

Non-Destructive Inspection of High Temperature Piping Combining Ultrasound and Eddy Current Testing

 ,
,  and
and 
Abstract
:1. Introduction
2. Experimental Setup and Samples
2.1. Standard Block
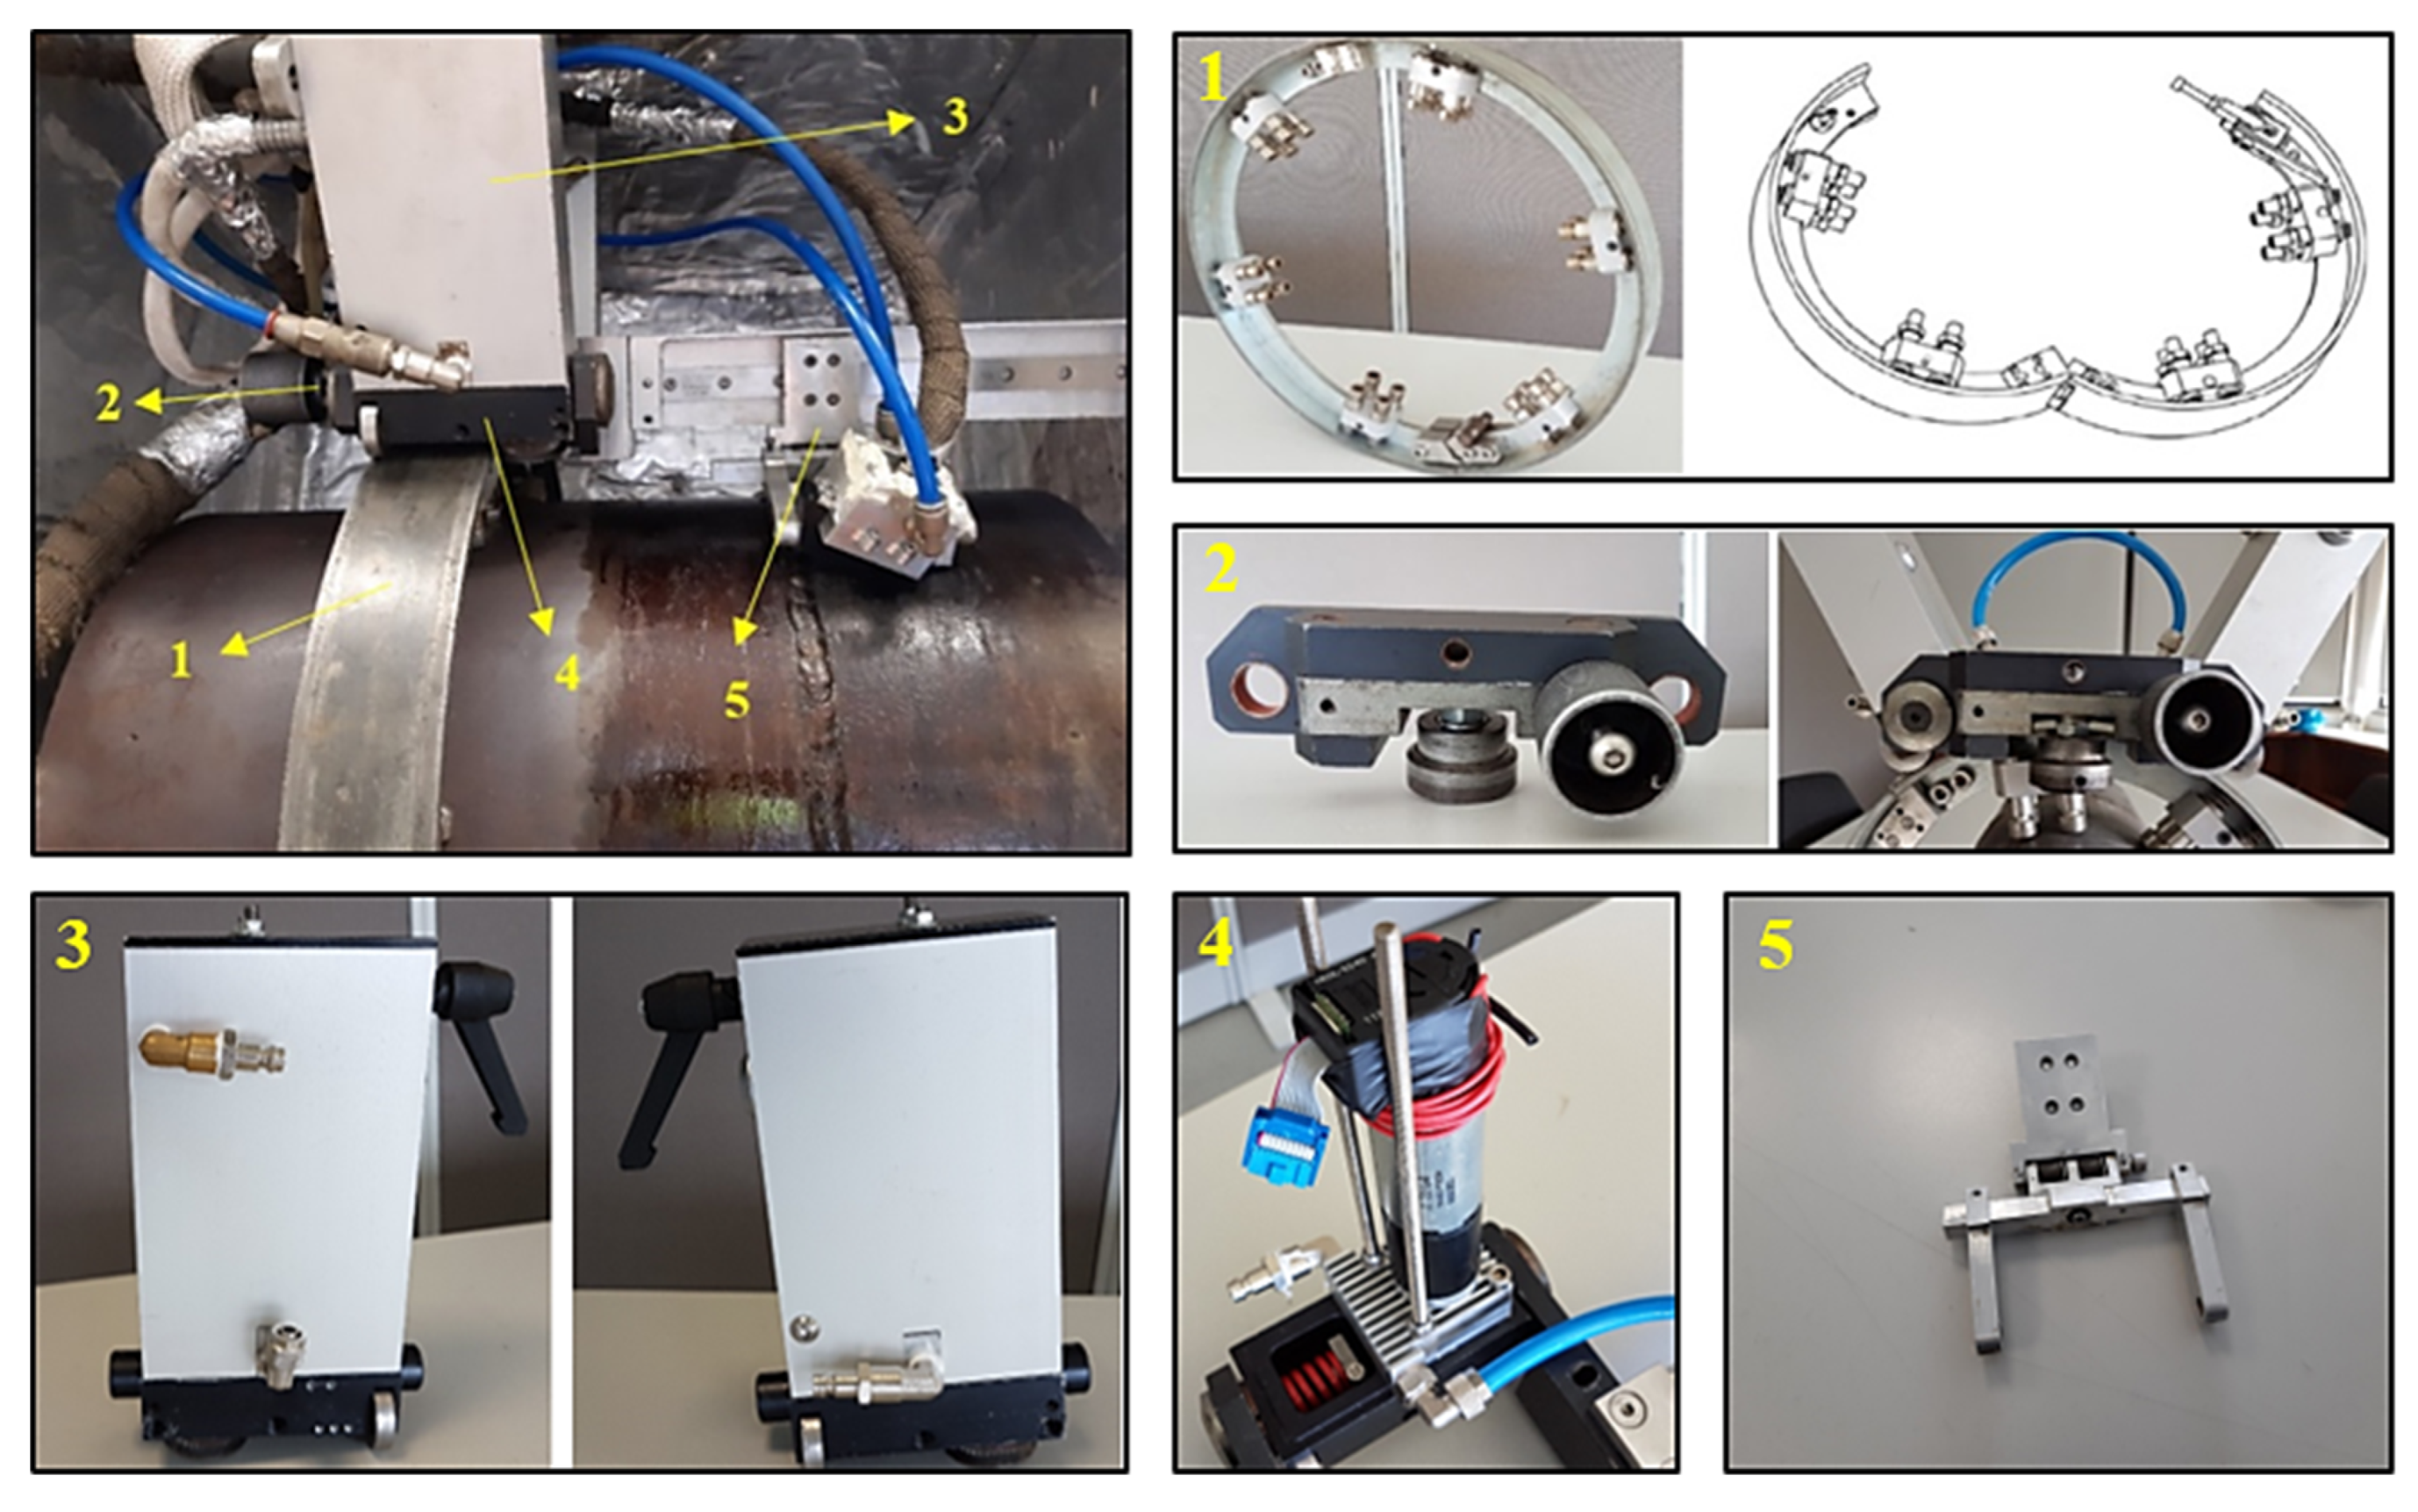
2.2. Automated Inspection System
- Orbital guide around the pipe, enabling the scanner’s movement—element 1;
- Quick tightening joint, to attach the scanner to the orbital guide—element 2;
- Air-cooled housing, to shelter the DC motors—element 3;
- Water-cooled base plate, where the DC motors were fixed—element 4;
- Probe holder—element 5.
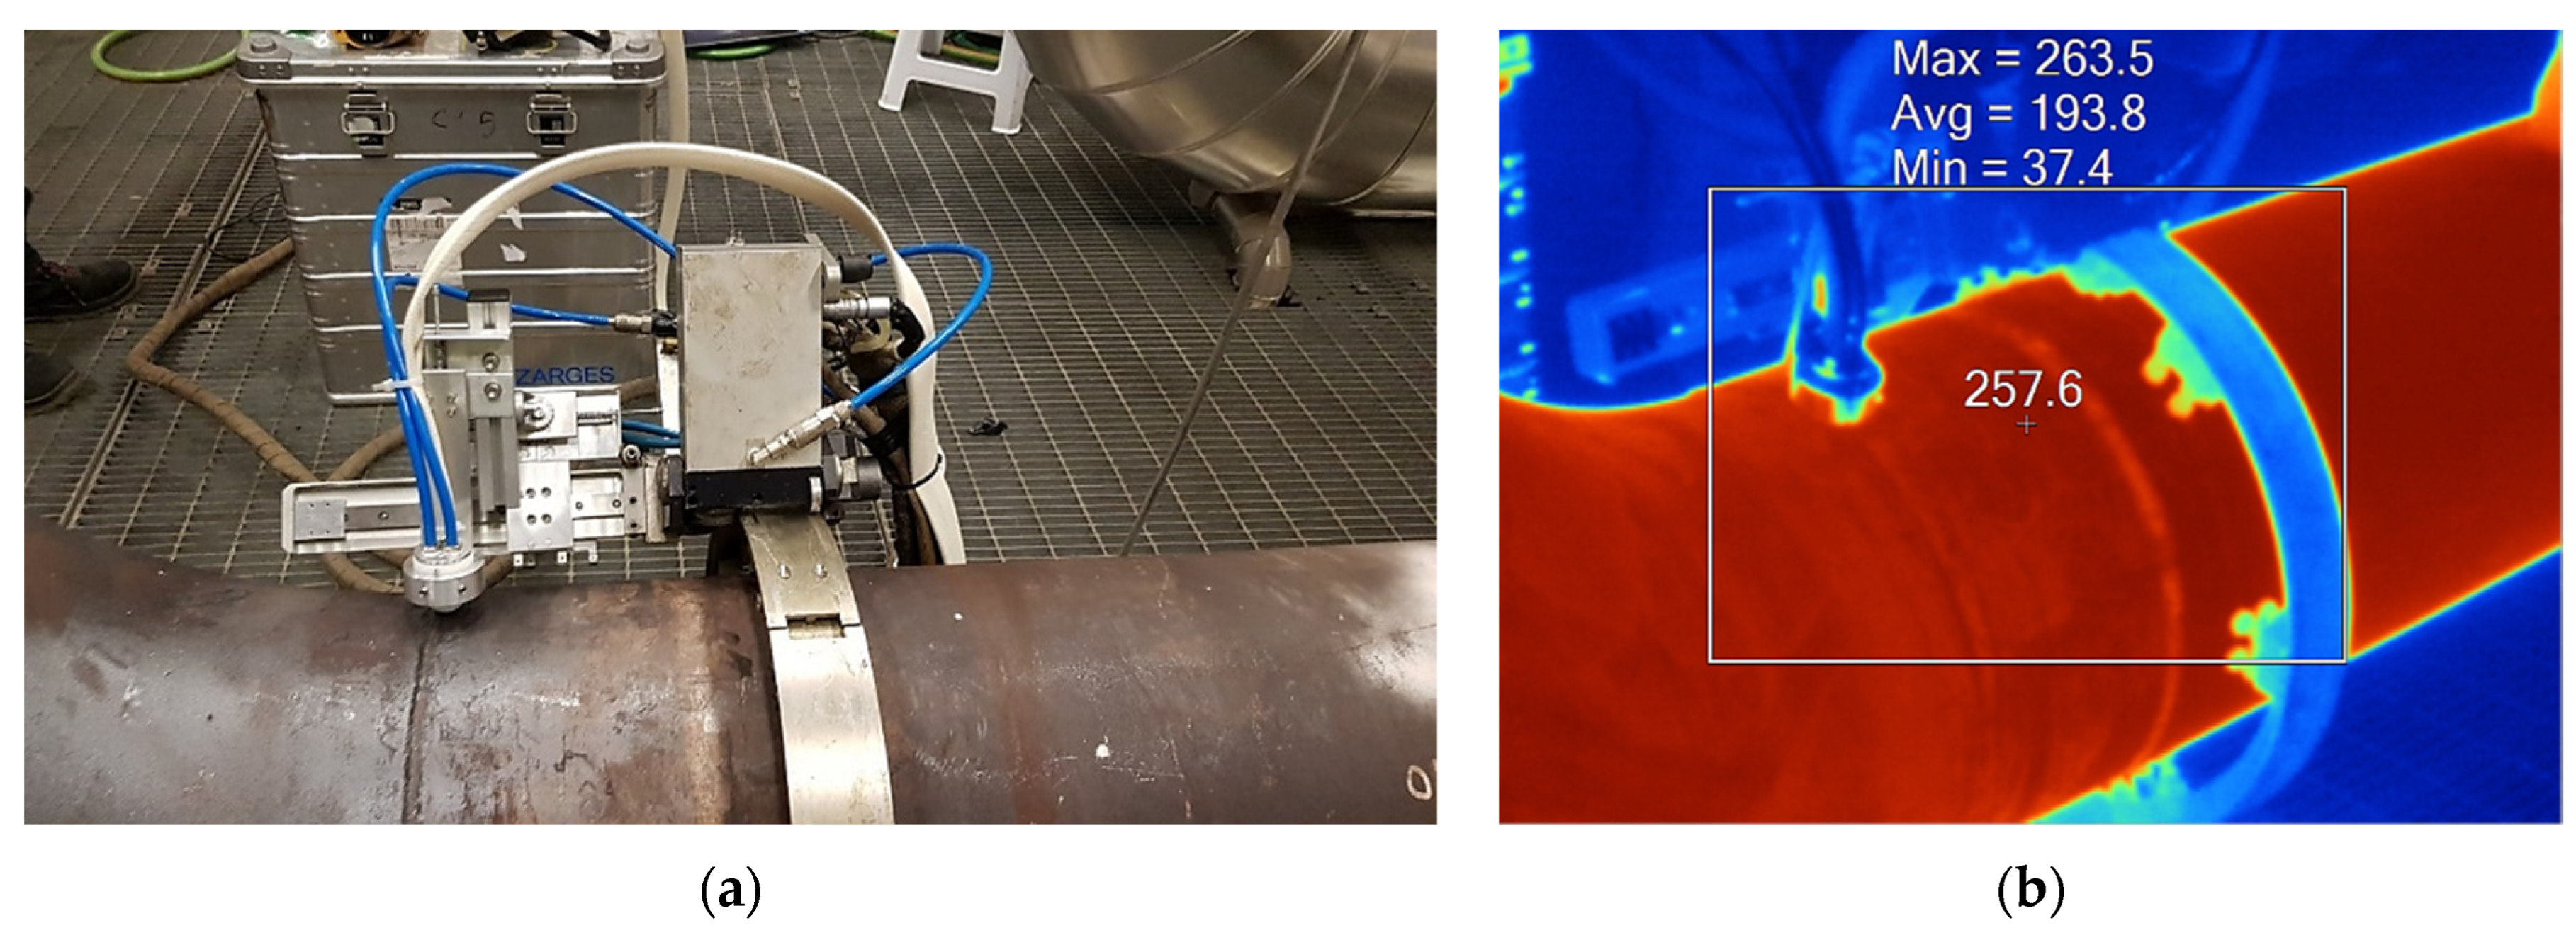
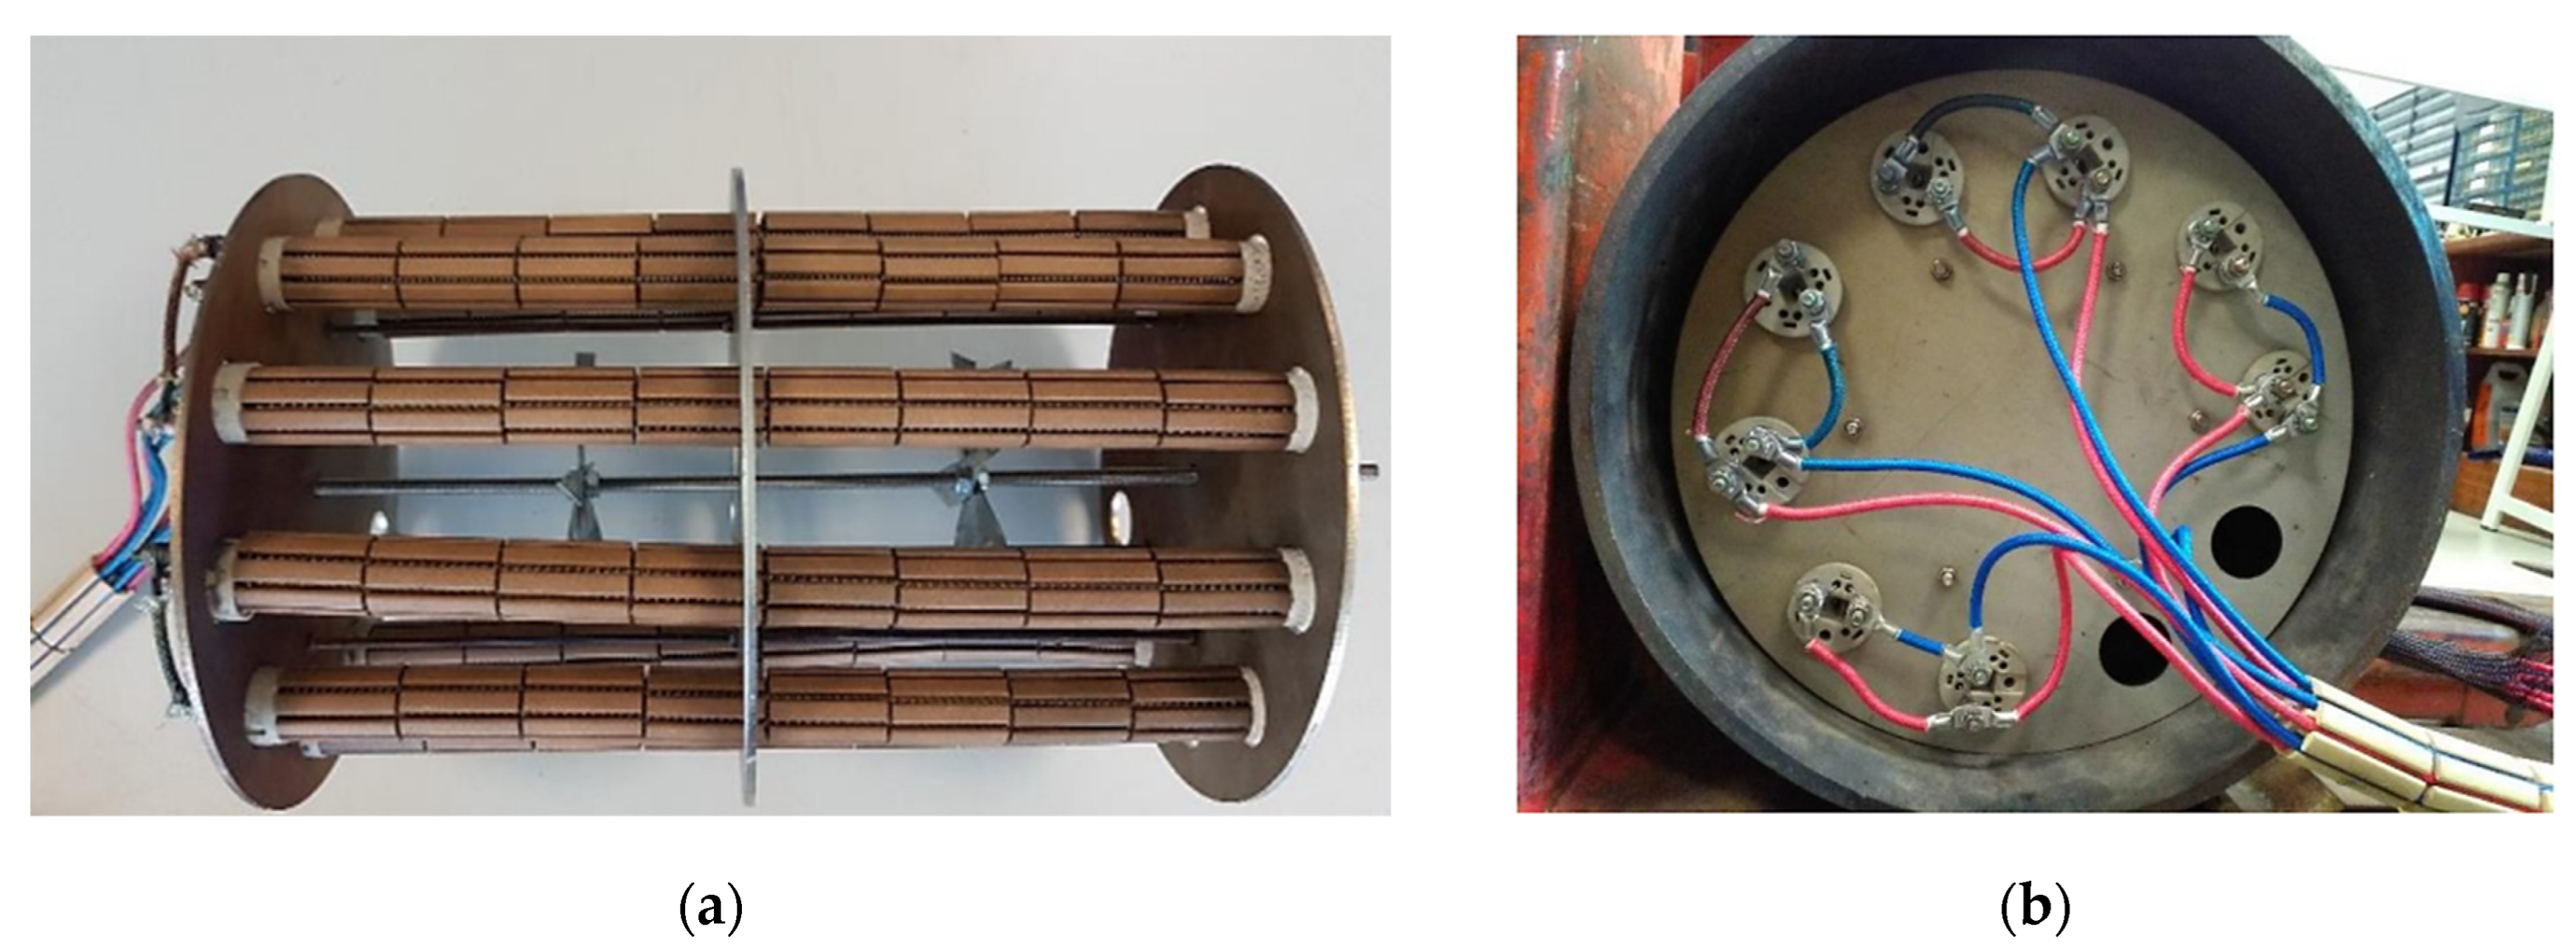
2.3. Heating and Temperature Control
3. Ultrasound Testing
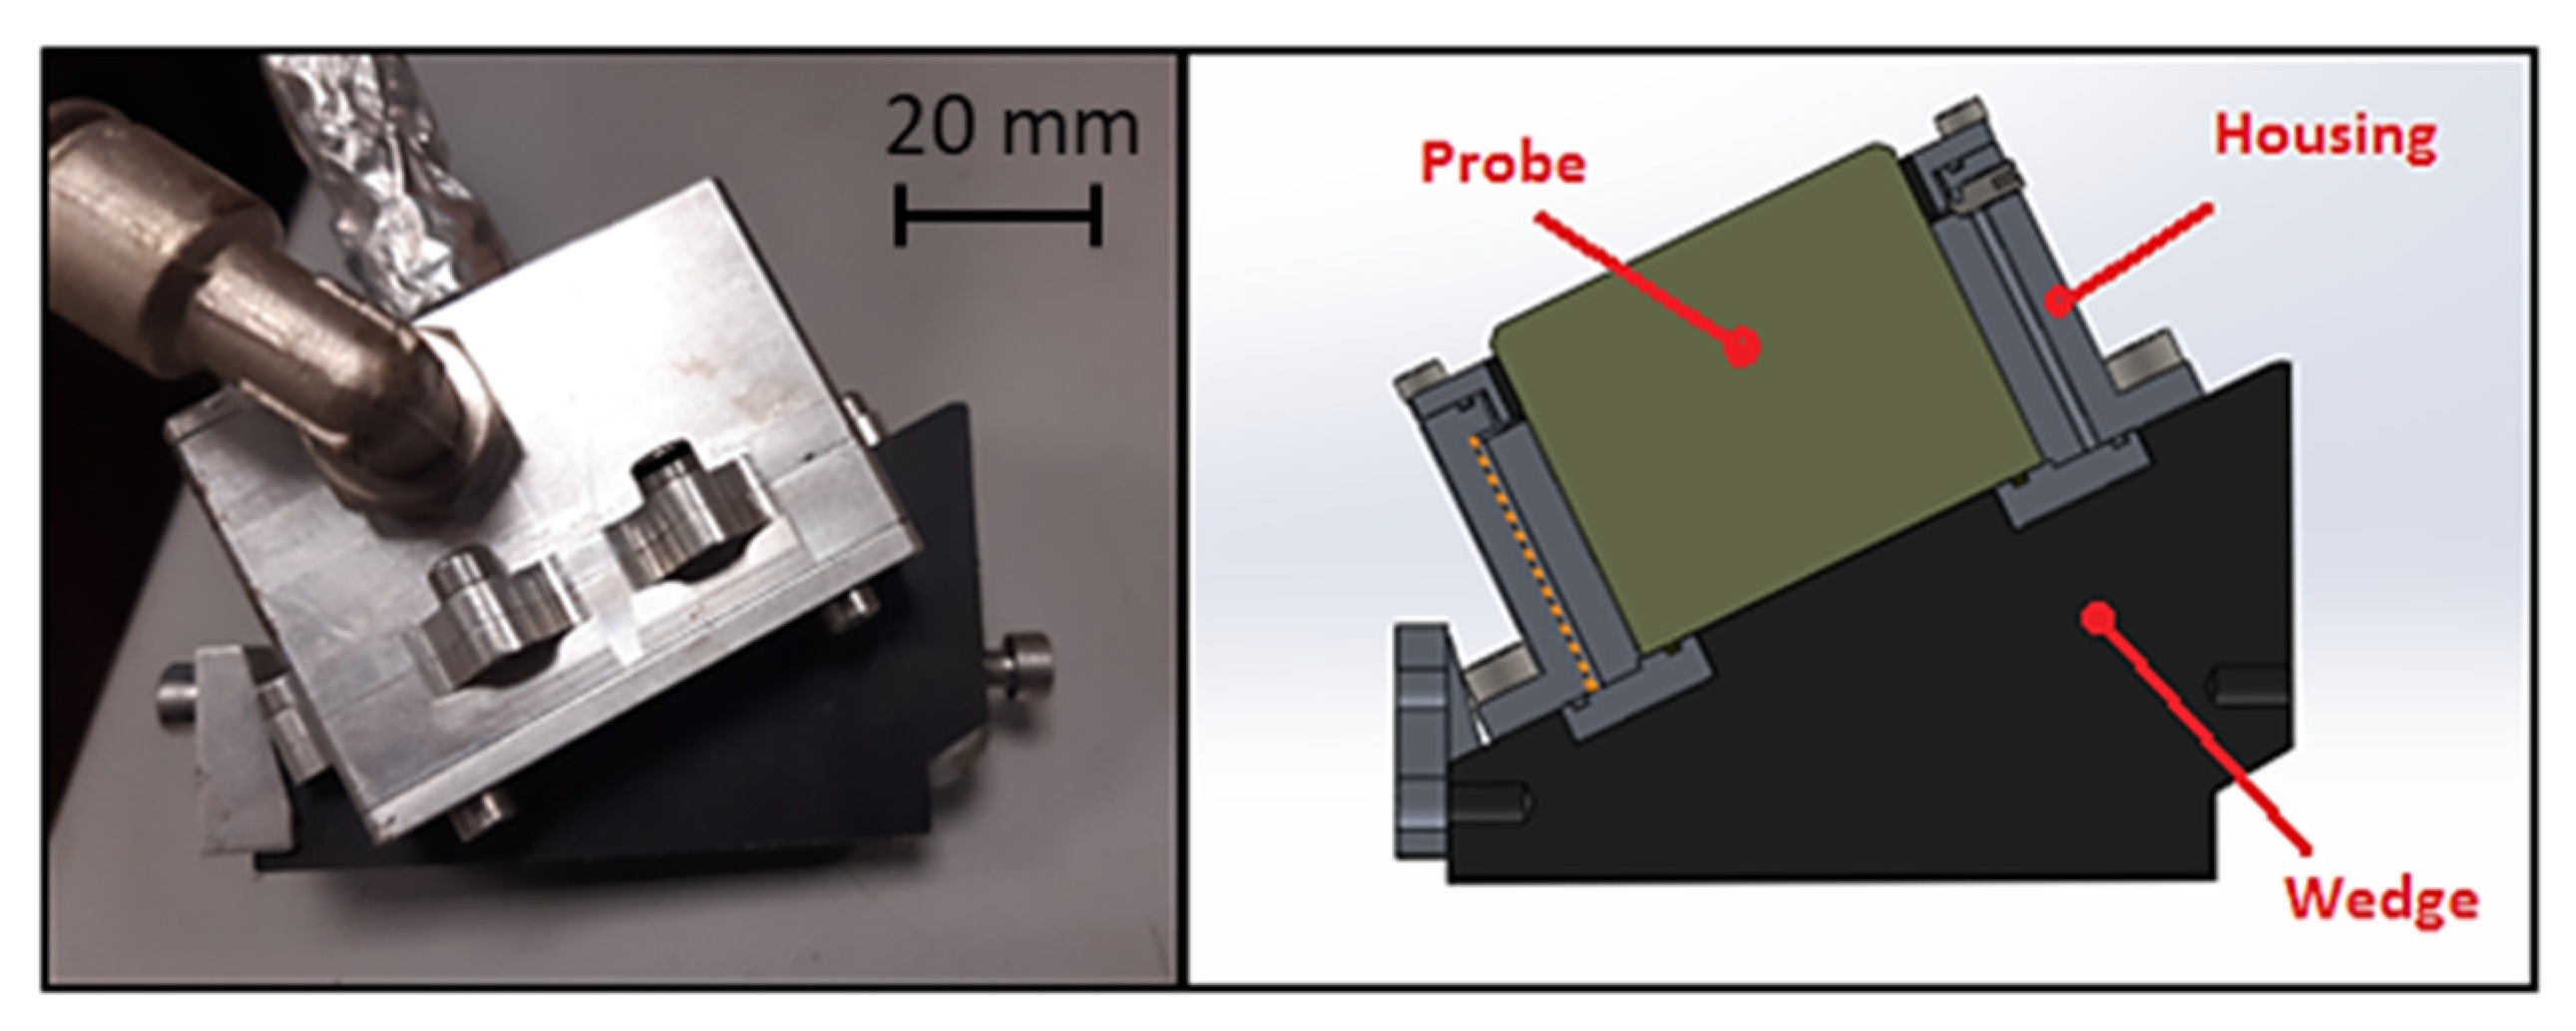
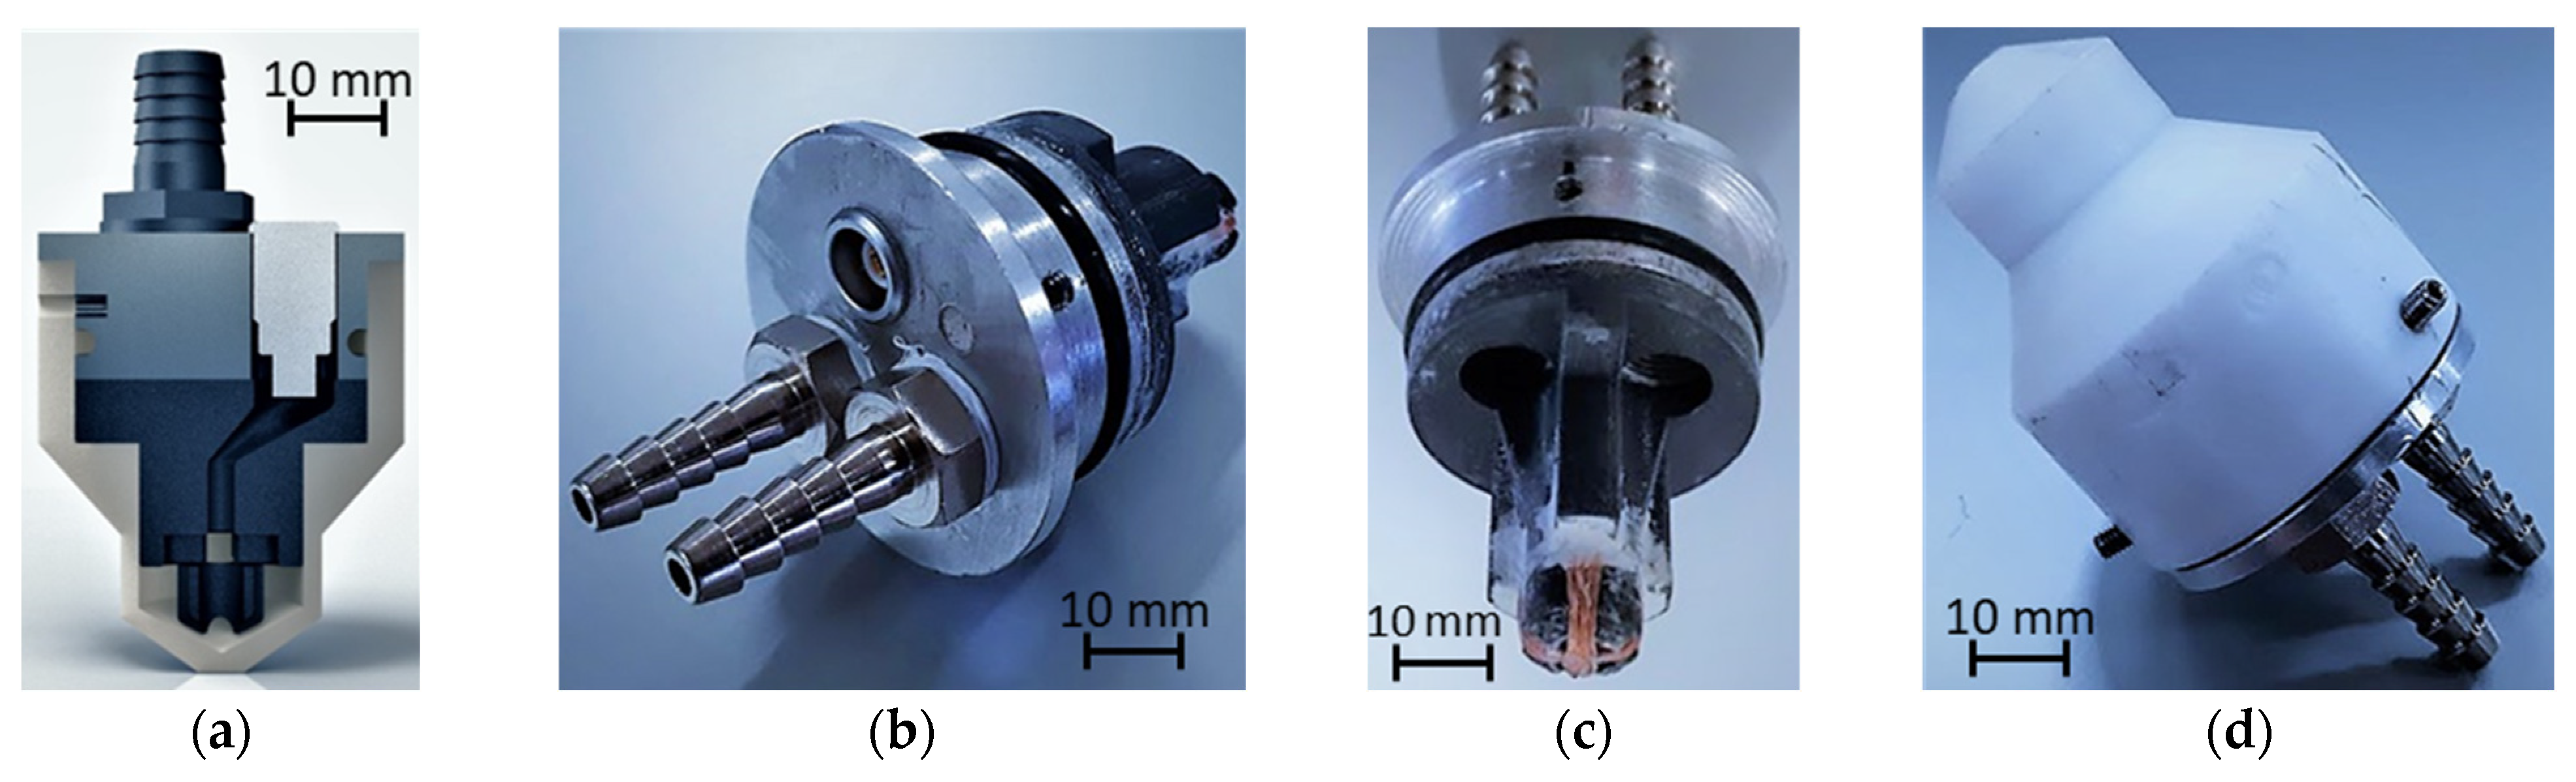
3.1. Probe and Wedge Concept
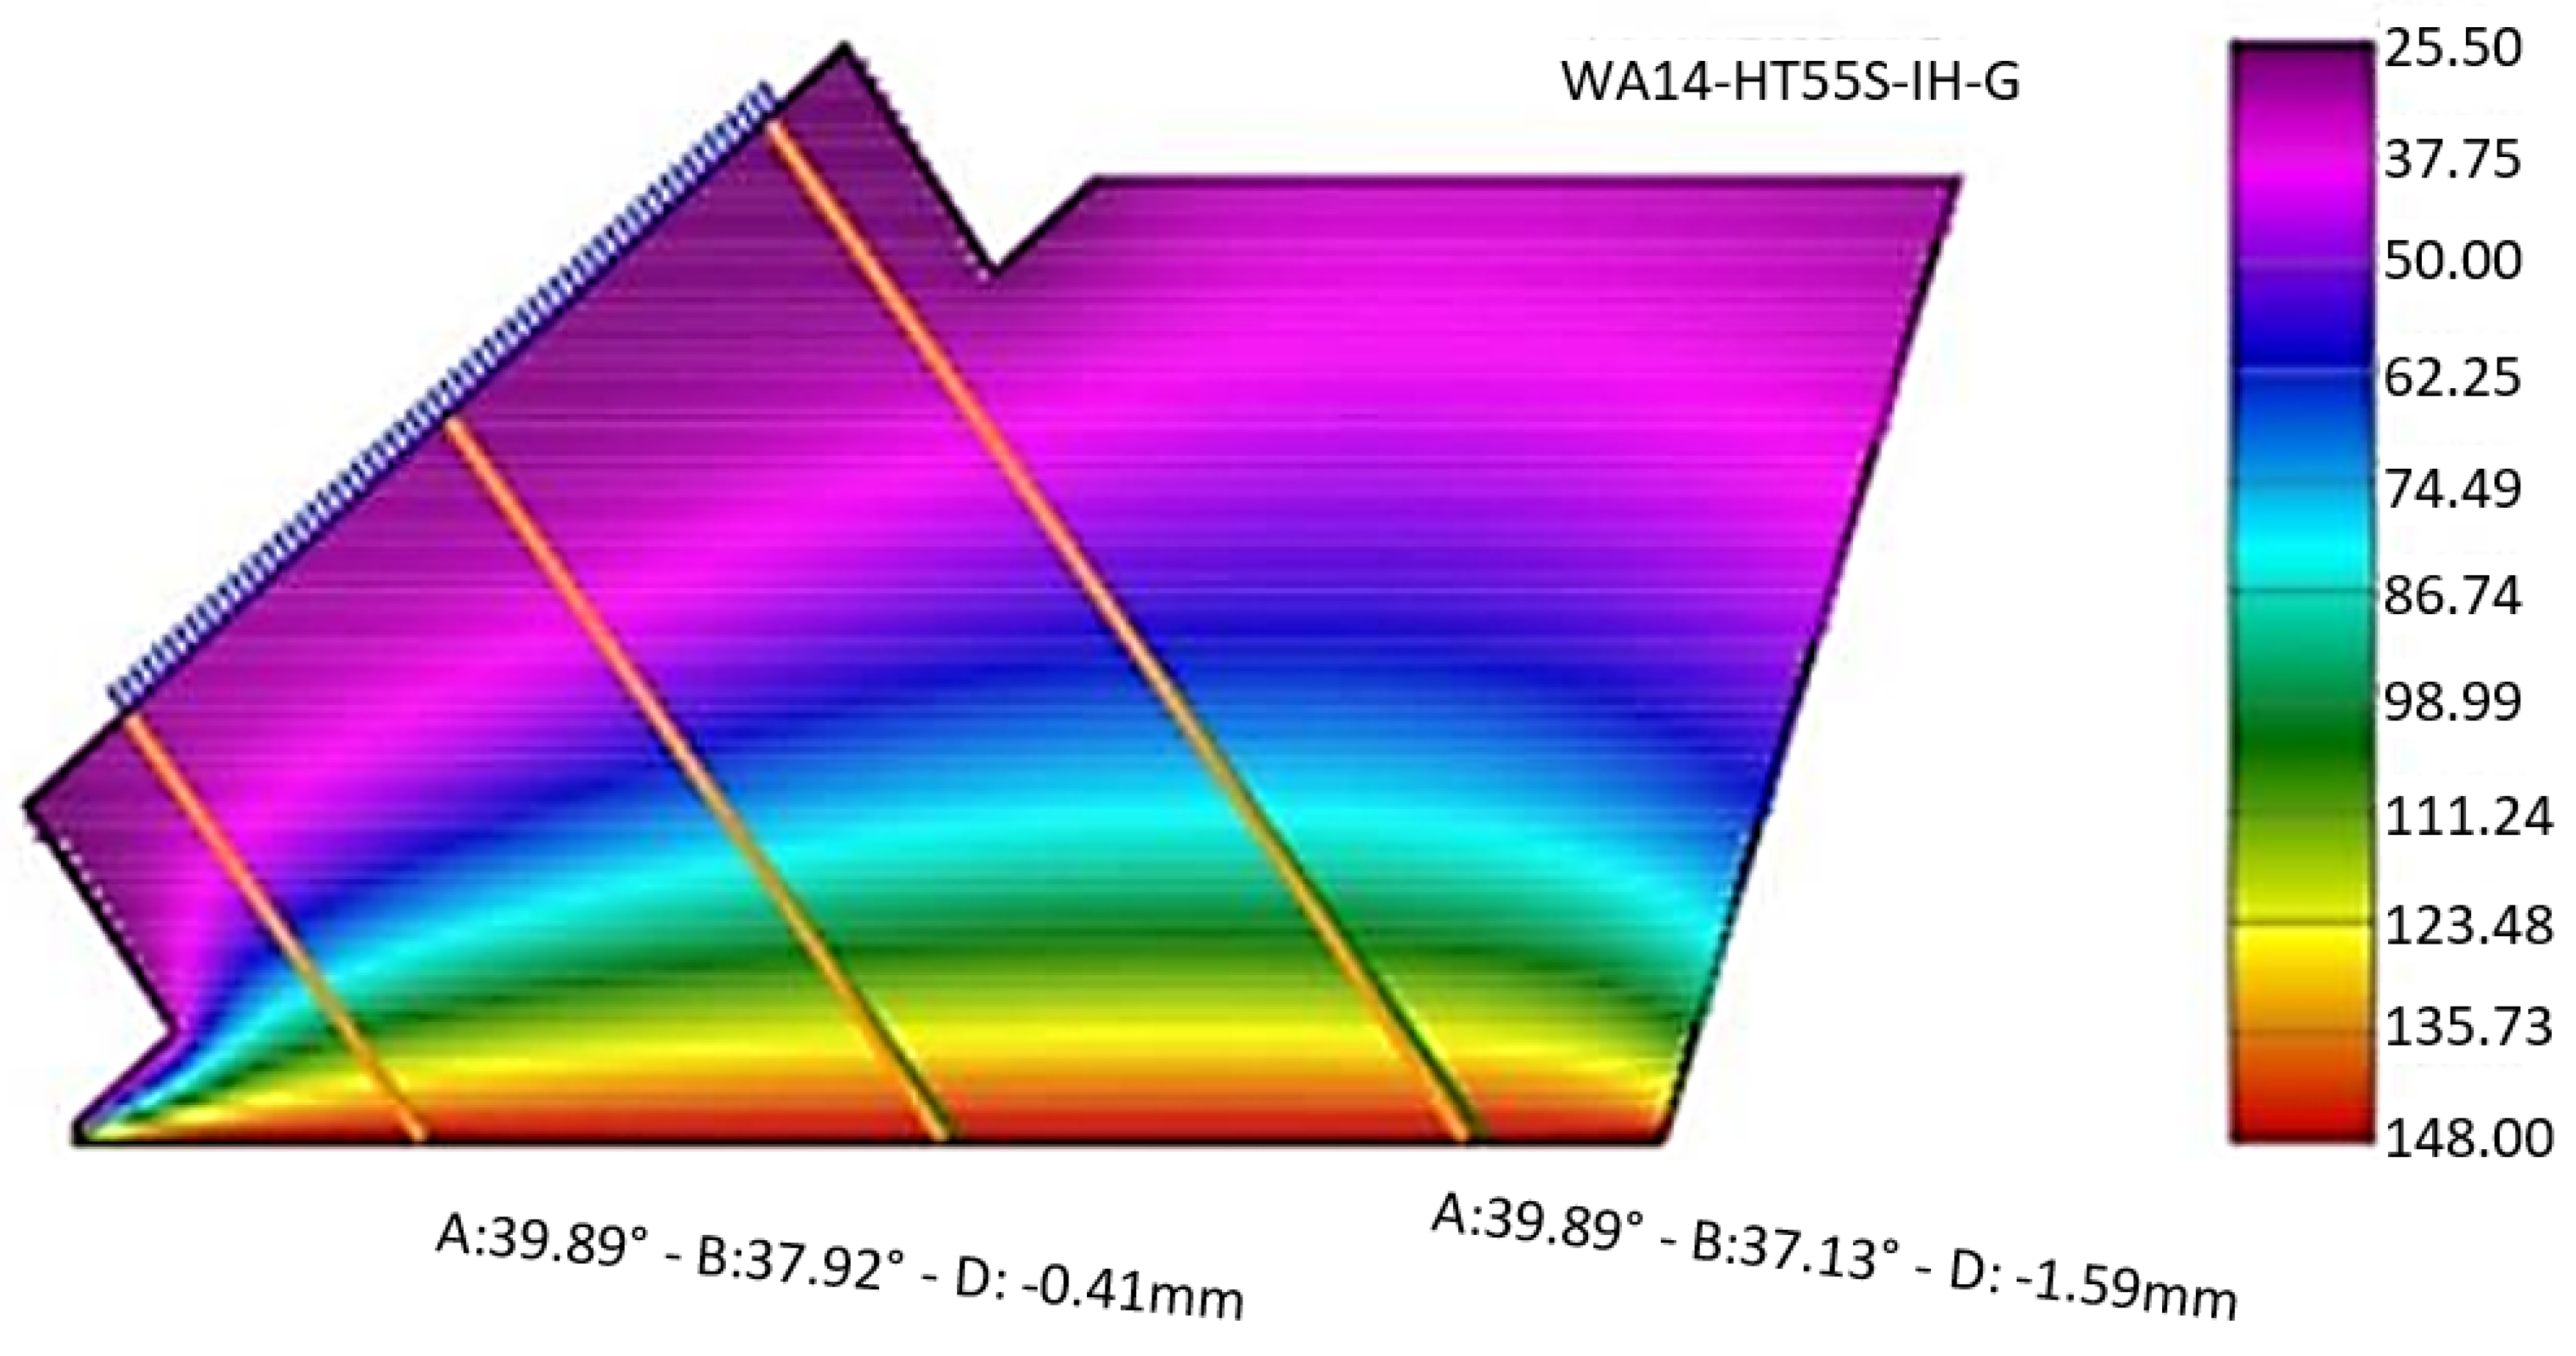
3.2. Focal Laws
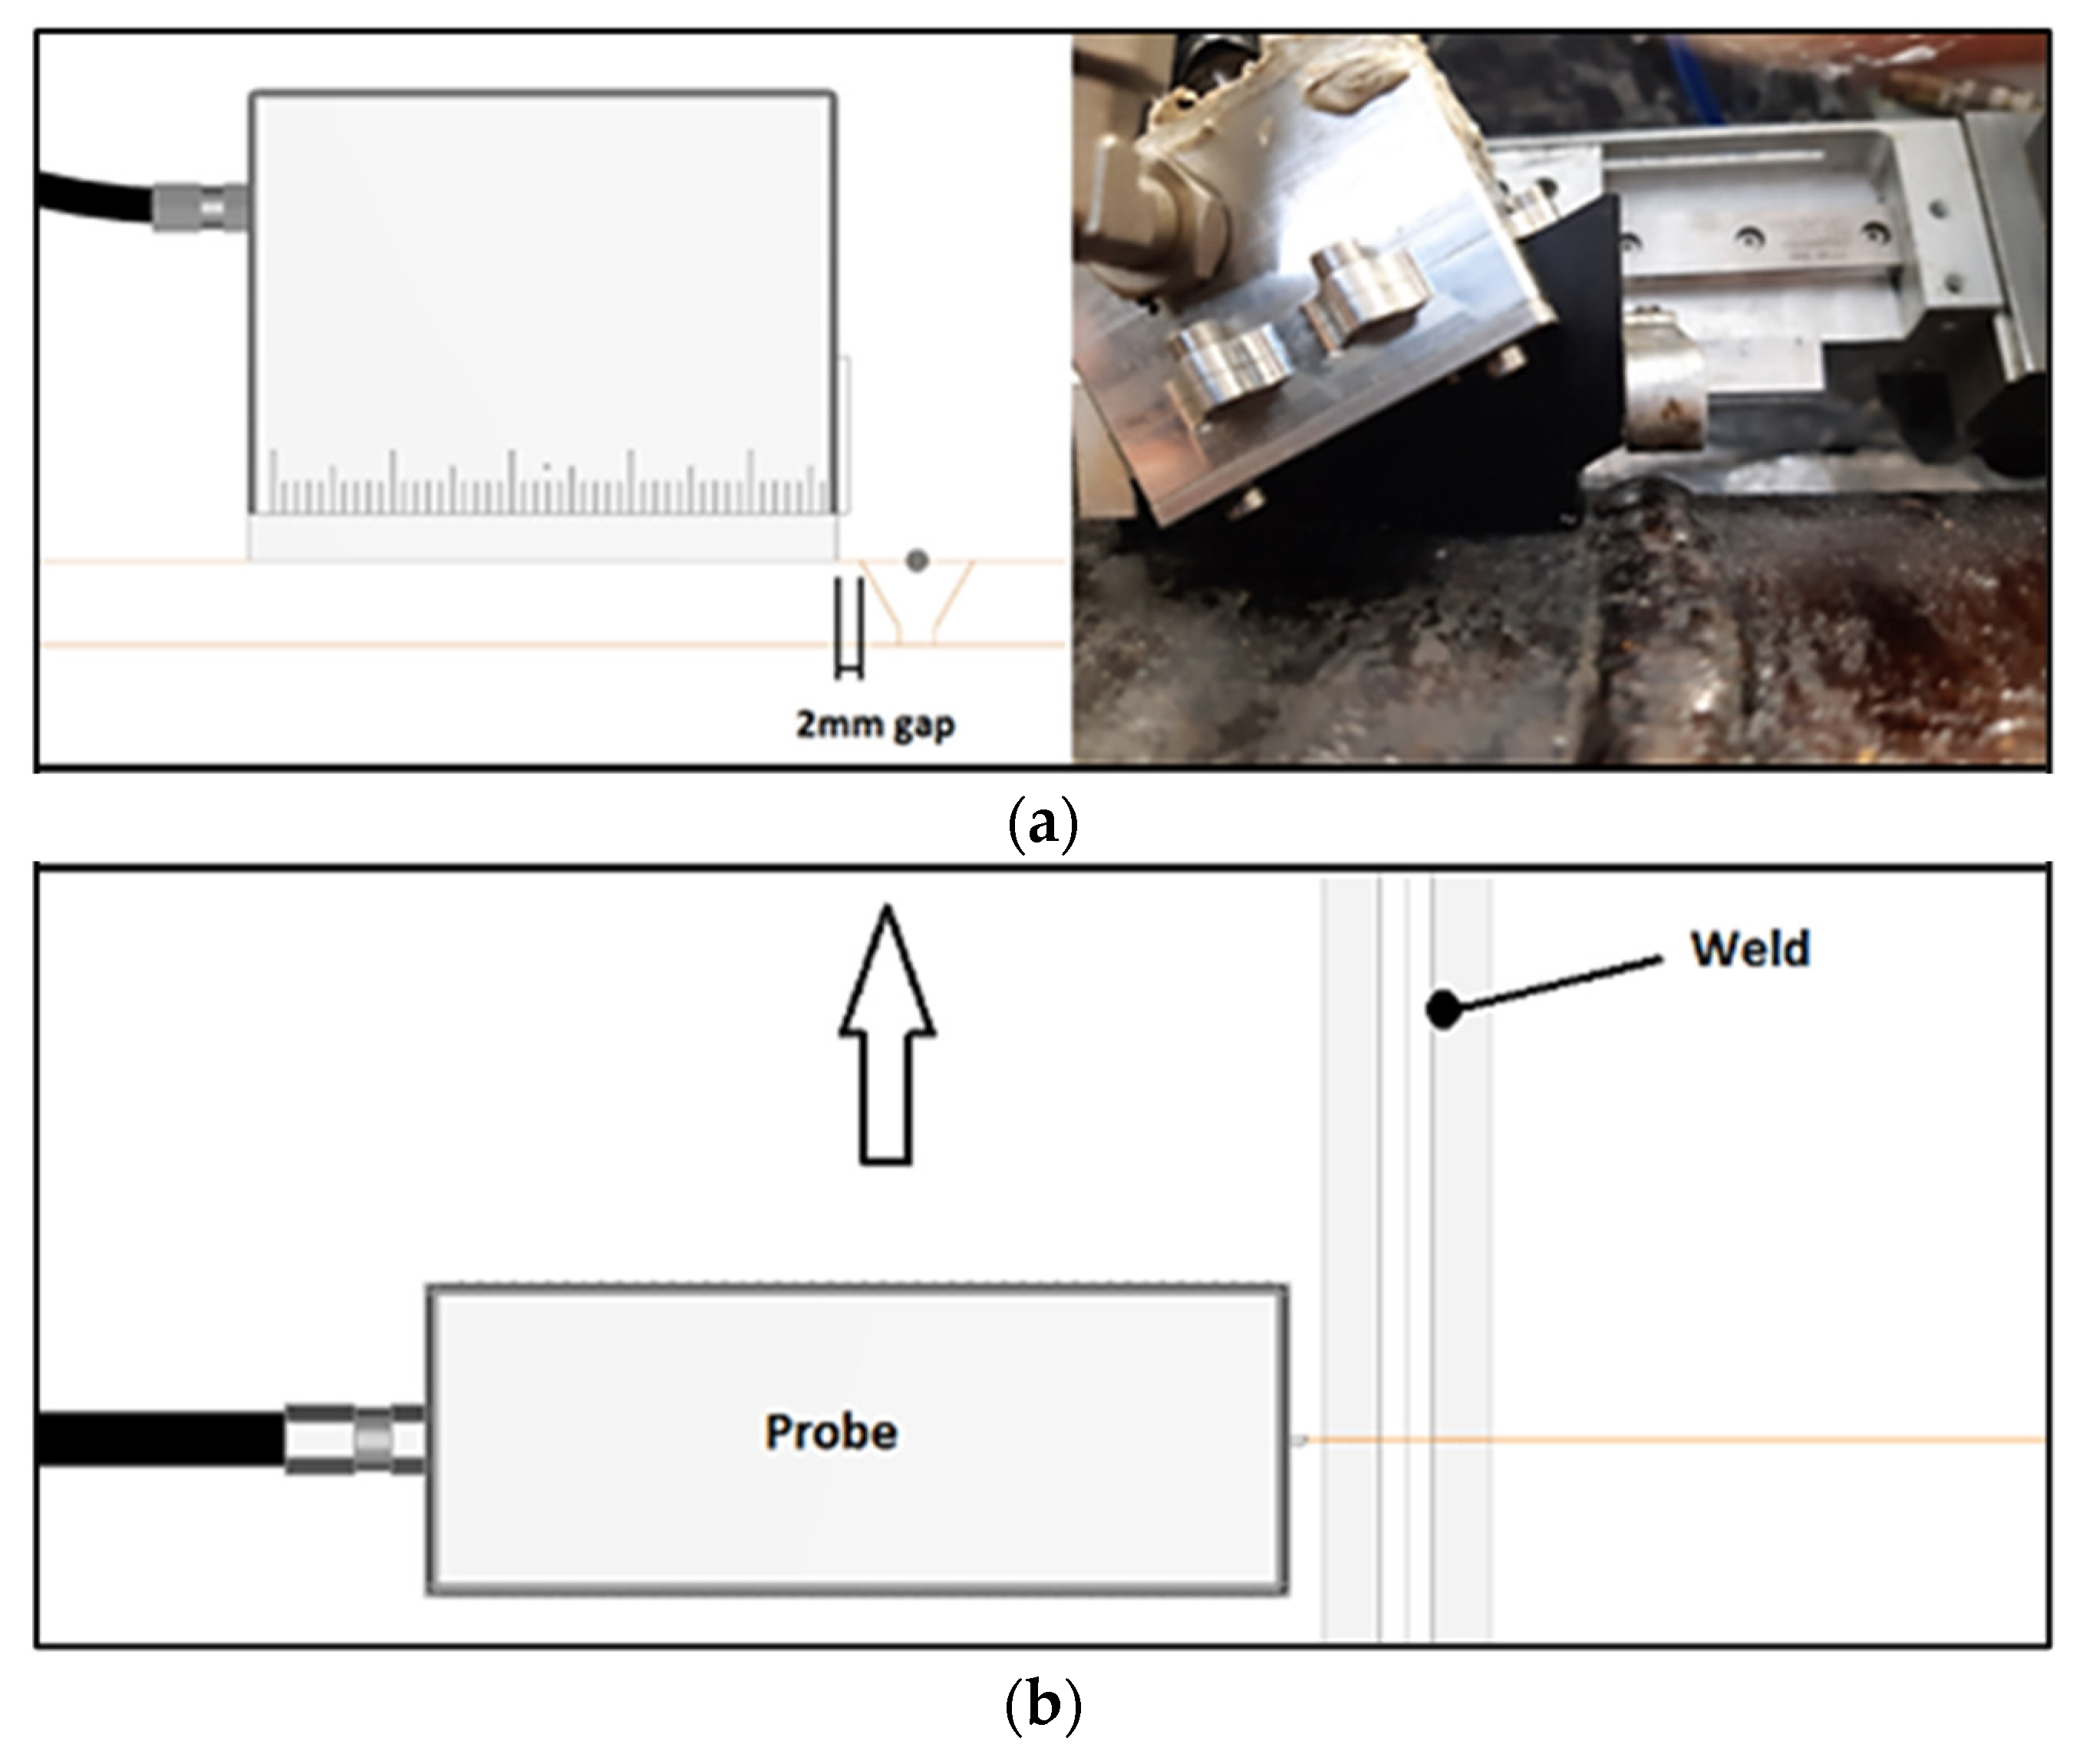
3.3. Scan Plan
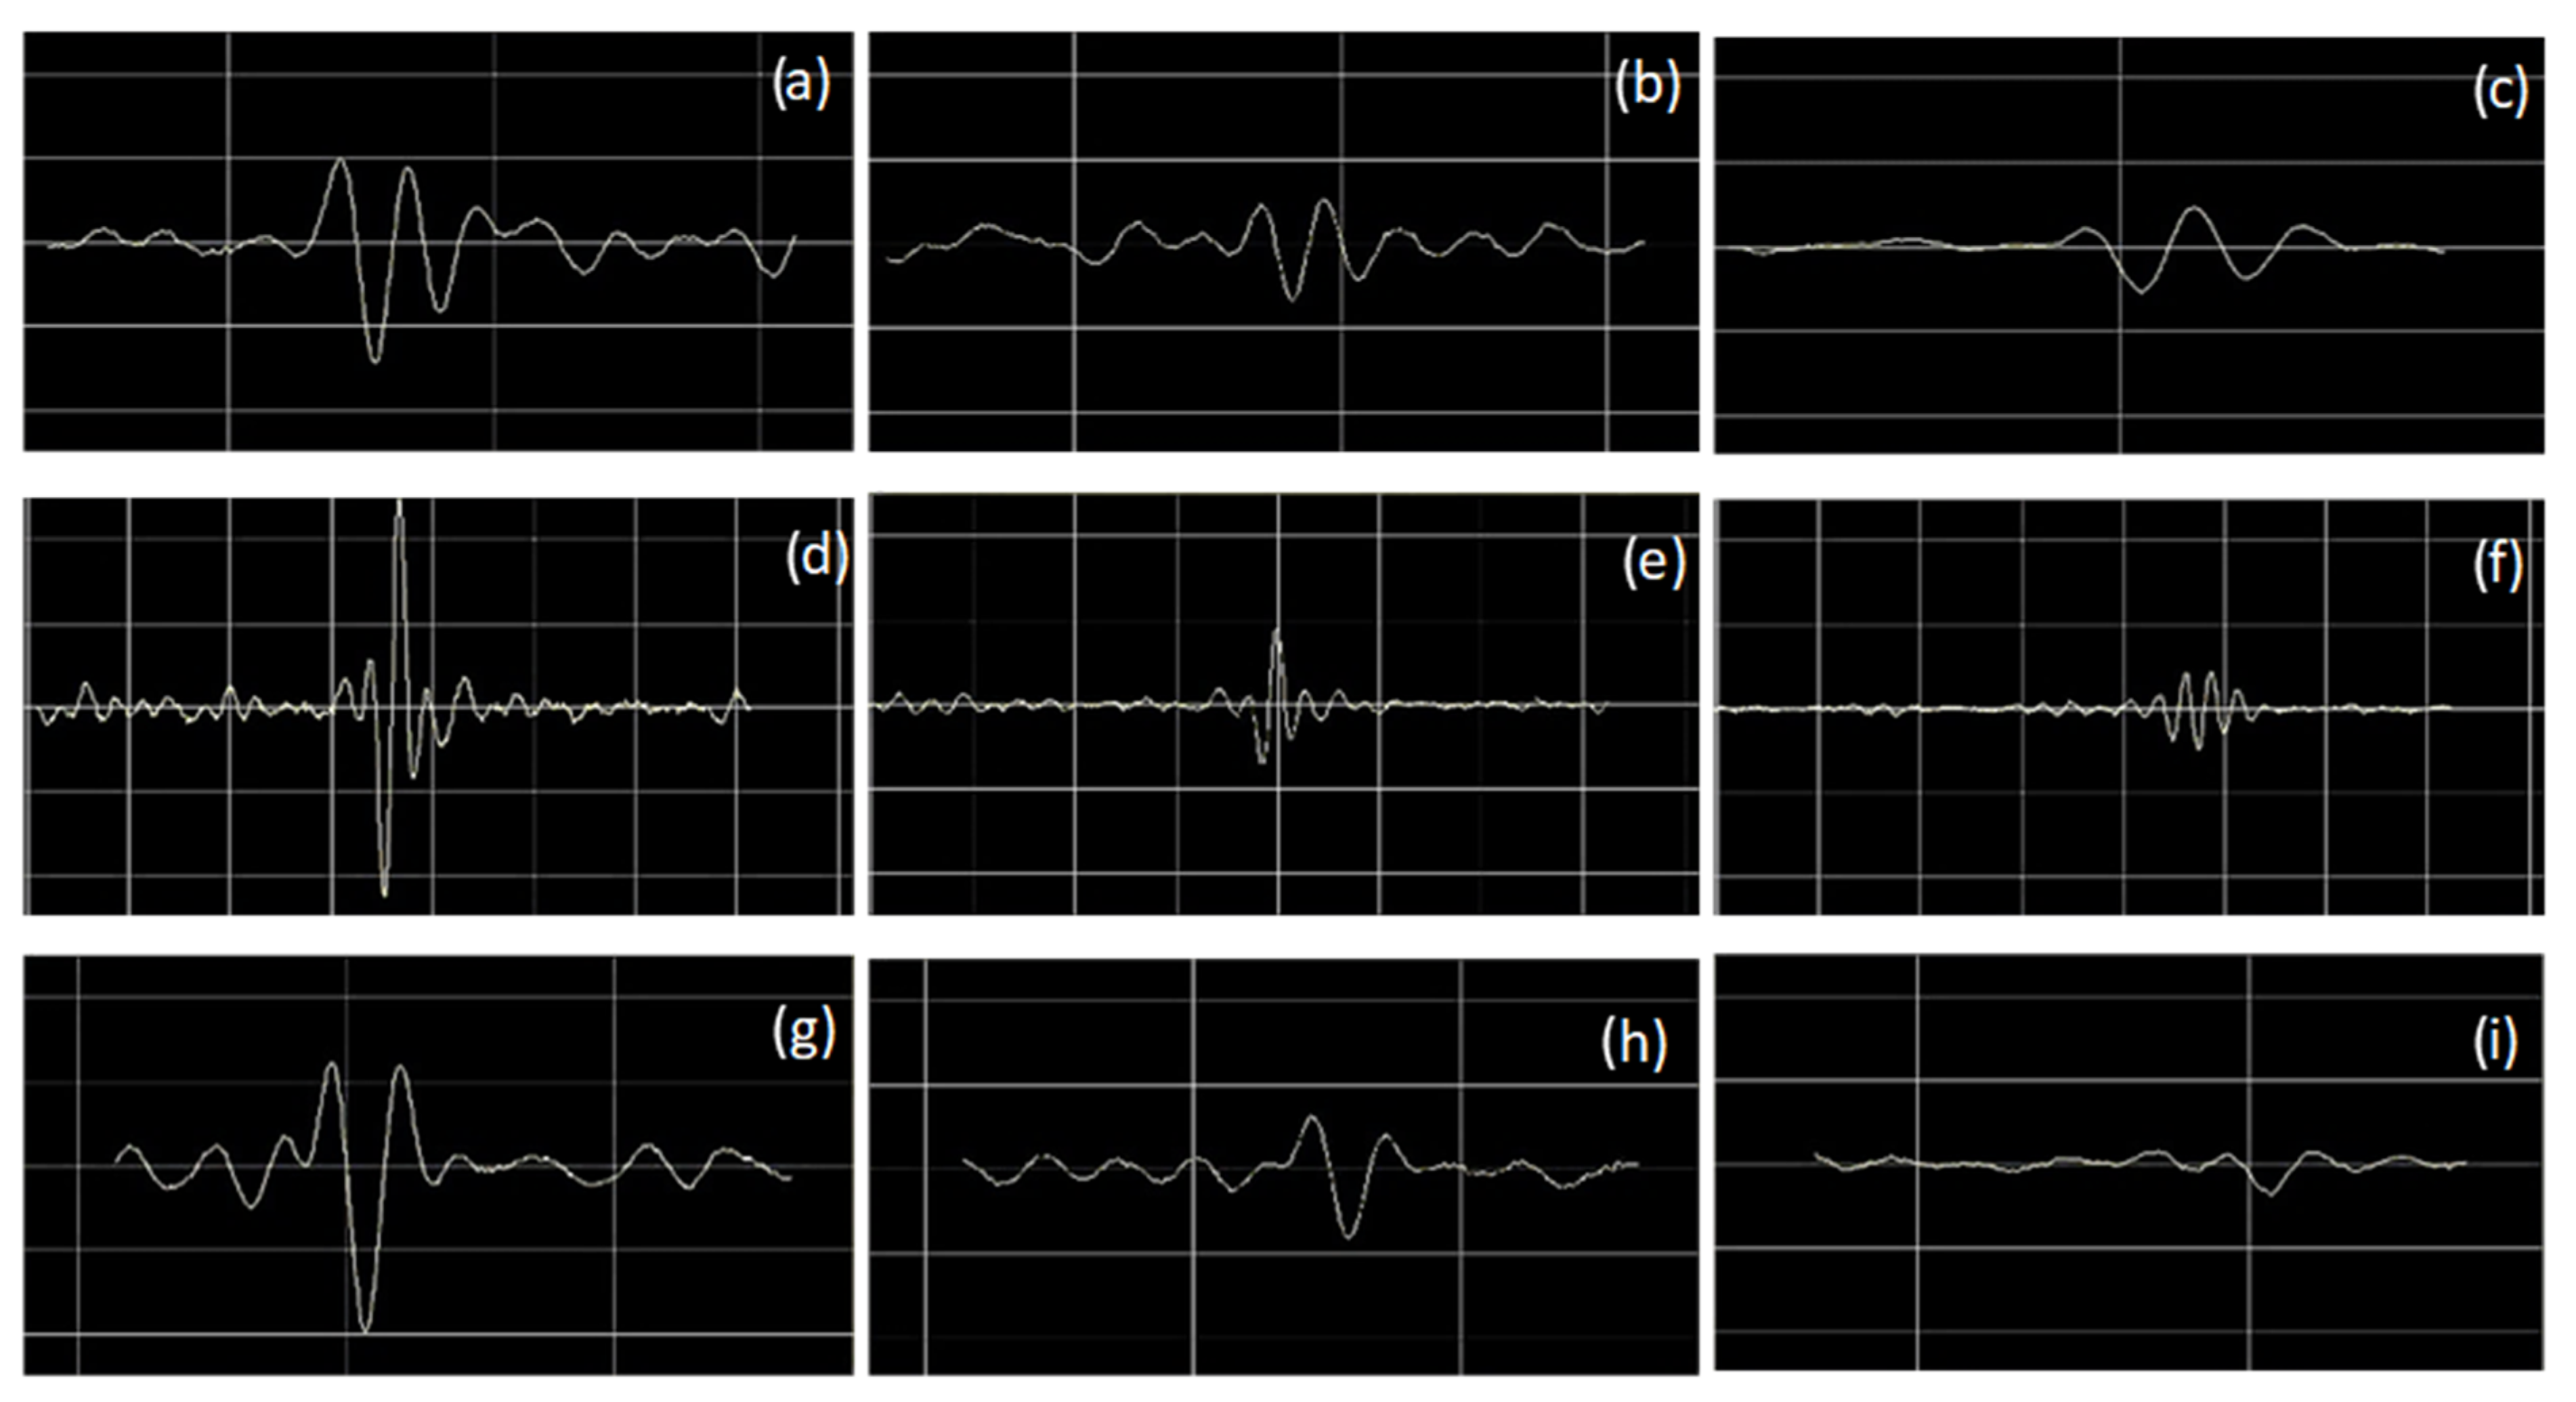
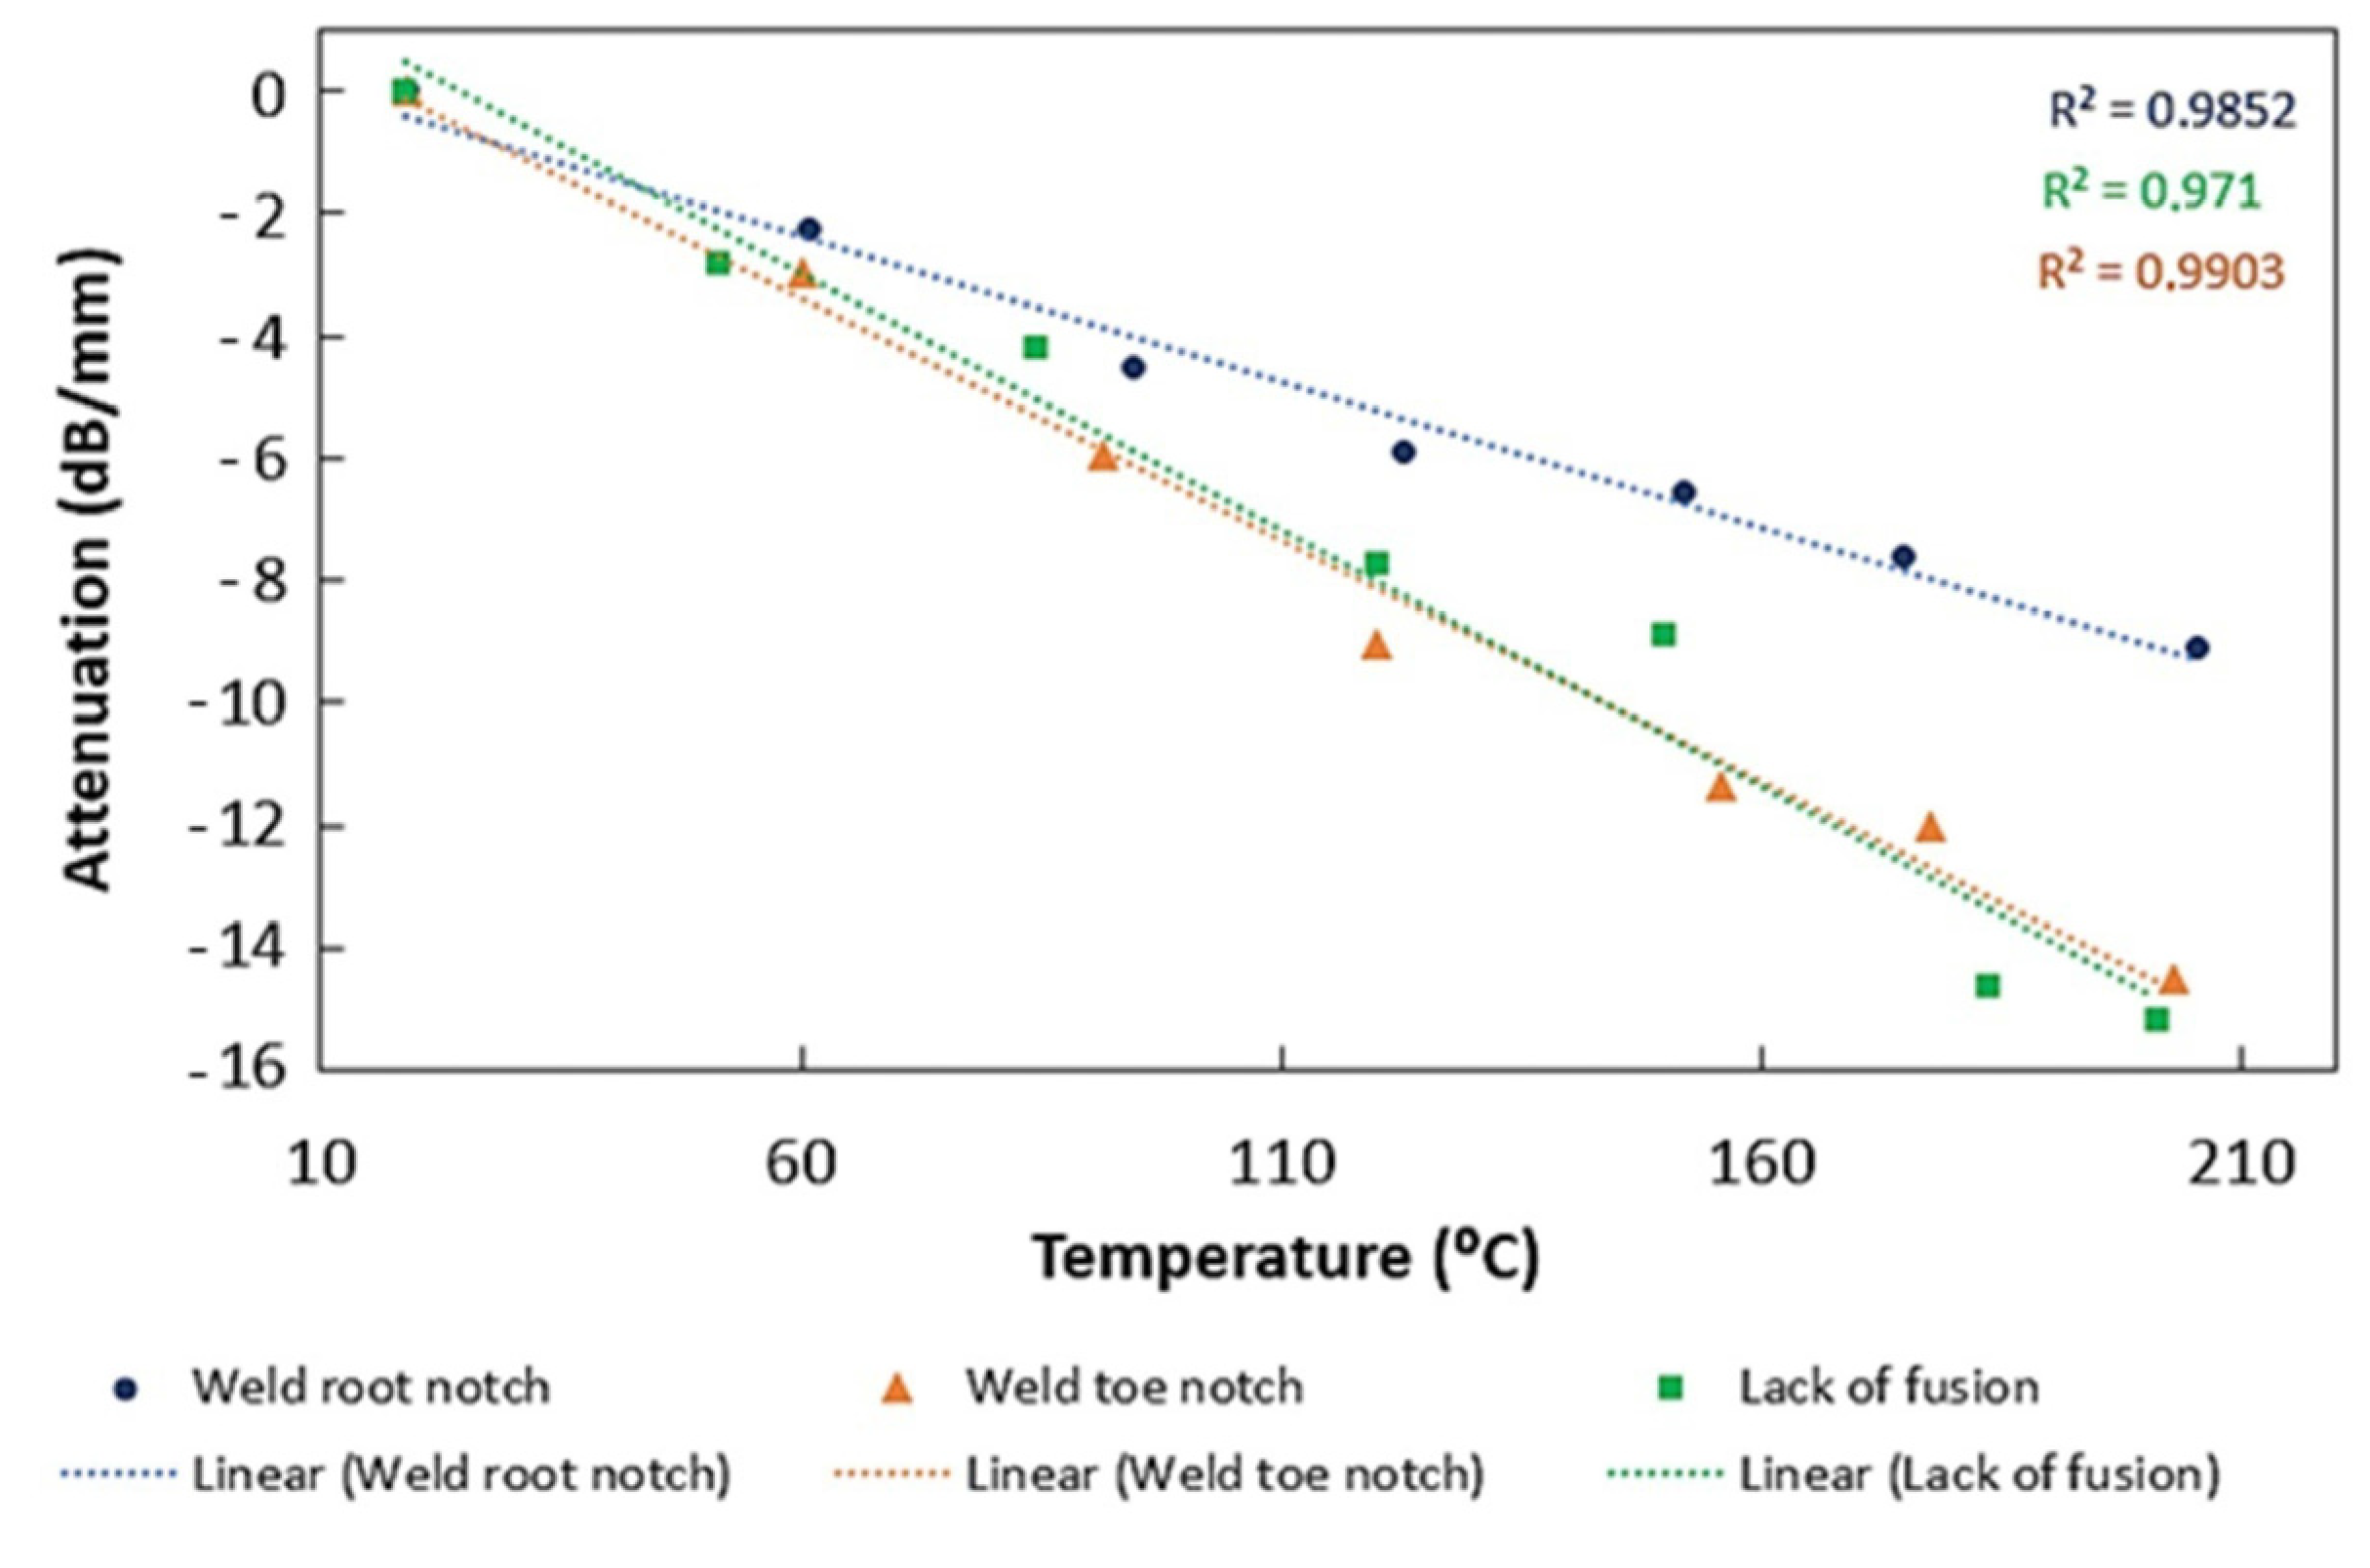
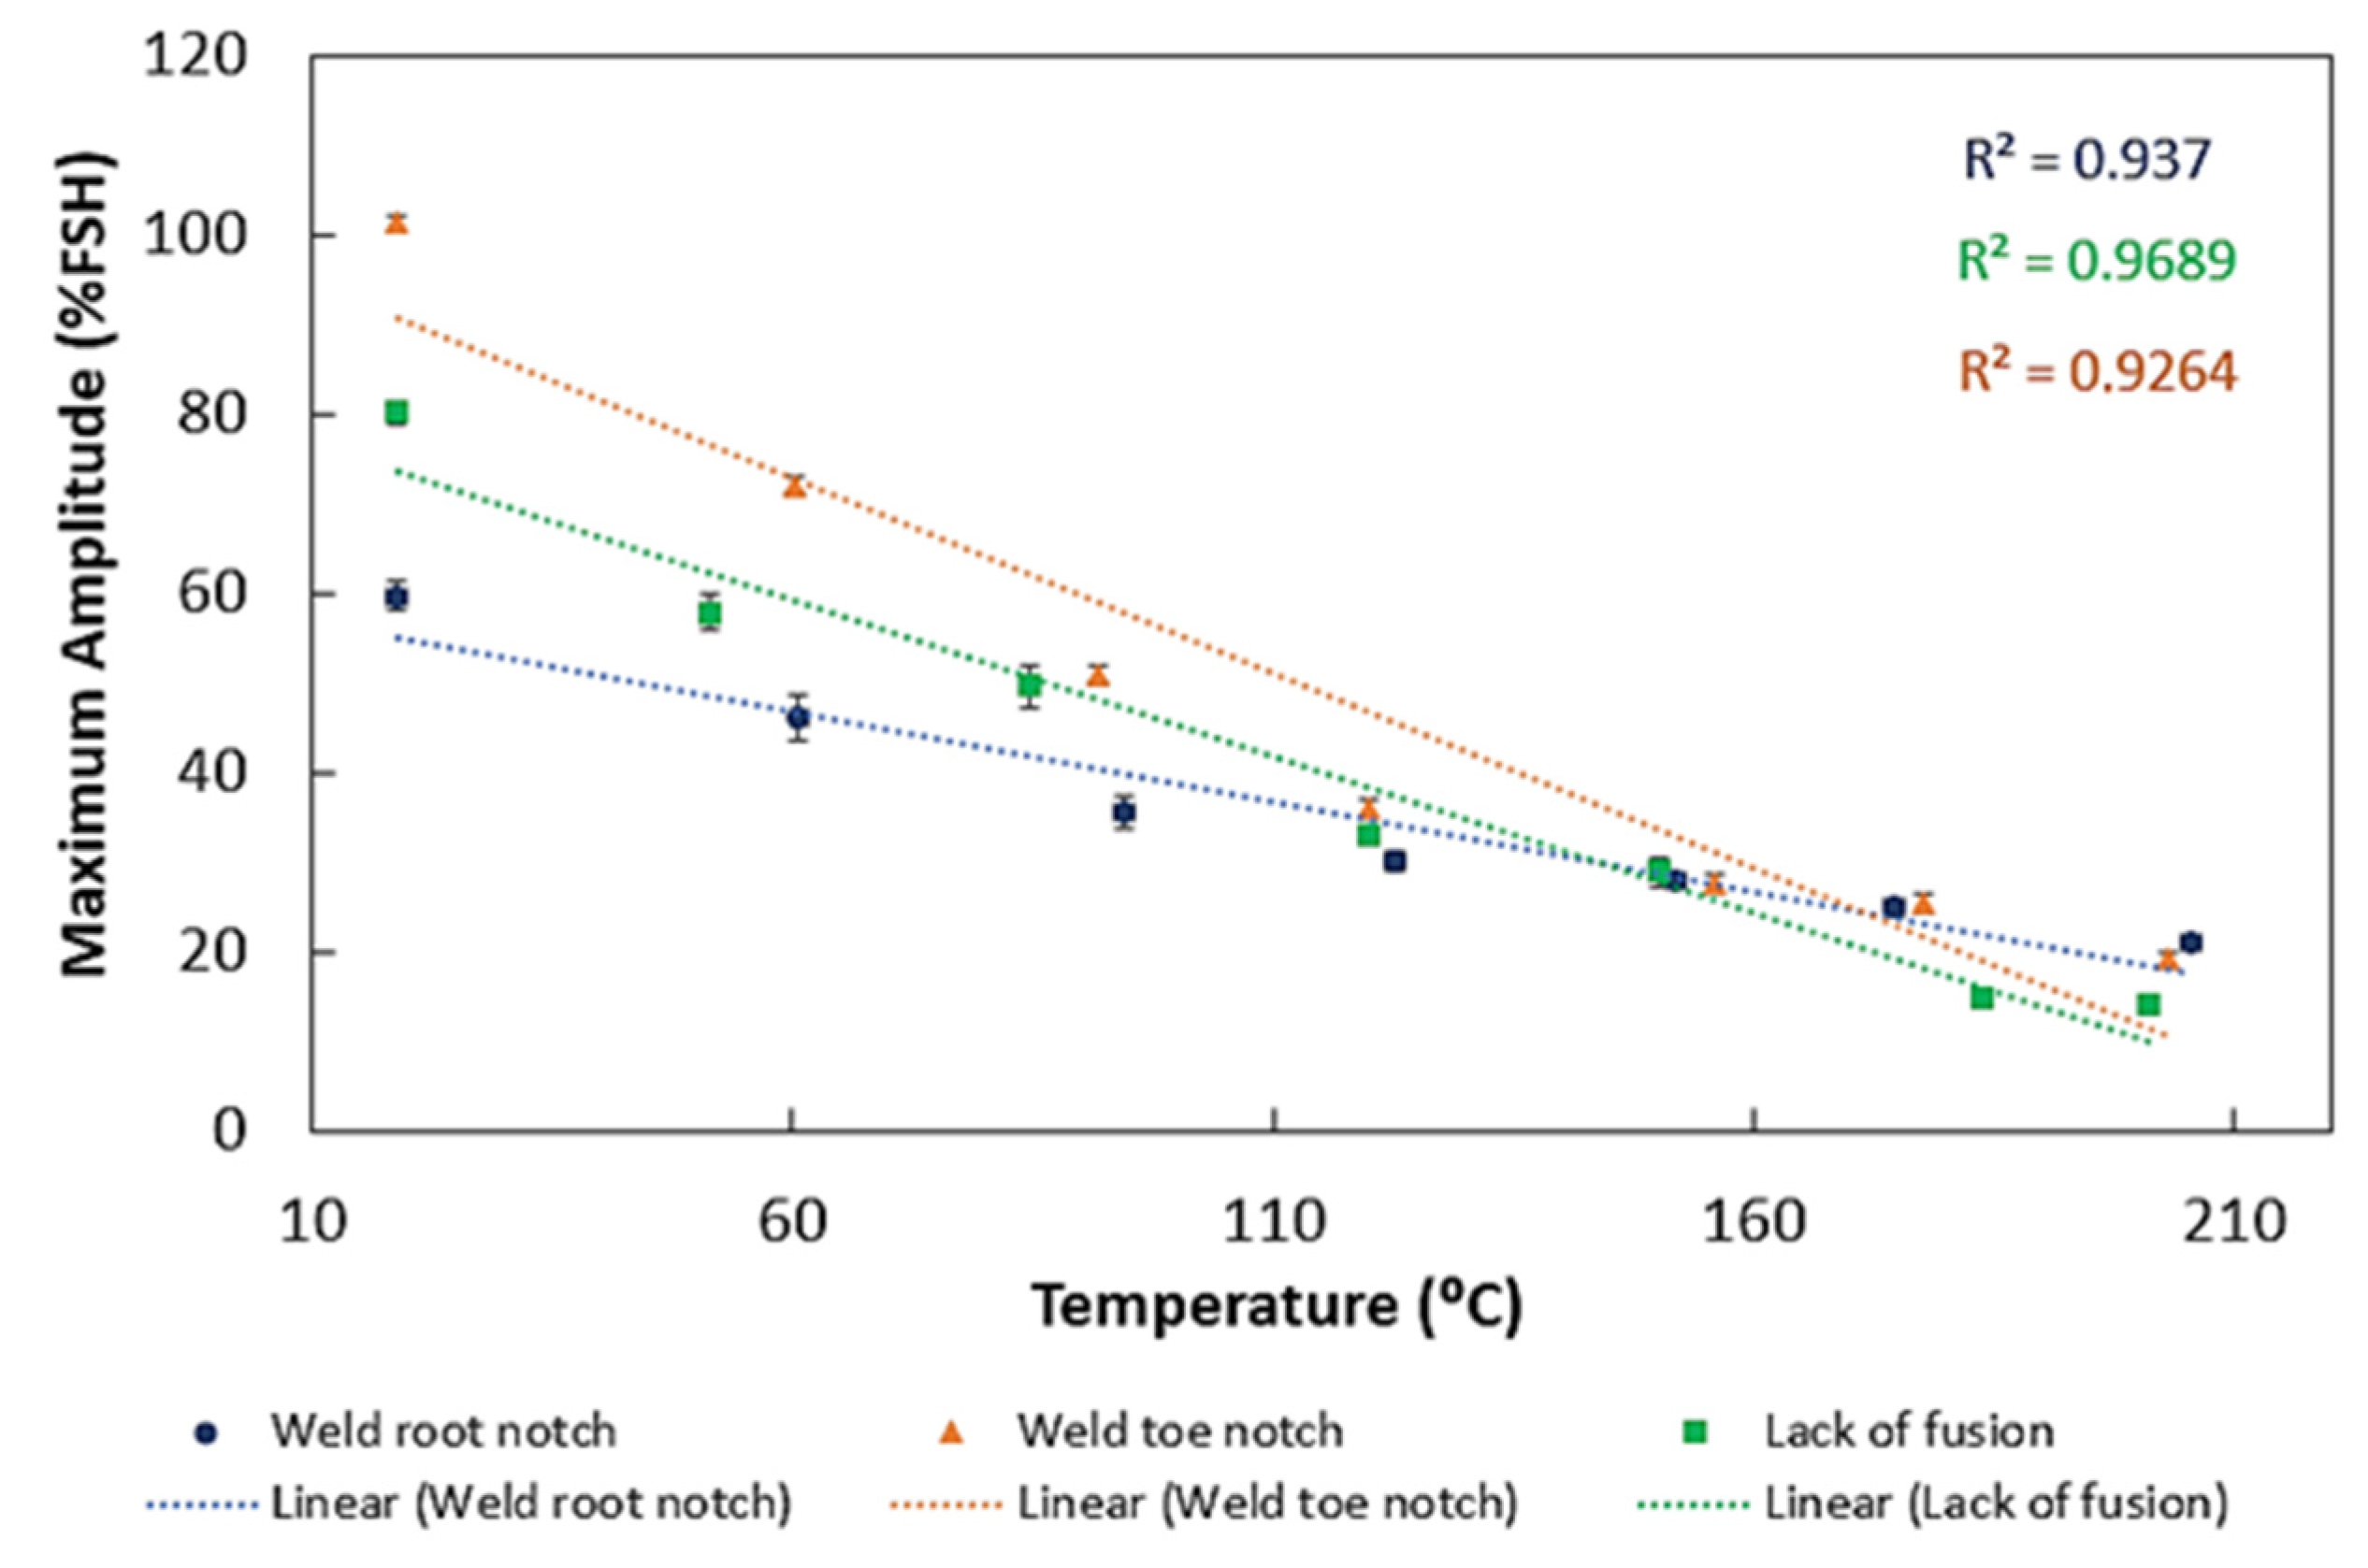
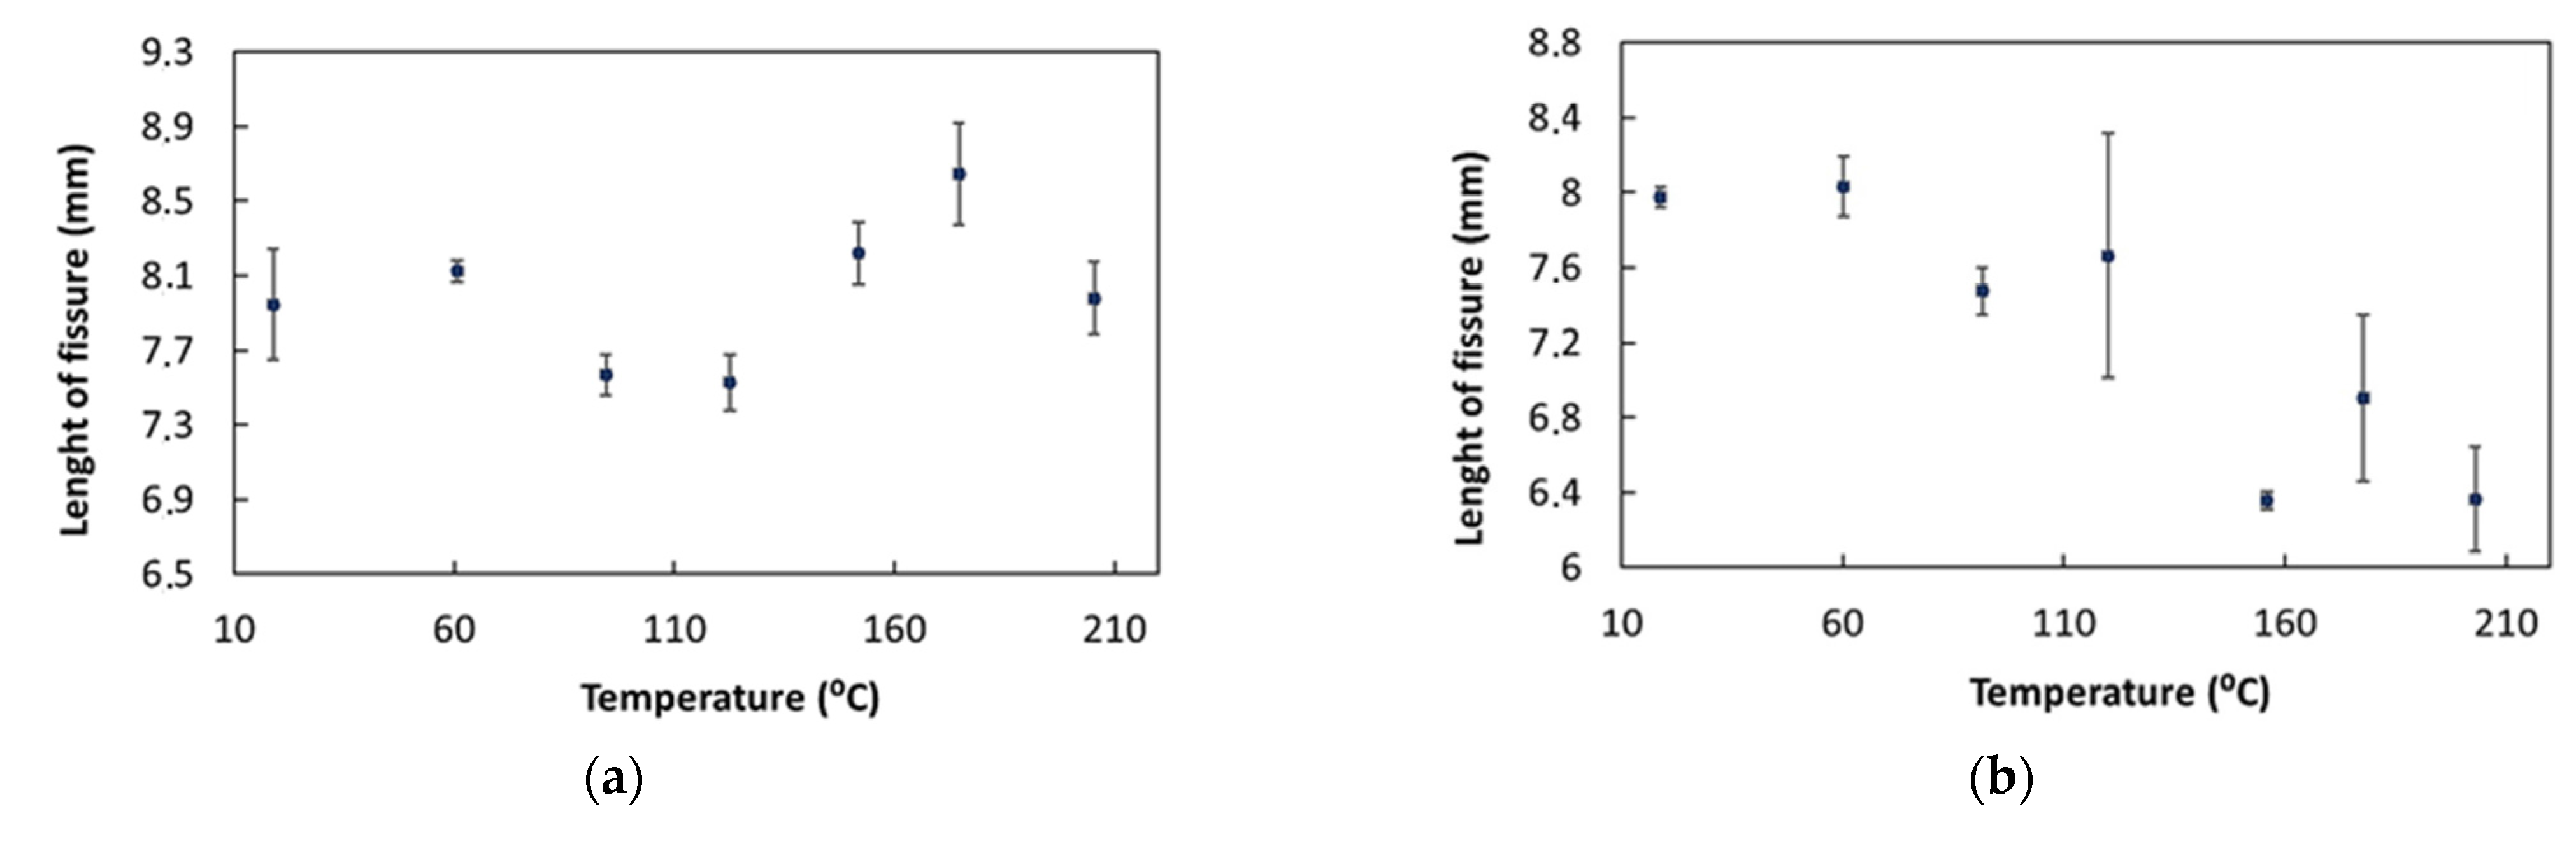
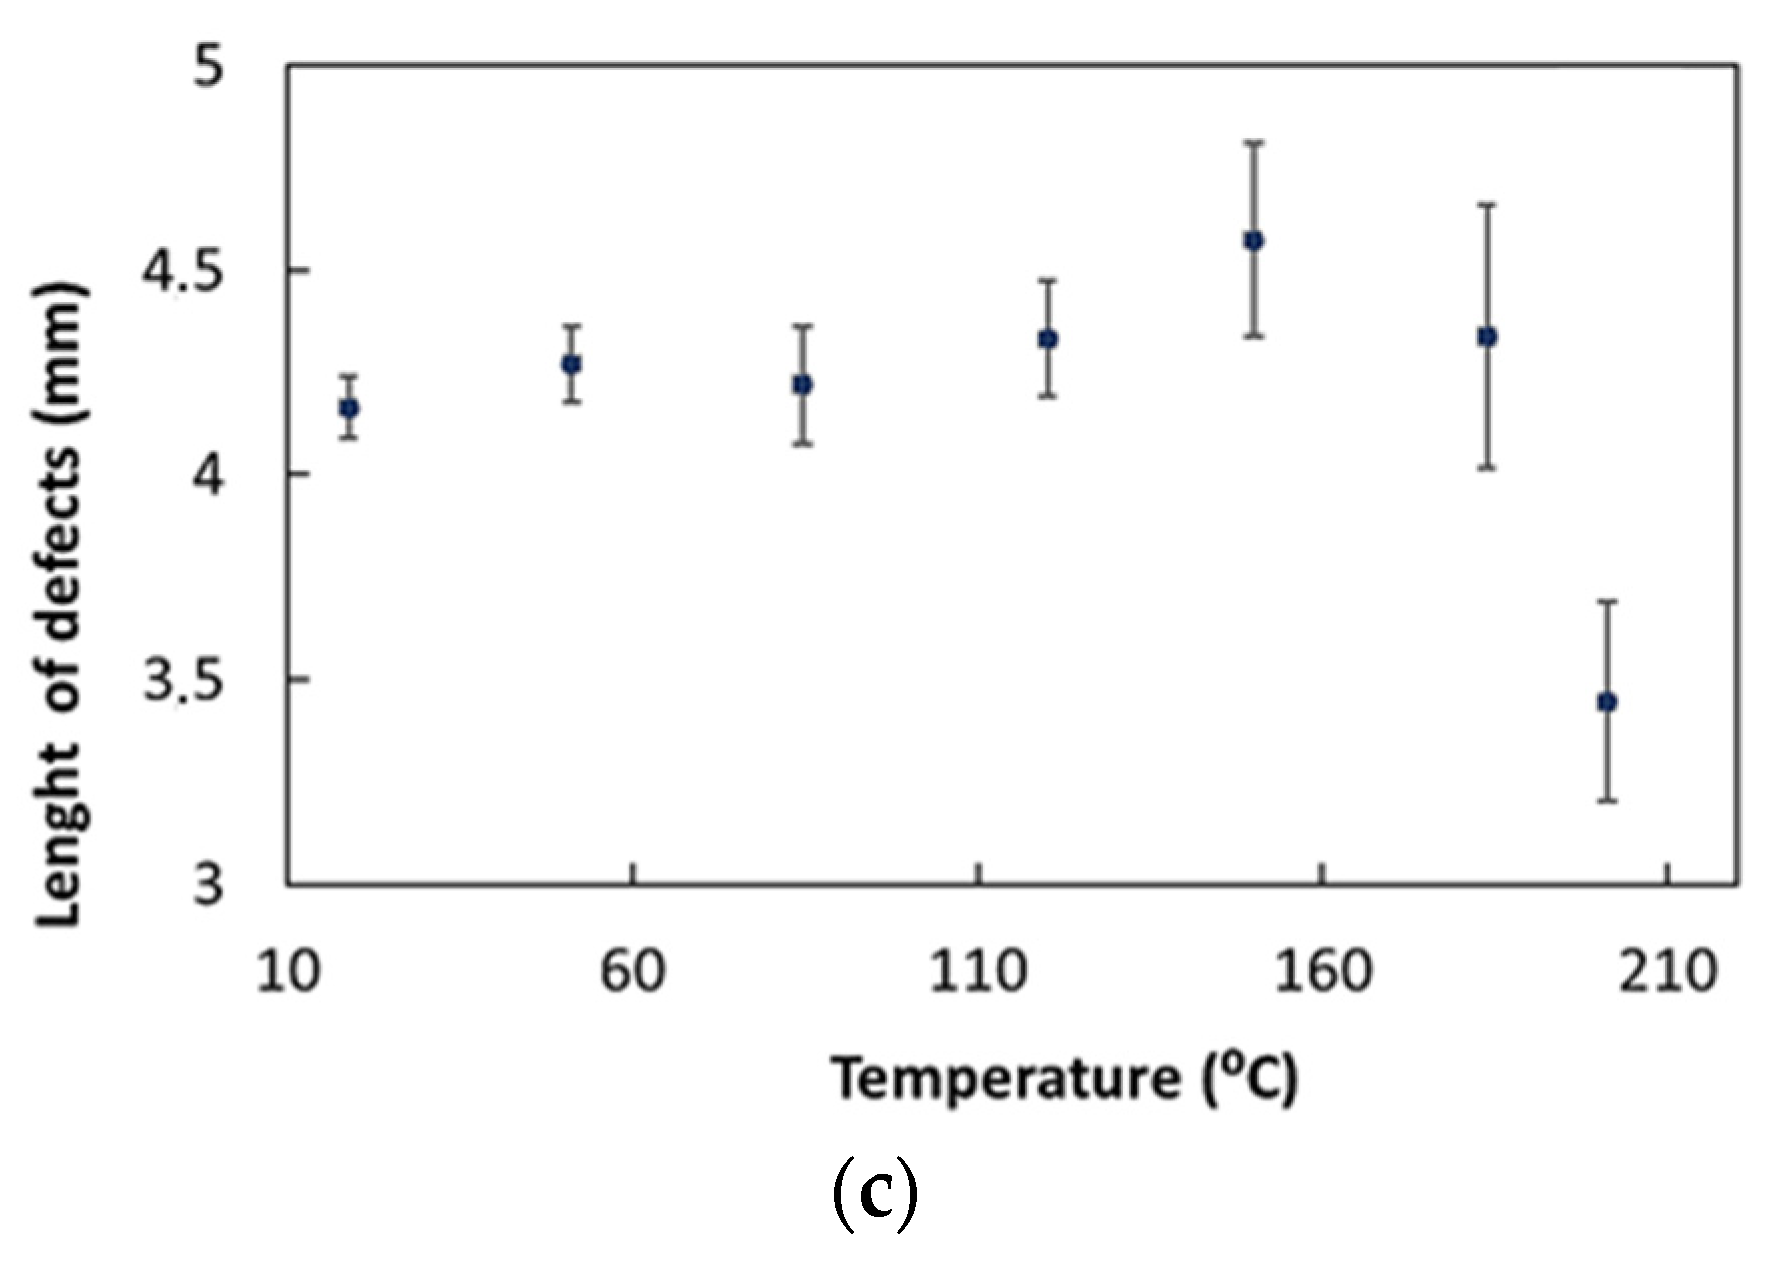
3.4. Experimental Results
4. Eddy Current Testing
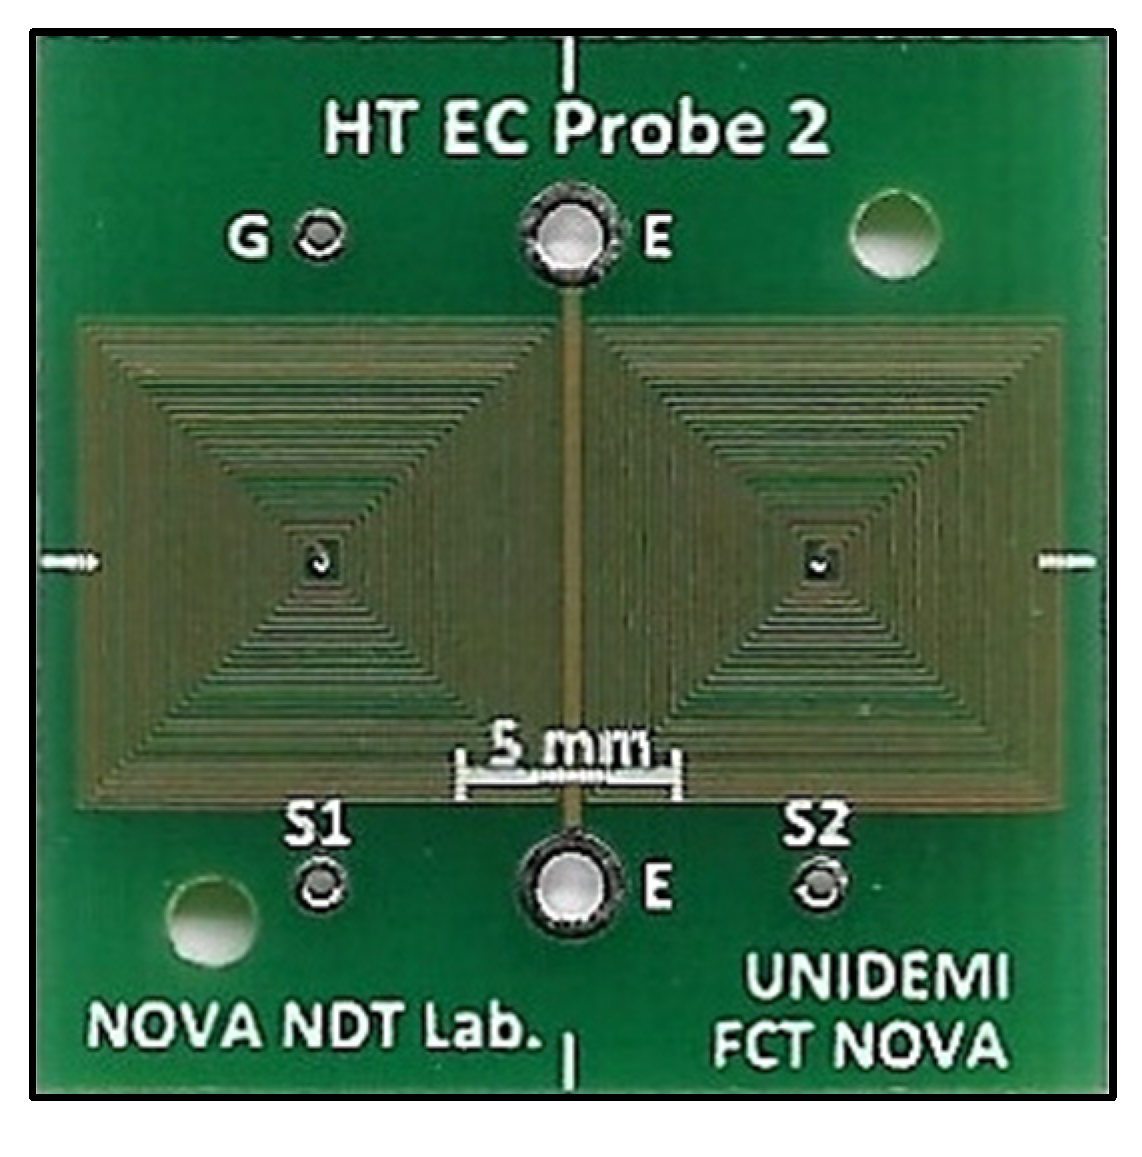
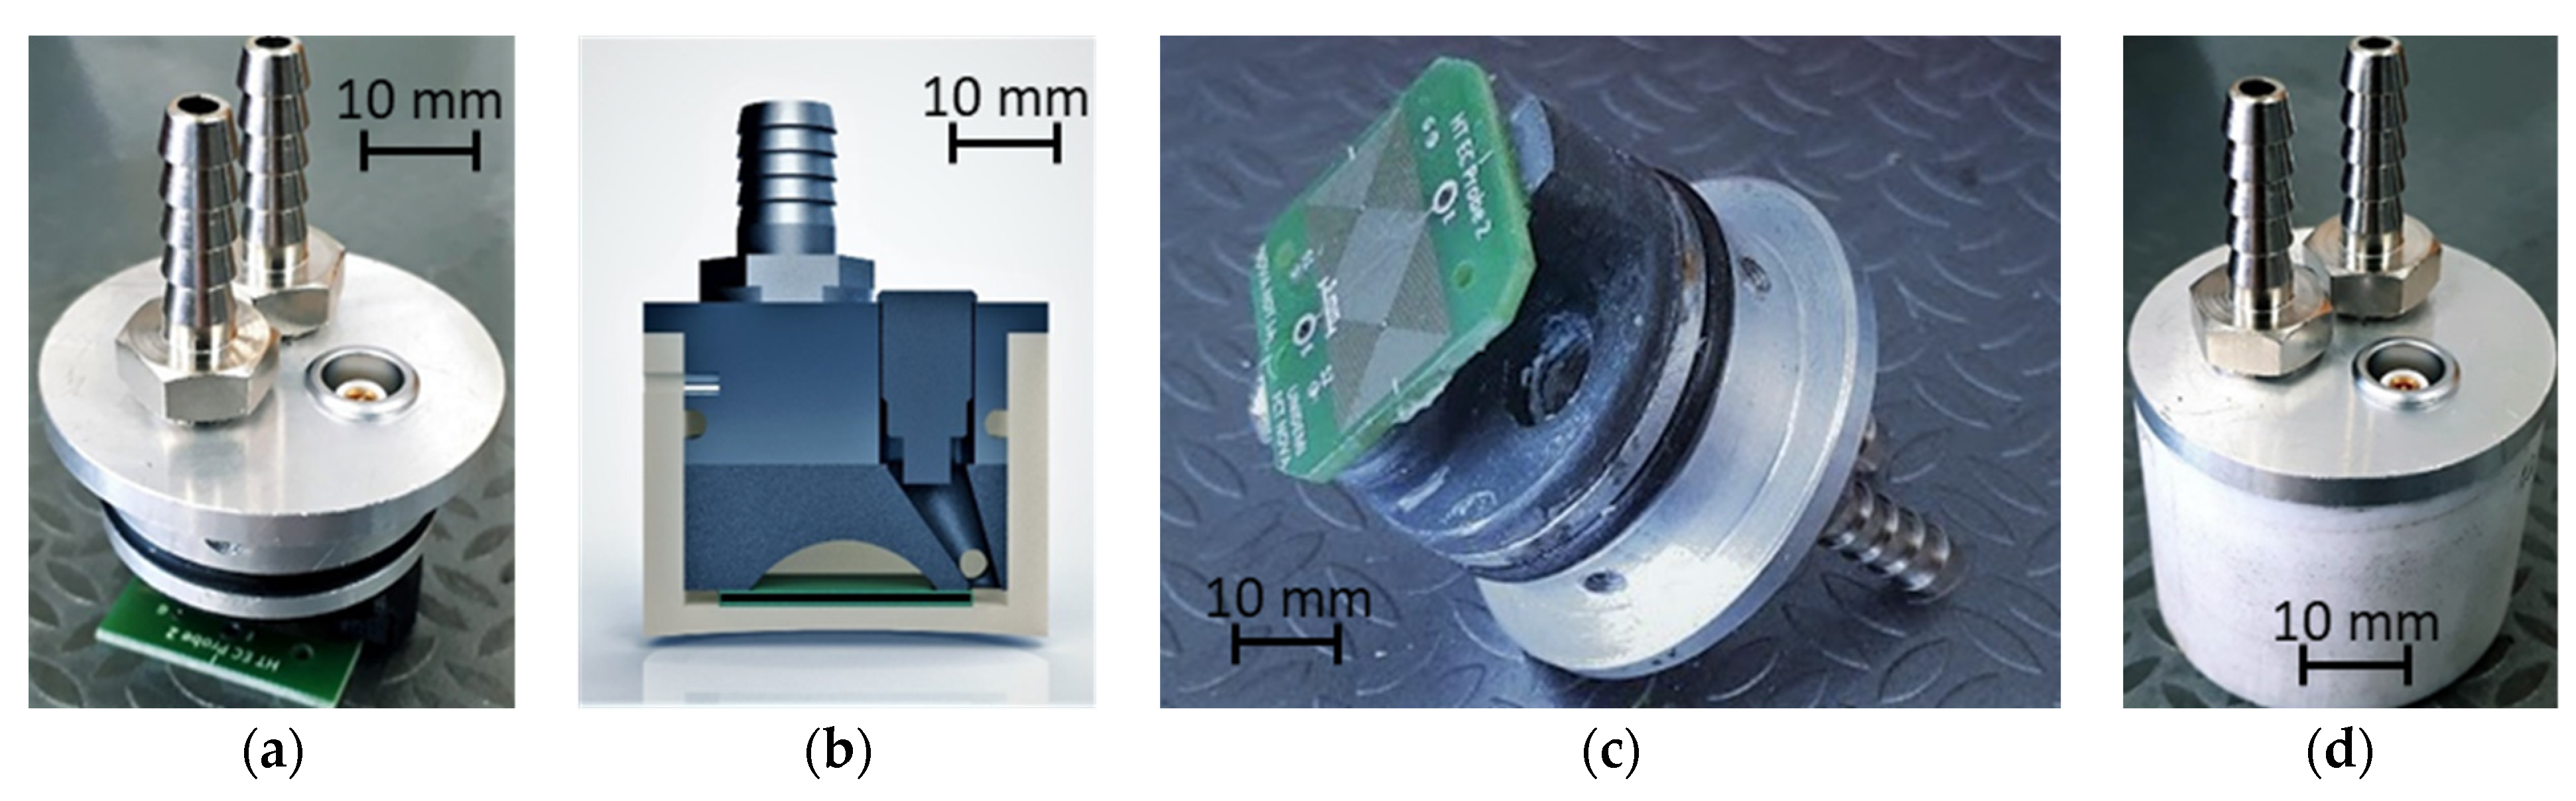
4.1. Customized EC Probes
4.2. Experimental Results
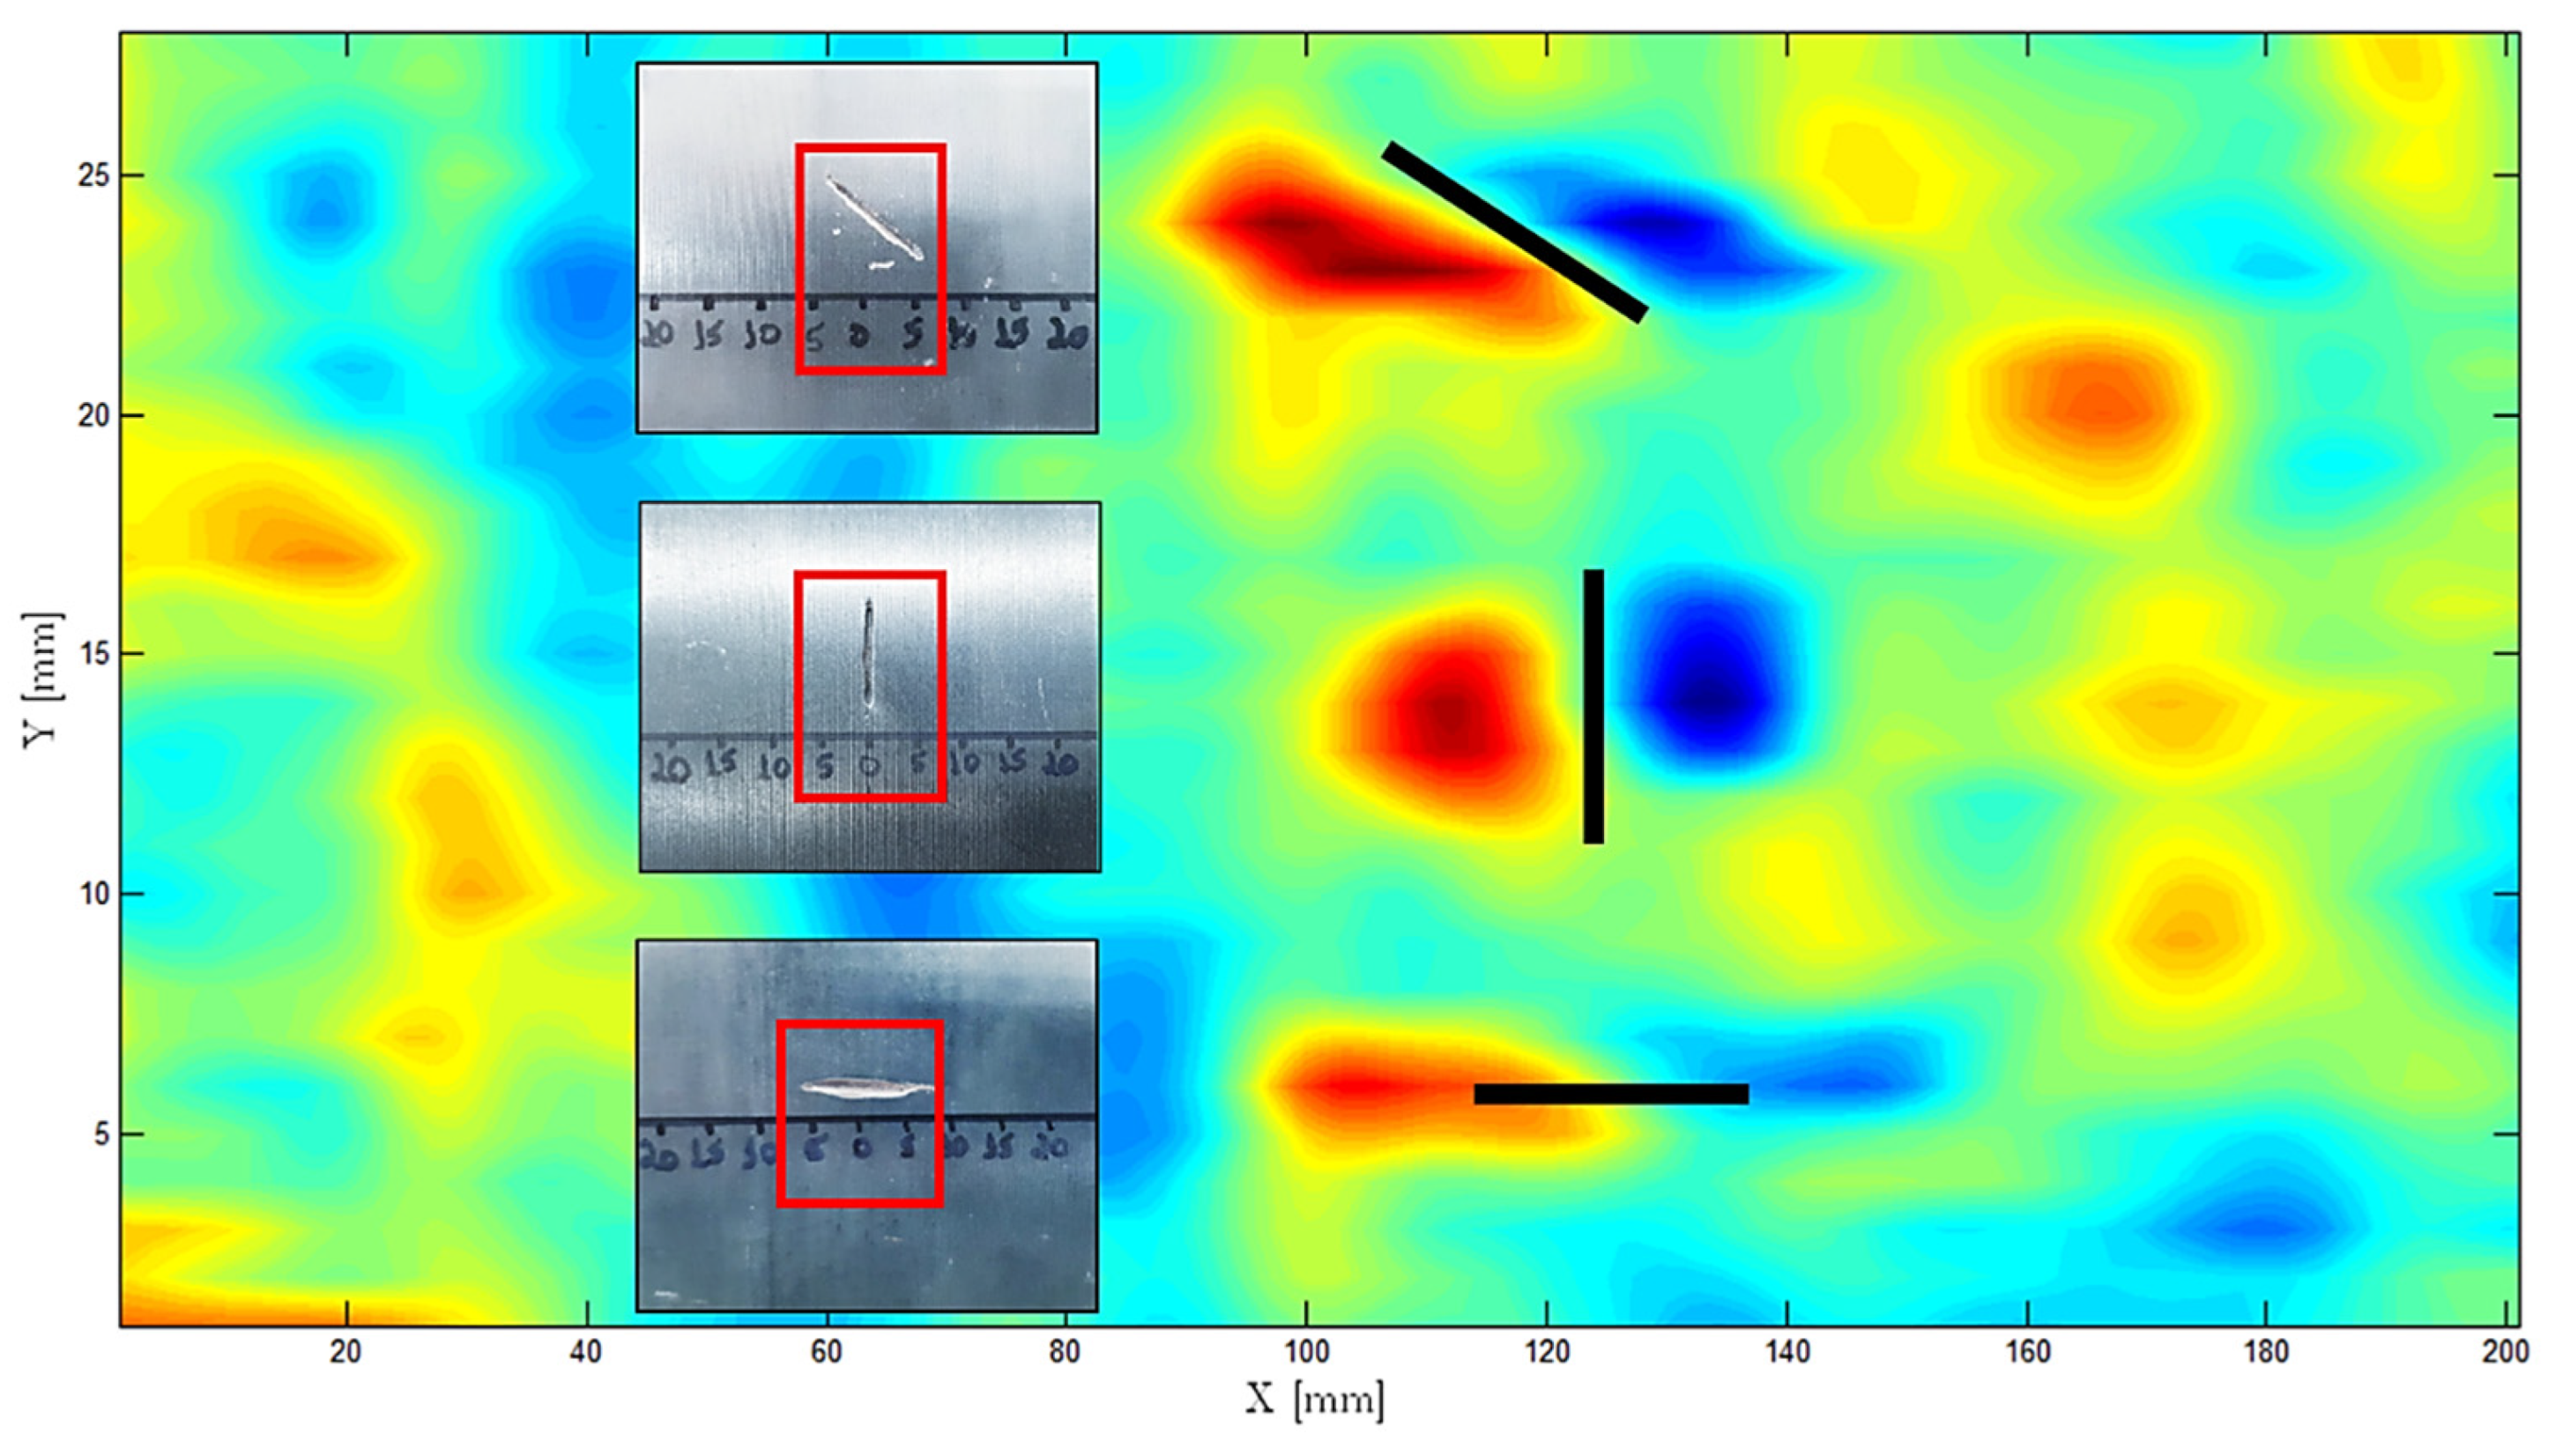
4.2.1. Base Material Inspection
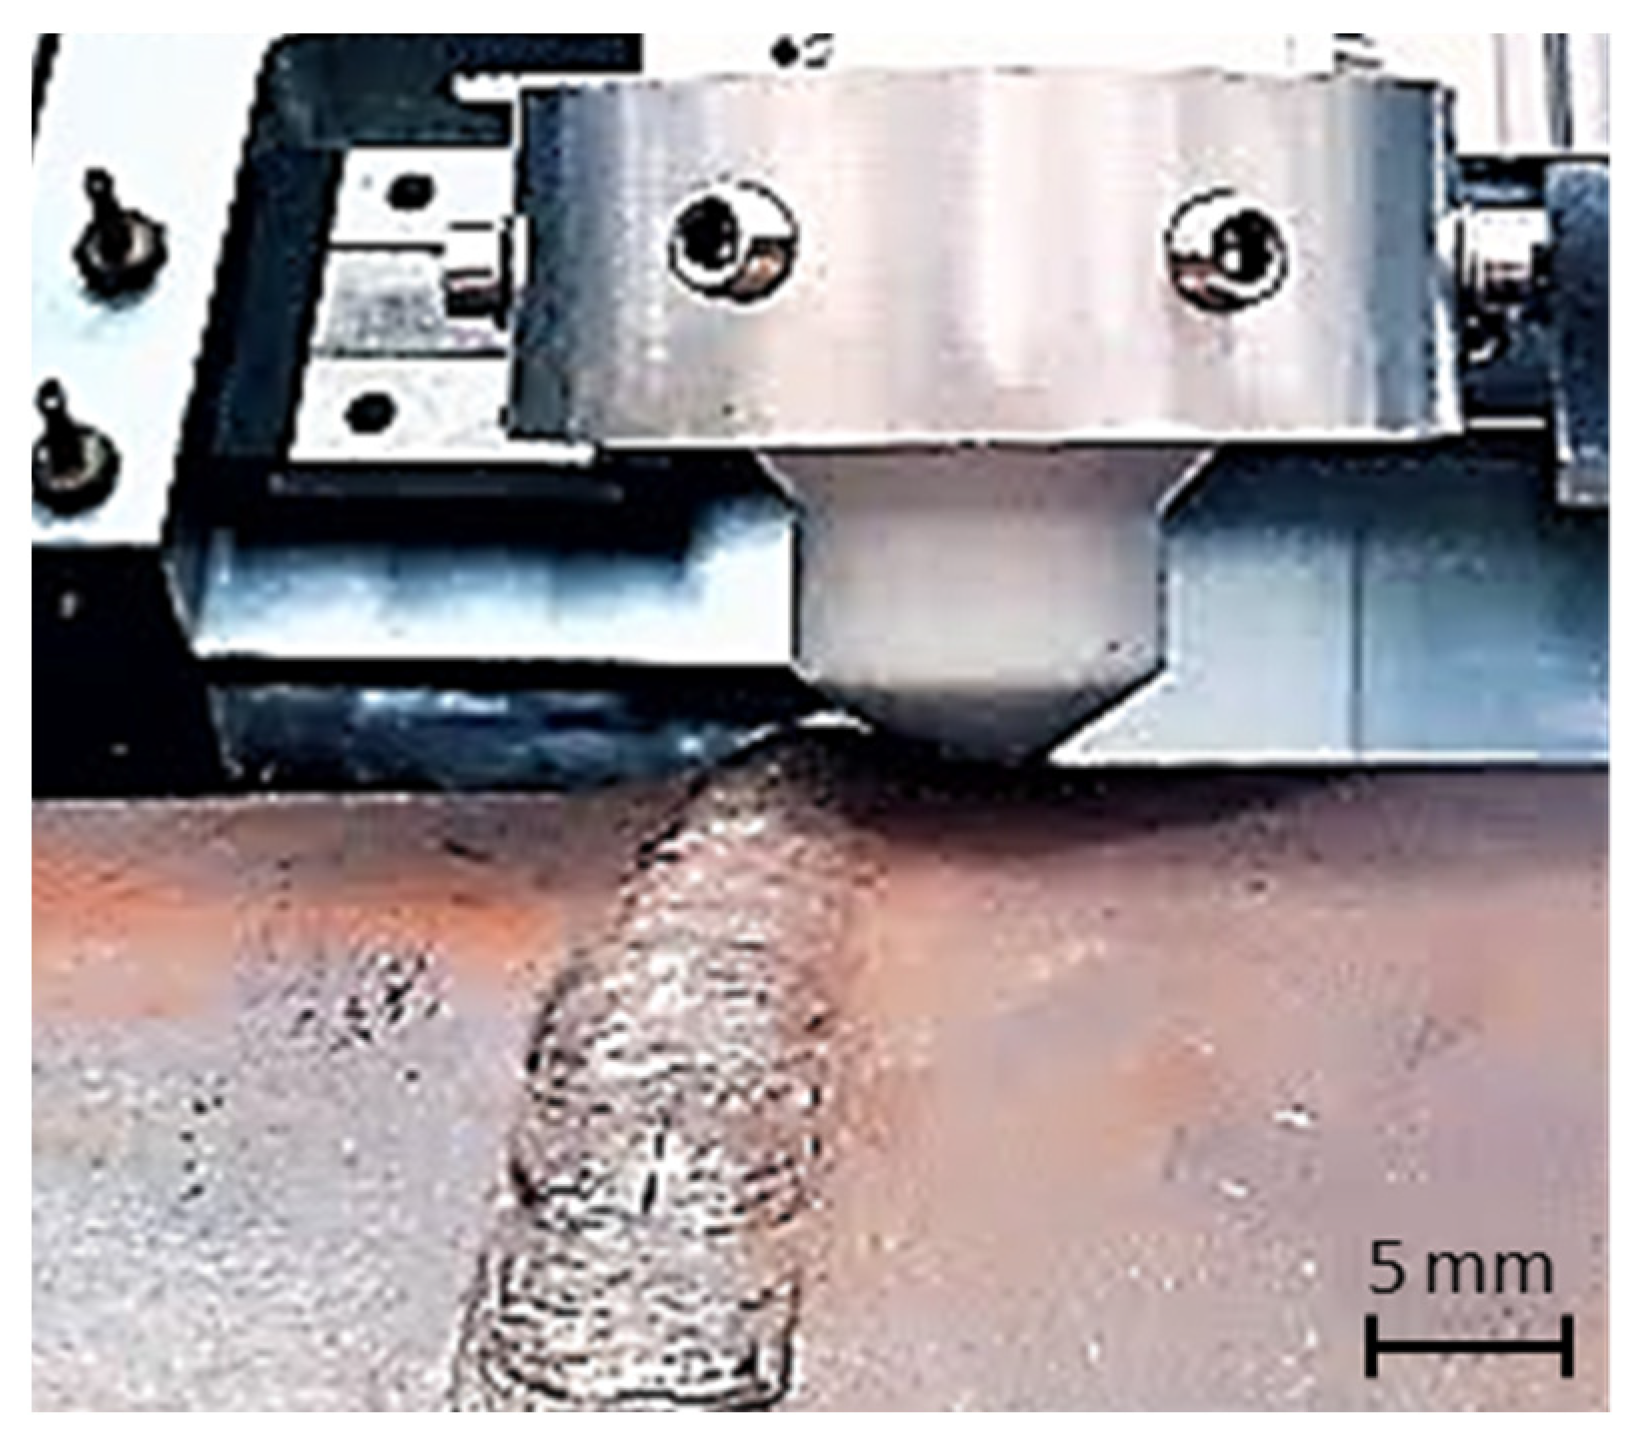
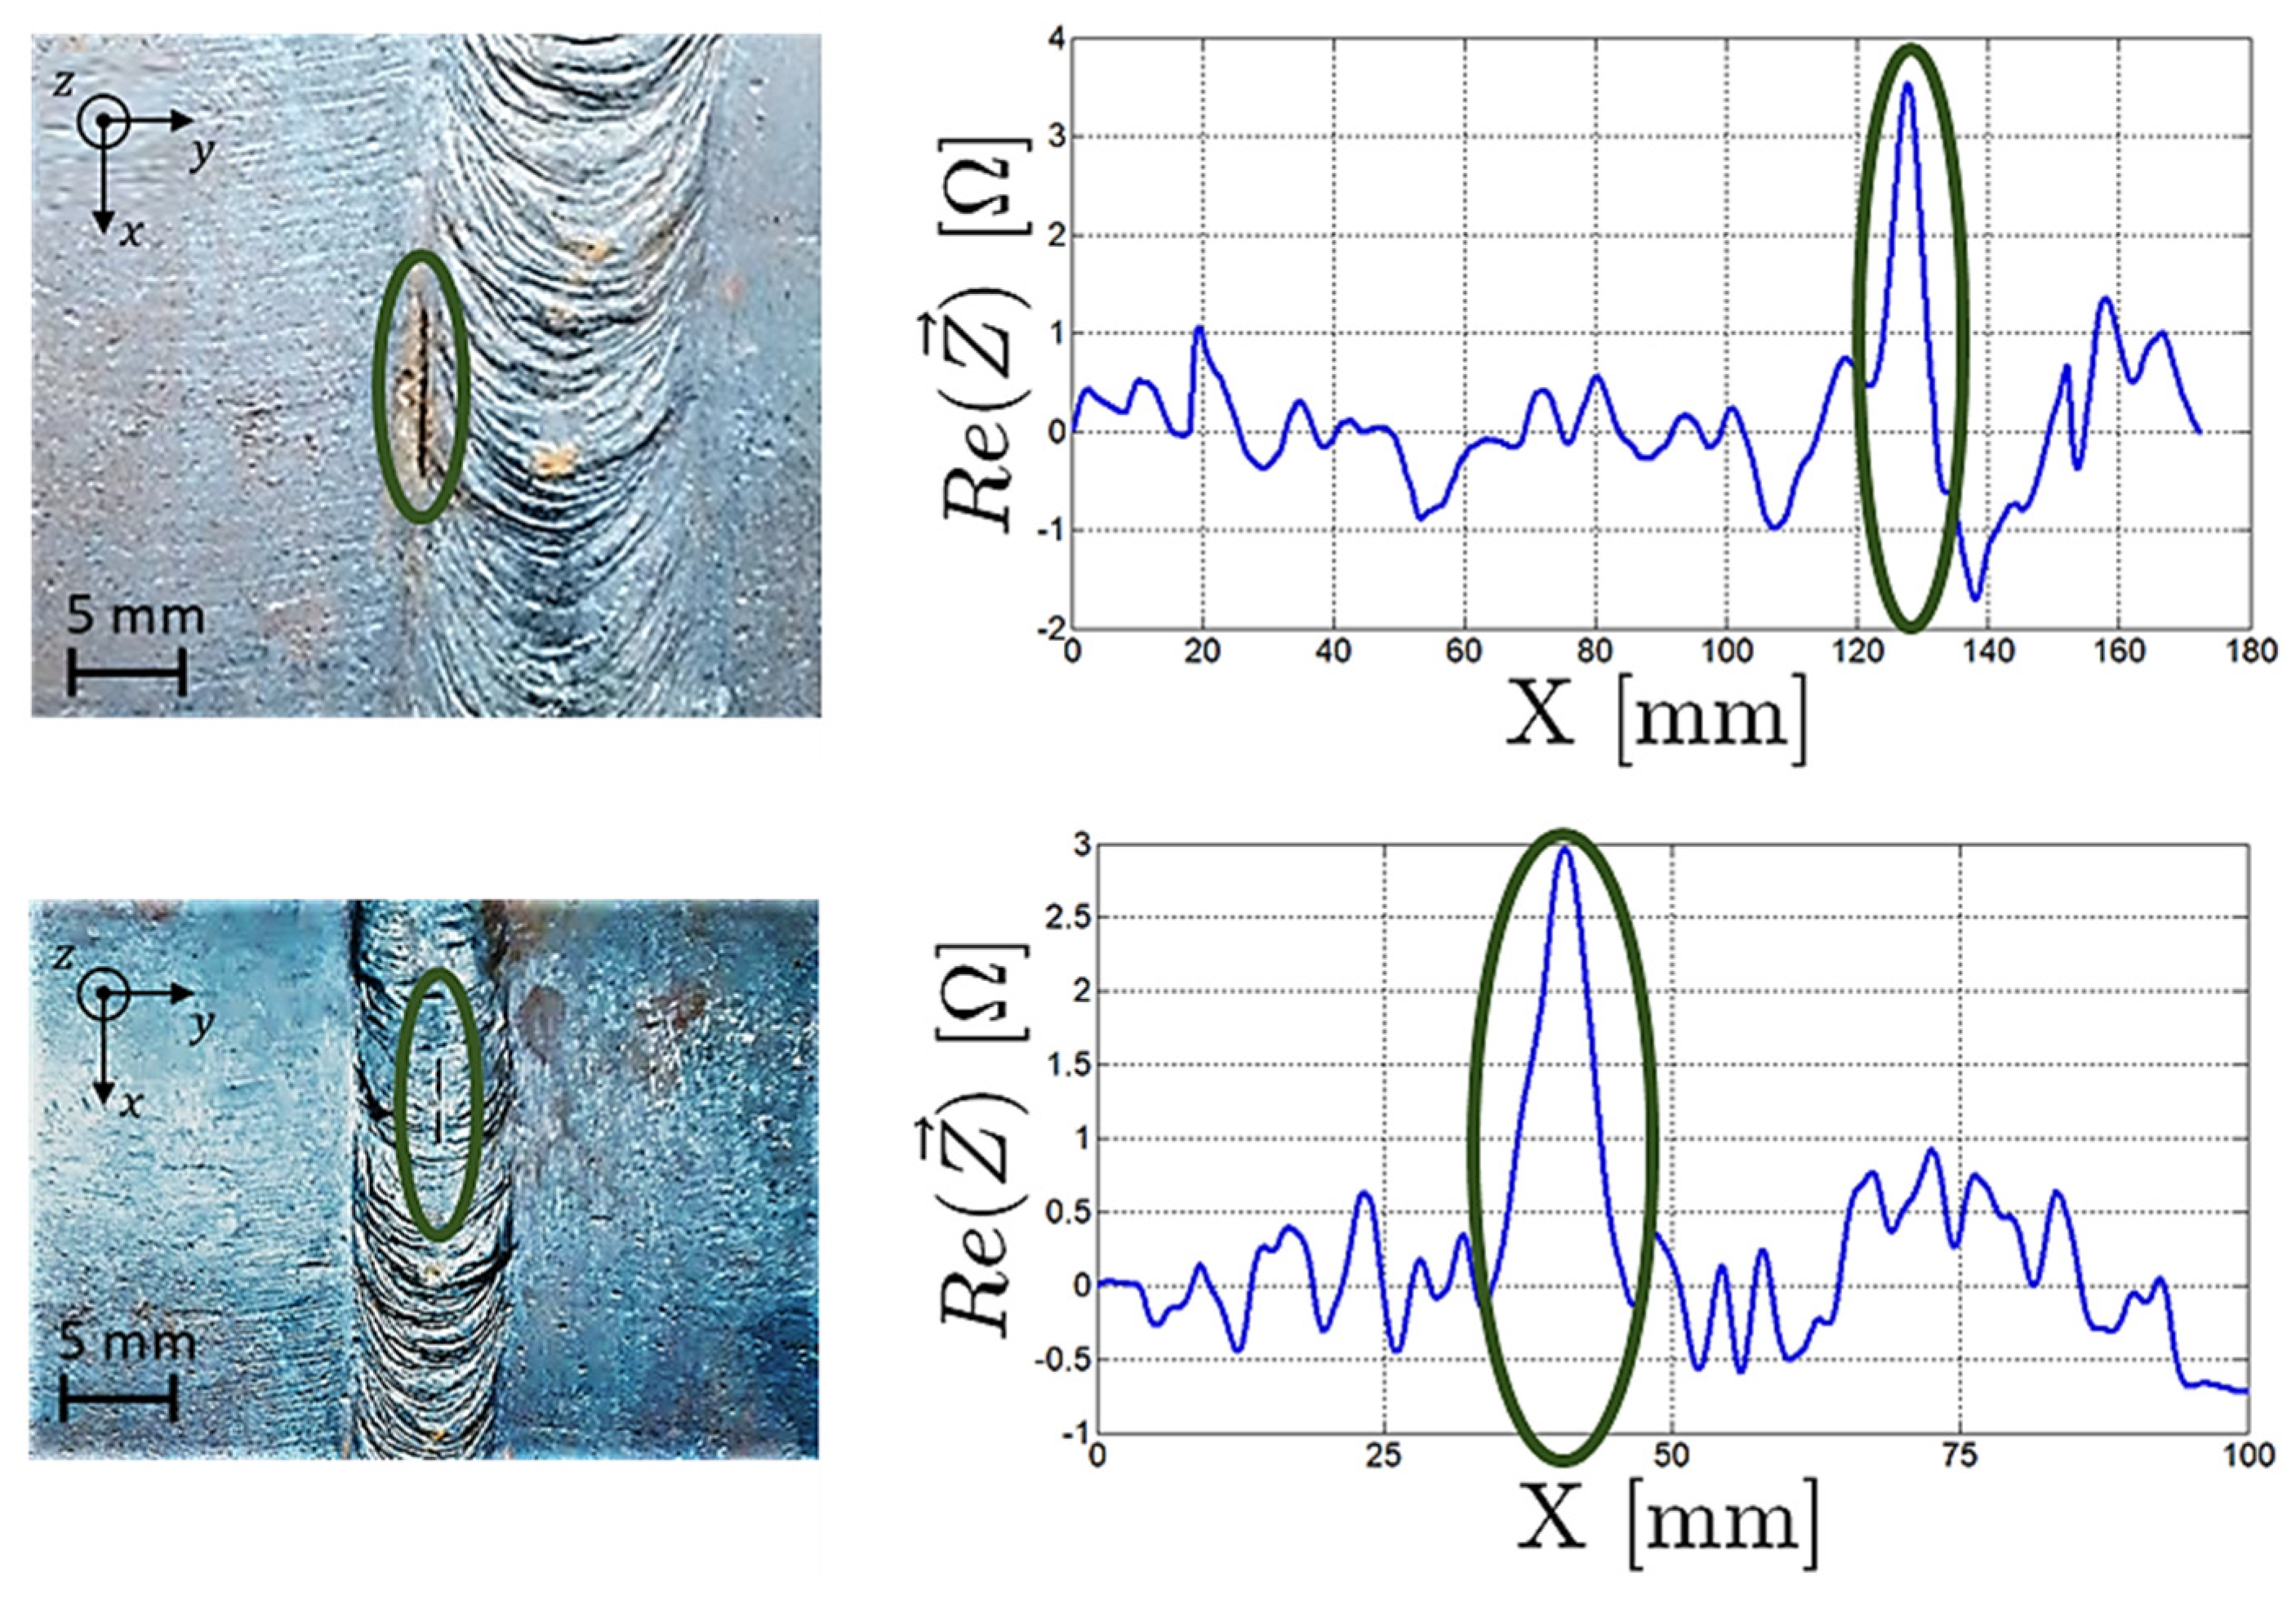
4.2.2. Weld Bead Inspection
5. Conclusions
Author Contributions
Funding
Institutional Review Board Statement
Informed Consent Statement
Acknowledgments
Conflicts of Interest
References
- Ferreira, P.M.; Machado, M.A.; Carvalho, M.S.; Vidal, C. Embedded Sensors for Structural Health Monitoring: Methodologies and Applications Review. Sensors 2022, 22, 8320. [Google Scholar] [CrossRef] [PubMed]
- Santos, T.G.; Oliveira, J.P.; Machado, M.A.; Inácio, P.L.; Duarte, V.R.; Rodrigues, T.A.; Santos, R.A.; Simão, C.; Carvalho, M.; Martins, A.; et al. Reliability and NDT Methods. Adv. Struct. Mater. 2020, 129, 265–295. [Google Scholar] [CrossRef]
- Long, Y.; Luo, J.; Yue, M.; Wu, G.; Zhao, M.; Ji, N.; Song, W.; Jin, Q.; Kuang, X.; Fan, Y. Investigation on leakage cause of 13Cr pipe flange used for a Christmas tree in a high-pressure and high-temperature gas well. Eng. Fail. Anal. 2022, 142, 106793. [Google Scholar] [CrossRef]
- Machado, M.A.; Rosado, L.; Pedrosa, N.; Miranda, R.; Piedade, M.; Santos, T.G. Customized Eddy Current Probes for Pipe Inspection. Stud. Appl. Electromagn. Mech. 2017, 42, 283–290. [Google Scholar] [CrossRef]
- Perez, C. In-Line Quality Control of Hot Wire Steel—Towards Innovative Contactless Solutions and Data Fusion (Incosteel); Publ Off Eur Union: Luxembourg, 2008. [Google Scholar] [CrossRef]
- Rahman, M.M.; Marklein, R. Advanced Techniques for Modelling and Detection of Cracks in Hot Wire Steel. In Proceedings of the 9th European Conference on NDT (ECNDT), Berlin, Germany, 25–29 September 2006; pp. 1–8. [Google Scholar]
- Hartmann, K.; Ricken, W.; Becker, W.-J.; Pérez, C.; Gonzalo, L. Improved Eddy Current Sensor for Hot Wire Inspection. In Proceedings of the 9th European Conference on NDT (ECNDT), Berlin, Germany, 25–29 September 2006; pp. 1–9. [Google Scholar]
- Ricken, W.; Hartmann, K.; Becker, W.-J.; Perez, C.; Gonzalo, L. Optimierung von Wirbelstromspulen. Verbesserte Fehlerdetektion bei der Heißdrahtprüfung Optimised Eddy Current Sensor. Improved Defect Detection on Hot Wire Steel. TM Tech. Mess. 2008, 75, 501–507. [Google Scholar] [CrossRef]
- Klümper-Westkamp, H.; Zoch, H.-W.; Reimche, W.; Bach, F. High Temperature Resistant Eddy Current Sensor for “in situ” Monitoring the Material Microstructure Development of Steel Alloys during Heat Treatment—Bainite Sensor. Procedia Eng. 2011, 25, 1605–1608. [Google Scholar] [CrossRef] [Green Version]
- Tittmann, B.R.; Batista, C.F.G.; Trivedi, Y.P.; Lissenden, C.J., III; Reinhardt, B.T. State-of-the-Art and Practical Guide to Ultrasonic Transducers for Harsh Environments Including Temperatures above 2120 °F (1000 °C) and Neutron Flux above 1013 n/cm2. Sensors 2019, 19, 4755. [Google Scholar] [CrossRef] [Green Version]
- Kazys, R.; Vaskeliene, V. High Temperature Ultrasonic Transducers: A Review. Sensors 2021, 21, 3200. [Google Scholar] [CrossRef]
- Ferreira, P.M.; Machado, M.A.; Carvalho, M.S.; Vidal, C. Granting Sensorial Properties to Metal Parts through Friction Stir Processing. Measurement 2023, 207, 112405. [Google Scholar] [CrossRef]
- Slongo, J.S.; Gund, J.; Passarin, T.A.R.; Pipa, D.R.; Ramos, J.E.; Arruda, L.V.; Junior, F.N. Effects of Thermal Gradients in High-Temperature Ultrasonic Non-Destructive Tests. Sensors 2022, 22, 2799. [Google Scholar] [CrossRef]
- Netshidavhini, N.; Mabuza, R.B. Effects of Various Couplants on Carbon Steel and Aluminium Materials Using Ultrasonic Testing. In Proceedings of the 18th World Conference on Nondestructive Testing, Durban, South Africa, 16–20 April 2012; pp. 16–20. [Google Scholar]
- Li, C.; Nordlund, E. Effects of couplants on acoustic transmission. Rock Mech. Rock Eng. 1993, 26, 63–69. [Google Scholar] [CrossRef]
- Clarke, T.; Cawley, P.; Wilcox, P.D.; Croxford, A.J. Evaluation of the damage detection capability of a sparse-array guided-wave SHM system applied to a complex structure under varying thermal conditions. IEEE Trans. Ultrason. Ferroelectr. Freq. Control. 2009, 56, 2666–2678. [Google Scholar] [CrossRef] [PubMed]
- Croxford, A.J.; Moll, J.; Wilcox, P.; Michaels, J.E. Efficient temperature compensation strategies for guided wave structural health monitoring. Ultrasonics 2010, 50, 517–528. [Google Scholar] [CrossRef] [PubMed]
- Machado, M.A.; Rosado, L.S.; Santos, T.G. Shaping Eddy Currents for Non-Destructive Testing Using Additive Manufactured Magnetic Substrates. J. Nondestruct. Eval. 2022, 41, 50. [Google Scholar] [CrossRef]
- Machado, M.A.; Antin, K.-N.; Rosado, L.S.; Vilaça, P.; Santos, T.G. High-speed inspection of delamination defects in unidirectional CFRP by non-contact Eddy current testing. Compos. Part B Eng. 2021, 224, 109167. [Google Scholar] [CrossRef]
- Machado, M.A.; Rosado, L.F.S.G.; Mendes, N.A.M.; Miranda, R.M.M.; dos Santos, T.J.G. New directions for inline inspection of automobile laser welds using non-destructive testing. Int. J. Adv. Manuf. Technol. 2021, 118, 1183–1195. [Google Scholar] [CrossRef]
- He, P.; Ma, Y.; Chen, H. Temperature Drift Compensation of Eddy Current Sensor under High Temperature Environment. E3S Web Conf. 2018, 38, 04005. [Google Scholar] [CrossRef] [Green Version]
- Beck, F.R.; Lind, R.P.; Smith, J.A. Temperature Sensitivity Study of Eddy Current and Digital Gauge Probes for Oxide Measurement. Res. Nondestruct. Eval. 2018, 30, 334–349. [Google Scholar] [CrossRef]
- Vetterlein, J.; Klümper-Westkamp, H.; Hirsch, T.; Mayr, P. September. Eddy current testing at high temperatures for controlling heat treatment processes. In Proceedings of the International Symposium of Non Destructive Testing in Civil Engineering, Berlin, Germany, 16–19 September 2003; pp. 16–19. [Google Scholar]
- Machado, M.A.; Rosado, L.S.; Mendes, N.M.; Miranda, R.M.; Santos, T.G. Multisensor Inspection of Laser-Brazed Joints in the Automotive Industry. Sensors 2021, 21, 7335. [Google Scholar] [CrossRef]
- SRPS EN 10216–2: 2014; Seamless Steel Tubes for Pressure Purposes. Non-Alloy and Alloy Steel Tubes with Specified Elevated Tem-Perature Properties. 2014. Available online: https://iss.rs/en/project/show/iss:proj:47290 (accessed on 20 February 2023).
- ISO 13588; Non-Destructive Testing of Welds, Ultrasonic Testing, Use of Automated Phased Array Technology. ISO: London, UK, 2019.
- ISO 17640:2010; Non-Destructive Testing of Welds–Ultrasonic Testing—Techniques, Testing Levels, and Assessment. ISO: London, UK, 2010.
- Burger, B.; Fuchs, M. Introduction to Phased Array Ultrasonic Technology Applications, 1st ed.; Olympus: Waltham, MA, USA, 2005. [Google Scholar]
- Dubé, N. Advanced in Phased Array Ultrasonic Technology Applications: Olympus Guideline; Olympus NTD: Waltham, MA, USA, 2017. [Google Scholar]
- Cheong, Y.-M.; Kim, K.-M.; Kim, D.-J. High-temperature ultrasonic thickness monitoring for pipe thinning in a flow-accelerated corrosion proof test facility. Nucl. Eng. Technol. 2017, 49, 1463–1471. [Google Scholar] [CrossRef]
- Oh, S.-B.; Cheong, Y.-M.; Kim, D.-J.; Kim, K.-M. On-Line Monitoring of Pipe Wall Thinning by a High Temperature Ultrasonic Waveguide System at the Flow Accelerated Corrosion Proof Facility. Sensors 2019, 19, 1762. [Google Scholar] [CrossRef] [PubMed] [Green Version]


| General Dimensions | Standard Block | |
|---|---|---|
| Length | 500 mm |  |
| Thickness | 7.1 mm | |
| Outer diameter | 323.9 mm | |
| Weld dimensions | Weld cut view | |
| Bevel type | 60° V bevel |  |
| Root height | 1.5 mm | |
| Root spacing | 3 mm | |
| Defect | Weld Toe Notch | Weld Bevel Flat Bottom Hole | Weld Root Notch |
|---|---|---|---|
| Manufacturing method | EDM (electrical discharge machining) | Drilling | EDM (electrical discharge machining) |
| Length | 8 | - | 8 |
| Width | 0.3 | - | 0.3 |
| Height | 1 | - | 1 |
| Diameter | - | 2.5 | - |
| Position | Top surface, in the weld toe | Weld bevel (at 30°), centred at half thickness | Bottom surface, in the weld root |
| Representation |  |  |  |
| N° of Crystals | Element Width | Gap between | Element Size | Central Frequency | Bandwidth |
|---|---|---|---|---|---|
| 20 | 16 mm | 0.2 mm | 1 mm | 3.25 MHz | 60% |
| Weld bevel flat bottom hole |  | |
| Wave type | Longitudinal | |
| Active elements | 15 active elements 6 sequences | |
| Angle range | 58.2° to 70.8° | |
| Weld toe notch |  | |
| Wave type | Transversal | |
| Active elements | 10 active elements 4 sequences | |
| Angle range | 38.5° to 45.9° | |
| Weld root notch |  | |
| Wave type | Longitudinal | |
| Active elements | 12 active elements 9 sequences | |
| Angle range | 64.2° to 75.7° | |
Disclaimer/Publisher’s Note: The statements, opinions and data contained in all publications are solely those of the individual author(s) and contributor(s) and not of MDPI and/or the editor(s). MDPI and/or the editor(s) disclaim responsibility for any injury to people or property resulting from any ideas, methods, instructions or products referred to in the content. |
© 2023 by the authors. Licensee MDPI, Basel, Switzerland. This article is an open access article distributed under the terms and conditions of the Creative Commons Attribution (CC BY) license (https://creativecommons.org/licenses/by/4.0/).
Share and Cite
Santos, D.; Machado, M.A.; Monteiro, J.; Sousa, J.P.; Proença, C.S.; Crivellaro, F.S.; Rosado, L.S.; Santos, T.G. Non-Destructive Inspection of High Temperature Piping Combining Ultrasound and Eddy Current Testing. Sensors 2023, 23, 3348. https://doi.org/10.3390/s23063348
Santos D, Machado MA, Monteiro J, Sousa JP, Proença CS, Crivellaro FS, Rosado LS, Santos TG. Non-Destructive Inspection of High Temperature Piping Combining Ultrasound and Eddy Current Testing. Sensors. 2023; 23(6):3348. https://doi.org/10.3390/s23063348
Chicago/Turabian StyleSantos, David, Miguel A. Machado, João Monteiro, José P. Sousa, Carla S. Proença, Fernando S. Crivellaro, Luís S. Rosado, and Telmo G. Santos. 2023. "Non-Destructive Inspection of High Temperature Piping Combining Ultrasound and Eddy Current Testing" Sensors 23, no. 6: 3348. https://doi.org/10.3390/s23063348