Review

Fluorescence Methods for the Detection of Bioaerosols in Their Civil and Military Applications

by
Mirosław Kwaśny
,
Aneta Bombalska
*,
Miron Kaliszewski
,
Maksymilian Włodarski
and
Krzysztof Kopczyński
Institute of Optoelectronics, Military University of Technology, gen. Sylwestra Kaliskiego 2, Str., 00-908 Warsaw, Poland
*
Author to whom correspondence should be addressed.
Sensors 2023, 23(6), 3339; https://doi.org/10.3390/s23063339
Submission received: 26 February 2023 / Revised: 10 March 2023 / Accepted: 15 March 2023 / Published: 22 March 2023
(This article belongs to the Special Issue Advances in Optical Sensing, Instrumentation and Systems)

Abstract

:
The article presents the history of the development and the current state of the apparatus for the detection of interferents and biological warfare simulants in the air with the laser-induced fluorescence (LIF) method. The LIF method is the most sensitive spectroscopic method and also enables the measurement of single particles of biological aerosols and their concentration in the air. The overview covers both the on-site measuring instruments and remote methods. The spectral characteristics of the biological agents, steady-state spectra, excitation–emission matrices, and their fluorescence lifetimes are presented. In addition to the literature, we also present our own detection systems for military applications.

1. Introduction

Biological material emitted to the atmosphere from biogenic sources or intentionally introduced can seriously affect human health and many different environmental processes [1,2,3]. We inhale and exhale air containing thousands of particles such as living, dormant, dead, pathogenic, allergenic, or biologically inert materials [3]. Primary biological aerosol particles (PBAP) or “bioaerosols” may contain bacteria, viruses, fungal spores, pollen, animal and human debris, fragments of leaves, vegetative detritus, fungal hyphae, and biopolymers [4]. Aerosols also contain aromatic hydrocarbons from industrial chemicals and engine exhaust.
Air monitoring is an important element of civil protection. It is used both in early warning systems against a potential bioterrorist act and in determining the air purity in workspaces (production, service, office, hospital rooms, ventilation inlets), residential, public utility, means of transport as well as in the air [5]. A separate problem related to the threat of bioaerosols was the fear of using biological warfare agents. Biological weapons (BWs) are a type of weapon of mass destruction in which the combat charge are pathogenic microorganisms (e.g., anthrax) or viruses (e.g., smallpox virus).
Biodetection is a compromise between time and the amount of information on the specificity of a biological agent. Its types can be divided into the warning, classification, and identification of biological particles. The fastest real-time detection techniques use particle counters and analyzers based on light scattering. Physical methods enabling the classification of biological agents include spectroscopic methods: FTIR [6,7,8,9], Raman [10,11], and fluorescence [12,13,14,15]. Identification is only possible using biochemical techniques (nucleic acid sequence identification, affinity, and the specificity of natural antibodies for detecting antigens).
One of the most important and sensitive methods of the spectroscopic techniques is based on ultraviolet laser-induced fluorescence (UV-LIF). It was originally implemented by the military research community for the rapid detection of biological warfare agents. LIF plays an important role in the detection and classification of biological material in the air [16,17], on surfaces [18,19], in water [20], and in medical diagnosis [21,22]. The construction of biosensors based on UV light-induced fluorescence and elastic scattering began at the end of the 20th century. From 1990 to 2005, advanced detection systems were built and many tests were carried out in both field and laboratory conditions [23,24,25]. Further development of the devices was based on improving the ideas and solutions of previously developed devices. The subject of bioaerosol detection and its development prospects are still very up-to-date and are the subject of review publications [26,27,28]. A number of research groups have constructed detector prototypes to measure the LIF of individual aerosol particles in one or two broadband wavelength channels (266, 355, 375 nm) during the last decades [29,30,31]. In more advanced prototypes, to excite fluorescence, two wavelengths (266, 355 nm) have been used [32,33] or the entire spectrum measured [34]. In the following years, further analyzers were built using the LIF method for the detection of biological analyzers [35,36]. So far, the most technologically advanced instrument is the LIF instrument, which uses fluorescence lifetime measurements in four spectral ranges using two excitation wavelengths (293 and 337 nm) [37]. Fluorescence lidars for BW detection are also technologically advanced [38].
Now, UV-LIF instrumentation has also been commercialized for use in civil research in fields related to atmospheric science and health care. The instruments are used in the study of bioaerosols in the hospital environment [39,40], in school classrooms [41], offices [42], or from humans [43]. They allow for study of the concentration and properties of bioaerosols from long-distance transport [44], in tropical aerosols [45,46], urban aerosols [47,48], or from composting plants [49]. Bioaerosols can also influence cloud formation, precipitation, and climate change [50,51,52,53].
The article presents the history of the development of devices based on LIF, their construction, and principle of operation. In addition to classical instruments using real-time single-particle fluorescence measurements at one or two wavelength excitation, more sophisticated techniques combining LIF with molecular size and shape measurements were demonstrated. An important progress is the construction of instruments that use fluorescence measurements over time.
The general characteristics of biological warfare agents are presented as are the fluorescence characteristics of biological agents in the form of emission–excitation maps, methods, and the results of time-resolved fluorescence studies. Examples of our own solutions for bioanalyzers using the LIF method were also demonstrated.

2. Characteristics of Biological Warfare Agents

It is customary to also include weapons based on toxins of biological origin (e.g., botulinum, ricin) as biological weapons (BWs). Biological warfare agents are classified into three main groups by the U.S. Department of Defense: bacterial, viral, and toxin, and there are no known biological agents that are molecular vapors. BWs can be used during an attack on individuals, military units, and civilians. The target of a biological attack can also be homogeneous plant monocultures or livestock farms. The specificity of BW is to cause infectious diseases of people, animals, and plants on a massive scale.
Biological weapons are extremely dangerous, the effects of which are visible only after a long period of time. Anthrax sticks can lie in the ground for up to 40 years, and 2 g of a biological agent can kill 0.5 million people.
Infection with BWs takes place mainly through the respiratory and digestive tracts and open wounds. The majority of BWs are most effective as a finely atomized aerosol that can penetrate deep into the lungs. Penetration into the alveoli is easy when the aerosol particles are 1–5 μm in diameter. BWs come in the form of a dry powder or a liquid suspension. Aerosol droplets can contain from 1 to 50 organisms, and their concentration is in the order of 102 to 106 particles/m3.
The diffusion coefficient of microorganisms in air is many orders of magnitude lower than for gaseous molecules. This is important for the spread of diseases if there is negligible turbulent mixing, and the particle cloud takes a long time to disperse. When particles are transported through the air and encounter solid objects, they are deposited due to their greater inertia. This is the primary mechanism by which plant pollen reaches objects. The occurrence of microorganisms (e.g., Bacillus, Micrococcus, Arthrobacter, Staphylococcus, and Brachybacterium) has been found at an altitude of up to 12 km [54]. The influence of atmospheric conditions on the movement of microorganisms is presented in [55,56,57]. Microbes are spread by wind over long distances. A significant impact of the fog carrying microorganisms characteristic of the marine environment inland, over a distance of 50 km, was also observed [58]. Studies on the generic composition of microorganisms at different altitudes have shown that at an altitude of 10 m above the ground, there are different species of microorganisms than at an altitude of 800 m, where the air is already rarefied [59].
All microorganisms are generated by several types of destructive processes. It can be, for example, air movement entraining individual solid particles or water suspensions and separating them from the ground.
An example of the process of creating an infected aerosol from a liquid suspension is sneezing, which is triggered by a sharp contraction of the muscles and leads to the expulsion of air at high speed through the nose. The second example is the dispersion of pollen and spores. Plants have developed complex strategies using grain geometry, grain coverings, and pollen sac linings to overcome the effect of van der Waals forces. Therefore, pollen and spores are effectively broken down, even in light wind.
Of the thousands of pathogenic bacteria and toxins that exist in nature, only about 160 have been identified as harmful to humans, and only 30 are considered likely BWs. Table 1 shows examples of the diseases and their pathogens by potential biological agents.
Particle sizes are the basis for distinguishing different groups of particles (Figure 1).
Man has frequently used biological agents in the fight against the enemy [60,61,62]. One of the first recorded uses of biological warfare occurred in 1347, when Mongol forces are reported to have catapulted plague-infested bodies over the walls into the Black Sea port of Caffa. Infectious diseases brought by the Europeans contributed to the destruction of the Inca and Mayan civilizations.
In 1763, British troops besieged at Fort Pitt during Pontiac’s Rebellion passed blankets infected with the smallpox virus to the Indians, causing a devastating epidemic among their ranks. During World War I (1914–1918), Germany initiated a clandestine program to infect horses and cattle owned by Allied armies on both the Western and Eastern fronts. During World War II, the Japanese used biological warfare agents against the Chinese. Biological weapons have also been used in a few instances in the past by terrorist organizations. In 2001, anthrax-laden letters were sent to many politicians and other prominent individuals in the United States where the letters killed five people and sent 22 to hospital. This event caused many billions of dollars in cleanup, decontamination, and investigation costs.

3. Materials and Methods

3.1. Materials

The reference materials used throughout this study (Table 2) were prepared as suspensions in water at the Military Institute of Hygiene and Epidemiology (MIHE) in Warsaw [63]. The strains of vegetative bacteria were purchased from the American Type Culture Collection (ATCC.) The samples were prepared from reference stocks and grown in the appropriate liquid media for 18 h at 37 °C in accordance with the procedures consistent with the requirements of the ATCC. Endospores of five Bacillus species were grown, purified, and stored as described by Lewandowski et al. [64]. Candida albicans was grown in liquid yeast-extract-peptone-dextrose growth medium (YPD), and strains of filamentous fungi were cultured in malt extract agar medium (MEA) [65]. The water suspension of the bacteria, endospores, fungi, and pollens were placed in 1 cm thick quartz cuvettes (OD600 = 0.1–0.2) and their spectra and fluorescence decay times were measured. During the measurements, the suspensions were stirred using a magnetic stirrer. The front-surface fluorescence measurement method was used to avoid the internal filter effect caused by the absorption of the emitted radiation.

3.2. Measuring Apparatus

(a)
Fluorimeter FS 900 (Edinburgh Instr., Livingston, Scotland) for measuring the excitation–emission matrices (EX-EM);
(b)
Ultraviolet aerodynamic particle sizer (UVAPS, model 3314, TSI Inc., St. Paul, MN, USA) for the real-time measurement of single particle’s aerodynamic diameter and fluorescence intensity;
(c)
ASPECT (Bristol Industrial & Research—BIRAL, Bristol, UK);
(d)
VeroTectTM (Bristol Industrial & Research—BIRAL, Bristol, UK);
(e)
EasyLife System (Photon Technology International, Birmingham, NJ, USA) with excitation of 280 and 340 nm for the fluorescence measurements of the suspensions and solid particles. Fluorescence excitation was realized using nanosecond impulse LEDs (Edinburgh Instruments, Livingston, Scotland);
(f)
Compressed-air nebulizer Monsun2 MP2 (Medbryt, Warsaw, Poland);
(g)
Small scale powder dispenser (TSI Inc., Shoreview, MN, USA);
(h)
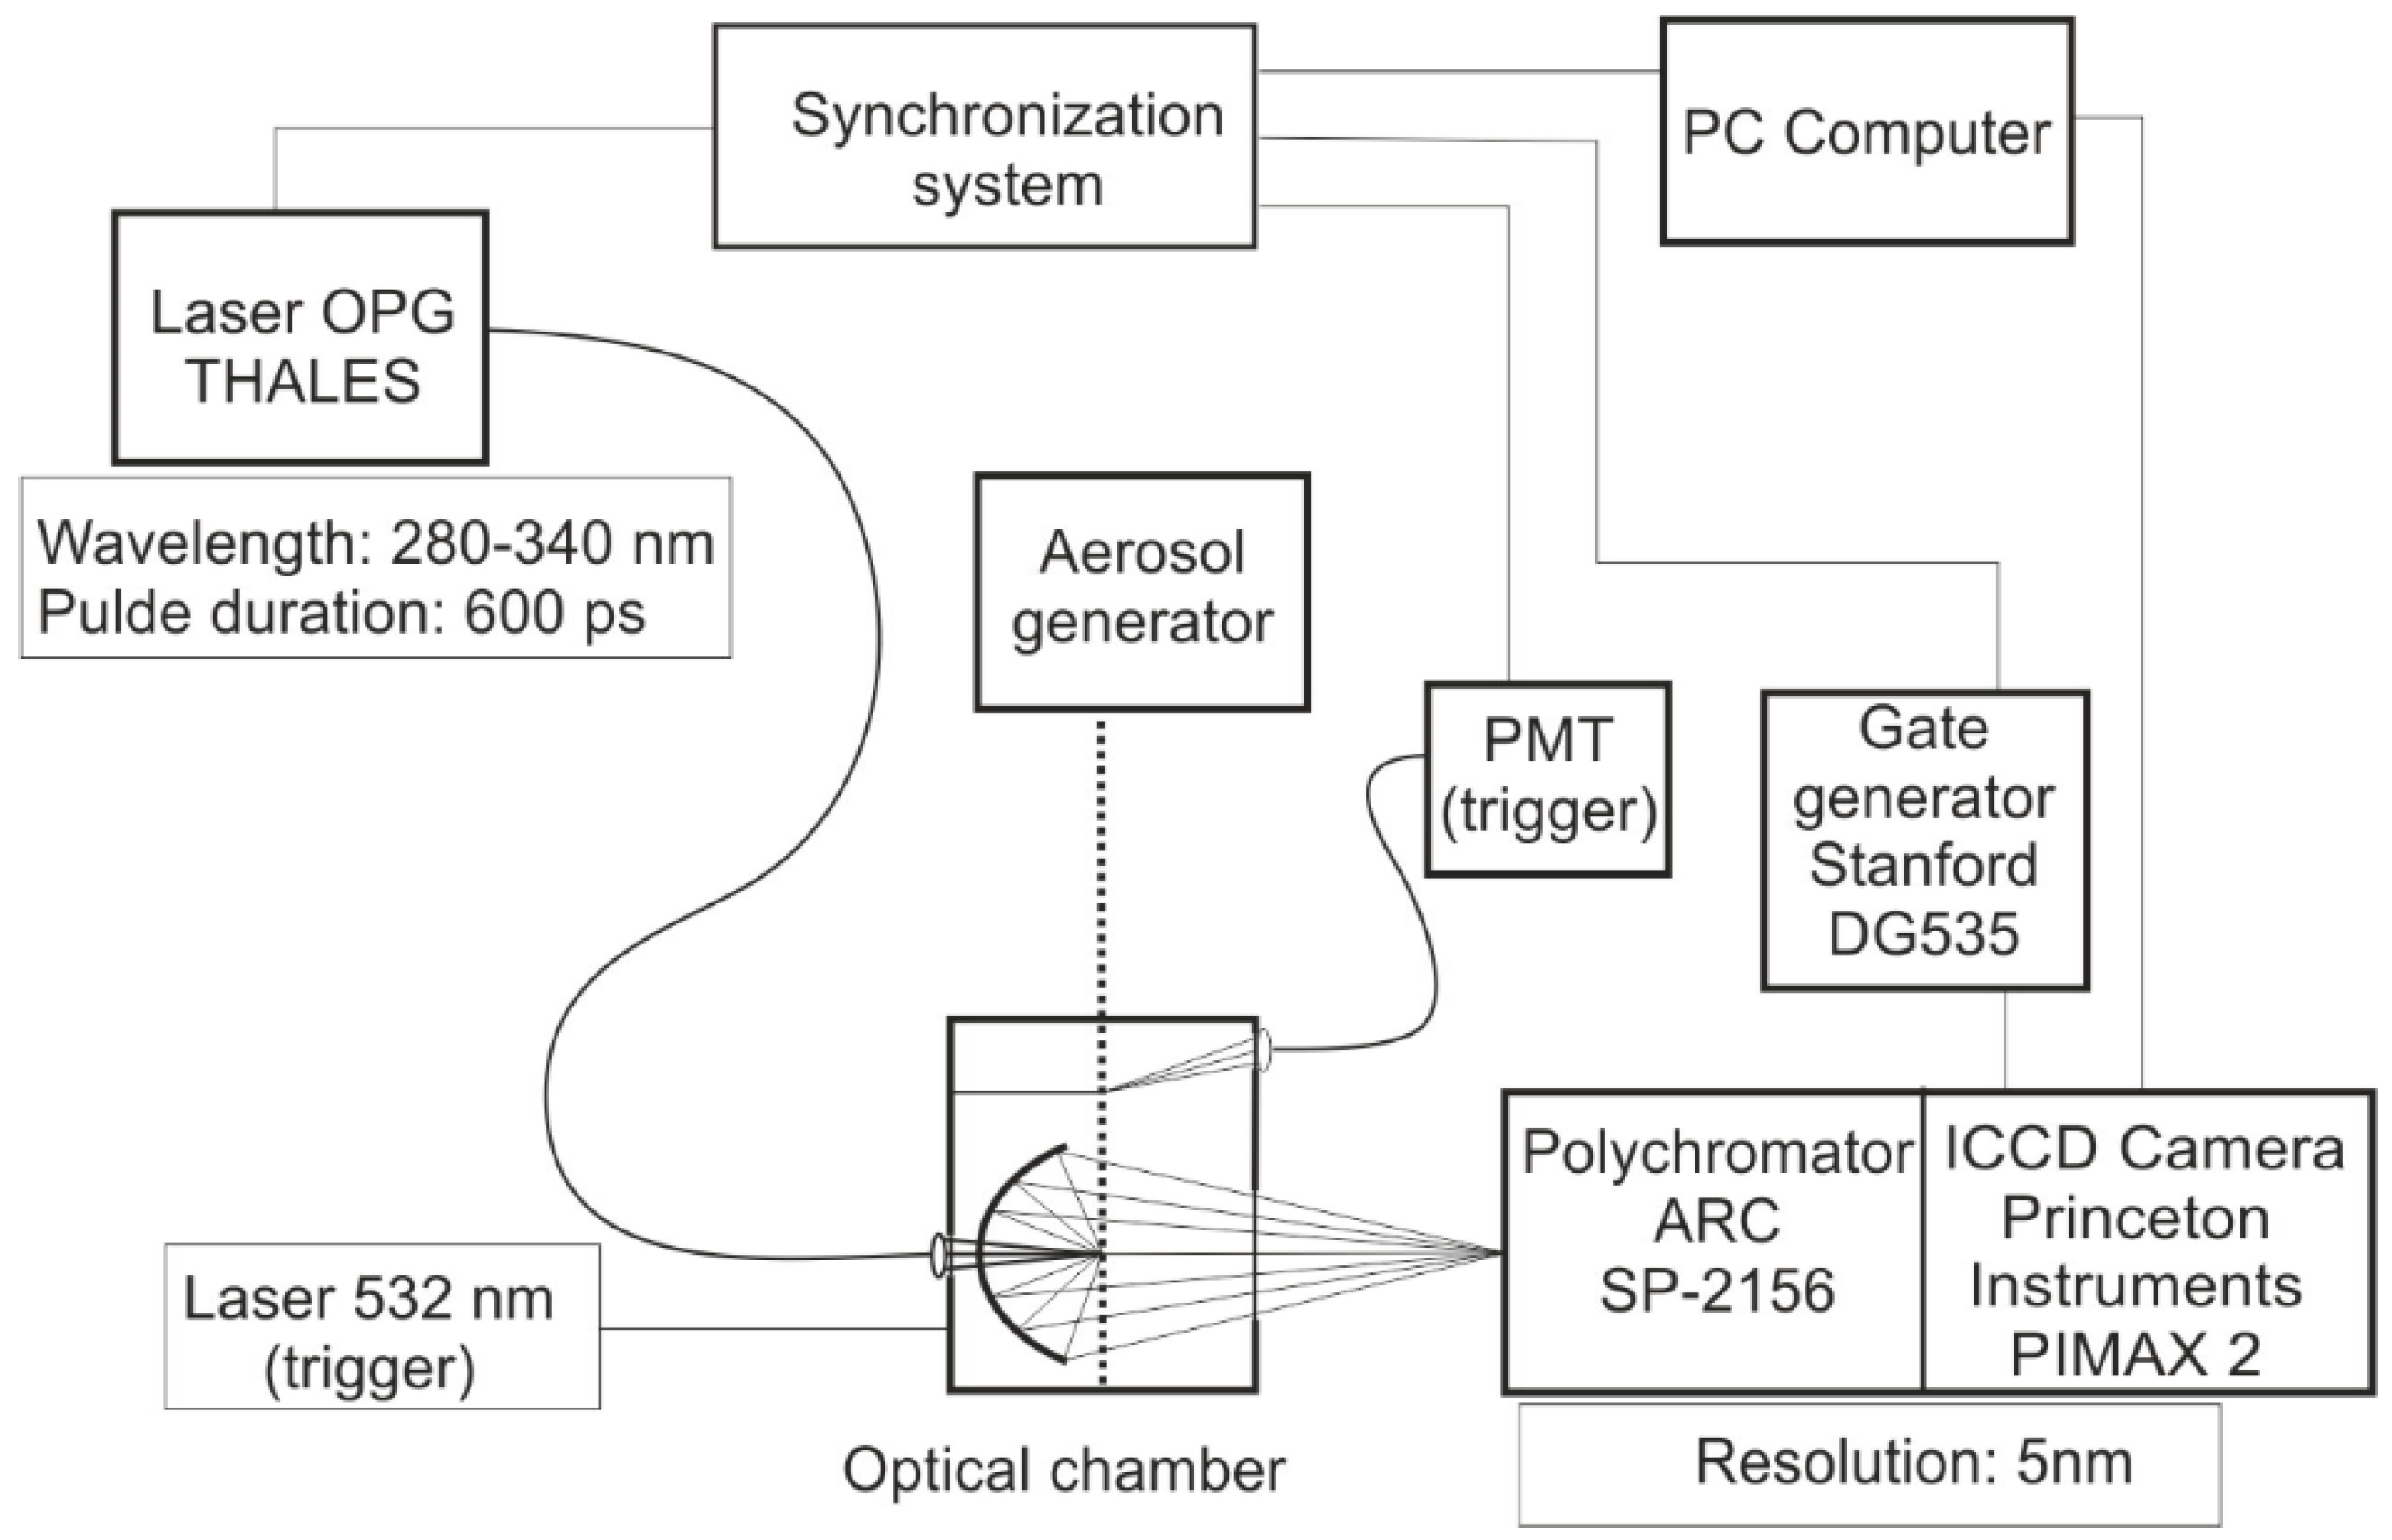
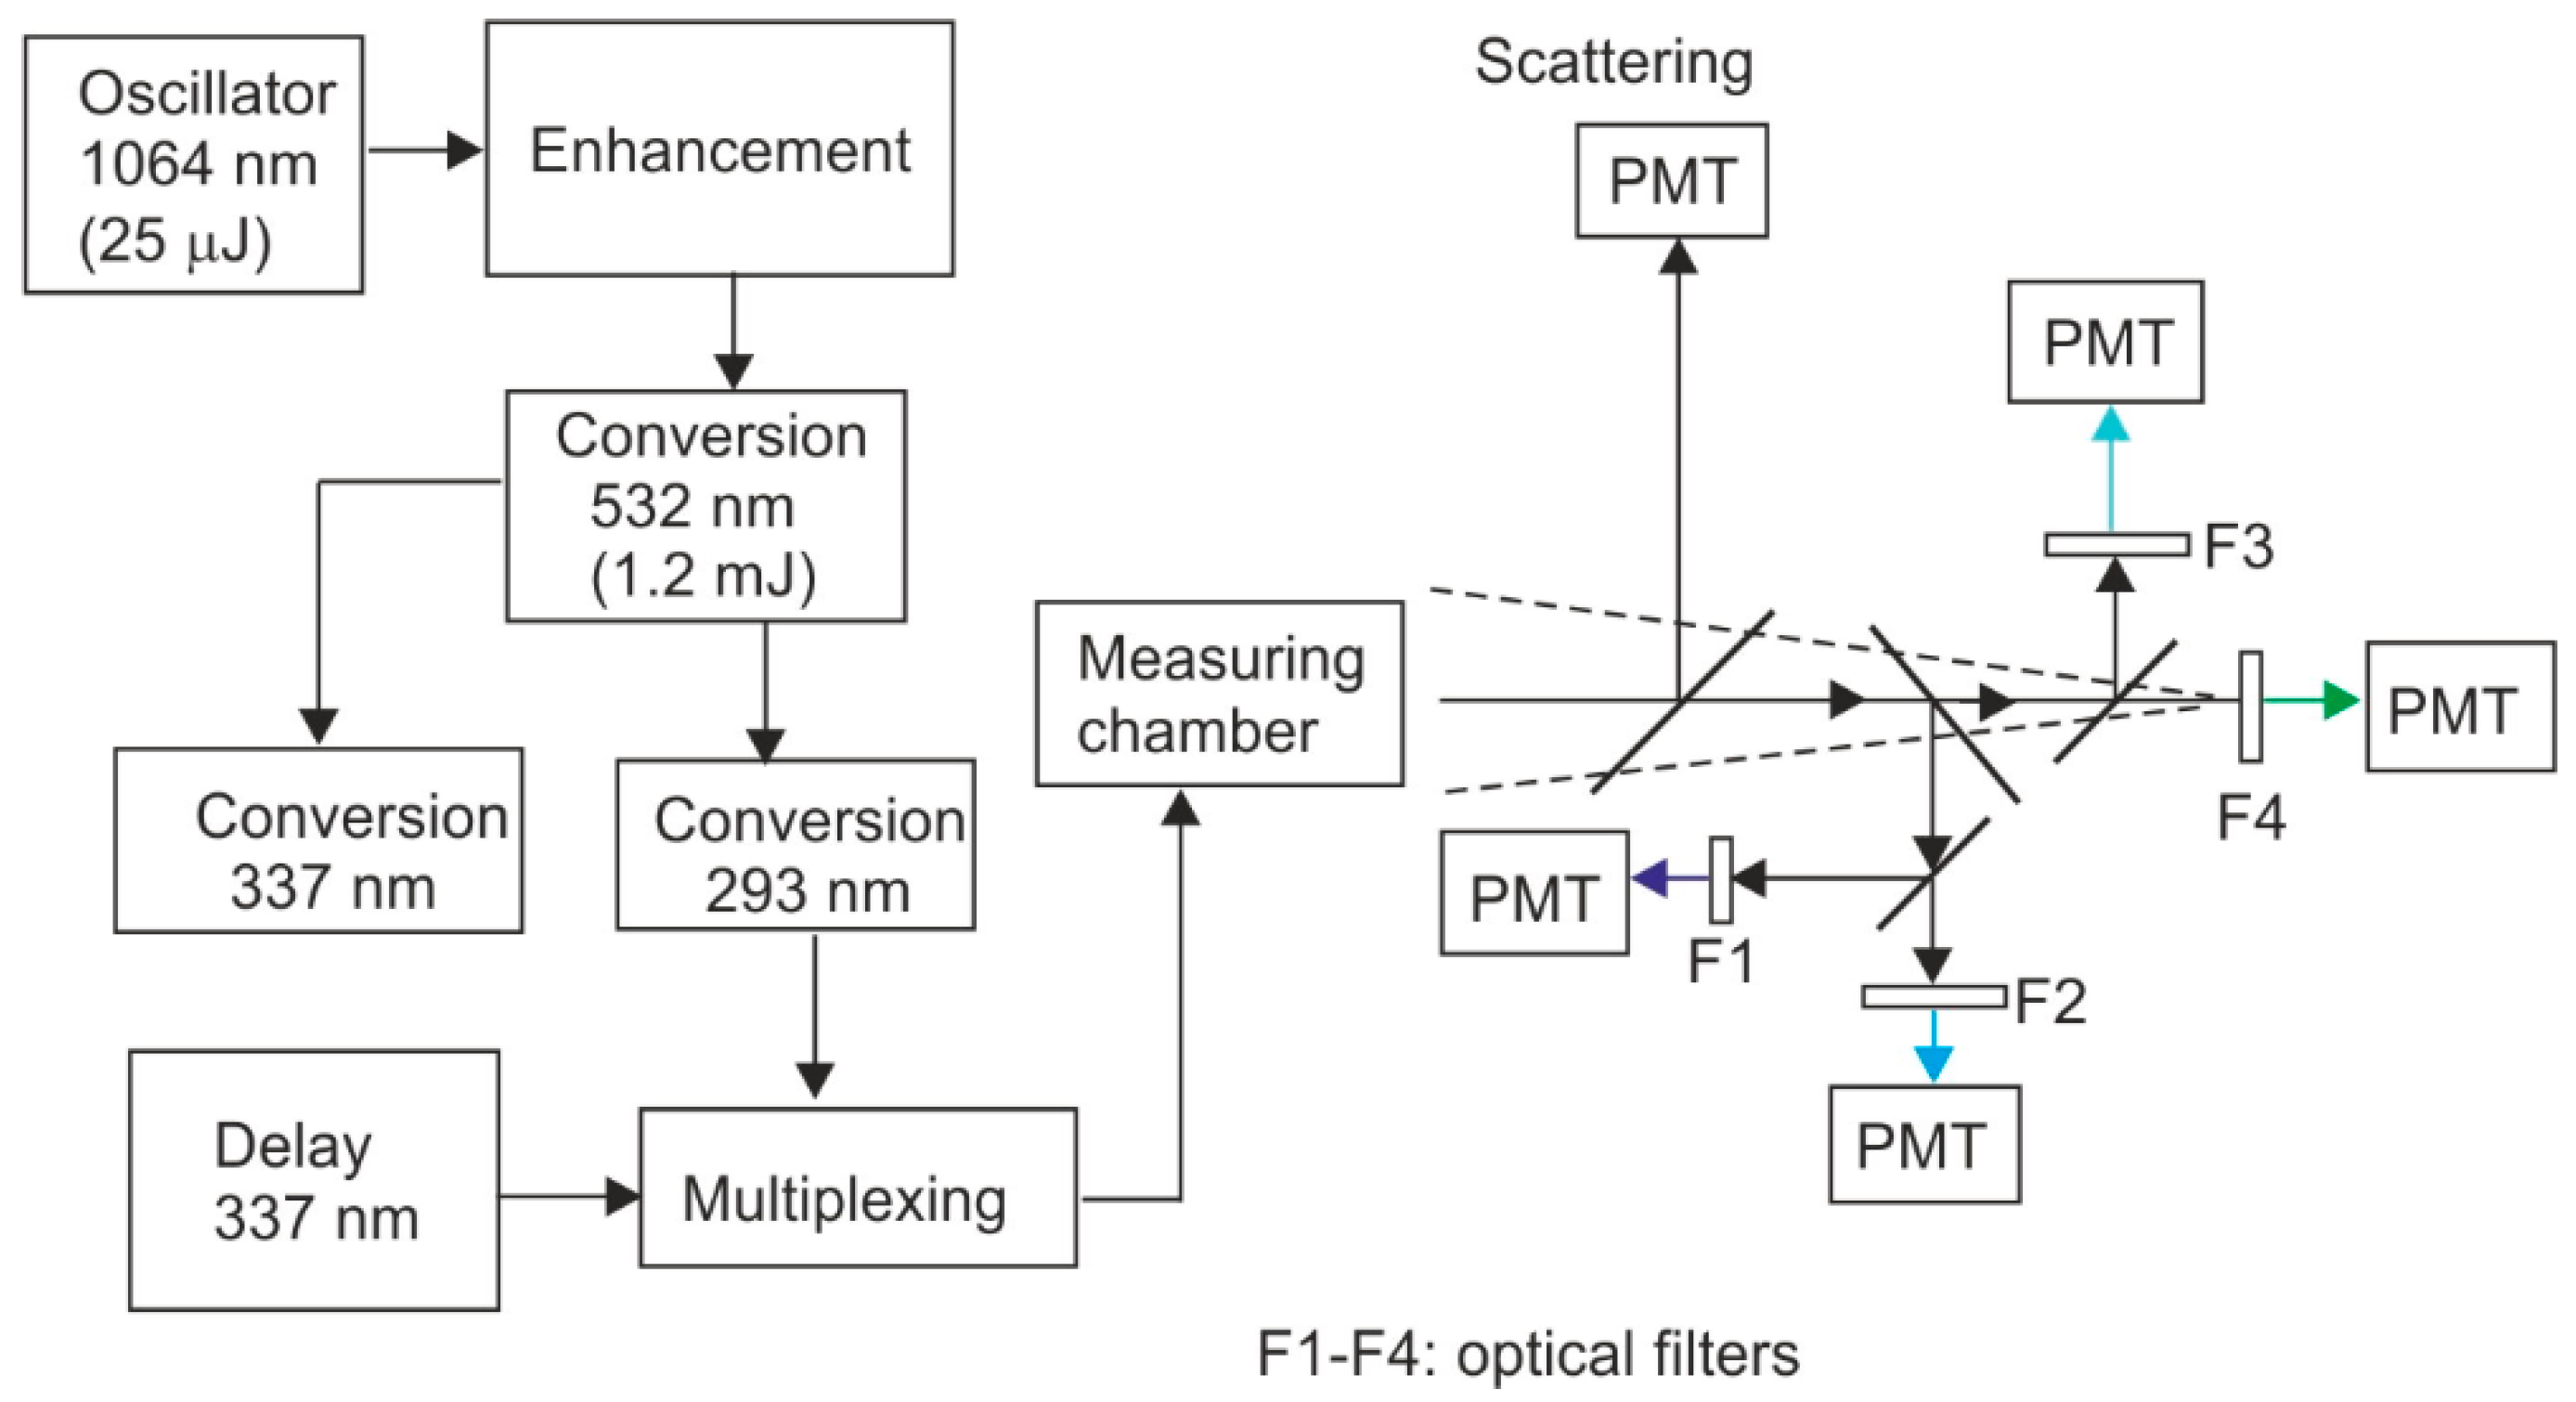
To measure the fluorescence spectra of single particles of aerosols, our own system was used, as shown in Figure 2.
The Thales laser is described in Section 5 in this article. Principal component analysis (PCA) was performed using the SIMCA-P program from Umetrics (Ulmea, Sweden).

4. Methods and Results of Measurements of Biological Materials

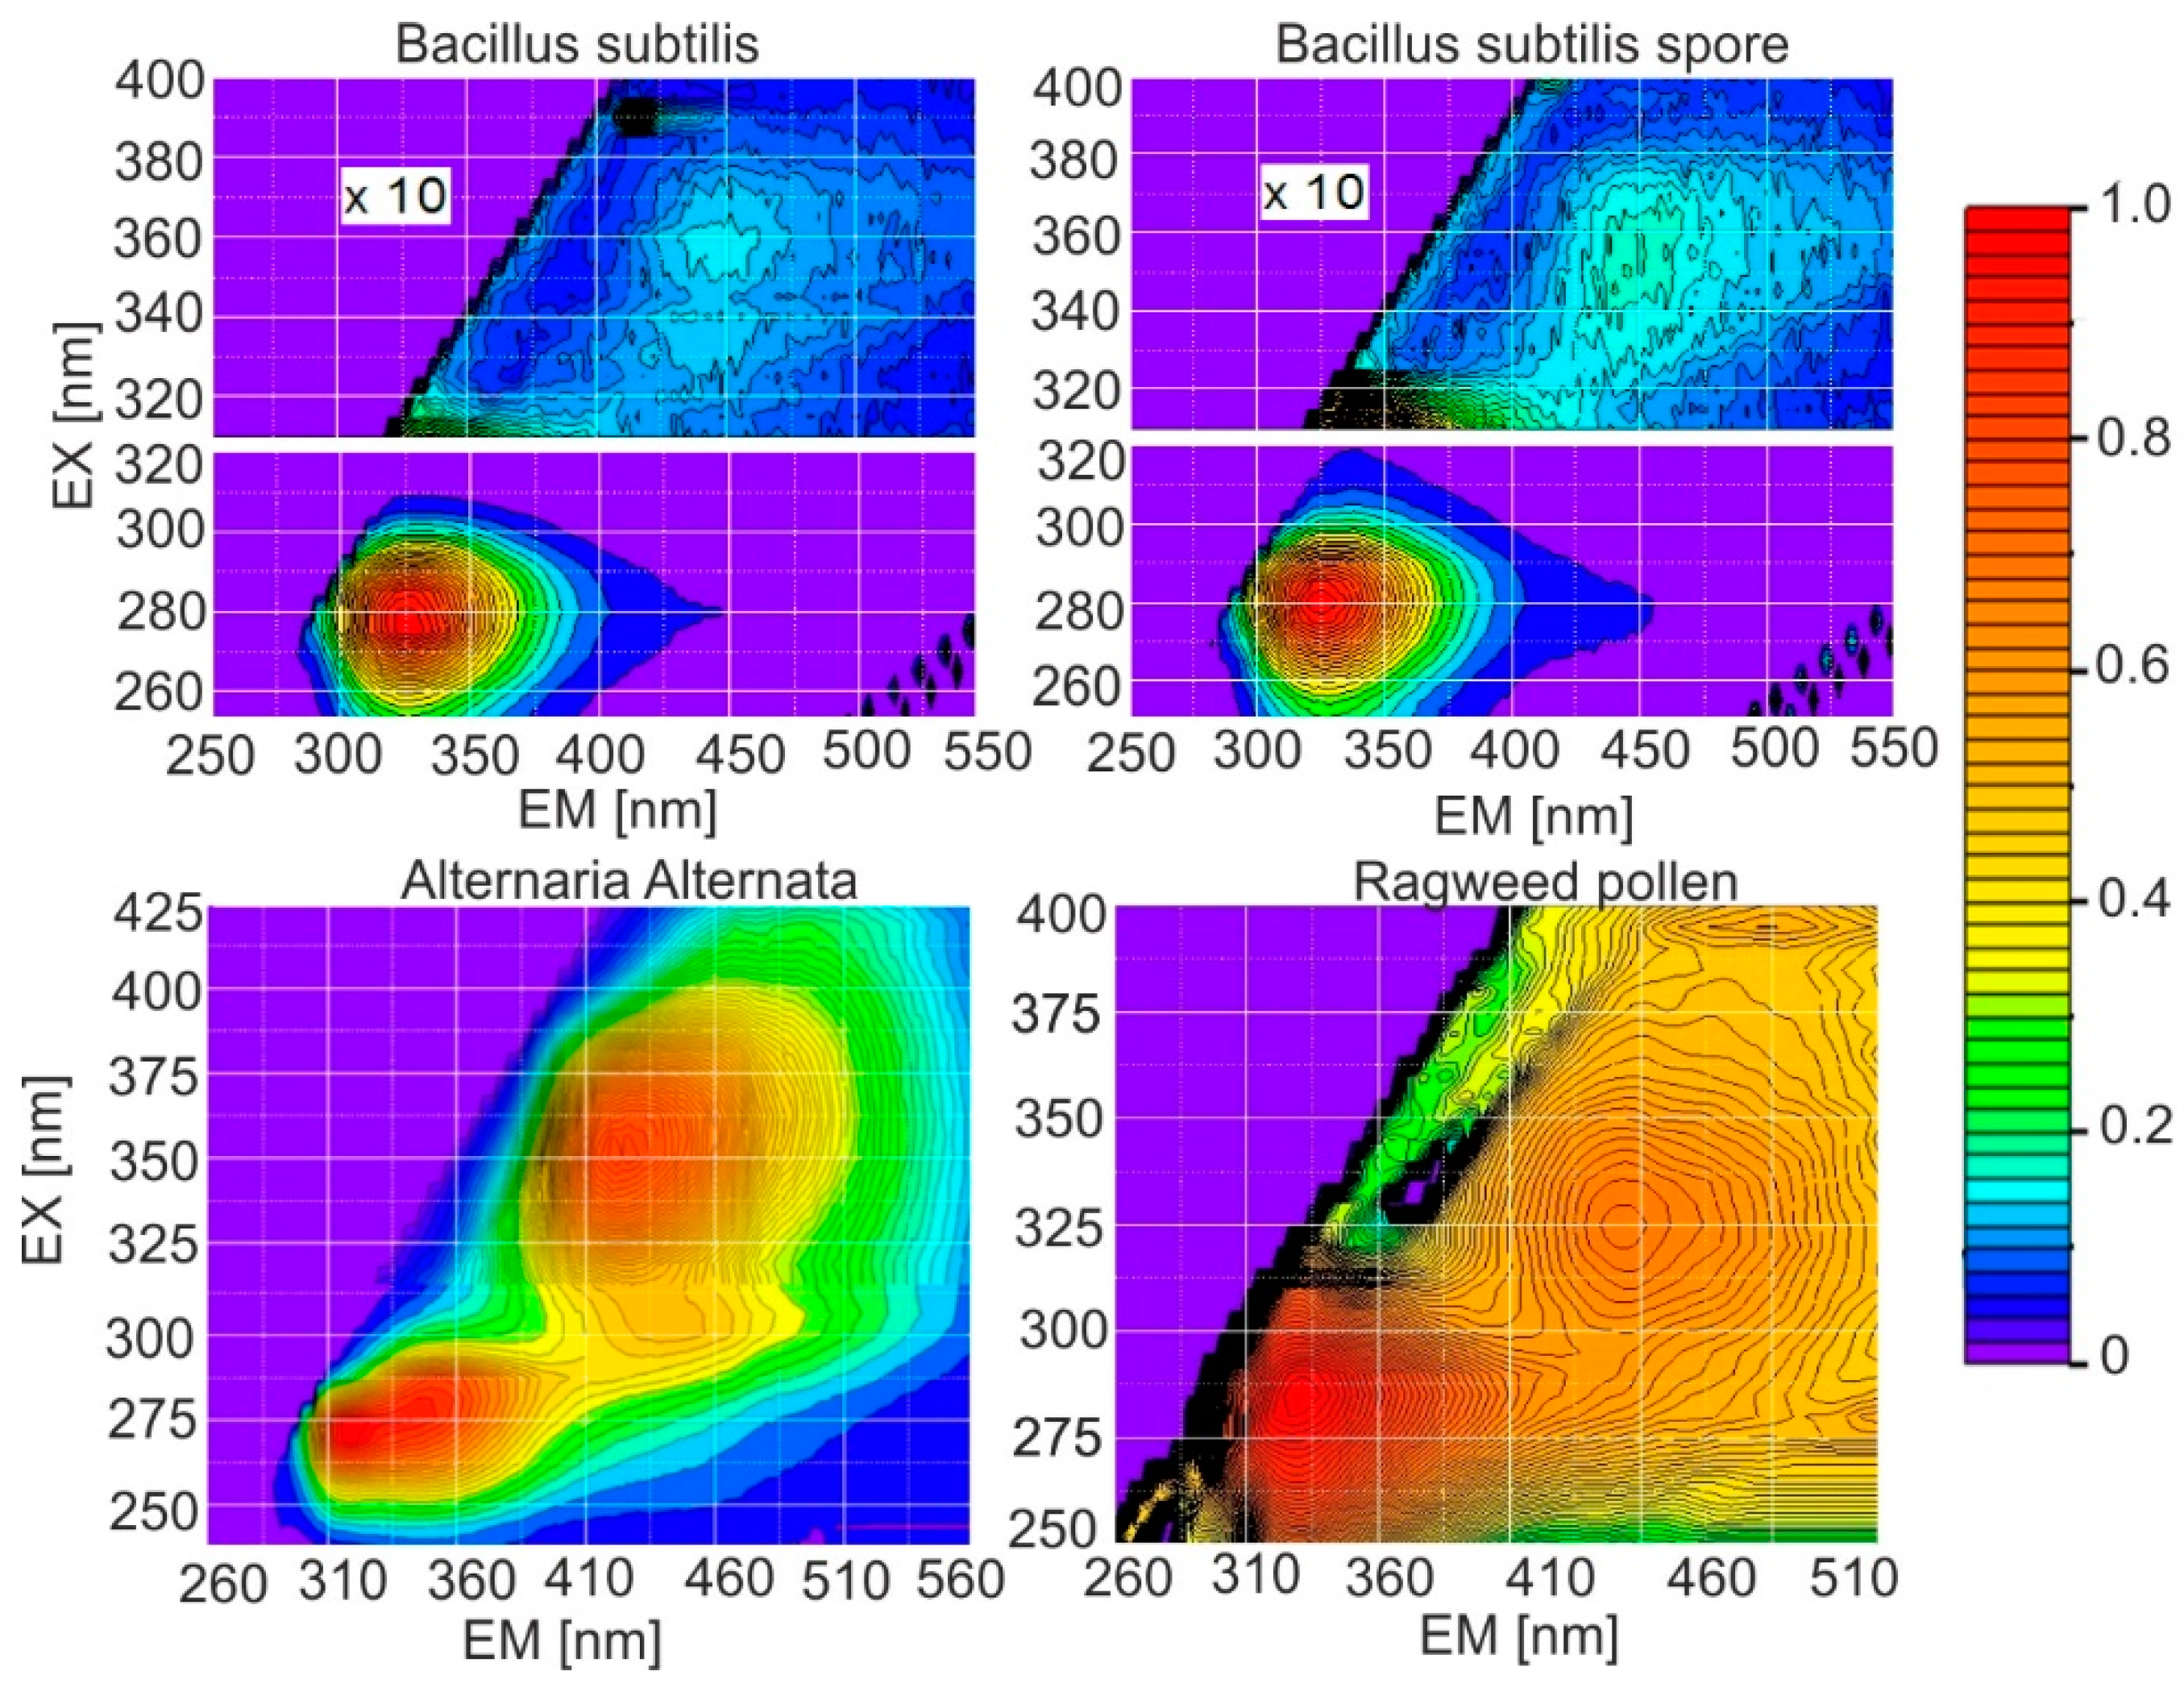
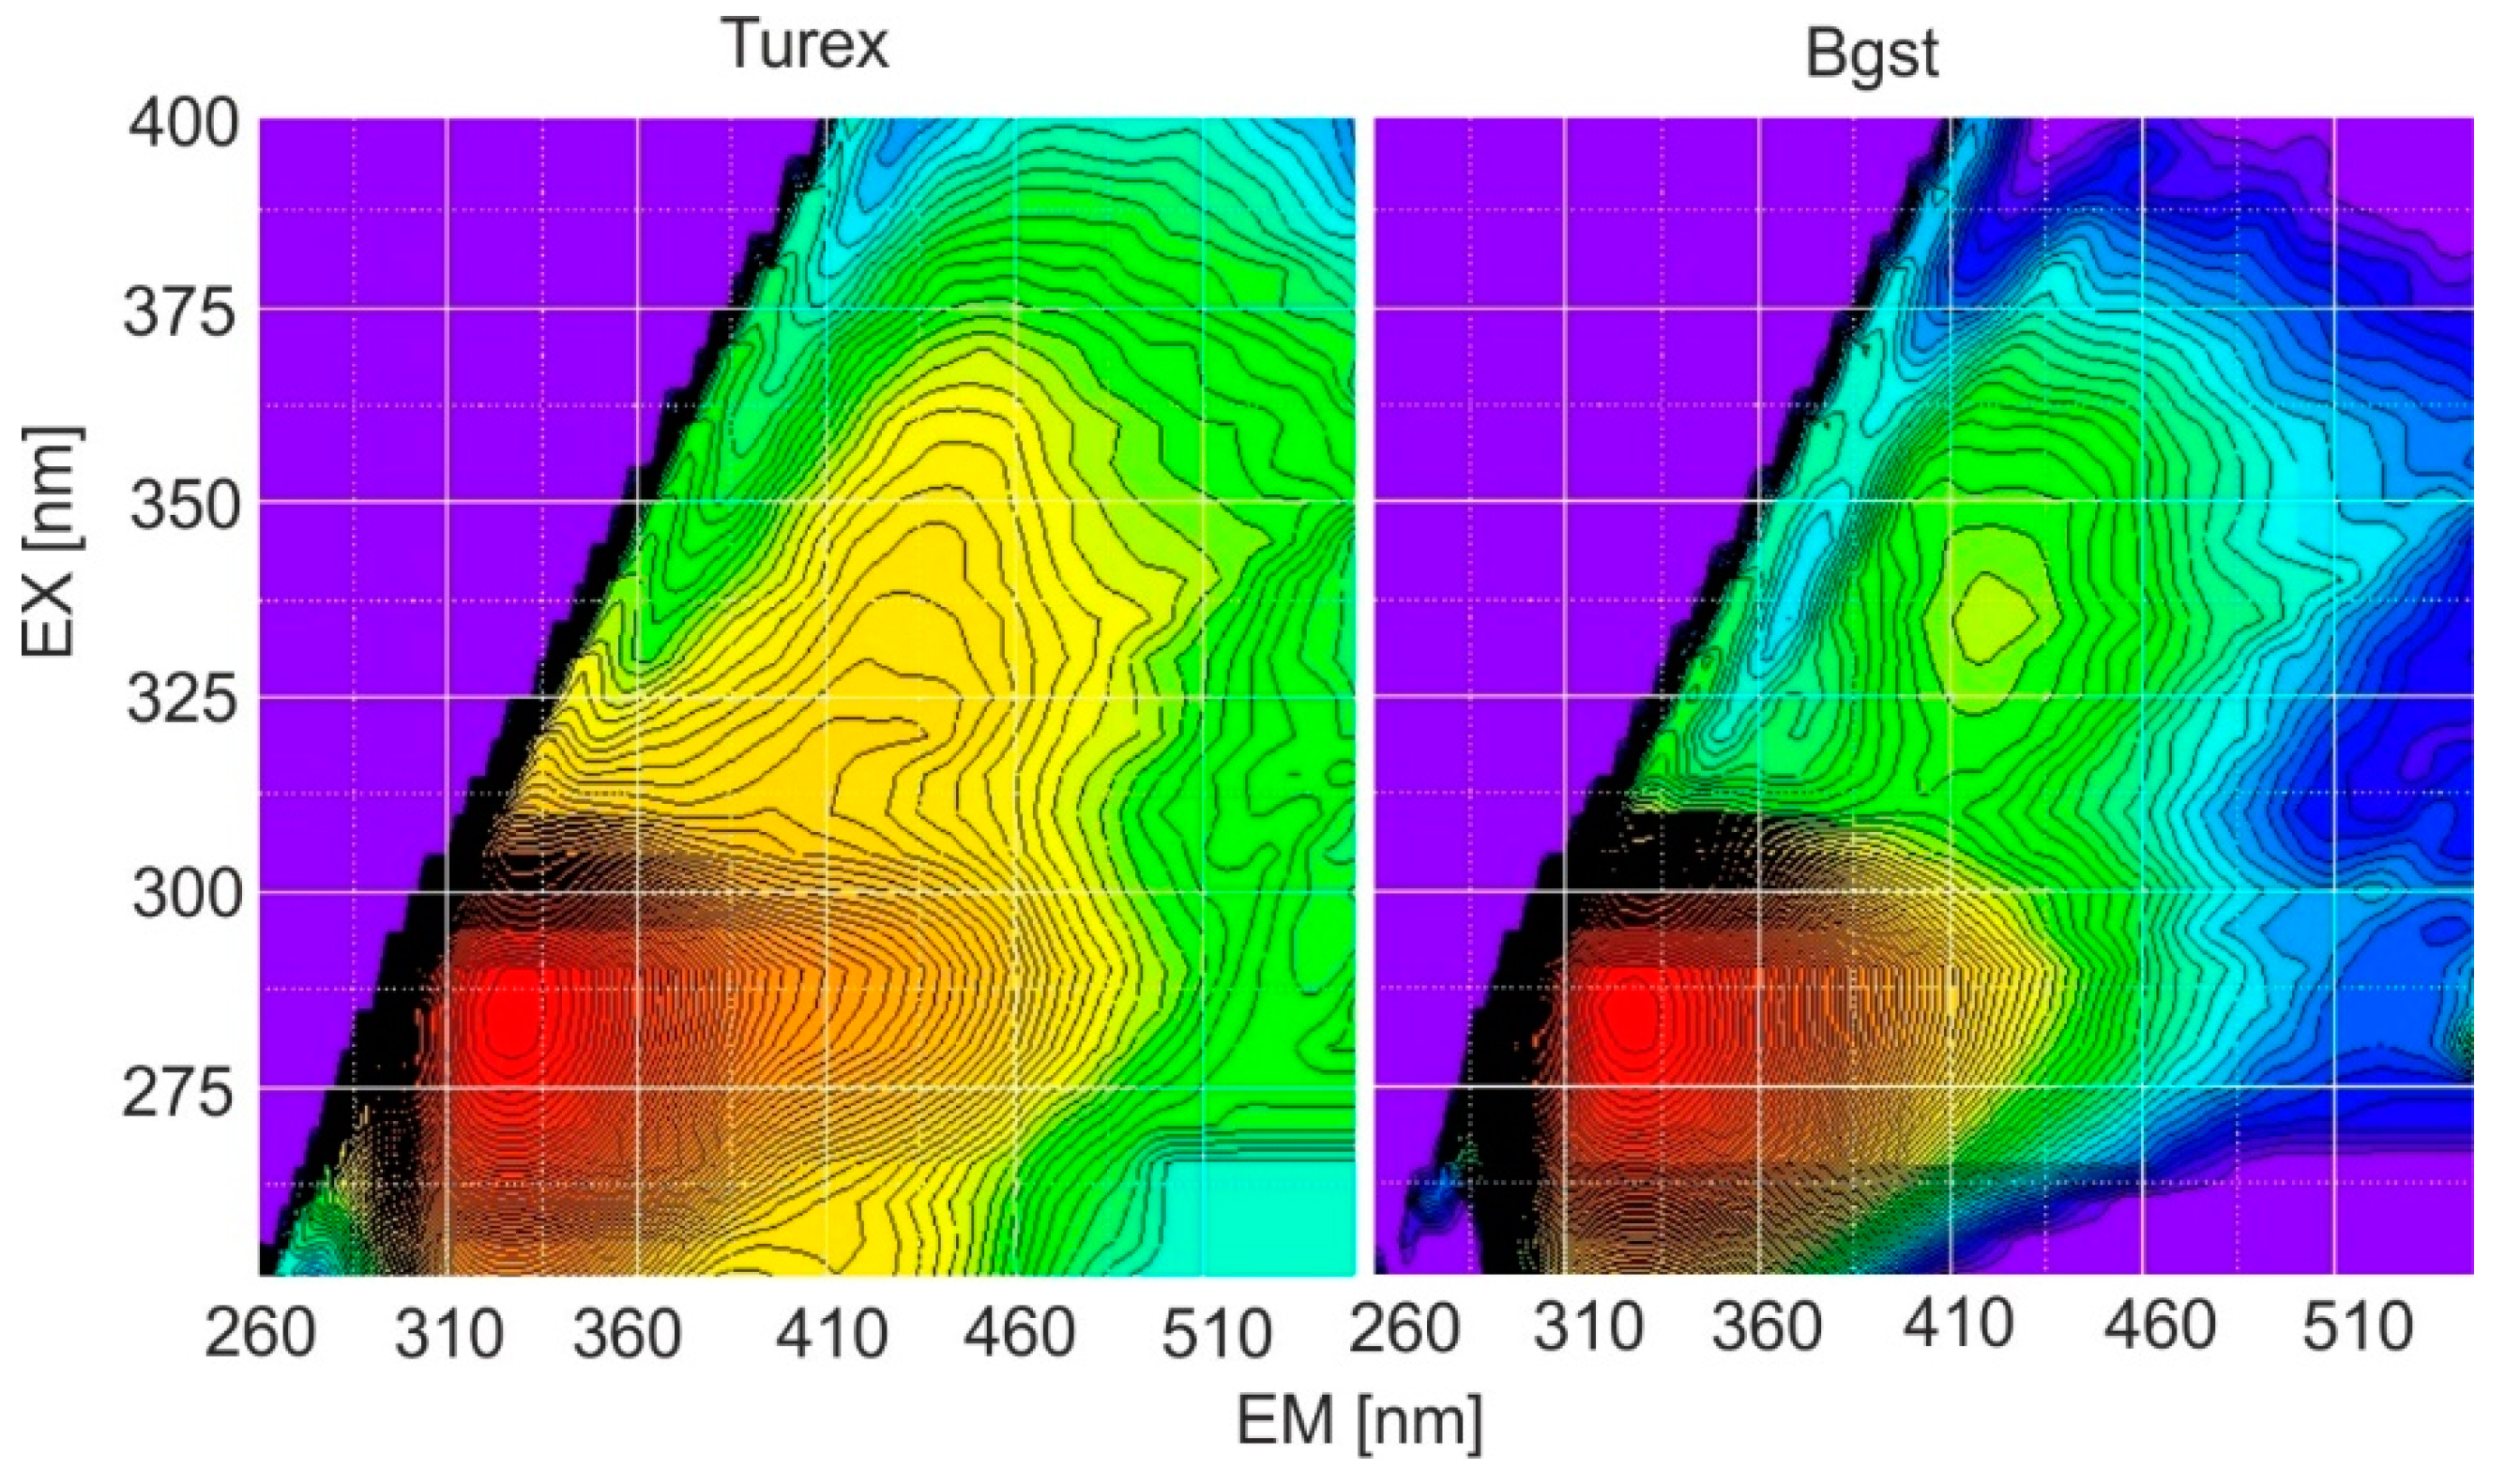
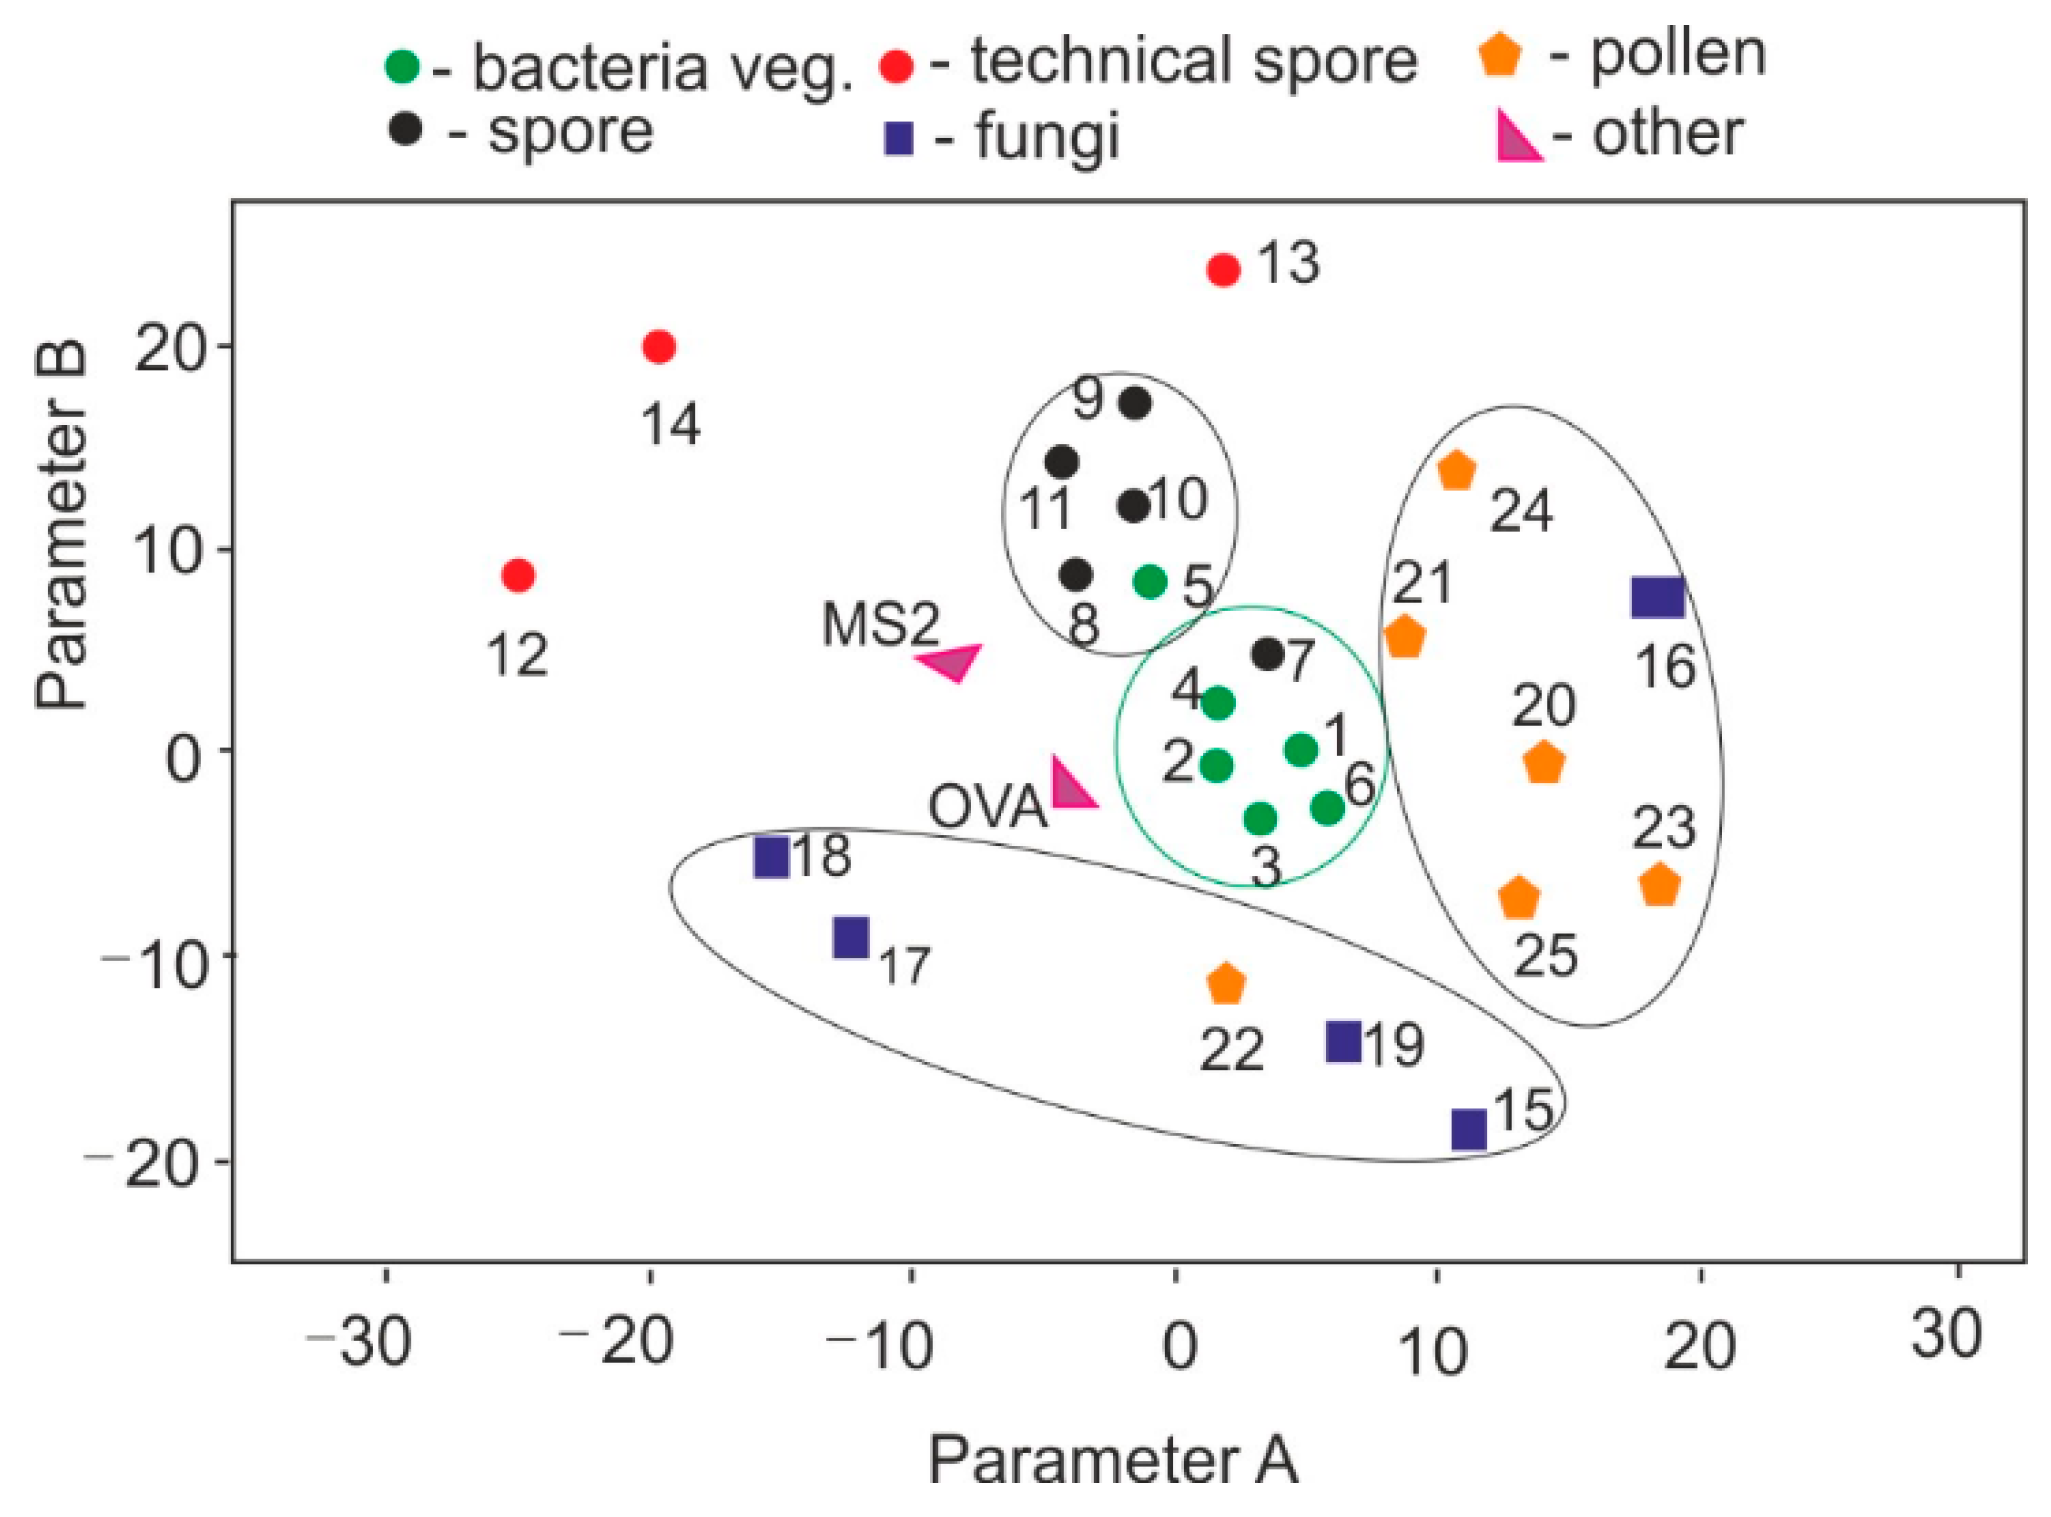
4.1. Fluorescence Emission–Excitation Matrices (EM-EX)

In the case of the presence of many fluorophores, as occurs in microorganisms, the best method of full spectral characterization is emission–excitation matrices. This is a true spectral fingerprint. The first EM-EX measurements of the selected biological materials were described in [65], and now the current database contains about 80 different biological substances and their interfering substances. In the natural environment, bacteria may appear in the same airborne particle with different interferents such as fungi, pollens, cellulose, lignin, humic and fulvic acids, chlorophyll, and dust. Example matrices of the selected bacteria and their interferents are shown in Figure 3.
Spore forms, compared to vegetative bacteria, have much more intense fluorescence in the 350–370 nm region (II region). EX-EM matrices enable the process of sporulation or the death of live bacteria. In practice, the biological warfare material will be a mixture of spores, live and dead cells, admixtures of stabilizers, and culture media. Technical preparations used to test various BW analyzers have even stronger fluorescence bands in the second region (Figure 4).
Many research groups have been involved in the analysis of endogenous biological fluorophores [66,67,68,69,70]. The source of endogenous fluorescence in cells and biological tissues are aromatic amino acids used to build proteins and coenzymes. Of the 20 amino acids from which proteins are built, only tryptophan (TRP), tyrosine (TYR), and phenylalanine (PHE) fluoresce in the 250–290 nm range (range I). The excitation and emission maxima in solution are about 255 and 282 nm for phenylalanine; 275 and 303 nm for tyrosine, and 280 and 350 nm for tryptophan. The second group of fluorescent endogenous compounds includes the following coenzymes: nicotinamide adenine dinucleotide (NADH), flavin adenine dinucleotide (FAD), and flavin mononucleotide (FMN).
These coenzymes cooperate with oxyreductase and their task is to transfer protons and electrons. NADH exhibits strong fluorescent properties, having absorption and emission maxima at 340 and 460 nm wavelengths, while the oxidized form of the coenzyme NAD+ does not fluoresce. FAD and FMN coenzymes absorb light with a wavelength of about 450 nm, and emission occurs at a wavelength of about 530 nm. Spore forms, compared to vegetative bacteria, have much more intense fluorescence in the 350–370 nm region (II region). EX-EM matrices enable the process of sporulation or the death of live bacteria. In practice, the BW material will be a mixture of spores, live and dead cells, admixtures of stabilizers, and culture media.
Figure 5 shows the analysis of the EM-EX maps of the examined biological materials using the principal component analysis (PCA) method [71]. Practically, the PCA results are interpreted in such a way that the farther apart the points representing the individual substances are, the lower their degree of similarity. The PCA method has been used in the analysis of bioaerosols since 2001 [72]. The collections of pure vegetative bacteria and their spore forms were the most similar. It can be seen that the technical disputes changed the fluorescent properties. Separate groups were pollen and fungi, which have very different characteristics. EX-EM mapping methods and PCA distinguished the individual substances well. This method, however, requires a very long time and a high concentration of test substances and cannot be directly applied to real-time measurement systems.

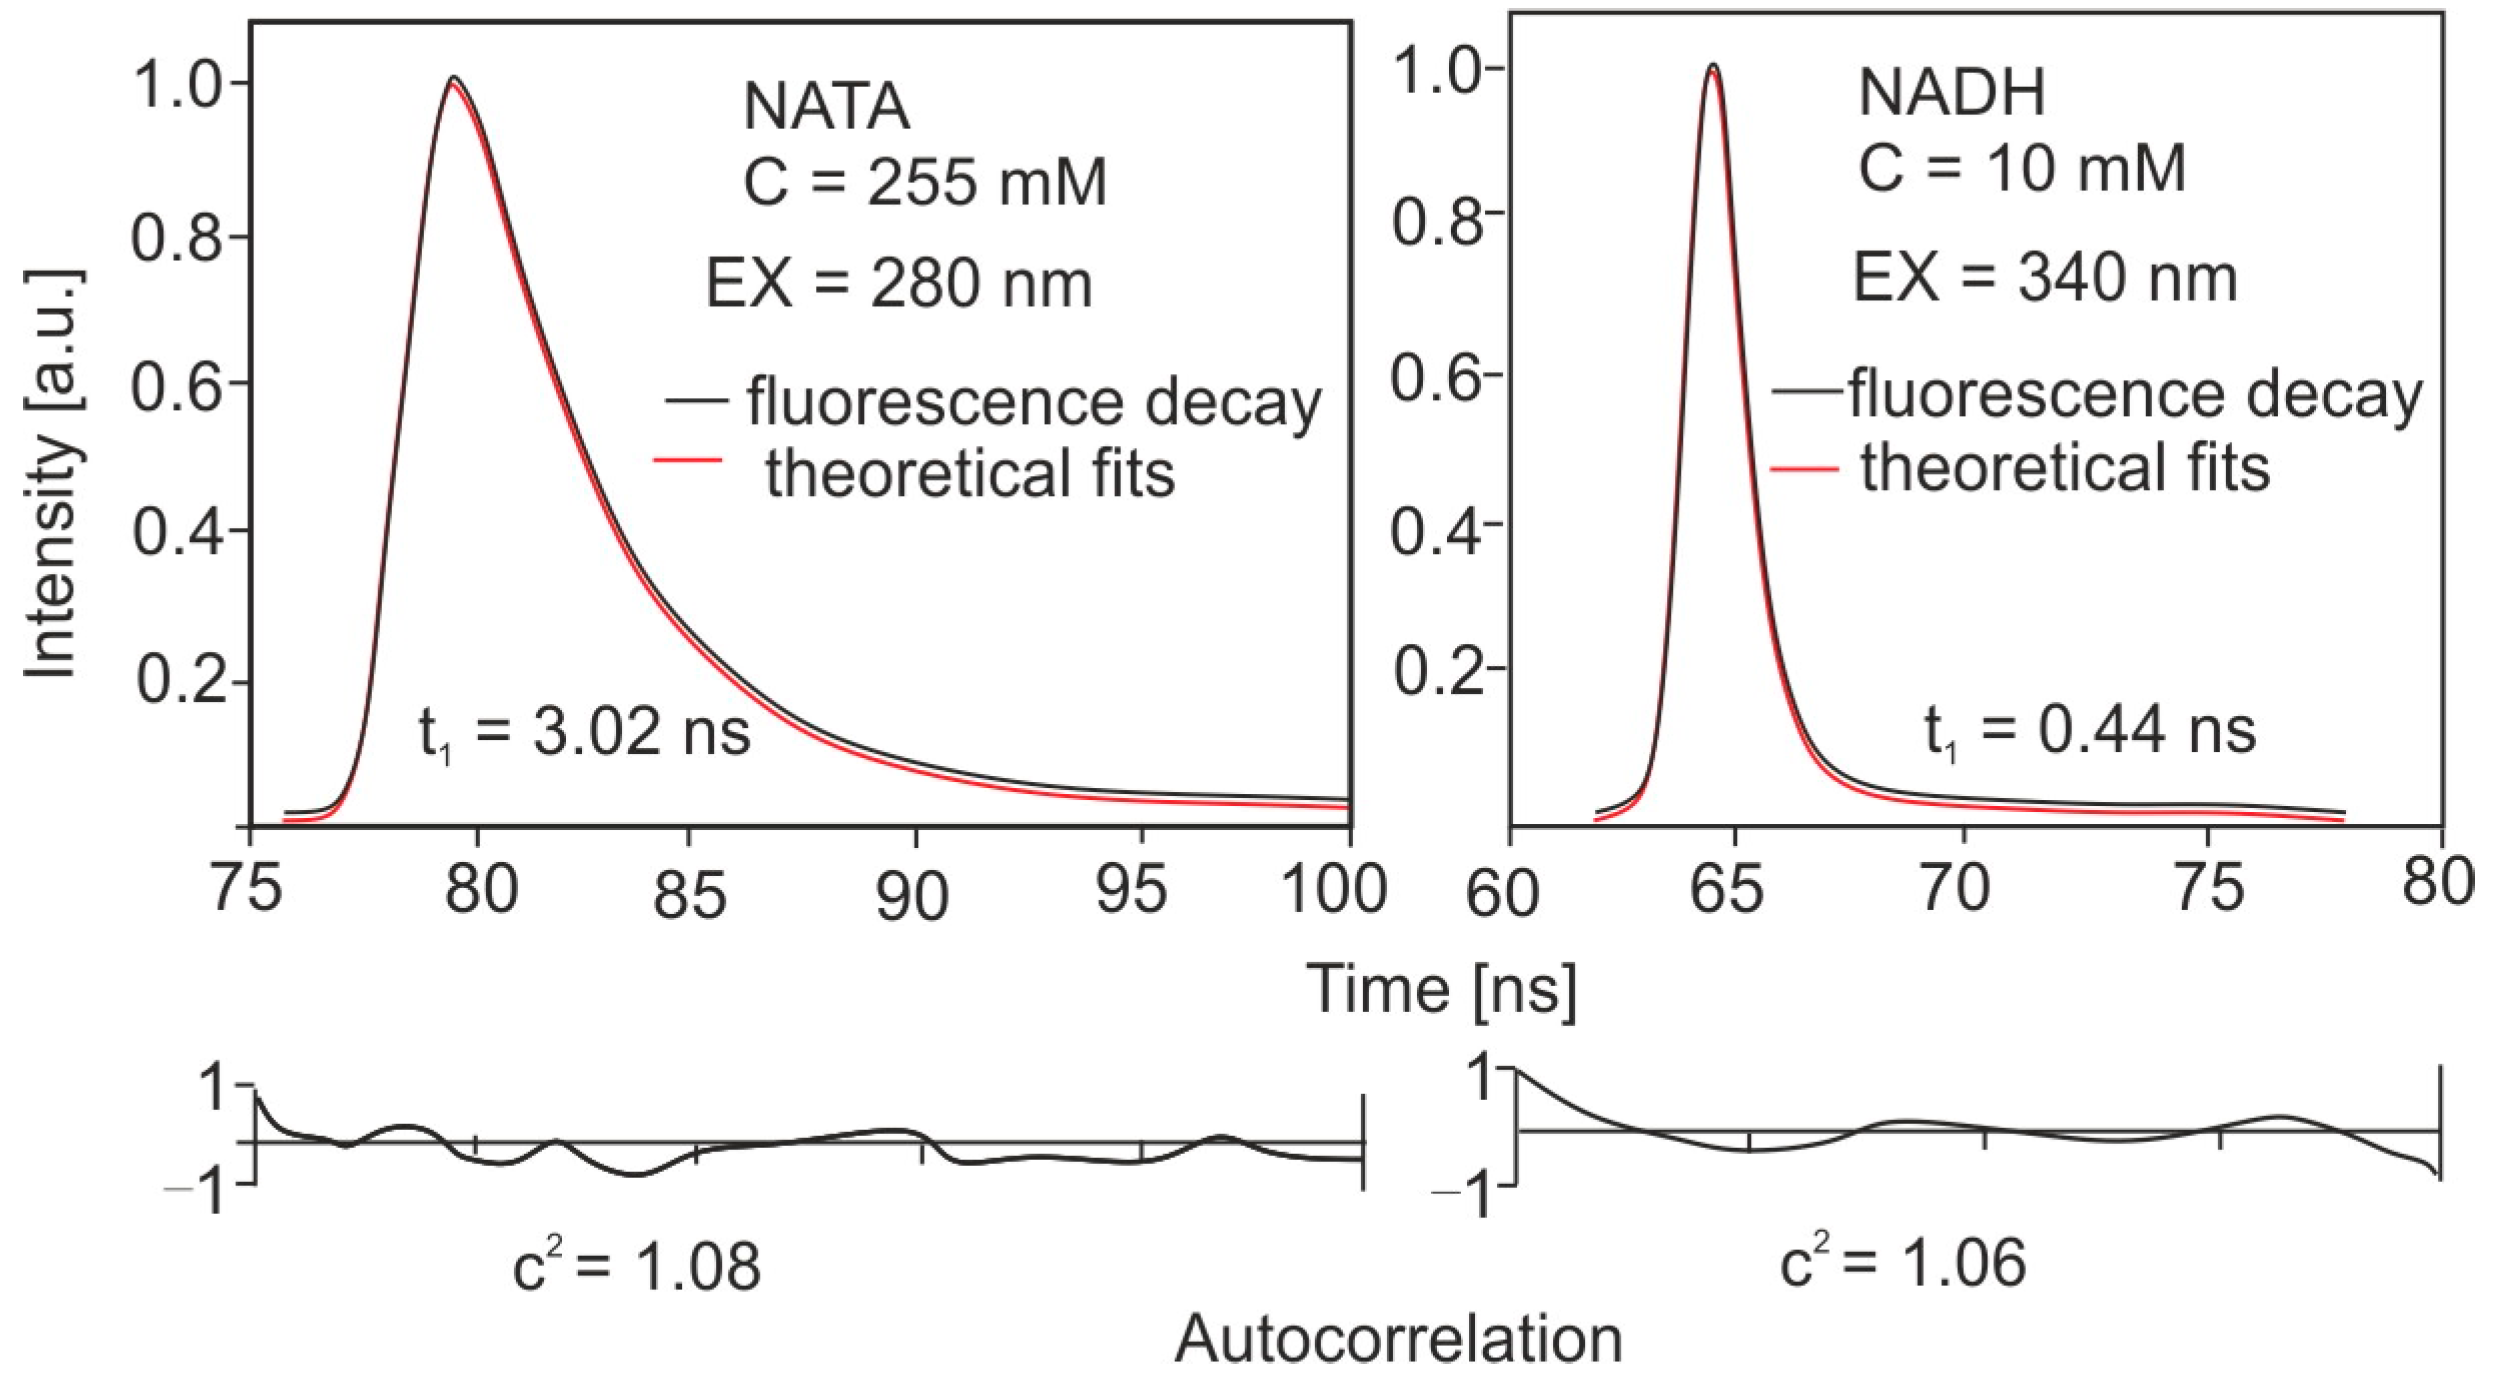
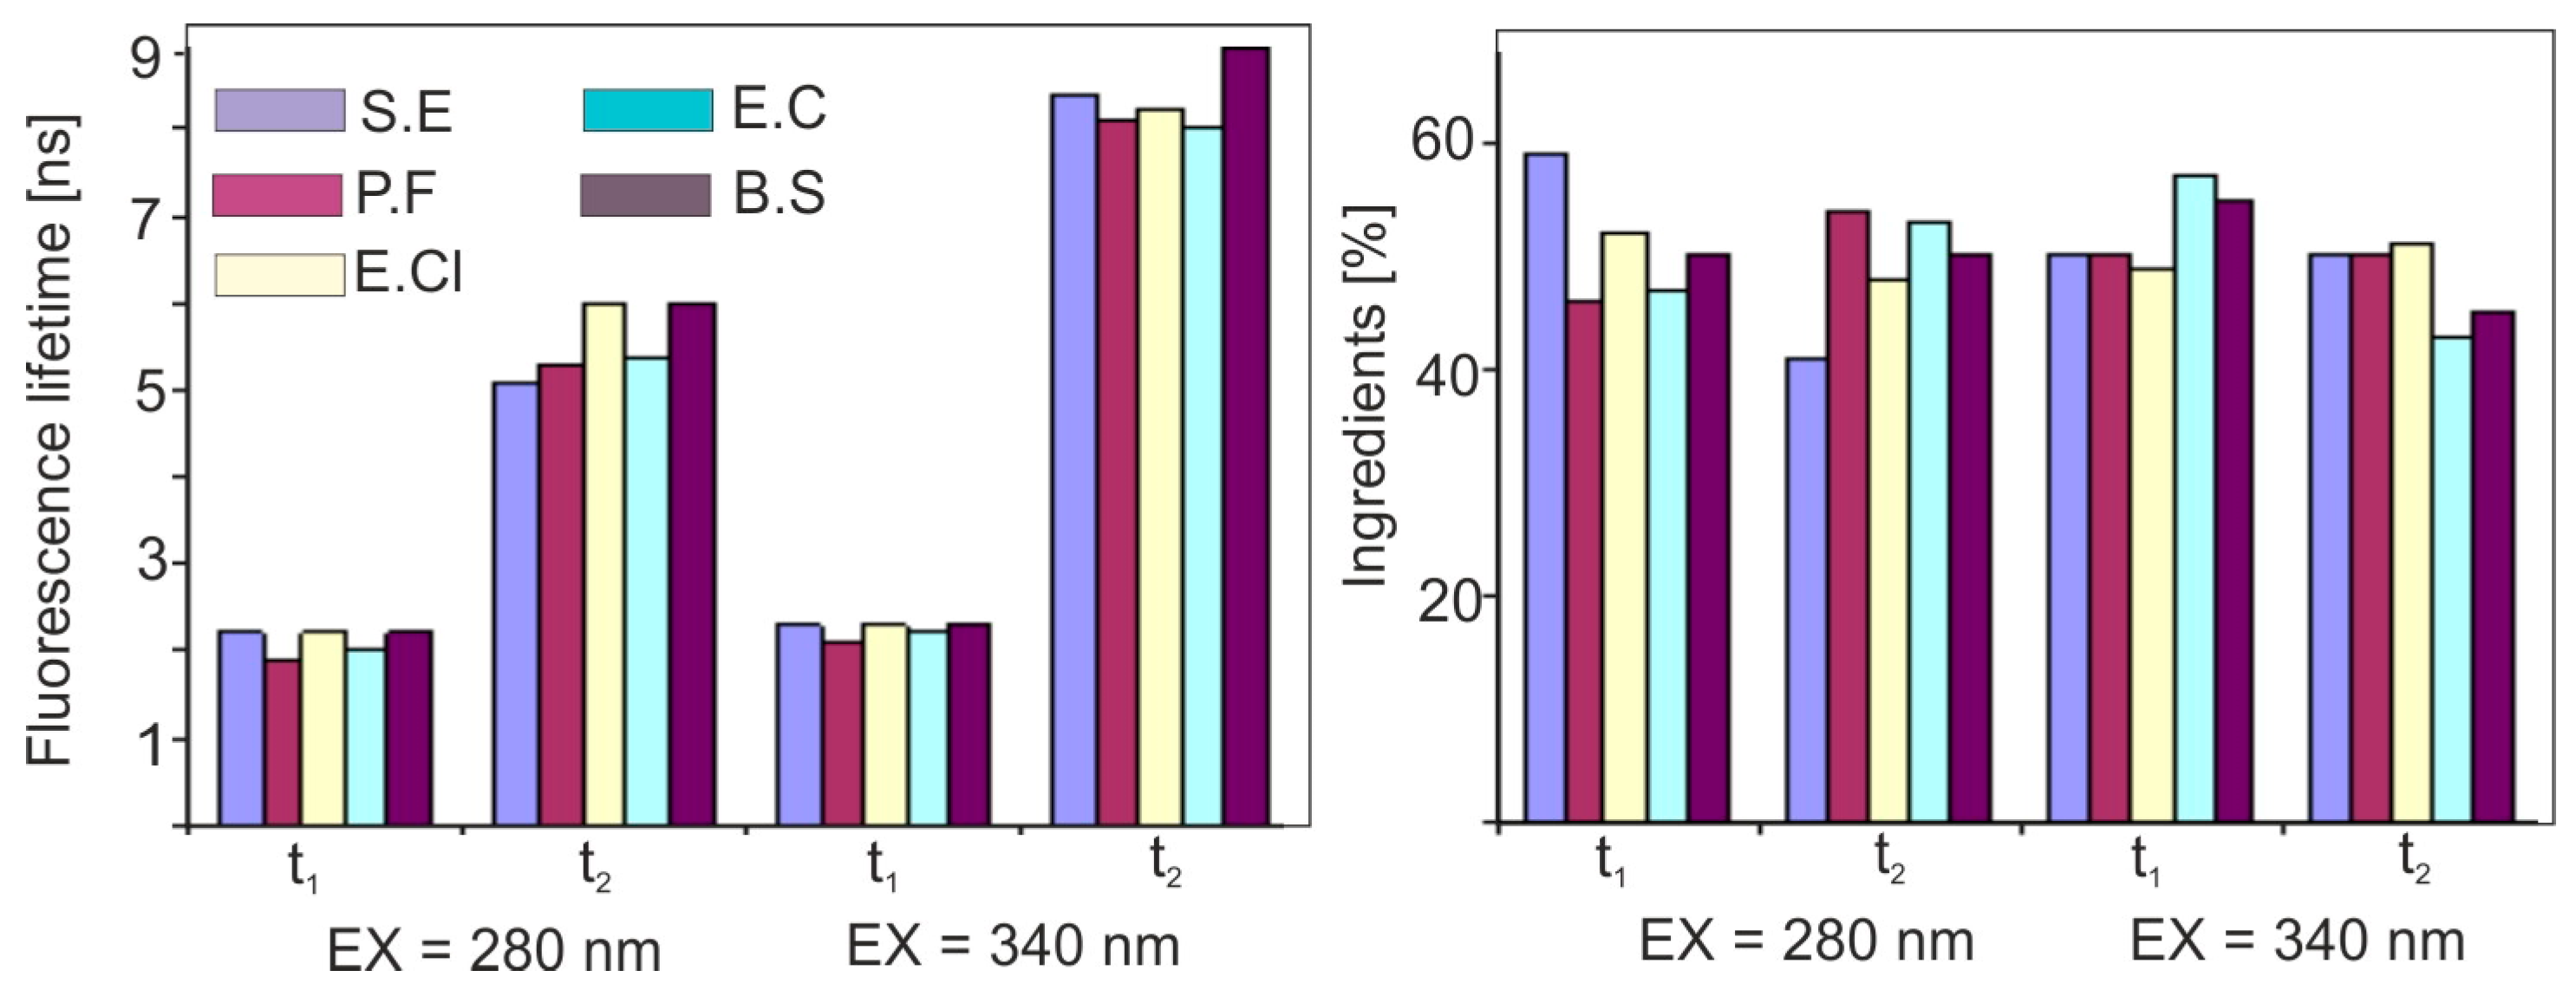
4.2. Fluorescence Lifetime Measurements

The fluorescence lifetime is an important parameter that characterizes the fluorophore and extends the ability to distinguish weak emission signals from the surrounding background. Time-resolved fluorescence is commonly used in the study of macromolecules, mainly proteins, as well as for the characterization of other biological systems [73]. The data obtained by this method often provide more information about the molecular structure than the fluorescence spectra.
This technique is used to measure the resonant energy transfer, fluorescence quenching, interaction of fluorescent probes with proteins, DNA, or membranes, decay anisotropy and rotational state correlation times, lifetime distributions, and multi-exponential decays. The fluorescence lifetime of biofluorophores is very sensitive to their micro-environment in the protein and makes it possible to discriminate between different biological molecules. Times to be expected for fluorescence range from ps to ns and for phosphorescence to μs. Each of these ranges has different technical requirements and presents different measurement challenges. Various methods of time-resolved laser spectroscopy are used to determine the fluorescence lifetime. Currently, the most popular methods of measuring this parameter include:
  • Measurement method in the frequency domain, the so-called modulation-phase method (frequency domain);
  • Time domain measurement methods.
The classic method, time correlated single photon counting (TCSPC), is characterized by very long measurement times, up to several hours, and during the irradiation, bacteria are degraded. The stroboscopic method [74], developed in the 1990s, allows for the measurement of the fluorescence lifetime in about 10–20 s. This method has also been implemented to measure the lifetime of bacteria and biological interferents [75]. A very important application is the study of the lifetime of chemical or biological compounds. Figure 6 shows examples of the decay of the fluorescence curve for tryptophan methyl ester (NATA) and the NADH coenzyme.
The NATA and NADH standards are characterized by mono exponential decay and their values are consistent with the literature values determined by other methods. In addition, the signal level is very high with a low noise value at the same time. A very high degree of fit of the theoretical and experimental curve can also be observed, which shows that the method used is reliable. The stroboscopic method is perfect for measuring the lifetime of biological compounds. Using the stroboscopic method, fluorescence time measurement takes only a dozen or so seconds. Figure 7 presents the results of our own research on the lifetime of the selected bacteria.

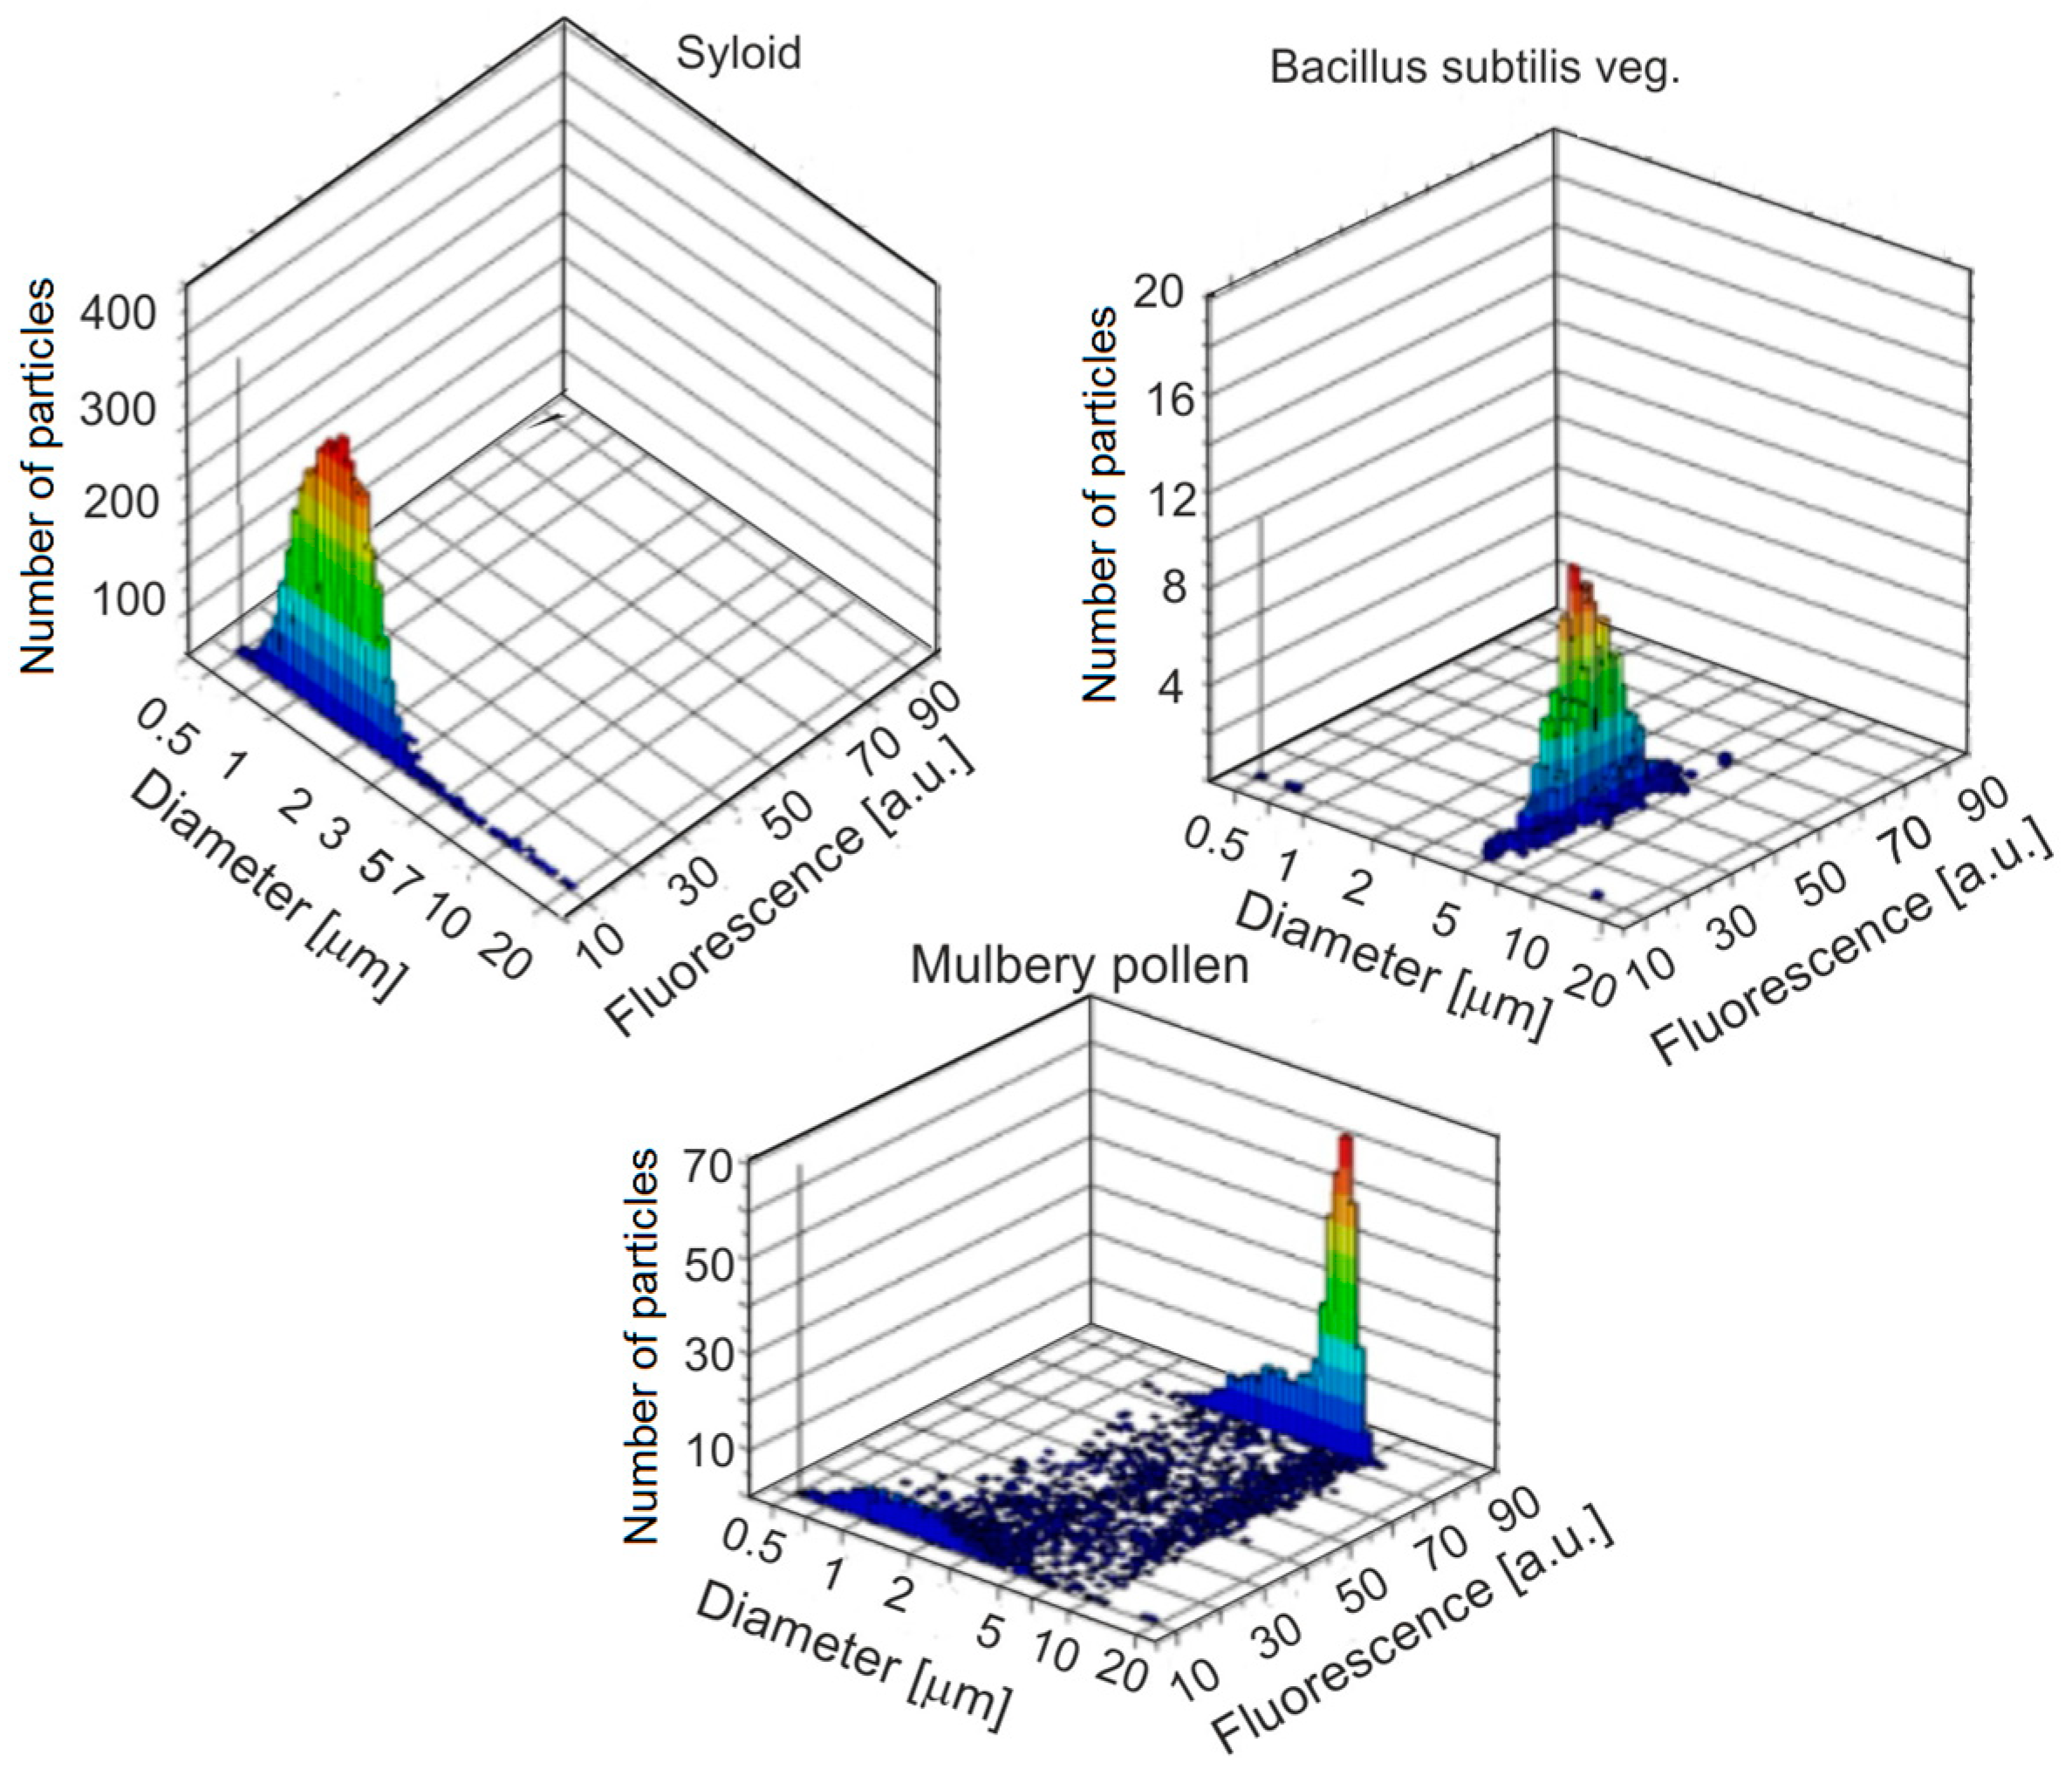
4.3. Measurements of the Size and Shape of Bioaerosol Particles

The fluorescence does not provide sufficient information for the clear and reliable identification of airborne species and only allows for a rough, real-time discrimination of potential intentionally-released biological warfare agents from interferents. For many years, instruments that measure the aerosol size distribution have been available. However, the addition of valuable shape information has enabled a much deeper understanding of the particle populations. Since most particles, either naturally occurring or manmade, are not perfect spheres, particle shape is an important parameter that can classify the particle species. The first device developed by Kaye has been commercialized by BIRAL as an instrument called ASPECT [76,77,78]. Using BIRAL’s ASAS Technology, ASPECT is a particle analyzer combining the size and shape characterization of aerosols. With a unique method of laser light scattering, the instrument performs a rapid analysis of the transient spatial intensity distributions of scattered light from single particles.
The principle of operation of the instrument is described in more detail in Section 5. Using the optical size and shape analyzer, we found a good correlation between the light scattering properties and the particle features determined by scanning electron and fluorescence microscopy [79]. Additionally, HCA (hierarchical cluster analysis) offers fast and continuous bioaerosol classification. These data could be significant in environmental monitoring, climate research, and industrial settings. Example characteristics obtained using the ASPECT device are shown in Figure 8.
One of the most important instruments for studying the fluorescence and size of individual particles of bioaerosols in real-time is UV-APS, which was developed by the Canadian company TSI Inc. The instrument is often used as the standard and reference in the development and construction of various particle analyzers. Figure 9 shows examples of the measured fluorescence characteristics and aerosol particle diameters.

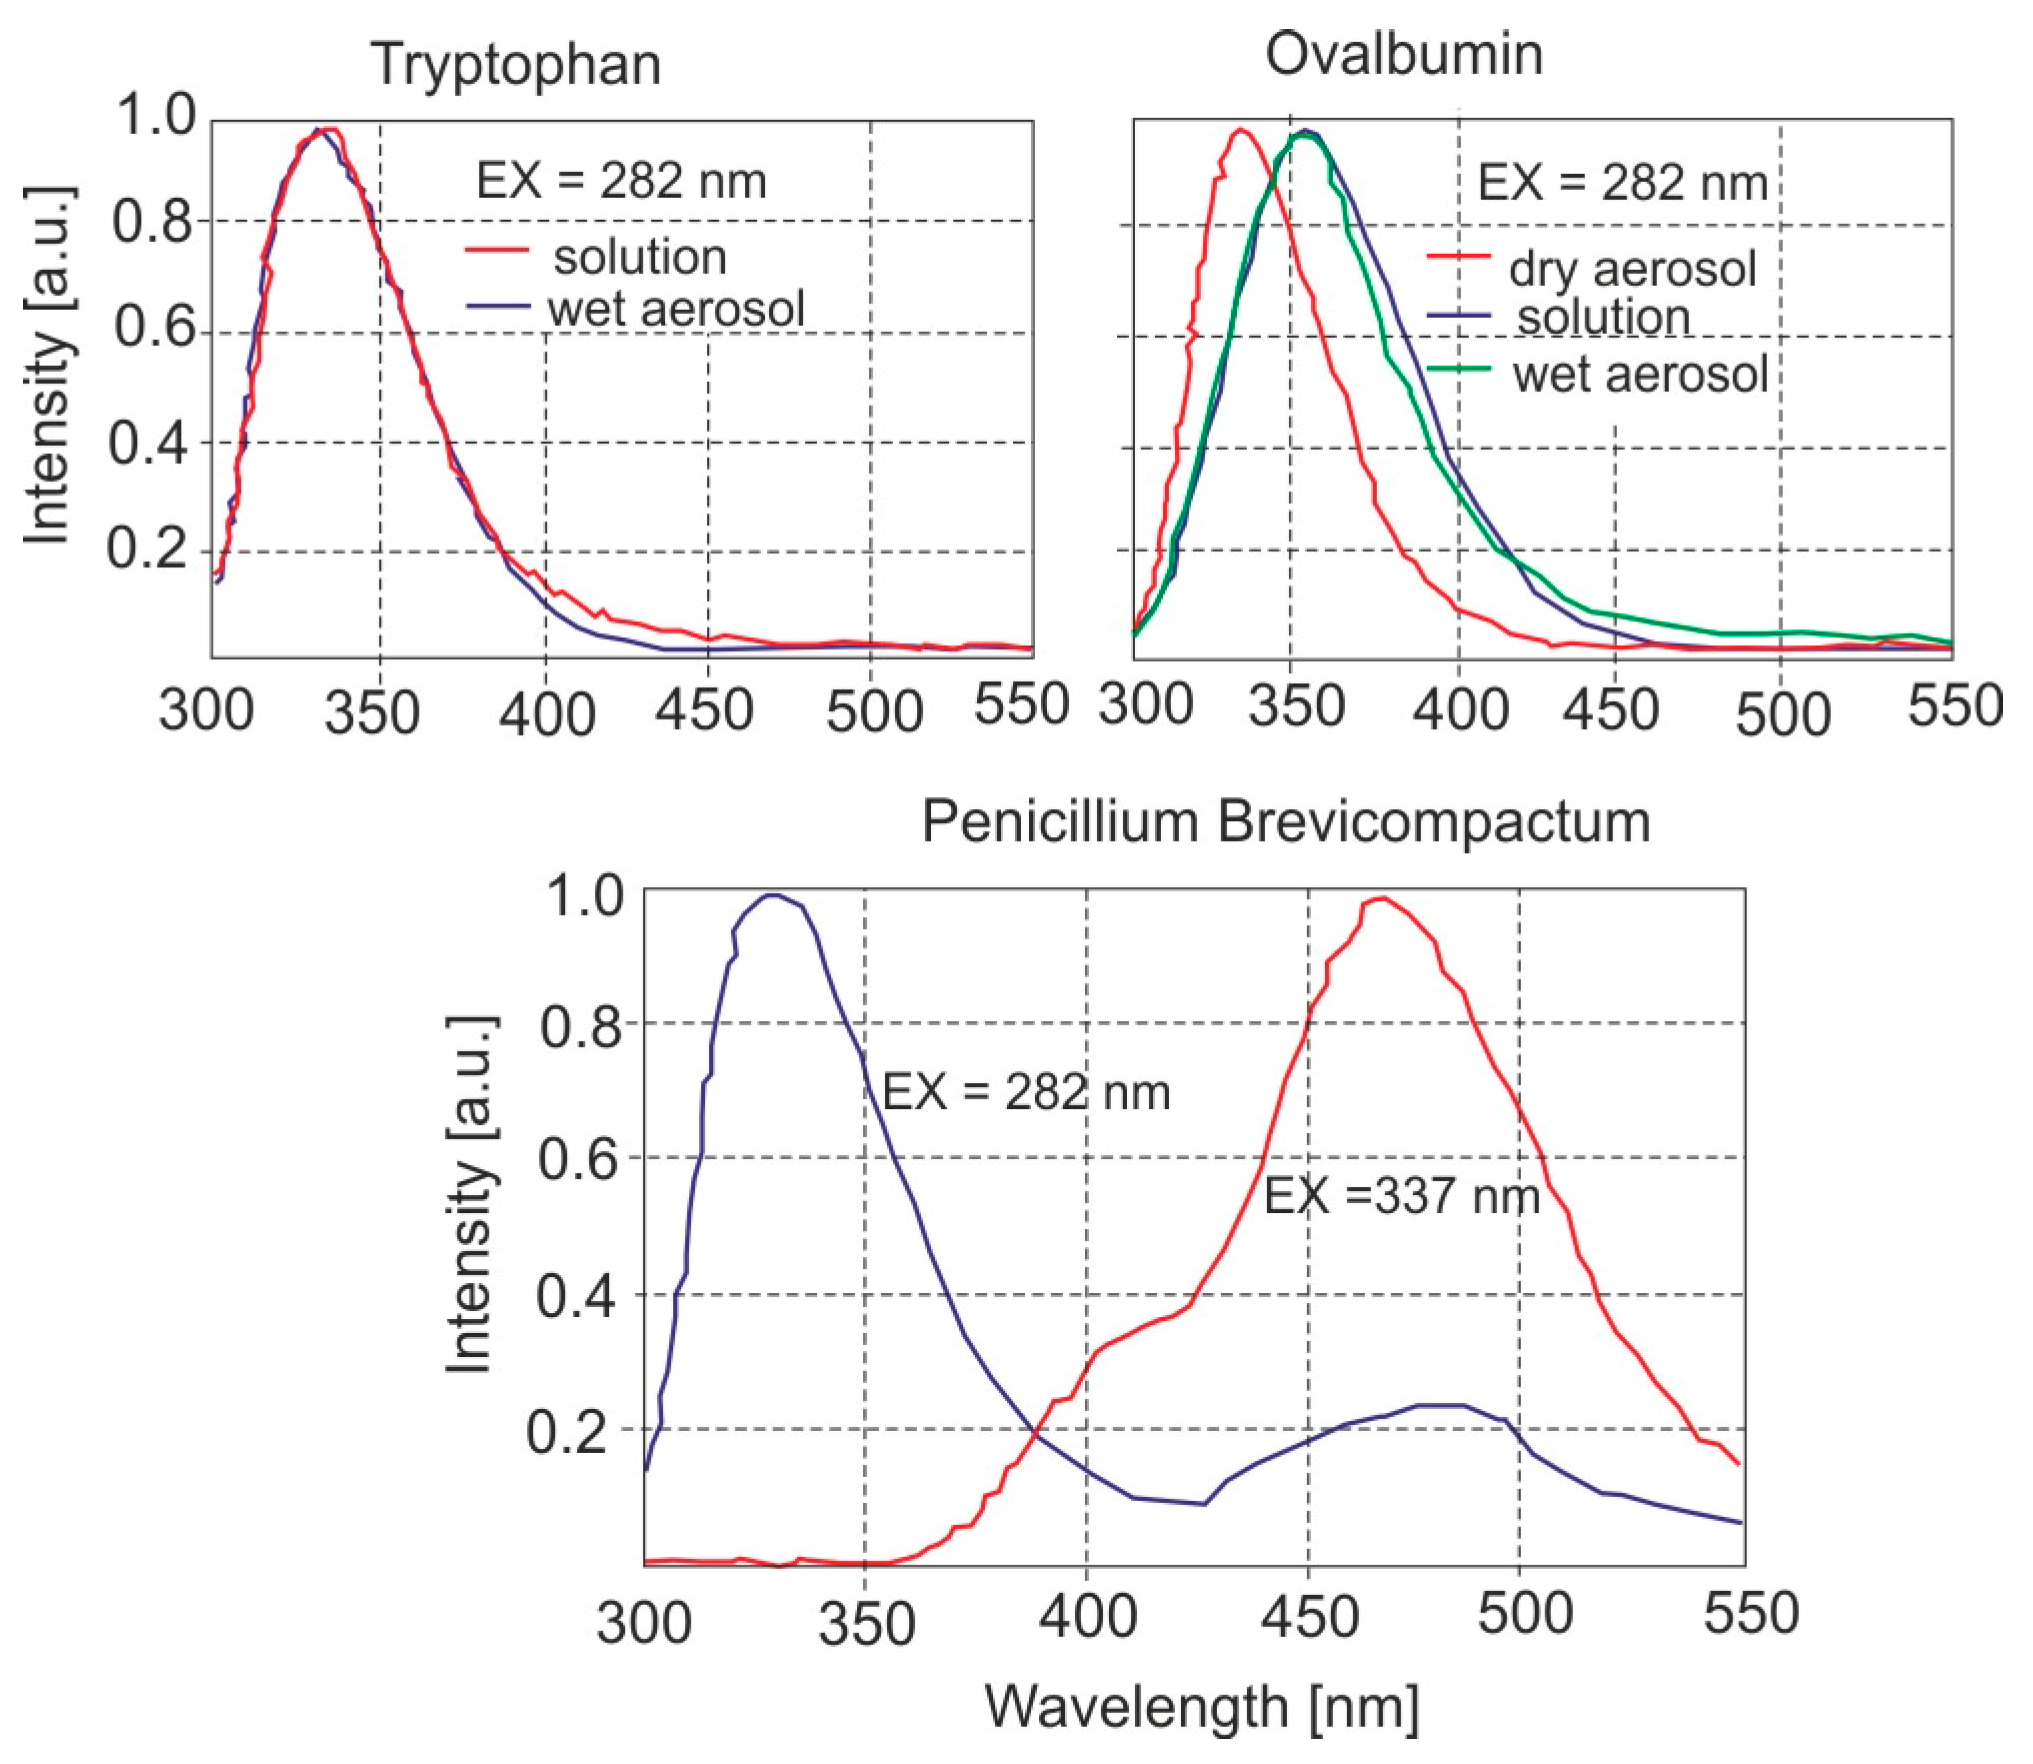
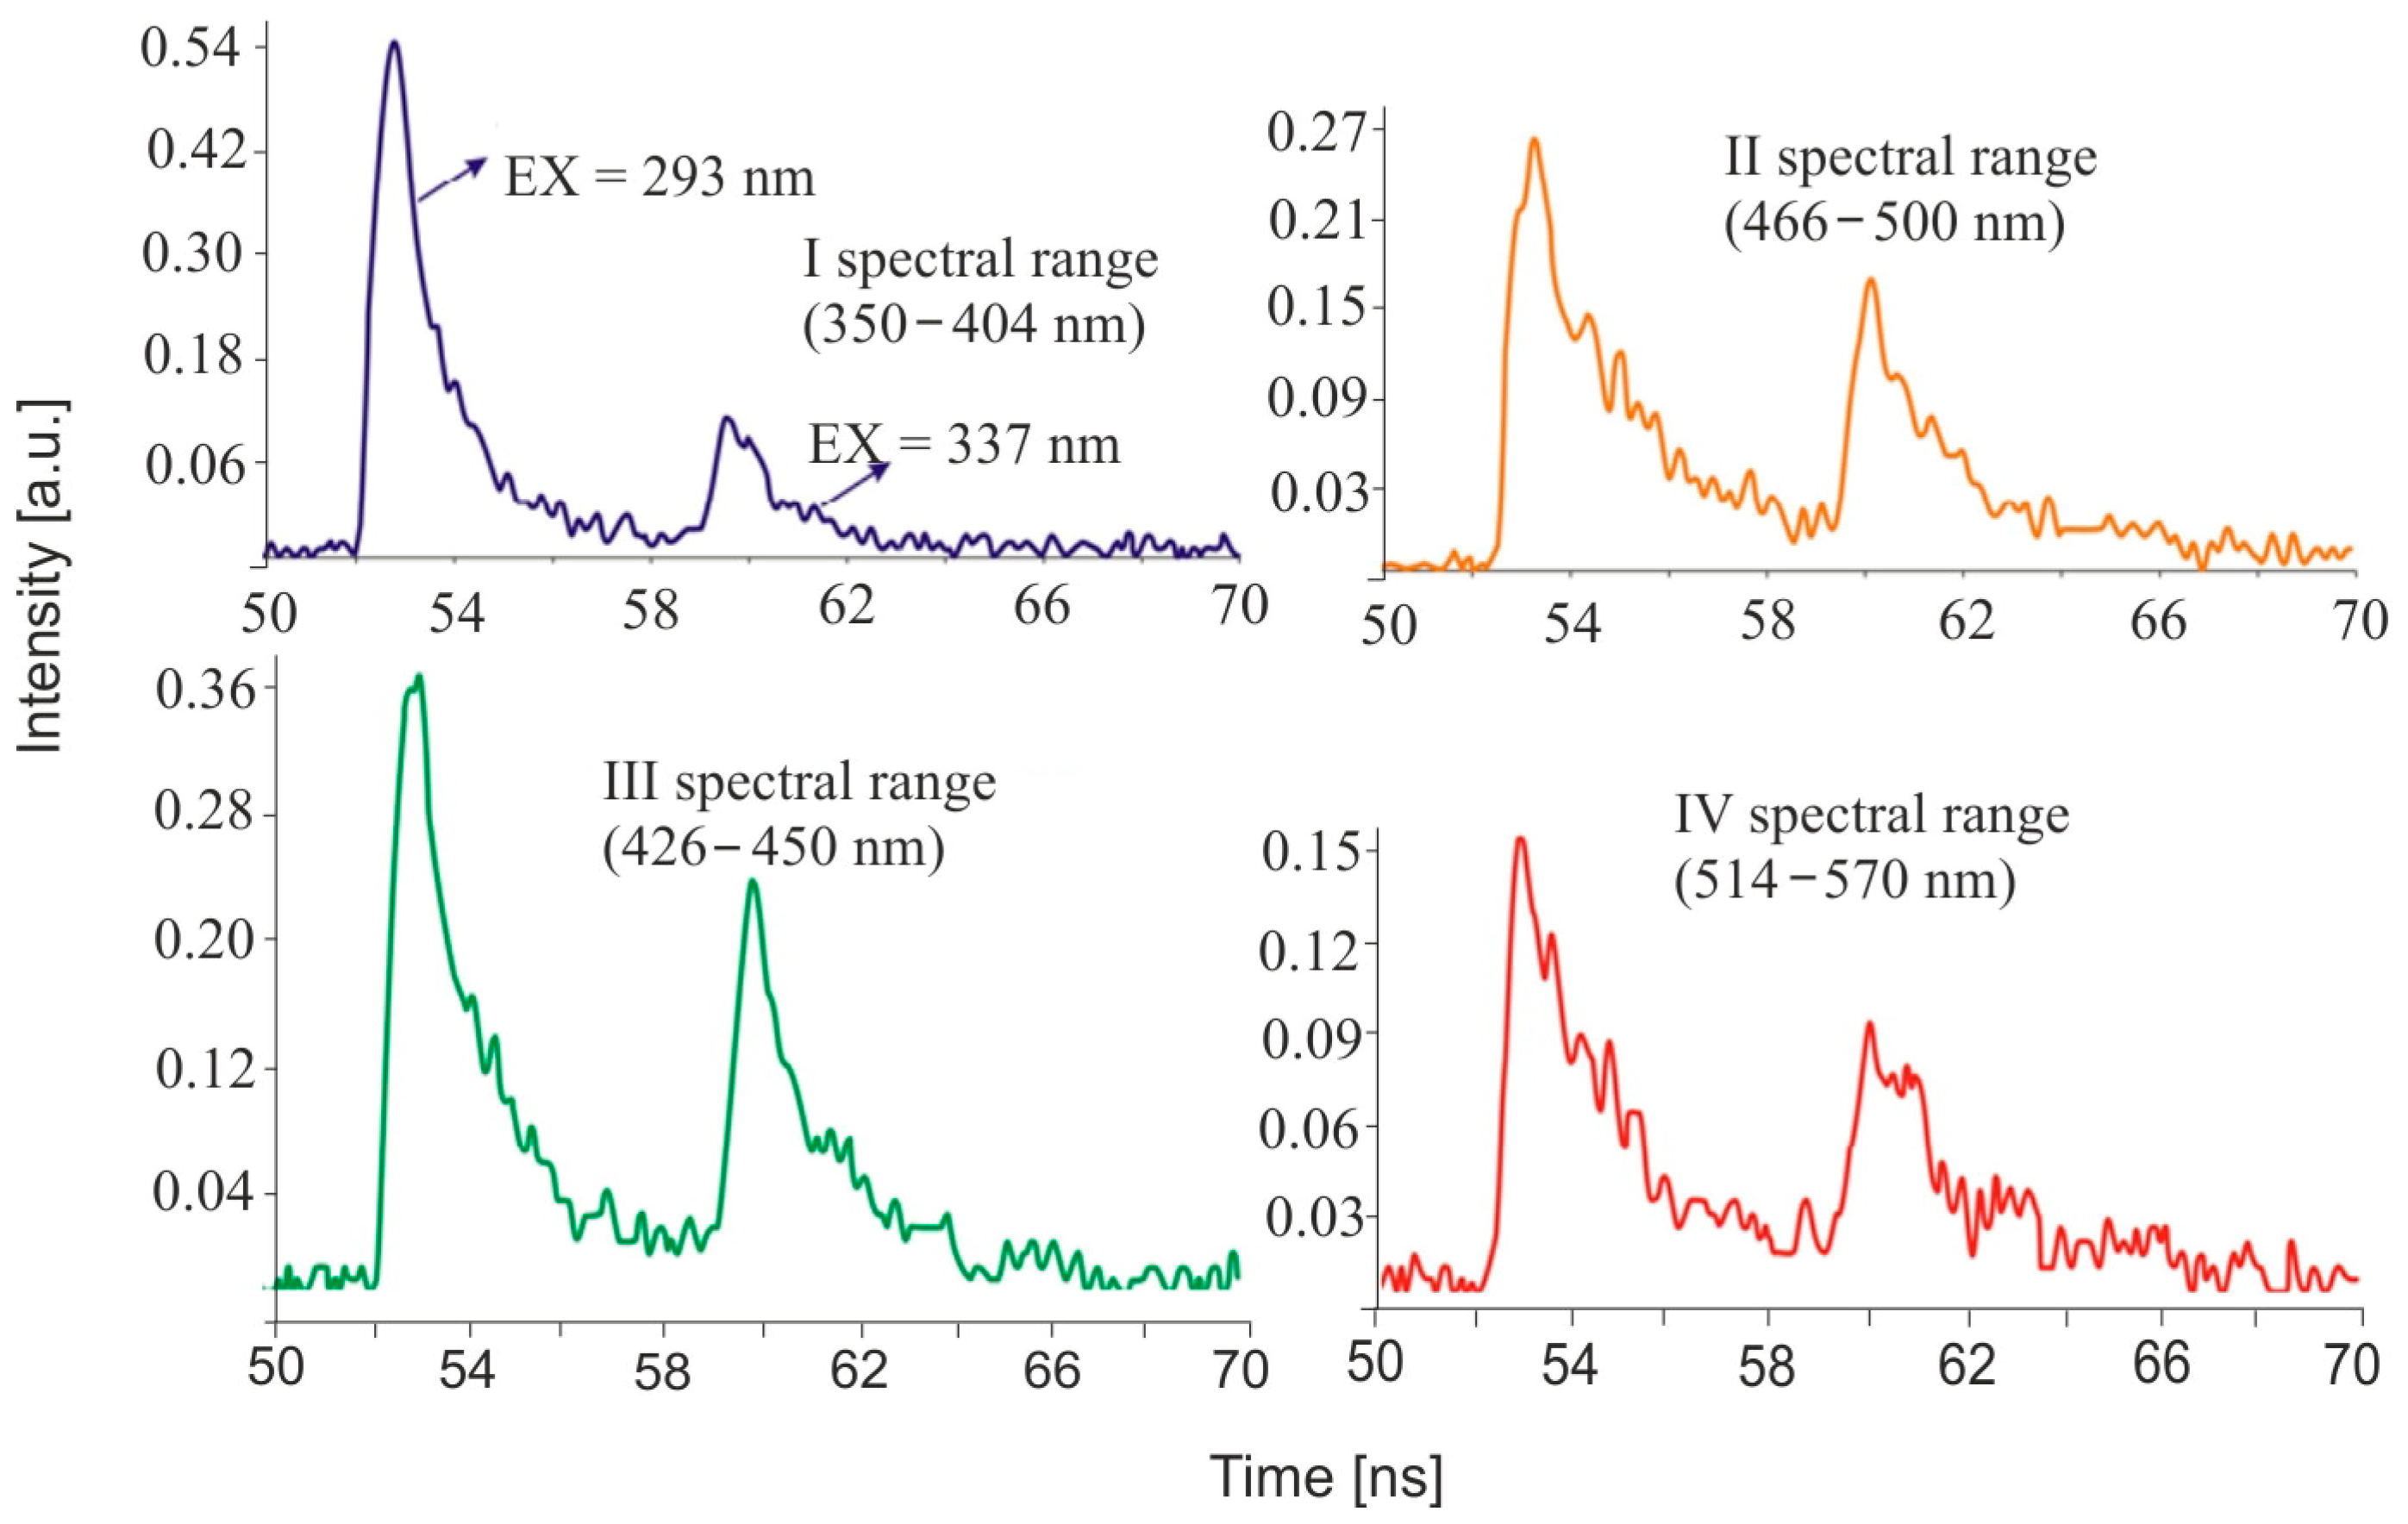
4.4. Single Particle Spectra

The single-shot, fluorescence spectra from the individual particles of primary fluorophores are presented in Figure 10. Chemical compounds were dissolved in water and the solutions were aerosolized with a compressed-air nebulizer. Emission maxima from different biological materials are not necessarily the same in an aerosol as in solution because the aerosols are often dry or somewhat dry.

5. Review of Instrumentation

The construction of biosensors based on UV light-induced fluorescence and elastic scattering began at the end of the 20th century. The idea of building the first analyzers of biological agents consisted in combining the fluorescence technique, commonly used in liquid flow cytometry, and the aerodynamic method of particle size measurement. The system measures the number of particles in the flowing aerosol as a function of scattering and fluorescence. The aerodynamic method of measuring the particle diameter values is commonly used for the analysis of aerosol particle distribution with high resolution in the diameter range of 0.5–15 µm.
The aerosol particles are passed through a small nozzle, causing them to rapidly accelerate in the air stream. Small particles in the jet accelerate almost like the air stream, and larger particles leave the nozzle later due to their greater inertia. Particle velocities are determined at the exit of the nozzle by measuring their time-of-flights on a specific path controlled by laser radiation and then converting them into particle diameters. The principle of operation of liquid flow cytometry does not consist in passing a liquid stream containing the tested particles through a focused laser beam. The jet is surrounded by a layer of clear liquid that keeps the sample flowing through the radiation focus. Fluorescence from the biological particles is measured using photomultipliers equipped with optical filters or a spectrometer with an ICCD camera (Figure 11).
Flow cytometers enable high-volume single-particle data collection and the real-time characterization of populations of biological particles. The classical method uses fluorescent antigens that form specific complexes with the analyzed antibodies. For the characterization of bacteria suspended in an aerosol, this solution is impractical, and only the fluorescence of endogenous fluorophores contained in the bacteria is determined. Table 3 provides an overview of the bioaerosol detection instruments.
The first measurements of the fluorescence of individual single-particles from Bacillus anthracis were conducted by the U.S. Army Research Laboratory (ARL) [80]. The system with a 488-nm laser was used to measure the LIF spectra of atmospheric aerosol [35,81,82] and laboratory-generated particles [83,84].
The Canadian Defense Research Establishment, in cooperation with TSI, Inc. (Shoreview, MN, USA), developed the first commercially available fluorescence-based bioaerosol detectors—the UV-APS and FLAPS for military applications [85,86,87,88,89,90].
MIT Lincoln Laboratory (LL, Lexington, MA, USA) developed a 266-nm-based fluorescence and elastic scattering detector, BAWS (biological-agent warning sensor) [91]. The sensor was used as the trigger on the joint biological point detection system, (JBPDS0) [92,93].
The Naval Research Laboratory (NRL) constructed an elastic scattering-cued fluorescence sensor at 266 nm [25,94]. Cooperation between the LLNRL and the Edgewood Chemical and Biological Center led to the construction of the Rapid Agent Aerosol Detector (RAAD), which consists of 355-nm polarized elastic scattering, and dual fluorescence excitation at 266 and 355 nm [15]. Detection of the fluorescence of individual aerosols with two excitations and broad band emission channels [34] has been shown to better discriminate against common interferents [15]. An even better classification of bioaerosols is possible with a dual excitation system with 32-channel spectral resolution [84]. The University of Hertfordshire and U.K. Defense Ministry developed and commercialized, by BIRAL, the fluorescence and light-scattering instrument WIBS [33,78,98,99], and later VeroTectTM [100].
Similar in design to the WIBS is the multiparameter bioaerosol sensor (MBS) with enhanced spectral resolution and morphological information [101,102]. A xenon lamp (wavelength 280 nm) was used to excite the fluorescence and the fluorescence signal (310–638) was detected over eight channels (310–638 nm) by a multichannel photo-multiplier. A dual CMOS linear array recorded the spatial effects of elastic scattering.
Another modification of the WIBS analyzer is the commercial SBS (spectral intensity bioaerosol spectrometer) [103]. It is a commercial LIF instrument built on the optical block of the WIBS. Excitation pulses from the filtered xenon flash-lamps were centered at 285 and 370 nm and the emission spectra fell into 16 channels (300–720 nm). The SIBS is characterized by a significantly increased spectral resolution relative to WIBS.
Real real-time observations of the total pollen and grass pollen concentrations were performed using the Rapid-E analyzer. The PA-300 (Plair SA, Geneva, Switzerland) [104,105] analyzer was described by Kiselev et al. [106,107]. Rapid-E consists of a blue laser (400 nm) used to produce time-resolved scattering patterns across 24 detectors at different angles.

6. Characteristics of Selected Analyzers for the Detection of Bioaerosols

6.1. UV-APS

The device most often used as a model or reference in relation to other devices built is the UV-APS (in the military version FLAPS). So far, a very large number of aerosol studies have been carried out using this instrument in both indoor [44,45,108,109] and outdoor analysis [110,111,112,113] to investigate the viability and dynamics of airborne particles [85,87,114,115].
In the first prototype, a He-Cd laser with a wavelength of 354 nm and a power of 30 mW was used as the excitation source; the next versions contained the following lasers: He-Cd (325 nm, 30 mW) and Nd:YAG (355 nm). Pulsed 355-nm light from a Nd:YAG laser excited the fluorescence and the integrated intensity from 420 to 575 nm was measured [116].
The first laboratory tests showed that the upper limit of detection was about 60 particles/cm3. In addition to the fluorescence level of individual particles, their aerodynamic diameter was determined, and the combination of these values allowed for the discrimination of different types of biological agents. This device enables the real-time measurement of the aerodynamic diameter, diffuse light intensity, and aerosol fluorescence. The tested aerosol is sucked from the environment through a nozzle with a constant flow rate of 1 L/min. Around the mainstream, a protective jacket is created from a stream of filtered air flowing with a capacity of 4 L/min. Such a system ensures the precise focusing of the bioaerosol in the laser beam. Aerosol analysis takes place in the measuring chamber. The signal coming from the scattering of light on the particle is detected using a photomultiplier. The measurement of the aerodynamic diameter is based on the analysis of the particle’s time-of-flight between two laser beams emitting a red light with a wavelength of 655 nm and a power of 30 mW. The larger the particle, the longer the time-of-flight. The measurement of the fluorescence of individual particles distinguishes the biological material from non-biological. Fluorescence is excited at a wavelength of 355 nm, and the emission is recorded using a photomultiplier in the range of 430–580 nm. The UV laser pulse is triggered based on the time-of-flight measurements, which allows for the determination of the appropriate fluorescence. Most particles are between 0.7 and 3 μm in size, and the average aerodynamic diameter is about 1.5 μm. The examples of the analysis of the size distribution and fluorescence level of various aerosol materials, determined with the UVAPS instrument, presented in Figure 10, indicate a fundamental difference in the emission of these materials. The UV-APS reports fluorescence in a single emission band, with the overall particle discrimination generally poorer than for multichannel instruments.

6.2. WIBS

In the WIBS system, pulsed xenon lamps are also used as the excitation source. An example of such solutions are the WIBS1 [117] and WIBS2 [118] prototypes. WIBS1 uses two xenon modules (Perkin Elmer RSL3100) built-in quasi-collimation optics. Their repetition rate is 50 Hz, operates at 2–3 Hz, maximum flash energy of 40 mJ, and a flash duration of 1 ms. The xenon lamps are mounted on either side of the scattering chamber and orthogonal to the axis of the lamps are two fluorescence detectors.
Elastic scatter from a 635-nm laser is used, two xenon flashlamps are filtered to produce narrow excitation wavebands centered at 280 and 370 nm, and two wideband photomultiplier detection channels (310–400 nm and 420–650 nm) provide three channels of fluorescence detection.
The aerosol flow of 10 l/min is drawn from the ambient environment through the central chamber. The WIBS1 sensor records the intrinsic fluorescence from an ensemble of particles simultaneously. The WBS2 sensor overcomes the significant limitations and provides single-particle fluorescence detection. Around a central optical chamber, a CW 660 nm diode laser (or 635 nm laser) is arranged and used to determine the particle size and asymmetry of particles as well as two pulsed xenon sources and two fluorescence detection channels. The aerosol is drawn from the atmosphere via a laminar-flow delivery system with the flow of 4.0 L/min. Each particle entering the chamber produces a scattered light and the size is determined. Particles greater than about 1 μm in size initiate the sequential firing of xenon source.
WIBS2 uses two Hamamatsu L9455 xenon modules (Hamamatsu Photonics K.K., Hamamatsu, Japan) with a maximum repetition rate of 126 Hz. The sensor has the ability to differentiate between various biological and non-biological airborne particles down to 1 μm. The most recent version is WIBS4 [16,118,119,120]. Fluorescence emitted by a given particle after each excitation pulse is detected simultaneously using two PMT detectors. The first PMT is optically filtered to detect the total intensity of fluorescence in the range 310–400 nm and the second PMT in the range 420–650 nm. Therefore, for every particle that triggers xenon lamp flashes, Xe1 produces a signal in the FL1 (310–400 nm) and FL2 (420–650 nm) channels, whereas Xe2 produces only a signal in the FL3 (420–650 nm) channel because the elastic scatter from the Xe2 flash saturates the first PMT. Elastic scatter from a 635-nm laser or 660 nm laser diode is used to determine the particle size and asymmetry, two xenon flashlamps are filtered to produce narrow excitation wavebands centered at 280 and 370 nm, and two wideband photomultiplier detection channels (310–400 nm and 420–650 nm) provide three channels of fluorescence detection.
The wideband integrated bioaerosol spectrometer (WIBS) is a widely used, commercial, three-channel LIF spectrometer developed by the University of Hertfordshire (UH), now licensed to and manufactured by Droplet Measurement Technologies (DMT; Longmont, Colorado). Several non-commercial WIBS versions have been produced with slightly different optical and electronic configurations, and DMT has manufactured two commercial models (4A and NEO).
Savage et al. [16] presented a systematic characterization of the WIBS4A instrument using 69 types of aerosol materials including a representative list of pollen, fungal spores, and bacteria as well as the most important groups of non-biological materials reported to exhibit interfering fluorescent properties. Broad separation can be seen between the biological and non-biological particles directly using the five WIBS output parameters and by taking advantage of the particle classification analysis introduced by Perring et al. [121]. Hernandez et al. [122] presented a summary of more than 50 pure cultures of bacteria, fungal spores, and pollen species analyzed by the WIBS with respect to the fluorescent particle type.

6.3. ASAS and VeroTectTM

The combination of fluorescence analysis and light scattering on individual air particles has become an important tool that can characterize, classify, and in some cases, identify biological particles. This technique allows for non-invasive, non-destructive analysis in real-time and is widely used in the study of environmental pollution and the detection of deliberately introduced combat pathogens.
Since most particles either naturally occurring or manmade are not perfect spheres, the particle shape is an important parameter in which the particle species can be classified. For spherical particles illuminated by circularly polarized radiation, the scattering intensity does not change in different azimuthal planes for the entire range of polar angles. However, the presence of non-spherical particles breaks this symmetry, and the scattering for the selected azimuthal plane is dependent on the orientation of the particle. This approach was developed by Kaye [24,76]. In the original system, three photodiodes were arranged symmetrically at 40° in a circle around the z-axis of the incident beam of circularly polarized radiation.
The detectors collected light scattered by single particles flowing in laminar motion. The signals recorded by azimuthal detectors allowed for the distinction between the spherical and non-spherical particles. The aim was to distinguish, in real-time, between spherical droplets of potential contaminants. The system was modified several times in order to increase the measurement range of particle diameters to 1 μm and the value of the polar angle.
This setup was the starting point for BIRAL’s particle size and aspect ratio analyzers. The technology is known as ASAS (aerosol size and shape). The measurement of the number of particles, size, and aspect ratio is based on ASAS technology. It consists of the analysis of light scattered on individual particles. The addition of valuable shape information has enabled a deeper understanding of particle morphology. One of the simplest methods of reducing the shape-related light scattering data is the asymmetry factor Af, a measure of the azimuthal variability of the scattered radiation. The three azimuthal detectors E1, E2, and E3 provide information on the shape of the particles, and the scattering data measured on the single detector E4 relates to the particle sizes. A spherical particle such as a drop of liquid scatters the radiation to three azimuthal detectors. Elongated particles (e.g., fibers) tend to align themselves parallel to the flow direction and thus scatter, mainly horizontally, to one E2 detector. Particles with other morphologies have intermediate scattering distributions in relation to the extremes above-mentioned. Af is expressed by the following formula:
A f = i = 1 i = n   E s E i 2 k / E s
where Es means E1 + E2 + E3, and k—is a constant chosen to reach the maximum value of Af.
For spherical particles, Af is zero, and the orientation in one direction is 100. Despite the simplicity of this method, estimating the value of Af is effective in the differentiation of real-time morphology.
A combination of measurements of the fluorescence intensity, size, and aspect ratio of bioaerosol particles was used in BIRAL’s VeroTectTM system. The instrument enables real-time, generic biodetection, characterizes the ambient background aerosol, and detects changes associated with the presence of biological threats. Fluorescence is measured on a bulk sample of the aerosol in two ranges: 330–650 and 420–650 nm, respectively. The system uses an innovative light source centered at 280 nm, the optimum excitation wavelength for biodetection. The size range of measured particles is 0.5–15 µm, flow rate—2 L per minute, and the max. particle throughout is 20.000 per second. Characterization by size, concentration, and particle shape is a powerful means of distinguishing between the potential threat and benign interferents (pollen, diesel fuels).

6.4. BARDet

Semiconductor laser diodes are also beginning to be used in bioaerosol detection systems. An example is the airborne particle flow detector BARDet (bioaerosol detector) built at the Institute of Optoelectronics (IOE) of the Military University of Technology (MUT) in Warsaw.
The scattering and fluorescence intensity of individual particles are measured in seven bands [32]. The fluorescence excitation source is a CW 375 nm laser (Coherent CUBE CW). The aerosol is drawn through the inlet nozzle and focused by a flow of filtered shielding air, and the flow is perpendicular to the plane of the laser beam. The aerosol and focus stream flow rates are approximately 0.15 and 2 L/min, respectively. Back and forward stray light is detected with two PMT detectors (Hamamatsu, H6780, Japan), which for backward and forward scattered light measurements are mounted at 35° and 145° laser beam angles, respectively, and the fluorescent signals are collected at 90° angles to the excitation laser beam. Fluorescence signals are collected by a spherical mirror and reflected to a polychromator integrated with the 32-channel PMT. The compact design allows it to be mounted on a mobile platform.
The artificial neural network (ANN) method is used to analyze data obtained from measurements using the BARDet device. A total of 48 different aerosols including bacteria, pollens, fungi, spores and non-biological substances have been analyzed and it was found that almost every particle could be properly classified [123]. At the Institute, the device is used as a reference in the field tests of bioaerosols. The prototype of the device is at the disposal of the Field Biological Laboratory.

6.5. The Fabiola Project

The next stage in the development of the LIF method was the use of different fluorescence lifetimes of individual biological media, which was implemented in the FABIOLA program [37,124]. Constructed by a consortium of many international centers, the analyzer has successfully passed laboratory and field tests. The device consists of the following components:
  • Particle segregation chambers [125];
  • OPG laser for fluorescence excitation with 293 nm and 337 nm wavelength radiation [126];
  • Optical system for the acquisition of emission signals in the spectrum of the four spectral ranges;
  • Software enabling the quick analysis and grouping of signals using the PCA method.
The measuring chamber is the heart of the system; it also acts as a particle concentrator (Figure 12).
In the central part of the chamber, air with biological particles flows in a laminar flow. The flow rate is 2 dm3/min. In the particle concentrator, the air stream is divided into two streams with flows of 1.8 dm3/min and 0.2 dm3/min, respectively. The main stream, containing particles with diameters below 1 μm, is removed from the system. The secondary stream, containing particles with diameters of 1–10 µm, continues to the nozzle. Theoretically, the particle concentration factor (Qtot/Qsec) is 10. This stream is additionally surrounded by an external, additional air stream with a flow of 1.6 dm3/min in order to stabilize it. Upon reaching the nozzle, the particles are rapidly accelerated. They encounter laser radiation with a wavelength of 650 nm, followed by OPG laser radiation. A laser diode with red radiation acts as a trigger for the UV laser. The fluorescence radiation is focused on an elliptical mirror. At the first focus of the ellipse, the particle is in contact with the fluorescence excitation radiation; at the second focus of the ellipse, the exit slit is placed, and the radiation is focused.
The OPG laser constructed by Thales (Figure 13) consists of a main oscillator with an amplifier (λ = 1064 nm, Eimp = 61 µJ, ν = 1 kHz) and radiation conversion blocks [127]. Second harmonic generation takes place in a KTP crystal with a length of 15 mm. The temperature of the crystal is stabilized by a thermoelectric cooler. At the exit from the crystal, radiation with a wavelength of 532 nm is obtained, which then, in the crystal of lithium niobate doped with magnesium (PPMgLN), generates radiation in the range of 590–700 nm.
The conversion of this radiation to the range of 290–350 nm (SGH) takes place in the BBO crystal. The conversion of radiation from the 580–700 nm range to the 280–300 nm range is generally done by generating a summation frequency. The laser radiation is introduced into the optical fiber through a filter made of UG11 glass, transmitting only UV radiation. The laser has been modified so that it is possible to generate both beams simultaneously. The 337 nm beam was delayed by a fiber optic line to arrive at the chamber 80 ns later than the 293 nm beam.
Limitations of the size of the equipment and the sensitivity of the apparatus forced the choice of two excitation lines lying in the TRP and NADH emission bands of bacteria (293 and 337 nm). The number of emission bands at which the emission decay was tested was limited to four due to sensitivity. The scheme of the bioanalyzer is shown in Figure 14. The decay of fluorescence is measured in successive channels. The measurement of the scattered laser radiation is made in a photomultiplier tube, and in the next four emission channels, the fluorescence decay over time is measured. In front of each photomultiplier, there is an appropriate interference filter for a given range of wavelengths. Diffuse radiation makes it possible to measure the particle diameter.
Figure 15 shows an example of the emission characteristics derived from the excitation of a single particle of BG material.
On the ordinate axis, the normalized intensity values correspond to the actual intensity ratios in the individual channels. Fluorescence emission bands are strongest in the wavelength range of 350–404 nm and decrease with increasing wavelength. The areas under the individual decay curves correspond to the integrated fluorescence intensity. In this way, two important emission parameters are obtained: the intensity levels for different spectral ranges and the emission lifetimes. The measurements are very fast, and every single particle that enters the chamber in the flowing air stream is analyzed. The system was tested in laboratory conditions in the chamber (Paris) and on the training ground in Sweden. Appropriate differentiation between tested simulators and BW interferers was achieved.

7. Stand-Off Detection of Bioaerosols

Compared to in situ analyzers, stand-off detection is less frequently used. Lidar is one of the very few promising methods in terms of long-range stand-off airborne biological particles. Initially, lidars were used in atmospheric research [128,129], and over time, this technique was adopted for military applications [130,131]. Scattering lidar is the most basic representative of the family. LIF-lidar methods are based on the fluorescence emission of biological particles. This technique is one of the very few promising methods in terms of the long-range detection of airborne particles. Standard remote sensing systems are used for atmospheric composition, environmental research, national security and agricultural monitoring. These systems are designed for both ground and air applications [132,133,134,135,136].
The advantage of remote methods over point detectors results from the possibility of observing large areas, in the order of tens of kilometers, with a high spatial resolution of several meters and without the need to physically reach the target. Quantitative, spatially resolved measurements of bioaerosol concentration and properties are primarily provided by active methods of light detection, and distance determination enables the measurement of the bioaerosol concentration and properties [137]. Lidars have been used to monitor various types of measurements [138,139,140]. The LIF-lidar technique mainly uses high-power pulsed UV lasers, usually with an excitation wavelength of 266 or 355 nm (e.g., with a pulsed Nd:YAG laser).
A typical new generation lidar was presented in [38]. The device is based on two pulsed UV laser source operating at 266 nm and 355 nm wavelengths (4th and 3rd harmonic of Nd:YAG and Q switched, respectively). Range resolved fluorescence signals are collected in 28 channels of a compound PMT sensor coupled with a Czerny–Turner spectrograph. System tests were carried out, among others, in the facilities of the Dugway Proving Ground (DPG). The device enables one to detect the concentration at the level of several hundreds to a few thousand parts per liter (ppl) from a distance of about 700 m, incorporating as small an averaging time as 1 s. Considering longer averaging times, one can arrive at the configuration capable of detecting concentration levels below 100 ppl from the distance of 1 km.
A compact ultraviolet biological trigger lidar (UBTL) instrument for the detection and discrimination of biological warfare agent (BWA) simulant aerosol clouds was developed by us [141] using a 5 mW, 375 nm semiconductor UV optical source (SUVOS) laser diode.
The system successfully passed field tests at the Dugway Proving Ground. The measuring ranges for elastic scattering were over 300 m, and for fluorescence, over 100 m. Several modifications have been made to increase the sensitivity, detection, and differentiation of particles including increasing the telescope’s collection apertures to a diameter of 200 mm, adding 266 nm and 977 nm laser emitters, and three detection channels for 266 nm and 977 nm flexible backscatter and fluorescence at 330 nm, which provided an increased operating range and sensitivity.

8. Summary

Fluorescence methods are the most sensitive of all the spectroscopic methods and have found wide application for the detection of bioaerosols in both civil and military applications. The instruments either use fluorescence excited by one or two wavelengths, or the entire spectrum is measured. Both steady-state and time-resolved fluorescence measurements are used. In addition to analyzers for in situ tests, lidars are also used for stand-off detection. In real-time fluorescence methods, single particles are combined in one instrument with the measurements of the size and particle shape, which reduces the number of false alarms, Measurements of air bioaerosols using UV-APS and WIBS instruments have been carried out inside various rooms (hospitals, schools) and in the natural environment of all regions worldwide, as far away as Antarctica and the Amazon forest. Several systems have also been implemented that are used by the military. These instruments are mainly used for warning, and in the case of alarms, the biological material is collected and analyzed by biochemical methods in biological field laboratories. However, they are rarely used in everyday practice. A major limitation of BW detection with the LIF method is the ability to detect only bacteria and viruses, and toxins are beyond its reach. UV LIF lidars, despite their many advantages, have a main limitation, which is the strong background signal of sunlight during the day, although the measurements are practically possible at night. In situ analyzers do not have such limitations. Advances in the construction of new light sources or sensitive matrix detectors create new possibilities for the construction of analyzers based on the excitation of fluorescence with two wavelengths and measurements of the entire spectrum, and not only the average intensity in selected spectral ranges.
In all systems using the LIF method, the most important problem is the selection of the appropriate light source. Biological materials are characterized by low fluorescence quantum yields, and therefore lasers are preferred for its excitation. Their power at a selected wavelength is orders of magnitude greater than for typical lamps, even impulse lamps (e.g., xenon). In remote detection systems, these are the only possible sources. Pulsed lasers also enable the detection of individual particles of bioaerosols. For bacteria, fungi, or plant pollen, the ideal wavelengths for fluorescence excitation are lines at 280 and 340 nm. The only lasers emitting these wavelengths are only tunable, very complicated, complex, difficult to use, and very expensive OPO and PGN. In practice, therefore, the 4th and 3rd harmonics of the Nd:YAG laser (355 and 266 nm, respectively) have been used thus far. The future is semiconductor lasers, but currently, the lowest achievable wavelength is 375 nm. The most popular WIBS system uses xenon lamps as replacements for lasers. When using them, the entire fluorescence spectrum is not measured, but only wide, selected bands. It is surprising why newer generations using LED sources have not been developed. Currently, such commercially strong, pulsed sources at 280 and 340 nm are already available, especially since the American SUVOS program is just about to build such sources for biodetection purposes.
The article presented many biodetection devices. In the vast majority, however, these are still only prototypes, which were produced in small numbers. The most common and commonly used analyzers were UV-APS and subsequent modifications of WIBS. These have played an important role in the study of aerosols around the world. Currently, how-ever, UV-APS has been withdrawn from production.
An important parameter in the detection of bioaerosols is the size of the detected particles. It is estimated that about 25% of the particles formed in the atmosphere are mi-croorganisms in sizes ranging from 0.2 μm to 50 μm. Particles with larger dimensions are practically not a threat to human health. The measurements of the sizes by scattering methods accompanying the LIF allow for the preliminary recognition of dangerous biological aerosols. Particle shape studies are of lesser importance as BW materials are a mixture of many substances. Moreover, the particles are generally stuck together and form clusters of spherical shapes. Thus, more than 90% of aerosol particles in the atmosphere are spherical in shape. Shape studies make more sense for single particles of pure bacteria or viruses.

Author Contributions

Conceptualization, M.K. (Mirosław Kwaśny); Methodology, M.K. (Mirosław Kwaśny), A.B., M.K. (Miron Kaliszewski) and M.W.; Investigation, M.K. (Mirosław Kwaśny), A.B., M.W., M.K. (Miron Kaliszewski) and K.K.; Resources, M.K. (Mirosław Kwaśny); Data curation, M.K. (Mirosław Kwaśny) and A.B.; Writing—original draft preparation, M.K. (Mirosław Kwaśny); Writing—review and editing, M.K. (Mirosław Kwaśny) and A.B.; Visualization, M.K. (Mirosław Kwaśny); Project administration, M.K. (Mirosław Kwaśny), A.B., M.W., M.K. (Miron Kaliszewski) and K.K.; Funding acquisition M.K. (Mirosław Kwaśny) and K.K. All authors have read and agreed to the published version of the manuscript.

Funding

Part of the presented results was funded with grant MNiSW-DBO-03-/I/2007.

Institutional Review Board Statement

Not applicable.

Informed Consent Statement

Not applicable.

Data Availability Statement

Not applicable.

Conflicts of Interest

The authors declare no conflict of interest.

References

  1. Fröhlich-Nowoisky, J.; Kampf, C.J.; Weber, B.; Huffman, J.A.; Pöhlker, C.; Andreae, M.O.; Lang-Yona, N.; Burrows, S.M.; Gunthe, S.S.; Elbert, W.; et al. Bioaerosols in the Earth system: Climate, health, and ecosystem interactions. Atmos. Res. 2016, 182, 346–376. [Google Scholar] [CrossRef] [Green Version]
  2. Pöschl, U. Atmospheric aerosols: Composition, transformation, climate and health effects. Chem. Int. Edit. 2005, 44, 7520–7540. [Google Scholar] [CrossRef] [PubMed]
  3. Blais-Lecours, P.; Perrott, P.; Duchaine, C. Non-culturable bio-aerosols in indor settings. Impact on health and molecular approaches for detection. Atmos. Environ. 2015, 110, 45–53. [Google Scholar] [CrossRef]
  4. Després, V.R.; Huffman, J.A.; Burrows, S.M.; Hoose, C.; Safatov, A.S.; Buryak, G.; Fröhlich-Nowoisky, J.; Elbert, W.; Andreae, M.O.; Pöschl, U.; et al. Primary biological aerosol particles in the atmosphere: A review. Tellus Ser. B 2012, 64, 15598. [Google Scholar] [CrossRef] [Green Version]
  5. Hameri, K.; Lahde, T.; Niemela, R.; Korhonen, P. Fine aerosols indoors and outdoors in downtown. J. Aerosol Sci. 2003, 2, S1359–S1360. [Google Scholar]
  6. Bombalska, A.; Mularczyk-Oliwa, M.; Kwaśny, M. Classification of the biological material with the use of FTIR spectroscopy and statistical analysis. Spectrochim. Acta Part A 2011, 78, 1221–1226. [Google Scholar] [CrossRef]
  7. Mularczyk-Oliwa, M.; Bombalska, A.; Kaliszewski, M.; Włodarski, M.; Kwaśny, M. Rapid discrimination of several fungus species with FTIR spectroscopy and statistical analysis. Bull. Mil. Acad. Technol. 2013, 62, 71–80. [Google Scholar]
  8. Foster, N.S.; Thompson, S.E.; Valentine, N.B.; Amonette, J.E.; Johnson, T.J. Identification of sporulated and vegetative bacteria using statistical analysis of Fourier transform mid-IR transmission data. Appl. Spectrosc. 2004, 58, 203–211. [Google Scholar] [CrossRef]
  9. Valentine, N.B.; Johnson, T.J.; Su, Y.F.; Forrester, J. FTIR Spectroscopy for Bacterial Spore Identification and classification. Proc. SPIE 2006, 6378, 144–153. [Google Scholar]
  10. Bombalska, A.; Mularczyk-Oliwa, M.; Jankiewicz, B.J.; Bartosewicz, B.; Gajda-Rączka, M.; Kaliszewski, M.; Włodarski, M.; Kwaśny, M.; Kopczyński, K.; Szpakowska, M.; et al. Applications of FTIR and SERS spectroscopy in analysis and discrimination of bacteria and their interferents. Biomed. Spectrosc. Image 2014, 3, 29–39. [Google Scholar] [CrossRef]
  11. Sengupta, A.; Laucks, M.L.; Dildine, N.; Drapala, E.; Davs, E.J. Bio-aerosol characterization by surface-enhanced Raman spectroscopy (SERS). J. Aerosol Sci. 2005, 36, 651–664. [Google Scholar] [CrossRef] [Green Version]
  12. Hill, S.C.; Pinnick, R.G.; Niles, S.; Fell, N.F.; Pan, Y.L.; Bottiger, J.; Bronk, B.V.; Holler, S.; Chang, R.K. Fluorescence from Airborne Microparticles: Dependence on Size, Concentration of Fluorophores, and Illumination Intensity. Appl. Opt. 2001, 40, 3005–3013. [Google Scholar] [CrossRef]
  13. Hill, S.C.; Williamson, C.C.; Doughty, D.C.; Pan, Y.L.; Santarpia, J.L.; Hill, H.H. Size-dependent fluorescence of bioaerosols: Mathematical model using fluorescing and absorbing molecules in bacteria. J. Quant. Spectrosc. 2015, 157, 54–70. [Google Scholar] [CrossRef] [Green Version]
  14. Pöhlker, C.; Huffman, J.A.; Pöschl, U. Autofluorescence of atmospheric bioaerosols—Fluorescent biomolecules and potential interferences. Atmos. Meas. Tech. 2012, 5, 37–71. [Google Scholar] [CrossRef] [Green Version]
  15. Sivaprakasam, V.; Lin, H.B.; Huston, A.L.; Eversole, J.D. Spectral characterization of biological aerosol particles using two-wavelength excited laser-induced fluorescence and elastic scattering measurements. Opt. Express 2011, 19, 6191–6208. [Google Scholar] [CrossRef] [PubMed]
  16. Savage, N.J.; Krentz, C.E.; Könemann, T.; Han, T.T.; Mainelis, G.; Pöhlker, C.; Huffman, J.A. Systematic characterization and fluorescence threshold strategies for the widebrand integrated bioaerosol sensor (WIBS) using size-resolved biological and interfering particles. Atmosfspheric Meas. Tech. 2017, 10, 4279–4302. [Google Scholar] [CrossRef] [Green Version]
  17. Taketani, F.; Kanaya, Y.; Nakamura, T.; Koizumi, K.; Moteki, M.; Takkegawa, N. Measurement of fluorescence spectra from atmospheric single submicron particle using laser-induced fluorescence technique. J. Aerosol Sci. 2013, 58, 1–8. [Google Scholar] [CrossRef]
  18. Babichenko, S.; Gala, J.L.; Bentahir, M.; Piette, A.S.; Poryvkina, L.; Rebane, O.; Smits, B.; Sobolev, I.; Soboleva, N. Non-Contact, Real Time Laser Induced Fluorescence Detection and Monitoring of Microbial Contaminants on Solid Surface Before, During and After Decontaminations. J. Biosens. Bioelectron. 2018, 9, 255. [Google Scholar]
  19. Trafny, E.A.; Lewandowski, R.; Stępińska, M.; Kaliszewski, M. Biological threat detection in the air and on the surface. How to define the risk. Arch. Immunol. Ther. Exp. 2014, 62, 253–261. [Google Scholar] [CrossRef]
  20. Gabbarini, V.; Rossi, R.; Ciparisse, J.-F.; Malizia, A.; Divizia, A.; De Filippis, P.; Anselmi, M.; Carestia, M.; Palombi, L.; Divizia, M.; et al. Laser- induced fluorescence (LIF) as a smart method for fast environmental virological analyser: Validation on Picornaviruses. Sci. Rep. 2019, 9, 12598. [Google Scholar] [CrossRef] [Green Version]
  21. Kwaśny, M.; Bombalska, A. Applications of Laser-Induced Fluorescence in Medicine. Sensors 2022, 22, 2956. [Google Scholar] [CrossRef]
  22. Rennie, M.Y.; Dunhan, D.; Lindvere-Teene, L.; Raizman, R.; Hill, R.; Linden, R. Understanding real time fluorescence signal from bacteria and wound tissues observed with Molecular i:XTM. Diagnostics 2019, 9, 22. [Google Scholar] [CrossRef] [PubMed] [Green Version]
  23. Ho, J. Future of biological aerosol detection. Anal. Chim. Acta 2002, 457, 125–148. [Google Scholar] [CrossRef]
  24. Eversole, J.D.; Cary, W.K.; Scotto, C.S.; Pierson, R.; Spence, M.; Campilo, A.J. Continuous bio-aerosol monitoring using UV excitation fluorescence: Outdoor test results. Field Anal. Chem. Tech. 2001, 5, 205–212. [Google Scholar] [CrossRef]
  25. Seaver, M.; Eversole, J.D.; Hardgrove, J.J.; Cary, W.K.; Roselle, D.C. Size and fluorescence measurement for field detection of biological aerosol. Aerosol Sci. Tech. 1999, 30, 174–185. [Google Scholar] [CrossRef]
  26. Fennely, T.; Sewell, G.; Prentice, M.B.; O’Connor, D.J.; Sodeau, J.R. Review: The use of real-time fluorescence instrumentation to monitor ambient primary biological aerosol particles (PBAP). Atmosphere 2017, 9, 1. [Google Scholar] [CrossRef] [Green Version]
  27. Huffman, J.A.; Perringc, A.E.; Savaged, N.J.; Clote, B.; Crouzye, B.; Tummone, F.; Shoshanimf, O.; Damitg, B.; Schneiderh, J.; Sivaprakasami, V.; et al. Real-time sensing of bioaerosols: Review and current perspectives. Aerosol Sci. Technol. 2020, 54, 465–495. [Google Scholar] [CrossRef] [Green Version]
  28. Šantl-Temkiv, T.; Sikoparija, B.; Maki, T.; Carotenuto, F.; Amato, P.; Yao, M.; Morris, C.E.; Schnell, R.; Jaenicke, R.; Pöhlker, C.; et al. Bioaerosol field measurements: Challenges and perspectives in outdoor studies. Aerosol Sci. Technol. 2020, 54, 520–546. [Google Scholar] [CrossRef]
  29. Huffman, J.A.; Santarpia, J. Online techniques for quantification and characterization of bio-logical aerosol. In Microbiology of Aerosols; Delort, A., Amato, P., Wiley, J., Eds.; John Wiley & Sons, Inc.: New York, NY, USA, 2017; pp. 83–114. [Google Scholar]
  30. Hairstone, P.P.; Ho, J.; Quant, F.R. Design of an instrument for real-time detection of bioaerosol using simultaneous measurement of particle aerodynamic size and intrinsic fluorescence. J. Aerosol Sci. 1997, 28, 471–482. [Google Scholar] [CrossRef]
  31. Pinnick, R.G.; Hill, S.C.; Nachman, P.; Videen, G.; Chen, G.; Chang, R.K. Aerosol fluorescence spectrum analyzer for rapid measurement of single micrometer-sized airborne biological particles. Aerosol Sci. Technol. 1998, 28, 95–104. [Google Scholar] [CrossRef]
  32. Kaliszewski, M.; Włodarski, M.; Młyńczak, J.; Leskiewicz, M.; Bombalska, A.; Mularczyk-Oliwa, M.; Kwaśny, M.; Buliński, D.; Kopczyński, K. A new real-time bio-aerosol fluorescence detector based on semiconductor excitation UV laser. J. AerosolSci. 2016, 100, 14–25. [Google Scholar] [CrossRef]
  33. Kaye, P.H.; Stanley, W.R.; Hirst, E.; Foot, E.V.; Baxter, K.L.; Barrington, S.J. Single particle multichannel bio-aerosol fluorescence sensor. Opt. Express 2005, 13, 3583–3593. [Google Scholar] [CrossRef] [PubMed] [Green Version]
  34. Pinnick, R.G.; Hill, S.C.; Pan, Y.L.; Chang, R.K. Fluorescence spectra of atmospheric aerosol at Adelphi, Maryland, USA: Measurement and classification of single particles containing organic carbon. Atmos. Environ. 2004, 38, 1657–1672. [Google Scholar] [CrossRef]
  35. Pan, Y.L.; Hartings, J.; Pinnick, R.G.; Hill, S.C.; Halverson, J.; Chang, R.K. Single-particle fluorescence spectrometer for ambient aerosols. Aerosol Sci. Res. 2003, 37, 1707–1709. [Google Scholar] [CrossRef] [Green Version]
  36. Choi, K.; Ha, Y.; Lee, H.K.; Lee, J. Development of a biological aerosol detector using laser-induced fluorescence and a particle collection system. Instrum. Sci. Technol. 2014, 42, 200–214. [Google Scholar] [CrossRef]
  37. Feugnet, G.; Lallier, E.; Gisard, A.; McIntosh, L.; Hellstrom, J.; Jelger, P.; Laurell, F.; Albano, C.; Kaliszewski, M.; Włodarski, M.; et al. Improved laser-induced fluorescence method for bio-attack early warning detection system. Proc. SPIE 2008, 7116, 53. [Google Scholar]
  38. Wojtanowski, J.; Zygmunt, M.; Muzal, M.; Knysak, P.; Młodzianko, A.; Gawlikowski, A.; Drozd, T.; Kopczyński, K.; Mierczyk, Z.; Kaszczuk, M.; et al. Perfomance verification of a LIF-LIDAR technique for stand-off detection and classification of biological agents. Opt. Laser Technol. 2015, 67, 25–32. [Google Scholar] [CrossRef]
  39. Lavoie, J.; Marchand, G.E.; Cloutier, Y.; Halle, S.; Nadeau, S.; Duchaine, C.; Pichette, G. Evaluation of bioaerosol exposures during hospital bronchoscopy examinations. Environ. Sci. Proc. 2015, 17, 288–299. [Google Scholar] [CrossRef]
  40. Handorean, A.; Robertson, C.E.; Harris, J.K.; Frank, D.; Hull, N.; Kotter, C.; Stevens, M.J.; Baumgardner, D.; Pace, N.R.; Hernandez, M. Microbial aerosol liberation from soiled textiles isolated during routine residuals handling in a modern health care setting. Microbiome 2015, 3, 72. [Google Scholar] [CrossRef] [Green Version]
  41. Bhangar, S.; Huffman, J.A.; Nazaroff, W.W. Size-resolved fluorescent biological aerosol particle concentrations and occupant emissions in a university classroom. Indoor Air 2014, 24, 604–617. [Google Scholar] [CrossRef]
  42. Xie, Y.Y.; Fajardo, O.A.; Yan, W.Z.; Zhao, B.; Jiang, J.K. Six-day measurement of size-resolved indoor fluorescent bioaerosols of outdoor origin in an office. Particuology 2017, 31, 161–169. [Google Scholar] [CrossRef]
  43. Bhangar, S.; Adams, R.I.; Pasut, W.; Huffman, J.A.; Arens, E.A.; Taylor, J.W.; Bruns, T.D.; Nazaroff, W.W. Chamber bioaerosol study: Human emissions of size-resolved fluorescent biological aerosol particles. Indoor Air 2016, 26, 193–206. [Google Scholar] [CrossRef] [Green Version]
  44. Hallar, A.G.; Chirokova, G.; McCubbin, I.; Painter, T.H.; Wiedinmyer, C.; Dodson, C. Atmospheric bioaerosols transported via dust storms in the western United States. Geophys. Res. Lett. 2011, 38, L17801. [Google Scholar] [CrossRef] [Green Version]
  45. Whitehead, J.D.; Darbyshire, E.; Brito, J.; Barbosa, H.M.J.; Crawford, I.; Stern, R.; Gallagher, M.W.; Kaye, P.H.; Allan, J.D.; Coe, H.; et al. Biogenic cloud nuclei in the central Amazon during the transition from wet to dry season. Atmos. Chem. Phys. 2016, 16, 9727–9743. [Google Scholar] [CrossRef] [Green Version]
  46. Valsan, A.E.; Ravikrishna, R.; Biju, C.V.; Pöhlker, C.; Després, V.R.; Huffman, J.A.; Pöschl, U.; Gunthe, S.S. Fluorescent biological aerosol particle measurements at a tropical high-altitude site in southern India during the southwest monsoon season. Atmos. Chem. Phys. 2016, 16, 9805–9830. [Google Scholar] [CrossRef] [Green Version]
  47. Saari, S.; Niemi, J.V.; Ronkko, T.; Kuuluvainen, H.; Jarvinen, A.; Pirjola, L.; Aurela, M.; Hillamo, R.; Keskinen, J. Seasonal and Diurnal Variations of Fluorescent Bioaerosol Concentration and Size Distribution in the Urban Environment. Aerosol Air Qual. Res. 2015, 15, 572–581. [Google Scholar] [CrossRef] [Green Version]
  48. Yu, X.; Wang, Z.; Zhang, M.; Kuhn, U.; Xie, Z.; Cheng, Y.; Pöschl, U.; Su, H. Ambient measurement of fluorescent aerosol particles with a WIBS in the Yangtze River Delta of China: Potential impacts of combustion-related aerosol particles. Atmos. Chem. Phys. 2016, 16, 11337–11348. [Google Scholar] [CrossRef] [Green Version]
  49. O’Connor, D.J.; Healy, D.A.; Sodeau, J.R. A 1-month online monitoring campaign of ambient fungal spore concentrations in the harbour region of Cork, Ireland. Aerobiologia 2015, 31, 295–314. [Google Scholar] [CrossRef]
  50. Mason, R.H.; Si, M.; Li, J.; Chou, C.; Dickie, R.; Toom-Sauntry, D.; Pöhlker, C.; Yakobi-Hancock, J.D.; Ladino, L.A.; Jones, K.; et al. Ice nucleating particles at a coastal marine boundary layer site: Correlations with aerosol type and meteorological conditions. Atmos. Chem. Phys. 2015, 15, 12547–12566. [Google Scholar] [CrossRef] [Green Version]
  51. Twohy, C.H.; McMeeking, G.R.; DeMott, P.J.; McCluskey, C.S.; Hill, T.C.J.; Burrows, S.M.; Kulkarni, G.R.; Tanarhte, M.; Kafle, D.N.; Toohey, D.W. Abundance of fluorescent biological aerosol particles at temperatures conducive to the formation of mixed-phase and cirrus clouds. Atmos. Chem. Phys. 2016, 16, 8205–8225. [Google Scholar] [CrossRef] [Green Version]
  52. Crawford, I.; Lloyd, G.; Herrmann, E.; Hoyle, C.R.; Bower, K.N.; Connolly, P.J.; Flynn, M.J.; Kaye, P.H.; Choularton, T.W.; Gallagher, M.W. Observations offluorescent aerosol-cloud interactions in the free tropo-sphere at the high-altitude research station Jungfraujoch. Atmos. Chem. Phys. 2016, 16, 2273–2284. [Google Scholar] [CrossRef] [Green Version]
  53. D’Amato, G.; Vitale, C.; Lanza, M.; Molino, A.; D’Amato, M. Climate change, air pollution, and allergic respiratory diseases: An update.Current Opin. Allergy Clin. Immunol. 2016, 16, 434–440. [Google Scholar]
  54. Smith, D.J.; Ravichandar, J.D.; Jain, S.; Griffin, D.W.; Yu, H.; Thissen, J.; Lusby, T.; Nicoll, P.; Shedler, S.; Martinez, P.; et al. Airborne bacteria in earth’s lower stratosphere resemble taxa detected in the troposphere: Results from a new NASA aircraft bioaerosol collector (ABC). Front. Microbiol. 2018, 9, 1752. [Google Scholar] [CrossRef] [PubMed]
  55. Erkara, I.P.; Asan, A.; Yilmaz, V.; Pehlivan, S.; Okten, S.S. Airborne Alternaria and Cladosporium species and relationship with meteorological conditions in Eskisehir City, Turkey. Environ. Monitor. Assess. 2008, 144, 31–41. [Google Scholar] [CrossRef] [PubMed]
  56. Liu, H.; Zhang, X.; Zhang, H.; Yao, X.; Zhou, M.; Wang, J.; He, Z.; Zhang, H.; Lou, L.; Mao, W.; et al. Effect of air pollution on the total bacteria and pathogenic bacteria in different sizes of particulate matter. Ecotoxicol. Environ. Saf. 2018, 233, 483–493. [Google Scholar] [CrossRef]
  57. Prussin, A.J.; Schwake, D.O.; Marr, L.C. Ten questions concerning the aerosolization and transmission of Legionella in the built environment. Build. Environ. 2017, 123, 684–695. [Google Scholar] [CrossRef]
  58. Evans, S.E.; Dueker, M.E.; Logan, J.R.; Weathers, K.C. The biology of fog: Results from coastal Maine and Namib Desert reveal common drivers of fog microbial composition. Sci. Total Environ. 2019, 647, 1547–1556. [Google Scholar] [CrossRef]
  59. Kakikawa, M.; Kobayashi, F.; Maki, T.; Yamada, M.; Higashi, T.; Chen, B.; Shi, G.; Hong, C.; Tobo, Y.; Iwasaka, Y. Dustborne microorganisms in the atmosphere over an Asian dust source region, Dunhuang. Air Qual. Atm. Health 2008, 1, 195–202. [Google Scholar] [CrossRef] [Green Version]
  60. Frischknecht, F. The history of biological warfare. EMBO Rep. 2003, 4, 47–52. [Google Scholar] [CrossRef]
  61. Atlas, R.A. Bioterrosims before and after September 11. Crit. Rev. Microbiol. 2001, 27, 355–379. [Google Scholar] [CrossRef]
  62. Leitenberg, M. Biological weapons in the twentieth century: A review and analysis. Crit. Rev. Microbiol. 2001, 27, 267–320. [Google Scholar] [CrossRef] [PubMed]
  63. Lewandowski, R.; Kozłowska, K.; Szpakowska, M.; Stępińska, M.; Trafny, E.A. Use of a foam spatula for sampling surfaces after bioaerosol deposition. Appl. Environ. Microbiol. 2010, 76, 688–694. [Google Scholar] [CrossRef] [PubMed] [Green Version]
  64. Włodarski, M.; Kaliszewski, M.; Trafny, E.A.; Szpakowska, M.; Lewandowski, R.; Bombalska, A.; Kwaśny, M.; Kopczyński, K.; Mularczyk-Oliwa, M. Fast, reagentless and reliable screening of “white powders” during the bioterrorism hoaxes. Forensic Sci. Int. 2015, 248, 71–77. [Google Scholar] [CrossRef] [PubMed]
  65. Włodarski, M.; Kaliszewski, M.; Kwaśny, M.; Kopczyński, K.; Zawadzki, Z.; Mierczyk, Z.; Młyńczak, J. Fluorescence excitation-emission matrices of selected biological materials. Proc. SPIE 2006, 6398, 11–22. [Google Scholar]
  66. Lakowicz, J.R. Principles of Fluorescence Spectroscopy, 3rd ed.; Springer: Singapore, 2006. [Google Scholar]
  67. Gabey, A.M.; Stanley, W.R.; Gallagher, M.W.; Kaye, P.H. The fluorescence properties of aerosol larger than 0.8 mm in urban and tropical rainfores location. Atmos.Chem. Phys. 2011, 11, 5491–5504. [Google Scholar] [CrossRef] [Green Version]
  68. O’Connor, D.J.; Iacopino Healy, D.; Daniela Healy, D.A.; O’Sullivan, D.; Sodeau, J.R. The intrinsic fluorescence spectra of selected pollen and fungal spores. Atm. Environ. 2011, 45, 5491–5504. [Google Scholar] [CrossRef]
  69. Ammor, M.S. Recent advances in the use of intrinsic fluorescence for bacterial identification and characterization. J. Fluoresc. 2007, 17, 455–459. [Google Scholar] [CrossRef]
  70. Alimova, A.; Katz, A.; Siddigue, M.; Minko, G.; Savage, H.E.; Shah, M.K.; Rosen, R.B.; Alfano, R.R. Native fluorescence changes by bactericidal agents. IEEE Sens. J. 2005, 5, 704–710. [Google Scholar] [CrossRef]
  71. Heaton, H.I. Principal Component Analysis of fluorescence cross-section spectra from pathogenic and simulant bacteria. Appl. Opt. 2005, 44, 6486–6494. [Google Scholar] [CrossRef]
  72. Tjarnhage, T.; Stromqvist, M.; Squirrell, D.; Burke, J.; Ho, J.; Spence, M. Multivariate data analysis of fluorescence signals from biological signals from biological aerosols. Field Anal. Chem. Tech. 2001, 5, 171–176. [Google Scholar]
  73. Berezin, M.Y.; Achilefu, S. Fluorescence lifetime measurements and biological imaging. Chem. Rev. 2010, 110, 2641–2684. [Google Scholar] [CrossRef] [PubMed] [Green Version]
  74. James, D.R.; Siemiarczuk, A.; Ware, W.R. Stroboscopic optical boxcar technique for the determination of fluorescence lifetimes. Rev. Sci. Instr. 1992, 63, 1710–1716. [Google Scholar] [CrossRef]
  75. Włodarski, M.; Kwaśny, M.; Kopczyński, K. Stroboscopic technique for measurement of fluorescence lifetimes of bacteria and biological interferents. Proc. SPIE 2006, 6398, 98–108. [Google Scholar]
  76. Kaye, P.H.; Eyles, N.A.; Ludlow, L.K.; Clark, J.M. An instrument for the Classification of Airborne Particles on the Basis of Size, Shape and Count Frequency. Atmos. Environ. 1991, 25, 645–654. [Google Scholar] [CrossRef]
  77. Kaye, P.H. Spatial light-scattering analysis as a means of characterizing and classifying non-sperical particles. Meas. Sci. Technol. 1998, 9, 141–149. [Google Scholar] [CrossRef]
  78. Keye, P.H.; Aptowicz, K.; Chang, R.K.; Foot, V.; Videen, G. Angularly Resolved Scattering from Aiborne Particles. In Optics of Biological Particles; Hoeksra, A., Maltsew, V., Videen, G., Eds.; Springer: Berlin/Heidelberg, Germany, 2007; pp. 31–62. [Google Scholar]
  79. Kaliszewski, M.; Trafny, E.A.; Włodarski, M.; Lewandowski, R.; Stępińska, M.; Kwaśny, M.; Kostecki, J.; Kopczyński, K. Real-time analysis and classification of bioaerosols based on optical scattering properties. Bull. Mil. Acad. Technol. 2017, 66, 27–40. [Google Scholar] [CrossRef]
  80. Pinnick, R.G.; Hill, S.C.; Nachman, P.; Pendleton, J.D.; Fernandez, G.L.; Mayo, M.W.; Bruno, J.G. Fluorescence particle counter for detecting airborne bac-teria and other biological particles. Aerosol Sci. Technol. 1995, 23, 653–664. [Google Scholar] [CrossRef] [Green Version]
  81. Pan, Y.L.; Pinnick, R.G.; Hill, S.C.; Rosen, J.M.; Chang, R.K. Single-particle laser-induced-fluorescence spectra of biological and other organic-carbon aerosols in the atmosphere: Measurements at New Haven, Connecticut, and Las Cruces, New Mexico. J. Geophys. Res. 2007, 112, D24S19. [Google Scholar] [CrossRef]
  82. Hill, S.C.; Pinnick, R.G.; Niles, S.; Pan, Y.L.; Holler, S.; Chang, R.K.; Bottiger, J.; Chen, B.T.; Orr, C.S.; Feather, G. Real-time measurement of fluorescence spectra from single airborne biological particles. Field Anal. Chem. Technol. 1999, 4–5, 221–239. [Google Scholar] [CrossRef]
  83. Pan, Y.L.; Cobler, P.; Rhodes, S.; Potter, A.; Chou, T.; Holler, S.; Chang, R.K.; Pinnick, R.G.; Wolf, J.P. High-speed, high-sensitivity aerosol fluorescence spectrum detection using a 32-anode photomultiplier tube detector. Rev. Sci. Instrum. 2001, 72, 1831–1836. [Google Scholar] [CrossRef]
  84. Pan, Y.L.; Hill, S.C.; Pinnick, R.G.; Huang, H.; Bottiger, J.R.; Chang, R.K. Fluorescence spectra of atmospheric aerosol particles measured using one or two excitation wavelengths: Comparison of classification schemes employing different emission and scattering results. Opt. Express 2010, 18, 12436–12457. [Google Scholar] [CrossRef] [PubMed]
  85. Agranovski, V.; Ristovski, Z.; Hargreaves, M.; Blackall, P.J.; Morawska, L. Performance evaluation of the UVAPS: Influence of physiological age of airborne bacteria and bacterial stress. Aeros. Sci. 2003, 34, 301–317. [Google Scholar] [CrossRef] [Green Version]
  86. Agranovski, V.; Ristovski, Z.D.; Ayoko, G.A.; Morawska, L. Performance evaluation of the UVAPS in measuring biological aerosols: Fluorescence spectra from NAD(P)H coenzymes and riboflavin. Aerosol Sci. Tech. 2004, 38, 354–364. [Google Scholar] [CrossRef] [Green Version]
  87. Agranovski, V.; Ristovski, Z.D. Real-time monitoring of viable bioaerosols: Capability of the UVAPS to predict the amount of individual microorganisms in aerosol particles. J. Aerosol Sci. 2005, 36, 665–676. [Google Scholar] [CrossRef] [Green Version]
  88. Huffman, J.A.; Treutlein, B.; Pöschl, U. Fluorescent biological aerosol particle concentrations and size distributions measured with an Ultraviolet Aerodynamic Particle Sizer (UVAPS) in Central Europe. Atmos. Chem. Phys. 2010, 10, 3215–3233. [Google Scholar] [CrossRef] [Green Version]
  89. Huffman, J.A.; Sinha, B.; Garland, R.M.; Snee-Pollmann, A.; Gunthe, S.S.; Artaxo, P.; Martin, S.T.; Andreae, M.O.; Pöschl, U. Size distributions and temporal variations of biological aerosol particles in the Amazon rainforest characterized by microscopy and real-time UV-APS fluorescence techniques during AMAZE-08. Atmos. Chem. Phys. 2012, 12, 11997–12019. [Google Scholar] [CrossRef] [Green Version]
  90. Kanaani, H.; Hargreaves, M.; Ristovski, Z.; Morawska, L. Performance assessment of UVAPS: Influence of fungal spore age and air exposure. J. Aerosol Sci. 2007, 38, 83–96. [Google Scholar] [CrossRef] [Green Version]
  91. Primmerman, C.A. Detection of biological agents. Linc. Lab. 2000, 12, 3–32. [Google Scholar]
  92. Grometstein, A. MIT Lincoln Laboratory: Technology in Support of National Security 201; Lincoln Laboratory: Lexington, KY, USA, 2001; pp. 45–49. [Google Scholar]
  93. Lynch, E.J.; Bogucki, M.I.; Gardner, P.J.; Hyttinen, L. Biological agent warning sensor (baws): Laser-induced fluorescence as the joint biological point detec-tion system trigger. In Chemical and Biological Sensing VI; Gardner, P.J., Ed.; International Society for Optics and Photonics: Orlando, FL, USA, 2005; pp. 75–79. [Google Scholar]
  94. Eversole, J.D.; Hardgrove, J.J.; Cary, W.K.; Choulas, D.P.; Seaver, M. Continuous, rapid biological aerosol detection with the use of UV fluorescence: Outdoor test results. Field Anal. Chem. Technol. 1999, 3, 4249–4259. [Google Scholar] [CrossRef]
  95. Jeys, T.H.; Herzog, W.D.; Hybl, J.D.; Czerwinski, R.N.; Sanchez, A. Advanced trigger development. Linc. Lab. 2007, 17, 29–62. [Google Scholar]
  96. DeFreez, R. LIF bio-aerosol threat triggers: Then and now. In Optically Based Biological and Chemical Detection for Defence; V International Society for Optics and Photonics: Berlin, Germany, 2009; p. 74840H. [Google Scholar]
  97. Sivaprakasam, V.; Pletcher, T.; Tucker, J.E.; Huston, A.L.; McGinn, J.; Keller, D.; Eversole, J.D. Classification and selective collection of individual aerosol particles using laser-induced fluorescence. Appl. Opt. 2009, 48, 126–136. [Google Scholar] [CrossRef] [PubMed]
  98. Foot, V.E.; Kaye, P.H.; Stanley, W.R.; Barrington, S.J.; Gallagher, M.; Gabey, A. Low-cost real-time multi-parameter bio-aerosol sensors. Proc. SPIE 2008, 7116, 711601. [Google Scholar]
  99. Kaye, P.H.; Barton, J.E.; Hirst, E.; Clark, J.M. Simultaneous light scattering and intrinsic fluorescence measurement for the classification of airborne particles. Appl. Opt. 2000, 39, 3738–3745. [Google Scholar] [CrossRef] [PubMed] [Green Version]
  100. Clark, J.M.; Shelton, M.J.; Evans, S.P.; Smith, P.D.; Simpson, I.A.; Kaye, P.H. A new real-time biological agent characterisation system. Proc. SPIE 2005, 5990, 59900Z. [Google Scholar] [CrossRef]
  101. Ruske, S.D.; Topping, O.; Foot, V.E.; Kaye, P.H.; Stanley, W.R.; Crawford, I.; Morse, A.P.; Gallagher, M.W. Evaluation of machine learning algorithms for classification of primary biological aerosol using a new UV-LIF spectrometer. Atmos. Meas. Tech. 2017, 10, 695. [Google Scholar] [CrossRef] [Green Version]
  102. Ruske, S.; Topping, D.O.; Foot, V.E.; Morse, A.P.; Gallagher, M.W. Machine learning for improved data analysis of biological aerosol using the WIBS. Atmos. Meas. Tech. 2018, 11, 6203–6230. [Google Scholar] [CrossRef] [Green Version]
  103. Könemann, T.; Savage, N.; Klimach, T.; Walter, D.; Fröhlich-Nowoisky, J.; Su, H.; Pöschl, U.J.; Huffman, A.; Pöhlker, C. Spectral intensity bioaerosol sensor (SIBS): An instrument for spectrally resolved fluorescence detection of single particles in real time. Atmos. Meas. Tech. 2019, 12, 1337–1363. [Google Scholar] [CrossRef] [Green Version]
  104. Crouzy, B.; Stella, M.; Konzelmann, T.; Calpini, B.; Clot, B. All-optical automatic pollen identification: Towards an operational system. Atmos. Environ. 2016, 140, 202–212. [Google Scholar] [CrossRef]
  105. Sauliene, I.; Sukiene, L.; Daunys, G.; Valiulis, G.; Vaitkevicius, L.; Matavulj, P.; Brdar, S.; Panic, M.; Sikoparija, B.; Clot, B.; et al. Automatic pollen recogni-tion with the rapid-e particle counter: The first-level procedure, experience and next steps. Atmos. Meas. Tech. 2019, 12, 3435–3452. [Google Scholar] [CrossRef] [Green Version]
  106. Kiselev, D.; Bonacina, L.; Wolf, P. Individual bioaerosol particle discrimination by multi-photon excited fluorescence. Opt. Express 2011, 19, 24516–24521. [Google Scholar] [CrossRef] [Green Version]
  107. Kiselev, D.; Bonacina, L.; Wolf, J.P. A flash-lampbased device for fluorescence detection and identificationof individual pollen grains. Rev. Sci. Instrum. 2013, 84, 033302. [Google Scholar] [CrossRef] [PubMed] [Green Version]
  108. Kanaani, H.; Hargreaves, M.; Ristovski, Z.; Morawska, L. Deposition rates of fungal spores in indoor envi-ronments, factors effecting them and comparison with non-biological aerosols. Atmos. Environ. 2008, 42, 7141–7154. [Google Scholar] [CrossRef] [Green Version]
  109. Pereira, M.L.; Knibbs, L.D.; He, C.; Grzybowski, P.; Johnson, G.R.; Huffman, J.A.; Bell, S.C.; Wainwright, C.E.; Matte, D.L.; Dominski, F.H.; et al. Sources and dynamics of fluorescent particles in hospitals. Indoor Air 2017, 27, 988–1000. [Google Scholar] [CrossRef] [PubMed]
  110. Wei, K.; Zou, Z.L.; Zheng, Y.H.; Li, J.; Shen, F.X.; Wu, C.Y.; Wu, Y.S.; Hu, M.; Yao, M.S. Ambient bioaerosol particle dynamics observed during haze and sunny days in Beijing. Sci. Total Environ. 2016, 550, 751–759. [Google Scholar] [CrossRef] [PubMed]
  111. Schumacher, C.J.; Pöhlker, C.; Aalto, P.; Hiltunen, V.; Kulmala, M.; Pöschl, U.; Huffman, J.A. Seasonal cycles of fluorescent biological aerosol particles in boreal and semi-arid forests of Finland and Colorado. Atmos. Chem. Phys. 2013, 13, 11987–12001. [Google Scholar] [CrossRef] [Green Version]
  112. Pöschl, U.; Martin, S.T.; Sinha, B.; Chen, Q.; Gunthe, S.S.; Huffman, J.A.; Borrmann, S.; Farmer, D.K.; Garland, R.M.; Helas, G.; et al. Rainforest aerosols as biogenic nuclei of clouds and precipitation in the Amazon. Science 2010, 329, 1513–1516. [Google Scholar] [CrossRef] [Green Version]
  113. Huffman, J.A.; Prenni, A.J.; DeMott, P.J.; Pöhlker, C.R.; Mason, H.; Robinson, N.H.; Fröhlich-Nowoisky, J.F.; Tobo, Y.; Despres, V.; Garcia, E.; et al. High concentra-tions of biological aerosol particles and ice nuclei during and after rain.Atmos. Chem. Phys. 2013, 13, 6151–6164. [Google Scholar]
  114. Pan, Y.L.; Santarpia, J.L.; Ratnesar-Shumate, S.; Corson, E.; Eshbaugh, J.; Hill, S.C.; Williamson, C.C.; Coleman, M.; Bare, C.; Kinahan, S. Effects of ozone and relative humidity on fluorescence spectra of octapeptide bioaerosol particle. J. Quant. Spectrosc. Radiat. Transfer 2014, 133, 538–550. [Google Scholar] [CrossRef] [Green Version]
  115. Saari, S.; Mensah-Attipoe, J.; Reponen, T.; Veijalainen, A.M.; Salmela, A.; Pasanen, P.; Keskinen, J. Effects of fungal species, cultivation time, growth substrate, and air exposure velocity on the fluorescence properties of air-borne fungal spores. Indoor Air 2015, 25, 653–661. [Google Scholar] [CrossRef]
  116. Brosseau, L.M.; Vesley, D.; Rice, N.; Goodell, K.; Nellis, M.; Hairston, P. Differences in detected fluorescence among several bacterial species measured with a direct-reading particle sizer and fluorescence detector. Aerosol Sci. Technol. 2000, 32, 545–558. [Google Scholar] [CrossRef]
  117. Kaye, P.H.; Hirst, E.; Foot, V.E.; Clark, J.M.; Baxter, K. A low-cost multichannel aerosol fluorescence sensor for networked deployment. Proc. SPIE 2004, 5617, 388–398. [Google Scholar]
  118. Ziemba, L.D.; Beyersdorf, A.J.; Chen, G.; Corr, C.A.; Crumeyrolle, S.N.; Diskin, G.; Hudgins, C.; Martin, R.; Mikoviny, T.; Moore, R.; et al. Airborne observations of bioaerosol over the Southeast United States using a Wideband Integrated Bioaerosol Sensor. J. Geophys. Res. Atmos. 2016, 121, 8506–8524. [Google Scholar] [CrossRef] [Green Version]
  119. Healy, D.A.; O’Connor, D.J.; Burke, A.M.; Sodeau, J.R. A laboratory assessment of the Waveband Integrated Bioaerosol Sensor (WIBS-4) using individual samples of pollen and fungal spore material. Atmos. Environ. 2012, 60, 534–543. [Google Scholar] [CrossRef]
  120. Healy, D.A.; Huffman, J.A.; O’Connor, D.J.; Pöhlker, C.; Pöschl, U.; Sodeau, J.R. Ambient measurements of biological aerosol particles near Killarney, Ireland: A comparison between real-time fluorescence and microscopy techniques. Atmos. Chem. Phys. 2014, 14, 8055–8069. [Google Scholar] [CrossRef] [Green Version]
  121. Perring, A.E.; Schwarz, J.P.; Baumgardner, D.; Hernandez, M.T.; Spracklen, D.V.; Heald, C.L.; Gao, R.S.; Kok, G.; McMeekin, G.R.; McQuaid, J.B.; et al. Airborne observations of regional variation in fluorescent aerosol across the United States. J. Geophys. Res. Atmos. 2015, 120, 1153–1170. [Google Scholar] [CrossRef]
  122. Hernandez, M.; Perring, A.E.; McCabe, K.; Kok, G.; Granger, G.; Baumgardner, D. Chamber catalogues of optical and fluorescent signatures distinguish bioaerosol classes. Atmos. Meas. Tech. 2016, 9, 3283–3292. [Google Scholar] [CrossRef] [Green Version]
  123. Leśkiewicz, M.; Kaliszewski, M.; Włodarski, M.; Młyńczak, J.; Mierczyk, Z.; Kopczyński, K. Improved real-time bio-aerosol classification using artificial neural networks. Atmos. Meas. Tech. 2018, 11, 6259–6270. [Google Scholar] [CrossRef] [Green Version]
  124. Kopczyński, K.; Kwasny, M.; Mierczyk, Z.; Zawadzki, Z. Laser induced fluorescence system for detection of biological agents: European project FABIOLA. Proc. SPIE 2005, 5945, 30–41. [Google Scholar]
  125. Rostedt, A.; Putkiranta, M.; Marjamaki, M.; Keskinen, M.; Janka, K.; Reinivaara, R.; Holma, L. Optical chamber design for aerosol particle fluorescent measurement. Proc. SPIE 2006, 6398, 88–97. [Google Scholar]
  126. Feugnet, G.; Grisard, A.; Lallier, E. Widely tunable pulsed UV source for laser-induced fluorescence of bioaerosols. Proc. SPIE 2006, 6398, 208–221. [Google Scholar]
  127. Measures, R.M. Laser Remote Sensing: Fundamentals and Applications; Krieger Pub. Co.: Malabar, FL, USA, 1992. [Google Scholar]
  128. Mensah, F.E. Lidar Techniques and Remote Sensing of the Atmosphere: Understanding the Use of Laser Light in the Atmosphere; Author House: Bloomington, IN, USA, 2009. [Google Scholar]
  129. Wojtanowski, J. The Applications of Multispectral Fluorescence LIDAR Technique for Stand-Off Detection of Biological Aerosols. Ph.D. Dissertation, Military University of Technology, Warsaw, Poland, 2011. [Google Scholar]
  130. Mierczyk, Z.; Zygmunt, M.; Gawlikowski, A.; Gietka, A.; Kaszczuk, M.; Knysak, P. Two-wavelength backscattering lidar for stand-off detection of aerosols. Proc SPIE 2008, 7111, 152–160. [Google Scholar]
  131. Gelbwach, J.; Birnbaum, M. Fluorescence of atmospheric aerosols and lidar implications. Appl. Opt. 1973, 12, 244. [Google Scholar] [CrossRef] [PubMed]
  132. Simard, J.R.; Roy, G.; Mathieu, P.; Larochelle, V.; McFee, J.; Ho, J. Standoff Sensing of Bioaerosols Using Intensified Range-Gated Spectral Analysis of Laser-Induced Fluorescence. IEEE Trans. Geosci. Remote Sens. 2004, 42, 865–874. [Google Scholar] [CrossRef]
  133. Christesen, S.; Merrow, D.; Desha, M.S.; Wong, A.; Wilson, M.W.; Butler, J.C. Ultraviolet fluorescence lidar detection of bioaerosols. SPIE Proc. 1994, 222, 228–237. [Google Scholar]
  134. Buteau, S.; Lahaie, P.; Rowsell, S.; Rustad, G.; Baxter, K.; Castle, M.; Foot, V.; Vanderbeek, R.; Warren, R. Laser Based Stand-Off Detection of Biological Agents; NATO Report RTO-TR-SET; NATO: Brussels, Belgium, 2010. [Google Scholar]
  135. Joshi, D.; Kumar, D.; Maini, A.K.; Sharma, R.C. Detection of biological warfare agents using ultra violet-laser induced fluorescence LIDAR. Spectrochim. Acta Part A 2013, 112, 446–456. [Google Scholar] [CrossRef]
  136. Richardson, J.M.; Aldridge, J.C.; Milstein, A.B. Polarimetric lidar signatures for remote detection of bio-logical warfare agents. In Polarization: Measurement, Analysis, and Remote Sensing; Chenault, D.B., Goldstein, D.H., Eds.; SPIE: Bellingham, WA, USA, 2008. [Google Scholar]
  137. Buteau, S.; Simard, J.R.; Lahaie, P.; Roy, G.; Mathieu, P.; Dery, B.; Ho, J.; McFee, J. Bioaerosol standoff monitoring using intensified range-gated laser-induced fluorescence spectroscopy. In Advanced Environmental Monitoring; Kim, Y.J., Platt, U., Eds.; Aerosol Science and Technology; Springer: Dordrecht, The Netherlands, 2008; pp. 203–216. [Google Scholar]
  138. Brydegaard, M.; Guan, Z.; Wellenreuther, M.; Svanberg, S. Insect monitoring with fluorescence lidar techniques: Feasibility study. Appl. Opt. 2009, 48, 5668–5677. [Google Scholar] [CrossRef]
  139. Sassen, K. Boreal tree pollen sensed by polarization lidar: Depolarizing biogenic chaff. Geophys. Res. Lett. 2008, 35, L18810. [Google Scholar] [CrossRef]
  140. Saito, Y.; Ichihara, K.; Morishita, K.; Uchiyama, K.; Kobayashi, F.; Tomida, T. Remote detection of the fluorescence spectrum of natural pollens floating in the atmosphere using a laser-induced-fluorescence spectrum (LIFS) lidar. Remote Sens. 2018, 10, 1533. [Google Scholar] [CrossRef] [Green Version]
  141. Achey, A.; Bufton, J.; Dawson, J.; Huang, W.; Lee, S.; Mehta, N.; Prasad, C. An Enhanced Multi-wavelength Ultraviolet Biological Trigger Lidar. Proc. SPIE 2004, 5617, 87–92. [Google Scholar]
Figure 1. Sizes of the organisms and their interferents.
Sensors 23 03339 g001
Figure 2. Scheme of the system for measuring the spectra of single particles.
Sensors 23 03339 g002
Figure 3. EX-EM matrices of the bacteria and their interferents.
Sensors 23 03339 g003
Figure 4. EM-EX matrices of the technical spores.
Sensors 23 03339 g004
Figure 5. PCA of the EM-EX of the biological materials (description as in Table 1).
Sensors 23 03339 g005
Figure 6. Fluorescence decay curves of NATA and coenzyme NADH.
Sensors 23 03339 g006
Figure 7. Fluorescence decay characteristics for vegetative forms of bacteria (S.E—Staphyllococcus epidermis, E.Cl—Enterobacter cloacae, E.C—Escerica coli, B.S.—Bacillus subtilis, P.F.—Pseudomonas Fluorescens).
Sensors 23 03339 g007
Figure 8. Particle size and size distribution and the SEM image of the chosen particles.
Sensors 23 03339 g008
Figure 9. Aerosol particle characteristics measured with a UV-APS analyzer.
Sensors 23 03339 g009
Figure 10. The single-shot spectra from individual particles.
Sensors 23 03339 g010
Figure 11. The idea of single particle measurements.
Sensors 23 03339 g011
Figure 12. Construction of the particle concentrator and view of the chamber.
Sensors 23 03339 g012
Figure 13. Schematic of the OPG laser.
Sensors 23 03339 g013
Figure 14. Schematic diagram of the four-channel bioanalyzer: F1–F4—optical filters.
Sensors 23 03339 g014
Figure 15. Emission characteristics of a single particle of BG.
Sensors 23 03339 g015
Table 1. Examples of the disease and its pathogens.
InfectionPathogenDiameter [µm]
AnthraxBacillus anthracis1–4
BotulismClostridium botulinum1–5
PlagueVibrio cholerae0.5–0.8
TularemiaFrancisella Tularemia0.2–0.7
SmallpoxMariola Major0.15–0.3
Table 2. Biological sample list and their abbreviations.
No.NameSourceAbbreviation
Vegetative bacteria
1Bacillus atrophaeus var. globigiiATCC 9372BG
2Bacillus cereusATCC 14579BC
3Bacillus megateriumPCM 2006BM
4Bacillus subtilisATCC 6333BS
5Bacillus thuringiensisATCC 10792BT
5Micrococus luteusATCC 4698ML
6Escherichia ColiATCC 25922EC
Endospores
7Bacillus atrophaeus endosporesATCC 9372BGs
8Bacillus cereus endosporesATCC 14579BCs
9Bacillus megaterium endosporesPCM 2006BMs
10Bacillus subtilis endosporesATCC 6333BSs
11Bacillus thuringiensis endosporesATCC 10792BTs
Technical spores
12Bacillus atrophaeus sporesMIHEBGst
13Bacillus anthracis sporesMIHEBAst
14Bacillus thuringiensis spores (TUREX)PVTT (Finland)BTst
Fungi
15Alternaria alternataATCC 6663AA
16Candida albicansATCC 18804CA
17Cladosporum herbarumATCC 28987CLH
18Penicillium chrysogenumATCC 9197PCH
19Penicillium brevicompactumATCC 9056PBC
Pollens
20Bermuda grass pollenDuke Scientific Corp.BER
21Corn pollenDuke Scientific Corp.COR
22Paper mulberry pollenDuke Scientific Corp.PAP
23Ragweed pollenDuke Scientific Corp.RAG
24Johnsons Grass Smut sporesDuke Scientific Corp.JONs
25Secale cereale pollenSigma-AldrichSEC
Other
26OvalbuminSigma-AldrichOVA
26Bacteriophage MS2MIHEMS2
Table 3. Overview of the instruments for detecting bioaerosols.
Instrument/MethodFirmEX [nm]References
Laboratory systemArmy Research Laboratory (ARL)488[34,35,80,81,82,83,84]
Fluorescence aerodynamic particle sizer (UVAPS) and military version (FLAPS)Canadian Defense Research Establishment TSI355[85,86,87,88,89,90]
Biological aerosol warning system (BAWS)MIT, Lincoln Laboratory
(LL, Lexington, MA, USA)
266[91,92,93]
Elastic scattering-cued fluorescence sensorNaval Research Laboratory (NRL)266[25,94]
Rapid agent aerosol detector (RAAD)LL NRL
Edgewood Chemical and Biological Center
266
355
[15,95,96,97,98]
WIBSBIRAL, University of Hertfordshire and Defense Science Technology Laboratories
(Dstl, UK)
280[33,78,98,99]
VerotectTMBIRAL, Dstl280[100]
Multiparameter bioaerosol sensor (MBS). 280[101,102]
SBS (spectral intensity bioaerosol spectrometer) 285
370
[103]
Rapid-E, (PA-300)Plair SA, Geneva, Switzerland337[104,105,106,107]
BARDet (Bioaerosol detector).Intite Optoelectronics of MUT375[32]
Disclaimer/Publisher’s Note: The statements, opinions and data contained in all publications are solely those of the individual author(s) and contributor(s) and not of MDPI and/or the editor(s). MDPI and/or the editor(s) disclaim responsibility for any injury to people or property resulting from any ideas, methods, instructions or products referred to in the content.

