
Association of the Degree of Varus Thrust during Gait Assessed by an Inertial Measurement Unit with Patient-Reported Outcome Measures in Knee Osteoarthritis
 , ,
, ,
Abstract
:1. Introduction
2. Materials and Methods
2.1. Subjects
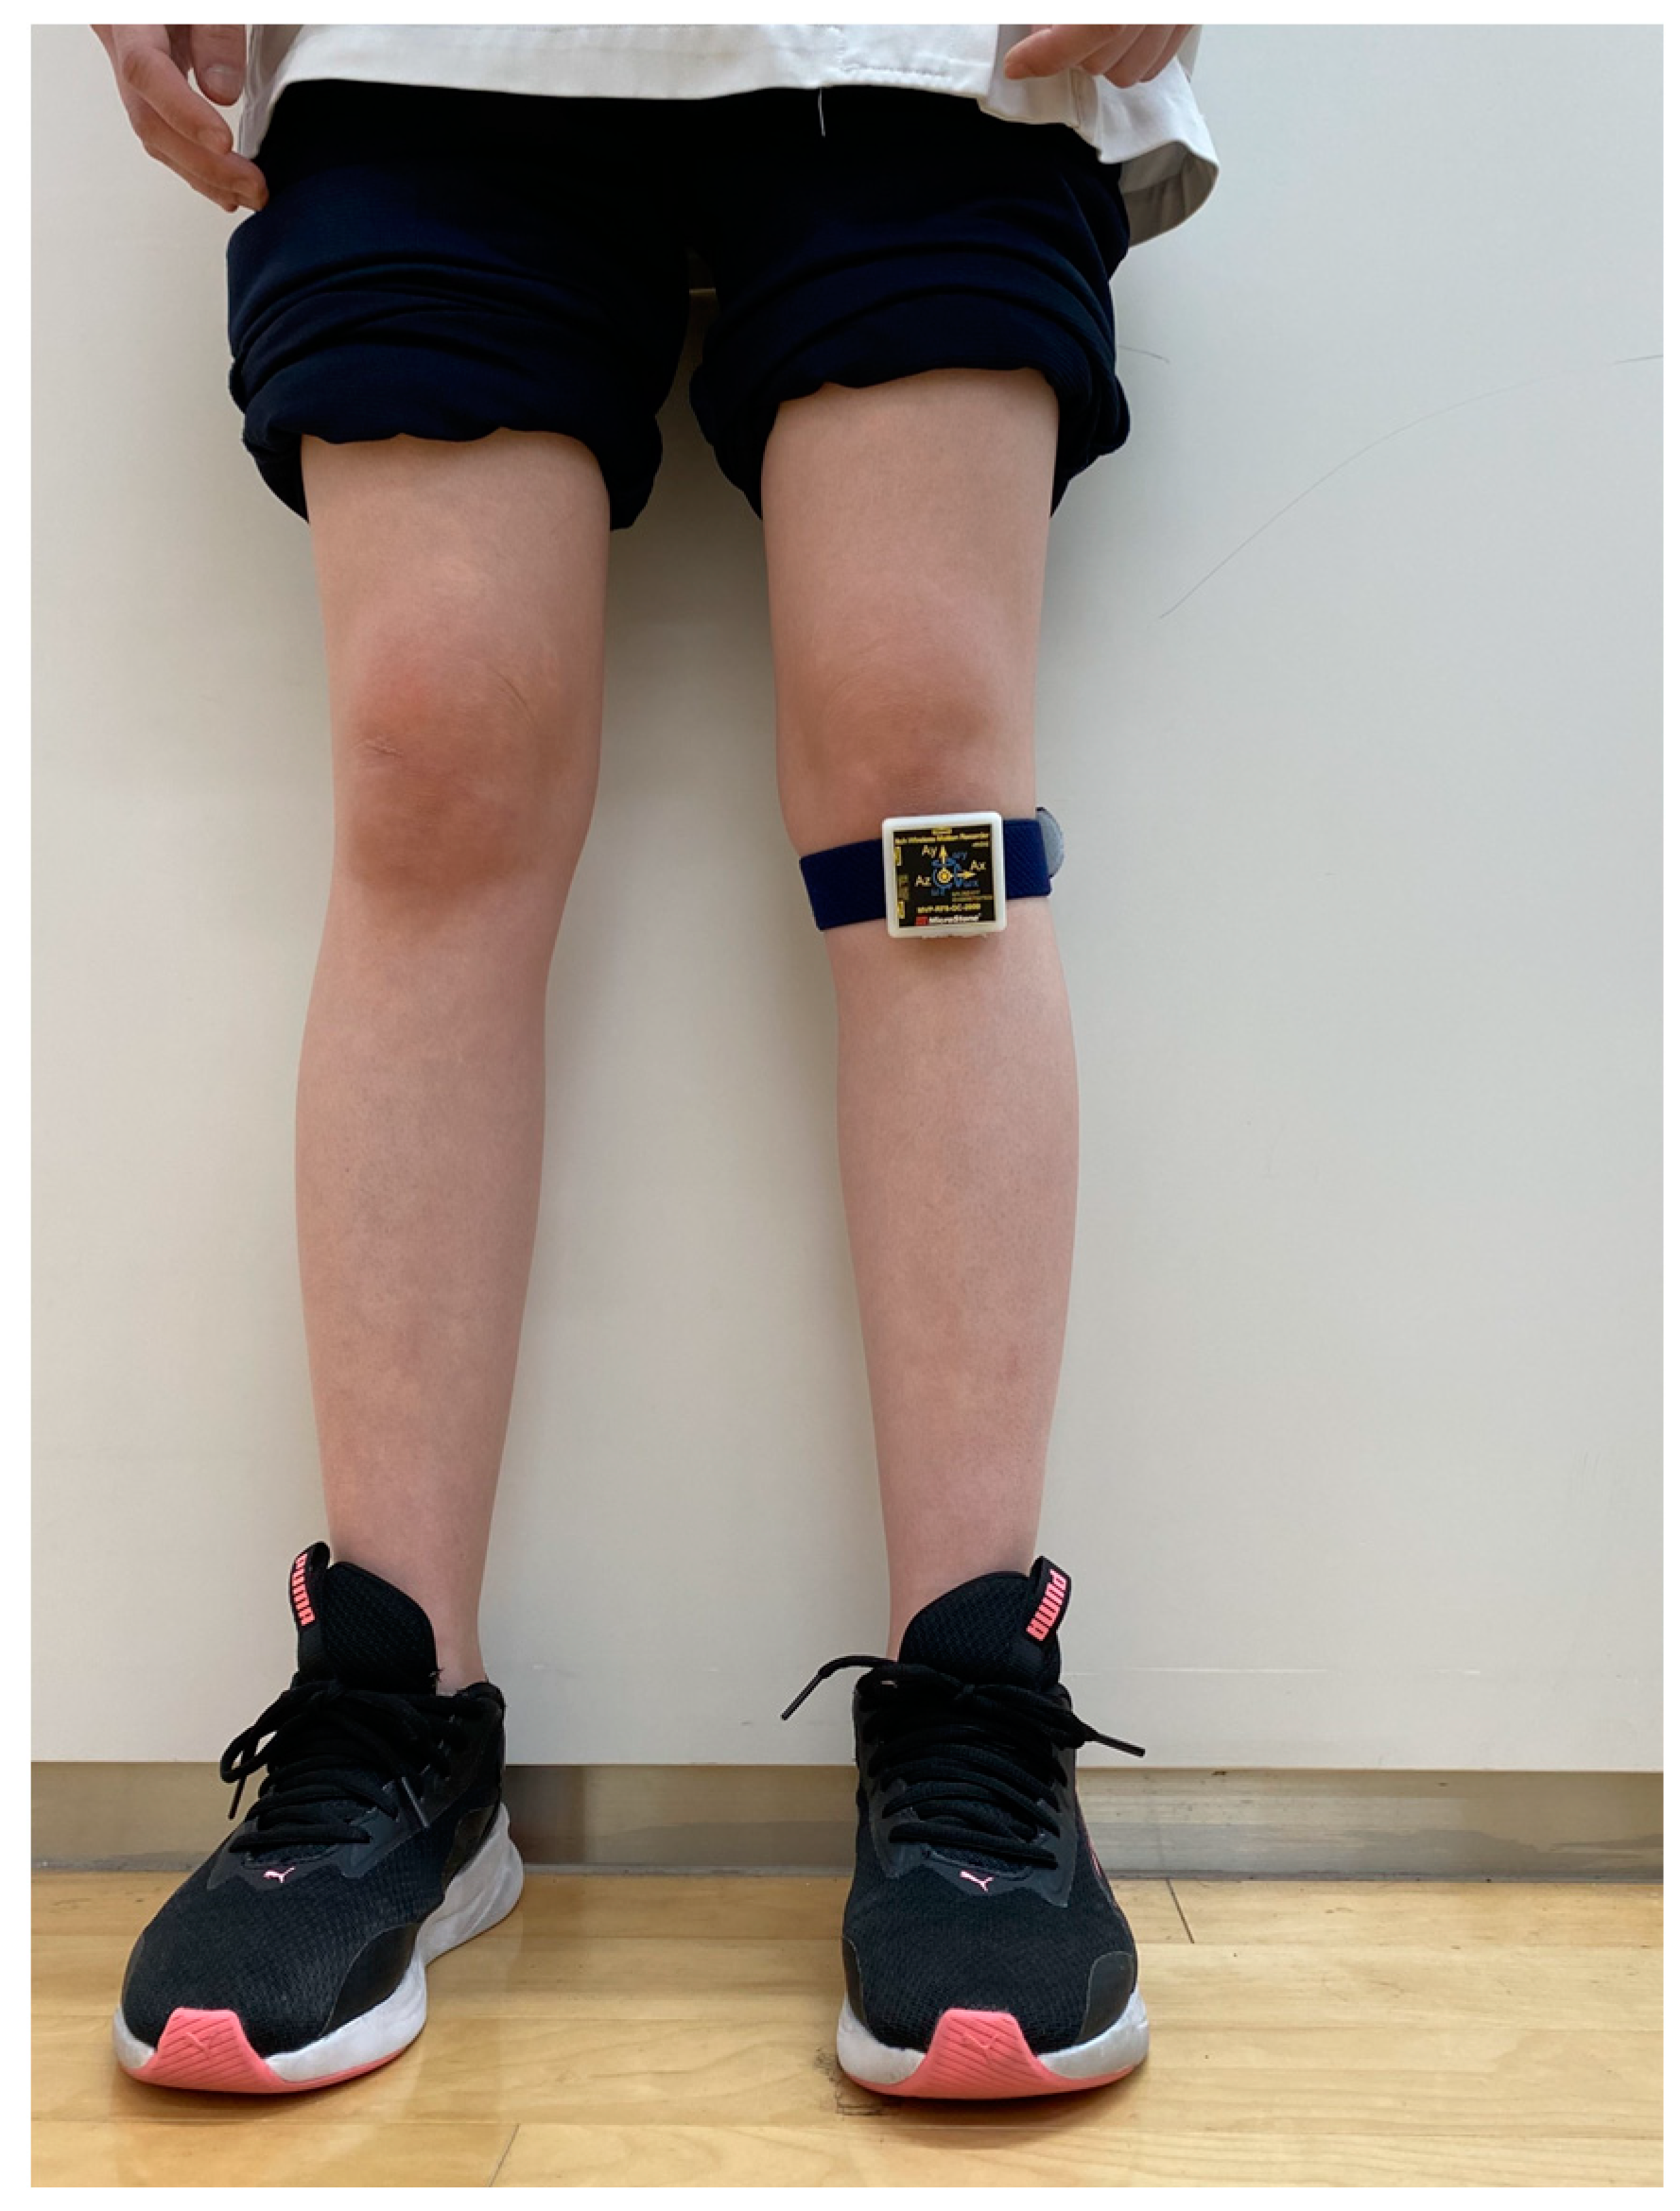
2.2. Assessments of VT during Gait
2.3. PROMs
2.4. Potential Confounders
2.5. Sample Size
2.6. Statistical Analysis
3. Results
4. Discussion
5. Conclusions
Author Contributions
Funding
Institutional Review Board Statement
Informed Consent Statement
Data Availability Statement
Acknowledgments
Conflicts of Interest
References
- Nguyen, U.-S.D.T.; Zhang, Y.; Zhu, Y.; Niu, J.; Zhang, B.; Felson, D.T. Increasing Prevalence of Knee Pain and Symptomatic Knee Osteoarthritis: Survey and Cohort Data. Ann. Intern. Med. 2011, 155, 725–732. [Google Scholar] [CrossRef] [PubMed]
- Wallace, I.J.; Worthington, S.; Felson, D.T.; Jurmain, R.D.; Wren, K.T.; Maijanen, H.; Woods, R.J.; Lieberman, D.E. Knee Osteoarthritis Has Doubled in Prevalence since the Mid-20th Century. Proc. Natl. Acad. Sci. USA 2017, 114, 9332–9336. [Google Scholar] [CrossRef] [PubMed]
- Safiri, S.; Kolahi, A.-A.; Smith, E.; Hill, C.; Bettampadi, D.; Mansournia, M.A.; Hoy, D.; Ashrafi-Asgarabad, A.; Sepidarkish, M.; Almasi-Hashiani, A.; et al. Global, Regional and National Burden of Osteoarthritis 1990–2017: A Systematic Analysis of the Global Burden of Disease Study 2017. Ann. Rheum. Dis. 2020, 79, 819–828. [Google Scholar] [CrossRef] [PubMed]
- Vitaloni, M.; Botto-van Bemden, A.; Sciortino Contreras, R.M.; Scotton, D.; Bibas, M.; Quintero, M.; Monfort, J.; Carné, X.; de Abajo, F.; Oswald, E.; et al. Global Management of Patients with Knee Osteoarthritis Begins with Quality of Life Assessment: A Systematic Review. BMC Musculoskelet. Disord. 2019, 20, 493. [Google Scholar] [CrossRef]
- van Doormaal, M.C.M.; Meerhoff, G.A.; Vliet Vlieland, T.P.M.; Peter, W.F. A Clinical Practice Guideline for Physical Therapy in Patients with Hip or Knee Osteoarthritis. Musculoskelet. Care 2020, 18, 575–595. [Google Scholar] [CrossRef]
- Lundgren-Nilsson, Å.; Dencker, A.; Palstam, A.; Person, G.; Horton, M.C.; Escorpizo, R.; Küçükdeveci, A.A.; Kutlay, S.; Elhan, A.H.; Stucki, G.; et al. Patient-Reported Outcome Measures in Osteoarthritis: A Systematic Search and Review of Their Use and Psychometric Properties. RMD Open 2018, 4, e000715. [Google Scholar] [CrossRef]
- Jordan, J.M.; Helmick, C.G.; Renner, J.B.; Luta, G.; Dragomir, A.D.; Woodard, J.; Fang, F.; Schwartz, T.A.; Abbate, L.M.; Callahan, L.F.; et al. Prevalence of Knee Symptoms and Radiographic and Symptomatic Knee Osteoarthritis in African Americans and Caucasians: The Johnston County Osteoarthritis Project. J. Rheumatol. 2007, 34, 172–180. [Google Scholar]
- Bedson, J.; Croft, P.R. The Discordance between Clinical and Radiographic Knee Osteoarthritis: A Systematic Search and Summary of the Literature. BMC Musculoskelet. Disord. 2008, 9, 116. [Google Scholar] [CrossRef]
- Chang, A.; Hayes, K.; Dunlop, D.; Hurwitz, D.; Song, J.; Cahue, S.; Genge, R.; Sharma, L. Thrust during Ambulation and the Progression of Knee Osteoarthritis. Arthritis Rheum. 2004, 50, 3897–3903. [Google Scholar] [CrossRef]
- Wink, A.E.; Gross, K.D.; Brown, C.A.; Lewis, C.E.; Torner, J.; Nevitt, M.C.; Tolstykh, I.; Sharma, L.; Felson, D.T. Association of Varus Knee Thrust During Walking with Worsening Western Ontario and McMaster Universities Osteoarthritis Index Knee Pain: A Prospective Cohort Study. Arthritis Care Res. 2019, 71, 1353–1359. [Google Scholar] [CrossRef]
- Chang, A.H.; Chmiel, J.S.; Moisio, K.C.; Almagor, O.; Zhang, Y.; Cahue, S.; Sharma, L. Varus Thrust and Knee Frontal Plane Dynamic Motion in Persons with Knee Osteoarthritis. Osteoarthr. Cartil. 2013, 21, 1668–1673. [Google Scholar] [CrossRef]
- Chang, A.; Hochberg, M.; Song, J.; Dunlop, D.; Chmiel, J.S.; Nevitt, M.; Hayes, K.; Eaton, C.; Bathon, J.; Jackson, R.; et al. Frequency of Varus and Valgus Thrust and Factors Associated with Thrust Presence in Persons with or at Higher Risk of Developing Knee Osteoarthritis. Arthritis Rheum. 2010, 62, 1403–1411. [Google Scholar] [CrossRef]
- Lo, G.H.; Harvey, W.F.; McAlindon, T.E. Associations of Varus Thrust and Alignment with Pain in Knee Osteoarthritis. Arthritis Rheum. 2012, 64, 2252–2259. [Google Scholar] [CrossRef]
- Iijima, H.; Fukutani, N.; Aoyama, T.; Fukumoto, T.; Uritani, D.; Kaneda, E.; Ota, K.; Kuroki, H.; Matsuda, S. Clinical Phenotype Classifications Based on Static Varus Alignment and Varus Thrust in Japanese Patients with Medial Knee Osteoarthritis. Arthritis Rheumatol 2015, 67, 2354–2362. [Google Scholar] [CrossRef]
- Fukutani, N.; Iijima, H.; Fukumoto, T.; Uritani, D.; Kaneda, E.; Ota, K.; Aoyama, T.; Tsuboyama, T.; Matsuda, S. Association of Varus Thrust with Pain and Stiffness and Activities of Daily Living in Patients with Medial Knee Osteoarthritis. Phys. Ther. 2016, 96, 167–175. [Google Scholar] [CrossRef]
- Wink, A.E.; Gross, K.D.; Brown, C.A.; Guermazi, A.; Roemer, F.; Niu, J.; Torner, J.; Lewis, C.E.; Nevitt, M.C.; Tolstykh, I.; et al. Varus Thrust during Walking and the Risk of Incident and Worsening Medial Tibiofemoral MRI Lesions: The Multicenter Osteoarthritis Study. Osteoarthr. Cartil. 2017, 25, 839–845. [Google Scholar] [CrossRef]
- Ashe, M.C.; Miller, W.C.; Eng, J.J.; Noreau, L. Physical Activity and Chronic Conditions Research Team Older Adults, Chronic Disease and Leisure-Time Physical Activity. Gerontology 2009, 55, 64–72. [Google Scholar] [CrossRef]
- Chaudhury, H.; Campo, M.; Michael, Y.; Mahmood, A. Neighbourhood Environment and Physical Activity in Older Adults. Soc. Sci. Med. 2016, 149, 104–113. [Google Scholar] [CrossRef]
- Bensalma, F.; Hagemeister, N.; Cagnin, A.; Ouakrim, Y.; Bureau, N.J.; Choinière, M.; Mezghani, N. Biomechanical Markers Associations with Pain, Symptoms, and Disability Compared to Radiographic Severity in Knee Osteoarthritis Patients: A Secondary Analysis from a Cluster Randomized Controlled Trial. BMC Musculoskelet. Disord. 2022, 23, 896. [Google Scholar] [CrossRef]
- Mahmoudian, A.; van Dieёn, J.H.; Bruijn, S.M.; Baert, I.A.C.; Faber, G.S.; Luyten, F.P.; Verschueren, S.M.P. Dynamic and Static Knee Alignment at Baseline Predict Structural Abnormalities on MRI Associated with Medial Compartment Knee Osteoarthritis after 2 Years. Gait Posture 2017, 57, 46–51. [Google Scholar] [CrossRef]
- Baldwin, J.N.; McKay, M.J.; Simic, M.; Hiller, C.E.; Moloney, N.; Nightingale, E.J.; Burns, J. 1000 Norms Project Consortium Self-Reported Knee Pain and Disability among Healthy Individuals: Reference Data and Factors Associated with the Knee Injury and Osteoarthritis Outcome Score (KOOS) and KOOS-Child. Osteoarthr. Cartil. 2017, 25, 1282–1290. [Google Scholar] [CrossRef] [PubMed]
- Debi, R.; Mor, A.; Segal, O.; Segal, G.; Debbi, E.; Agar, G.; Halperin, N.; Haim, A.; Elbaz, A. Differences in Gait Patterns, Pain, Function and Quality of Life between Males and Females with Knee Osteoarthritis: A Clinical Trial. BMC Musculoskelet. Disord. 2009, 10, 127. [Google Scholar] [CrossRef] [PubMed]
- Raud, B.; Gay, C.; Guiguet-Auclair, C.; Bonnin, A.; Gerbaud, L.; Pereira, B.; Duclos, M.; Boirie, Y.; Coudeyre, E. Level of Obesity Is Directly Associated with the Clinical and Functional Consequences of Knee Osteoarthritis. Sci. Rep. 2020, 10, 3601. [Google Scholar] [CrossRef] [PubMed]
- Marcum, Z.A.; Zhan, H.L.; Perera, S.; Moore, C.G.; Fitzgerald, G.K.; Weiner, D.K. Correlates of Gait Speed in Advanced Knee Osteoarthritis. Pain Med. 2014, 15, 1334–1342. [Google Scholar] [CrossRef]
- Tavares, D.R.B.; Moça Trevisani, V.F.; Frazao Okazaki, J.E.; Valéria de Andrade Santana, M.; Pereira Nunes Pinto, A.C.; Tutiya, K.K.; Gazoni, F.M.; Pinto, C.B.; Cristina Dos Santos, F.; Fregni, F. Risk Factors of Pain, Physical Function, and Health-Related Quality of Life in Elderly People with Knee Osteoarthritis: A Cross-Sectional Study. Heliyon 2020, 6, e05723. [Google Scholar] [CrossRef]
- Mibu, A.; Nishigami, T.; Tanaka, K.; Manfuku, M.; Yono, S. Difference in the Impact of Central Sensitization on Pain-Related Symptoms between Patients with Chronic Low Back Pain and Knee Osteoarthritis. J. Pain Res. 2019, 12, 1757–1765. [Google Scholar] [CrossRef]
- Tanaka, K.; Murata, S.; Nishigami, T.; Mibu, A.; Manfuku, M.; Shinohara, Y.; Tanabe, A.; Ono, R. The Central Sensitization Inventory Predict Pain-Related Disability for Musculoskeletal Disorders in the Primary Care Setting. Eur. J. Pain 2019, 23, 1640–1648. [Google Scholar] [CrossRef]
- Kim, J.-J.; Koh, I.-J.; Kim, M.-S.; Choi, K.-Y.; Kang, K.-H.; In, Y. Central Sensitization Is Associated with Inferior Patient-Reported Outcomes and Increased Osteotomy Site Pain in Patients Undergoing Medial Opening-Wedge High Tibial Osteotomy. Medicina 2022, 58, 1752. [Google Scholar] [CrossRef]
- Loeser, J.D.; Treede, R.-D. The Kyoto Protocol of IASP Basic Pain Terminology. Pain 2008, 137, 473–477. [Google Scholar] [CrossRef]
- Mease, P.J.; Hanna, S.; Frakes, E.P.; Altman, R.D. Pain Mechanisms in Osteoarthritis: Understanding the Role of Central Pain and Current Approaches to Its Treatment. J. Rheumatol. 2011, 38, 1546–1551. [Google Scholar] [CrossRef]
- Zheng, X.; Reneman, M.F.; Echeita, J.A.; Schiphorst Preuper, R.H.; Kruitbosch, H.; Otten, E.; Lamoth, C.J. Association between Central Sensitization and Gait in Chronic Low Back Pain: Insights from a Machine Learning Approach. Comput. Biol. Med. 2022, 144, 105329. [Google Scholar] [CrossRef]
- Mayer, T.G.; Neblett, R.; Cohen, H.; Howard, K.J.; Choi, Y.H.; Williams, M.J.; Perez, Y.; Gatchel, R.J. The Development and Psychometric Validation of the Central Sensitization Inventory. Pain Pract. 2012, 12, 276–285. [Google Scholar] [CrossRef]
- Tanaka, K.; Nishigami, T.; Mibu, A.; Manfuku, M.; Yono, S.; Shinohara, Y.; Tanabe, A.; Ono, R. Validation of the Japanese Version of the Central Sensitization Inventory in Patients with Musculoskeletal Disorders. PLoS ONE 2017, 12, e0188719. [Google Scholar] [CrossRef]
- Yoshimura, I.; Naito, M.; Hara, M.; Zhang, J. Analysis of the Significance of the Measurement of Acceleration with Respect to Lateral Laxity of the Anterior Cruciate Ligament Insufficient Knee. Int. Orthop. 2000, 24, 276–278. [Google Scholar] [CrossRef]
- Iwama, Y.; Harato, K.; Kobayashi, S.; Niki, Y.; Ogihara, N.; Matsumoto, M.; Nakamura, M.; Nagura, T. Estimation of the External Knee Adduction Moment during Gait Using an Inertial Measurement Unit in Patients with Knee Osteoarthritis. Sensors 2021, 21, 1418. [Google Scholar] [CrossRef]
- Ishii, Y.; Ishikawa, M.; Kurumadani, H.; Hayashi, S.; Nakamae, A.; Nakasa, T.; Sumida, Y.; Tsuyuguchi, Y.; Kanemitsu, M.; Deie, M.; et al. Increase in Medial Meniscal Extrusion in the Weight-Bearing Position Observed on Ultrasonography Correlates with Lateral Thrust in Early-Stage Knee Osteoarthritis. J. Orthop. Sci. 2020, 25, 640–646. [Google Scholar] [CrossRef]
- Tsukamoto, H.; Saito, K.; Matsunaga, T.; Iwami, T.; Saito, H.; Kijima, H.; Akagawa, M.; Komatsu, A.; Miyakoshi, N.; Shimada, Y. Diagnostic Accuracy of the Mobile Assessment of Varus Thrust Using Nine-Axis Inertial Measurement Units. Prog. Rehabil. Med. 2021, 6, 20210009. [Google Scholar] [CrossRef]
- Misu, S.; Tanaka, S.; Ishihara, K.; Asai, T.; Nishigami, T. Applied Assessment Method for Varus Thrust during Walking in Patients with Knee Osteoarthritis Using Acceleration Data Measured by an Inertial Measurement Unit. Sensors 2022, 22, 6460. [Google Scholar] [CrossRef]
- Kavanagh, J.J.; Menz, H.B. Accelerometry: A Technique for Quantifying Movement Patterns during Walking. Gait Posture 2008, 28, 1–15. [Google Scholar] [CrossRef]
- Kobsar, D.; Masood, Z.; Khan, H.; Khalil, N.; Kiwan, M.Y.; Ridd, S.; Tobis, M. Wearable Inertial Sensors for Gait Analysis in Adults with Osteoarthritis-A Scoping Review. Sensors 2020, 20, 7143. [Google Scholar] [CrossRef]
- Roos, E.M.; Roos, H.P.; Lohmander, L.S.; Ekdahl, C.; Beynnon, B.D. Knee Injury and Osteoarthritis Outcome Score (KOOS)--Development of a Self-Administered Outcome Measure. J. Orthop. Sports Phys. Ther. 1998, 28, 88–96. [Google Scholar] [CrossRef] [PubMed]
- Nakamura, N.; Takeuchi, R.; Sawaguchi, T.; Ishikawa, H.; Saito, T.; Goldhahn, S. Cross-Cultural Adaptation and Validation of the Japanese Knee Injury and Osteoarthritis Outcome Score (KOOS). J. Orthop. Sci. 2011, 16, 516–523. [Google Scholar] [CrossRef] [PubMed]
- Collins, N.J.; Prinsen, C.A.C.; Christensen, R.; Bartels, E.M.; Terwee, C.B.; Roos, E.M. Knee Injury and Osteoarthritis Outcome Score (KOOS): Systematic Review and Meta-Analysis of Measurement Properties. Osteoarthr. Cartil. 2016, 24, 1317–1329. [Google Scholar] [CrossRef] [PubMed]
- Kamei, G.; Sumen, Y.; Sakaridani, K. Evaluation of Cartilage Defect at Medial Femoral Condyle in Early Osteoarthritis of the Knee. Magn. Reson. Imaging 2008, 26, 567–571. [Google Scholar] [CrossRef]
- Harrell, F.E. Regression Modeling Strategies; Springer: New York, NY, USA, 2001. [Google Scholar]
- Hutchison, L.; Grayson, J.; Hiller, C.; D’Souza, N.; Kobayashi, S.; Simic, M. The Relationship between Knee Biomechanics and Pain in People with Knee Osteoarthritis: A Systematic Review and Meta-Analysis. Arthritis Care Res. 2022. [Google Scholar] [CrossRef]
- Sosdian, L.; Hinman, R.S.; Wrigley, T.V.; Paterson, K.L.; Dowsey, M.; Choong, P.; Bennell, K. Quantifying Varus and Valgus Thrust in Individuals with Severe Knee Osteoarthritis. Clin. Biomech. 2016, 39, 44–51. [Google Scholar] [CrossRef]
- Costello, K.E.; Eigenbrot, S.; Geronimo, A.; Guermazi, A.; Felson, D.T.; Richards, J.; Kumar, D. Quantifying Varus Thrust in Knee Osteoarthritis Using Wearable Inertial Sensors: A Proof of Concept. Clin. Biomech. 2020, 80, 105232. [Google Scholar] [CrossRef]
- Andias, R.; Silva, A.G. Cross-Cultural Adaptation and Psychometric Properties of the European Portuguese Version of the Central Sensitization Inventory in Adolescents with Musculoskeletal Chronic Pain. Pain Pract. 2020, 20, 480–490. [Google Scholar] [CrossRef]
- Menz, H.B.; Lord, S.R.; Fitzpatrick, R.C. Age-Related Differences in Walking Stability. Age Ageing 2003, 32, 137–142. [Google Scholar] [CrossRef]
- Zafar, A.Q.; Zamani, R.; Akrami, M. The Effectiveness of Foot Orthoses in the Treatment of Medial Knee Osteoarthritis: A Systematic Review. Gait Posture 2020, 76, 238–251. [Google Scholar] [CrossRef]
- Xing, F.; Lu, B.; Kuang, M.-J.; Wang, Y.; Zhao, Y.-L.; Zhao, J.; Sun, L.; Wang, Y.; Ma, J.-X.; Ma, X.-L. A Systematic Review and Meta-Analysis into the Effect of Lateral Wedge Arch Support Insoles for Reducing Knee Joint Load in Patients with Medial Knee Osteoarthritis. Medicine 2017, 96, e7168. [Google Scholar] [CrossRef]
- Huang, X.-M.; Yuan, F.-Z.; Chen, Y.-R.; Huang, Y.; Yang, Z.-X.; Lin, L.; Yu, J.-K. Physical Therapy and Orthopaedic Equipment-Induced Reduction in the Biomechanical Risk Factors Related to Knee Osteoarthritis: A Systematic Review and Bayesian Network Meta-Analysis of Randomised Controlled Trials. BMJ Open 2022, 12, e051608. [Google Scholar] [CrossRef]
- Sharma, L.; Chang, A.H.; Jackson, R.D.; Nevitt, M.; Moisio, K.C.; Hochberg, M.; Eaton, C.; Kwoh, C.K.; Almagor, O.; Cauley, J.; et al. Varus Thrust and Incident and Progressive Knee Osteoarthritis. Arthritis Rheumatol 2017, 69, 2136–2143. [Google Scholar] [CrossRef]


| Variables | Mean ± SD/n (%) | Range | |
|---|---|---|---|
| Age | [years] | 59.8 ± 8.6 | [41–74] |
| Sex: Female | [n (%)] | 40 (57.1) | |
| Body weight | [kg] | 67.2 ± 11.6 | [44.9–94.7] |
| Height | [m] | 1.60 ± 0.09 | [1.44–1.82] |
| BMI | [kg/m2] | 26.1 ± 3.7 | [20.0–38.6] |
| K-L classification: | [n (%)] | ||
| II | 19 (27.1) | ||
| III | 45 (64.3) | ||
| IV | 6 (8.6) | ||
| Mikulicz line score | [%] | 20.3 ± 12.2 | [−17.6–39.1] |
| CSI | 9.9 ± 5.2 | [1–22] | |
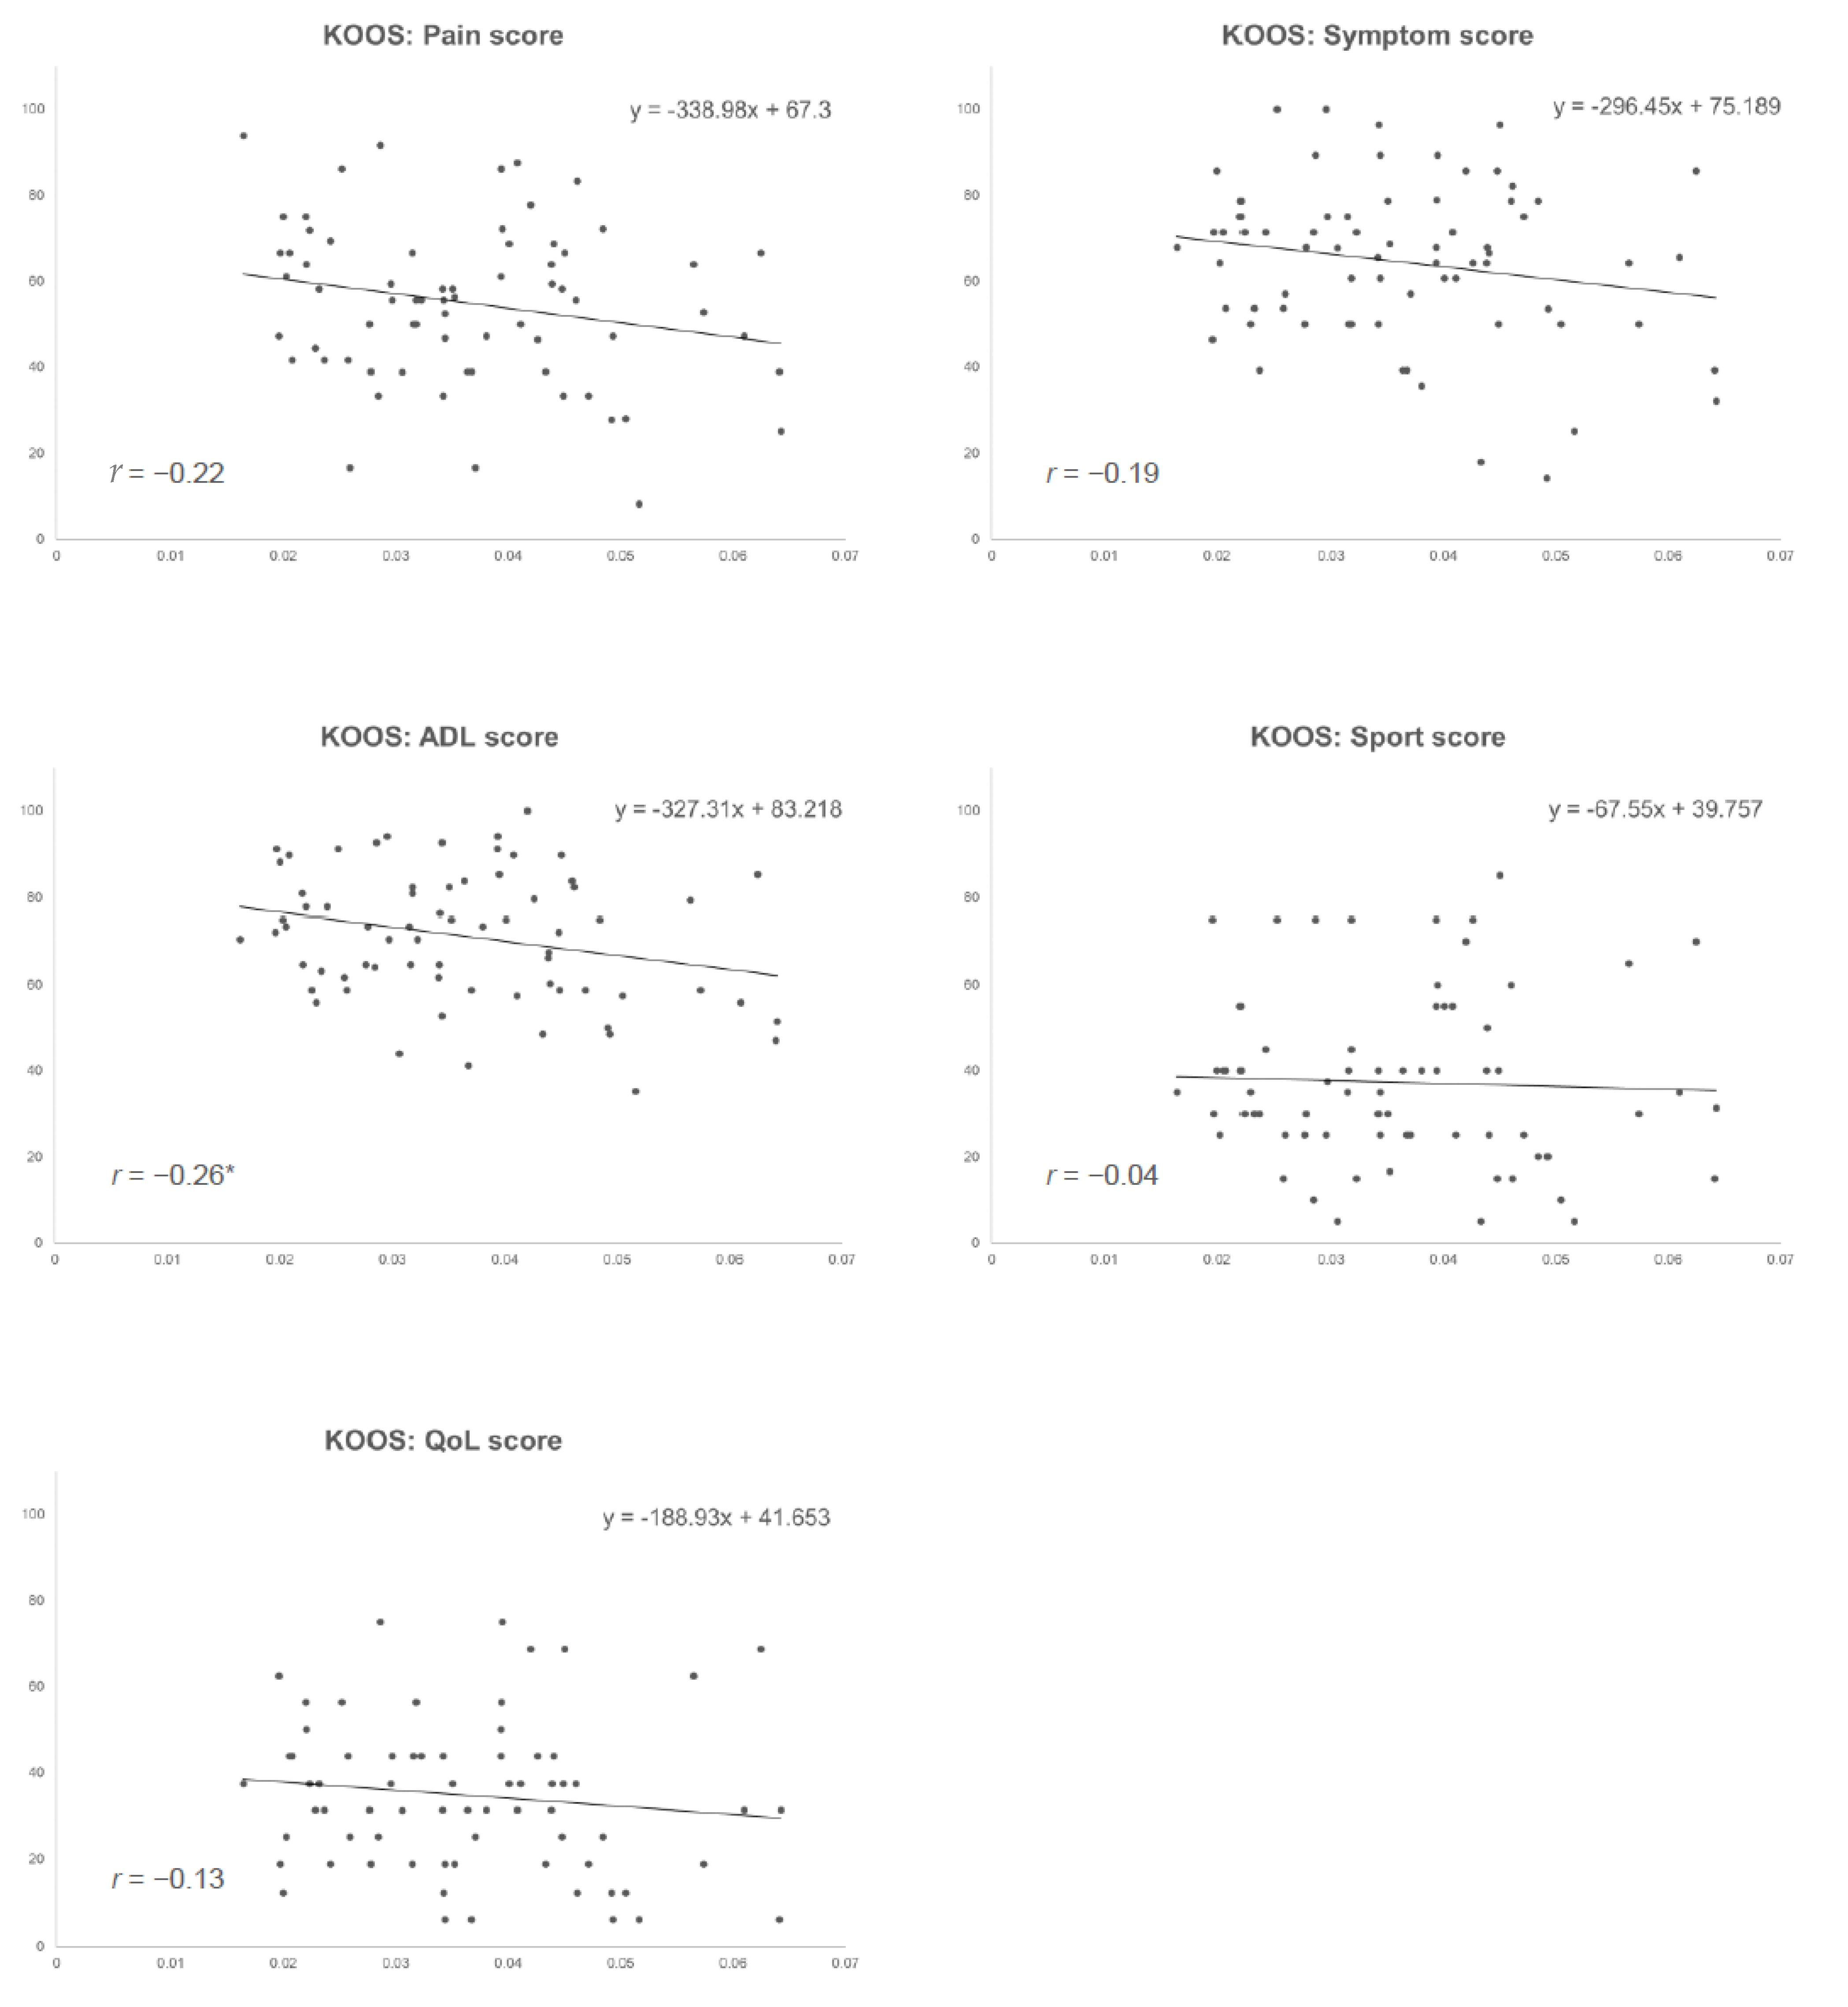
| KOOS score | |||
| Pain score | 54.9 ± 18.5 | [8.3–93.8] | |
| Symptom score | 64.4 ± 18.5 | [14.3–100.0] | |
| ADL score | 71.3 ± 15.0 | [35.3–100.0] | |
| Sport score | 37.3 ± 19.7 | [5.0–85.0] | |
| QoL score | 34.8 ± 17.6 | [6.3–75.0] | |
| Gait speed a | [km/h] | 1.34 ± 0.36 | [0.50–2.50] |
| VT-index b | [m/s/deg] | 0.036 ± 0.012 | [0.016–0.064] |
| Dependent Variables | |||||||||||
|---|---|---|---|---|---|---|---|---|---|---|---|
| Pain Score | Symptom Score | ADL Score | Sport Score | Qol Score | VIF | ||||||
| Standardized β | p Value | Standardized β | p Value | Standardized β | p Value | Standardized β | p Value | Standardized β | p Value | ||
| Independent variables | |||||||||||
| VT-index | −0.295 | 0.026 | −0.287 | 0.026 | −0.256 | 0.028 | 0.075 | 0.588 | −0.076 | 0.577 | 1.343 |
| (Covariates) | |||||||||||
| age | 0.104 | 0.407 | 0.079 | 0.520 | 0.046 | 0.679 | −0.085 | 0.523 | 0.008 | 0.955 | 1.264 |
| sex | 0.093 | 0.458 | −0.097 | 0.429 | 0.018 | 0.870 | 0.209 | 0.121 | 0.1 | 0.449 | 1.257 |
| BMI | 0.084 | 0.479 | 0.079 | 0.495 | −0.117 | 0.265 | −0.242 | 0.057 | −0.347 | 0.007 | 1.113 |
| Mikulicz line score | 0.061 | 0.593 | 0.131 | 0.241 | 0.064 | 0.526 | 0.017 | 0.891 | −0.025 | 0.837 | 1.049 |
| CSI | −0.465 | 0.001 | −0.445 | 0.001 | −0.516 | <0.001 | −0.250 | 0.066 | −0.238 | 0.079 | 1.278 |
| gait speed | −0.054 | 0.682 | −0.006 | 0.964 | 0.173 | 0.138 | 0.132 | 0.346 | −0.039 | 0.779 | 1.371 |
| adjusted R2 | 0.246 | 0.283 | 0.343 | 0.048 | 0.063 | ||||||
Disclaimer/Publisher’s Note: The statements, opinions and data contained in all publications are solely those of the individual author(s) and contributor(s) and not of MDPI and/or the editor(s). MDPI and/or the editor(s) disclaim responsibility for any injury to people or property resulting from any ideas, methods, instructions or products referred to in the content. |
© 2023 by the authors. Licensee MDPI, Basel, Switzerland. This article is an open access article distributed under the terms and conditions of the Creative Commons Attribution (CC BY) license (https://creativecommons.org/licenses/by/4.0/).
Share and Cite
Misu, S.; Tanaka, S.; Miura, J.; Ishihara, K.; Asai, T.; Nishigami, T. Association of the Degree of Varus Thrust during Gait Assessed by an Inertial Measurement Unit with Patient-Reported Outcome Measures in Knee Osteoarthritis. Sensors 2023, 23, 4578. https://doi.org/10.3390/s23104578
Misu S, Tanaka S, Miura J, Ishihara K, Asai T, Nishigami T. Association of the Degree of Varus Thrust during Gait Assessed by an Inertial Measurement Unit with Patient-Reported Outcome Measures in Knee Osteoarthritis. Sensors. 2023; 23(10):4578. https://doi.org/10.3390/s23104578
Chicago/Turabian StyleMisu, Shogo, So Tanaka, Jun Miura, Kohei Ishihara, Tsuyoshi Asai, and Tomohiko Nishigami. 2023. "Association of the Degree of Varus Thrust during Gait Assessed by an Inertial Measurement Unit with Patient-Reported Outcome Measures in Knee Osteoarthritis" Sensors 23, no. 10: 4578. https://doi.org/10.3390/s23104578