Article

Towards a Miniaturized Photoacoustic Detector for the Infrared Spectroscopic Analysis of SO2F2 and Refrigerants

1
Department of Microsystems Engineering, University of Freiburg, 79110 Freiburg, Germany
2
Fraunhofer Institute for Physical Measurement Techniques IPM, 79110 Freiburg, Germany
*
Author to whom correspondence should be addressed.
Sensors 2023, 23(1), 180; https://doi.org/10.3390/s23010180
Submission received: 30 November 2022 / Revised: 16 December 2022 / Accepted: 21 December 2022 / Published: 24 December 2022
(This article belongs to the Collection Gas Sensors)

Abstract

:
Sulfuryl fluoride (SO2F2) is a toxic and potent greenhouse gas that is currently widely used as a fumigant insecticide in houses, food, and shipping containers. Though it poses a major hazard to humans, its detection is still carried out manually and only on a random basis. In this paper, we present a two-chamber photoacoustic approach for continuous SO2F2 sensing. Because of the high toxicity of SO2F2, the concept is to use a non-toxic substituent gas with similar absorption characteristics in the photoacoustic detector chamber, i.e., to measure SO2F2 indirectly. The refrigerants R227ea, R125, R134a, and propene were identified as possible substituents using a Fourier-transform infrared (FTIR) spectroscopic analysis. The resulting infrared spectra were used to simulate the sensitivity of the substituents of a photoacoustic sensor to SO2F2 in different concentration ranges and at different optical path lengths. The simulations showed that R227ea has the highest sensitivity to SO2F2 among the substituents and is therefore a promising substituent detector gas. Simulations concerning the possible cross-sensitivity of the photoacoustic detectors to H2O and CO2 were also performed. These results are the first step towards the development of a miniaturized, sensitive, and cost-effective photoacoustic sensor system for SO2F2.

1. Introduction

The detection of sulfuryl fluoride (SO2F2) has gained increasing interest in recent years since it is widely used as a fumigant insecticide in houses, food, and shipping containers [1]. SO2F2 is neurotoxic and therefore poses a major hazard to humans, e.g., to inhabitants of treated houses or workers in the logistics industry, with an occupational exposure limit (OEL) of 5 ppm and an immediate danger for life and health starting from 200 ppm [2]. Since the adoption of the Montreal Protocol in 1987, in which the use of methyl bromide as a fumigant was phased out because of its harm to the ozone layer, SO2F2 has largely replaced methyl bromide, and the amount used drastically increased to more than 2000 metric tons per year [3,4]. Apart from its toxicity, SO2F2 is a potent greenhouse gas with a global warming potential of 4780 and an atmospheric lifetime of 36 years [5,6]. The main degradation pathway in the environment is hydrolysis, e.g., in oceans and wetlands [6,7,8].
Due to the high necessity of SO2F2 measurement to minimize its use and therefore release into the environment, a wealth of different sensors and sensor principles have recently been developed and have been reported in the literature [9,10,11,12,13,14,15,16]. Apart from fumigation, SO2F2 detection is often employed in the failure monitoring of fully enclosed insulated gas switching equipment (gas-insulated switchgear, GIS) because SO2F2 is a decomposition product of SF6-filled GIS. Such sensors must be able to monitor SO2F2 at very low concentrations (low ppm to ppb range) to safely warn below the OEL of 5 ppm. Most of the proposed sensors involve transition metals [9,13] or semiconductors [10,11], which detect a chemical reaction of SO2F2 with the respective material. Such sensors have the advantage of being very sensitive and compact, yet they often suffer from cross-sensitivities to other gases and ambient parameter variations, such as temperature and humidity. Several studies on metal/semiconductor-based sensors relied on density functional theory (DFT) simulations of chemical reactions with SO2F2 and took changes in the ambient conditions into account [12,13,14,15,16].
Alternatively, gases can often also be measured very well optically via their characteristic absorption in the infrared, as they have distinct absorption bands in the spectral range between 3 µm and 16 µm. Simple non-dispersive IR (NDIR) gas sensors work with a few fixed spectral channels and pyroelectric detectors. To minimize influences from interfering gases or drift effects from the light source, an additional reference channel is usually used for compensation, which measures in an absorption-free wavelength range. The wavelengths and spectral bandwidths are selected using thin-film interference filters, which are each optimized for the wavelength of the absorption band of the gas to be measured [17,18]. Naik et al. [19] reported an NDIR-based sensor for SO2F2 using a spectral absorption around 6.64 µm for the concentration range of 500–30,000 ppm. For higher sensitivity and resolution, SO2F2 can also be detected using tunable laser absorption spectroscopy (TDLAS) with suitable light sources and optical long-path cells, as proposed in [20,21]. Yao et al. [20] employed on interband cascade laser (ICL) at a 3619 nm central wavelength, combined with a 5.33 long-path cell to reach a detection limit of ~4 ppm. Zhang et al. [21] conducted a simulation study on the comparison of an ICL at 3619 nm and a quantum cascade laser (QCL) at 6653 nm, either using TDLAS or photoacoustic detection to reach a sub-ppm detection limit: 0.34 ppm for the ICL and 0.66 ppm for the QCL. Photoacoustics is another highly selective infrared spectroscopic measurement technique and is widely used to measure IR-active gases at low concentrations, from high-precision industrial process monitoring to trace gas monitoring [22,23,24]. The operating modes of photoacoustic systems can be divided into resonant and non-resonant. Resonant cells are mainly used in trace gas monitoring, which requires a very high level of sensitivity. With lasers as light sources, resonant photoacoustic systems can achieve sensitivities in the ppb range [25,26]. However, resonant systems are comparatively complex and expensive. Recently, different resonant photoacoustic systems have been introduced for SO2F2 sensing [27,28,29,30], achieving such low detection limits. However, such systems are laboratory-based due to their size and complexity. In contrast, non-resonant systems can be much smaller and less complex, making them suitable for use outside the laboratory. Broadband infrared sources such as filament emitters or planar thermal emitters are often employed. An advantage of broadband emitters is that all absorption lines of the target gas contribute to the signal, which allows the optical path length to be reduced. A prominent application example is room climate monitoring, in which the CO2 concentration is evaluated as a parameter for air quality [31].
Therefore, we propose a non-resonant, two-chamber photoacoustic approach to meet the requirements of size, cost, and complexity reduction to obtain a sensor for continuous SO2F2 sensing in field applications, e.g., freight container monitoring. The scheme of a two-chamber photoacoustic sensor is shown in Figure 1. Our core concept is to use a non-toxic substituent gas with similar absorption characteristics in the photoacoustic detector chamber for indirect, but still selective, SO2F2 detection. Fourier-transform infrared (FTIR) spectroscopy was used to obtain high-resolution spectra of the possible substituents 1,1,1,2,3,3,3-heptafluoropropane (R227ea), 1,1,1,2,2-pentafluoroethane (R125), 1,1,1,2-tetrafluoroethane (R134a), and propene. The resulting infrared spectra were used to simulate the sensitivity of the substituents of a photoacoustic sensor to SO2F2 in different concentration ranges and at different optical path lengths.

2. Materials and Methods

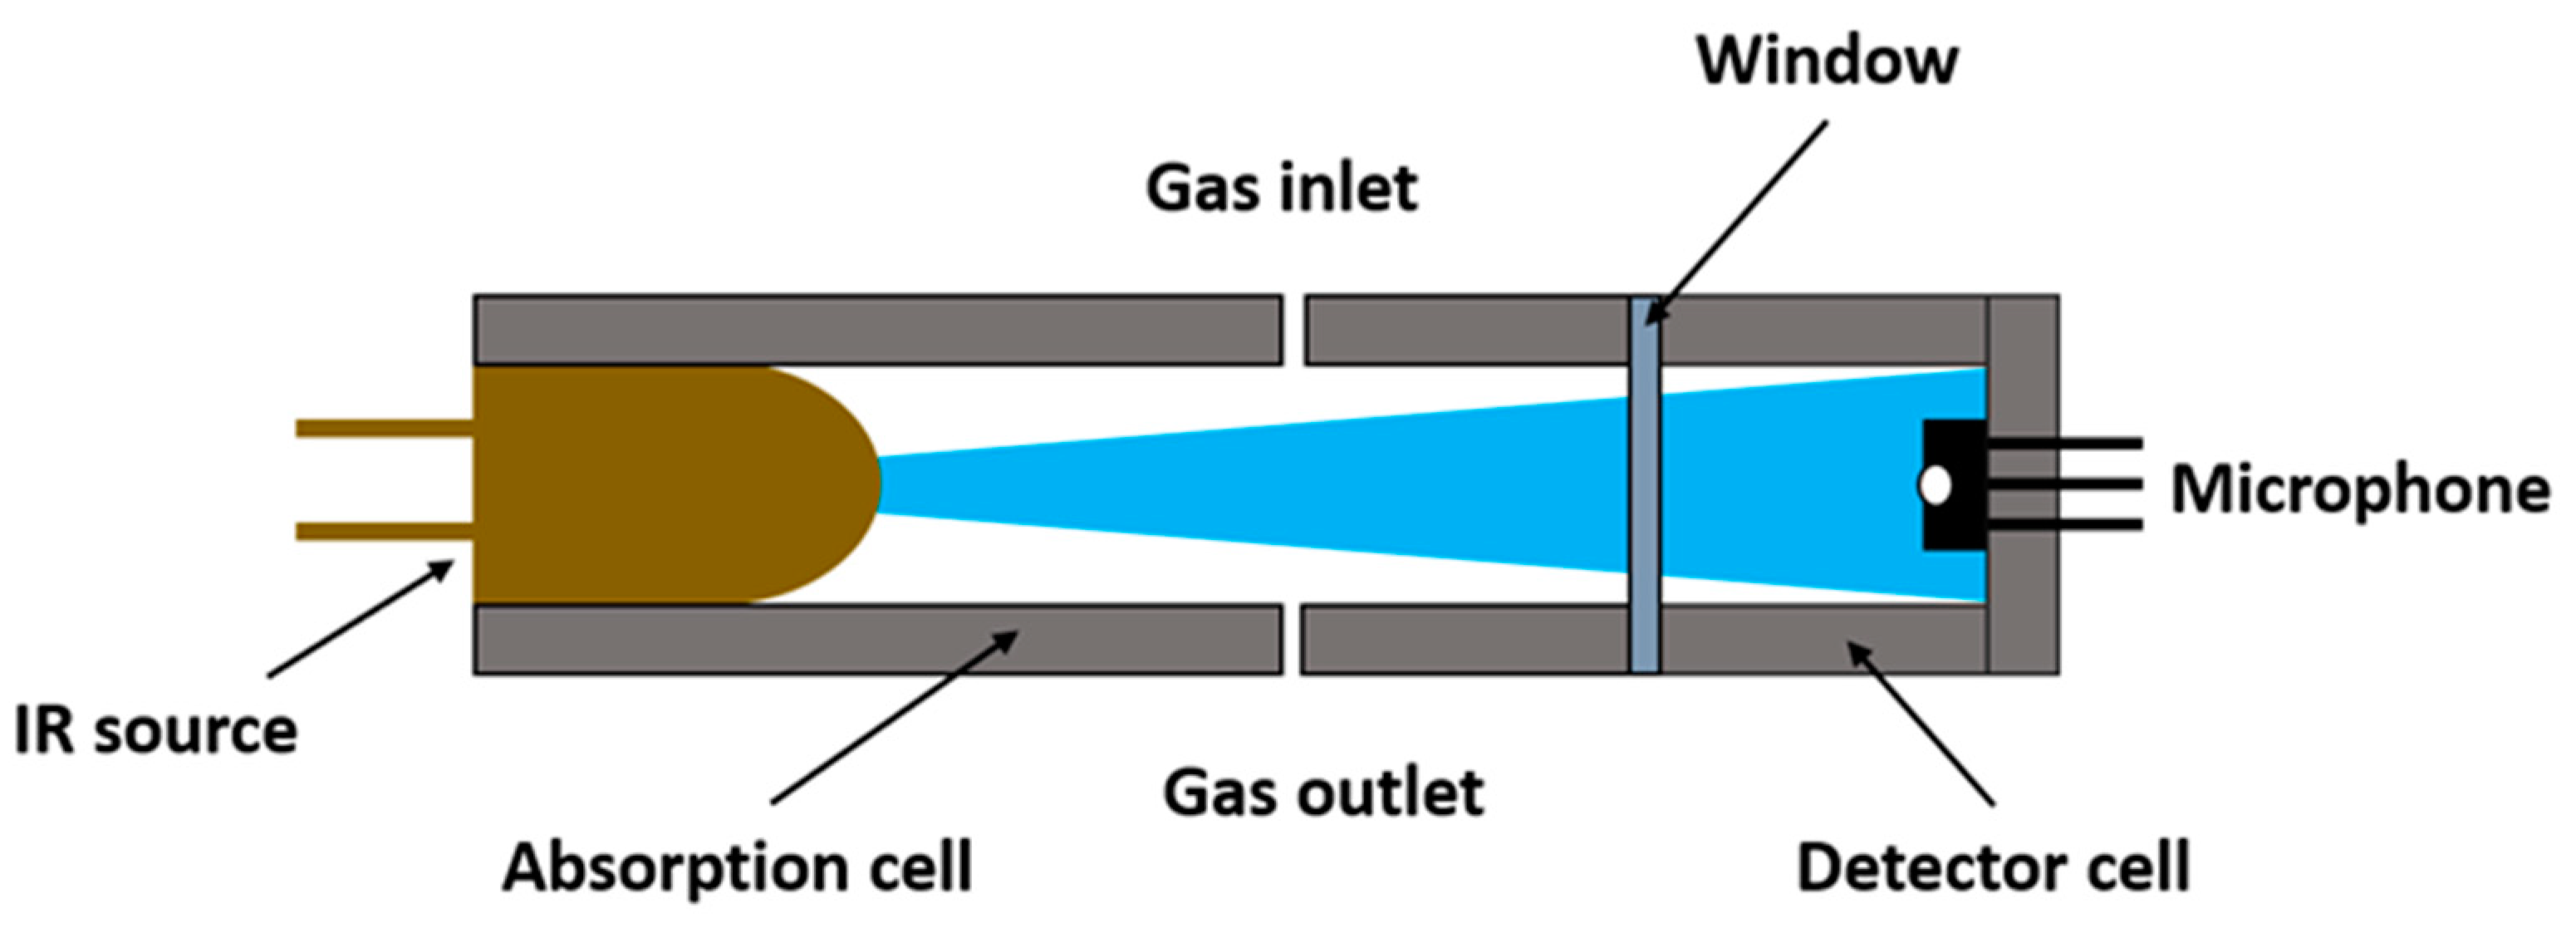
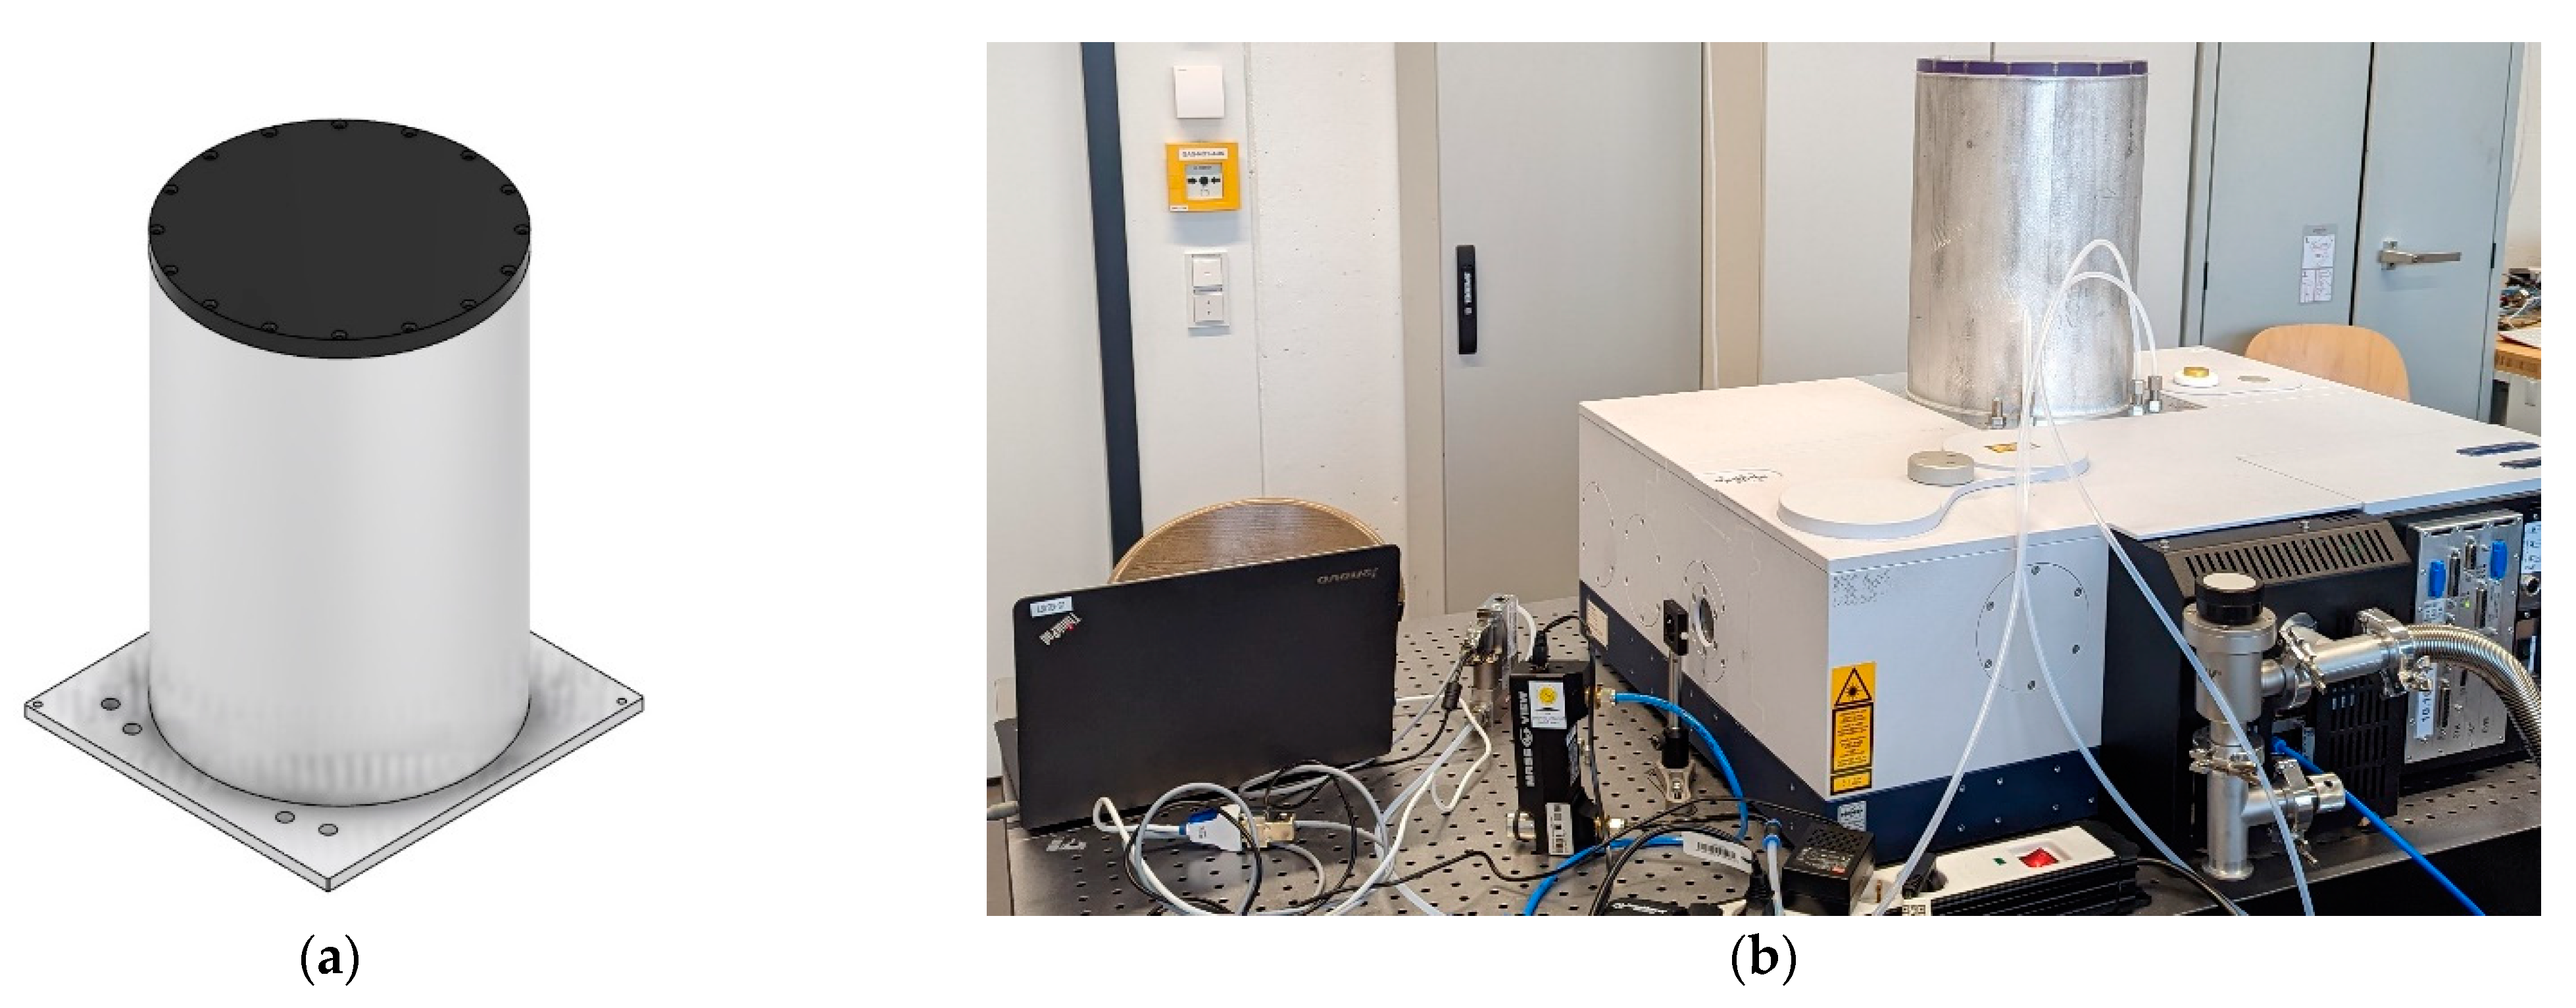
2.1. Measurement Setup

To estimate the sensitivity of the hermetically sealed photoacoustic detector cells to SO2F2, simulations were performed, requiring high-resolution spectra of the target gas, SO2F2, and the possible substituents. For this purpose, the transmission measurements of SO2F2 and the substituent gases were determined using an FTIR spectrometer (Vertex v80, Bruker, Billerica, MA, USA). The decadic absorption coefficients were calculated from the resulting spectra.
The measurement setup consisted of the FTIR spectrometer combined with a 10 m long-path gas cell (Pike Technologies, Madison, WI, USA), mass flow controllers (Bronkhorst, The Netherlands), and a lid (Figure 2a). The lid was needed to evacuate the sample compartment of the spectrometer to avoid absorption from atmospheric gases. However, the long-path gas cell was higher than the sample compartment, so the sample compartment could not be evacuated with the standard lid of the spectrometer. A lid with corresponding dimensions, as seen in Figure 2a, was constructed and designed. An aluminum cylinder (250 mm × 15 mm × 360 mm) with a polycarbonate plate (250 mm × 15 mm) was fixed through screws to a rectangular aluminum plate (282 mm × 293 mm × 10 mm). Four holes for straight bulkhead fittings were inserted in the bottom plate. The gas inlet was connected to one of the bulkhead fittings on the outside of the lid, and a second bulkhead fitting was connected to the gas exhaust (see Figure 2b). The inlet and the outlet of the long-path gas cell were connected to the respective bulkhead fittings on the inside of the lid. In case the sample compartment was intended to be flushed with nitrogen gas (N2), the third bulkhead fitting was connected to the N2 source and the fourth one was connected to the gas exhaust. For evacuating, these two were closed so that the entire measurement setup remained vacuum tight.
Before adjusting different concentrations of each gas and recording the resulting spectra with the FTIR spectrometer, the measurement parameters, such as the mirror velocity, resolution, etc., were set. For all measurements, consistent parameters were defined. A mercury–cadmium–telluride (MCT) photo detector cooled with liquid N2 was used to achieve high sensitivity. Table 1 summarizes all parameters.
The transmission spectra were recorded after setting different gas concentrations, starting from the gas cylinder concentration down to 5–15 ppm. Certified gas bottles were obtained from Westfalen, Germany (1000 ppm SO2F2 in N2), and TEGA, Germany (refrigerants), and used as received. At high gas concentrations, the strong absorption bands were already saturated, while weak absorption bands were not saturated and were clearly measured. On the other hand, at low gas concentrations, the strong absorption bands were clearly measured, while the weak ones were not. The decadic absorption coefficients were calculated from the transmission spectrum at each concentration, and the calculated spectra were merged. The resulting spectrum then contained both the weak and strong absorption bands with the desired resolution (Figure 3).

2.2. Simulations

The sensitivity of the photoacoustic detectors filled with the substituent pure gas to the target gas, SO2F2, was simulated. This was performed using a script written in JavaScript, similar to that in [32]. The script calculated the integral absorbed power in the detector cell filled with a definite pure gas (100 Vol.-%). By varying the concentration of the target gas in the absorption path at a defined optical path length, the integral absorbed power in the detector decreased. This change was defined as the sensitivity. Furthermore, a suitable window material was selected for the hermetic sealing of the detectors. Silicon has an average transmission of about ~50% in the infrared region [33]. It is easy to obtain and can easily be sawed into desired small detector windows. For this purpose, the transmission measurements of a single-side-polished (SSP) Si wafer and a double-side-polished (DSP) Si wafer were determined using the FTIR spectrometer (Figure 4).
The numerical calculations were performed for each substituent gas using the decadic absorption coefficients calculated from the FTIR measurements and by considering the IR transmission of the DSP Si wafer. Both the detector gas and the optical path length were varied.
I E m i t t e r ( λ ) = d P E m i t t e r d λ = 2 π h c 2 λ 5 A exp ( h c k B λ T ) 1
A ( λ ) = 1 T ( λ ) = 1 10 α ( λ ) l c ,
P A b s = λ 1 λ 2 I E m i t t e r ( λ ) A D e t e c t o r ( λ ) T W i n d o w ( λ ) T A b s .   c e l l ( λ )   d λ ,
where I is the emitted spectral power of the emitter, PEmitter is the optical power of the emitter, λ is the wavelength, h is Planck’s constant, c is the speed of light, A is the active emitter area of the emitter, kb is Stefan–Boltzmann’s constant, T is the temperature, α is the decadic absorption coefficient of the gas, Twindow and TAbs.cell are the transmission through the window and the absorption cell, respectively, ADetector is the absorption in the detector, and PAbs is the integral absorbed power in the detector cell. Using these Equations, the emitted spectral power of the infrared emitter, with an active emitter area 2.2 mm × 2.2 mm, and the integral absorbed power in the detector were calculated [35,36]. The length of the detector chamber was fixed to 1.5 mm. The sensitivity of the detectors filled with SO2F2 and the refrigerants (100 Vol.-%) to 0–10,000 ppm SO2F2 at an optical path length of 50 mm was simulated. Similarly, simulations for the measurement range of 0–50 ppm SO2F2 with an optical path length of 1.6 m were conducted. The cross-sensitivity to atmospheric gases such as H2O (0–4 Vol.-%) and CO2 (0–2000 ppm) were also investigated for both optical path lengths.

3. Results and Discussion

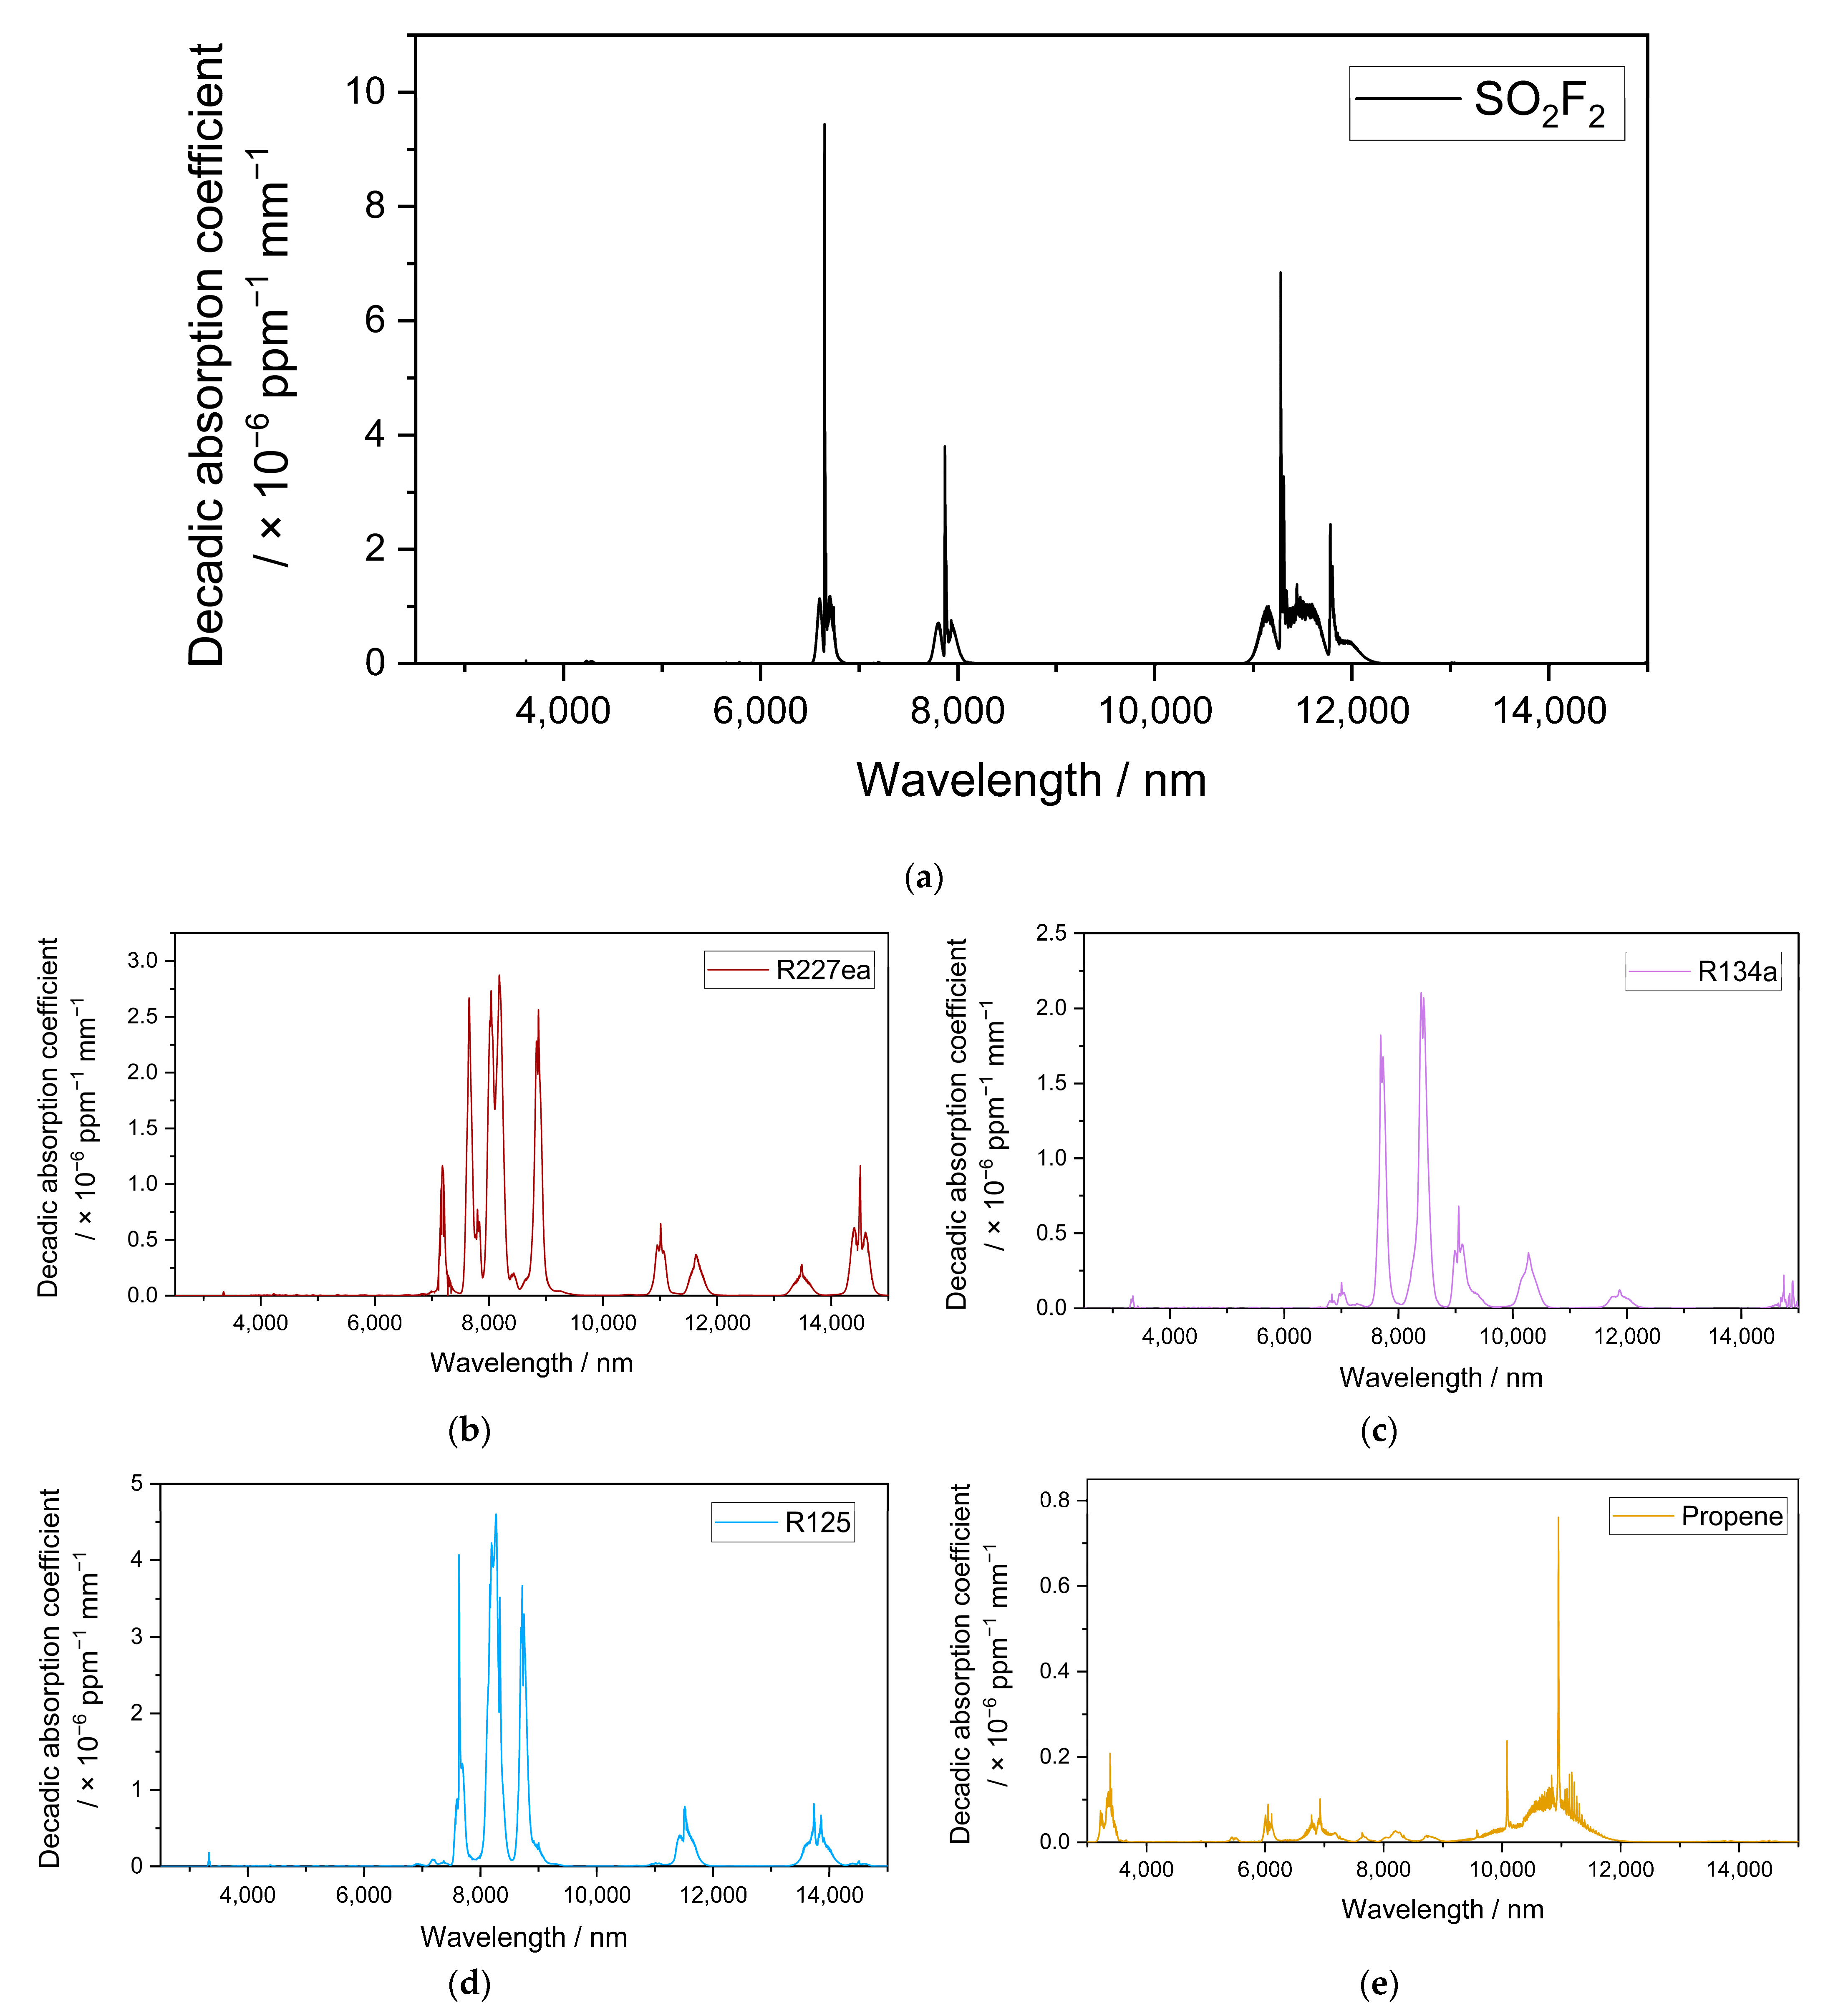
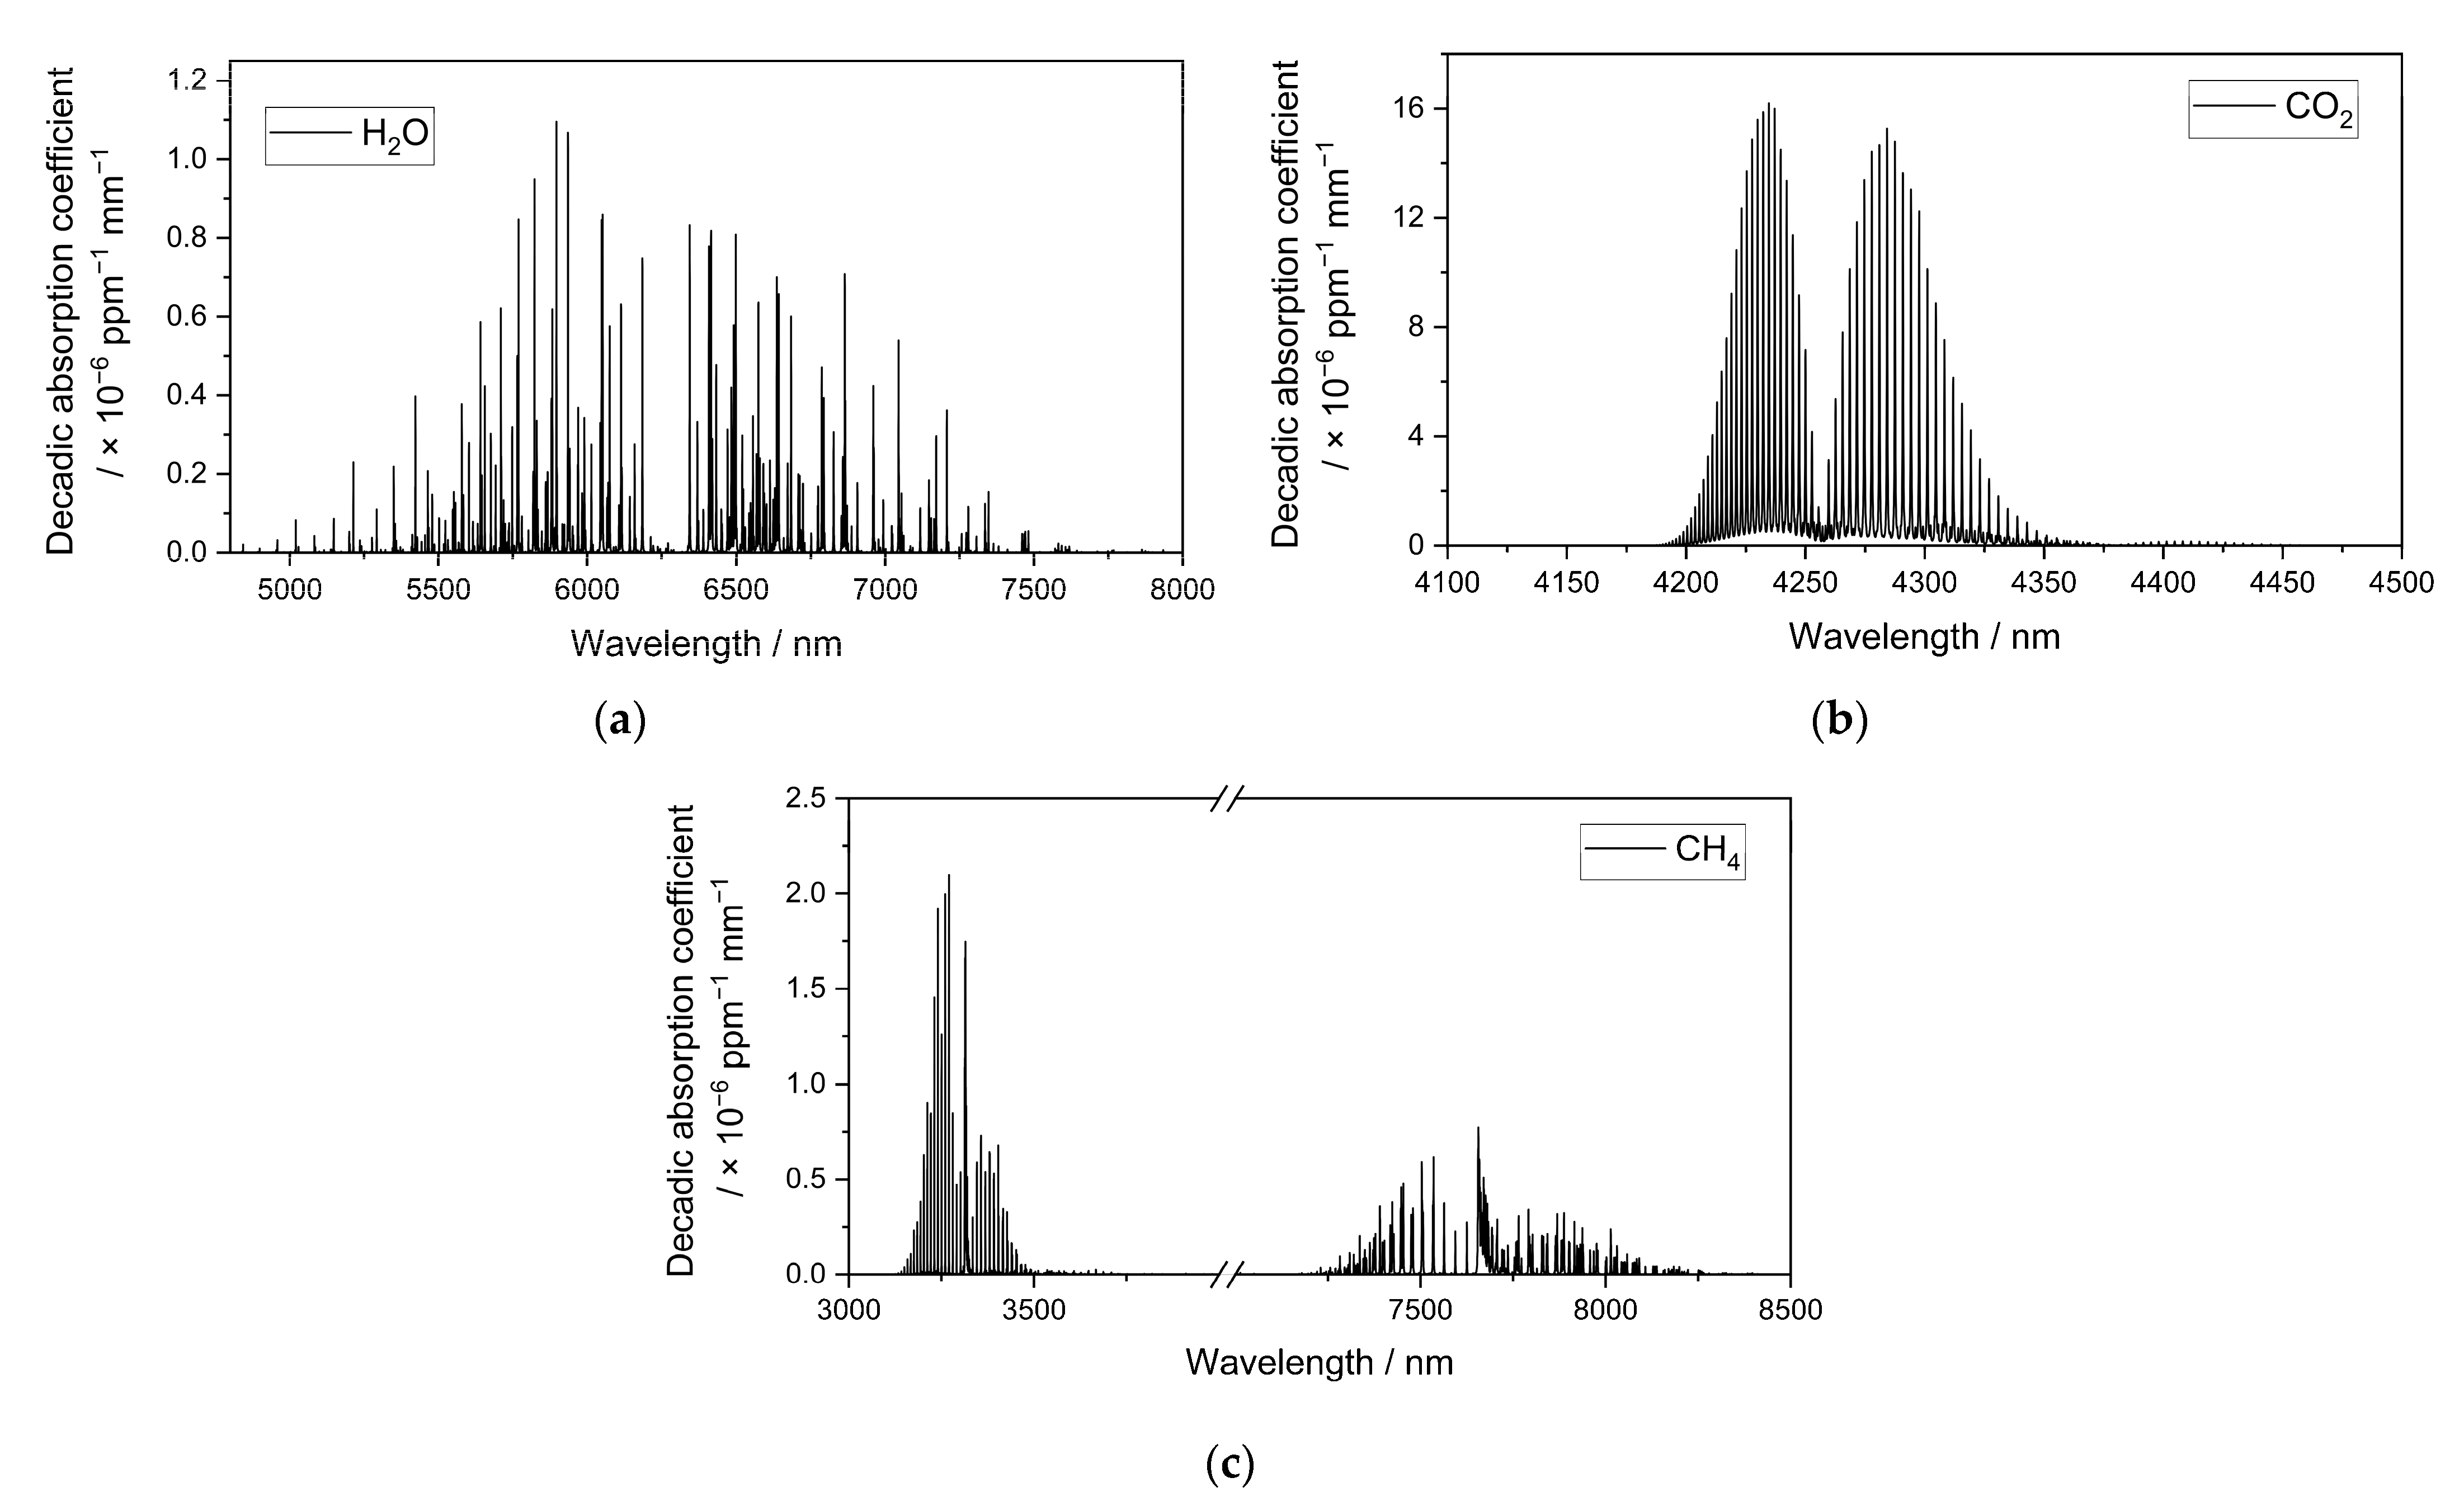
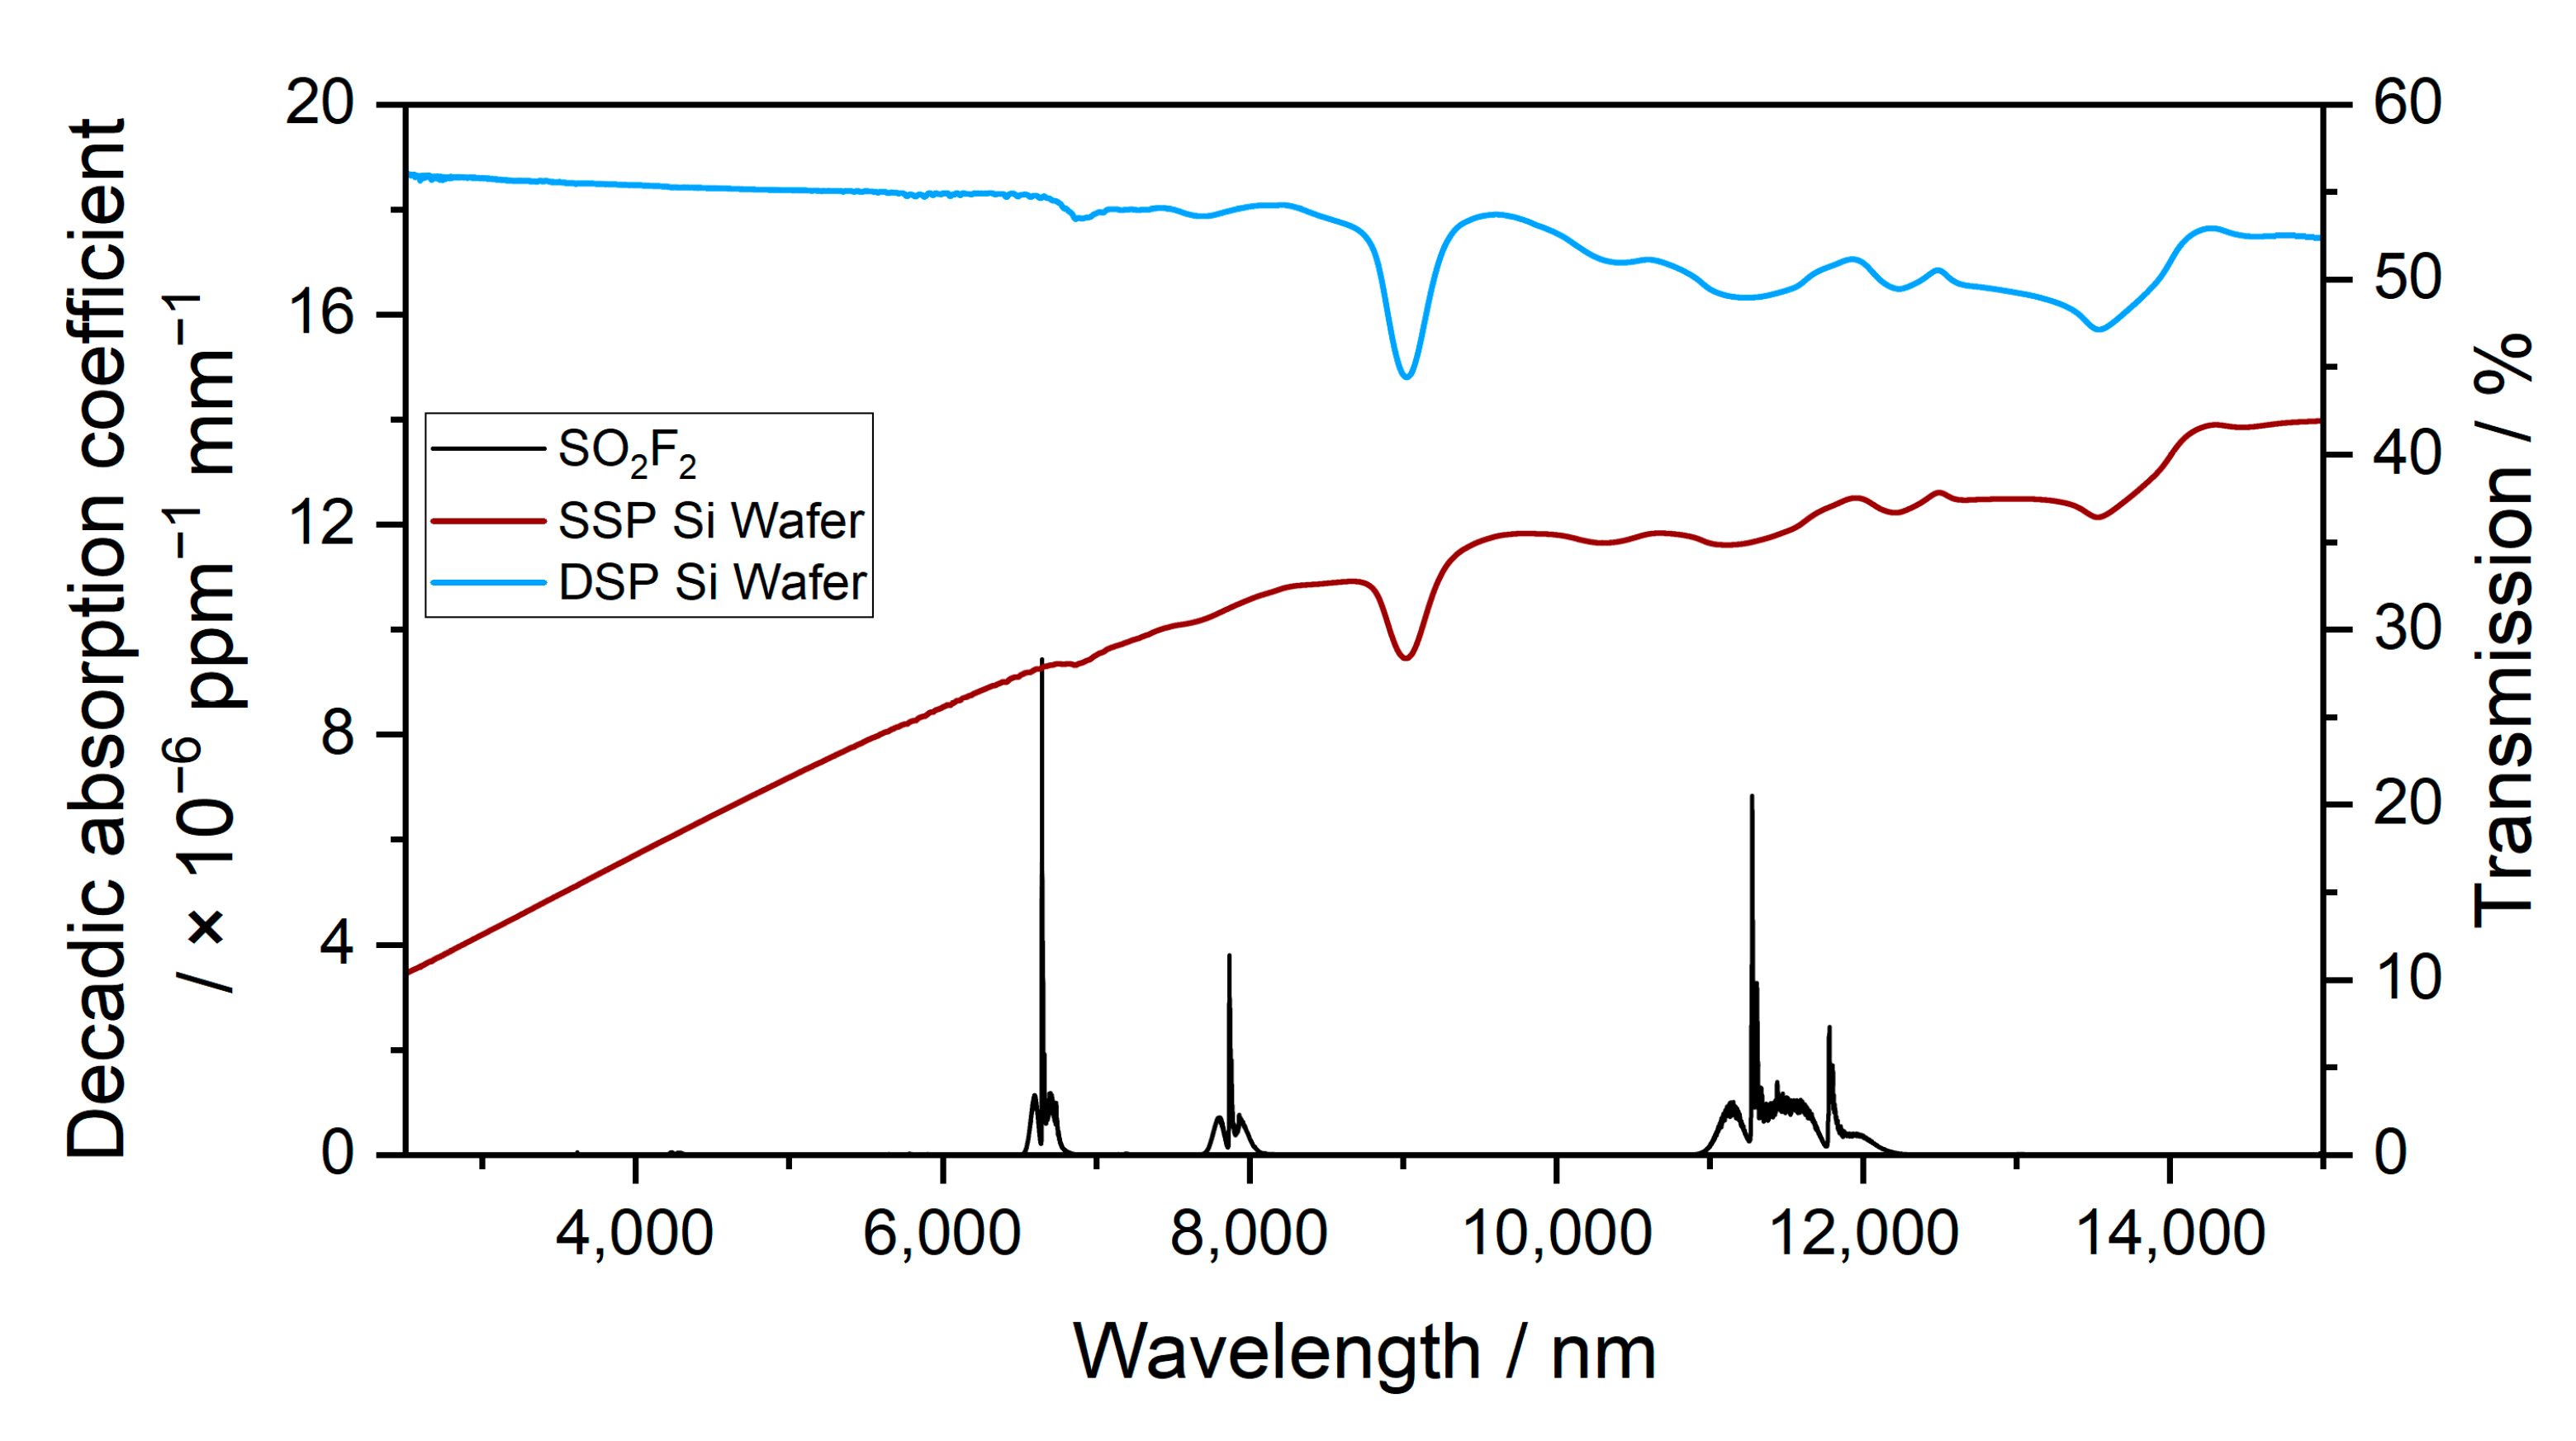
3.1. Infrared Spectroscopic Characteristics of SO2F2 and Refrigerants

The resulting infrared spectra of SO2F2 and the possible substituents are plotted in Figure 3. SO2F2 had three main strong absorption bands in the wavelength range between 6500 and 6800 nm, 7700 and 8100 nm, and 10,500 and 12,200 nm (Figure 3a).
As seen in Figure 3b and Table 2, R227ea had absorption bands that overlapped with SO2F2 between 7700 and 8100 nm, 10,900 and 11,250 nm, and 11,400 and 11,800 nm. R134a had bands that overlapped with the target gas between 6550 and 6800 nm, 7700 and 8050 nm, and 11,000 and 12,200 nm [32]. R125 had bands that overlapped with the target gas between 7700 and 8100 nm and 10,900 and 12,000 nm. Propene had weaker absorption compared with the other refrigerants but also had bands that overlapped with SO2F2 between 6500 and 6800 nm, 7700 and 7800 nm, 7900 and 8100 nm, and 10,950 and 12,000 nm.
Figure 4 shows the decadic absorption spectra of the possibly interfering atmospheric gases H2O, CO2, and CH4, which were calculated and plotted using the HITRAN database [34].

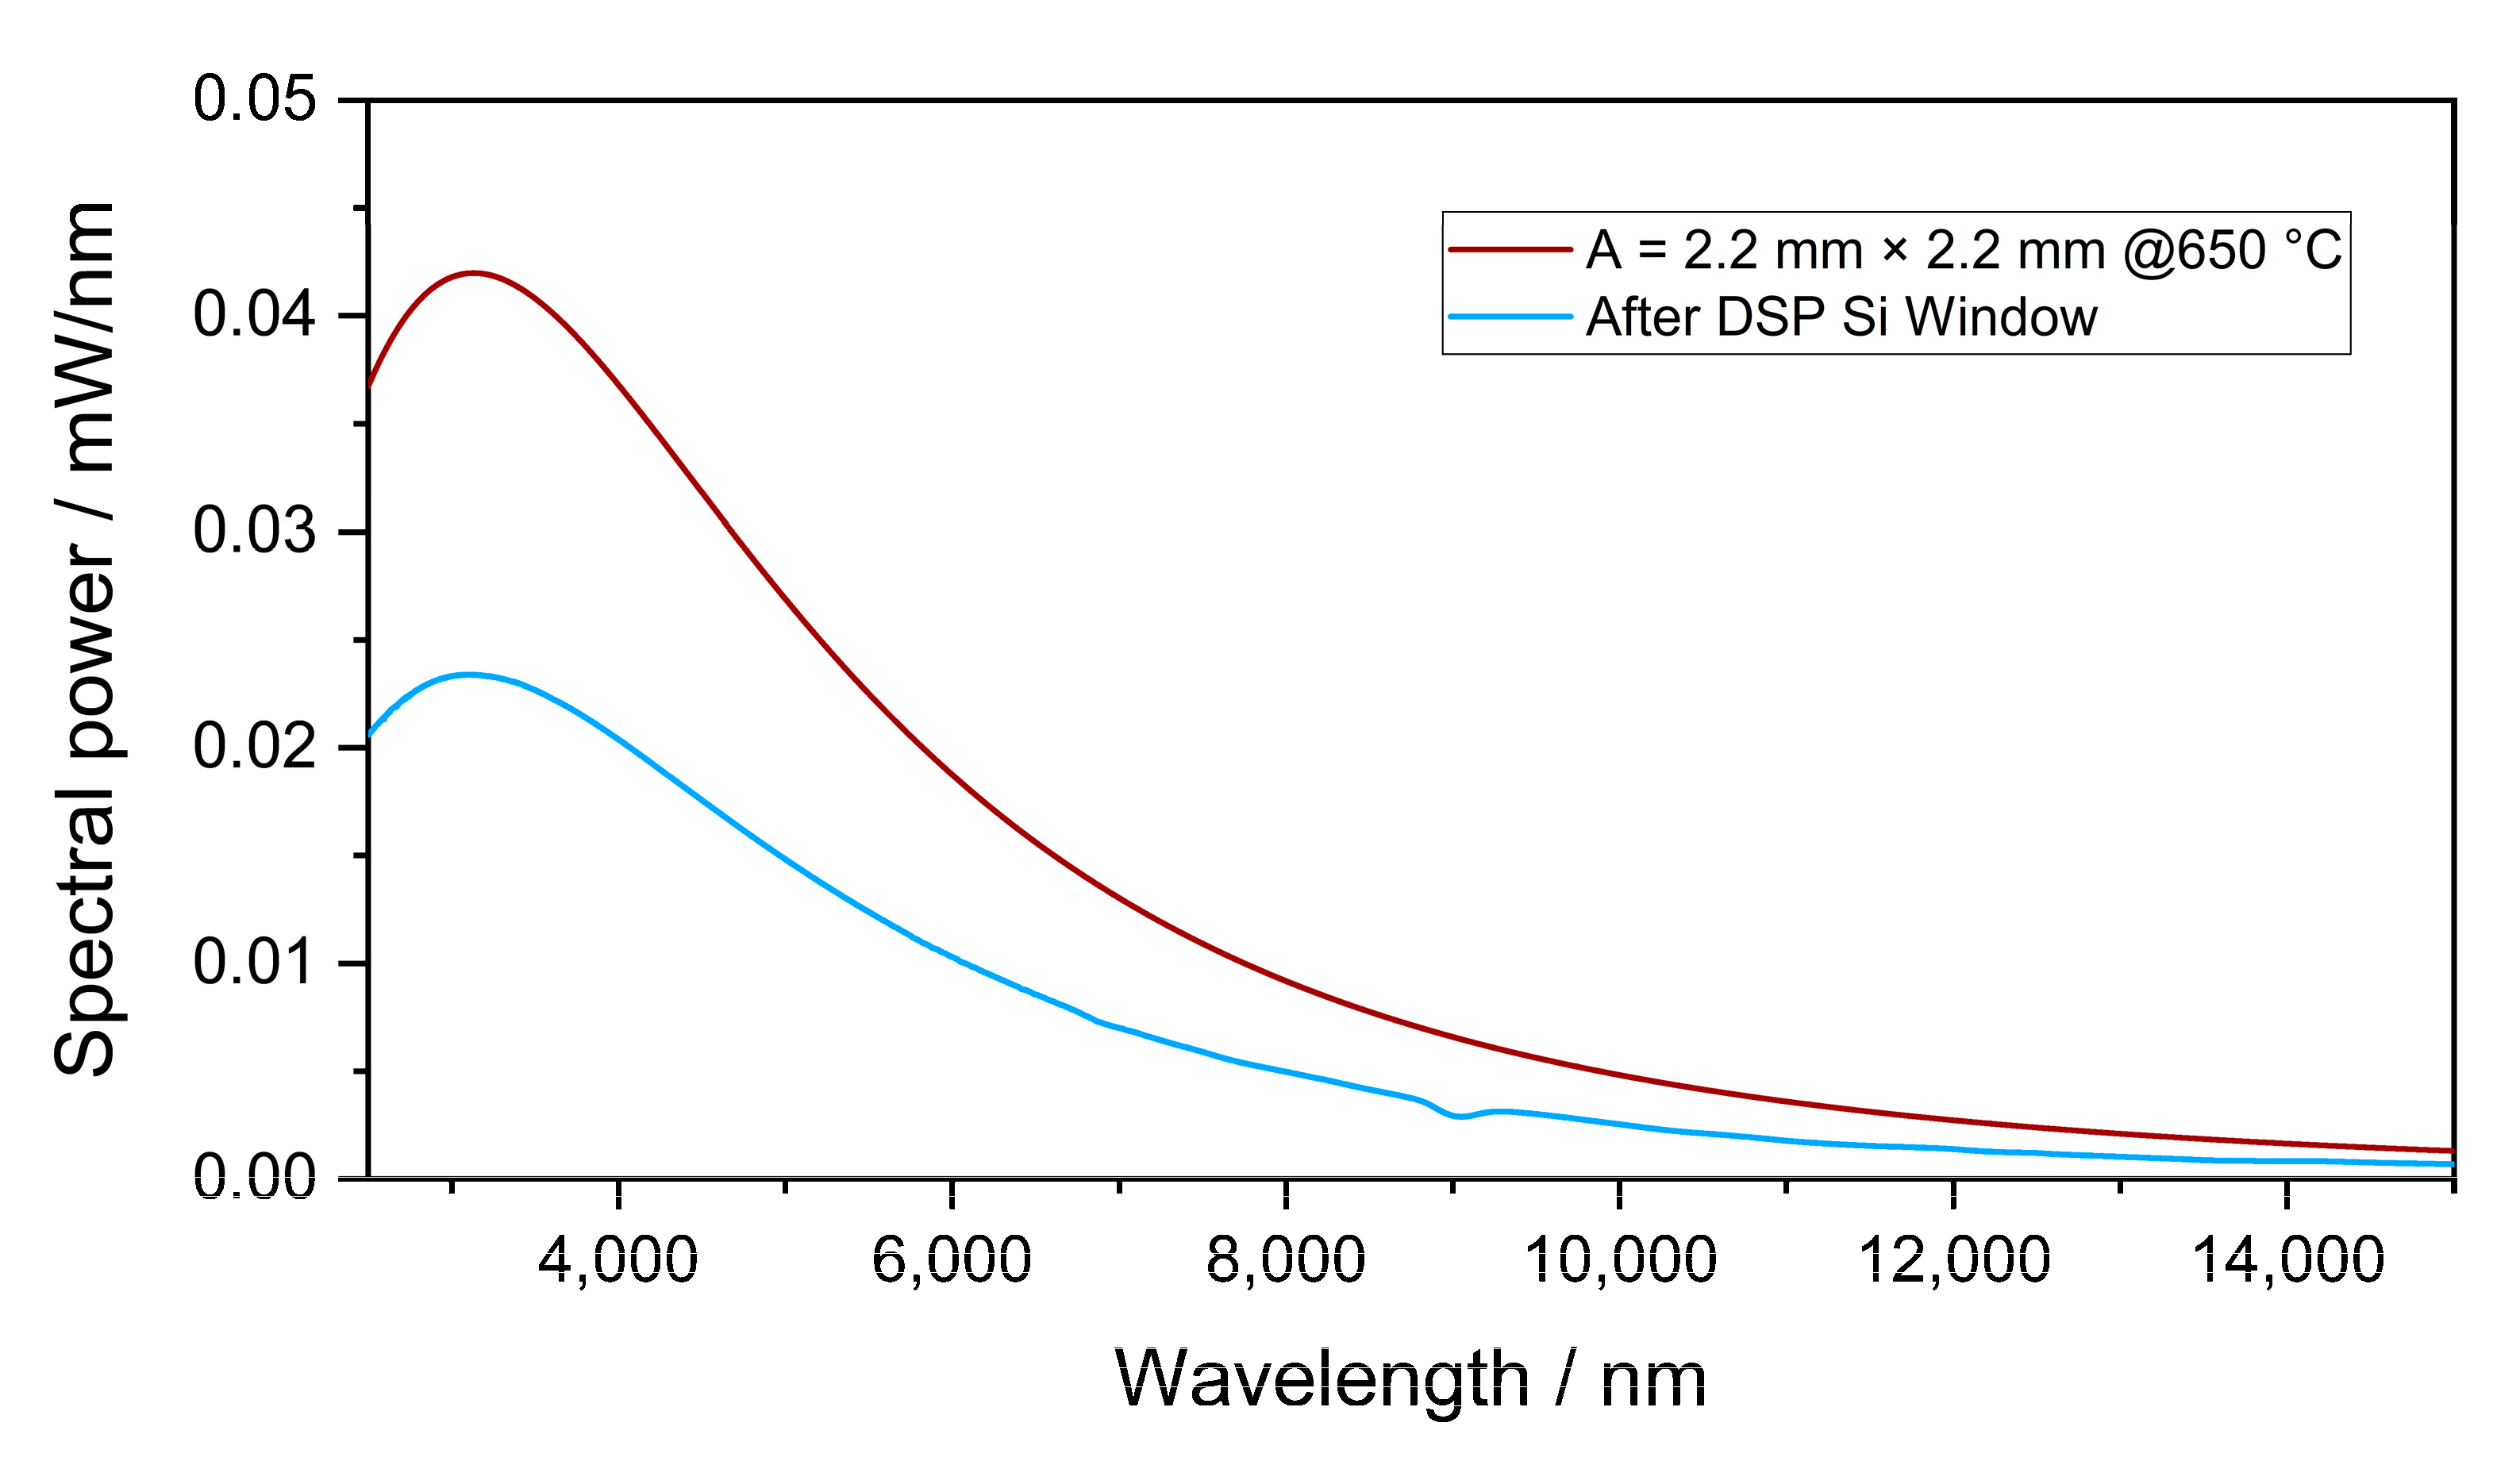
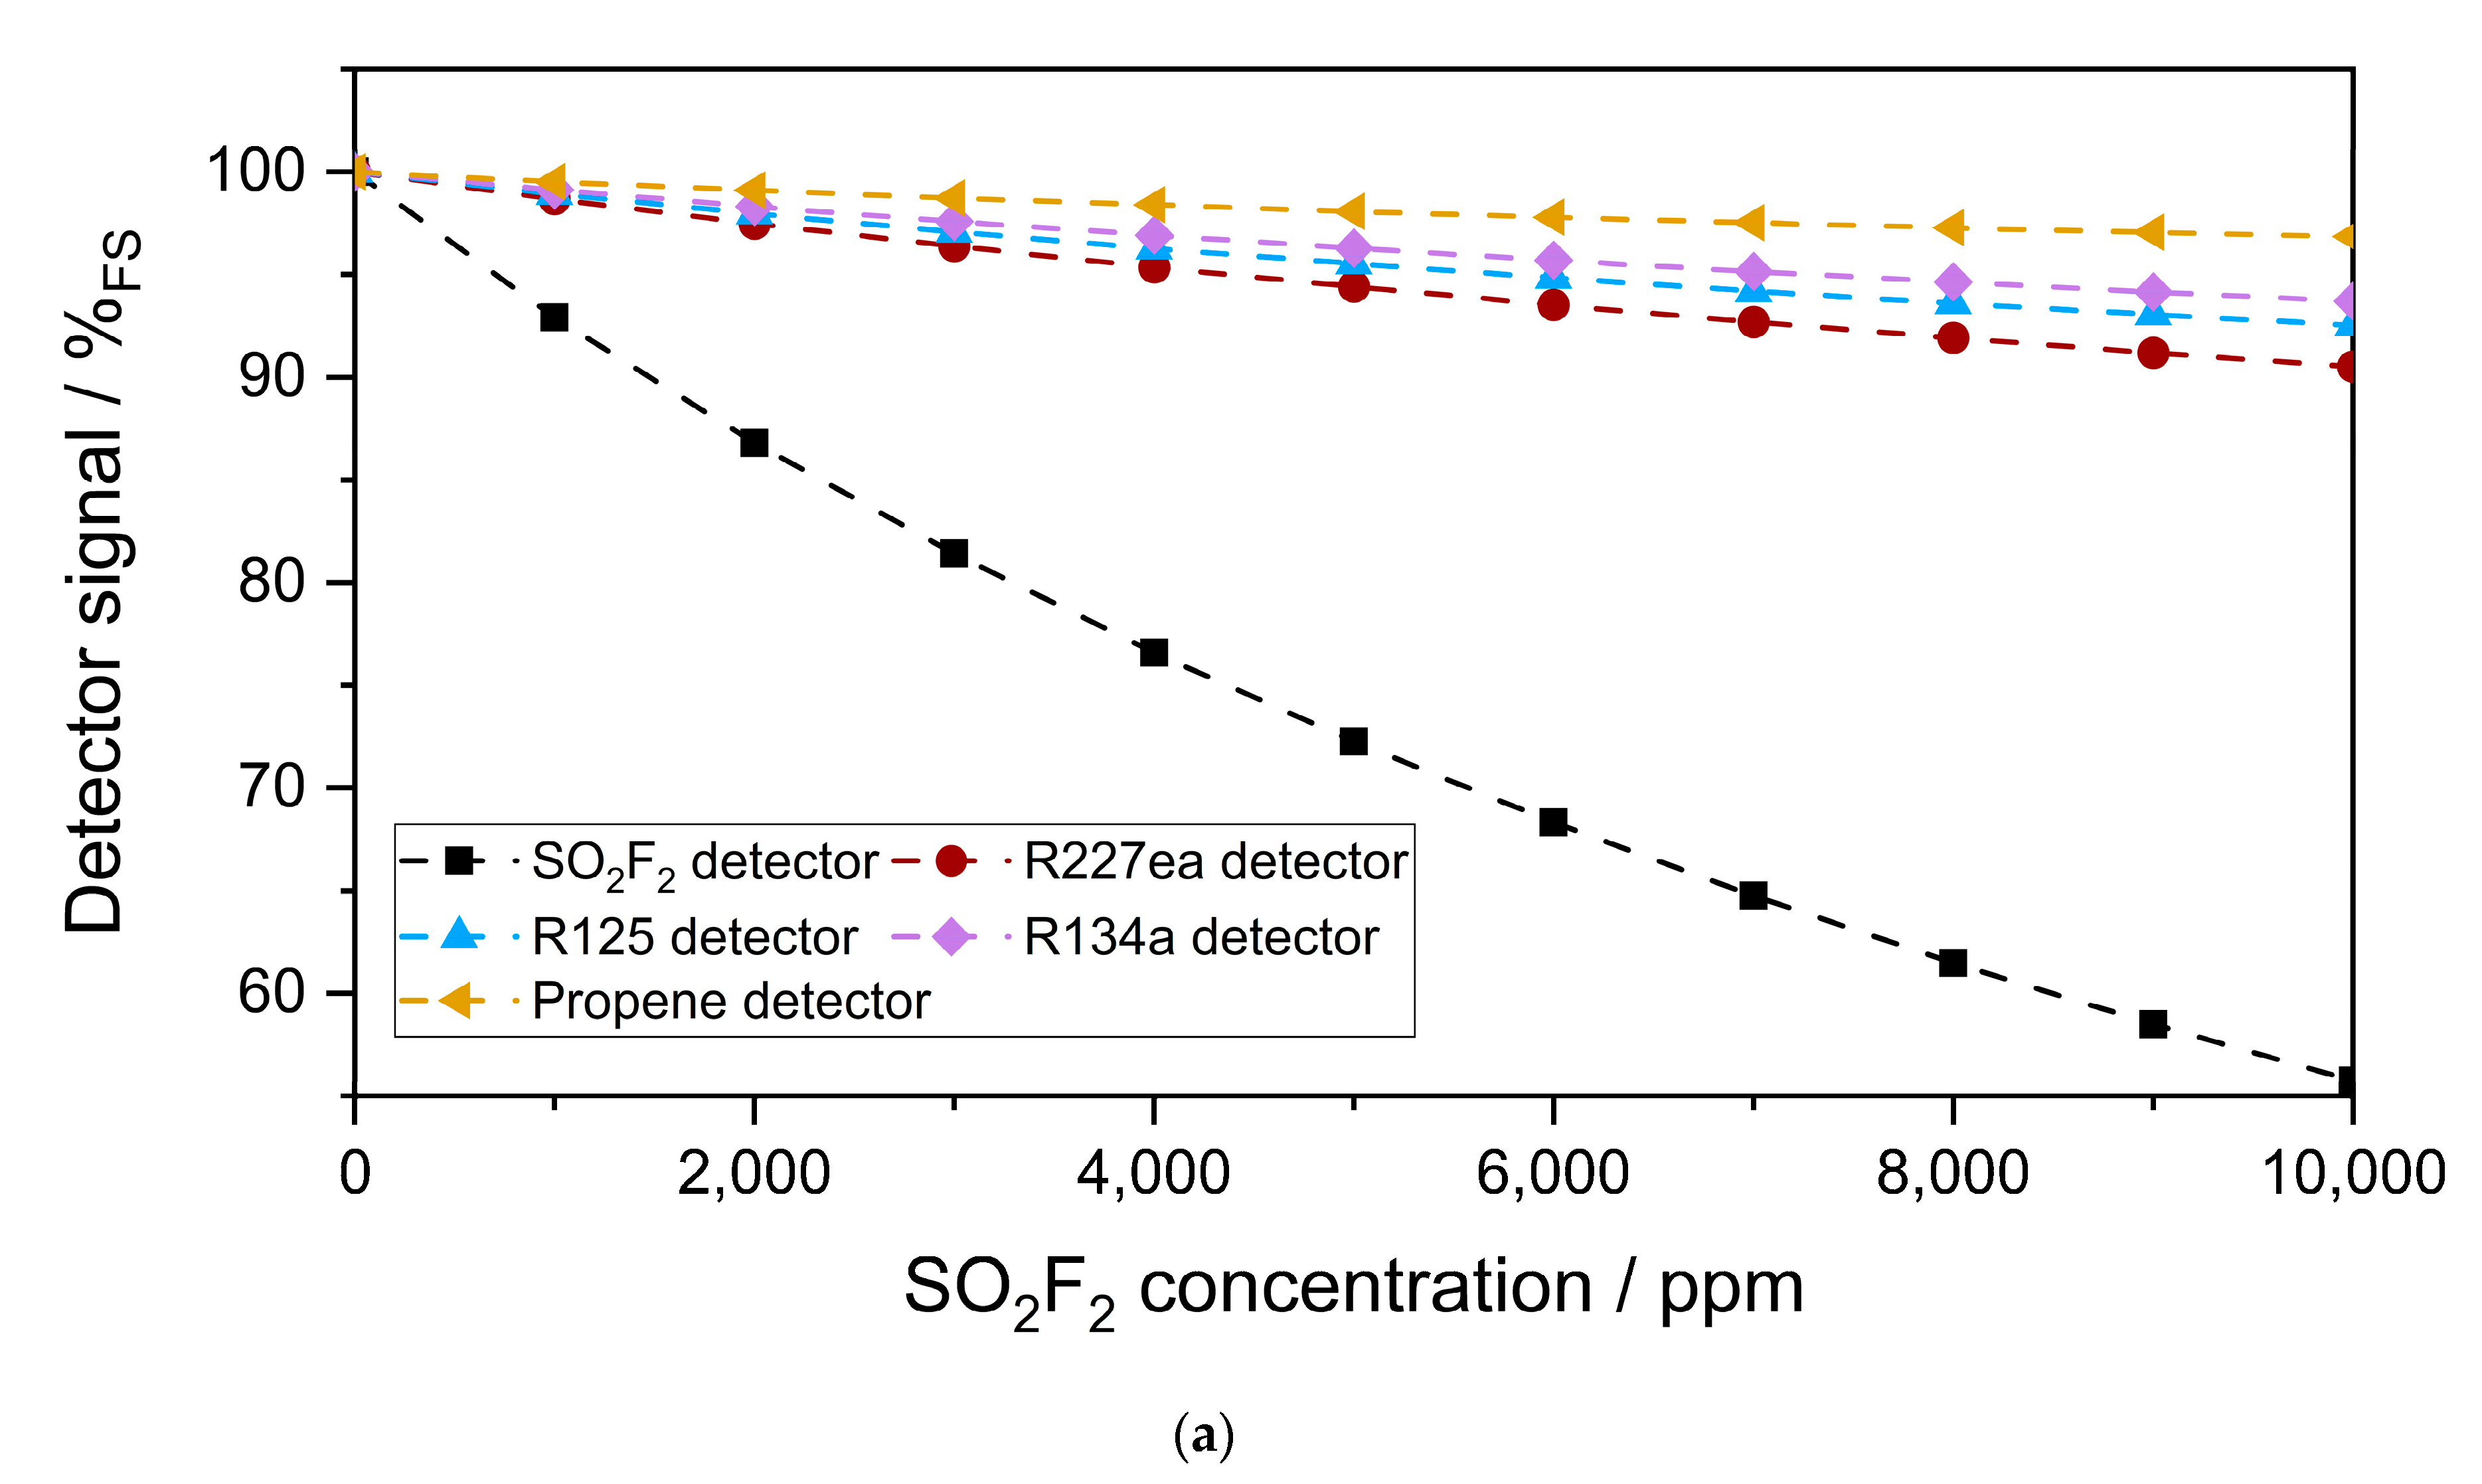
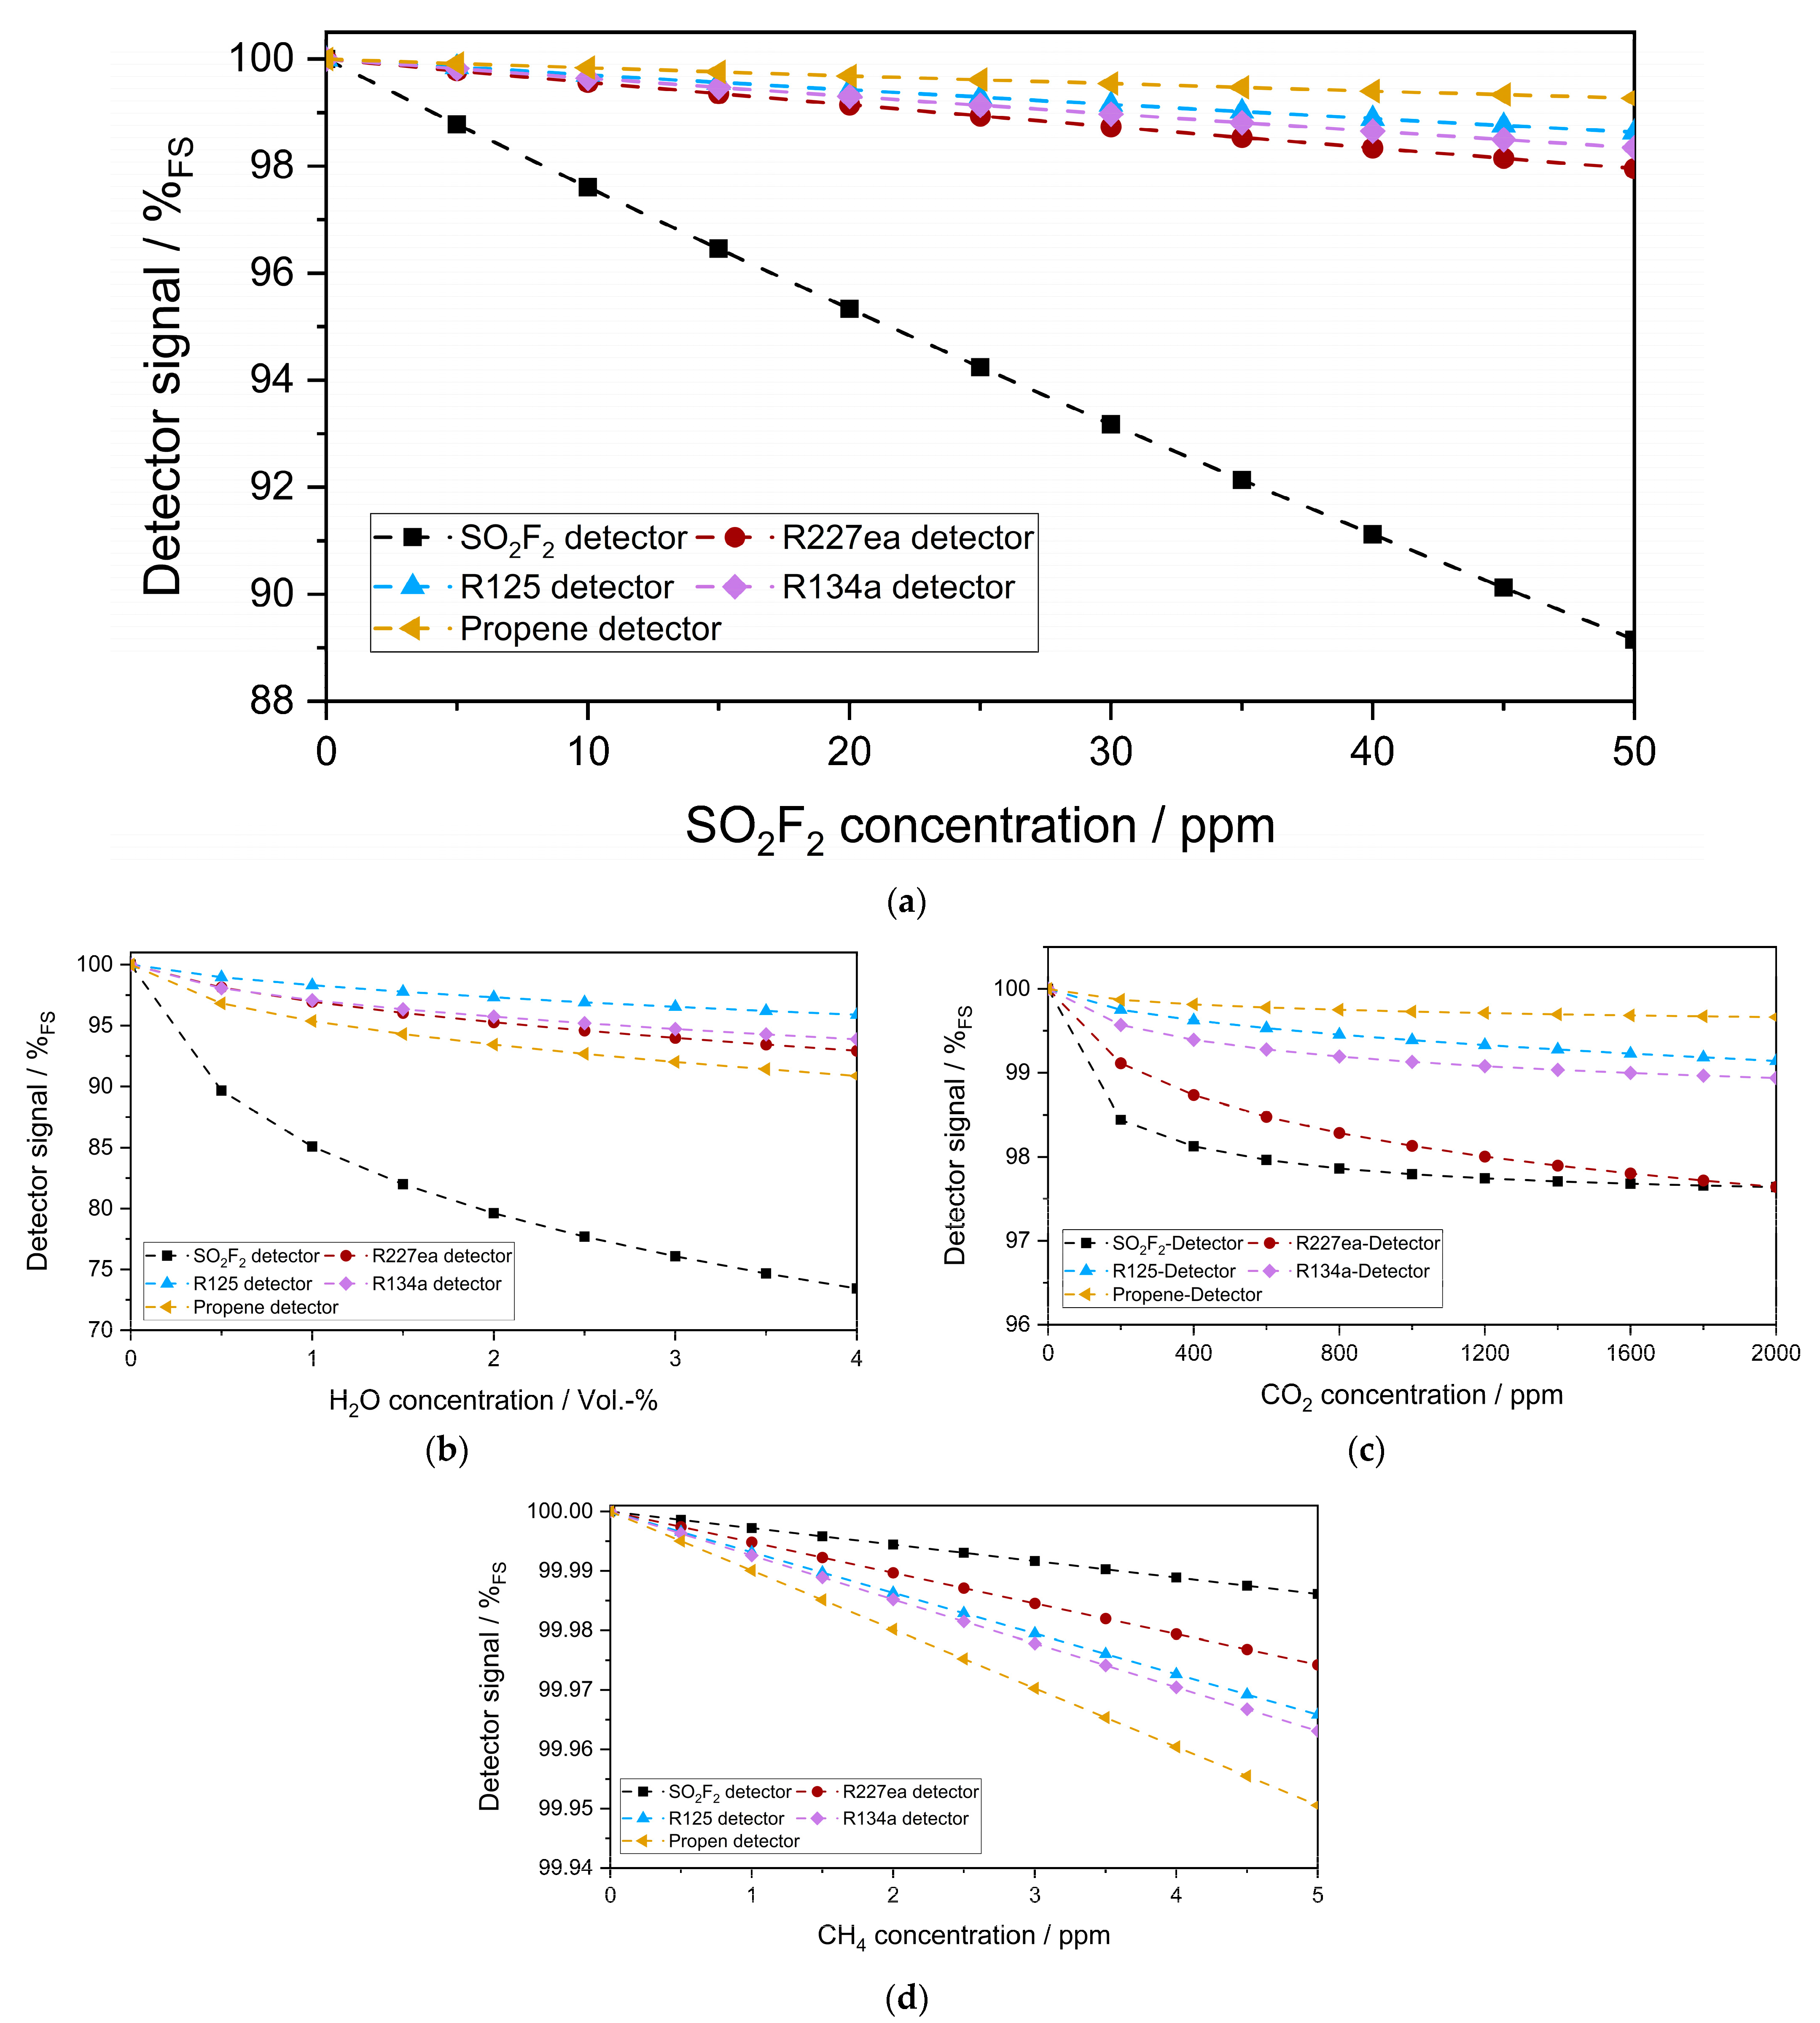
3.2. Simulation of the Sensitivity of the Photoacoustic Detectors

The infrared transmission through 500 µm of SSP Si and 500 µm of DSP Si and the spectrum of SO2F2 in the wavelength range between 2500 and 15,000 nm are shown in Figure 5. The infrared transmission through DSP Si was higher than the transmission though SSP Si. The average infrared transmission through DSP Si was about 52 % in the wavelength ranges where SO2F2 absorbs.
Figure 6 shows the emitted spectral power of the infrared source simulated using Equation 1 with an emitter temperature of 650 °C as well as the transmitted spectral power through DSP Si. According to these simulations, the minimum spectral power transmitted into the detector was about 0.006 mW/nm at wavelengths between 7800 and 8100 nm, and it dropped to about one third at wavelengths between 10,500 and 12,200 nm. Nevertheless, the transmitted power was sufficient for the planned application.
The simulated sensitivity of each photoacoustic detector to 0–10,000 ppm SO2F2 in the absorption cell (50 mm length) is plotted in Figure 7a. As expected, the highest sensitivity was obtained with the SO2F2 detector. Among the substituents, R227ea showed the highest sensitivity to SO2F2. Although R125 absorbed stronger than R227ea, R134a, and propene between 10,500 and 12,200 nm, the absorbance of R227ea between 7700 and 8100 nm was higher than those of R134a, R125, and propene, and the spectral power transmitted through the detector between 7700 and 8100 nm was three times higher than that between 10,500 and 12,200 nm. For this reason, the R227ea detector was more sensitive to SO2F2 than the other detectors. The propene detector showed the lowest sensitivity to SO2F2, which can be explained by its weak infrared absorption compared to the other substituents in the considered wavelength range. Moreover, the relative signal change of the SO2F2 detector versus the SO2F2 concentration change in the absorption cell was not linear, while that of the refrigerant detectors was.
Figure 7b–d show the cross-sensitivity of the photoacoustic detectors to 0–4 Vol.-% H2O, 0–2000 ppm CO2, and 0–5 ppm CH4, respectively. The highest cross-sensitivity was obtained with SO2F2 as the detector gas. The relative signal change of a SO2F2 detector to ambient 0–4 Vol.-% H2O in the absorption cell was 10× lower than that to 0–10,000 ppm SO2F2. This is because the absorption bands of SO2F2 overlap with those of H2O, especially at 6500–6800 nm. The cross-sensitivity of the SO2F2 detector to ambient CO2 (0–2000 ppm) was 4× lower than that to ambient H2O. The lowest cross-sensitivity to ambient H2O was obtained with the R125 detector, while that to CO2 was obtained with propene. The R227ea detector showed a maximum relative signal change of 0.5 % to CO2 and H2O. The cross-sensitivity of the photoacoustic detectors to 0–5 ppm CH4, which is in the range of the relevant background concentration in the atmosphere, was negligible. However, the problem of the cross-sensitivity of the photoacoustic detectors to CO2 and H2O must be taken into account when calibrating the sensors and can be solved by additionally integrating humidity and CO2 sensors into a final sensor system or by integrating a humidity sensor and an IR-blocking filter.
Figure 8a shows the simulated sensitivity of each photoacoustic detector to 0–50 ppm SO2F2 in a long-path absorption cell (1.6 m optical path length). In these simulations, only the concentrations of SO2F2 and the optical path length were changed. Everything else was kept as in the previous simulations. Therefore, R227ea still showed the highest sensitivity to SO2F2 among the substituents. Moreover, the relative signal change of the SO2F2 detector as a function of the SO2F2 concentration change in the long-path absorption cell became linear, like that of the refrigerant detectors. The cross-sensitivity of the photoacoustic detectors to 0–4 Vol.-% H2O and 0–2000 ppm CO2 also became more critical in this case (Figure 8b,c), while the cross-sensitivity to 0–5 ppm CH4 was still low and negligible (Figure 8d).

4. Conclusions

In this article, an investigation of a new photoacoustic detector approach for the measurement of SO2F2 is presented. It is based on the concept of filling a non-toxic substituent gas that has absorption bands that overlap with the target gas into a photoacoustic detector chamber to measure SO2F2 indirectly. The refrigerants R227ea, R125, R134a, and propene were selected as possible substituents. An infrared spectroscopic analysis of SO2F2 and the refrigerants was performed using an FTIR spectrometer. The resulting infrared spectra were used as a basis for simulating the sensitivity of the detector filled with the substituents to SO2F2 in different concentrations and at different optical path lengths. In addition, the cross-sensitivity of the detectors filled with the substituents to ambient CO2 and H2O was simulated. The simulations revealed that R227ea had the highest sensitivity to SO2F2 among the substituents and could be used as a detector gas. Detection limits below 50 ppm and 1.5 ppm could be reached with a 50 mm absorption cell and a 1.6 m long-path absorption cell, respectively, with a thermal broadband emitter and a compact setup. The simulation results also showed the cross-sensitivity of the photoacoustic detectors to ambient gases such as H2O and CO2, which have to be taken into account in experimental studies. Based on these results, photoacoustic sensors for the measurement of SO2F2 will be designed, built, and experimentally characterized in the future.

Author Contributions

Conceptualization, H.Y., C.W., K.S. and J.W.; methodology, C.W., H.Y. and K.S.; software, C.W.; validation, H.Y, C.W. and K.S.; formal analysis, H.Y.; investigation, H.Y. and N.B.; resources, H.Y., C.W. and N.B.; data curation, H.Y. and C.W.; writing—original draft preparation, H.Y. and K.S.; writing—review and editing, J.W.; visualization, H.Y.; supervision, K.S. and J.W.; project administration, K.S.; funding acquisition, K.S. All authors have read and agreed to the published version of the manuscript.

Funding

This research was funded by the German Federal Ministry of Education and Research, grant number 13N15732 (“MICON”).

Data Availability Statement

The data presented in this study are available in [this article].

Conflicts of Interest

The authors declare no conflict of interest.

References

  1. Derrick, M.R.; Burgess, H.D.; Baker, M.T.; Binnie, N.E. Sulfuryl fluoride (Vikane): A review of its use as a fumigant. J. Am. Inst. Conserv. 1990, 29, 77–90. [Google Scholar] [CrossRef]
  2. NIOSH Pocket Guide to Chemical Hazards. “#0581”; National Institute for Occupational Safety and Health (NIOSH): Washington, DC, USA, 2019.
  3. Veryser, C.; Demaerel, J.; Bieliūnas, V.; Gilles, P.; De Borggraeve, W.M. Ex situ generation of sulfuryl fluoride for the synthesis of aryl fluorosulfates. Org. Lett. 2017, 19, 5244–5247. [Google Scholar] [CrossRef] [PubMed]
  4. Gressent, A.; Rigby, M.; Ganesan, A.L.; Prinn, R.G.; Manning, A.J.; Mühle, J.; Salameh, P.K.; Krummel, P.B.; Fraser, P.J.; Steele, L.P.; et al. Growing atmospheric emissions of sulfuryl fluoride. J. Geophys. Res. Atmos. 2021, 126, e2020JD034327. [Google Scholar] [CrossRef]
  5. Papadimitriou, V.C.; Portmann, R.W.; Fahey, D.W.; Mühle, J.; Weiss, R.F.; Burkholder, J.B. Experimental and theoretical study of the atmospheric chemistry and global warming potential of SO2F2. J. Phys. Chem. A 2008, 112, 12657–12666. [Google Scholar] [CrossRef] [PubMed]
  6. Sulbaek Andersen, M.P.; Blake, D.R.; Rowland, F.S.; Hurley, M.D.; Wallington, T.J. Atmospheric chemistry of sulfuryl fluoride: Reaction with OH radicals, Cl atoms and O3, atmospheric lifetime, IR spectrum, and global warming potential. Environ. Sci. Technol. 2009, 43, 1067–1070. [Google Scholar] [CrossRef]
  7. Mühle, J.; Huang, J.; Weiss, R.F.; Prinn, R.G.; Miller, B.R.; Salameh, P.K.; Simmonds, P.G. Sulfuryl fluoride in the global atmosphere. J. Geophys. Res. Atmos. 2009, 114, D05306. [Google Scholar] [CrossRef] [Green Version]
  8. Roshni, V.; Harikumar, V.S. Fluoride contamination in wetlands of Kuttanad, India: Predisposing edaphic factors. Eurasian Soil Sci. 2021, 10, 61–68. [Google Scholar] [CrossRef]
  9. Qian, H.; Deng, J.; Xie, Z.; Pan, Z.; Zhang, J.; Zhou, H. Adsorption and gas sensing properties of the Pt3-MoSe2 monolayer to SOF2 and SO2F2. ACS Omega 2020, 5, 7722–7728. [Google Scholar] [CrossRef] [Green Version]
  10. Liu, H.; Zhou, Q.; Zhang, Q.; Hong, C.; Xu, L.; Jin, L.; Chen, W. Synthesis, characterization and enhanced sensing properties of a NiO/ZnO p–n junctions sensor for the SF6 decomposition byproducts SO2, SO2F2, and SOF2. Sensors 2017, 17, 913. [Google Scholar] [CrossRef] [Green Version]
  11. Li, L.; Din, S.U.; ul Haq, M.; Tang, N.; Zhang, M.; Rahman, N.; Zhu, L. Room temperature monitoring of SF6 decomposition byproduct SO2F2 based on TiO2/NiSO4 composite nanofibers. Nanotechnology 2021, 32, 305705. [Google Scholar] [CrossRef]
  12. Gui, Y.; Wang, Y.; Duan, S.; Tang, C.; Zhou, Q.; Xu, L.; Zhang, X. Ab initio study of SOF2 and SO2F2 adsorption on Co-MoS2. ACS Omega 2019, 4, 2517–2522. [Google Scholar] [CrossRef] [PubMed] [Green Version]
  13. Liu, Z.; Gui, Y.; Xu, L.; Chen, X. Adsorption and sensing performances of transition metal (Ag, Pd, Pt, Rh, and Ru) modified WSe2 monolayer upon SF6 decomposition gases (SOF2 and SO2F2). Appl. Surf. Sci. 2022, 581, 152365. [Google Scholar] [CrossRef]
  14. Gui, X.; Zhou, Q.; Peng, S.; Xu, L.; Zeng, W. Adsorption behavior of Rh-doped MoS2 monolayer towards SO2, SOF2, SO2F2 based on DFT study. Phys. E Low-Dimens. Syst. Nanostruct. 2020, 122, 114224. [Google Scholar] [CrossRef]
  15. Fá, A.G.; Faccio, R.; López-Corral, I. Detection of SOF2 and SO2F2 through aluminium nitride nanosheets: A DFT study. Appl. Surf. Sci. 2021, 538, 147899. [Google Scholar]
  16. Huang, H.; Yu, Y.; Zhang, M. Analysis of adsorption properties of SF6 decomposed gases (SOF2, SO2F2, SF4, CF4, and HF) on Fe-doped SWCNT: A DFT study. Appl. Surf. Sci. 2020, 505, 144622. [Google Scholar] [CrossRef]
  17. Dinh, T.V.; Choi, I.Y.; Son, Y.S.; Kim, J.C. A review on non-dispersive infrared gas sensors: Improvement of sensor detection limit and interference correction. Sens. Actuators B 2016, 231, 529–538. [Google Scholar] [CrossRef]
  18. Bogue, R. Detecting gases with light: A review of optical gas sensor technologies. Sens. Rev. 2015, 35, 133–140. [Google Scholar] [CrossRef]
  19. Naik, R.C.; Shroff, R.D. NDIR based SO2F2 detector for fumigation monitoring. In Proceedings of the 9th International Conference on Controlled Atmosphere and Fumigation in Stored Products, Antalya, Turkey, 15–19 October 2012; pp. 374–379. [Google Scholar]
  20. Yao, Q.; Yan, X.; He, S.; Qi, R.; Li, X.; Zeng, X.-Z.; Wang, X.; Zhang, S.; Zi, J.; Yue, Y. Detection of SO2F2 concentration of SF6 decomposition product in GIS gas chamber based on ICL-TDLAS. Adv. Sens. Syst. Appl. XI 2021, 11901, 179–188. [Google Scholar]
  21. Zhang, S.; Qiang, Y. Study on the suitable intermediate infrared spectrum optical detection applied to SO2F2 and SOF2. Int. Workshop Adv. Algorithms Control. Eng. 2022, 12350, 445–453. [Google Scholar]
  22. Bozóki, Z.; Pogany, A.; Szabo, G. Photoacoustic instruments for practical applications: Present, potentials, and future challenges. Appl. Spectrosc. Rev. 2011, 46, 1–37. [Google Scholar] [CrossRef]
  23. Hodgkinson, J.; Tatam, R.P. Optical gas sensing: A review. Meas. Sci. Technol. 2012, 24, 012004. [Google Scholar] [CrossRef] [Green Version]
  24. West, G.A.; Barrett, J.J.; Siebert, D.R.; Reddy, K.V. Photoacoustic spectroscopy. Rev. Sci. Instrum. 1983, 54, 797–817. [Google Scholar] [CrossRef]
  25. Schilt, S.; Thévenaz, L.; Niklès, M.; Emmenegger, L.; Hüglin, C. Ammonia monitoring at trace level using photoacoustic spectroscopy in industrial and environmental applications. Spectrochim. Acta Part A Mol. Biomol. Spectrosc. 2004, 60, 3259–3268. [Google Scholar] [CrossRef] [PubMed]
  26. Sigrist, M.W. Trace gas monitoring by laser-photoacoustic spectroscopy. Infrared Phys. Technol. 1995, 36, 415–425. [Google Scholar] [CrossRef]
  27. Bian, C.; Dai, F.; Cheng, J.; Chen, X.; Gan, Q.; Zhang, Z.; Tan, T.; Yang, B.; Wang, C.; Cui, G.; et al. Detection of SF6 decomposition components SO2F2 and SOF2 based on mid-infrared laser photoacoustic spectroscopy. Int. Symp. High Volt. Eng. 2021, 1949–1953. [Google Scholar] [CrossRef]
  28. Minini, K.M.S.; Bueno, S.C.E.; da Silva, M.G.; Sthel, M.S.; Vargas, H.; Angster, J.; Miklós, A. Quantum cascade laser-based photoacoustic sulfuryl fluoride sensing. Appl. Phys. B 2017, 123, 1–5. [Google Scholar] [CrossRef]
  29. Zhang, Y.; Wang, M.; Yu, P.; Liu, Z. Optical Gas-Cell Dynamic Adsorption in a Photoacoustic Spectroscopy-Based SOF2 and SO2F2 Gas Sensor. Sensors 2022, 22, 7949. [Google Scholar] [CrossRef]
  30. Zhang, Y.; Wang, M.; Yu, P.; Liu, Z. Optical gas sensing of sub-ppm SO2F2 and SOF2 from SF6 decomposition based on photoacoustic spectroscopy. IET Optoelectron. 2022, 16, 277–282. [Google Scholar] [CrossRef]
  31. Huber, J.; Ambs, A.; Rademacher, S.; Wöllenstein, J. A selective, miniaturized, low-cost detection element for a photoacoustic CO2 sensor for room climate monitoring. Proc. Eng. 2014, 87, 1168–1171. [Google Scholar] [CrossRef]
  32. El-Safoury, M.; Weber, C.; Kiesewetter, O.; Hespos, Y.; Eberhardt, A.; Schmitt, K.; Wöllenstein, J. Miniaturized photoacoustic detection of organofluorine-based refrigerants. J. Sens. Sens. Sys. 2020, 9, 89–97. [Google Scholar] [CrossRef]
  33. Kuznetsova, T.I.; Lebedev, V.S. Transmission of visible and near-infrared radiation through a near-field silicon probe. Phys. Rev. B 2004, 70, 035107. [Google Scholar] [CrossRef]
  34. Gordon, I.E.; Rothman, L.S.; Hill, C.; Kochanov, R.V.; Tan, Y.; Bernath, P.F.; Birk, M.; Boudon, V.; Campargue, A.; Chance, K.V.; et al. The HITRAN2016 Molecular Spectroscopic Database. J. Quant. Spectrosc. Radiat. Transf. 2017, 203, 3–69. [Google Scholar] [CrossRef]
  35. Demtröder, W. Experimentalphysik 2: Elektrizität und Optik; Springer: Berlin/Heidelberg, Germany, 2018; Volume 2. [Google Scholar]
  36. Baehr, H.D.; Stephan, K. Wärme-Und Stoffübertragung; Springer: Berlin, Germany, 1994; Volume 7. [Google Scholar]
Figure 1. Scheme of a two-chamber photoacoustic sensor. The light of a modulated source passes through the absorption cell with an unknown target gas concentration. The detector cell with the microphone is hermetically sealed and filled with the target gas or a substituent. The detector signal decreases with an increasing target gas concentration in the absorption cell.
Sensors 23 00180 g001
Figure 2. (a) CAD model of the designed lid. An aluminum cylinder (250 mm × 15 mm × 360 mm) with a polycarbonate plate (250 mm × 15 mm) was fixed with screws to a rectangular aluminum plate (282 mm × 293 mm × 10 mm). (b) Measurement setup with the lid fixed to the FTIR spectrometer with the long-path gas cell inside. The gas inlet was connected to one of the bulkhead fittings on the outside of the lid, and a second bulkhead fitting was connected to the gas exhaust. The inlet and the outlet of the long-path gas cell were connected to the respective bulkhead fittings on the inside of the lid.
Sensors 23 00180 g002
Figure 3. (a) Decadic absorption coefficient spectrum of SO2F2 between 2500 and 15,000 nm and the decadic adsorption coefficient spectra of the possible substituents R227ea (b); R134a (c) [32]; R125 (d) and propene (e) in standard conditions.
Sensors 23 00180 g003
Figure 4. Decadic absorption coefficient spectra of (a) H2O between 4500 and 8000 nm, (b) CO2 between 4100 nm and 4500 nm, and (c) CH4 between 3000 nm and 8500 nm in standard conditions, which were calculated and plotted using the HITRAN database [34].
Sensors 23 00180 g004
Figure 5. Decadic absorption coefficient spectrum of SO2F2 and the infrared transmission through 500 µm of SSP Si and 500 µm of DSP Si between 2500 and 15,000 nm.
Sensors 23 00180 g005
Figure 6. Simulated emitted spectral power of the infrared emitter with an emitter temperature of 650 °C and an active area of 2.2 mm × 2.2 mm and the transmitted spectral power through DSP Si.
Sensors 23 00180 g006
Figure 7. (a) Simulated sensitivity of the photoacoustic detectors to 0–10,000 ppm SO2F2 in the absorption cell (50 mm length) and the cross-sensitivity to ambient H2O (0–4 Vol.-%) (b) and ambient CO2 (0–2000 ppm) (c) as well as ambient CH4 (0–5 ppm) (d).
Sensors 23 00180 g007aSensors 23 00180 g007b
Figure 8. (a) Simulated sensitivity of the photoacoustic detectors to 0–50 ppm SO2F2 in the absorption cell (1.6 m) and the cross-sensitivity to ambient H2O (0–4 Vol.-%) (b) ambient CO2 (0–2000 ppm) (c) and ambient CH4 (0–5 ppm) (d).
Sensors 23 00180 g008
Table 1. Parameters used for the transmission measurements with the FTIR spectrometer (Vertex 80v, Bruker).
Detector TypeLN-MCT Photoconductor
Resolution0.08 cm−1
Mirror velocity80 kHz
Acquisition modeSingle-sided, forward–backward
Phase correction methodMertz
Apodization functionThree-term Blackman–Harris window
Table 2. List of the substituent gases with the wavelength ranges of absorption that overlapped with SO2F2.
SubstituentWavelength Range of Absorption Overlapping with SO2F2 (nm)
R227ea7700–8100
10,900–11,250
11,400–11,800
R134a [32]6550–6800
7700–8050
11,000–12,200
R1257700–8100
10,900–12,000
Propene6500–6800
7700–7800
7900–8100
10,950–12,000
Disclaimer/Publisher’s Note: The statements, opinions and data contained in all publications are solely those of the individual author(s) and contributor(s) and not of MDPI and/or the editor(s). MDPI and/or the editor(s) disclaim responsibility for any injury to people or property resulting from any ideas, methods, instructions or products referred to in the content.

