Article

A Novel Elastomer-Based Inclinometer for Ultrasensitive Bridge Rotation Measurement

1
School of Civil Engineering, Central South University, Changsha 410075, China
2
Institute of Urban Smart Transportation & Safety Maintenance, College of Civil and Transportation Engineering, Shenzhen University, Shenzhen 518060, China
*
Author to whom correspondence should be addressed.
Sensors 2022, 22(7), 2715; https://doi.org/10.3390/s22072715
Submission received: 10 March 2022 / Revised: 29 March 2022 / Accepted: 30 March 2022 / Published: 1 April 2022
(This article belongs to the Topic Recent Advances in Structural Health Monitoring)

Abstract

:
Bridge deformation consists of cross-section rotation and deflection, which are crucial parameters for bridge capacity evaluation and damage detection. The maximum value of deflection usually happens at mid-span while for rotation it happens at two-ends. Therefore, compared with deflection, rotation is more convenient for in-situ measurement since the bridge pier can be the reference point. In this study, a high-precision inclinometer for bridge rotation measurement was conceptualized, designed, and validated. The proposed inclinometer converted the small rotation of bridge section into the deformation of an elastomer. Strain gauges were then utilized to measure the elastomer deformation and thus the bridge rotation can be obtained. The dimensions and modulus of the elastomer were designed and chosen based on the theoretical analysis. Characteristics of the inclinometer were calibrated in lab and in-situ experiments at an in-service bridge were conducted to validate its feasibility and robustness. Test results showed that the proposed inclinometer had excellent performance in resolution and accuracy, which indicate its great potential for future bridge health monitoring.

1. Introduction

Load effects such as strain, deflection, rotation, and acceleration are commonly used for bridge capacity evaluation and damage detection [1,2,3,4,5,6,7,8]. Deflection reflects the overall deformation of a bridge structure. Current methods for bridge deflection monitoring usually measure the distance between the bridge and a fixed reference point. Based on the location of the reference point, different sensors/equipment can be used: linear variable differential transformer (LVDT) [9], total station [10], machine vision [11], laser vibrometer [12,13], radar [14], and global navigation satellite system (GNSS) [15,16]. LVDT-based monitoring is a contact method with high accuracy for dynamic measurement. Machine vision, laser vibrometer, and other non-contact monitoring methods are characterized by relatively low precision and insufficient resolution, and thus are not suitable for dynamic or real-time monitoring. They can be used for monitoring large-scale or long-term deflection. Generally, the maximum deflection of a bridge structure occurs in the mid-span section, making it difficult to monitor since no fixed reference point is available. For this reason, deflection measurement is limited in practical application for bridge evaluation.
Similar to deflection, bridge rotation also reflects the overall deformation of a bridge structure. Compared with deflection, the rotation of a bridge section can be measured relative to the vertical direction without using any physical reference point. Therefore, rotation measurement for bridge health monitoring has gradually become a popular research topic. However, rotation measurement is challenging in conventional understanding since the rotation absolute value for any civil engineering infrastructure is limited and not on a magnified scale. To address this issue, many researchers developed various techniques for rotation measurement in the past decade [17,18,19]. So far, rotation monitoring methods are generally based on the gravity pendulum setup and then convert or magnify the angular information into other types of measurable parameters such as resistance, capacitance, magnetic field, or optical parameters [20], etc.
In many studies, the rotation data of different bridge sections have been used to indirectly calculate or reconstruct the deflection and deformation of the bridge superstructure [21,22,23,24]. Zhai et al. [25] proposed a method to identify the modal parameters of a simply supported beam based on the inclination angle data. Hoult [26] used a rotation sensor network to monitor the long-term changes in boundary conditions of long-span bridges. Many recent studies also have used rotation data for the damage detection [27,28]. Alamdari et al. [29] proposed a rotation-based method for identifying the stiffness loss of a cable stayed bridge, and compared experimental results with the strain-based damage identification method. The results showed that the effectiveness of the strain-based method was largely dependent on the position of the strain-measuring points, which may affect the cable damage identification results. Huseynov et al. [20] proposed a new method to identify the presence and location of damage in a simply supported bridge based on the characteristics of rotation influence lines and verified its effectiveness through laboratory experiments. The study concluded that rotation is the optimum parameter for identifying local damage.
Compared with local strain and acceleration measurement, rotation can better reflect the overall deformation of a structure. Moreover, rotation is also more convenient to measure than deflection since no extra reference point is needed. Thus, it has great application prospects and supplementary potential in the current bridge health monitoring and condition evaluation system [30,31]. Inclinometers have been widely used in automobile, aviation, and other industrial fields for rotation measurement. In civil engineering, inclinometers were originally used for geotechnical monitoring and long-term deformation monitoring of bridges during the construction or early service stage [32,33]. Moreover, inclinometers are also useful to assess the effective plastic deformation demand during seismic events [34,35]. In the past decades, with the improvement in precision of the inclinometer, rotation monitoring has been used increasingly in the civil engineering for structural health monitoring. Table 1 lists some commercial inclinometers and their parameters [20,36,37,38,39,40]. Among them, precision of 3.5 × 10⁻⁴ (°) and resolution of 1 × 10⁻⁴ (°) partially meet the minimum requirements for small-angle bridge monitoring. However, it is evident from Table 1 that the sampling frequencies of such inclinometers are too low to meet the demands of dynamic tests.
In summary, current inclinometers have the following disadvantages for bridge rotation monitoring: (1) The working range is too wide while the resolution and precision are too low. Bridge rotation is very small in amplitude [41,42] and thus it is difficult to capture the tilt signal. (2) Current inclinometers are designed primarily for static or low-frequency monitoring, which limits their use in dynamic measurements.
To address above issues, the novelty of this work is to propose, design, and validate a new elastomer-based inclinometer with high accuracy for ultrasensitive dynamic monitoring of beam-end rotation. The motivation of this research is to monitor the health condition and evaluate the bridge bearing capacity in more accurate and efficient ways by utilizing the bridge rotation response. The working principle of the proposed inclinometer is to convert or magnify the beam-end rotation into the deformation of an elastomer. Based on the dynamic measurement system, a custom software module was developed for data acquisition. Characteristics of the proposed inclinometer, including range, resolution, linearity, and repeatability were calibrated first in the lab. Finally, to verify its feasibility and effectiveness, in-situ experiments were conducted to measure the dynamic rotation response of an in-service bridge subjected to moving vehicle loads. The in-situ test results indicate that the proposed inclinometer has excellent accuracy and resolution for bridge rotation measurement and thus has great potential for future bridge health monitoring and capacity evaluation.
This paper is organized into the following sections:
Section 1 is the general introduction of research background, current trend of rotation measurement, and the novelty and motivation of this work. Section 2 is dedicated to the working principle of the elastomer-based inclinometer. Section 3 constructs the design and data acquisition system of the proposed inclinometer. Section 4 investigates the characteristics of the proposed inclinometer, including range, resolution, linearity, and repeatability. Section 5 describes the in-situ experimental tests to illustrate the feasibility of the proposed method. Finally, discussions and conclusions are presented in Section 6.

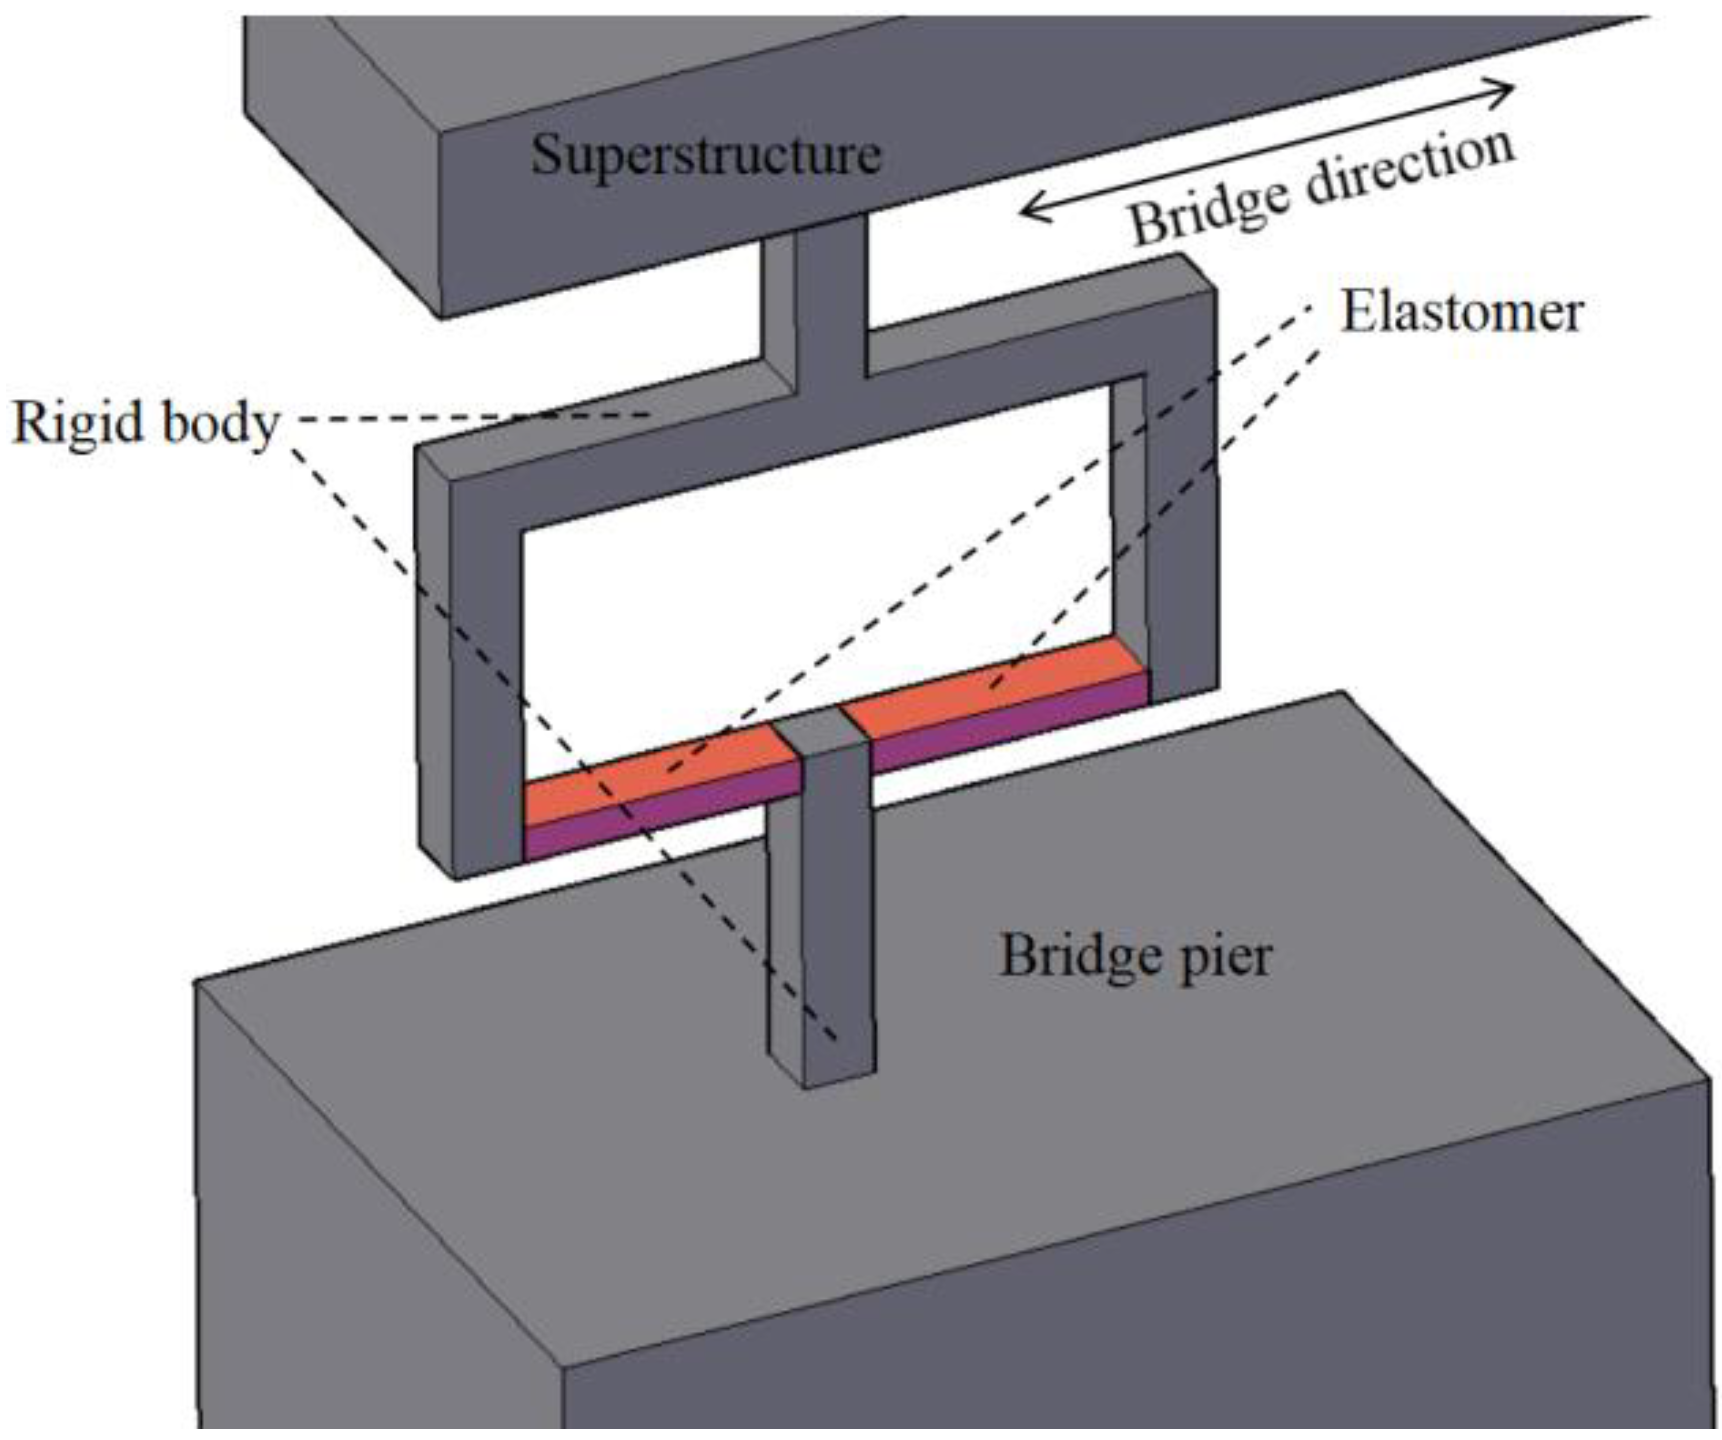
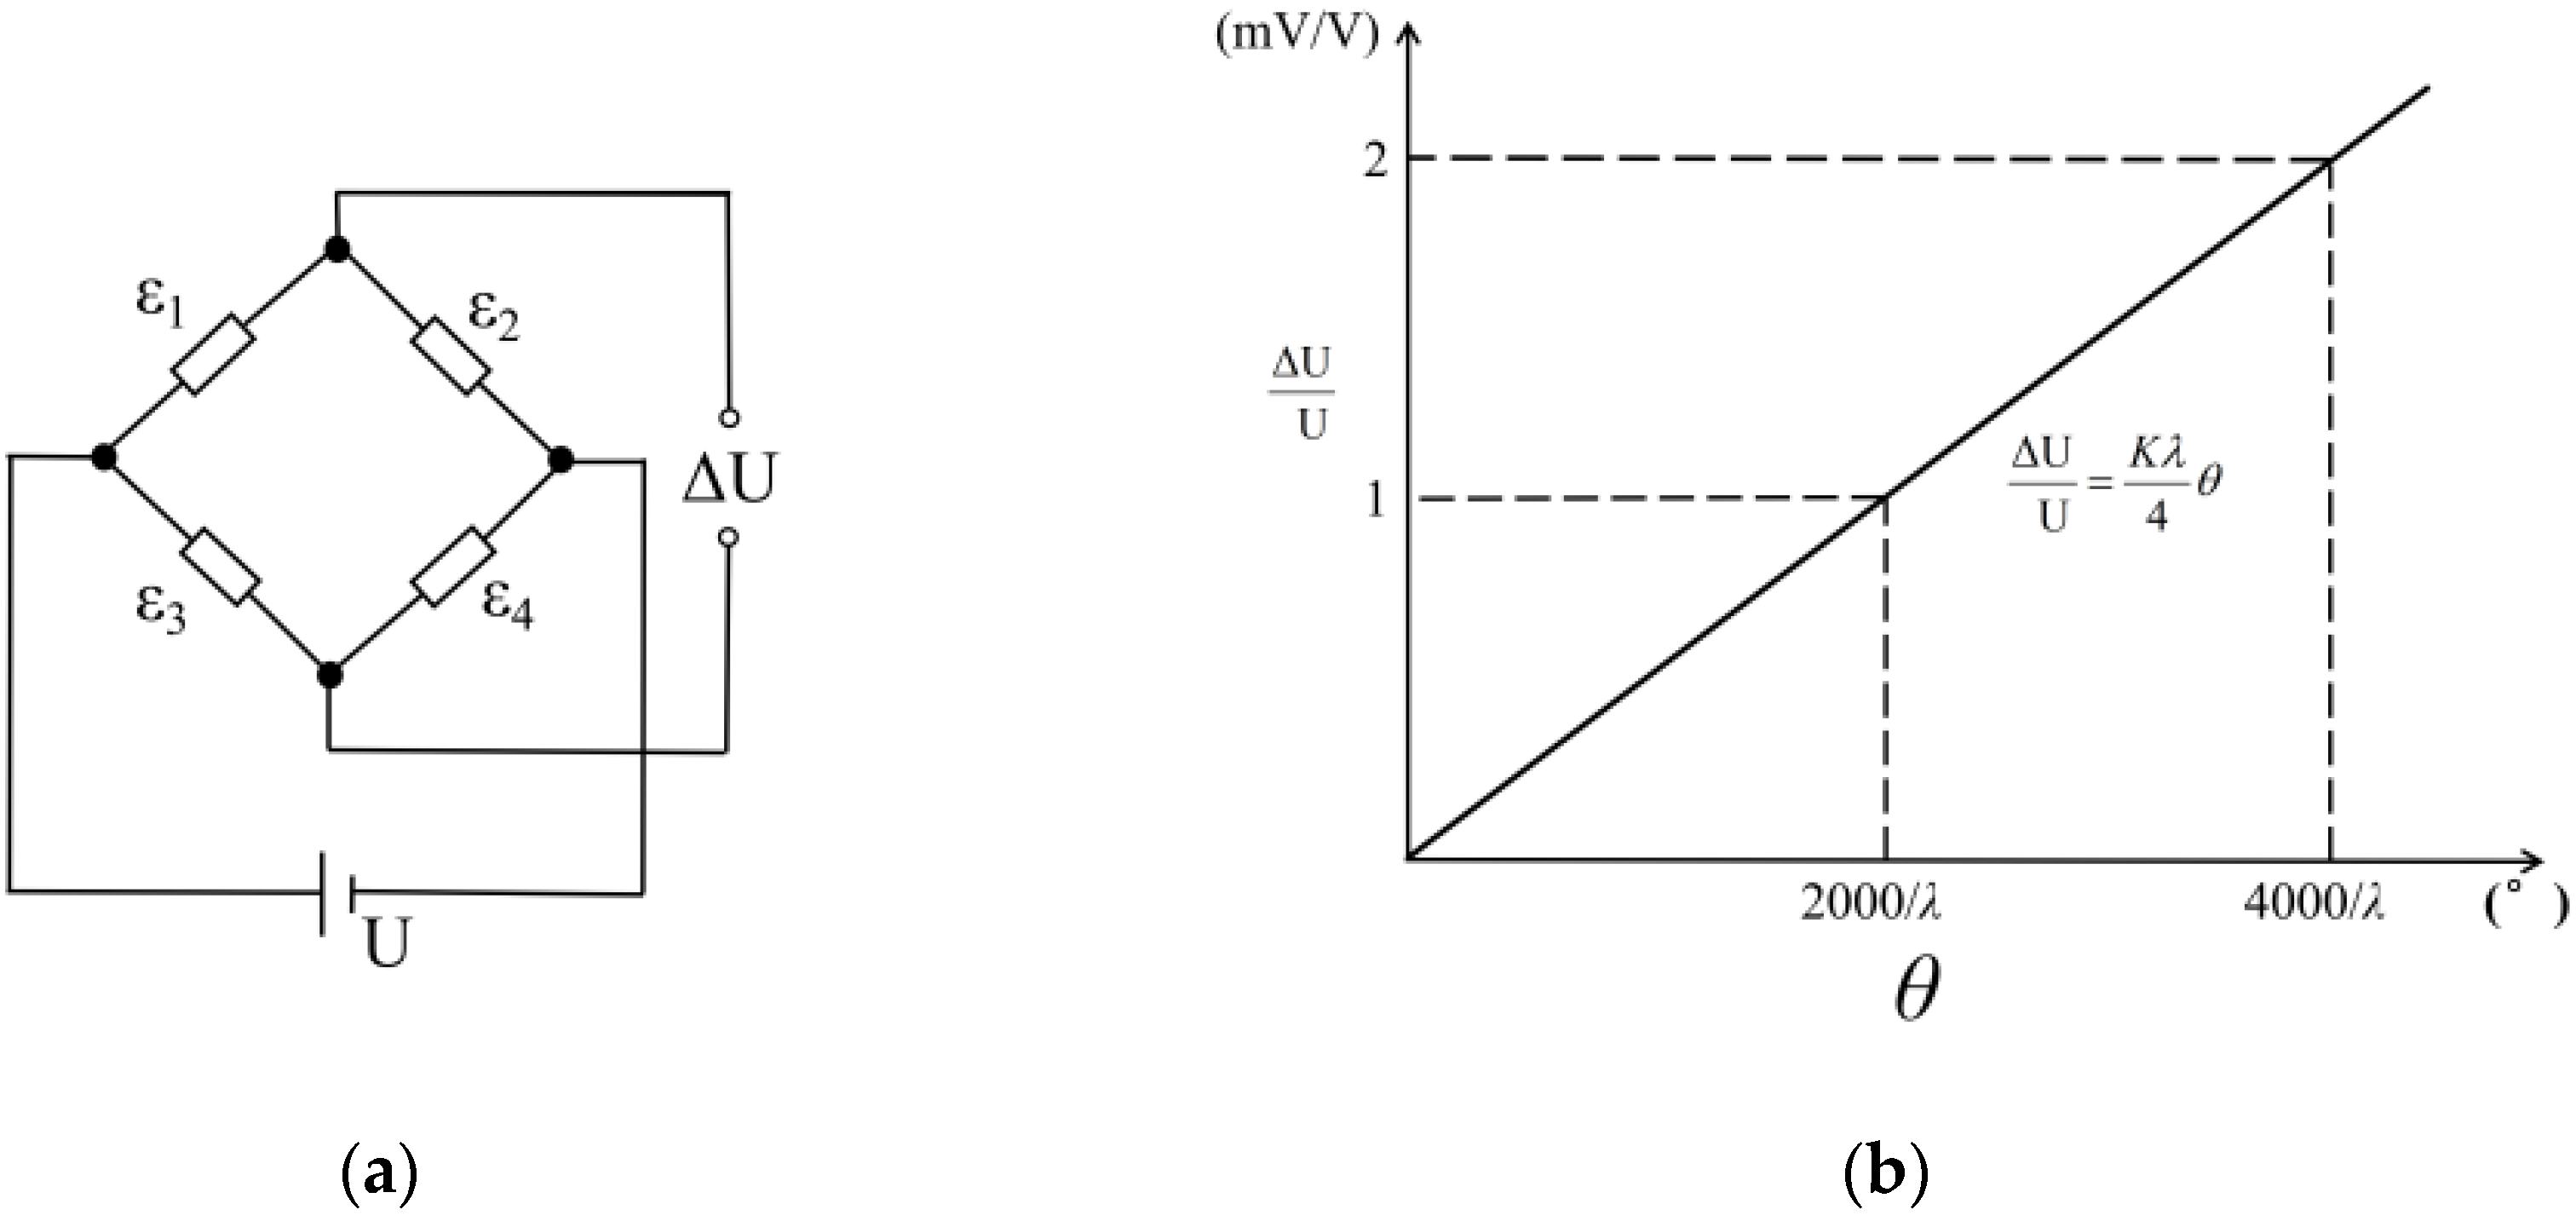
2. Working Principle of the Elastomer-Based Inclinometer

The fundamental principle of the proposed inclinometer is to convert the section rotation into the strain of an elastomer. By utilizing the strain gauges on elastomer, high-precision monitoring of the rotation can be achieved. In this method, bridge pier is used as a reference point, relative to which the beam-end rotation is monitored. The concept of this method is shown in Figure 1, top and bottom rigid bodies are fixed on the pier and superstructure, respectively. The elastomer (red part) is fixed to the two rigid bodies for connection and transfers the section rotation into elastomer bending. The bending strain can then be measured and utilized for rotation sensing.
Figure 2 illustrates the deformation of the inclinometer under bridge rotation, w1 and w2 represent the displacements at two ends of the rigid component caused by the rotation of the beam end (downward displacement is positive and upward is negative); w0 represents the vertical displacement of the beam end, and it is always small. The following equation represents the displacement relationship shown in Figure 2.
w 1 = w 0 + L 0 2 θ
w 2 = w 0 L 0 2 θ
w 1 w 2 = L 0 θ
Displacement of the top rigid body causes the bending deformation of the two elastomers. On left elastomer, the values of strain gauges 1 and 2 caused by w1 can be expressed as follows:
ε 1 = ε 2 = 3 h ( l 2 Δ l ) l 3 w 1
where l and h are the length and thickness of the elastomer, respectively; and Δl represents the distance between strain gauges and elastomer ends. Similarly, on the right elastomer:
ε 3 = ε 4 = 3 h ( l 2 Δ l ) l 3 w 2
The relation between the rotation angle and the elastomer strain can then be obtained from (Equations (1)–(5)). The fundamental principle of the inclinometer proposed in this work is to convert the small rotation into the strain of the elastomers. The rotation can thus be obtained by measuring the strains. Compared with the direct rotation or displacement measurement, strain measurement has higher resolution and thus can improve the accuracy of bridge rotation sensing. Moreover, all connections of the inclinometer are rigid to reduce potential errors, which can further enhance the accuracy of rotation measurement results.

3. Design and Data Acquisition of the Proposed Inclinometer
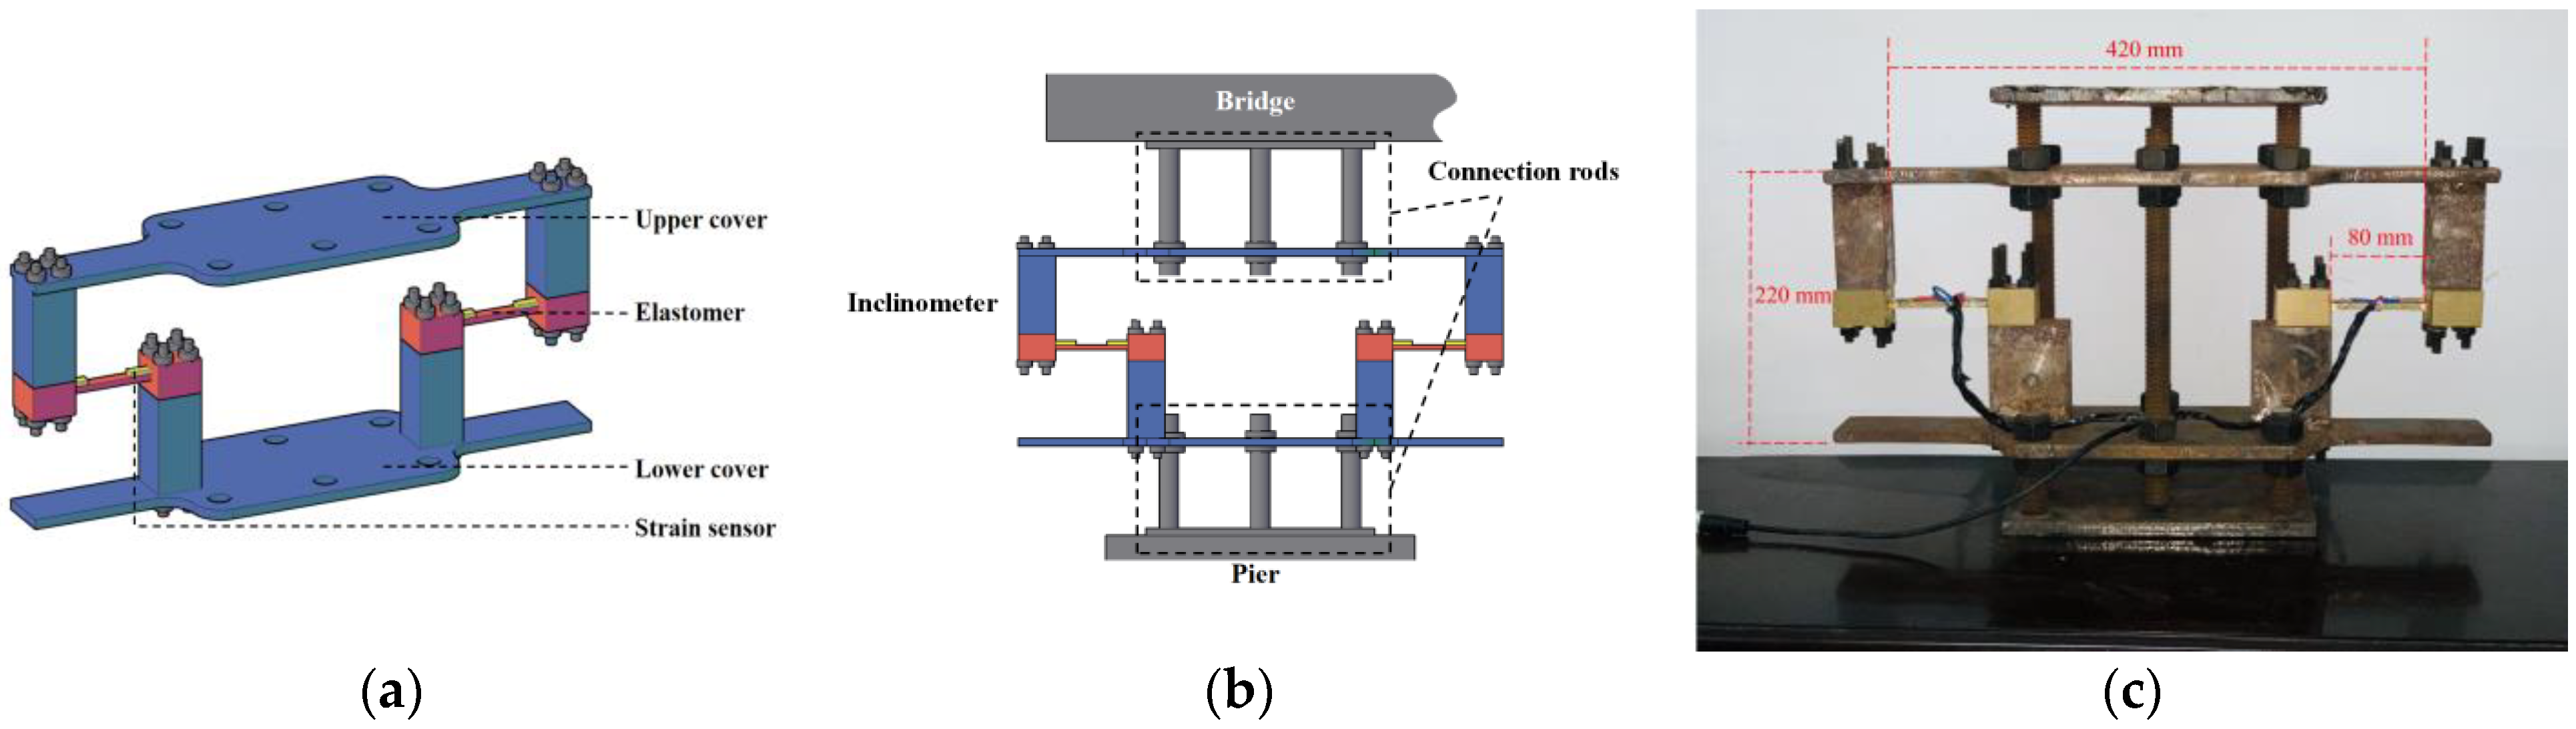
3.1. Design

Figure 3a,b shows the design of the proposed inclinometer, which consists of upper and lower rigid covers, elastomer, strain gauges, rigid rods, and connecting bolts. The upper and lower covers are designed to be fixed on the superstructure and pier of the bridge, respectively. The elastomer with two strain gauges connects the upper and lower covers. The rigid rods are bolted to the covers for height adjustment on different bridges, which can be disassembled easily and reused. Figure 3c shows the prototype of the proposed inclinometer.
Dimensions and features of each component are summarized in Table 2.
The sensitivity coefficient and measurement range of the proposed inclinometer can be adjusted for different purposes by changing the height, length, and modulus of the elastomer, which is further discussed in the following sections.

3.2. Data Acquisition Module

The proposed inclinometer converts the rotation into a strain signal. Thus, based on the current strain gauge data acquisition system, a custom data collection module was designed. As discussed in Section 2, a total of four strain gauges were used on the inclinometer, which can form a Wheatstone full-bridge circuit, as shown in Figure 4a. The conversion relation between the output strain signal ε of the full-bridge and rotation θ can be established as follows:
ε = ε 1 ε 2 + ε 3 ε 4 = 6 h ( l 2 Δ l ) L 0 l 3 θ
Let
λ = 6 h ( l 2 Δ l ) L 0 l 3
Then
ε = λ θ
It is evident from Equations (6)–(8) that there is a linear relation between the full-bridge output and the rotation. In Figure 4a, U is the input voltage of the strain circuit, ΔU is the output voltage. Based on the characteristics of the strain monitoring circuit, the output voltage and rotation angle satisfy:
Δ U   U = K 4 λ θ
where K is the sensitivity coefficient of the strain gauge and it is usually equal to 2. The inclinometer sensitivity coefficient λ is determined by Equation (7). By adjusting the elastomer height h and length l, strain gauge position Δl, and inclinometer length L0, the sensitivity coefficient can then be adjusted for different measuring purposes.
The theoretical characteristic curve of the inclinometer is shown in Figure 4b, which indicates the output signal of the inclinometer is linearly correlated to the measured rotation.
As shown in Figure 5, the HBM dynamic testing system (with an MGCplus data acquisition system) and its supporting Catman Easy software were utilized as the data acquisition module of the proposed inclinometer.
The data acquisition module interface contains the real-time output curve of measured rotation versus time (right part in Figure 5) and inclinometer list (left column in Figure 5), which is designed for multiple inclinometers measurement for in-situ application. The maximum data acquisition frequency is determined by the HBM system, which is 9.6 kHz.

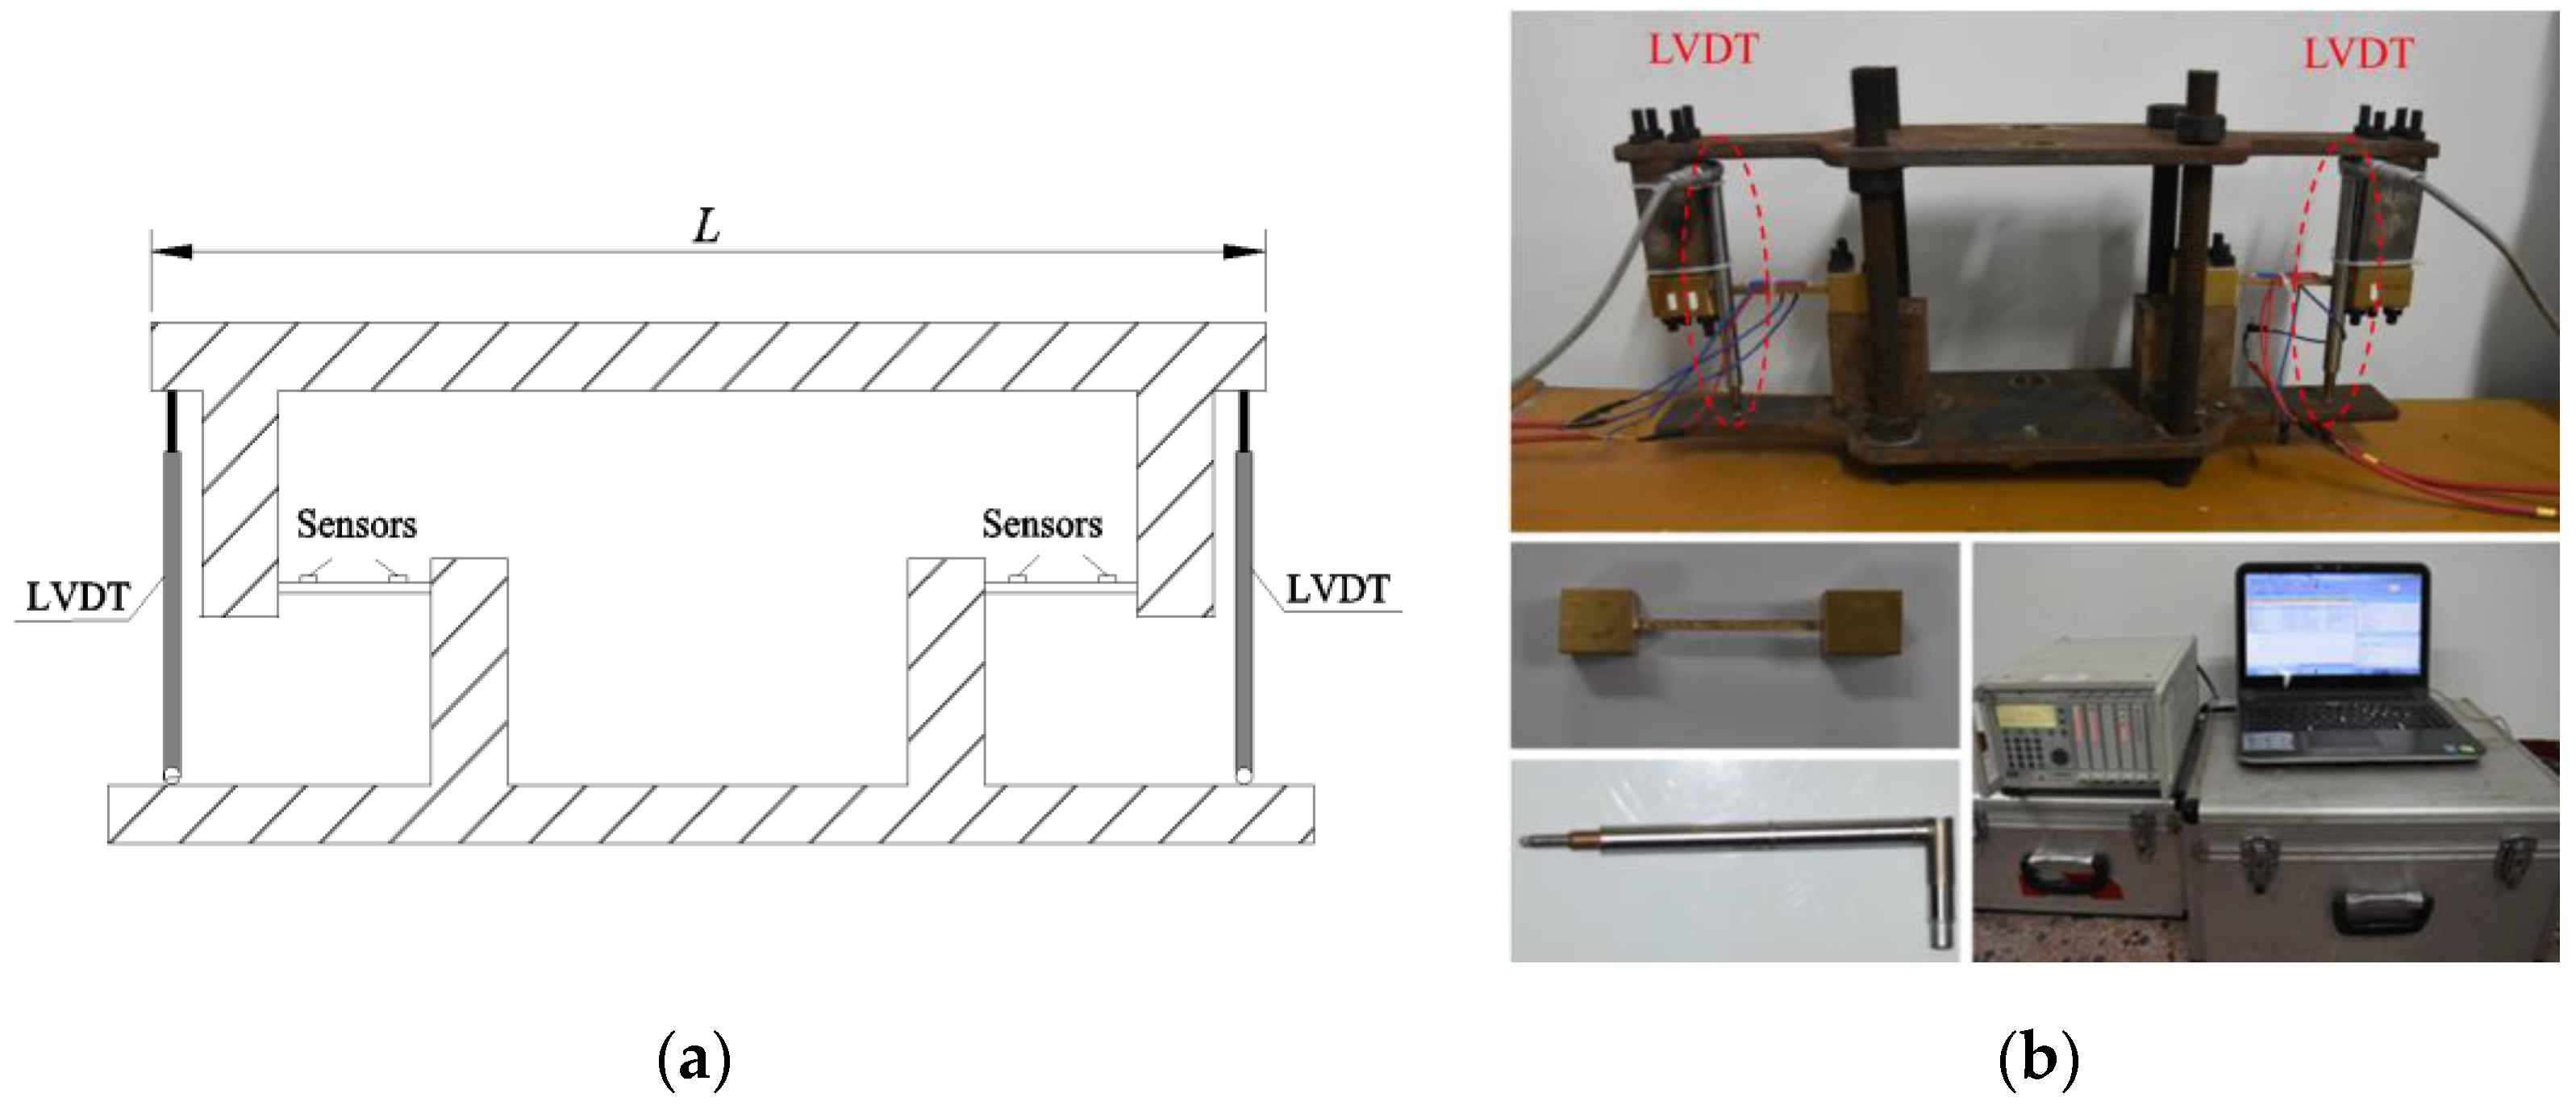
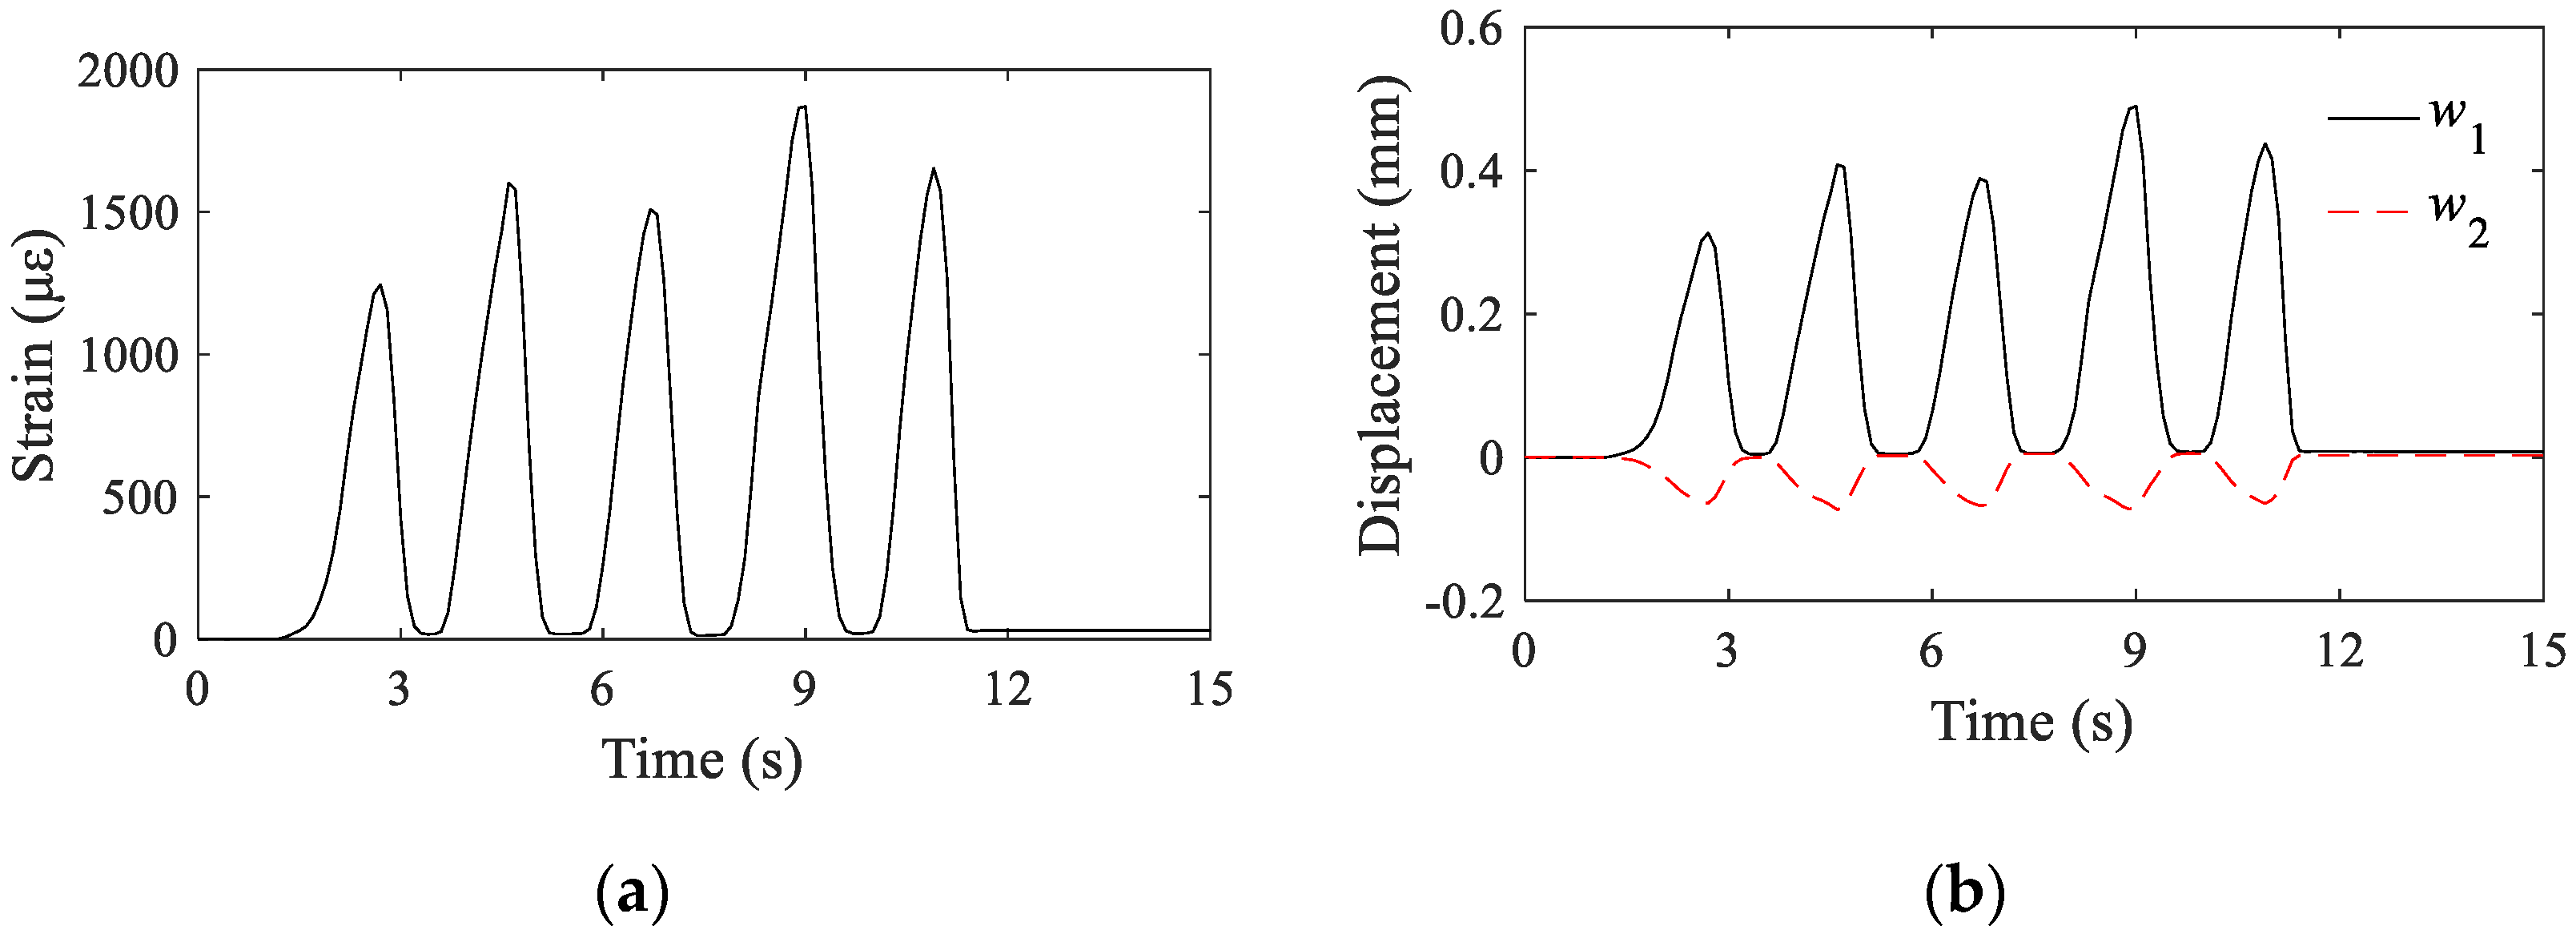
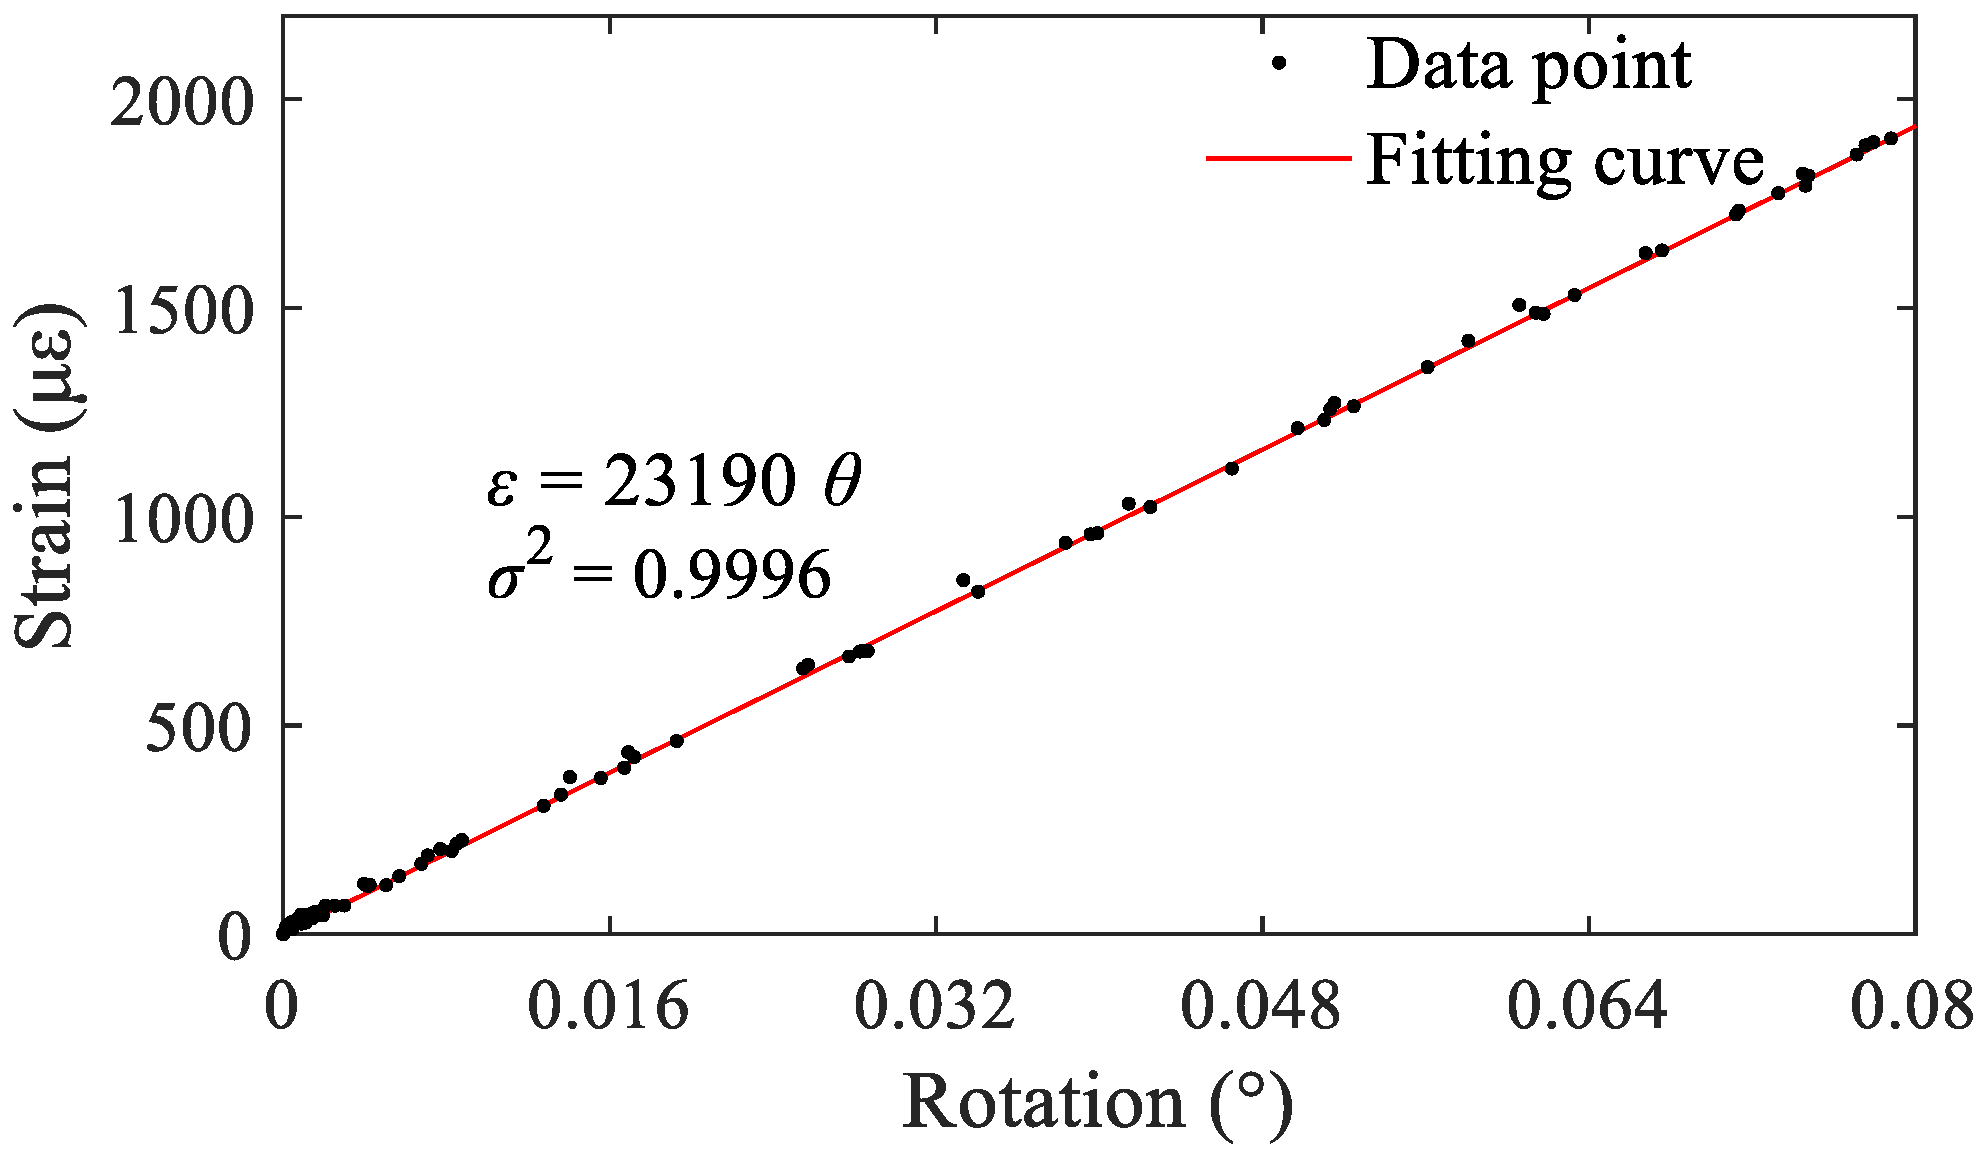
3.3. Calibration Test

For the calibration test, as shown in Figure 6, the lower cover was fixed, while the upper was set to undergo dynamic rotation in the longitudinal direction. Two LVDTs were placed at both ends of the cover to monitor the vertical displacement, from which the actual rotation can be derived. In this study, we used an HBM LVDT displacement transducer with a precision of 0.001 mm. The displacement transducer measurements are provided as w1 and w2, and the real-time rotation angle is calculated by (w1w2)/L.
The calibration process was conducted by repeatedly applying a weight on the inclinometer and then release it. Sampling rate of 50 Hz was chosen to ensure that the dynamic response of the inclinometer under such circumstance can be adequately captured. The time-history curve of the strain output is shown in Figure 7a. Similarly, time-history curves of the relative displacements measured by the LVDTs are shown in Figure 7b. The corresponding relation between the output strain and input rotation θ is shown in Figure 8. It is evident that there is a good linear correlation between the two parameters.
Figure 8 shows that even a small rotation angle input can result in a large strain of the elastomer, which means the proposed inclinometer has ultrahigh sensitivity. After carrying out five calibration tests, the value of the coefficient λ was averaged to be 23,190 με/°. Factors such as the physical parameters (elastic modulus) of the elastomer, manufacturing errors, and strain gauge installation errors can cause a discrepancy between the real and theoretical value of λ. Nevertheless, the proposed inclinometer can significantly amplify the rotation signal, which proves that it is suitable for high-precision dynamic monitoring of bridge rotation.

4. Inclinometer Characteristic Parameters

4.1. Measurement Range

The measurement range of the inclinometer is determined by the elastic modulus and dimensions of the elastomer. The elastomer used in this study was fabricated of brass. This material has a relatively high allowable stress ([σ] = 369 MPa) and low elastic modulus (E = 110 GPa), making it easy to deform. Based on the inclinometer design, Δl = 12 mm, L0 = 420 mm, the calculated range can be obtained by the two steps as follows:
The allowable strain [ε]:
[ ε ] = [ σ ] ( l 2 Δ l ) E l = 2348 μ ε
The maximum rotation angle:
[ θ ] = 2 l 3 3 h ( l 2 Δ l ) L 0 [ ε ] = 0.39 °
As shown in Equation (11), the rotation measurement range is determined by elastomer length l, height h, strain gauge position Δl, and inclinometer length L0. Therefore, by adjusting the elastomer dimension and inclinometer setup, the maximum measurement range of the proposed inclinometer can be tuned for different purposes. The above calculation is based on the assumption that the centerline of the inclinometer is the same with the rotation axis of the bridge, which means w1 = −w2. In real application, this may not be satisfied and thus the range will be slightly decreased. However, the maximum rotation specified in the current bridge design code is 0.115°. Therefore, the range of the inclinometer is sufficient to meet the requirements for beam-end rotation monitoring. In addition, the measurement range can be adjusted by changing the elastomer material, size of the elastomer, or the effective length of the upper cover.

4.2. Measurement Accuracy

The precision of an instrument refers to the difference between the measurements and the real values. The inclinometer accuracy relies on the HBM MGC Plus dynamic data acquisition system. According to previous study [43], the relative error of the HBM dynamic monitoring system for strain measurements is 0.1%, and the relative error, δ, for the rotation angle is 0.1%. The maximum error, that is, when the measured rotation angle reaches the measurement range of the present monitoring device, △max, is provided by the following:
Δ max = δ [ θ ] = 3.9 × 10 4   ( ° )
Compared with other inclinometers listed in Table 1, accuracy of the proposed inclinometer is obviously higher. It is worth noting that Equation (12) describes the maximum absolute error of the present device, but the precision level is related to the rotation angle measured during the actual monitoring process, which will generally not exceed the monitoring range of the present device. Using actual monitoring data from Section 4.2 as an example, the maximum rotation angle of the beam end during the selected monitoring period was 6.85 × 10⁻³ (°), and the corresponding monitoring error was 6.85 × 10⁻⁶ (°). This device had obvious advantages in terms of its accuracy and can be used to accurately monitor small rotations of beam ends.

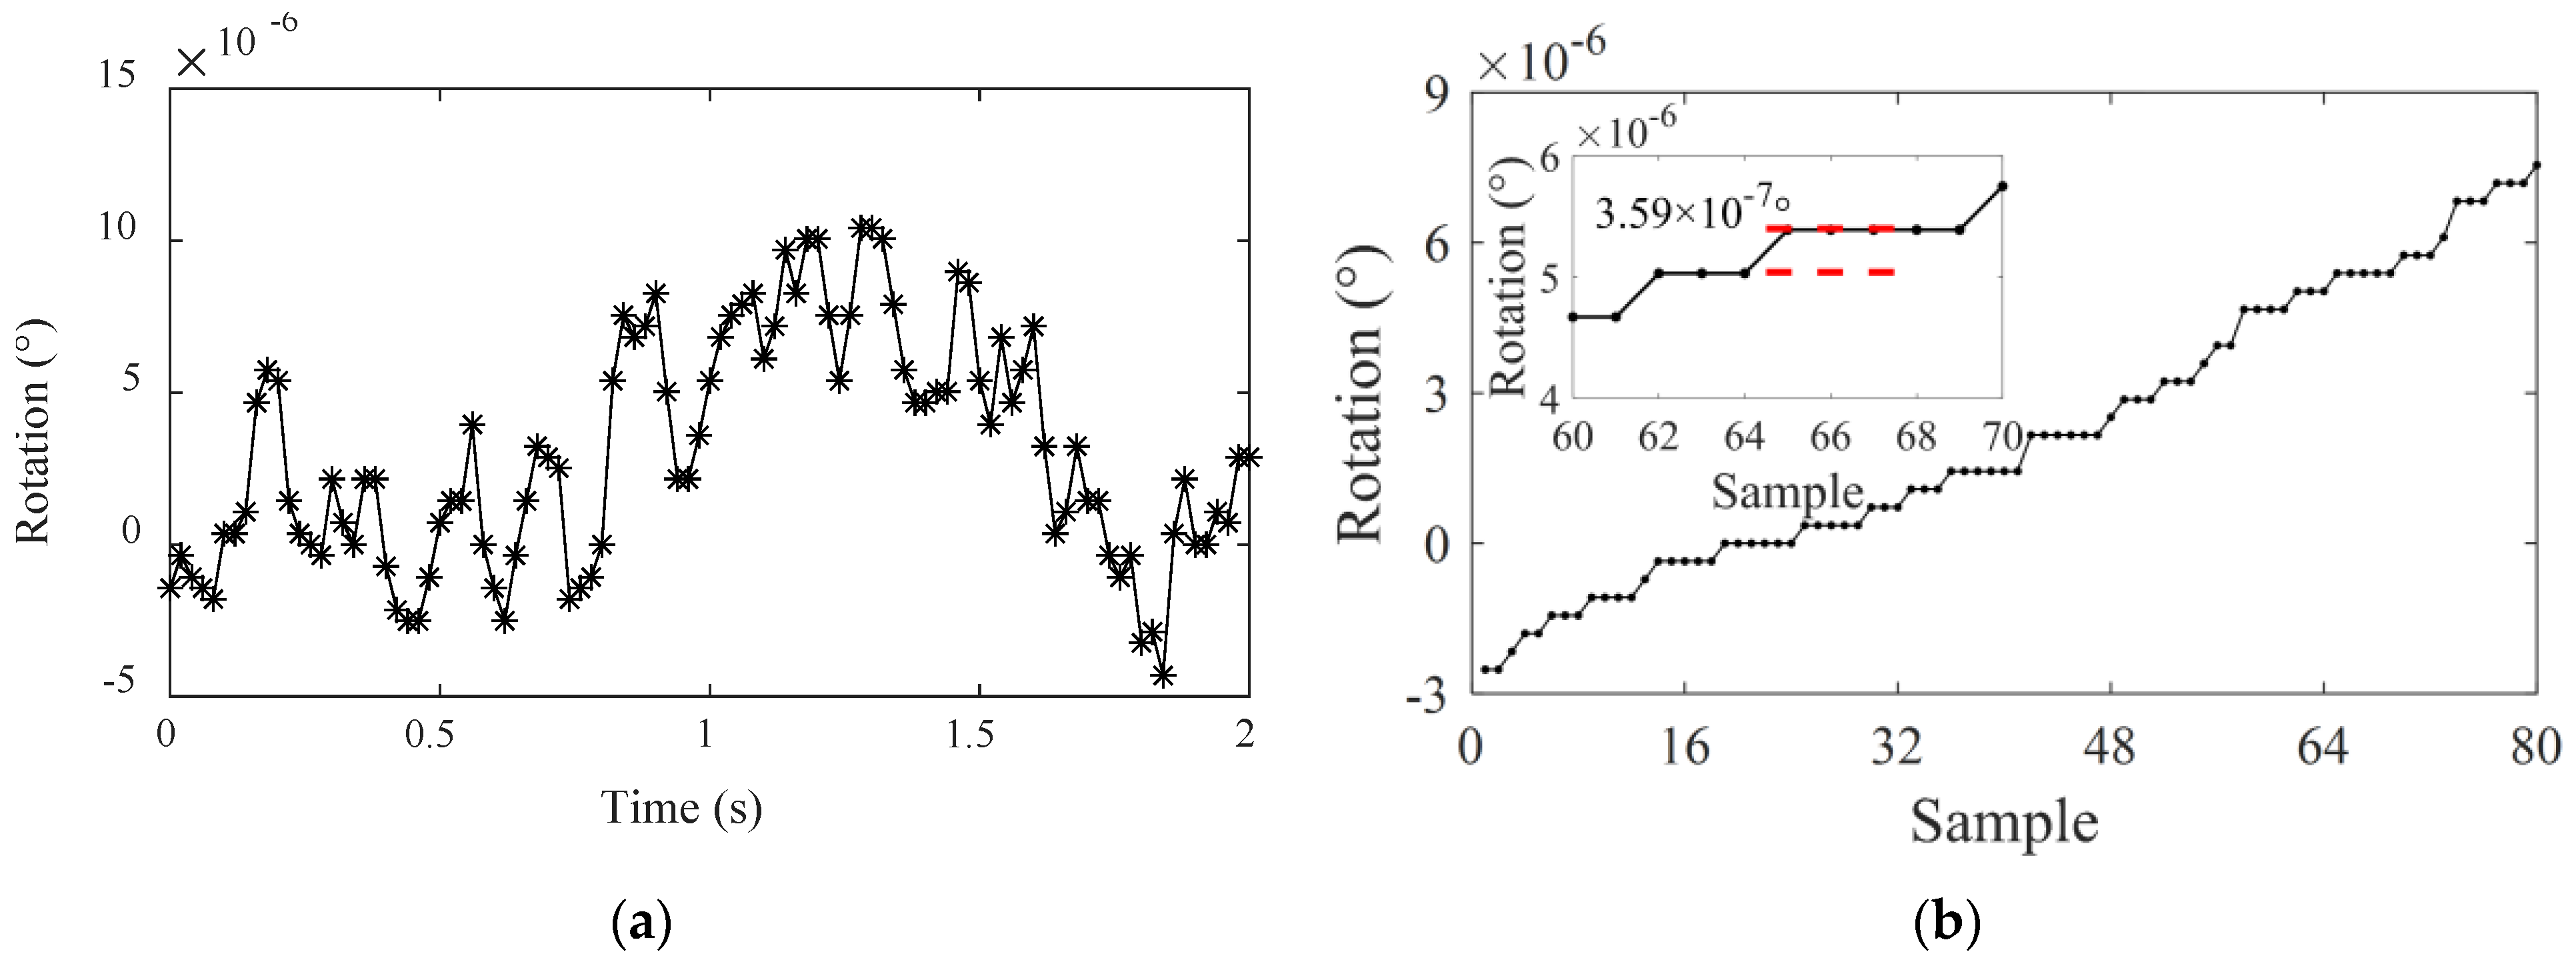
4.3. Measurement Resolution

Resolution of an instrument refers to the ability to capture the smallest change in the measurand. For the proposed inclinometer, it first relies on strain measurement resolution. Then amplification of the rotation angle by the inclinometer also increases the resolution. The actual resolution can be obtained based on the calibration data in Section 3.3. One of the rotation time-history curves was selected, as shown in Figure 9a, and the measured data was sorted based on the magnitude, as shown in Figure 9b.
It is evident from Figure 9b that when the rotation angle values output by the present device are sorted, an obvious stepwise increase can be observed, and the minimum change in the rotation angle, that is, the device resolution, can be determined to be 3.59 × 10⁻⁷ (°). The difference in the rotation angles between adjacent data points in Figure 7a can be expressed as N × 3.59 × 10⁻⁷ (N is an integer). It is evident that compared with the parameters of the commonly used inclinometers listed in Table 1, the present device is more advantageous in terms of its resolution. On the other hand, the present rotation monitoring device could not only satisfy the high precision and resolution requirements for bridge rotation monitoring, but its precision and resolution performance were also unaffected by the monitoring frequency.

4.4. Linearity and Repeatability

Linearity refers to the coincidence degree between the actual characteristic curve of the transducer and the reference line, as shown in Figure 10a. The nonlinear error, e1, of the characteristic curve can be calculated using Equation (12) [44]. A smaller nonlinear error indicates less the influence of the initial state on the characteristic relationship between the input value and the output value of the transducer. Thus, any point within the measurement range can be used as the initiation point for relative monitoring. The calibration test data in Section 3.3 were used as a basis to determine the actual linearity of the present device. Different rotation angle values were input into the monitoring equipment within its measurement range to obtain the actual characteristic curve of rotation–strain conversion, as shown in Figure 10b. Using the line between the starting point and the maximum point of the measured data as the reference line, the nonlinear error of the present monitoring equipment was calculated to be 0.76%.
e 1 = | Δ L max | y FS × 100 %
Similarly, repeatability describes the degree of non-coincidence for the input–output curve when the transducer input changes repeatedly, as shown in Figure 11a. The repeatability error can be calculated using Equation (14). If the degree of non-coincidence is large, the output values differ greatly for the same input signal, which also affects the monitoring accuracy. Based on the repeatability characteristic curve of the experimental monitoring data, as shown in Figure 11b, the repeatability error was calculated to be 0.82%.
e 2 = | Δ R max | y FS × 100 %
The linearity and repeatability of a transducer are also related to its manufacturing technology and strain gauge bonding technology. In general, the actual characteristic curve of the proposed device had good linearity and high coincidence, and its nonlinear error and repeatability error were very small, indicating that the device had good linearity and repeatability.

5. In-Situ Experiment

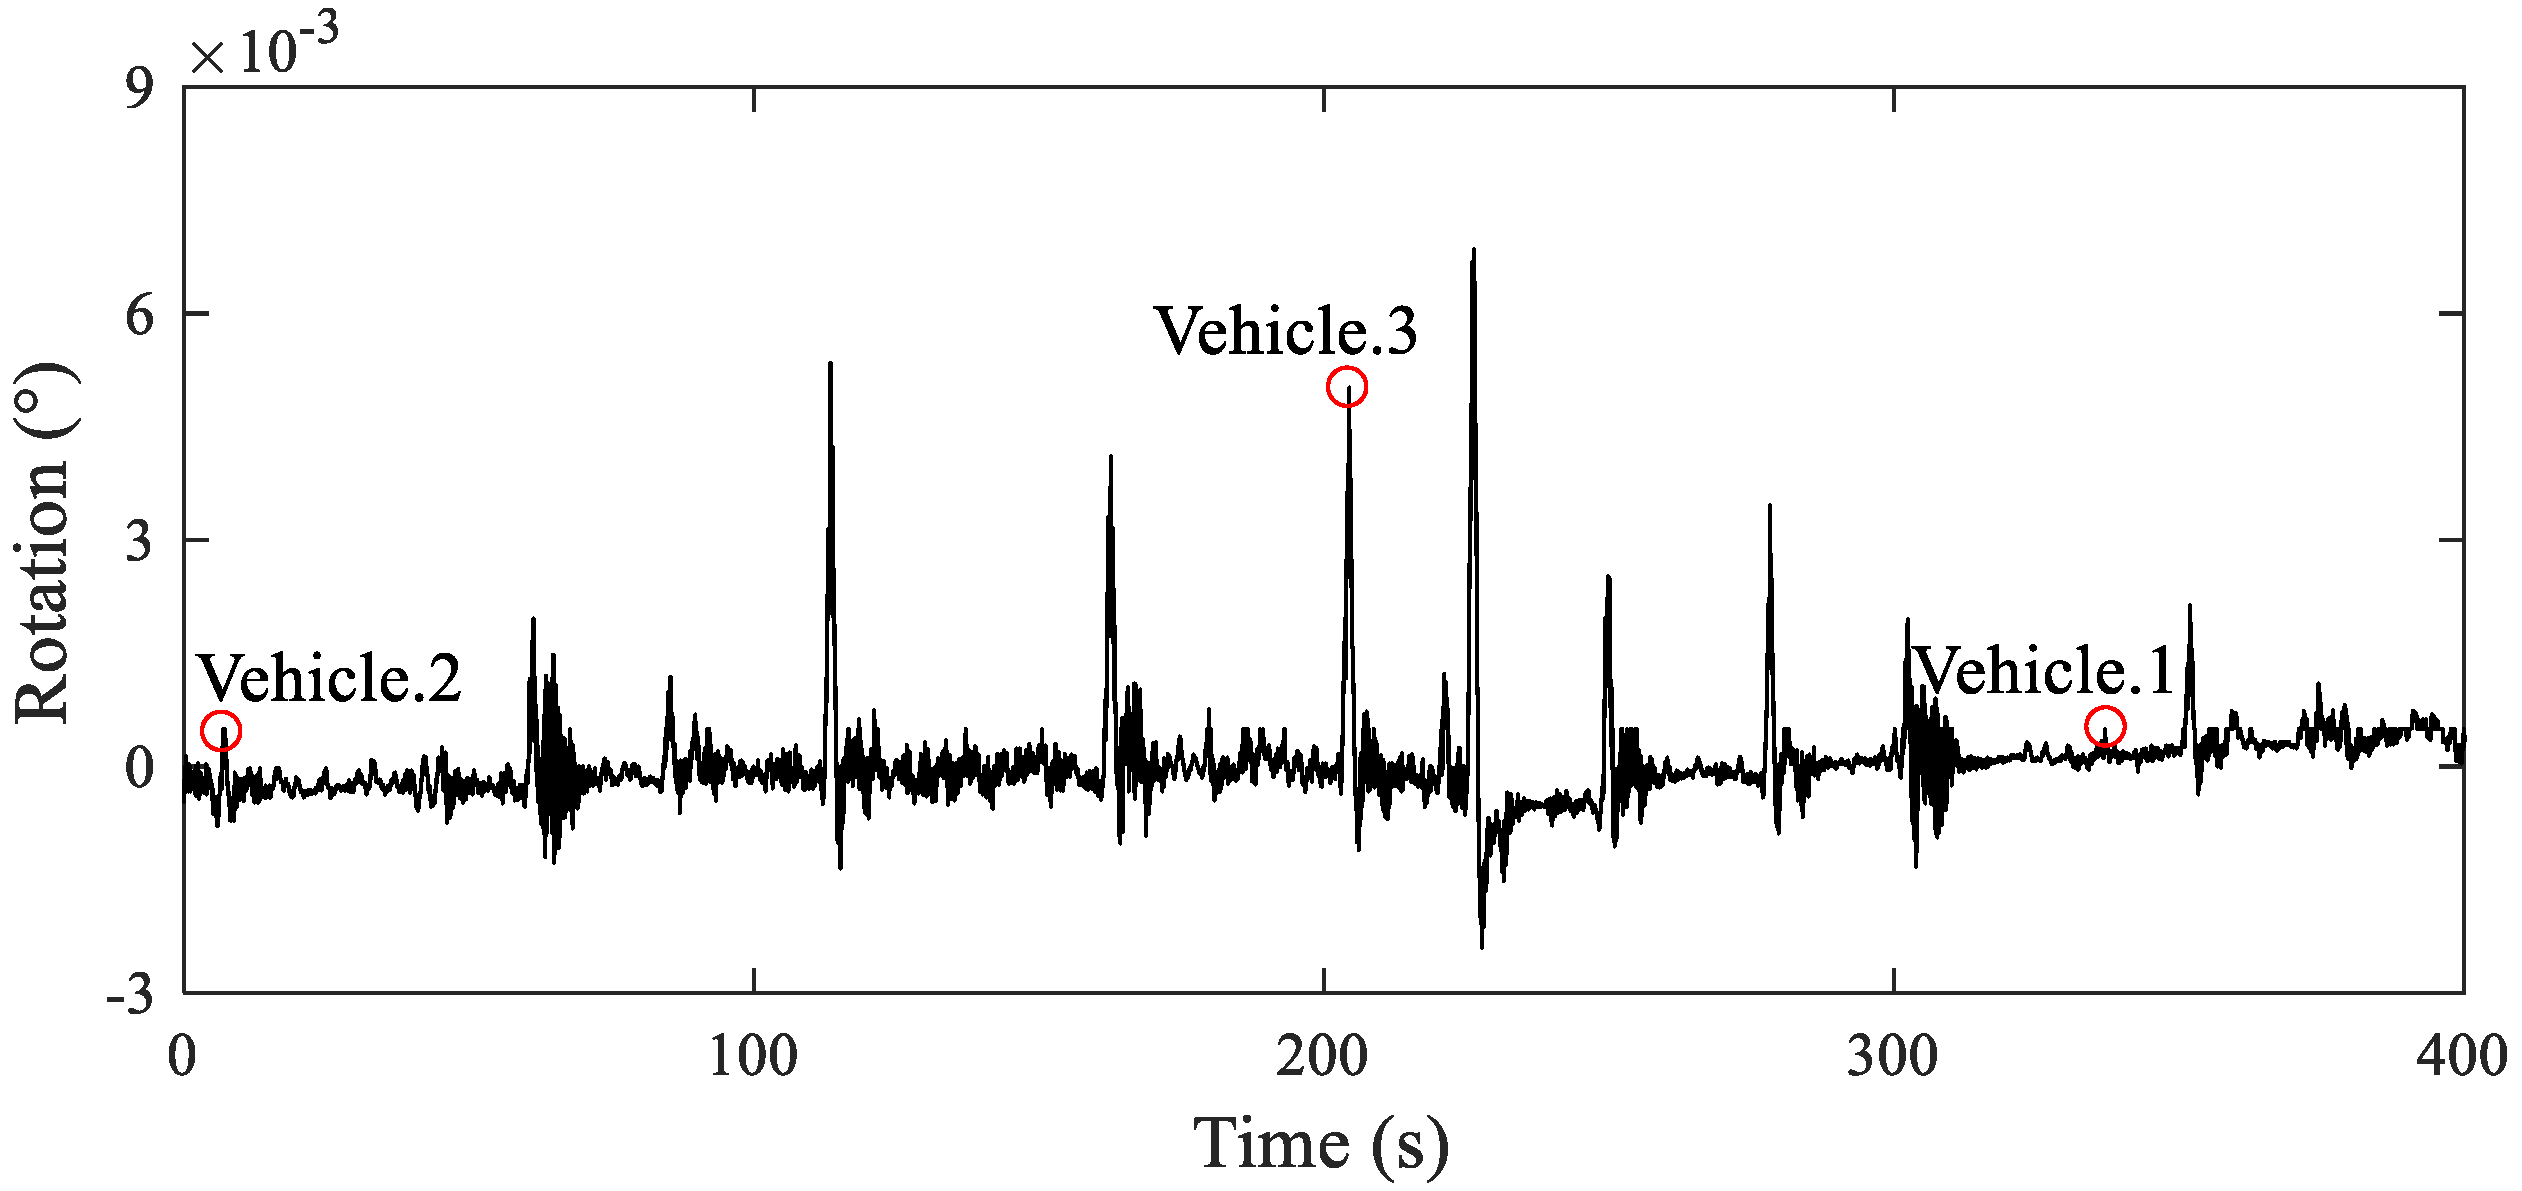
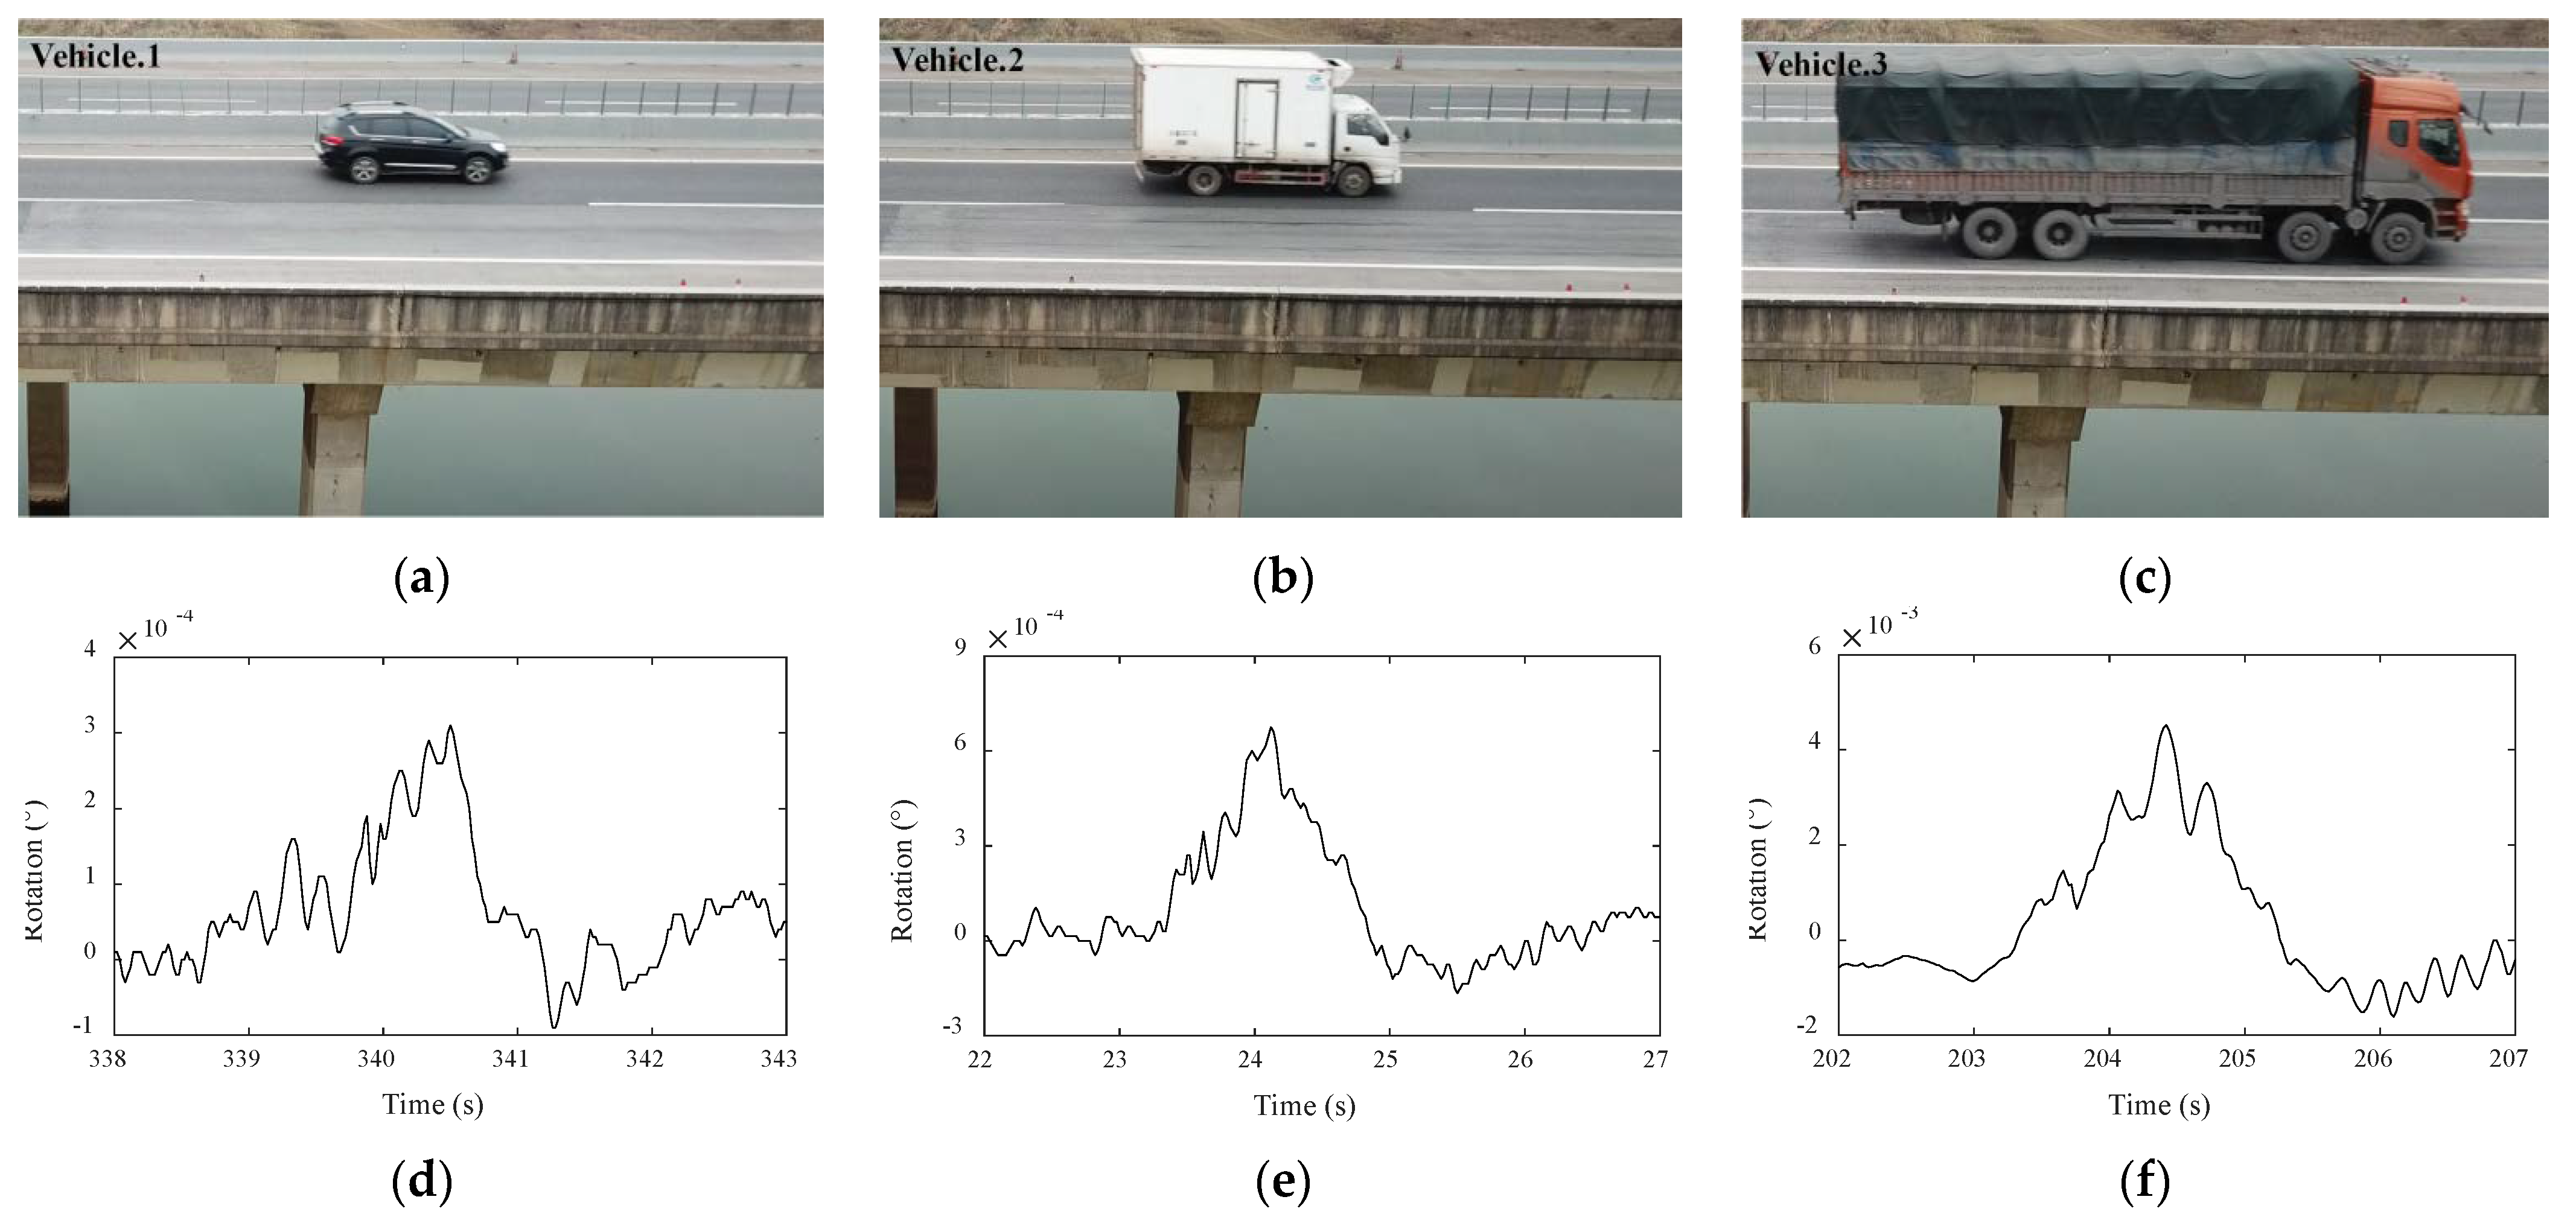
5.1. Experiment Overview

To further verify the feasibility and function of the proposed inclinometer, an expressway bridge called Jinjiang Bridge in Changsha City, Hunan Province (as shown in Figure 12), was selected to conduct in-situ experiments. Real-time beam-end rotation data generated by the random vehicle loads were captured and analyzed. The monitored bridge is a five-span (each span measures 60 m) continuous bridge aligned in the east–west direction. The superstructure is a prestressed concrete single-cell box girder. No lane closures were required during the experiment. Therefore, the beam-end rotation monitoring was carried out during the actual operation of the bridge.
In the field experiment, the inclinometer was set at the beam end at the supporting pier of the first span, as shown in Figure 12. Taking the pier as the fixed reference point, the rotation angle of the beam end relative to the pier was measured in real-time. The gap between the pier and the bridge was 29 cm, which was slightly higher than the height of the inclinometer main part. Thus, the connection bolts were used to adjust height for correct installation. High-strength structural epoxy with maximum tensile strength of 6.5 MPa was used to fix the inclinometer on the beam and pier, as shown in Figure 13a. A temporary working platform was set up near the monitoring point to for data acquisition and the sampling frequency was 50 Hz. The in-situ monitoring setup is shown in Figure 13b. An unmanned aerial vehicle (UAV) was used to photograph the bridge deck to synchronously record the vehicle loads, as shown in Figure 13c.

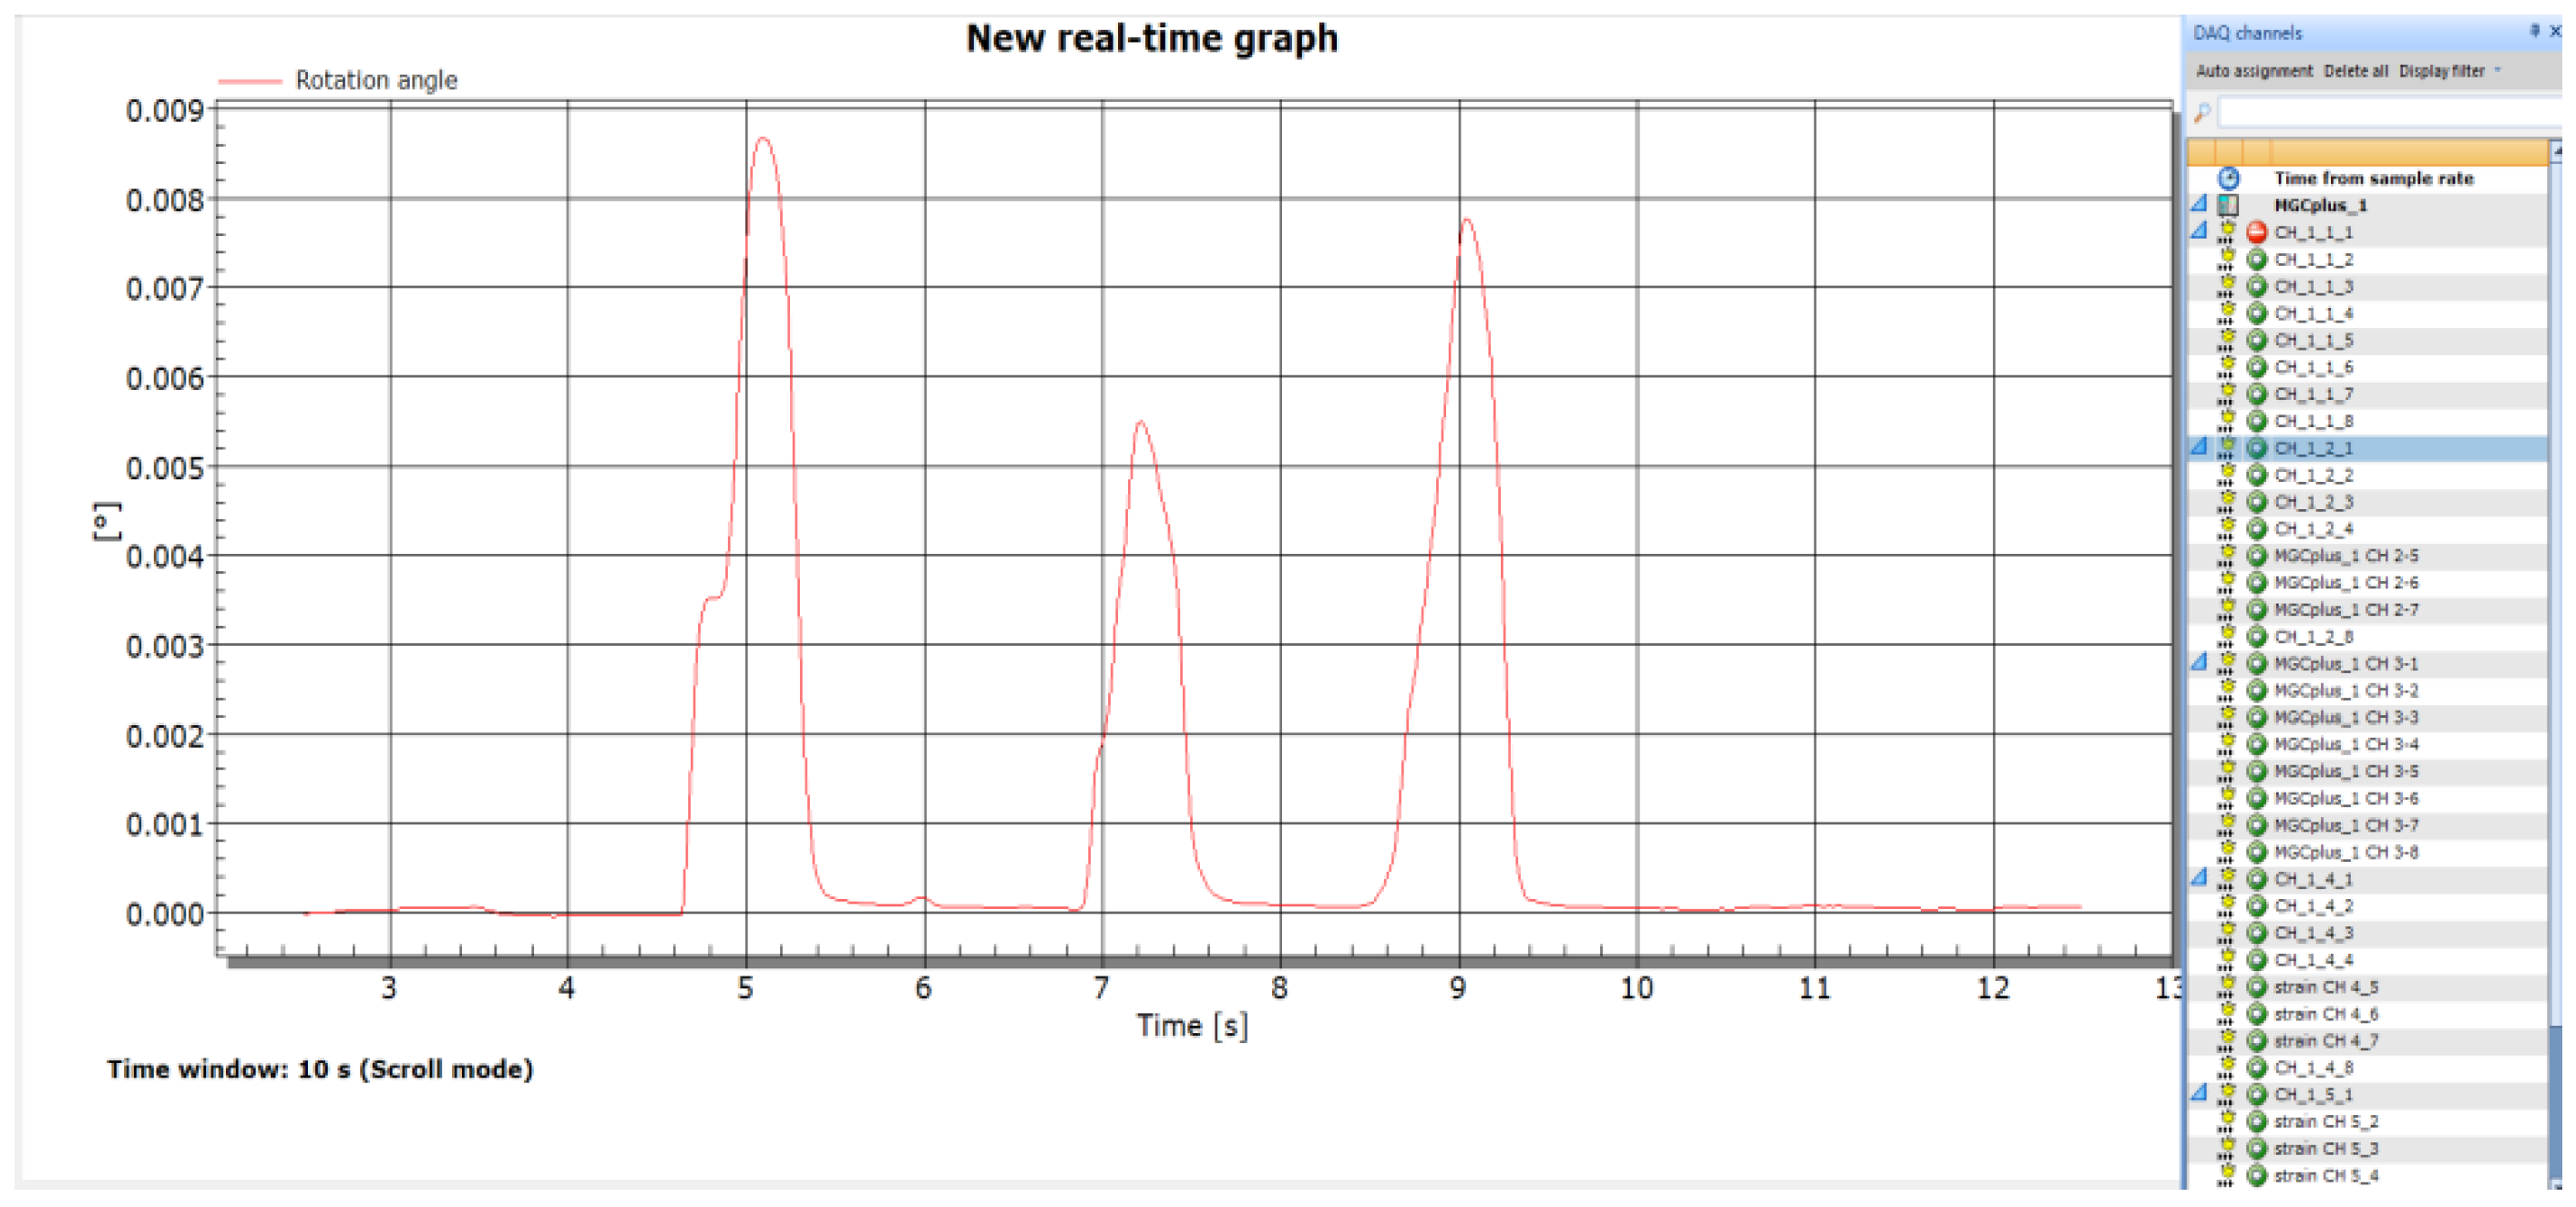
5.2. Results Analysis

During the experiment, the dynamic changes in the beam-end rotation were recorded. The UAV captured video was utilized to mark each passing vehicle with time synchronization to the rotation data. A typical 10 min period of data was selected for analysis, as shown in Figure 14. It was evident that when a vehicle passed the monitored span, rotation response of the beam end was effectively captured by the proposed inclinometer. The captured data were compared with the UAV photos and it showed that different amplitude signals correlated to different vehicles sizes (small, medium, and large).
The time-history data in Figure 14 were divided into segments to isolate each rotation response when only a single vehicle crossed the span. Three typical data for different sizes of vehicles, together with the corresponding photos captured by the UAV, are shown in Figure 15. Figure 15a–c show the different sizes vehicles in each section, and Figure 15d–f show the corresponding beam-end rotation response curves. It is evident that the time required by each vehicle to pass the monitored span was approximately 2 s, indicating that the three vehicles traveled across the bridge at a high speed of approximately 110 km/h (speed limit of the bridge is 120 km/h). The changes in the amplitude of the rotation angle caused by vehicle 1, vehicle 2, and vehicle 3 were 6.2 × 10⁻⁴, 3.2 × 10⁻⁴, and 46.8 × 10⁻⁴ (°), respectively. The beam-end rotation and corresponding vehicle sizes and weight are listed in Table 3.
The monitoring point was located at the fixed support near the expansion joint close to the end of the bridge. Therefore, when a vehicle passed over the expansion joint, the rotation data inevitably contained some vibration interference. Nevertheless, the proposed device was still able to accurately capture the rotation response of the beam end throughout the entire experiment. When a 35-ton vehicle passed the bridge, the magnitude of the beam-end rotation response was approximately 4% of the specified limit (0.115°) for highway bridges. The response curve clearly reflected the entire process and contained very little noise. Furthermore, even when smaller vehicles of 2–5 tons crossed the bridge at a high speed, the beam-end response was also clearly captured by the proposed inclinometer. The above experimental results showed the feasibility and advantages of the proposed inclinometer in terms of resolution and precision. Therefore, it can be used effectively to capture the rotation responses of in-service bridges.

6. Conclusions

In this study, we developed a new elastomer-based inclinometer for bridge rotation monitoring. The monitoring mechanism of the proposed device involved converting a small displacement generated by the rotation of a rigid component into the strain of an elastomer, and then using strain gauges to obtain a highly accurate beam-end rotation signal. Compared with other methods, the proposed inclinometer can capture the small rotation more accurately.
Based on theoretical analysis and calibration test results, measurement range, accuracy, resolution, linearity, and robustness were all analyzed. The results showed that the measurement range of the proposed inclinometer met the current bridge design code; the relative precision was 1/1000, the maximum absolute error was 3.19 × 10⁻⁴ (°), the resolution was 1.365 × 10⁻⁶ (°), the nonlinear error and repeatability error were low, and its performance parameters were better than most commercial rotation transducers.
The proposed inclinometer was tested on an in-service bridge. The device was installed between the pier and the bridge superstructure to accurately capture the rotation response under the actions of moving vehicles. The case study results showed that the inclinometer output curve clearly reflected the beam-end rotation even for small vehicles crossing the bridge at a high speed. The proposed inclinometer has obvious advantages in terms of its resolution and precision, and can thus be used effectively to monitor the rotation responses of bridges in the future.

Author Contributions

D.Z., N.W. and C.F.; conceived of and designed method and test device. Y.Z.; performed the experiments. N.W.; and C.F.; analyzed the data. D.Z., N.W. and C.G.; revised the paper. All authors have read and agreed to the published version of the manuscript.

Funding

This research was funded by the Natural Science Foundation of Hunan Province of China (2021JJ30840) and National Natural Science Foundation of China (No. 52078486).

Conflicts of Interest

The authors declare no conflict of interest.

References

  1. Sangree, R.H.; Schafer, B.W. Field Experiments and Numerical Models for the Condition Assessment of Historic Timber Bridges: Case Study. J. Bridge Eng. 2008, 13, 595–601. [Google Scholar] [CrossRef]
  2. Xie, H.B.; Wang, Y.F.; Wu, H.L.; Li, Z. Condition assessment of existing RC highway bridges in China based on SIE2011. J. Bridge Eng. 2014, 19, 39–48. [Google Scholar] [CrossRef]
  3. American Association of State Highway and Transportation Officials (AASHTO). The Manual for Bridge Evaluation, 2nd ed.; American Association of State Highway and Transportation Officials: Washington, DC, USA, 2011. [Google Scholar]
  4. Ministry of Communications and Transportation. Specification for Inspection and Evaluation of Load-Bearing Capacity of Highway Bridges; Research Institute of Highway Ministry of Transport: Beijing, China, 2011. [Google Scholar]
  5. Wang, N.B.; Shen, W.; Guo, C.R.; Wan, H.P. Moving load test-based rapid bridge capacity evaluation through actual influence line. Eng. Struct. 2021, 252, 0141–0296. [Google Scholar] [CrossRef]
  6. Wang, N.B.; Ren, W.X.; Huang, T.L. Baseline-free damage detection method for beam structures based on an actual influence line. Smart Struct. Syst. 2019, 24, 475–490. [Google Scholar]
  7. Li, J.; Hao, H. Damage detection of shear connectors under moving loads with relative displacement measurements. Mech. Syst. Signal Process. 2015, 60–61, 124–150. [Google Scholar] [CrossRef]
  8. Zhang, W.W.; Li, J.; Hao, H.; Ma, H.W. Damage detection in bridge structures under moving loads with phase trajectory change of multi-type vibration measurements. Mech. Syst. Signal Process. 2017, 87, 410–425. [Google Scholar] [CrossRef]
  9. Mayunga, S.D.; Bakaone, M. Dynamic deformation monitoring of lotsane bridge using global positioning systems (GPS) and linear variable differential transducers (LVDT). J. Data Anal. Inf. Process. 2021, 9, 21. [Google Scholar] [CrossRef]
  10. Zhang, G.W.; Wu, Y.Y.; Zhao, W.J.; Zhang, J. Radar-based multipoint displacement measurements of a 1200-m-long suspension bridge. ISPRS J. Photogramm. 2020, 167, 71–84. [Google Scholar] [CrossRef]
  11. Yu, J.Y.; Zhu, P.; Xu, B.; Meng, X.L. Experimental assessment of high sampling-rate robotic total station for monitoring bridge dynamic responses. Measurement 2017, 104, 60–69. [Google Scholar] [CrossRef]
  12. Chen, Z.S.; Zhang, C.; Wang, X.; Ma, C.M. Wind tunnel measurements for flutter of a long-afterbody bridge deck. Sensors 2017, 17, 335. [Google Scholar] [CrossRef] [Green Version]
  13. Long, T.; Pan, B. Remote bridge deflection measurement using an advanced video deflectometer and actively illuminated LED targets. Sensors 2016, 16, 1344. [Google Scholar]
  14. Zhu, J.; Zhang, C.; Lu, Z.; Li, X. A multi-resolution deep feature framework for dynamic displacement measurement of bridges using vision-based tracking system. Measurement 2021, 183, 109847. [Google Scholar] [CrossRef]
  15. Meng, X.L.; Nguyen, D.; Xie, Y.L.; Owen, J.; Psimoulis, P.; Ince, S.; Chen, Q.S.; Ye, J.; Bhatia, P. Design and implementation of a new system for large bridge monitoring—GeoSHM. Sensors 2018, 18, 775. [Google Scholar] [CrossRef] [PubMed] [Green Version]
  16. Xiong, C.; Lu, H.L.; Zhu, J.S. Operational modal analysis of bridge structures with data from GNSS/accelerometer measurements. Sensors 2017, 17, 436. [Google Scholar] [CrossRef] [Green Version]
  17. Xie, T.; Wang, X.; Li, C.; Tian, S.H.; Zhao, Z.G.; Li, Y.N. Fiber bragg grating differential tilt sensor based on mercury column piston structure. Acta Opt. Sin. 2017, 37, 170–176. [Google Scholar]
  18. Chuan, C.S.; Wang, K.D. Inclination sensing characteristic using magnetic fluids. J. Shanghai Jiaotong Univ. 2014, 48, 1183–1188. [Google Scholar]
  19. Hidehiko, S.; Takeshi, K.; Chitoshi, M. Determination method of bridge rotation angle response using mems imu. Sensors 2014, 16, 1882. [Google Scholar]
  20. Huseynov, F.; Kim, C.; Obriene, E.J.; Brownjohn, J.M.W.; Hester, D.; Chang, K.C. Bridge damage detection using rotation measurements-experimental validation. Mech. Syst. Signal Process. 2020, 135, 106380.1–106380.22. [Google Scholar] [CrossRef]
  21. Zhang, C.R.; Ge, Y.X.; Hu, Z.C.; Zhou, K.; Ren, G.F.; Wang, X.D. Research on deflection monitoring for long span cantilever bridge based on optical fiber sensing. Opt. Fiber Technol. 2019, 53, 102035. [Google Scholar] [CrossRef]
  22. Yu, H.Y.; Chen, X.L.; Ren, M.Y.; Yin, L.K.; Wu, Q.; Zhao, J.S.; Liu, Q. A coupled bend-twist deformation monitoring method based on inclination measurement and rational cubic spline fitting. Mech. Syst. Signal Process. 2021, 147, 107084. [Google Scholar] [CrossRef]
  23. Li, S.; Hu, W.B. A novel bridge curve mode measurement technique based on FOG. Optik—Int. J. Light Electron Opt. 2015, 126, 4175–4178. [Google Scholar] [CrossRef]
  24. Bertola, N.J.; Smith, I.F.C. A methodology for measurement-system design combining information from static and dynamic excitations for bridge load testing. J. Sound Vib. 2019, 463, 114953. [Google Scholar] [CrossRef]
  25. Zhai, H.; Qu, S.Y.; Wang, G.L. Research on the method of simply supported beam modal parameters recognition by QY inclinometer. J. Appl. Sci. 2014, 14, 1844–1850. [Google Scholar]
  26. Hoult, N.A.; Fidler, P.R.A.; Hill, P.G.; Middleton, G.R. Long-term wireless structural health monitoring of the Ferriby road bridge. J. Bridge Eng. 2010, 15, 153–159. [Google Scholar] [CrossRef] [Green Version]
  27. Stöhr, R.; Rücker, W. Damage detection based on static measurements on bridge structures. In Proceedings of the IMAC-XXIV, Missouri, MO, USA, 1 June 2006. [Google Scholar]
  28. Alten, K.; Ralbovsky, M.; Vorwagner, A.; Toplitzer, H.; Wittmann, S. Evaluation of different monitoring techniques during damage infliction on structures. Procedia Eng. 2017, 199, 1840–1845. [Google Scholar] [CrossRef]
  29. Alamdari, M.M.; Kildashti, K.; Samali, B.; Goudarzi, H.V. Damage diagnosis in bridge structures using rotation influence line: Validation on a cable-stayed bridge. Eng. Struct. 2019, 185, 1–14. [Google Scholar] [CrossRef]
  30. Furinghetti, M.; Pavese, A.; Lunghi, F.; Silvestri, D. Strategies of structural health monitoring for bridges based on cloud computing. J. Civ. Struct. Health Monit. 2019, 9, 607–616. [Google Scholar] [CrossRef]
  31. Clemente, P.; Bongiovanni, G.; Buffarini, G.; Saitta, F. Structural health status assessment of a cable-stayed bridge by means of experimental vibration analysis. J. Civ. Struct. Health Monit. 2019, 9, 655–669. [Google Scholar] [CrossRef]
  32. Glii, B.; Posenato, D.; Inaudi, D.; Figini, A. Structural health monitoring method for curved concrete bridge box girders. Proc. SPIE—Int. Soc. Opt. Eng. 2008, 6932, 693204–693204-9. [Google Scholar]
  33. Liu, H.; Ou, J.P. The state of the art in structural health monitoring of cable-stayed bridges. J. Civ. Struct. Health Monit. 2015, 6, 1–25. [Google Scholar] [CrossRef]
  34. Priestley, M.J.N.; Park, R. Strength and ductility of concrete bridge column under seismic loading. Aci. Struct. J. 1987, 84, 61–76. [Google Scholar]
  35. Furinghetti, M.; Pavese, A. Definition of a simplified design procedure of seismic isolation systems for bridges. Struct. Eng. Int. 2020, 30, 381–386. [Google Scholar] [CrossRef]
  36. Wu, C.M.; Chuang, Y.T. Roll angular displacement measurement system with microradian accuracy. Sens. Actuators A Phys. 2004, 116, 145–149. [Google Scholar] [CrossRef]
  37. Wyler, A.G. Levelmatic 31—High Precision Analog Inclination Sensor Technical Specification. 2016. Available online: https://www.wylerag.com/fileadmin/pdf/manuel/Manual%20LEVELMATIC%2031.pdf (accessed on 10 March 2022).
  38. Bruns, D.G. An optically referenced inclinometer with sub-microradian repeatability. Rev. Sci. Instrum. 2017, 88, 115111. [Google Scholar] [CrossRef] [PubMed]
  39. Inaudi, D.; Glisic, B. Interferometric inclinometer for structural monitoring. In Proceedings of the 2002 15th Optical Fiber Sensors Conference Technical Digest Ofs IEEE, Portland, OR, USA, 10 May 2002. [Google Scholar]
  40. New Light FS64 | Tilt Sensor. Available online: https://www.hbm.com/cn/8122/newlight-fs64-optical-tilt-sensor (accessed on 2 March 2022).
  41. The Third Railway Survey and Design Institute Group Corporation. Specification for Design of High Speed Railway; China Railway Publishing House: Beijing, China, 2014. [Google Scholar]
  42. Japan Institute of Railway Comprehensive Technology. Railway Structure Design Criteria and Its Interpretation-Displacement Limits; Maruzen Co., Ltd. Publishing Division: Tokyo, Japan, 2004. [Google Scholar]
  43. HBM Launches Data Acquisition Amplifier Modules. Mainframe Computing. 2014. Available online: https://www.digitalengineering247.com/article/hbm-launches-new-data-acquisition-amplifier-modules/ (accessed on 10 March 2022).
  44. Dong, Y.G. Sensing Technology and Systems; Tsinghua University Press: Beijing, China, 2006. [Google Scholar]
Figure 1. Schematic illustration of the inclinometer setup.
Sensors 22 02715 g001
Figure 2. Deformation illustration of the inclinometer under bridge rotation.
Sensors 22 02715 g002
Figure 3. Schematic illustration of the inclinometer: (a) device components; (b) device installed on bridge; (c) prototype of the proposed inclinometer.
Sensors 22 02715 g003
Figure 4. (a) Full bridge circuit; (b) sensor characteristic curve.
Sensors 22 02715 g004
Figure 5. Data acquisition module interface.
Sensors 22 02715 g005
Figure 6. (a) Schematic illustration and (b) laboratory setup of the calibration test.
Sensors 22 02715 g006
Figure 7. Strain and displacement curves under repeated load (a) strain curve; (b) displacement curve.
Sensors 22 02715 g007
Figure 8. Rotation-strain curve.
Sensors 22 02715 g008
Figure 9. Resolution test chart (a) actual test curve; (b) resolution.
Sensors 22 02715 g009
Figure 10. (a) Schematic diagram of linearity curve; (b) actual linearity of the proposed inclinometer.
Sensors 22 02715 g010
Figure 11. (a) Schematic diagram of repeatability characteristics; (b) actual repeatability curve of the proposed inclinometer.
Sensors 22 02715 g011
Figure 12. Bridge overview and installation point (red dot) of the inclinometer.
Sensors 22 02715 g012
Figure 13. On-site installation of BRT-1 rotation monitoring device (a) device installation; (b) overall setup; (c) UAV photography.
Sensors 22 02715 g013
Figure 14. Time-history of typical beam-end rotation response.
Sensors 22 02715 g014
Figure 15. Beam-end rotation monitoring data under different vehicle loads (a) small vehicle; (b) medium vehicle; (c) large vehicle; rotation response to (d) small vehicle; (e) medium vehicle; (f) large vehicle.
Sensors 22 02715 g015
Table 1. Technical specifications of commercially available inclinometers.
ModelCountry of OriginMeasurement Range (°)Resolution in Degrees (°)Precision in Degrees (°)Sampling Rate (Hz)
DNSGermany±853 × 10−3±3 × 10−2100
JDI 100USA±11 × 10−4±4 × 10−3125
JN2101Germany±451 × 10−3±1 × 10−220
ACA2200Japan±0.51 × 10⁻⁴±3 × 10−320
ZERO-TRONICSwitzerland±0.51 × 10⁻⁴±3.5 × 10−410
T935UK±16 × 10−5±4 × 10−410
Table 2. Dimensions and features of the inclinometer components.
No.ComponentSize/(mm)Feature
1Upper cover420 × 150 × 8Convert rotation to strain
2Lower cover420 × 150 × 8Fix reference plane
3Elastomer80 × 10 × 5Elastic sensitive element
4Limit rodΦ20Limit before test
5Connection rods100 × 100 × 8Fix the device to the bridge
6Strain gauge5 × 3Sensing elastic beam strain signal
Table 3. Rotation responses generated by different types of vehicles.
Vehicle SizeSmallMediumLarge
Approx. vehicle weight (ton)2435
Rotation response (×10−4 (°))3.26.246.8
Publisher’s Note: MDPI stays neutral with regard to jurisdictional claims in published maps and institutional affiliations.

