
Non-Destructive Techniques for the Condition and Structural Health Monitoring of Wind Turbines: A Literature Review of the Last 20 Years


Abstract
:1. Introduction
2. Context: The Worldwide Politics and Economics of Wind Turbines
2.1. Climate Change and the Political Stance on Sustainable Energy Sources
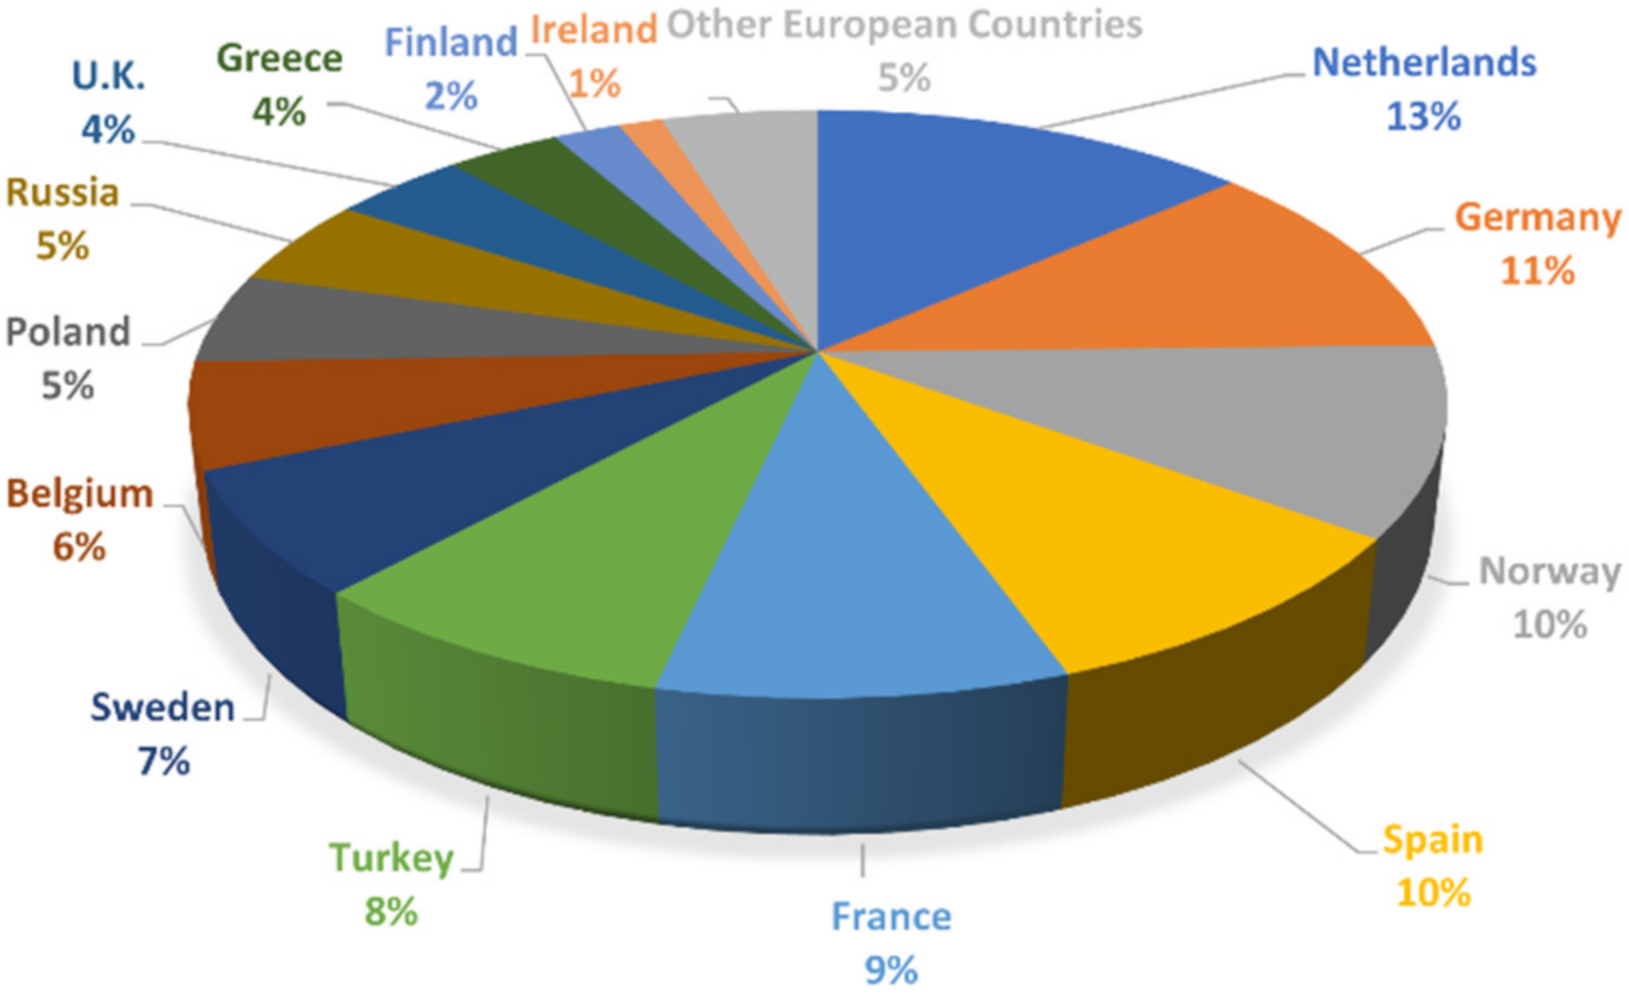
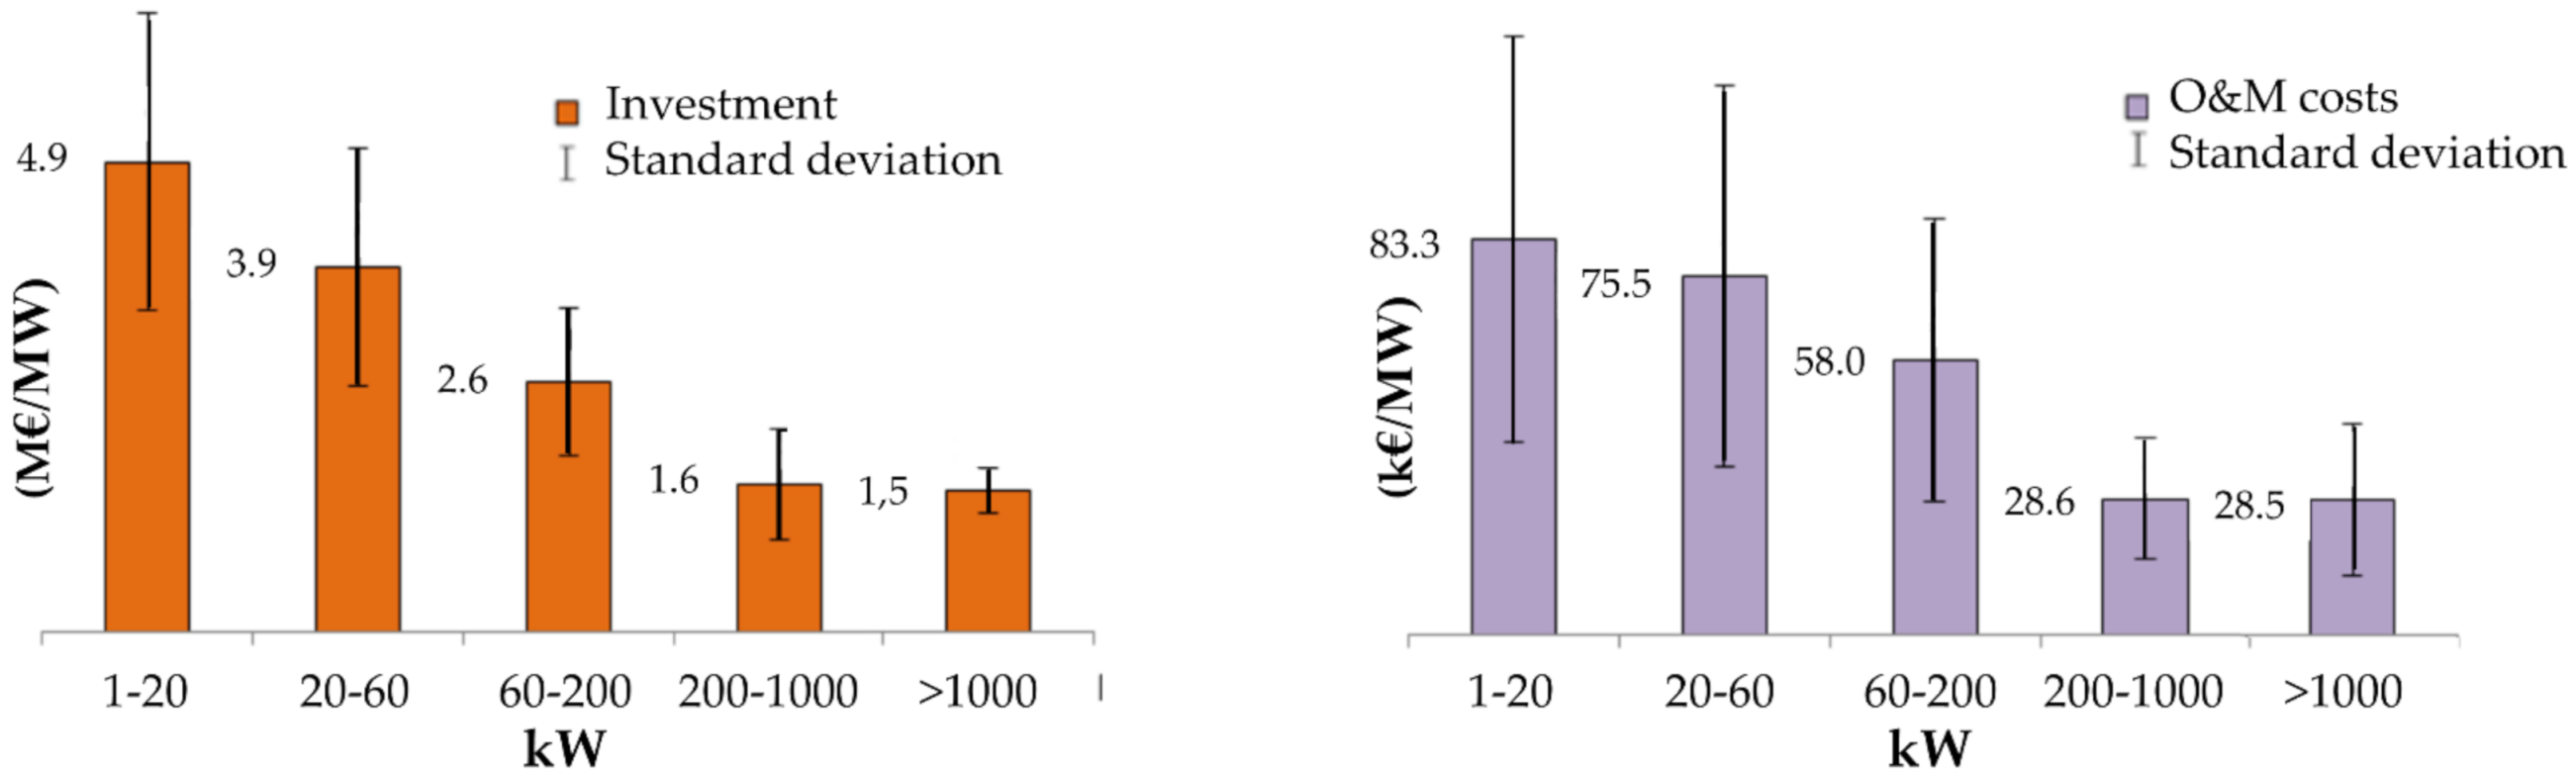
2.2. The Current and Near-Future Economic Impact of Wind Power
2.3. Expected Returns and Benefits from WT Monitoring

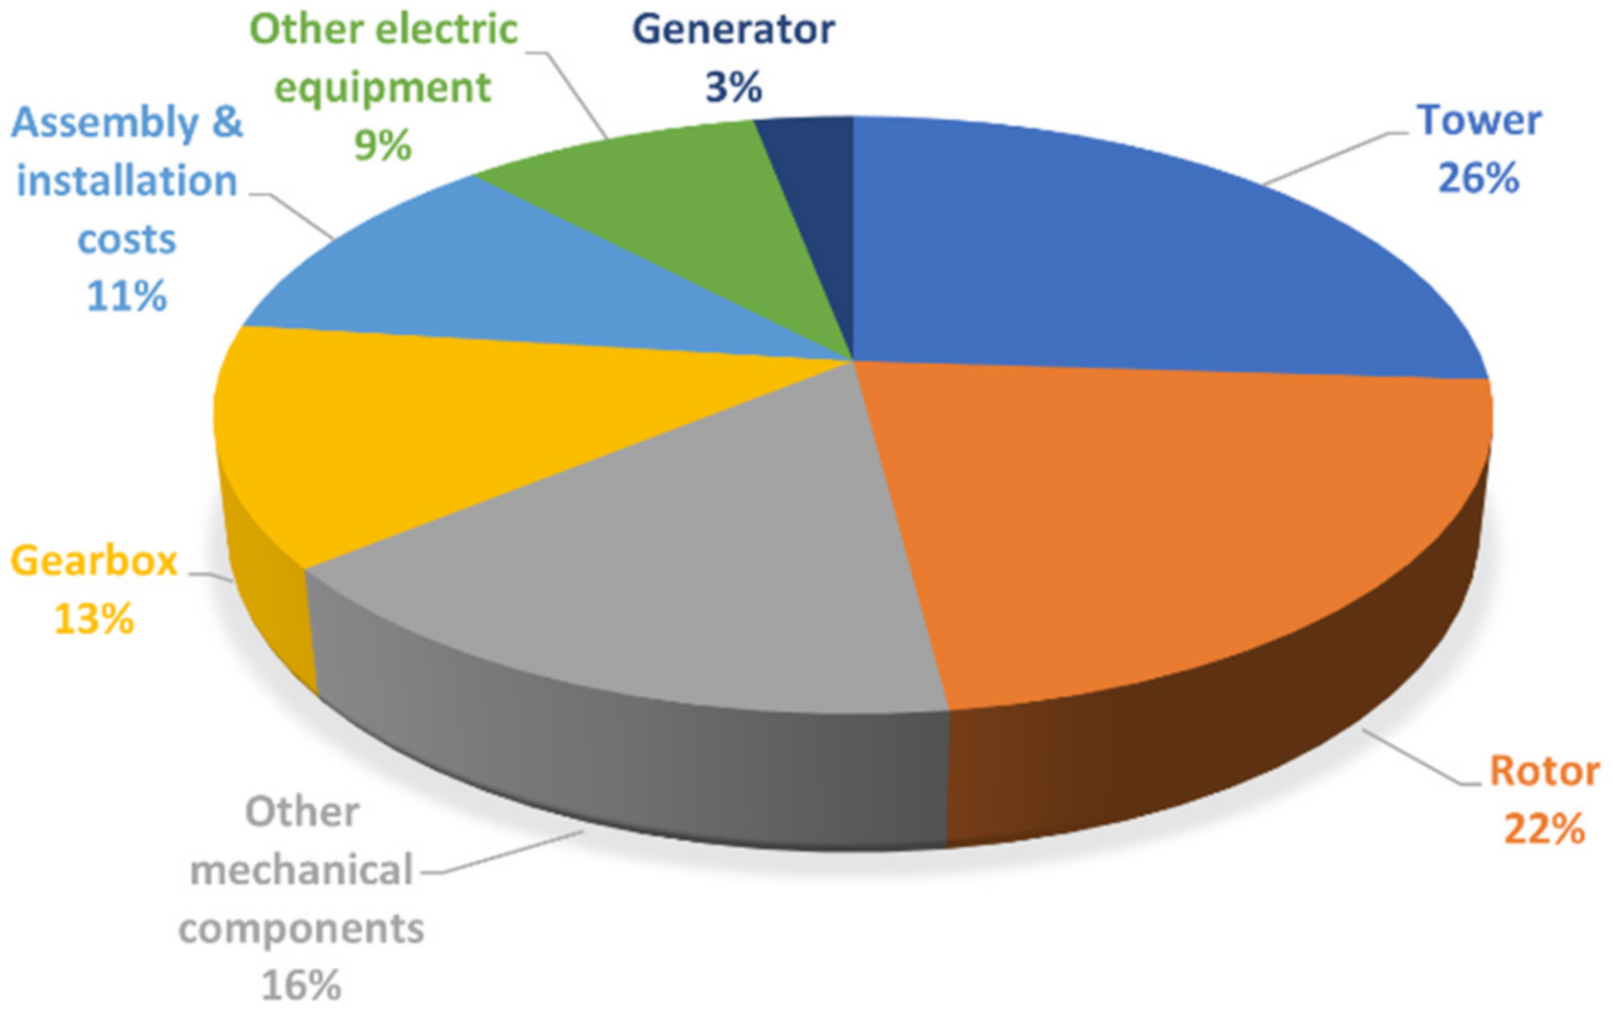
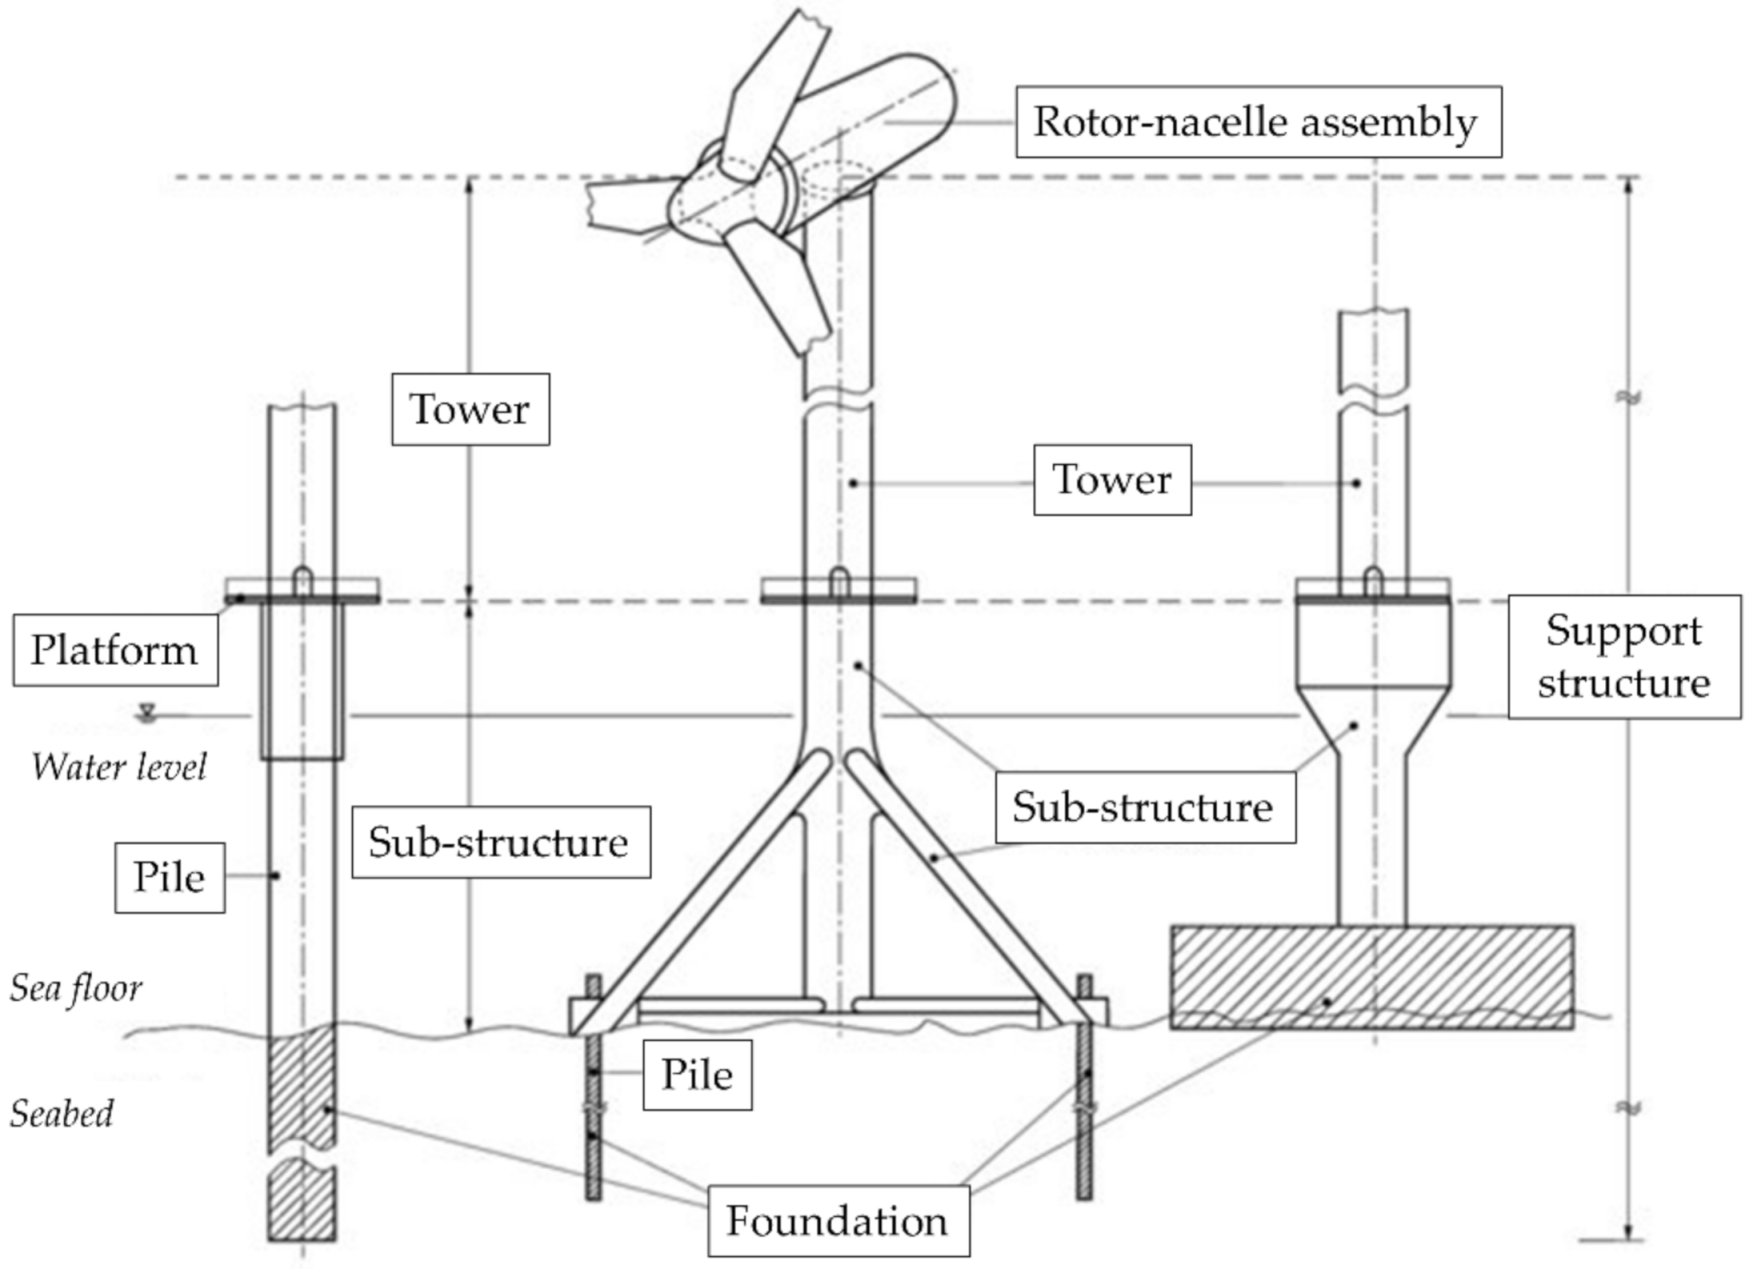
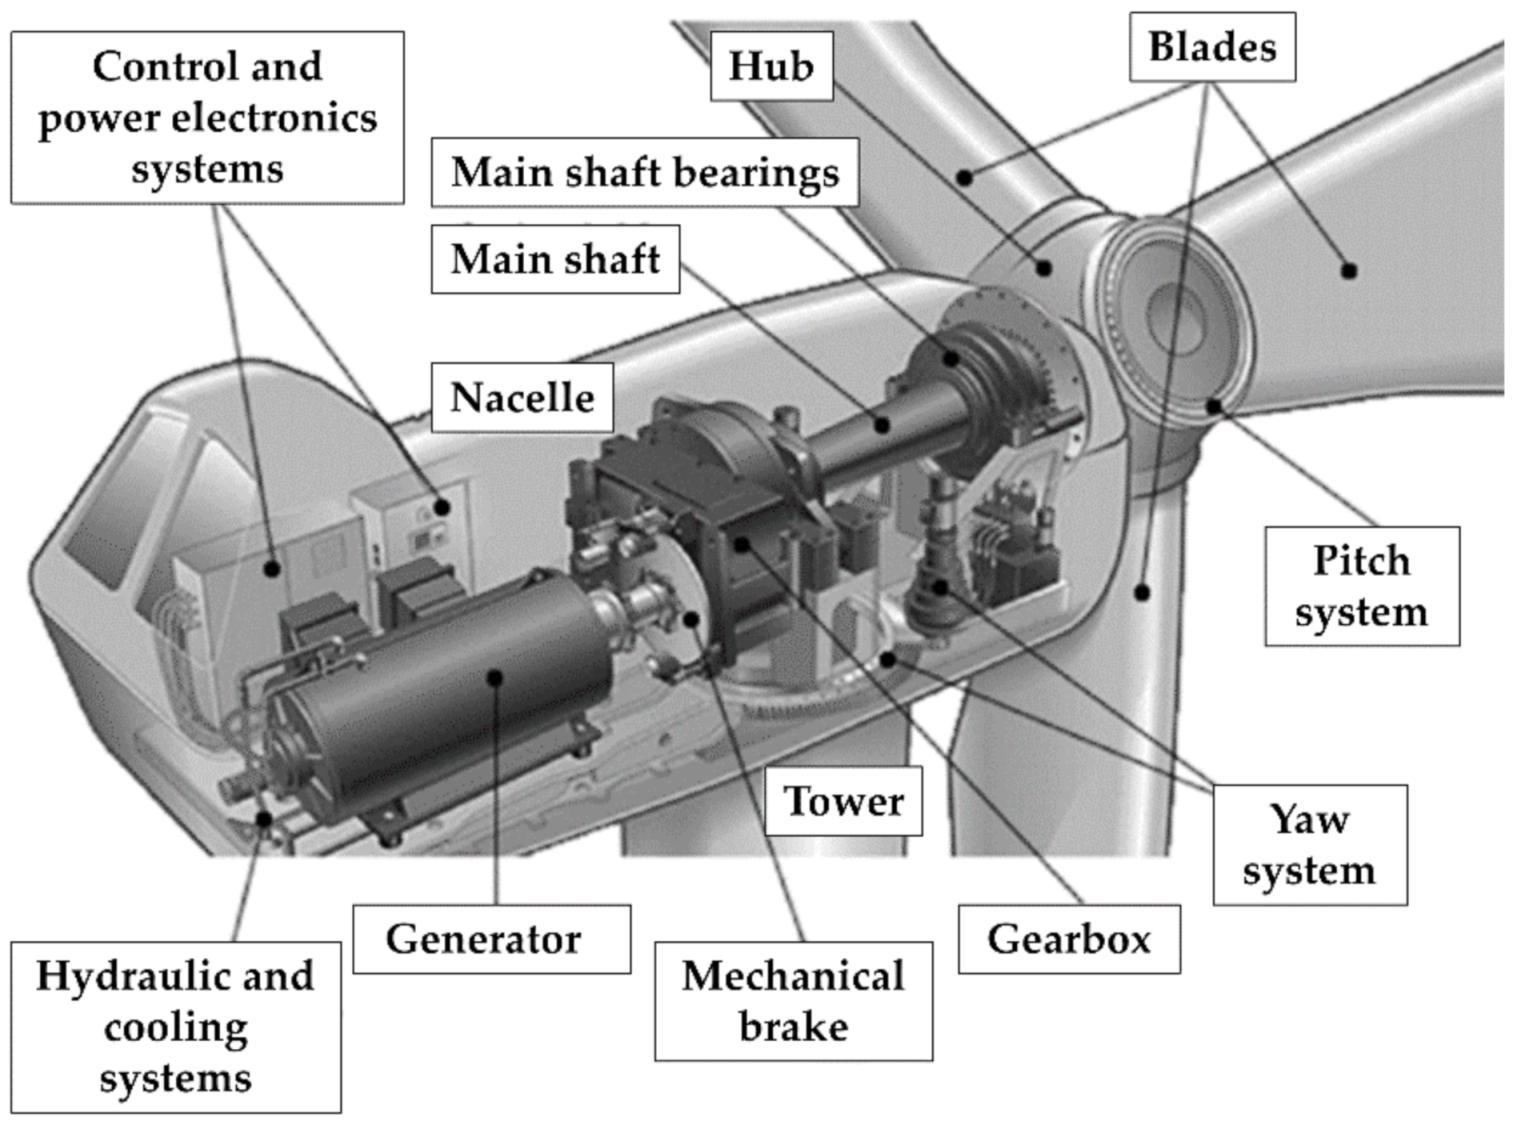
3. Wind Turbines: Structural and Mechanical Components
- (i)
- static, load-bearing components;
- (ii)
- moving/rotating parts, needed to harness the wind’s kinetic energy and turn it into electricity.
3.1. Components under Structural Health Monitoring
3.1.1. The Tower

3.1.2. The Substructure
3.1.3. The Foundations
3.1.4. The Rotor
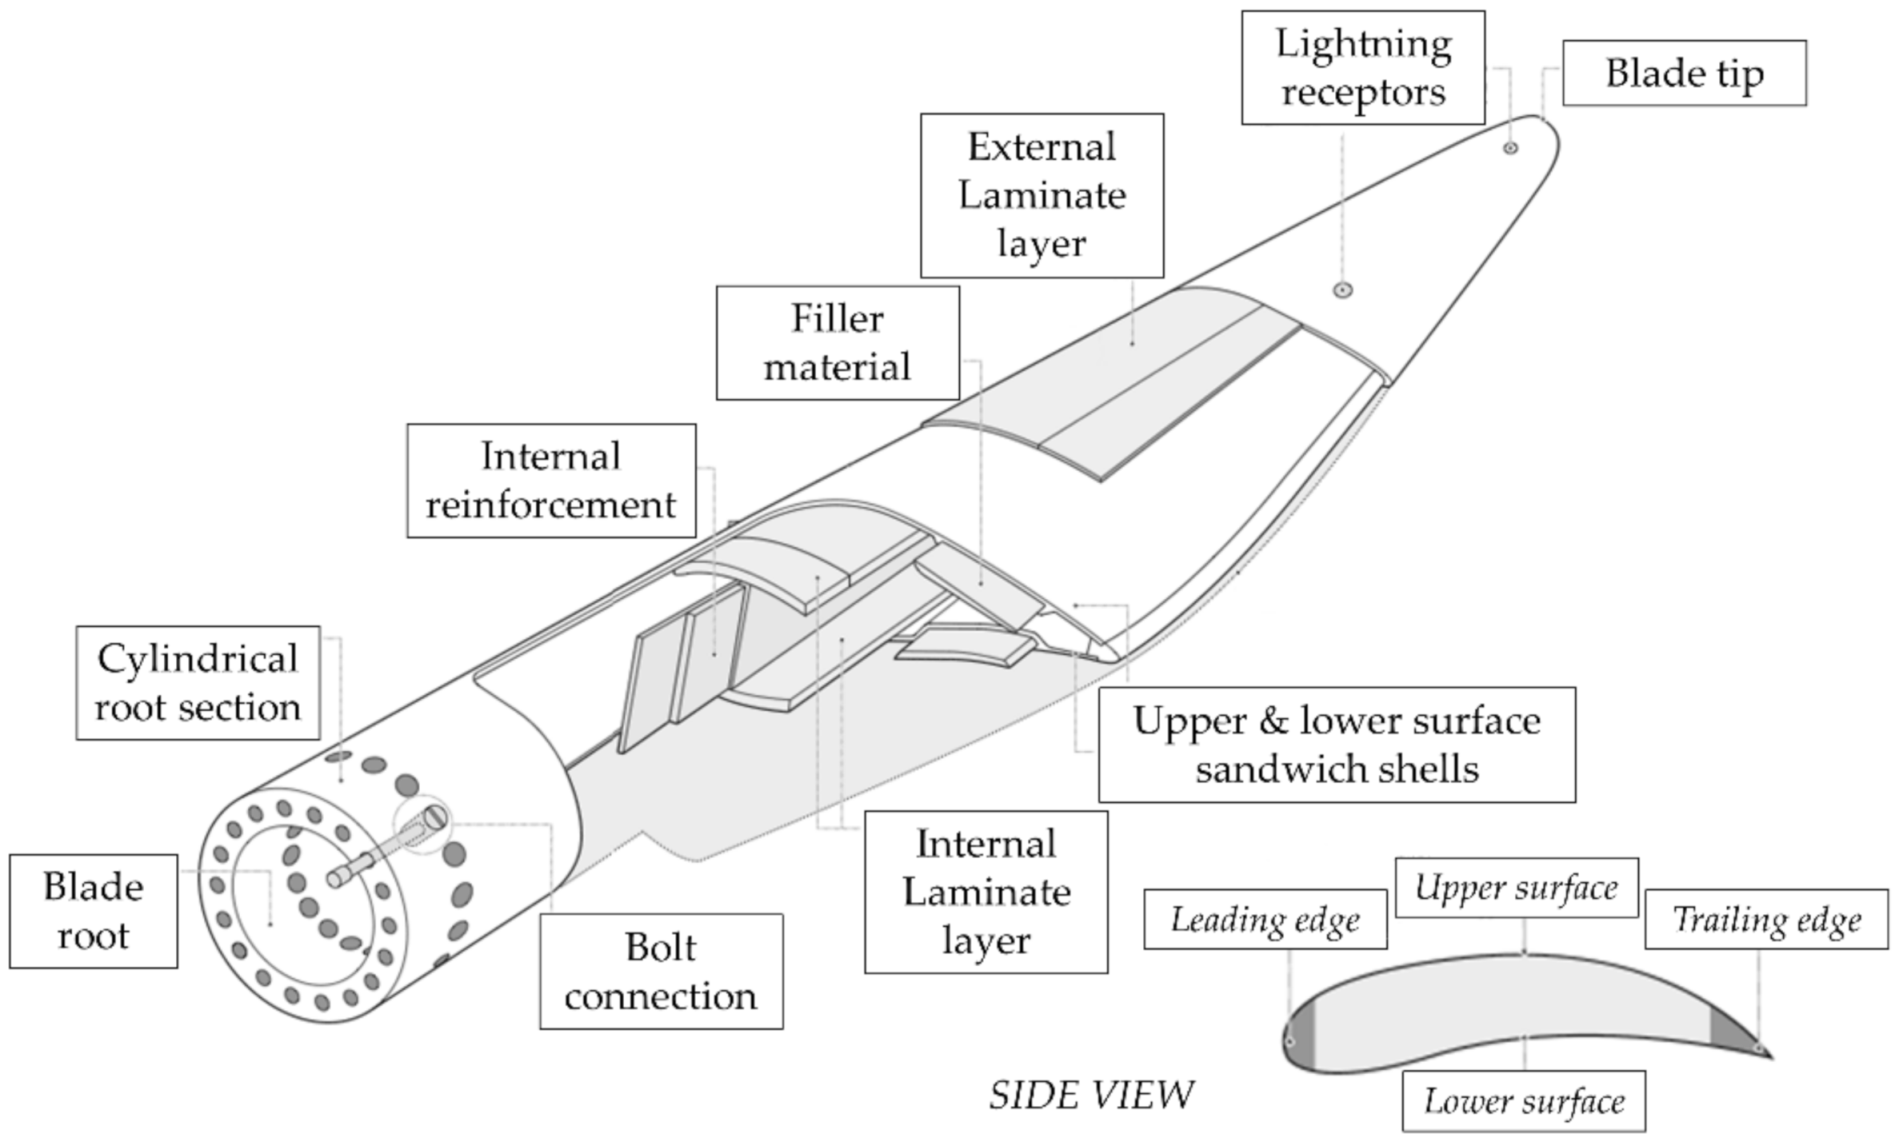
3.1.5. The Blades
3.2. Components under Condition Monitoring
3.2.1. Drive Train (and Other Components Inside the Nacelle)
3.2.2. The Gearbox
3.2.3. The Generator
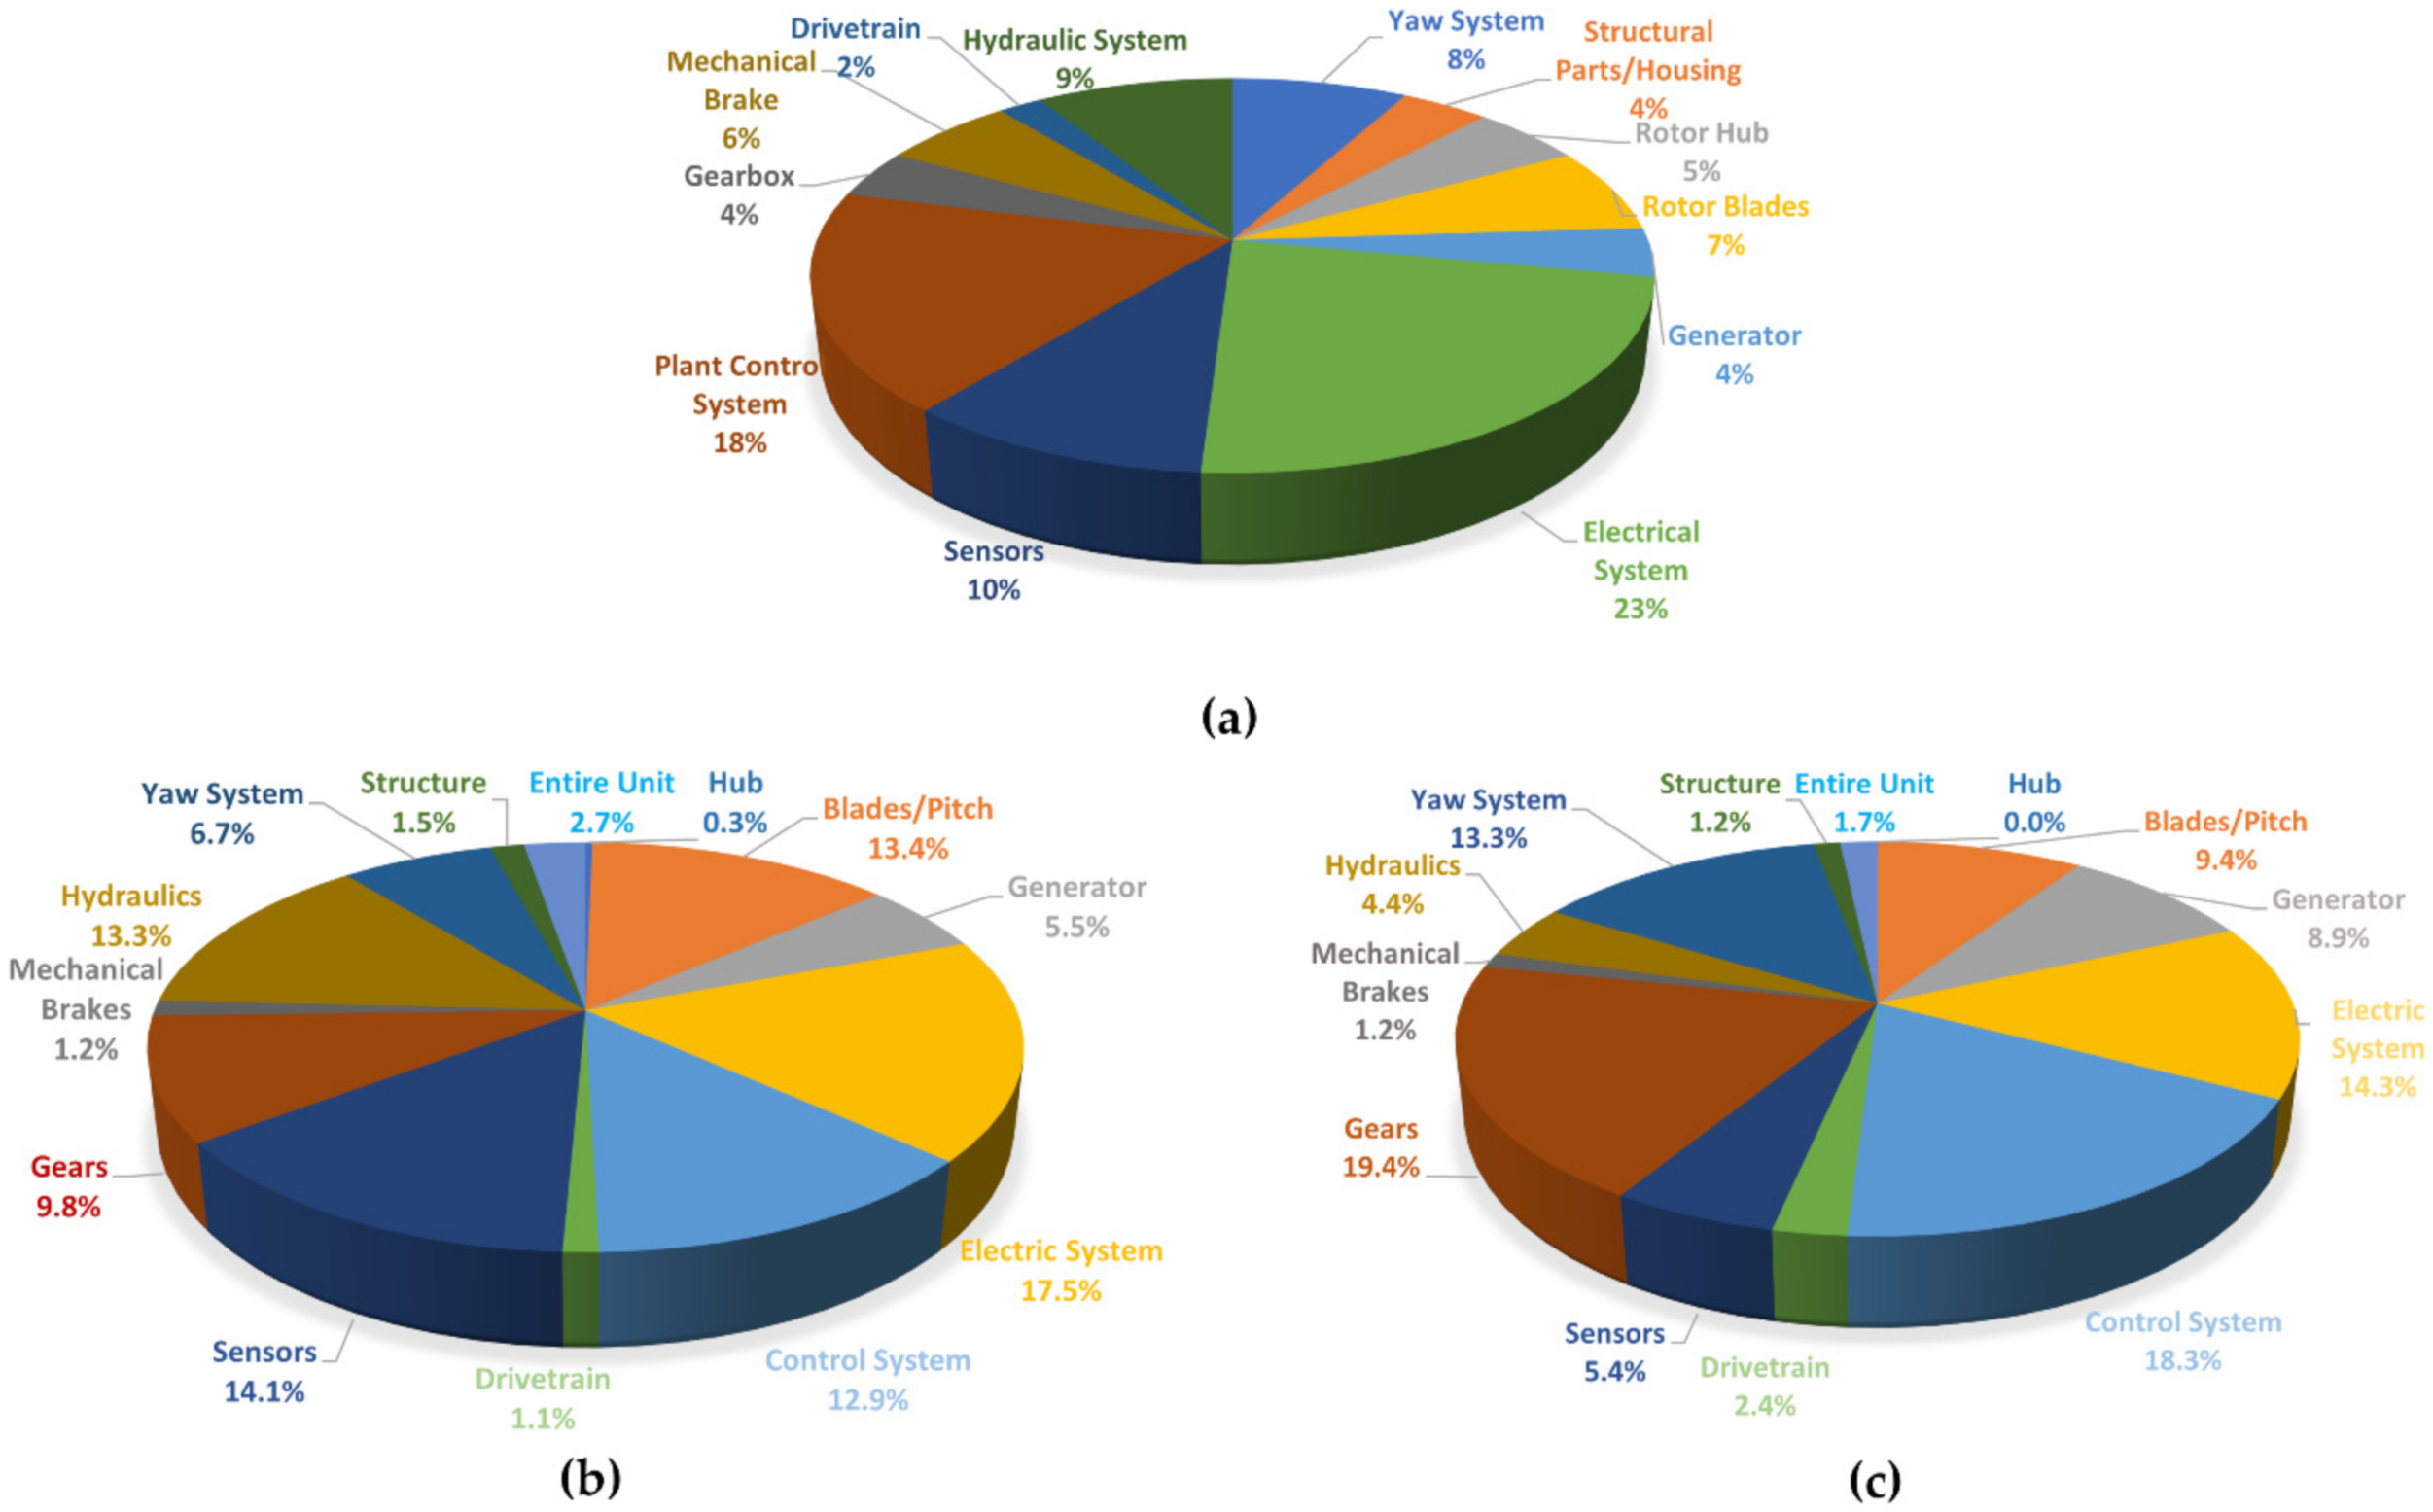
3.3. Incidence and Main Causes of Structural Collapse
3.4. The Incidence and Main Causes of Mechanical Failure
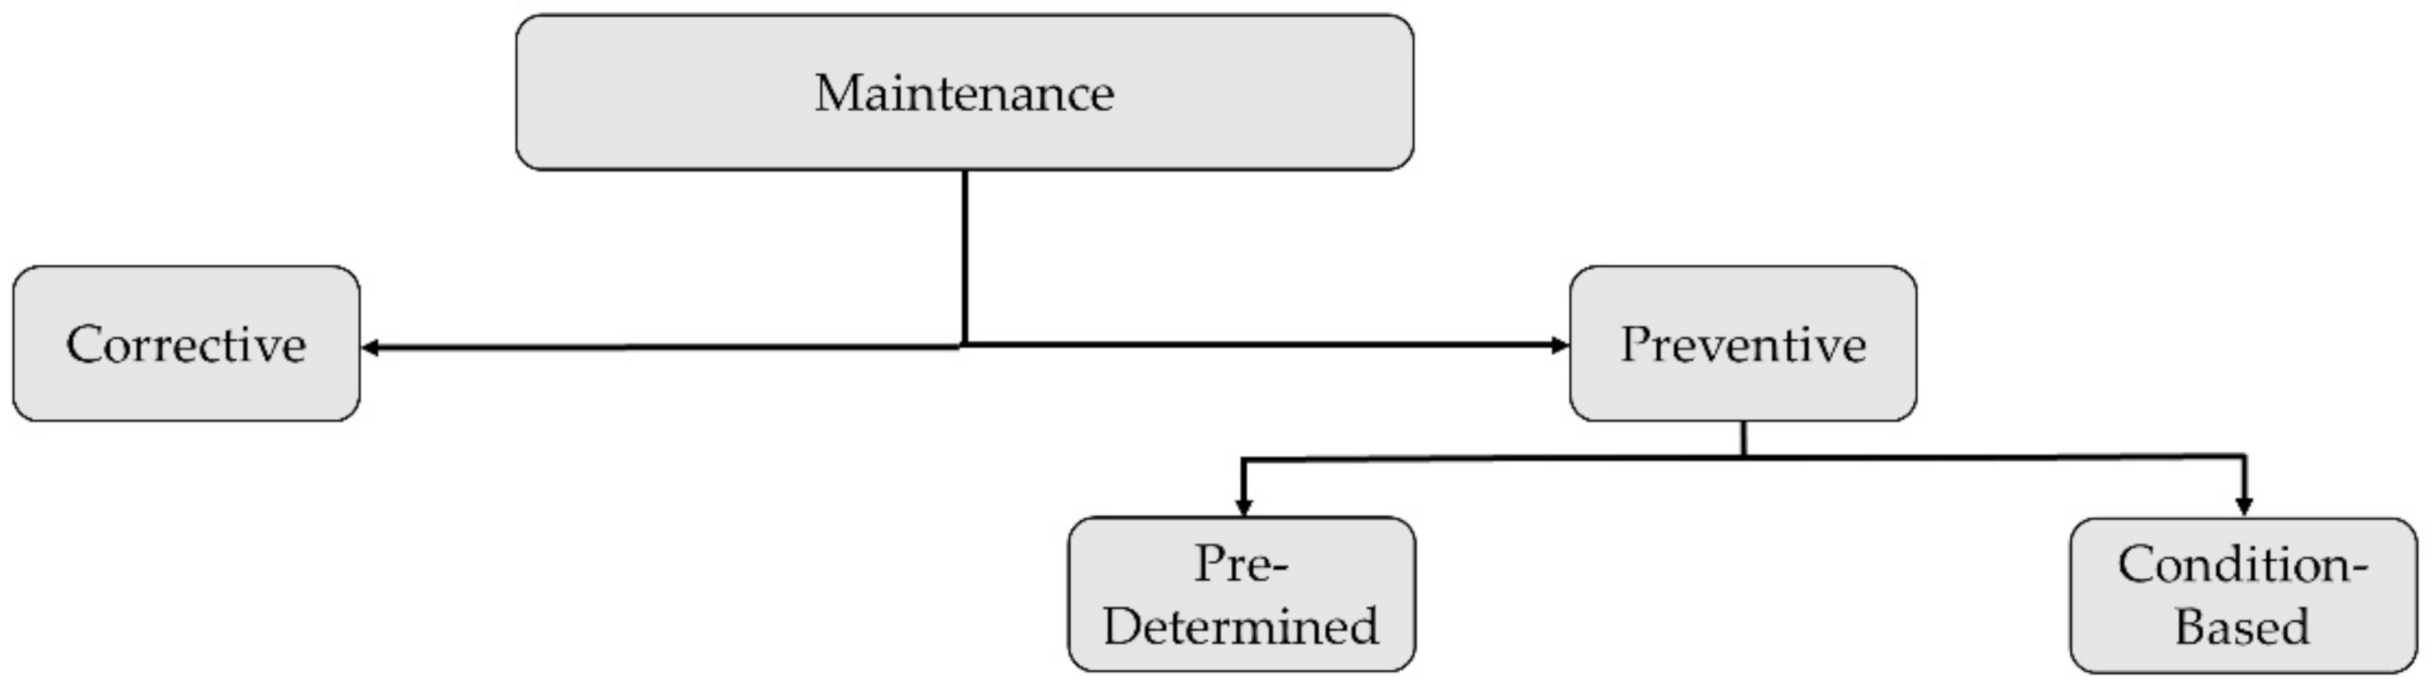
3.5. Survey and Maintenance Policy for Offshore Wind Farms
4. Main Applications for NDE Techniques in Wind Turbines
4.1. Condition Monitoring of the Mechanical Components
4.2. SHM of the Wind Turbine Blades (Blade Monitoring)
- at the blade root (where the mechanical stress is maximized);
- between % and % of the chord length;
- at 70% of the same;
- at the maximum chord section (subject to potential buckling);
- on the upper flange of the spar, at different chord lengths depending on the pitch angle (thus on the current wind speed).
4.3. SHM of the Supporting Structure and Substructure
- welted, grouted, and bolted joints, due to their relative fragility, in particular to fatigue damage; e.g., on tripod offshore structures, the upper central joint is the most critical location;
- location exposed to an aggressive environment (e.g., underwater or, even worse, in the splash zone). Corrosion monitoring is particularly requested in these most endangered locations.
4.4. SHM of the Foundations
5. Non-Destructive Techniques (NDTs)
5.1. Traditional, Enhanced, and Automatic Visual Inspection (VI)
- if they require human personnel on-site or not;
- if they add any kind of support to the human eyesight.
5.2. Optical Methods

| Study | Year | Technique | Notes | Application |
|---|---|---|---|---|
| Baqersad et al. [119] | 2012 | 3D DIC | The authors used two stereoscopic high-speed cameras to record the vibrations of a WT blade with optical targets attached to its surface (excited with hammer hits). | SHM |
| LeBlanc et al. [120] | 2013 | 3D DIC | The full-field displacement and strain fields of one CX-100 9 m-long WT blade were estimated. The damaged areas were located from discontinuities in the curvature shapes. | SHM |
| Winstroth et al. [121] | 2014 | 3D DIC and point tracking | A random black-and-white dot pattern was applied at four different radial positions on one blade of a three-bladed rotor. The tests were performed in situ on the operating HAWT. | SHM |
| Carr et al. [122] | 2016 | DIC and 3D Dynamic Point Tracking (3DPT) | The authors compared the dynamic stress and strain fields obtained with their video-extracted measurements with the readings from attached strain gauges. | SHM |
5.3. Laser-Based Measurement Techniques (LDV, LiDAR, and Shearography)
5.4. Video Spectroscopy
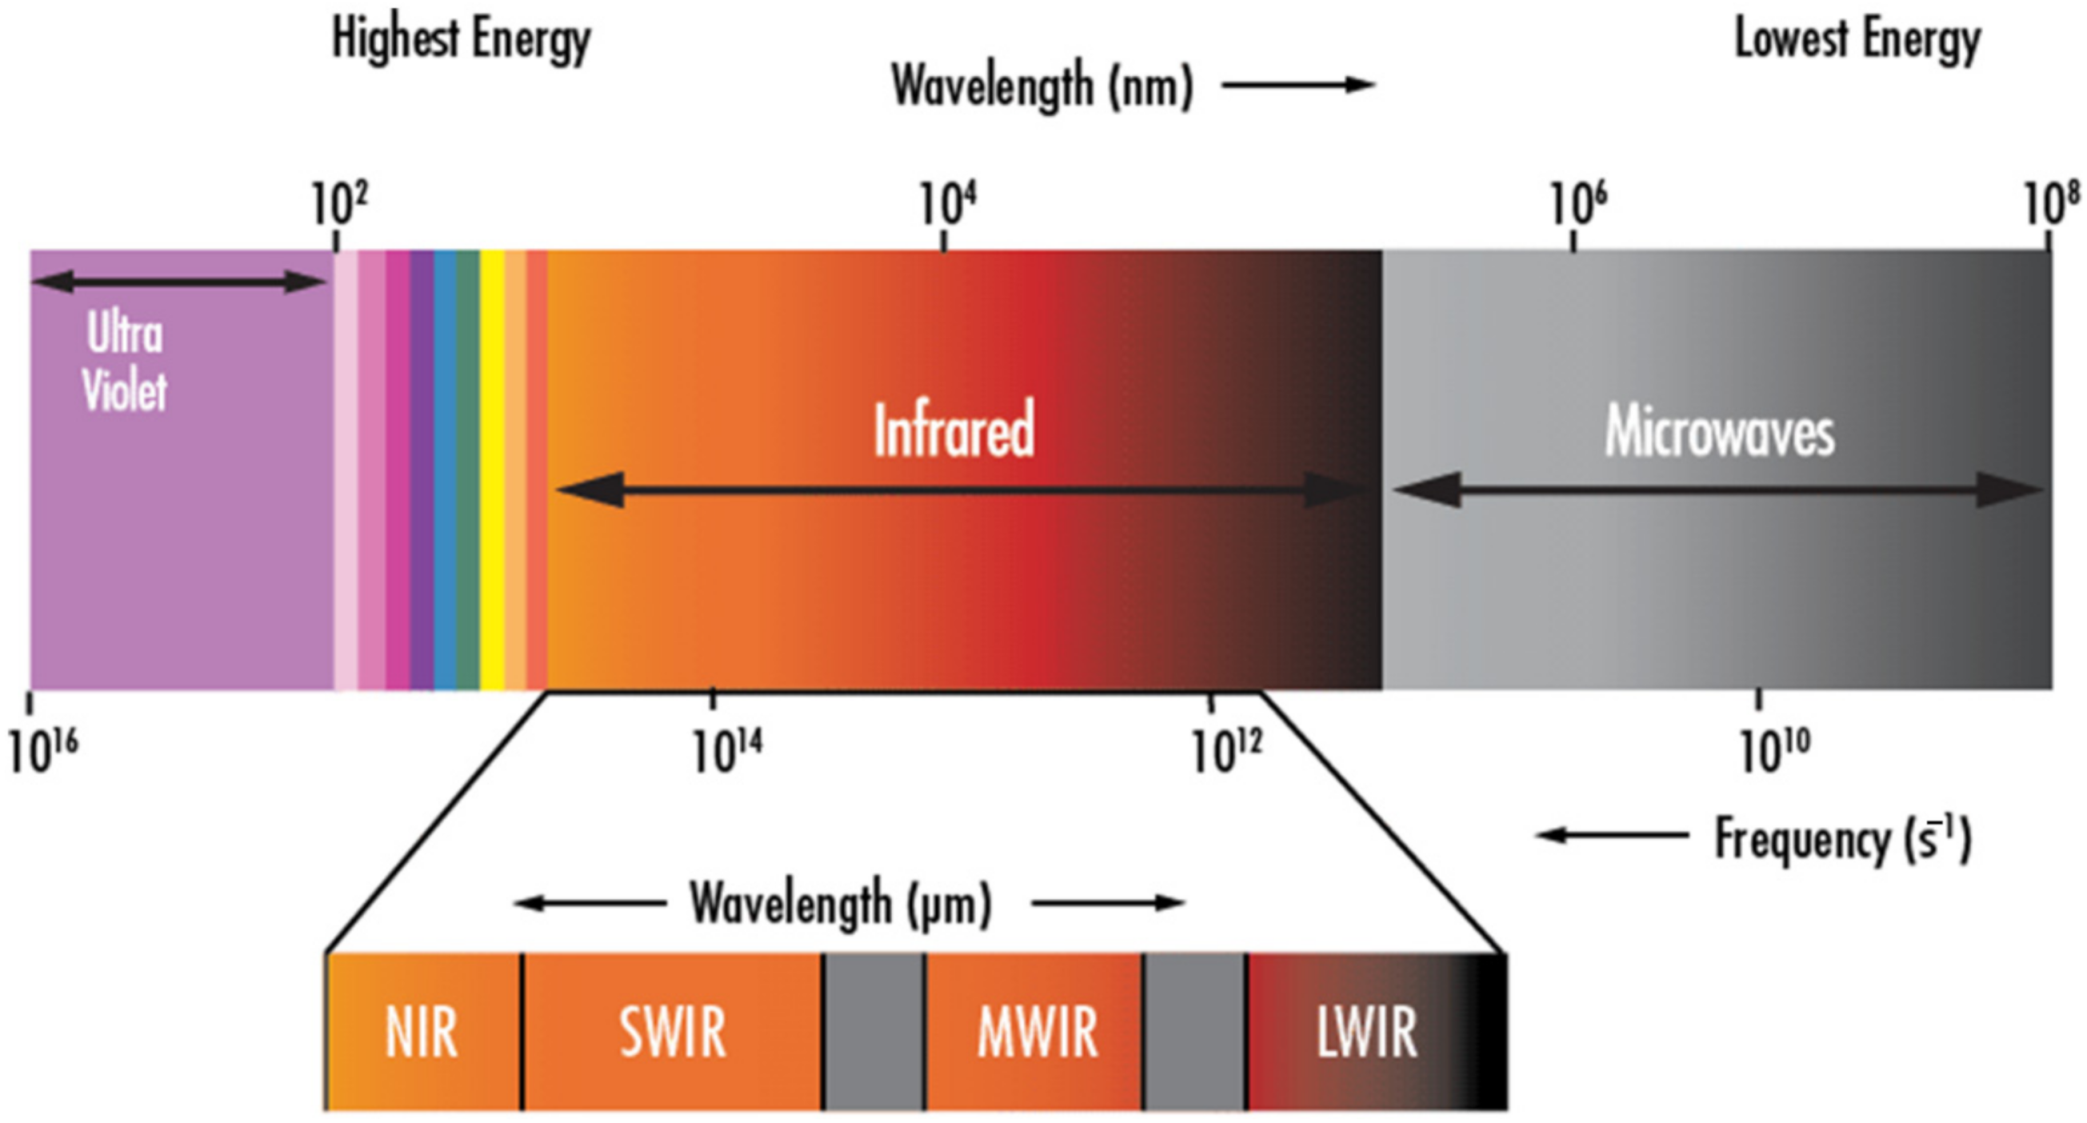
5.5. Infrared Thermography (IRT) and Other Temperature Measurements
5.5.1. Passive IRT
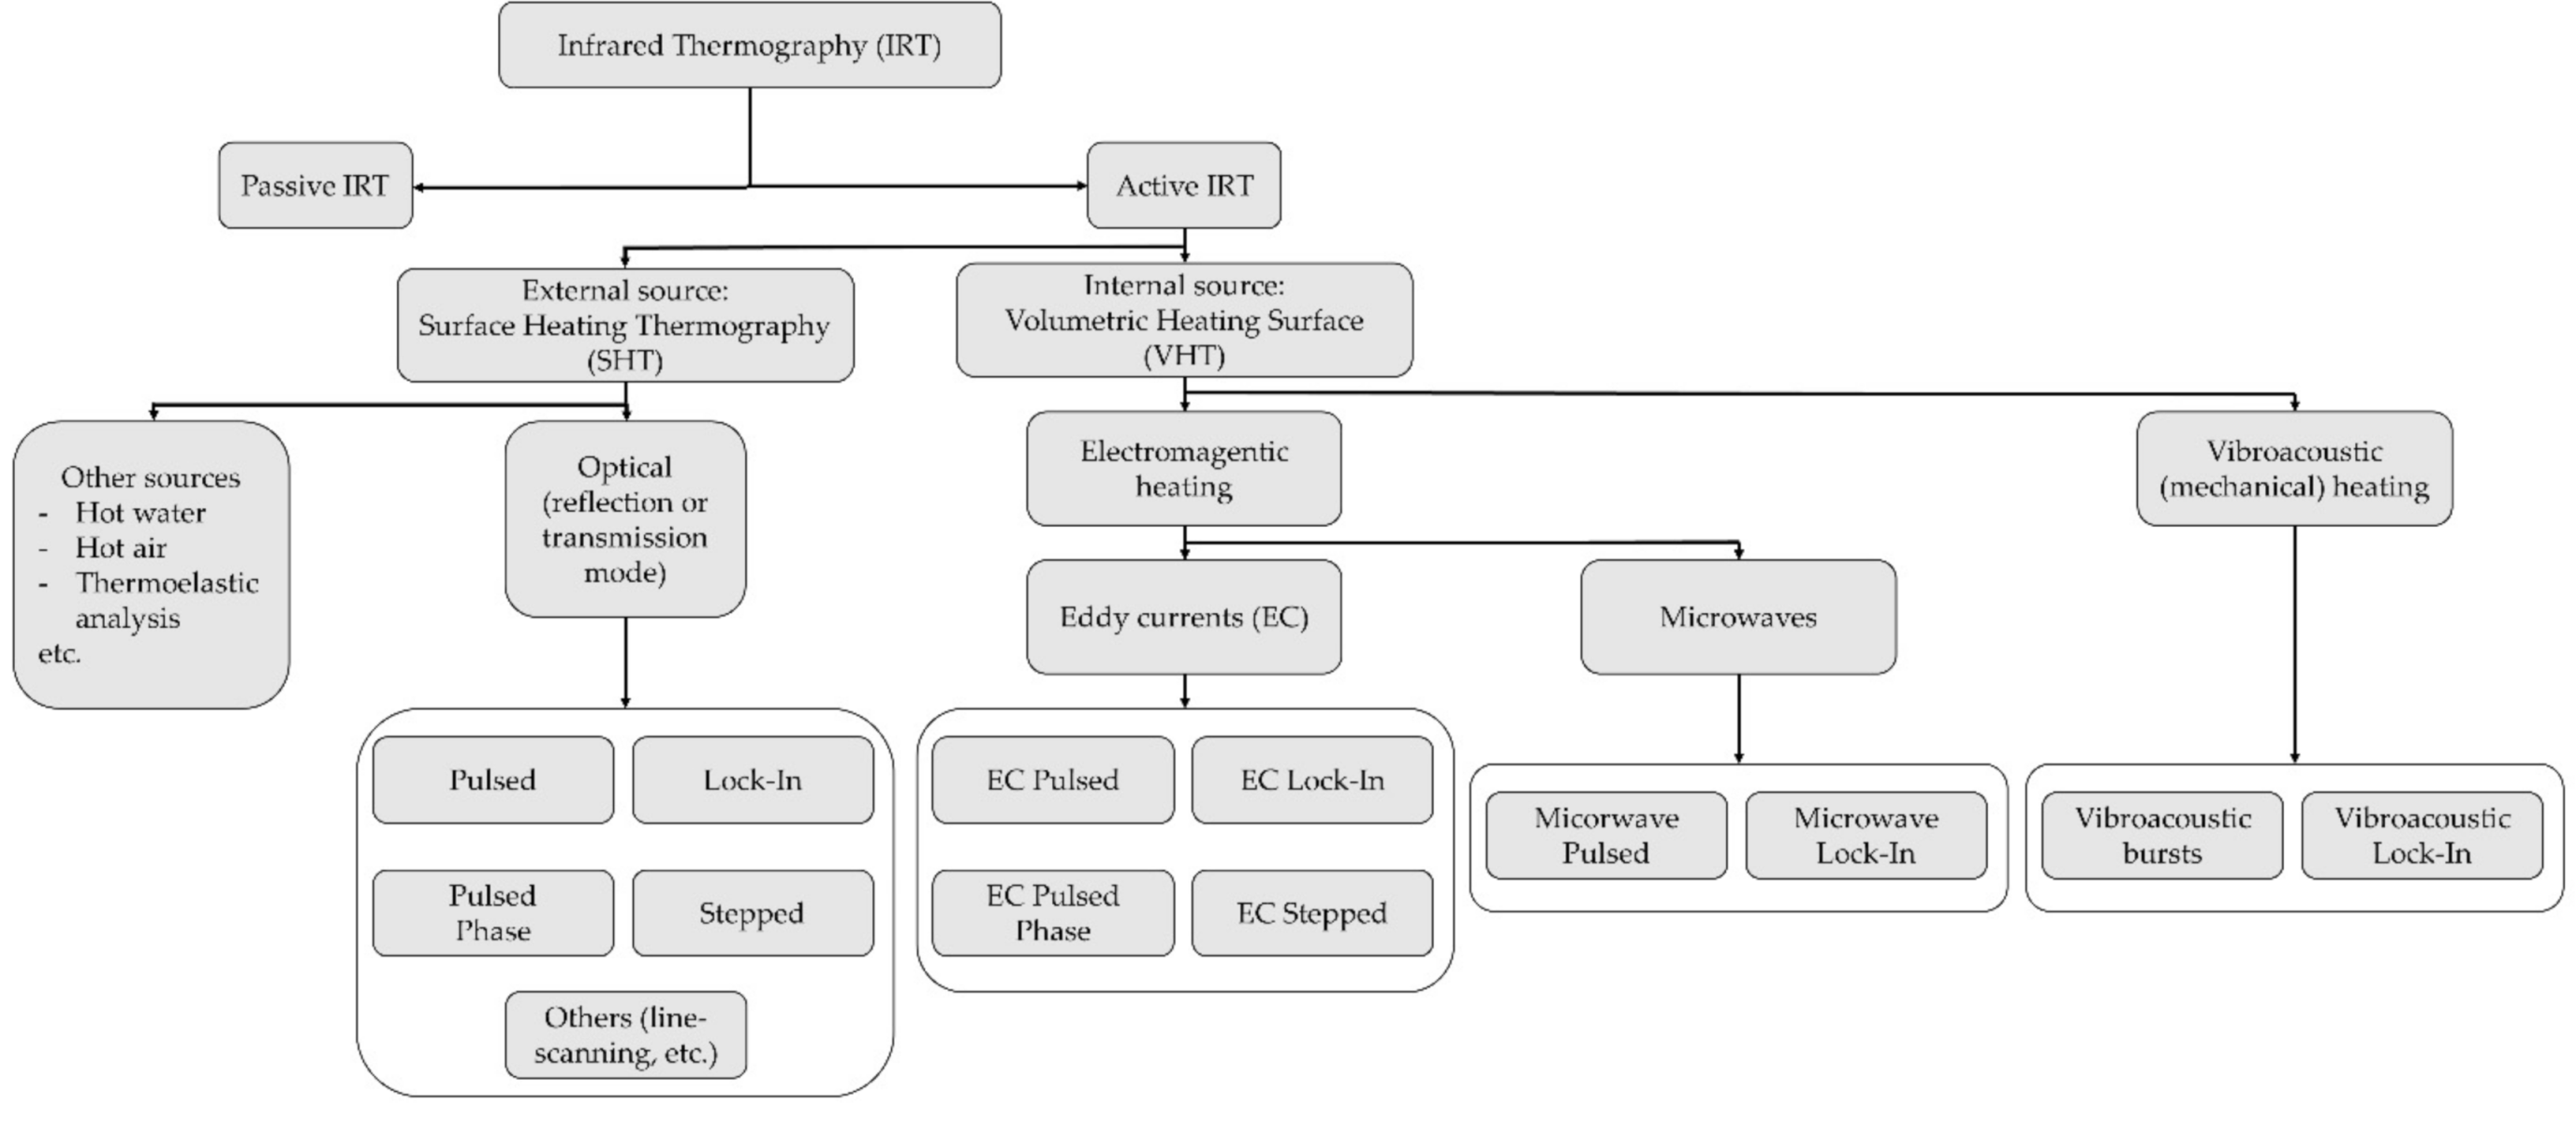
5.5.2. Active IRT
- eddy current (EC) thermography (or inductive thermography), based on the heath released by resistive losses to the eddy currents induced by electromagnetic pulses [161];
- microwave thermography, based on the well-known principles of microwave heating. The electromagnetic energy is absorbed volumetrically by the target object, favouring uniform and rapid self-heating;
- vibrothermography (or thermo-sonic testing), with mechanical waves.
5.5.3. Physically-Attached Temperature Sensors
5.6. Radiographic Testing (RT)
5.7. Microwave and Terahertz Testing
5.8. Electromagnetic Testing (ET)
5.9. Acoustic Emissions (AEs)
- (1)
- not all the typologies of damage emit strong AE;
- (2)
- even more importantly, many damage-unrelated phenomena emit AEs.
| Study | Year | Technique | Notes | Application |
|---|---|---|---|---|
| Eftekharnejad & Mba [256] | 2009 | AE waveforms. | Applied for the detection of seeded tooth root cracks in one helical gear of the wind turbine gearbox. | CM |
| Elforjani & Mba [257] | 2010 | Continuous AE energy monitoring. | The authors applied AEs for the CM of low-speed shafts and bearings (separately) also considering different conditions such as lubricant starvation. The bearing test demonstrated the AE’s efficiency in detecting crack initiation and propagation. | CM |
| Eftekharnejad et al. [258] | 2011 | Kurtogram (spectral kurtosis). | Compared the effectiveness of applying the kurtogram to AEs and for a roller bearing on a laboratory test bench. | CM |
| Qu et al. [259] | 2012 | Time synchronous averaging (TSA) and kurtosis. | The heterodyne technique used in telecommunication was used to pre-process AE signals, reducing the sampling frequency from MHz to kHz. | CM |
| Niknam et al. [260] | 2013 | PAC-energy (Physical Acoustic Corporation PCI-2 AE system). | This study focused on wind turbine drive trains subject to rotor unbalances. These unbalances may be caused by manufacturing defects or non-uniform accumulation of ice, dust, moisture, or even damage on rotor blades. | CM |
| Ferrando Chacon et al. [261] | 2016 | Root Mean Square Error, Peak Value, Crest Factor, and Information Entropy of AE waveforms. | The confounding influences induced by different operating conditions (load and torque) on the AE signature of a wind turbine gearbox were investigated. | CM |
| Zhang et al. [262] | 2017 | Damage localisation was performed via triangulation (delays in the time of arrival). | The first attempt of mechanical fault localisation for CM inside a wind turbine gearbox. | CM |
| Joosse et al. [245] | 2002 | Load-hold test. | An early application of AEs off-site on a detached WT blade. | SHM |
| Anastassopoulos et al. [263] | 2002 | Load-hold test. | Machine Learning (specifically, Unsupervised Pattern Recognition) was applied to AE data from ten WT blades. | SHM |
| Blanch & Dutton [264] | 2003 | Load-hold, stationary, and operating tests. | AEs applied on-site to attached blades (both stationary and rotating during normal operating conditions). | SHM |
| Paquette et al. [265] | 2007 | Three-point bending test. | The article documented a 5-year long project performed at Sandia National Laboratories (USA) to characterize WT blades made of carbon fibres. | SHM |
| Zarouchas & Van Hemelrijck [266] | 2011 | Peak frequency analysis of AEs and Digital Image Correlation. | AEs were used to characterize the crack growth at different scales in laboratory specimens, treated with an adhesive used for WT blades composites. Tensile and compression tests were executed. DIC was used to compare the strain measurements with the recorded acoustic activity. | SHM |
| Han et al. [267] | 2013 | Static loading test. | AEs and strain measurements of a WT blade inner shear web were compared, to correlate acoustic emissions and stress conditions. | SHM |
| Bouzid et al. [268] | 2014 | Ambient excitation(naturally occurring AEs). | Proposed a Wireless Sensor Network (WSN) architecture for damage localisation in the blades of operating wind turbines (via triangulation). | SHM |
| Tang et al. [269] | 2016 | Pencil lead break test. | The acoustic emissions were generated by breaking a pencil lead in the blade surface. Proved the feasibility of damage severity assessment and growth tracking. | SHM |
| Gómez Muñoz & García Márquez [270] | 2016 | Pencil lead break test. Damage localisation was performed via triangulation (delays in the time of arrival). | Three macro-fibre composite transducers were applied on the surface of a WT blade. | SHM |
| Tang et al. [271] | 2017 | 21-day long fatigue test. | Unsupervised Pattern Recognition was applied to a very large dataset of recorded AEs. | SHM |
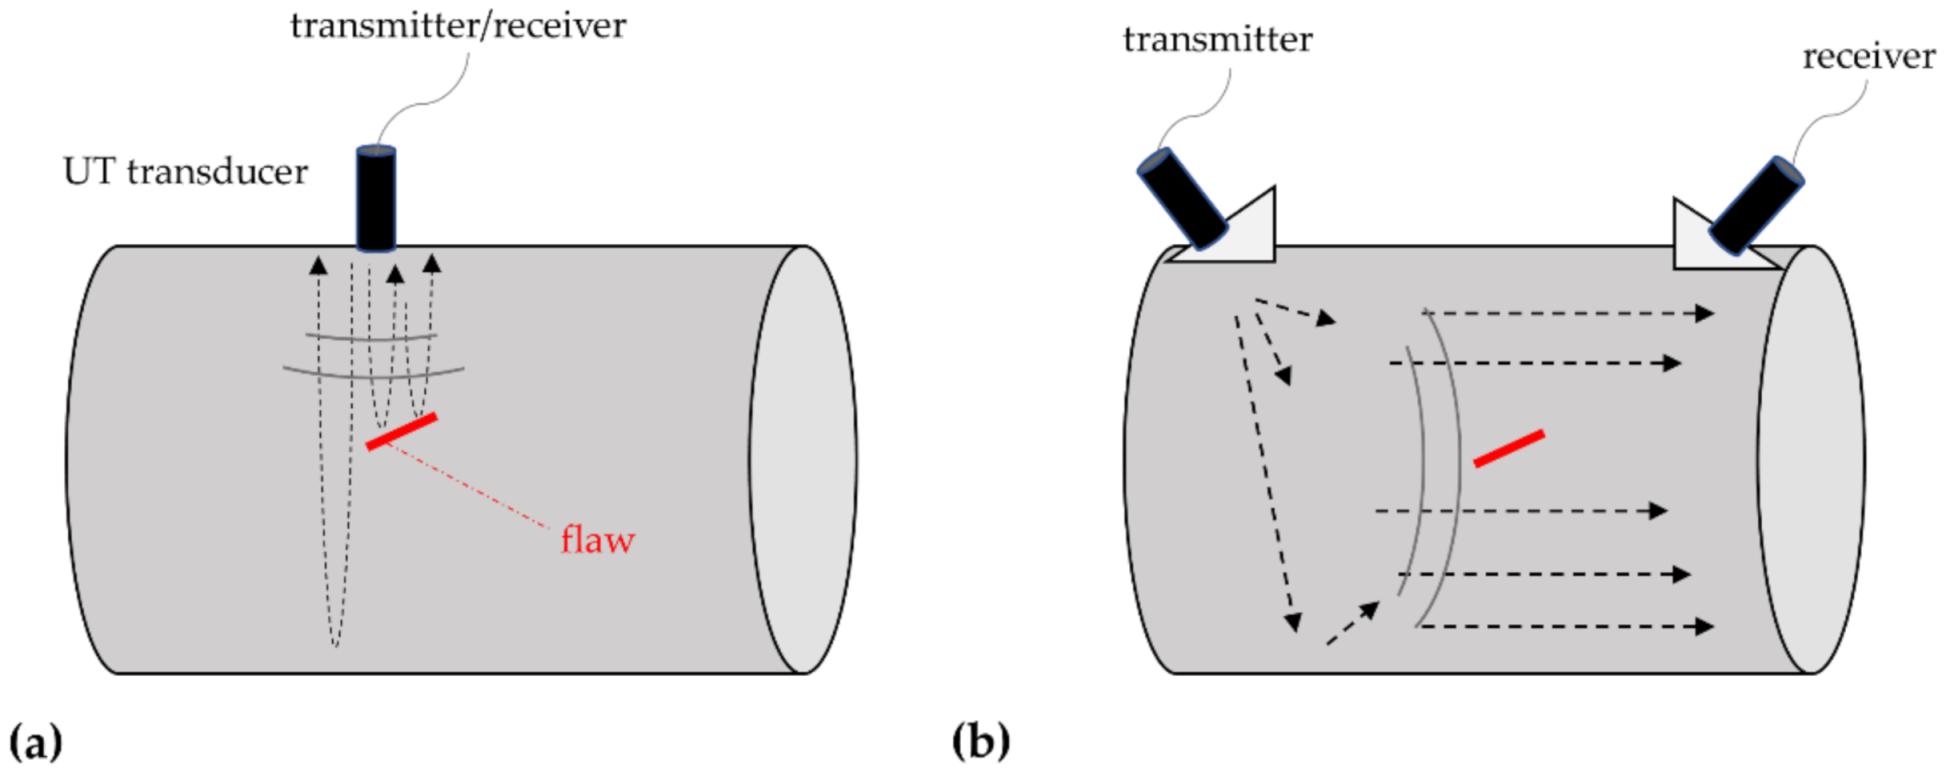
5.10. Ultrasonic Testing (UT)
5.11. Oil Monitoring
| Study | Year | Technique | Notes | Application |
|---|---|---|---|---|
| Myshkin et al. [302] | 2003 | Optical ferroanalyzer | The document presented the operating principle of the optical ferroanalyzer, a sensing device for the estimation of total lubricant oil contamination, for condition monitoring. | CM |
| Dupuis [303] | 2010 | Oil debris monitoring | The technique is based on counting debris particles and measuring their size to assess the severity of the gearbox failure. | CM |
| Zhu et al. [301] | 2013 | Several sensing devices | A total of 10 sensors and 6 performance parameters related to oil oxidation, water contamination, and particle contamination were discussed. | CM |
| Coronado & Kupferschmidt [307] | 2014 | Water content, particle concentration, particle count, dielectric constant, viscosity, oil colour, and oil density sensors | The paper mainly described a highly accelerated stress screening test chamber to assess the performance of oil properties sensors under extreme ambient temperature and vibration levels. The oil parameters are intended as considered as proxies of wind turbine gearbox conditions. | CM |
| Zhu et al. [308] | 2015 | Particle filtering, plus viscosity and dielectric constant sensors | Related to the previous paper by the same authors [301], it applied online oil monitoring for fault detection and remaining useful life prediction. | CM |
| Sheng [309] | 2016 | 2.5-MW dynamometer test facility at U.S. National Renewable Energy Laboratory (fully described in Ref. [310]) | The laboratory tests were performed on full-scale wind turbine gearboxes in three configurations: run-in, healthy, and damaged conditions. | CM |
5.12. Static Strain Measurements
5.13. Other NDE Approaches
- Dynamometer testing, performed off-site on the whole drive train system, to assess for potential slipping behaviour in the high-speed shaft tapered roller bearings [321];
- Short-Range Doppler Radar, very recently tested for the son-site SHM of WT blades [324];
- Multi-sensor apparatuses, such as e.g., the one proposed in Ref. [325] (with optical, acoustical, and vibrational sensing devices) to detect bird and bad strikes.
6. Discussion
7. Conclusions
Author Contributions
Funding
Institutional Review Board Statement
Informed Consent Statement
Data Availability Statement
Acknowledgments
Conflicts of Interest
Abbreviations
| AE | Acoustic Emission. |
| AI | Artificial Intelligence |
| BVID | Barely Visible Impact Damage |
| CFRP | Carbon Fibre Reinforced Polymer |
| CM | Condition Monitoring |
| CT | Coherence Tomography |
| DIC | Digital Image Correlation |
| EC | Eddy Current |
| ET | Electromagnetic testing |
| FBG | Fibre Bragg Grating |
| GFRP | Glass Fiber Reinforced Polymer |
| HAWT | Horizontal Axis Wind Turbine |
| IRT | Infrared Thermography |
| LCOE | Levelized Cost of Energy |
| LDV | Laser Doppler Velocimeter |
| NDE | Non-Destructive Evaluation |
| NDT | Non-Destructive Technique |
| OCT | Optical Coherence Tomography |
| O&M | Operation and Maintenance (cost) |
| RS | Remote Sensing |
| RT | Radiographic Testing |
| SCADA | Supervisory Control And Data Acquisition (system) |
| SHM | Structural Health Monitoring |
| SHT | Surface Heating Thermography |
| UAV | Unmanned Aerial Vehicle |
| UT | Ultrasonic Testing |
| VBI | Vibration-Based Inspection |
| VHT | Volume Heating Thermography |
| VI | Visual Inspection |
| WEC | White Etching Cracks |
| WT | Wind Turbine |
References
- Brouwer, S.R.; Al-Jibouri, S.H.; Cardenas, I.C.; Halman, J.I. Towards analysing risks to public safety from wind turbines. Reliab. Eng. Syst. Saf. 2018, 180, 77–87. [Google Scholar] [CrossRef]
- World Meteorological Organization. Proceedings of the World Climate Conference. A Conference of Experts on Climate and Mankind; Secretariat of the World Meteorological Organization: Geneva, Switzerland, 1979. [Google Scholar]
- International Renewable Energy Agency (IRENA). Renewable Capacity Statistics; International Renewable Energy Agency (IRENA): Abu Dhabi, United Arab Emirates, 2021. [Google Scholar]
- Gestore Servizi Energetici (GSE). Sviluppo e Diffusione Delle Fonti Rinnovabili di Energia in Italia e in Europa—Anno 2019; Gestore Servizi Energetici (GSE): Rome, Italy, 2021. [Google Scholar]
- Wind Europe. Wind in Power—2016 European Statistics; Wind Europe: Brussels, Belgium, 2017. [Google Scholar]
- BloombergNEF. Global Wind Industry Had a Record, Near 100GW, Year as GE, Goldwind Took Lead from Vestas. Available online: https://about.bnef.com/blog/global-wind-industry-had-a-record-near-100gw-year-as-ge-goldwind-took-lead-from-vestas/ (accessed on 22 November 2021).
- Pek, A. A Gust of Growth in China Makes 2020 a Record Year for Wind Energy. Available online: https://gwec.net/a-gust-of-growth-in-china-makes-2020-a-record-year-for-wind-energy/ (accessed on 10 February 2022).
- Bowers, R.; Comstock, O. The United States Installed More Wind Turbine Capacity in 2020 Than in Any Other Year. Available online: https://www.eia.gov/todayinenergy/detail.php?id=46976 (accessed on 10 February 2022).
- RenewablesNow. Japan Ends 2020 with 4.37 GW of Wind Power. Available online: https://renewablesnow.com/news/japan-ends-2020-with-437-gw-of-wind-power-731205/ (accessed on 10 February 2022).
- Clean Energy Council Australia. Wind Generation. Available online: https://www.cleanenergycouncil.org.au/resources/technologies/wind#:~:text=Wind%20was%20again%20Australia’s%20leading,breaking%20year%20for%20the%20sector (accessed on 10 February 2022).
- Ministry of New & Renewable Energy—Government of India. Current Status of the Wind Industry. Available online: https://mnre.gov.in/wind/current-status/ (accessed on 10 February 2022).
- Agência ABEEólica. Dia Mundial do Vento: Brasil Completa 19 GW de Capacidade Instalada de Energia Eólica. Available online: http://abeeolica.org.br/noticias/dia-mundial-do-vento-brasil-completa-19-gw-de-capacidade-instalada-de-energia-eolica/ (accessed on 10 February 2022).
- Adler, K.; Soo Cheng, P.L. South Korea Proposes World’s Largest Offshore Wind Farm. Available online: https://cleanenergynews.ihsmarkit.com/research-analysis/south-korea-proposes-worlds-largest-offshore-wind-farm.html (accessed on 10 February 2022).
- Wind Europe. Wind Energy in Europe—2020 Statistics and the Outlook for 2021–2025; Wind Europe: Brussels, Belgium, 2020. [Google Scholar]
- Italy—National Reports. 2021. Available online: thewindpower.net (accessed on 10 February 2022).
- Ministero dello Sviluppo Economico. Piano Nazionale Integrato per l’Energia e il Clima; Ministero dello Sviluppo Economico: Rome, Italy, 2019.
- Ueckerdt, F.; Hirth, L.; Luderer, G.; Edenhofer, O. System LCOE: What are the costs of variable renewables? Energy 2013, 63, 61–75. [Google Scholar] [CrossRef]
- Myhr, A.; Bjerkseter, C.; Ågotnes, A.; Nygaard, T.A. Levelised cost of energy for offshore floating wind turbines in a life cycle perspective. Renew. Energy 2014, 66, 714–728. [Google Scholar] [CrossRef] [Green Version]
- Costa, Á.; Orosa, J.; Vergara, D.; Fernández-Arias, P. New tendencies in wind energy operation and maintenance. Appl. Sci. 2021, 11, 1386. [Google Scholar] [CrossRef]
- Ukonsaari, J.; Bennstedt, N. Wind Turbine Gearboxes Maintenance Effect on Present and Future Gearboxes for Wind Turbines; Energiforsk: Stockholm, Sweden, 2016. [Google Scholar]
- Faulstich, S.; Hahn, B.; Tavner, P.J. Wind turbine downtime and its importance for offshore deployment. Wind Energy 2011, 14, 327–337. [Google Scholar] [CrossRef]
- McMillan, D.; Ault, G.W. Quantification of condition monitoring benefit for offshore wind turbines. Wind Eng. 2007, 31, 267–285. [Google Scholar] [CrossRef]
- Zonta, D.; Glisic, B.; Adriaenssens, S. Value of information: Impact of monitoring on decision-making. Struct. Control Health Monit. 2014, 21, 1043–1056. [Google Scholar] [CrossRef]
- Sønderkaer, J.; Dalgaard, M.; Nielsen, J.S.; Tcherniak, D.; Ulriksen, M.D. Quantifying the value of SHM for wind turbine blades. In Proceedings of the 9th European Workshop on Structural Health Monitoring (EWSHM 2018), Manchester, UK, 10–13 July 2018. [Google Scholar]
- Van Horenbeek, A.; van Ostaeyen, J.; Duflou, J.R.; Pintelon, L. Quantifying the added value of an imperfectly performing condition monitoring system—Application to a wind turbine gearbox. Reliab. Eng. Syst. Saf. 2013, 111, 45–57. [Google Scholar] [CrossRef]
- Mcmillan, D.; Ault, G. Towards quantification of condition monitoring benefit for wind turbine generators. In Proceedings of the European Wind Energy Conference & Exhibition, Milan, Italy, 7–10 May 2007. [Google Scholar]
- Gestore Servizi Energetici (GSE). Il Punto Sull’eolico; Gestore Servizi Energetici (GSE): Roma, Italy, 2017. [Google Scholar]
- Hau, E.; von Renouard, H. Wind Turbines; Springer Science & Business Media: Berlin/Heidelberg, Germany, 2006. [Google Scholar]
- Guo, L.; Uang, C.-M.; Elgamal, A.; Prowell, I.; Zhang, S. Pushover analysis of a 53 m high wind turbine tower. Adv. Sci. Lett. 2011, 4, 656–662. [Google Scholar] [CrossRef]
- ABB SACE. Quaderni di Applicazione Tecnica N.13 Impianti Eolici; ABB SACE: Zurich, Switzerland, 2011. [Google Scholar]
- Esteban, M.D.; López-Gutiérrez, J.-S.; Negro, V. Gravity-based foundations in the offshore wind sector. J. Mar. Sci. Eng. 2019, 7, 64. [Google Scholar] [CrossRef] [Green Version]
- Sun, X.; Huang, D.; Wu, G. The current state of offshore wind energy technology development. Energy 2012, 41, 298–312. [Google Scholar] [CrossRef]
- European Wind Energy Association. Deep Water: The Next Step for Offshore Wind Energy; European Wind Energy Association: Brussels, Belgium, 2013. [Google Scholar]
- Fingersh, L.; Hand, M.; Laxson, A. Wind Turbine Design Cost and Scaling Model; National Renewable Energy Laboratory: Golden, CO, USA, 2006.
- Barlas, T.; van Kuik, G. Review of state of the art in smart rotor control research for wind turbines. Prog. Aerosp. Sci. 2010, 46, 1–27. [Google Scholar] [CrossRef]
- NENUPHAR. NENUPHAR Report 2010. In Wind Farms Designed for the Offshore Environment; NENUPHAR SARL: Lille, France, 2010. [Google Scholar]
- Tchakoua, P.; Wamkeue, R.; Ouhrouche, M.; Slaoui-Hasnaoui, F.; Tameghe, T.A.; Ekemb, G. Wind turbine condition monitoring: State-of-the-art review, new trends, and future challenges. Energies 2014, 7, 2595–2630. [Google Scholar] [CrossRef] [Green Version]
- Cao, W.; Xie, Y.; Tan, Z. Wind turbine generator technologies. Adv. Wind Power 2012, 1, 177–204. [Google Scholar] [CrossRef] [Green Version]
- U.S. Department of Energy. Advanced Wind Turbines Drivetrain Concepts; U.S. Department of Energy: Washington, DC, USA, 2010.
- Nguyen, T.-C.; Huynh, T.-C.; Yi, J.-H.; Kim, J.-T. Hybrid bolt-loosening detection in wind turbine tower structures by vibration and impedance responses. Wind Struct. Int. J. 2017, 24, 385–403. [Google Scholar] [CrossRef]
- Ashley, F.; Cipriano, R.J.; Breckenridge, S.; Briggs, G.A.; Gross, L.E.; Hinkson, J.; Lewis, P. Report from the Bethany Wind Turbine Study Committee. 2007. Available online: https://docs.wind-watch.org/bethany-windturbinestudycommittteereport.pdf (accessed on 10 February 2022).
- Bethold, H.; Durstewitz, M.; Rohrig, K. Reliability of Wind Turbines: Experiences of 15 Years with 1500 WTs; Springer: Berlin/Heidelberg, Germany, 2007. [Google Scholar]
- Ribrant, J.; Bertling, L.M. Survey of failures in wind power systems with focus on swedish wind power plants during 1997–2005. IEEE Trans. Energy Convers. 2007, 22, 167–173. [Google Scholar] [CrossRef]
- Shokrieh, M.M.; Rafiee, R. Simulation of fatigue failure in a full composite wind turbine blade. Compos. Struct. 2006, 74, 332–342. [Google Scholar] [CrossRef]
- Marín, J.; Barroso, A.; París, F.; Cañas, J. Study of fatigue damage in wind turbine blades. Eng. Fail. Anal. 2009, 16, 656–668. [Google Scholar] [CrossRef]
- Caithness Windfarm Information Forum. Wind Turbine Accident Data to December 31st 2005; 2005. Available online: http://www.caithnesswindfarms.co.uk/accidents.pdf (accessed on 10 February 2022).
- Yang, J.; Peng, C.; Xiao, J.; Zeng, J.; Xing, S.; Jin, J.; Deng, H. Structural investigation of composite wind turbine blade considering structural collapse in full-scale static tests. Compos. Struct. 2013, 97, 15–29. [Google Scholar] [CrossRef]
- Sorensen, B.F.; Lading, L.; Sendrup, P.; Mcgugan, M.; Debel, C.P.; Kristensen, O.J.D.; Larsen, G.; Hansen, A.M.; Rheinlander, J.; Rusborg, J.; et al. Fundamentals for Remote Structural Health Monitoring of Wind Turbine Blades—A Preproject; Risø National Laboratory: Roskilde, Denmark, 2002.
- Sørensen, B.F.; Jørgensen, E.; Debel, C.P.; Jensen, F.M.; Jensen, H.M.; Jacobsen, T.K.; Halling, K.M.; Jensen, H.M. Improved Design of Large Wind Turbine Blade of Fibre Composites Based on Studies of Scale Effects (Phase 1)—Summary Report; Risø National Laboratory: Roskilde, Denmark, 2004.
- Ciang, C.C.; Lee, J.-R.; Bang, H.-J. Structural health monitoring for a wind turbine system: A review of damage detection methods. Meas. Sci. Technol. 2008, 19, 122001. [Google Scholar] [CrossRef] [Green Version]
- Tavner, P. How are we going to make offshore wind farms more reliable? In Proceedings of the SUPERGEN Wind 2011 General Assembly, Durham, UK, 20 March 2011.
- Sheng, S. Report on Wind Turbine Subsystem Reliability—A Survey of Various Databases (Presentation); National Renewable Energy Laboratory (NREL): Golden, CO, USA, 2013.
- Martin-Del-Campo, S.; Sandin, F.; Strömbergsson, D. Dictionary learning approach to monitoring of wind turbine drivetrain bearings. Int. J. Comput. Intell. Syst. 2020, 14, 106. [Google Scholar] [CrossRef]
- Musial, W.; Butterfield, S.; McNiff, B. Improving wind turbine gearbox reliability. In Proceedings of the 2007 European Wind Energy Conference & Exhibition, Milan, Italy, 7–10 May 2007. [Google Scholar]
- NSK Company. New Bearing Doctor: Maintenance of Bearings. 2009. Available online: https://www.nsk-literature.com/en/new-bearing-doctor-maintenance/ (accessed on 10 February 2022).
- Liang, Y.; An, Z.; Liu, B. Fatigue life prediction for wind turbine main shaft bearings. In Proceedings of the 2013 International Conference on Quality, Reliability, Risk, Maintenance, and Safety Engineering (QR2MSE), Chengdu, China, 15–18 July 2013; pp. 888–893. [Google Scholar]
- Yang, W.; Tavner, P.; Wilkinson, M. Condition monitoring and fault diagnosis of a wind turbine with a synchronous generator using wavelet transforms. In Proceedings of the 4th IET International Conference on Power Electronics, Machines and Drives (PEMD 2008), York, UK, 2–4 April 2008. [Google Scholar]
- Yang, W.; Tavner, P.; Wilkinson, M. Condition monitoring and fault diagnosis of a wind turbine synchronous generator drive train. IET Renew. Power Gener. 2009, 3, 1–11. [Google Scholar] [CrossRef]
- Guo, P.; Infield, D.; Yang, X. Wind turbine generator condition-monitoring using temperature trend analysis. IEEE Trans. Sustain. Energy 2011, 3, 124–133. [Google Scholar] [CrossRef] [Green Version]
- Alewine, K.; Chen, W. A review of electrical winding failures in wind turbine generators. IEEE Electr. Insul. Mag. 2012, 28, 8–13. [Google Scholar] [CrossRef]
- Gowda, M.M.; Mallikarjun, N.; Gowda, P.; Chandrashekhar, R. Improvement of the performance of wind turbine generator using condition monitoring techniques. In Proceedings of the 2013 7th International Conference on Intelligent Systems and Control (ISCO), Coimbatore, India, 4–5 January 2013; pp. 495–501. [Google Scholar]
- Henderson, A.R.; Morgan, C.; Smith, B.; Sørensen, H.C.; Barthelmie, R.J.; Boesmans, B. Offshore wind energy in Europe—A review of the state-of-the-art. Wind Energy 2003, 6, 35–52. [Google Scholar] [CrossRef]
- Nielsen, J.J.; Sørensen, J.D. On risk-based operation and maintenance of offshore wind turbine components. Reliab. Eng. Syst. Saf. 2011, 96, 218–229. [Google Scholar] [CrossRef]
- Dinwoodie, I.; Quail, F.; McMillan, D. Analysis of offshore wind turbine operation & maintenance using a novel time domain meteo-ocean modeling approach. In Proceedings of the ASME Turbo Expo 2012, Copenhagen, Denmark, 11–15 June 2012. [Google Scholar]
- Scheu, M.; Matha, D.; Hofmann, M.; Muskulus, M. Maintenance strategies for large offshore wind farms. Energy Procedia 2012, 24, 281–288. [Google Scholar] [CrossRef] [Green Version]
- Besnard, F.; Fischer, K.; Tjernberg, L.B. A model for the optimization of the maintenance support organization for offshore wind farms. IEEE Trans. Sustain. Energy 2013, 4, 443–450. [Google Scholar] [CrossRef]
- Halvorsen-Weare, E.E.; Gundegjerde, C.; Halvorsen, I.B.; Hvattum, L.M.; Nonås, L.M. Vessel fleet analysis for maintenance operations at offshore wind farms. Energy Procedia 2013, 35, 167–176. [Google Scholar] [CrossRef] [Green Version]
- Hofmann, M.; Sperstad, I.B. NOWIcob—A tool for reducing the maintenance costs of offshore wind farms. Energy Procedia 2013, 35, 177–186. [Google Scholar] [CrossRef] [Green Version]
- Perveen, R.; Kishor, N.; Mohanty, S.R. Off-shore wind farm development: Present status and challenges. Renew. Sustain. Energy Rev. 2014, 29, 780–792. [Google Scholar] [CrossRef]
- Endrerud, O.-E.V.; Liyanage, J.P.; Keseric, N. Marine logistics decision support for operation and maintenance of offshore wind parks with a multi method simulation model. In Proceedings of the 2014 Winter Simulation Conference, Savannah, GA, USA, 7–10 December 2014. [Google Scholar]
- Nguyen, T.A.T.; Chou, S.-Y. Maintenance strategy selection for improving cost-effectiveness of offshore wind systems. Energy Convers. Manag. 2018, 157, 86–95. [Google Scholar] [CrossRef]
- Fischer, K.; Coronado, D.A. Condition Monitoring of Wind Turbines: State of the Art, User Experience and Recommendations; Fraunhofer-IWES Bremerhaven; VGB PowerTech Service GmbH: Essen, Germany, 2015; pp. 1–89. [Google Scholar]
- Farinholt, K.M.; Taylor, S.G.; Park, G.; Ammerman, C.M. Full-scale fatigue tests of CX-100 wind turbine blades. Part I: Testing. In Industrial and Commercial Applications of Smart Structures Technologies; SPIE: Bellingham, WA, USA, 2012; Volume 8343, pp. 213–220. [Google Scholar] [CrossRef]
- Taylor, S.G.; Jeong, H.; Jang, J.K.; Park, G.; Farinholt, K.M.; Todd, M.D.; Ammerman, C.M. Full-scale fatigue tests of CX-100 wind turbine blades. Part II: Analysis. In Industrial and Commercial Applications of Smart Structures Technologies; SPIE: Bellingham, WA, USA, 2012; Volume 8343, pp. 221–230. [Google Scholar]
- Bundesamt für Seeschifffahrt und Hydrographie. Konstruktive Ausführung von Offshore-Windenergieanlagen/Design of Offshore Wind Turbines; Bundesamt für Seeschifffahrt und Hydrographie: Hamburg, Germany, 2007. [Google Scholar]
- Perry, M.; McAlorum, J.; Fusiek, G.; Niewczas, P.; McKeeman, I.J.; Rubert, T. Crack monitoring of operational wind turbine foundations. Sensors 2017, 17, 1925. [Google Scholar] [CrossRef] [PubMed] [Green Version]
- Weijtjens, W.; Verbelen, T.; de Sitter, G.; Devriendt, C. Foundation structural health monitoring of an offshore wind turbine—A full-scale case study. Struct. Health Monit. 2016, 15, 389–402. [Google Scholar] [CrossRef]
- Devriendt, C.; El-Kafafy, M.; de Sitter, G.; Jordaens, P.J.; Guillaume, P. Continuous dynamic monitoring of an offshore wind turbine on a monopile foundation. In Proceedings of the ISMA Conference, Leuven, Belgium, 17–19 September 2012. [Google Scholar]
- Zheng, X.Y.; Li, H.; Rong, W.; Li, W. Joint earthquake and wave action on the monopile wind turbine foundation: An experimental study. Mar. Struct. 2015, 44, 125–141. [Google Scholar] [CrossRef] [Green Version]
- Rubert, T.; Perry, M.; Fusiek, G.; McAlorum, J.; Niewczas, P.; Brotherston, A.; McCallum, D. Field demonstration of real-time wind turbine foundation strain monitoring. Sensors 2017, 18, 97. [Google Scholar] [CrossRef] [Green Version]
- Resnik, B. Monitoring of concrete bases of wind turbines with modern inclinometers: Approaches and experience. In Proceedings of the FIG Working Week 2017, Helsinki, Finland, 29 May–2 June 2017. [Google Scholar]
- Currie, M.; Saafi, M.; Tachtatzis, C.; Quail, F. Structural health monitoring for wind turbine foundations. Proc. Inst. Civ. Eng.-Energy 2013, 166, 162–169. [Google Scholar] [CrossRef] [Green Version]
- He, Y.; Chen, S.; Zhou, D.; Huang, S.; Wang, P. Shared excitation based nonlinear ultrasound and vibrothermography testing for CFRP barely visible impact damage inspection. IEEE Trans. Ind. Inform. 2018, 14, 5575–5584. [Google Scholar] [CrossRef]
- Franko, J.; Du, S.; Kallweit, S.; Duelberg, E.; Engemann, H. Design of a multi-robot system for wind turbine maintenance. Energies 2020, 13, 2552. [Google Scholar] [CrossRef]
- Kim, D.Y.; Kim, H.-B.; Jung, W.S.; Lim, S.; Hwang, J.-H.; Park, C.-W. Visual testing system for the damaged area detection of wind power plant blade. In Proceedings of the IEEE ISR 2013, Seoul, Korea, 24–26 October 2013; pp. 1–5. [Google Scholar]
- Zhang, H.; Jackman, J. A feasibility study of wind turbine blade surface crack detection using an optical inspection method. In Proceedings of the 2013 International Conference on Renewable Energy Research and Applications (ICRERA), Madrid, Spain, 20–23 October 2013; pp. 847–852. [Google Scholar]
- Zhang, H.; Jackman, J. Feasibility of automatic detection of surface cracks in wind turbine blades. Wind Eng. 2014, 38, 575–586. [Google Scholar] [CrossRef] [Green Version]
- Civera, M.; Zanotti Fragonara, L.; Surace, C. An experimental study of the feasibility of phase-based video magnification for damage detection and localisation in operational deflection shapes. Strain 2020, 56, e12336. [Google Scholar] [CrossRef]
- Civera, M.; Fragonara, L.Z.; Antonaci, P.; Anglani, G.; Surace, C. An experimental validation of phase-based motion magnification for structures with developing cracks and time-varying configurations. Shock Vib. 2021, 2021, 5518163. [Google Scholar] [CrossRef]
- Nagarajan, V.; Rajadurai, J.S.; Kumar, T.A. A digital image analysis to evaluate delamination factor for wind turbine composite laminate blade. Compos. Part B Eng. 2012, 43, 3153–3159. [Google Scholar] [CrossRef]
- Stokkeland, M.; Klausen, K.; Johansen, T.A. Autonomous visual navigation of unmanned aerial vehicle for wind turbine inspection. In Proceedings of the 2015 International Conference on Unmanned Aircraft Systems (ICUAS), Denver, CO, USA, 9–12 June 2015; pp. 998–1007. [Google Scholar]
- Park, J.-H.; Huynh, T.-C.; Choi, S.-H.; Kim, J.-T. Vision-based technique for bolt-loosening detection in wind turbine tower. Wind Struct. Int. J. 2015, 21, 709–726. [Google Scholar] [CrossRef]
- Wang, L.; Zhang, Z. Automatic detection of wind turbine blade surface cracks based on UAV-taken images. IEEE Trans. Ind. Electron. 2017, 64, 7293–7303. [Google Scholar] [CrossRef]
- Reddy, A.; Indragandhi, V.; Ravi, L.; Subramaniyaswamy, V. Detection of cracks and damage in wind turbine blades using artificial intelligence-based image analytics. Measurement 2019, 147, 106823. [Google Scholar] [CrossRef]
- Shihavuddin, A.; Chen, X.; Fedorov, V.; Christensen, A.N.; Riis, N.A.B.; Branner, K.; Dahl, A.B.; Paulsen, R.R. Wind turbine surface damage detection by deep learning aided drone inspection analysis. Energies 2019, 12, 676. [Google Scholar] [CrossRef] [Green Version]
- Ren, S.; He, K.; Girshick, R.; Sun, J. Faster R-CNN: Towards real-time object detection with region proposal networks. IEEE Trans. Pattern Anal. Mach. Intell. 2017, 39, 1137–1149. [Google Scholar] [CrossRef] [Green Version]
- Yang, X.; Zhang, Y.; Lv, W.; Wang, D. Image recognition of wind turbine blade damage based on a deep learning model with transfer learning and an ensemble learning classifier. Renew. Energy 2021, 163, 386–397. [Google Scholar] [CrossRef]
- Krizhevsky, A.; Sutskever, I.; Hinton, G.E. Image, net classification with deep convolutional neural networks. In Advances in Neural Information Processing Systems; Curran Associates, Inc.: Red Hook, NY, USA, 2012. [Google Scholar]
- Shihavuddin, A.S.M.; Chen, X. DTU—Drone Inspection Images of Wind Turbine. 2018. Available online: https://data.mendeley.com/datasets/hd96prn3nc/2 (accessed on 10 February 2022).
- Lim, S.; Park, C.-W.; Hwang, J.-H.; Kim, D.-Y.; Kim, T.-K. The inchworm type blade inspection robot system. In Proceedings of the 2012 9th International Conference on Ubiquitous Robots and Ambient Intelligence (URAI), Daejeon, Korea, 26–28 November 2012; pp. 604–607. [Google Scholar]
- Girshick, R. Fast R-CNN. In Proceedings of the 2015 IEEE International Conference on Computer Vision (ICCV), Santiago, Chile, 7–13 December 2015; pp. 1440–1448. [Google Scholar] [CrossRef]
- Mao, Y.; Wang, S.; Yu, D.; Zhao, J. Automatic image detection of multi-type surface defects on wind turbine blades based on cascade deep learning network. Intell. Data Anal. 2021, 25, 463–482. [Google Scholar] [CrossRef]
- Simonyan, K.; Zisserman, A. Very deep convolutional networks for large-scale image recognition. arXiv 2014, arXiv:1409.1556. [Google Scholar]
- He, K.; Zhang, X.; Ren, S.; Sun, J. Identity mappings in deep residual networks. In European Conference on Computer Vision; Springer: Cham, Switzerland, 2016; pp. 630–645. [Google Scholar]
- Szegedy, C.; Ioffe, S.; Vanhoucke, V.; Alemi, A.A. Inception-v4, inception-res, net and the impact of residual connections on learning. In Proceedings of the Thirty-First AAAI Conference on Artificial Intelligence (AAAI-17), San Francisco, CA, USA, 4–9 February 2017. [Google Scholar]
- Jocher, G.; Stoken, A.; Chaurasia, A.; Borovec, J.; Xie, T.; Kwon, Y.; Michael, K.; Changyu, L.; Fang, J.; Abrahim, V.; et al. Ultralytics/yolov5: v6.0—YOLOv5n “Nano” Models, Roboflow Integration, Tensor, Flow Export, Open, CV DNN Support. Available online: https://doi.org/10.5281/ZENODO.5563715 (accessed on 10 February 2022).
- Tan, M.; Le, Q.V. Efficient, net: Rethinking model scaling for convolutional neural networks. In Proceedings of the International Conference on Machine Learning, Long Beach, CA, USA, 9–15 June 2019; pp. 6105–6114. [Google Scholar]
- Qiu, Z.; Wang, S.; Zeng, Z.; Yu, D. Automatic visual defects inspection of wind turbine blades via YOLO-based small object detection approach. J. Electron. Imaging 2019, 28, 043023. [Google Scholar] [CrossRef]
- Chu, T.C.; Ranson, W.F.; Sutton, M.A. Applications of digital-image-correlation techniques to experimental mechanics. Exp. Mech. 1985, 25, 232–244. [Google Scholar] [CrossRef]
- Leblanc, B.; Niezrecki, C.; Avitabile, P.; Chen, J.; Sherwood, J.A.; Hughes, S.A. Full-field inspection of a wind turbine blade using three-dimensional digital image correlation. In Industrial and Commercial Applications of Smart Structures Technologies; SPIE: Bellingham, WA, USA, 2011; Volume 7979. [Google Scholar]
- Wu, R.; Zhang, D.; Yu, Q.; Jiang, Y.; Arola, D. Health monitoring of wind turbine blades in operation using three-dimensional digital image correlation. Mech. Syst. Signal Process. 2019, 130, 470–483. [Google Scholar] [CrossRef]
- Baqersad, J.; Niezrecki, C.; Avitabile, P. Full-field dynamic strain prediction on a wind turbine using displacements of optical targets measured by stereophotogrammetry. Mech. Syst. Signal Process. 2015, 62–63, 284–295. [Google Scholar] [CrossRef]
- Khadka, A.; Dong, Y.; Baqersad, J. Structural health monitoring of wind turbines using a digital image correlation system on a UAV. In Dynamic Behavior of Materials; Springer Science and Business Media LLC: Berlin/Heidelberg, Germany, 2019; Volume 6, pp. 85–91. [Google Scholar]
- Curt, J.; Capaldo, M.; Hild, F.; Roux, S. Modal analysis of a wind turbine tower by digital image correlation. J. Phys. Conf. Ser. 2020, 1618, 022002. [Google Scholar] [CrossRef]
- Wadhwa, N.; Rubinstein, M.; Durand, F.; Freeman, W.T. Phase-based video motion processing. ACM Trans. Graph. 2013, 32, 1–10. [Google Scholar] [CrossRef] [Green Version]
- Chen, J.G.; Wadhwa, N.; Cha, Y.-J.; Durand, F.; Freeman, W.T.; Buyukozturk, O. Modal identification of simple structures with high-speed video using motion magnification. J. Sound Vib. 2015, 345, 58–71. [Google Scholar] [CrossRef]
- Yang, Y.; Dorn, C.; Mancini, T.; Talken, Z.; Kenyon, G.; Farrar, C.; Mascareñas, D. Blind identification of full-field vibration modes from video measurements with phase-based video motion magnification. Mech. Syst. Signal Process. 2017, 85, 567–590. [Google Scholar] [CrossRef]
- Poozesh, P.; Sarrafi, A.; Mao, Z.; Avitabile, P.; Niezrecki, C. Feasibility of extracting operating shapes using phase-based motion magnification technique and stereo-photogrammetry. J. Sound Vib. 2017, 407, 350–366. [Google Scholar] [CrossRef]
- Baqersad, J.; Carr, J.; Lundstrom, T.; Niezrecki, C.; Avitabile, P.; Slattery, M. Dynamic characteristics of a wind turbine blade using 3D digital image correlation. In Health Monitoring of Structural and Biological Systems 2012; SPIE: Bellingham, WA, USA, 2012; Volume 8348, pp. 711–719. [Google Scholar]
- Le Blanc, B.; Niezrecki, C.; Avitabile, P.; Chen, J.; Sherwood, J. Damage detection and full surface characterization of a wind turbine blade using three-dimensional digital image correlation. Struct. Health Monit. 2013, 12, 430–439. [Google Scholar] [CrossRef]
- Winstroth, J.; Schoen, L.; Ernst, B.; Seume, J.R. Wind turbine rotor blade monitoring using digital image correlation: A comparison to aeroelastic simulations of a multi-megawatt wind turbine. J. Phys. Conf. Ser. 2014, 524, 012064. [Google Scholar] [CrossRef] [Green Version]
- Carr, J.; Baqersad, J.; Niezrecki, C.; Avitabile, P. Full-field dynamic strain on wind turbine blade using digital image correlation techniques and limited sets of measured data from photogrammetric targets. Exp. Tech. 2016, 40, 819–831. [Google Scholar] [CrossRef]
- Huang, D.; Swanson, E.A.; Lin, C.P.; Schuman, J.S.; Stinson, W.G.; Chang, W.; Hee, M.R.; Flotte, T.; Gregory, K.; Puliafito, C.A.; et al. Optical coherence tomography. Science 1991, 254, 1178–1181. [Google Scholar] [CrossRef] [PubMed] [Green Version]
- Drexler, W.; Morgner, U.; Kärtner, F.X.; Pitris, C.; Boppart, S.; Li, X.D.; Ippen, E.P.; Fujimoto, J.G. In vivo ultrahigh-resolution optical coherence tomography. Opt. Lett. 1999, 24, 1221–1223. [Google Scholar] [CrossRef] [PubMed] [Green Version]
- Stifter, D.; Wiesauer, K.; Wurm, M.; Schlotthauer, E.; Kastner, J.; Pircher, M.; Götzinger, E.; Hitzenberger, C. Investigation of polymer and polymer/fibre composite materials with optical coherence tomography. Meas. Sci. Technol. 2008, 19, 074011. [Google Scholar] [CrossRef]
- Kastner, J.; Schlotthaue, E.; Burgholzer, P.; Stifter, D. Comparison of X-ray computed tomography and optical coherence tomography for characterisation of glass-fibre polymer matrix composites. In Proceedings of the World Conference on Non Destructive Testing, Montreal, QC, Canada, 30 August–3 September 2004; pp. 71–79. [Google Scholar]
- Petersen, C.; Rajagopalan, N.; Markos, C.; Israelsen, N.; Rodrigo, P.; Woyessa, G.; Tidemand-Lichtenberg, P.; Pedersen, C.; Weinell, C.; Kiil, S.; et al. Non-destructive subsurface inspection of marine and protective coatings using near- and mid-infrared optical coherence tomography. Coatings 2021, 11, 877. [Google Scholar] [CrossRef]
- Liu, P.; Groves, R.M.; Benedictus, R. 3D monitoring of delamination growth in a wind turbine blade composite using optical coherence tomography. NDT E Int. 2014, 64, 52–58. [Google Scholar] [CrossRef]
- Marks, R.; Gillam, C.; Clarke, A.; Pullin, R. Barely visible impact damage detection in a composite turbine blade using 3D scanning laser vibrometery. In Proceedings of the British Society for Strain Measurement Conference 2015, Edinburgh, UK, 1–3 September 2015. [Google Scholar]
- Schafer, B.E.; Picchi, D.; Engelhardt, T.; Abel, D. Multicopter unmanned aerial vehicle for automated inspection of wind turbines. In Proceedings of the 2016 24th Mediterranean Conference on Control and Automation (MED), Athens, Greece, 21–24 June 2016; pp. 244–249. [Google Scholar]
- Hung, Y. Applications of digital shearography for testing of composite structures. Compos. Part B Eng. 1999, 30, 765–773. [Google Scholar] [CrossRef]
- Sutherland, H.; Beattie, A.; Hansche, B.; Musial, W.; Allread, J.; Johnson, J.; Summers, M. The Application of Non-Destructive Techniques to the Testing of a Wind Turbine Blade; Sandla National Laboratories: Albuquerque, NM, USA, 1994.
- Amenabar, I.; Mendikute, A.; Lopez-Arraiza, A.; Lizaranzu, M.; Aurrekoetxea, J. Comparison and analysis of non-destructive testing techniques suitable for delamination inspection in wind turbine blades. Compos. Part B Eng. 2011, 42, 1298–1305. [Google Scholar] [CrossRef]
- Hung, Y.; Luo, W.; Lin, L.; Shang, H. Evaluating the soundness of bonding using shearography. Compos. Struct. 2000, 50, 353–362. [Google Scholar] [CrossRef]
- Gryzagoridis, J.; Findeis, D. Impact damage detection on composites using optical NDT techniques. Insight-Non-Destr. Test. Cond. Monit. 2010, 52, 248–251. [Google Scholar] [CrossRef] [Green Version]
- Hung, M.Y.Y.; Chen, Y.S.; Ng, S.P.; Shepard, S.M.; Hou, Y.; Lhota, J.R. Review and comparison of shearography and pulsed thermography for adhesive bond evaluation. Opt. Eng. 2007, 46, 051007. [Google Scholar] [CrossRef]
- Hung, Y.; Chen, Y.; Ng, S.P.; Liu, L.; Huang, Y.; Luk, B.L.; Ip, R.; Wu, L.; Chung, P. Review and comparison of shearography and active thermography for nondestructive evaluation. Mater. Sci. Eng. R Rep. 2009, 64, 73–112. [Google Scholar] [CrossRef] [Green Version]
- Niezrecki, C.; Avitabile, P.; Chen, J.; Sherwood, J.A.; Lundstrom, T.; Leblanc, B.; Hughes, S.A.; Desmond, M.; Beattie, A.; Rumsey, M.; et al. Inspection and monitoring of wind turbine blade-embedded wave defects during fatigue testing. Struct. Health Monit. 2014, 13, 629–643. [Google Scholar] [CrossRef]
- Márquez, F.P.G.; Chacón, A.M.P. A review of non-destructive testing on wind turbines blades. Renew. Energy 2020, 161, 998–1010. [Google Scholar] [CrossRef]
- Li, Z.; Tokhi, M.O.; Marks, R.; Zheng, H.; Zhao, Z. Dynamic wind turbine blade inspection using micro-polarisation spatial phase shift digital shearography. Appl. Sci. 2021, 11, 10700. [Google Scholar] [CrossRef]
- Li, Z.; Tokhi, M.O.; Zhao, Z.; Gao, J.; Zheng, H. A compact laser shearography system integrated with robotic climber for on-site inspection of wind turbine blades. In Proceedings of the CLAWAR 2020—23rd International Conference on Climbing and Walking Robots and the Support Technologies for Mobile Machines, Moscow, Russia, 24–26 August 2020. [Google Scholar]
- Gili, P.; Civera, M.; Roy, R.; Surace, C. An unmanned lighter-than-air platform for large scale land monitoring. Remote Sens. 2021, 13, 2523. [Google Scholar] [CrossRef]
- AISA DUAL Hyperspectral Sensor Technical Data Sheet. Available online: http://www.adept.net.au/cameras/specim/systems/pdf/Aisa_Dual.pdf (accessed on 8 March 2021).
- Rizk, P.; Al Saleh, N.; Younes, R.; Ilinca, A.; Khoder, J. Hyperspectral imaging applied for the detection of wind turbine blade damage and icing. Remote Sens. Appl. Soc. Environ. 2020, 18, 100291. [Google Scholar] [CrossRef]
- Rizk, P.; Younes, R.; Ilinca, A.; Khoder, J. Defect detection using hyperspectral imaging technology on wind turbine blade. Remote Sens. Appl. Soc. Environ. 2021, 22, 100522. [Google Scholar] [CrossRef]
- Hellstein, P.; Szwedo, M. 3D thermography in non-destructive testing of composite structures. Meas. Sci. Technol. 2016, 27, 124006. [Google Scholar] [CrossRef]
- Holst, G.C. Common Sense Approach to Thermal Imaging; SPIE Optical Engineering Press: Bellingham, WA, USA, 2000. [Google Scholar]
- Glowacz, A. Thermographic fault diagnosis of ventilation in BLDC motors. Sensors 2021, 21, 7245. [Google Scholar] [CrossRef] [PubMed]
- Anjar, B.; Dalberg, M.; Uppsäll, M. Feasibility Study of Thermal Condition Monitoring and Condition Based Maintenance in Wind Turbines; Elforsk Rapport; Elforsk AB: Stockholm, Sweden, 2011; p. 11. [Google Scholar]
- Carlsson, F.; Eriksson, E.; Dahlberg, M. Damage Preventing Measures for Wind Turbines. Phase 1—Reliability Data; Elforsk: Stockholm, Sweden, 2010. [Google Scholar]
- Muñoz, C.Q.G.; Márquez, F.P.G.; Tomás, J.M.S. Ice detection using thermal infrared radiometry on wind turbine blades. Measurement 2016, 93, 157–163. [Google Scholar] [CrossRef]
- Peeters, B.; de Roeck, G. One-year monitoring of the Z24-Bridge: Environmental effects versus damage events. Earthq. Eng. Struct. Dyn. 2001, 30, 149–171. [Google Scholar] [CrossRef]
- Hwang, S.; An, Y.-K.; Sohn, H. Continuous-wave line laser thermography for monitoring of rotating wind turbine blades. Struct. Health Monit. 2018, 18, 1010–1021. [Google Scholar] [CrossRef]
- Zeng, Z.; Tao, N.; Feng, L.; Li, Y.; Ma, Y.; Zhang, C. Breakpoint detection of heating wire in wind blade moulds using infrared thermography. Infrared Phys. Technol. 2014, 64, 73–78. [Google Scholar] [CrossRef]
- Sanati, H.; Wood, D.; Sun, Q. Condition monitoring of wind turbine blades using active and passive thermography. Appl. Sci. 2018, 8, 2004. [Google Scholar] [CrossRef] [Green Version]
- Shepard, S.M. Flash thermography of aerospace composites. In Proceedings of the IV Conferencia Panamericana de END, Buenos Aires, Argentina, 22–26 October 2007. [Google Scholar]
- Li, T.; Almond, D.P.; Rees, D.A.S. Crack imaging by scanning laser-line thermography and laser-spot thermography. Meas. Sci. Technol. 2011, 22, 035701. [Google Scholar] [CrossRef] [Green Version]
- Sun, J.G. Analysis of pulsed thermography methods for defect depth prediction. J. Heat Transf. 2005, 128, 329–338. [Google Scholar] [CrossRef]
- Yang, R.; He, Y.; Zhang, H. Progress and trends in nondestructive testing and evaluation for wind turbine composite blade. Renew. Sustain. Energy Rev. 2016, 60, 1225–1250. [Google Scholar] [CrossRef]
- Yang, R.; He, Y. Optically and non-optically excited thermography for composites: A review. Infrared Phys. Technol. 2016, 75, 26–50. [Google Scholar] [CrossRef]
- Netzelmann, U.; Walle, G.; Lugin, S.; Ehlen, A.; Bessert, S.; Valeske, B. Induction thermography: Principle, applications and first steps towards standardization. Quant. InfraRed Thermogr. J. 2015, 13, 170–181. [Google Scholar] [CrossRef]
- He, Y.; Tian, G.; Pan, M.; Chen, D. Eddy current pulsed phase thermography and feature extraction. Appl. Phys. Lett. 2013, 103, 084104. [Google Scholar] [CrossRef]
- Gao, B.; Bai, L.; Woo, W.L.; Tian, G.Y.; Cheng, Y. Automatic defect identification of eddy current pulsed thermography using single channel blind source separation. IEEE Trans. Instrum. Meas. 2013, 63, 913–922. [Google Scholar] [CrossRef]
- Yang, R.; He, Y.; Gao, B.; Tian, G.Y. Inductive pulsed phase thermography for reducing or enlarging the effect of surface emissivity variation. Appl. Phys. Lett. 2014, 105, 184103. [Google Scholar] [CrossRef]
- He, Y.; Pan, M.; Chen, D.; Tian, G.; Zhang, H. Eddy current step heating thermography for quantitatively evaluation. Appl. Phys. Lett. 2013, 103, 194101. [Google Scholar] [CrossRef]
- Riegert, G.; Zweschper, T.; Busse, G. Lockin thermography with eddy current excitation. Quant. Infrared Thermogr. J. 2004, 1, 31–32. [Google Scholar] [CrossRef]
- Zhang, H.; Yang, R.; He, Y.; Foudazi, A.; Cheng, L.; Tian, G. A review of microwave thermography nondestructive testing and evaluation. Sensors 2017, 17, 1123. [Google Scholar] [CrossRef]
- Gleiter, A.; Riegert, G.; Zweschper, T.; Busse, G. Ultrasound lock-in thermography for advanced depth resolved defect selective imaging. Insight-Non-Destr. Test. Cond. Monit. 2007, 49, 272–274. [Google Scholar] [CrossRef] [Green Version]
- Maldague, X.; Marinetti, S. Pulse phase infrared thermography. J. Appl. Phys. 1996, 79, 2694–2698. [Google Scholar] [CrossRef]
- Zeng, Z.; Tao, N.; Feng, L.C.; Li, Y.S.; Zhang, C.L. Relative thermal contrast analysis in the inspection of wind turbine blades using pulsed thermography. Adv. Mater. Res. 2011, 301, 591–596. [Google Scholar] [CrossRef]
- Bin Zhao, S.; Zhang, C.-L.; Wu, N.-M.; Duan, Y.-X.; Li, H. Infrared thermal wave nondestructive testing for rotor blades in wind turbine generators non-destructive evaluation and damage monitoring. In International Symposium on Photoelectronic Detection and Imaging 2009; SPIE: Bellingham, WA, USA, 2009; Volume 7383. [Google Scholar]
- Tao, N.; Zeng, Z.; Feng, L.; Li, X.; Li, Y.; Zhang, C. The application of pulsed thermography in the inspection of wind turbine blades. In International Symposium on Photoelectronic Detection and Imaging 2011; SPIE: Bellingham, WA, USA, 2011; Volume 8193. [Google Scholar]
- Avdelidis, N.P.; Ibarra-Castanedo, C.; Maldague, X.P.V. Infrared thermography inspection of glass reinforced plastic (GRP) wind turbine blades and the concept of an automated scanning device. In Proceedings of the SPIE Defense, Security, and Sensing, Baltimore, MA, USA, 29 April–3 May 2013. [Google Scholar]
- Yi, Q.; Tian, G.; Malekmohammadi, H.; Zhu, J.; Laureti, S.; Ricci, M. New features for delamination depth evaluation in carbon fiber reinforced plastic materials using eddy current pulse-compression thermography. NDT E Int. 2019, 102, 264–273. [Google Scholar] [CrossRef]
- Ren, W.; Liu, J.; Tian, G.Y.; Gao, B.; Cheng, L.; Yang, H. Quantitative non-destructive evaluation method for impact damage using eddy current pulsed thermography. Compos. Part B Eng. 2013, 54, 169–179. [Google Scholar] [CrossRef]
- He, Y.; Tian, G.; Pan, M.; Chen, D. Impact evaluation in carbon fiber reinforced plastic (CFRP) laminates using eddy current pulsed thermography. Compos. Struct. 2014, 109, 1–7. [Google Scholar] [CrossRef] [Green Version]
- Cheng, L.; Gao, B.; Tian, G.Y.; Woo, W.L.; Berthiau, G. Impact damage detection and identification using eddy current pulsed thermography through integration of PCA and ICA. IEEE Sens. J. 2014, 14, 1655–1663. [Google Scholar] [CrossRef]
- Tian, G.Y.; Sophian, A. Reduction of lift-off effects for pulsed eddy current NDT. NDT E Int. 2005, 38, 319–324. [Google Scholar] [CrossRef]
- Pan, M.; He, Y.; Tian, G.; Chen, D.; Luo, F. PEC frequency band selection for locating defects in two-layer aircraft structures with air gap variations. IEEE Trans. Instrum. Meas. 2013, 62, 2849–2856. [Google Scholar] [CrossRef]
- Ishikawa, M.; Shiiya, Y.; Kogo, Y.; Hatta, H.; Habuka, Y.; Fukui, R.; Utsunomiya, S. Non-destructive inspection of CFRP laminates using phase-transformed induction heating thermography. Trans. JSME Jpn. 2015, 81, 15–170. [Google Scholar] [CrossRef] [Green Version]
- Yang, R.; He, Y. Eddy current pulsed phase thermography considering volumetric induction heating for delamination evaluation in carbon fiber reinforced polymers. Appl. Phys. Lett. 2015, 106, 234103. [Google Scholar] [CrossRef]
- Palumbo, D.; Ancona, F.; Galietti, U. Quantitative damage evaluation of composite materials with microwave thermographic technique: Feasibility and new data analysis. Meccanica 2014, 50, 443–459. [Google Scholar] [CrossRef]
- Foudazi, A.; Donnell, K.M.; Ghasr, M.T. Application of active microwave thermography to delamination detection. In Proceedings of the 2014 IEEE International Instrumentation and Measurement Technology Conference (I2MTC), Montevideo, Uruguay, 12–15 May 2014; pp. 1567–1571. [Google Scholar]
- Keo, S.-A.; Defer, D.; Breaban, F.; Brachelet, F. Comparison between microwave infrared thermography and CO2 laser infrared thermography in defect detection in applications with CFRP. Mater. Sci. Appl. 2013, 4, 600–605. [Google Scholar] [CrossRef] [Green Version]
- Cheng, L.; Tian, G.Y.; Szymanik, B. Feasibility studies on microwave heating for nondestructive evaluation of glass fibre reinforced plastic composites. In Proceedings of the 2011 IEEE International Instrumentation and Measurement Technology Conference, Hangzhou, China, 10–12 May 2011; pp. 1–6. [Google Scholar]
- Manohar, A.; di Scalea, F.L. Detection of defects in wind turbine composite blades using statistically enhanced lock-in thermography. Struct. Health Monit. 2013, 12, 566–574. [Google Scholar] [CrossRef]
- Galietti, U.; di Bari, P.; Palumbo, D.; Galietti, U.; Palumbo, D.; Calia, G.; Pellegrini, M. Non destructive evaluation of composite materials with new thermal methods damage assessment of metallic material. In Proceedings of the ECCM15—15th European Conference on Composite Materials, Venice, Italy, 24–28 June 2012. [Google Scholar]
- Salazar, A.; Mendioroz, A.; Apiñaniz, E.; Oleaga, A.; Venegas, P.; Sáez-Ocáriz, I. Characterization of delaminations by lock-in vibrothermography. J. Phys. Conf. Ser. 2010, 214, 012079. [Google Scholar] [CrossRef] [Green Version]
- Shepard, S.M.; Ahmed, T.; Lhota, J.R. Experimental considerations in vibrothermography. Def. Secur. 2004, 5405, 332–335. [Google Scholar]
- Ley, O.; Butera, M.; Godinez, V.; Chung, S. Assessing impact damage on composites using line scanning thermography. Adv. Mater. Process. 2012, 170, 20–26. [Google Scholar]
- Ley, O.; Butera, M.; Godínez, V. Inspection of composite structures using line scanning thermography. SPIE Def. Secur. Sens. 2012, 8354, 835406. [Google Scholar]
- Gao, B.; Yin, A.; Tian, G.; Woo, W. Thermography spatial-transient-stage mathematical tensor construction and material property variation track. Int. J. Therm. Sci. 2014, 85, 112–122. [Google Scholar] [CrossRef]
- Rumsey, M.A.; Musial, W. Application of infrared thermography nondestructive testing during wind turbine blade tests. J. Sol. Energy Eng. 2001, 123, 271. [Google Scholar] [CrossRef]
- Dattoma, V.; Marcuccio, R.; Pappalettere, C.; Smith, G. Thermographic investigation of sandwich structure made of composite material. NDT E Int. 2001, 34, 515–520. [Google Scholar] [CrossRef]
- Hahn, F.; Kensche, C.W.; Paynter, R.; Dutton, A.G.; Kildegaard, C.; Kosgaard, J. Design, fatigue test and NDE of a sectional wind turbine rotor blade. J. Thermoplast. Compos. Mater. 2002, 15, 267–277. [Google Scholar] [CrossRef]
- Cheng, L.; Tian, G.Y. Surface crack detection for carbon fiber reinforced plastic (CFRP) materials using pulsed eddy current thermography. IEEE Sens. J. 2011, 11, 3261–3268. [Google Scholar] [CrossRef]
- Pan, M.; He, Y.; Tian, G.; Chen, D.; Luo, F. Defect characterisation using pulsed eddy current thermography under transmission mode and NDT applications. NDT E Int. 2012, 52, 28–36. [Google Scholar] [CrossRef]
- Cheng, L.; Tian, G.Y. Transient thermal behavior of eddy-current pulsed thermography for nondestructive evaluation of composites. IEEE Trans. Instrum. Meas. 2013, 62, 1215–1222. [Google Scholar] [CrossRef]
- Dattoma, V.; Giancane, S. Evaluation of energy of fatigue damage into GFRC through digital image correlation and thermography. Compos. Part B Eng. 2013, 47, 283–289. [Google Scholar] [CrossRef]
- Galleguillos, C.; Zorrilla, A.; Jiménez, A.; Diaz, L.; Montiano, Á.L.; Barroso, M.; Viguria, A.; Lasagni, F. Thermographic non-destructive inspection of wind turbine blades using unmanned aerial systems. Plast. Rubber Compos. 2015, 44, 98–103. [Google Scholar] [CrossRef]
- Gao, B.; He, Y.; Woo, W.L.; Tian, G.Y.; Liu, J.; Hu, Y. Multidimensional tensor-based inductive thermography with multiple physical fields for offshore wind turbine gear inspection. IEEE Trans. Ind. Electron. 2016, 63, 6305–6315. [Google Scholar] [CrossRef] [Green Version]
- Palumbo, D.; Tamborrino, R.; Galietti, U.; Aversa, P.; Tatì, A.; Luprano, V.A.M. Ultrasonic analysis and lock-in thermography for debonding evaluation of composite adhesive joints. NDT E Int. 2016, 78, 1–9. [Google Scholar] [CrossRef]
- Yang, R.; He, Y.; Mandelis, A.; Wang, N.; Wu, X.; Huang, S. Induction infrared thermography and thermal-wave-radar analysis for imaging inspection and diagnosis of blade composites. IEEE Trans. Ind. Inform. 2018, 14, 5637–5647. [Google Scholar] [CrossRef]
- Palumbo, D.; de Finis, R.; Demelio, G.P.; Galietti, U. Study of damage evolution in composite materials based on the thermoelastic phase analysis (TPA) method. Compos. Part B Eng. 2017, 117, 49–60. [Google Scholar] [CrossRef]
- Zhao, H.-S.; Zhang, X.-T. Early fault prediction of wind turbine gearbox based on temperature measurement. In Proceedings of the 2012 IEEE International Conference on Power System Technology (POWERCON), Auckland, New Zealand, 30 October–2 November 2012; pp. 1–5. [Google Scholar]
- Nie, M.; Wang, L. Review of condition monitoring and fault diagnosis technologies for wind turbine gearbox. Procedia CIRP 2013, 11, 287–290. [Google Scholar] [CrossRef] [Green Version]
- Guo, P.; Bai, N. Wind turbine gearbox condition monitoring with AAKR and moving window statistic methods. Energies 2011, 4, 2077–2093. [Google Scholar] [CrossRef] [Green Version]
- Cambron, P.; Tahan, A.; Masson, C.; Pelletier, F. Bearing temperature monitoring of a wind turbine using physics-based model. J. Qual. Maint. Eng. 2017, 23, 479–488. [Google Scholar] [CrossRef]
- Astolfi, D.; Scappaticci, L.; Terzi, L. Fault diagnosis of wind turbine gearboxes through temperature and vibration data. Int. J. Renew. Energy Res. 2017, 7, 965–976. [Google Scholar]
- Touret, T.; Changenet, C.; Ville, F.; Lalmi, M.; Becquerelle, S. On the use of temperature for online condition monitoring of geared systems—A review. Mech. Syst. Signal Process. 2018, 101, 197–210. [Google Scholar] [CrossRef]
- Fantidis, J.G.; Potolias, C.; Bandekas, D.V. Wind turbine blade nondestructive testing with a transportable radiography system. Sci. Technol. Nucl. Install. 2011, 2011, 347320. [Google Scholar] [CrossRef]
- Garcea, S.; Wang, Y.; Withers, P. X-ray computed tomography of polymer composites. Compos. Sci. Technol. 2018, 156, 305–319. [Google Scholar] [CrossRef]
- Sattar, T.P.; Marques, V.; Anvo, R.N.; Garrido, G.G.; Kaur, A.P.; Routledge, P.; Markham, K. Climbing robot to perform radiography of wind blades. In Climbing Robot to Perform Radiography of Wind Blades; Springer: Cham, Switzerland, 2021; pp. 165–176. [Google Scholar] [CrossRef]
- Holub, W.; Haßler, U. XXL X-ray computed tomography for wind turbines in the lab and on site. In Proceedings of the International Workshop on Smart Material and Structures, Calgary, AB, Canada, 7–10 October 2013. [Google Scholar]
- Mishnaevsky, L.; Fæster, S.; Mikkelsen, L.P.; Kusano, Y.; Bech, J.I. Micromechanisms of leading edge erosion of wind turbine blades: X-ray tomography analysis and computational studies. Wind Energy 2019, 23, 547–562. [Google Scholar] [CrossRef]
- Jespersen, K.M.; Mikkelsen, L.P. Three dimensional fatigue damage evolution in non-crimp glass fibre fabric based composites used for wind turbine blades. Compos. Sci. Technol. 2017, 153, 261–272. [Google Scholar] [CrossRef]
- Baran, I.; Straumit, I.; Shishkina, O.; Lomov, S.V. X-ray computed tomography characterization of manufacturing induced defects in a glass/polyester pultruded profile. Compos. Struct. 2018, 195, 74–82. [Google Scholar] [CrossRef]
- Gould, B.; Greco, A.; Stadler, K.; Xiao, X. An analysis of premature cracking associated with microstructural alterations in an AISI 52100 failed wind turbine bearing using X-ray tomography. Mater. Des. 2017, 117, 417–429. [Google Scholar] [CrossRef] [Green Version]
- Gegner, J.; Nierlich, W. Service loading analysis of wind turbine gearbox rolling bearings based on X-ray diffraction residual stress measurements. Mater. Sci. Forum 2013, 768, 723–732. [Google Scholar] [CrossRef]
- Hsu, D.K.; Im, K.-H.; Chiou, C.-P.; Barnard, D.J.; Thompson, D.O.; Chimenti, D.E. An exploration of the utilities of terahertz waves for the NDE of composites. In AIP Conference Proceedings; American Institute of Physics: College Park, MA, USA, 2011; Volume 1335, pp. 533–540. [Google Scholar]
- Hsu, D.K.; Lee, K.-S.; Park, J.-W.; Woo, Y.-D.; Im, K.-H. NDE inspection of terahertz waves in wind turbine composites. Int. J. Precis. Eng. Manuf. 2012, 13, 1183–1189. [Google Scholar] [CrossRef]
- Martin, R.W.; Sabato, A.; Schoenberg, A.; Giles, R.H.; Niezrecki, C. Comparison of nondestructive testing techniques for the inspection of wind turbine blades’ spar caps. Wind Energy 2018, 21, 980–996. [Google Scholar] [CrossRef]
- Li, Z.; Soutis, C.; Haigh, A.; Sloan, R.; Gibson, A.; Karimian, N. Microwave imaging for delamination detection in T-joints of wind turbine composite blades. In Proceedings of the 2016 46th European Microwave Conference (EuMC), London, UK, 4–6 October 2016; pp. 1235–1238. [Google Scholar] [CrossRef]
- Li, Z.; Haigh, A.; Soutis, C.; Gibson, A.; Sloan, R. Microwaves sensor for wind turbine blade inspection. Appl. Compos. Mater. 2016, 24, 495–512. [Google Scholar] [CrossRef]
- Im, K.-H.; Lee, K.-S.; Yang, I.-Y.; Yang, Y.-J.; Seo, Y.-H.; Hsu, D.K. Advanced T-ray nondestructive evaluation of defects in FRP solid composites. Int. J. Precis. Eng. Manuf. 2013, 14, 1093–1098. [Google Scholar] [CrossRef]
- Park, J.-W.; Im, K.-H.; Yang, I.-Y.; Kim, S.-K.; Kang, S.-J.; Cho, Y.-T.; Jung, J.-A.; Hsu, D.K. Terahertz radiation NDE of composite materials for wind turbine applications. Int. J. Precis. Eng. Manuf. 2014, 15, 1247–1254. [Google Scholar] [CrossRef]
- Im, K.-H.; Kim, S.-K.; Jung, J.-A.; Cho, Y.-T.; Wood, Y.-D.; Chiou, C.-P. NDE characterization and inspection techniques of trailing edges in wind turbine blades using terahertz waves. J. Mech. Sci. Technol. 2019, 33, 4745–4753. [Google Scholar] [CrossRef]
- Zhang, H.; Gao, B.; Tian, G.Y.; Woo, W.L.; Bai, L. Metal defects sizing and detection under thick coating using microwave NDT. NDT E Int. 2013, 60, 52–61. [Google Scholar] [CrossRef]
- White, J.; Zimdars, D. Time domain terahertz non destructive evaluation of water intrusion in composites and corrosion under insulation. In Proceedings of the 2007 Quantum Electronics and Laser Science Conference, Baltimore, MD, USA, 6–11 May 2007; pp. 1–2. [Google Scholar]
- Zhong, S. Progress in terahertz nondestructive testing: A review. Front. Mech. Eng. 2019, 14, 273–281. [Google Scholar] [CrossRef]
- Pieraccini, M.; Parrini, F.; Fratini, M.; Atzeni, C.; Spinelli, P. In-service testing of wind turbine towers using a microwave sensor. Renew. Energy 2008, 33, 13–21. [Google Scholar] [CrossRef]
- García-Martín, J.; Gómez-Gil, J.; Vázquez-Sánchez, E. Non-destructive techniques based on eddy current testing. Sensors 2011, 11, 2525–2565. [Google Scholar] [CrossRef] [PubMed] [Green Version]
- Gao, P.; Wang, C.; Li, Y.; Cong, Z. Electromagnetic and eddy current NDT in weld inspection: A review. Insight-Non-Destr. Test. Cond. Monit. 2015, 57, 337–345. [Google Scholar] [CrossRef]
- Mook, G.; Lange, R.; Koeser, O. Non-destructive characterisation of carbon-fibre-reinforced plastics by means of eddy-currents. Compos. Sci. Technol. 2001, 61, 865–873. [Google Scholar] [CrossRef]
- He, Y.; Pan, M.; Luo, F.; Tian, G. Pulsed eddy current imaging and frequency spectrum analysis for hidden defect nondestructive testing and evaluation. NDT E Int. 2011, 44, 344–352. [Google Scholar] [CrossRef]
- He, Y.; Tian, G.; Zhang, H.; Alamin, M.; Simm, A.; Jackson, P. Steel corrosion characterization using pulsed eddy current systems. IEEE Sens. J. 2012, 12, 2113–2120. [Google Scholar] [CrossRef]
- He, Y.; Tian, G.; Pan, M.; Chen, D. Non-destructive testing of low-energy impact in CFRP laminates and interior defects in honeycomb sandwich using scanning pulsed eddy current. Compos. Part B Eng. 2014, 59, 196–203. [Google Scholar] [CrossRef] [Green Version]
- Li, Z.; Meng, Z. A review of the radio frequency non-destructive testing for carbon-fibre composites. Meas. Sci. Rev. 2016, 16, 68–76. [Google Scholar] [CrossRef] [Green Version]
- Heuer, H.; Schulze, M.; Pooch, M.; Gäbler, S.; Nocke, A.; Bardl, G.; Cherif, C.; Klein, M.; Kupke, R.; Vetter, R.; et al. Review on quality assurance along the CFRP value chain—Non-destructive testing of fabrics, preforms and CFRP by HF radio wave techniques. Compos. Part B Eng. 2015, 77, 494–501. [Google Scholar] [CrossRef]
- Liu, R.; Zuo, H.; Sun, J.; Wang, L. Electrostatic monitoring of wind turbine gearbox on oil-lubricated system. Proc. Inst. Mech. Eng. Part C J. Mech. Eng. Sci. 2016, 231, 3649–3664. [Google Scholar] [CrossRef]
- Mao, H.; Zuo, H.; Wang, H. Electrostatic sensor application for on-line monitoring of wind turbine gearboxes. Sensors 2018, 18, 3574. [Google Scholar] [CrossRef] [Green Version]
- Liu, R.; Zhou, J.; Wang, W.; Yao, X. Electrostatic monitoring of wind turbine gearbox under variable operating conditions. In Proceedings of the 2018 Prognostics and System Health Management Conference (PHM), Chongqing, China, 26–28 October 2018; pp. 134–137. [Google Scholar]
- Esmaeili, K.; Zuercher, M.; Wang, L.; Harvey, T.; Holweger, W.; White, N.; Schlücker, E. A study of white etching crack bearing failure detection using electrostatic sensing in wind turbine gearboxes. Int. J. Cond. Monit. 2018, 8, 82–88. [Google Scholar] [CrossRef]
- Kijanka, P.; Manohar, A.; di Scalea, F.L.; Staszewski, W.J. Damage location by ultrasonic lamb waves and piezoelectric rosettes. J. Intell. Mater. Syst. Struct. 2015, 26, 1477–1490. [Google Scholar] [CrossRef]
- Joosse, P.A.; Blanch, M.J.; Dutton, A.G.; Kouroussis, D.A.; Philippidis, T.P.; Vionis, P.S. Acoustic emission monitoring of small wind turbine blades. J. Sol. Energy Eng. 2002, 124, 446–454. [Google Scholar] [CrossRef]
- Wei, J.; McCarty, J. Acoustic emission evaluation of composite wind turbine blades during fatigue testing. Wind Eng. 1993, 17, 266–274. [Google Scholar]
- Beattie, A. Acoustic emission monitoring of a wind turbine blade during a fatigue test. In Proceedings of the 35th Aerospace Sciences Meeting and Exhibit, Reno, NV, USA, 6–9 January 1997. [Google Scholar]
- Tsopelas, N.; Kourousis, D.; Ladis, I.; Anastasopulos, A.; Lekou, D.; Mouzakis, F. Health monitoring of operating windt urbine blades with acoustic emission. In Emerging Technologies in Non-Destructive Testing V; Taylor & Francis Group: London, UK, 2012; pp. 347–352. [Google Scholar]
- Papasalouros, D.; Tsopelas, N.; Anastasopoulos, A.; Kourousis, D.; Lekou, D.J.; Mouzakis, F. Acoustic emission monitoring of composite blade of NM48/750 NEG-MICON wind turbine. J. Acoust. Emiss. 2013, 31, 36–49. [Google Scholar]
- Yoshioka, T.; Fujiwara, T. A new acoustic emission source locating system for the study of rolling contact fatigue. Wear 1982, 81, 183–186. [Google Scholar] [CrossRef]
- Nienhaus, K.; Boos, F.D.; Garate, K.; Baltes, R. Development of acoustic emission (AE) based defect parameters for slow rotating roller bearings. J. Phys. Conf. Ser. 2012, 364, 012034. [Google Scholar] [CrossRef] [Green Version]
- Usgame Sandoval, H.M.; Pedraza Ramirez, C.A.; Quiroga Mendez, J.E. Acoustic emission-based early fault detection in tapered roller bearings. Ing. Investig. 2013, 33, 5–10. [Google Scholar]
- Soua, S.; van Lieshout, P.; Perera, A.; Gan, T.-H.; Bridge, B. Determination of the combined vibrational and acoustic emission signature of a wind turbine gearbox and generator shaft in service as a pre-requisite for effective condition monitoring. Renew. Energy 2013, 51, 175–181. [Google Scholar] [CrossRef] [Green Version]
- Purarjomandlangrudi, A.; Nourbakhsh, G. Acoustic emission condition monitoring: An application for wind turbine fault detection. Int. J. Res. Eng. Technol. 2013, 2, 907–918. [Google Scholar]
- Mba, D.; Rao, R.B.K.N. Development of acoustic emission technology for condition monitoring and diagnosis of rotating machines; bearings, pumps, gearboxes, engines and rotating structures. Shock Vib. Dig. 2006, 38, 3–16. [Google Scholar] [CrossRef] [Green Version]
- Eftekharnejad, B.; Mba, D. Seeded fault detection on helical gears with acoustic emission. Appl. Acoust. 2009, 70, 547–555. [Google Scholar] [CrossRef] [Green Version]
- Elforjani, M.; Mba, D. Condition monitoring of slow-speed shafts and bearings with acoustic emission. Strain 2011, 47, 350–363. [Google Scholar] [CrossRef]
- Eftekharnejad, B.; Carrasco, M.; Charnley, B.; Mba, D. The application of spectral kurtosis on acoustic emission and vibrations from a defective bearing. Mech. Syst. Signal Process. 2011, 25, 266–284. [Google Scholar] [CrossRef] [Green Version]
- Qu, Y.; Bechhoefer, E.; He, D.; Zhu, J. A new acoustic emission sensor based gear fault detection approach. Int. J. Progn. Health Manag. 2013, 4, 32–45. [Google Scholar] [CrossRef]
- Niknam, S.A.; Thomas, T.; Hines, J.W.; Sawhney, R. Analysis of acoustic emission data for bearings subject to unbalance. Int. J. Progn. Health Manag. 2013, 4, 80–89. [Google Scholar] [CrossRef]
- Ferrando Chacon, J.L.; Andicoberry, E.A.; Kappatos, V.; Papaelias, M.; Selcuk, C.; Gan, T.-H. An experimental study on the applicability of acoustic emission for wind turbine gearbox health diagnosis. J. Low Freq. Noise Vib. Act. Control 2016, 35, 64–76. [Google Scholar] [CrossRef]
- Zhang, Y.; Lu, W.; Chu, F. Planet gear fault localization for wind turbine gearbox using acoustic emission signals. Renew. Energy 2017, 109, 449–460. [Google Scholar] [CrossRef]
- Anastassopoulos, A.; Kouroussis, D.A.; Nikolaidis, V.N.; Proust, A.; Dutton, A.G.; Blanch, M.J.; Jones, L.E.; Vionis, P.; Lekou, D.J.; van Delft, D.R.V.; et al. Structural integrity evaluation of wind turbine blades using pattern recognition analysis on acoustic emission data. In Proceedings of the 25th European Conference on Acoustic Emission Testing—EWGAE, Prague, Czech Republic, 11–13 September 2002; pp. 11–13. [Google Scholar]
- Blanch, M.; Dutton, A. Acoustic emission monitoring of field tests of an operating wind turbine. Key Eng. Mater. 2003, 245, 475–482. [Google Scholar] [CrossRef]
- Paquette, J.; van Dam, J.; Hughes, S. Structural testing of 9 m carbon fiber wind turbine research blades. In Proceedings of the 45th AIAA Aerospace Sciences Meeting and Exhibit, Reno, NV, USA, 8–11 January 2007; Volume 14, pp. 9922–9932. [Google Scholar]
- Zarouchas, D.; van Hemelrijck, D. Mechanical characterization and damage assessment of thick adhesives for wind turbine blades using acoustic emission and digital image correlation techniques. J. Adhes. Sci. Technol. 2014, 28, 1500–1516. [Google Scholar] [CrossRef]
- Han, B.-H.; Yoon, D.-J.; Huh, Y.-H.; Lee, Y.-S. Damage assessment of wind turbine blade under static loading test using acoustic emission. J. Intell. Mater. Syst. Struct. 2013, 25, 621–630. [Google Scholar] [CrossRef]
- Bouzid, O.M.; Tian, G.Y.; Cumanan, K.; Moore, D. Structural health monitoring of wind turbine blades: Acoustic source localization using wireless sensor networks. J. Sens. 2015, 2015, 139695. [Google Scholar] [CrossRef]
- Tang, J.; Soua, S.; Mares, C.; Gan, T.-H. An experimental study of acoustic emission methodology for in service condition monitoring of wind turbine blades. Renew. Energy 2016, 99, 170–179. [Google Scholar] [CrossRef]
- Gomez Munoz, C.Q.; Garcia Marquez, F.P. A new fault location approach for acoustic emission techniques in wind turbines. Energies 2016, 9, 40. [Google Scholar] [CrossRef] [Green Version]
- Tang, J.; Soua, S.; Mares, C.; Gan, T.-H. A pattern recognition approach to acoustic emission data originating from fatigue of wind turbine blades. Sensors 2017, 17, 2507. [Google Scholar] [CrossRef] [Green Version]
- Skaga, S.K. Feasibility study of Unmanned Aerial Vehicles (UAV) Application for Ultrasonic Non-Destructive Testing (NDT) of Wind Turbine Rotor Blades. Preliminary Experiments of Handheld and UAV Utrasonic Testing on Glass Fibre Laminate. Master’s Thesis, UiT The Arctic University of Norway, Tromsø, Norway, 2017. [Google Scholar]
- Makaya, K.; Burnham, K.; Tuncbilek, K. Structural assessment of turbine blades using guided waves. In Proceedings of the 10th European Conference on Non-Destructive Testing, Moscow, Russia, 7–11 June 2010. [Google Scholar]
- Gan, T.-H.; Soua, S.; Dimlaye, V.; Burnham, K. Real-time monitoring system for defects detection in wind turbine structures and rotating components. In Proceedings of the 18th World Conference on Nondestructive Testing, Durban, South Africa, 16–20 April 2012. [Google Scholar]
- Wang, P.; Zhou, W.; Bao, Y.; Li, H. Ice monitoring of a full-scale wind turbine blade using ultrasonic guided waves under varying temperature conditions. Struct. Control Health Monit. 2018, 25, e2138. [Google Scholar] [CrossRef]
- Yang, J.; He, J.; Guan, X.; Wang, D.; Chen, H.; Zhang, W.; Liu, Y. A probabilistic crack size quantification method using in-situ lamb wave test and Bayesian updating. Mech. Syst. Signal Process. 2016, 78, 118–133. [Google Scholar] [CrossRef]
- Shen, Y.; Cesnik, C.E.S. Hybrid local FEM/global LISA modeling of damped guided wave propagation in complex composite structures. Smart Mater. Struct. 2016, 25, 095021. [Google Scholar] [CrossRef]
- Eremin, A.; Glushkov, E.; Glushkova, N.; Lammering, R. Guided wave time-reversal imaging of macroscopic localized inhomogeneities in anisotropic composites. Struct. Health Monit. 2019, 18, 1803–1819. [Google Scholar] [CrossRef]
- Taheri, H.; Hassen, A.A. Nondestructive ultrasonic inspection of composite materials: A Comparative advantage of phased array ultrasonic. Appl. Sci. 2019, 9, 1628. [Google Scholar] [CrossRef] [Green Version]
- Roach, D.; Neidigk, S.; Rice, T.; Duvall, R.; Paquette, J.A. Development and assessment of advanced inspection methods for wind turbine blades using a focused WINDIE experiment. In Proceedings of the 33rd Wind Energy Symposium 2015, Kissimmee, FL, USA, 5–9 January 2015. [Google Scholar]
- Lamarre, A. Improved inspection of composite wind turbine blades with accessible advanced ultrasonic phased array technology. In Proceedings of the 15th Asia Pacific Conference for Non-Destructive Testing (APCNDT 2017), Singapore, 13–17 November 2017. [Google Scholar]
- Zhang, N.; Bian, W.; Pan, B. The application of ultrasonic phased array technology in wind turbine blade defect detection system. IOP Conf. Ser. Earth Environ. Sci. 2021, 675, 012077. [Google Scholar] [CrossRef]
- Mohammadkhani, R.; Fragonara, L.Z.; Padiyar, M.J.; Petrunin, I.; Raposo, J.; Tsourdos, A.; Gray, I. Improving depth resolution of ultrasonic phased array imaging to inspect aerospace composite structures. Sensors 2020, 20, 559. [Google Scholar] [CrossRef] [PubMed] [Green Version]
- Rus, J.; Grosse, C.U. Local ultrasonic resonance spectroscopy: A demonstration on plate inspection. J. Nondestruct. Eval. 2020, 39, 1–12. [Google Scholar] [CrossRef] [Green Version]
- Wang, J.; Shen, Y.; Rao, D.; Xu, W. An instantaneous-baseline multi-indicial nonlinear ultrasonic resonance spectral correlation technique for fatigue crack detection and quantification. Nonlinear Dyn. 2021, 103, 677–698. [Google Scholar] [CrossRef]
- Iliopoulos, A.; van Hemelrijck, D.; Vlassenbroeck, J.; Aggelis, D. Assessment of grouted samples from monopile wind turbine foundations using combined non-destructive techniques. Constr. Build. Mater. 2016, 122, 855–862. [Google Scholar] [CrossRef]
- Chakrapani, S.K.; Dayal, V.; Hsu, D.K.; Barnard, D.J.; Gross, A.; Thompson, D.O.; Chimenti, D.E. Characterization of waviness in wind turbine blades using air coupled ultrasonics. AIP Conf. Proc. 2011, 1335, 956–962. [Google Scholar] [CrossRef] [Green Version]
- Nicholas, G. Development of Novel Ultrasonic Monitoring Techniques for Improving the Reliability of Wind Turbine Gearboxes; Elsevier: Amsterdam, The Netherlands, 2021. [Google Scholar]
- Joergensen, E.R.; Borum, K.K.; McGugan, M.; Thomsen, C.L.; Jensen, F.M.; Debel, C.P.; Soerensen, B.F. Full Scale Testing of Wind Turbine Blade to Failure—Flapwise Loading; Risø National Laboratory: Roskilde, Denmark, 2004.
- Jasiūnienė, E.; Raišutis, R.; Šliteris, R.; Voleišis, A.; Jakas, M. Ultrasonic NDT of wind turbine blades using contact pulse-echo immersion testing with moving water container. Ultragarsas 2008, 63, 28–32. [Google Scholar]
- Raišutis, R.; Jasiūnienė, E.; Žukauskas, E. Ultrasonic NDT of wind turbine blades using guided waves. Ultragarsas/Ultrasound 2008, 63, 7–11. [Google Scholar]
- Jüngert, A.; Damage Detection in Wind Turbine Blades Using Two Different Acoustic Techniques. NDT Database J. NDT 2008. Available online: https://www.researchgate.net/profile/Anne-Juengert/publication/228576960_Damage_Detection_in_wind_turbine_blades_using_two_different_acoustic_techniques/links/02e7e538da98b7fae9000000/Damage-Detection-in-wind-turbine-blades-using-two-different-acoustic-techniques.pdf (accessed on 10 February 2022).
- Jüngert, A.; Grosse, C.U. Inspection techniques for wind turbine blades using ultrasound and sound waves. In Proceedings of the Non-Destructive Testing in Civil Engineering, Nantes, France, 30 June–3 July 2009. [Google Scholar]
- Jasinien, E.; Raiutis, R.; Literis, R.; Voleiis, A.; Vladiauskas, A.; Mitchard, D.; Amos, M. NDT of wind turbine blades using adapted ultrasonic and radiographic techniques. Insight-Non-Destr. Test. Cond. Monit. 2009, 51, 477–483. [Google Scholar] [CrossRef] [Green Version]
- Lee, J.-R.; Shin, H.-J.; Chia, C.C.; Dhital, D.; Yoon, D.-J.; Huh, Y.-H. Long distance laser ultrasonic propagation imaging system for damage visualization. Opt. Lasers Eng. 2011, 49, 1361–1371. [Google Scholar] [CrossRef]
- Park, B.; Sohn, H.; Yeum, C.-M.; Truong, T.C. Laser ultrasonic imaging and damage detection for a rotating structure. Struct. Health Monit. 2013, 12, 494–506. [Google Scholar] [CrossRef]
- Ye, G.; Neal, B.; Boot, A.; Kappatos, V.; Selcuk, C.; Gan, T.-H. Development of an ultrasonic NDT system for automated in-situ inspection of wind turbine blades. In Proceeding of the EWSHM—7th European Workshop on Structural Health Monitoring, Nantes, France, 8–11 July 2014. [Google Scholar]
- Park, B.; An, Y.-K.; Sohn, H. Visualization of hidden delamination and debonding in composites through noncontact laser ultrasonic scanning. Compos. Sci. Technol. 2014, 100, 10–18. [Google Scholar] [CrossRef]
- Park, B.; Sohn, H.; Malinowski, P.; Ostachowicz, W. Delamination localization in wind turbine blades based on adaptive time-of-flight analysis of noncontact laser ultrasonic signals. Nondestruct. Test. Eval. 2017, 32, 1–20. [Google Scholar] [CrossRef]
- Marquez, F.P.G.; Muñoz, C.Q.G. A new approach for fault detection, location and diagnosis by ultrasonic testing. Energies 2020, 13, 1192. [Google Scholar] [CrossRef] [Green Version]
- Zhu, J.; Yoon, J.M.; He, D.; Qu, Y.; Bechhoefer, E. Lubrication oil condition monitoring and remaining useful life prediction with particle filtering. Int. J. Progn. Health Manag. 2013, 4, 124–138. [Google Scholar] [CrossRef]
- Myshkin, N.; Markova, L.; Semenyuk, M.; Kong, H.; Han, H.-G.; Yoon, E.-S. Wear monitoring based on the analysis of lubricant contamination by optical ferroanalyzer. Wear 2003, 255, 1270–1275. [Google Scholar] [CrossRef]
- Dupuis, R. Application of oil debris monitoring for wind turbine gearbox prognostics and health management. In Proceedings of the Annual Conference of the PHM Society, Portland, OR, USA, 10–16 October 2010. [Google Scholar] [CrossRef]
- Hamilton, A.; Quail, F.J. Detailed state of the art review for the different online/inline oil analysis techniques in context of wind turbine gearboxes. J. Tribol. 2011, 133, 044001. [Google Scholar] [CrossRef] [Green Version]
- Agoston, A.; Ötsch, C.; Jakoby, B. Viscosity sensors for engine oil condition monitoring—Application and interpretation of results. Sens. Actuators A Phys. 2005, 121, 327–332. [Google Scholar] [CrossRef]
- Mignani, A.G.; Ciaccheri, L.; Díaz-Herrera, N.; Mencaglia, A.A.; Ottevaere, H.; Thienpont, H.; Francalanci, S.; Paccagnini, A.; Pavone, F.S. Optical fiber spectroscopy for measuring quality indicators of lubricant oils. Meas. Sci. Technol. 2009, 20, 034011. [Google Scholar] [CrossRef]
- Coronado, D.; Kupferschmidt, C. Assessment and validation of oil sensor systems for on-line oil condition monitoring of wind turbine gearboxes. Procedia Technol. 2014, 15, 747–754. [Google Scholar] [CrossRef]
- Zhu, J.; Yoon, J.M.; He, D.; Bechhoefer, E. Online particle-contaminated lubrication oil condition monitoring and remaining useful life prediction for wind turbines. Wind Energy 2015, 18, 1131–1149. [Google Scholar] [CrossRef]
- Sheng, S. Monitoring of wind turbine gearbox condition through oil and wear debris analysis: A full-scale testing perspective. Tribol. Trans. 2016, 59, 149–162. [Google Scholar] [CrossRef]
- Musial, W.; McNiff, B. Wind turbine testing in the NREL dynamometer test bed. In Proceedings of the AWEA’s Wind, Power 2000 Conference, Palm Springs, CA, USA, 2 May 2000. [Google Scholar]
- Lading, L.; Mcgugan, M.; Sendrup, P.; Rheinlander, J.; Rusborg, J. Fundamentals for Remote Structural Health Monitoring of Wind Turbine Blades-a Pre-Project. Annex B-Sensors and Non-Destructive Testing Methods for Damage Detection in Wind Turbine Blades; Risø National Laboratory: Roskilde, Denmark, 2002.
- Kolle, J.J.; Kolle, J.J. Transverse optical fuse for composite damage detection. SAMPE Q. 1993, 24, 35–40. [Google Scholar]
- Verijenko, B.; Verijenko, V. A new structural health monitoring system for composite laminates. Compos. Struct. 2005, 71, 315–319. [Google Scholar] [CrossRef]
- Lara-Quintanilla, A.; Hulskamp, A.W.; Bersee, H.E. A high-rate shape memory alloy actuator for aerodynamic load control on wind turbines. J. Intell. Mater. Syst. Struct. 2013, 24, 1834–1845. [Google Scholar] [CrossRef] [Green Version]
- Papadopoulos, K.; Morfiadakis, E.; Philippidis, T.P.; Lekou, D.J. Assessment of the Strain Gauge Technique for Measurement of Wind Turbine Blade Loads. Wind Energy Int. J. Prog. Appl. Wind Power Convers. Technol. 2000, 3, 35–65. [Google Scholar] [CrossRef]
- Kim, S.-W.; Kim, E.-H.; Rim, M.-S.; Shrestha, P.; Lee, I.; Kwon, I.-B. Structural performance tests of down scaled composite wind turbine blade using embedded fiber bragg grating sensors. Int. J. Aeronaut. Space Sci. 2011, 12, 346–353. [Google Scholar] [CrossRef] [Green Version]
- Dimopoulos, C.; Gantes, C. Experimental investigation of buckling of wind turbine tower cylindrical shells with opening and stiffening under bending. Thin-Walled Struct. 2012, 54, 140–155. [Google Scholar] [CrossRef]
- Choi, K.-S.; Huh, Y.-H.; Kwon, I.-B.; Yoon, D.-J. A tip deflection calculation method for a wind turbine blade using temperature compensated FBG sensors. Smart Mater. Struct. 2012, 21, 25008. [Google Scholar] [CrossRef]
- Kim, S.-W.; Kang, W.-R.; Jeong, M.-S.; Lee, I.; Kwon, I.-B. Deflection estimation of a wind turbine blade using FBG sensors embedded in the blade bonding line. Smart Mater. Struct. 2013, 22, 125004. [Google Scholar] [CrossRef]
- Sierra-Pérez, J.; Torres-Arredondo, M.A.; Güemes, A. Damage and nonlinearities detection in wind turbine blades based on strain field pattern recognition. FBGs, OBR and strain gauges comparison. Compos. Struct. 2016, 135, 156–166. [Google Scholar] [CrossRef]
- Helsen, J.; Guo, Y.; Keller, J.; Guillaume, P. Experimental investigation of bearing slip in a wind turbine gearbox during a transient grid loss event. Wind Energy 2016, 19, 2255–2269. [Google Scholar] [CrossRef]
- Aizawa, K.; Poozesh, P.; Niezrecki, C.; Baqersad, J.; Inalpolat, M.; Heilmann, G. An acoustic-array based structural health monitoring technique for wind turbine blades. In Structural Health Monitoring and Inspection of Advanced Materials, Aerospace, and Civil Infrastructure 2015; SPIE: Bellingham, WA, USA, 2015; pp. 450–466. [Google Scholar]
- Poozesh, P.; Aizawa, K.; Niezrecki, C.; Baqersad, J.; Inalpolat, M.; Heilmann, G. Structural health monitoring of wind turbine blades using acoustic microphone array. Struct. Health Monit. 2017, 16, 471–485. [Google Scholar] [CrossRef]
- Zhao, H.; Chen, G.; Hong, H.; Zhu, X. Remote structural health monitoring for industrial wind turbines using short-range doppler radar. IEEE Trans. Instrum. Meas. 2021, 70, 1–9. [Google Scholar] [CrossRef]
- Hu, C.; Albertani, R.; Suryan, R.M. Wind turbine sensor array for monitoring avian and bat collisions. Wind Energy 2018, 21, 255–263. [Google Scholar] [CrossRef]
- Lu, B.; Li, Y.; Wu, X.; Yang, Z. A review of recent advances in wind turbine condition monitoring and fault diagnosis. In Proceedings of the 2009 IEEE Power Electronics and Machines in Wind Applications, Lincoln, NE, USA, 24–26 June 2009; pp. 1–7. [Google Scholar]
- Qiao, W.; Lu, D. A survey on wind turbine condition monitoring and fault diagnosis—Part II: Signals and signal processing methods. IEEE Trans. Ind. Electron. 2015, 62, 6546–6557. [Google Scholar] [CrossRef]
- Ren, Z.; Verma, A.S.; Li, Y.; Teuwen, J.J.; Jiang, Z. Offshore wind turbine operations and maintenance: A state-of-the-art review. Renew. Sustain. Energy Rev. 2021, 144, 110886. [Google Scholar] [CrossRef]
- Yang, W.; Tavner, P.J.; Crabtree, C.; Wilkinson, M. Cost-effective condition monitoring for wind turbines. IEEE Trans. Ind. Electron. 2010, 57, 263–271. [Google Scholar] [CrossRef] [Green Version]
- Yang, W.; Tavner, P.J.; Crabtree, C.; Feng, Y.; Qiu, Y. Wind turbine condition monitoring: Technical and commercial challenges. Wind Energy 2012, 17, 673–693. [Google Scholar] [CrossRef] [Green Version]
- Lian, J.; Cai, O.; Dong, X.; Jiang, Q.; Zhao, Y. Health monitoring and safety evaluation of the offshore wind turbine structure: A Review and discussion of future development. Sustainability 2019, 11, 494. [Google Scholar] [CrossRef] [Green Version]


| Damage Type | Description |
|---|---|
| #1 | Damage formation and growth in the adhesive layer joining the skin and main spar flanges (skin/adhesive debonding and/or the main spar/adhesive layer debonding). |
| #2 | Damage formation and growth in the adhesive layer joining the up- and downwind skins along leading and/or trailing edges (adhesive joint failure between skins). |
| #3 | Damage formation and growth at the interface between the face and core in the sandwich panels in skins and the main spar web (sandwich panel face/core debonding). |
| #4 | Internal damage formation and growth in laminates in the skin and/or main spar flanges, under a tensile or compression load (delamination driven by a tensional or a buckling load). |
| #5 | Splitting and fracture of separate fibres in the laminates of the skin and main spar (fibre failure in tension; laminate failure in compression). |
| #6 | Buckling of the skin due to damage formation and growth in the bond between the skin and main spar under a compressive load. * |
| #7 | Formation and growth of cracks in the gel coat; debonding of the gel-coat from the skin (gelcoat cracking and gel-coat/skin debonding). |
| Damage Type | Description | Possible causes |
|---|---|---|
| Flaking | Creation of regions with a rough and coarse texture due to the splitting off of small pieces from the raceway surface. | Rolling fatigue, caused in turn by excessive load, misalignment, poor lubrification, water or debris inclusions, unsuitable bearing clearance, unevenness in housing rigidity, rust, corrosion pits, dents. |
| Peeling | Light wear and dull spots on the surface, with micrometric cracks and minor flaking. | Poor or unsuitable lubricant, debris intrusion in the lubricant. |
| Scoring | Straight lines on the surface, circumferentially on the raceway surface. | Generated by accumulated small seizures, caused in turn by sliding under improper lubrication or excessive/improper loads and conditions (shaft bending, the inclination of inner and outer rings, etc). |
| Smearing | Surface damage, with the formation of rough and partially melted material. | Generated by accumulated small seizures between bearing components, caused in turn by oil film rupture (because of poor/improper lubrication or high speeds with very light loads). |
| Fracture | Small pieces broke off due to shock loads or stress accumulation. | Impacts during mounting/dismounting, excessive loads, progression of surface cracks. |
| Cracks | Formation of surface cracks on the raceway rings and/or rolling elements. | Excessive loads, progression of flaking damage, creep-induced heating, inappropriate shaft (e.g., poor taper angle). |
| Cage damage | Cage deformation, fracture, and/or wear (considering the cage guide surface, pocket surface, and cage pillars). | Excessive speed, sudden acceleration/deceleration, high temperature, poor lubrication, excessive vibrations, bearing misalignment. |
| Denting | Small dents on the surface of raceway rings or rolling elements. | Caused by metallic particles or other very small debris caught in the surface during rolling. |
| Pitting | Pitted surface on the raceway rings or rolling elements. | Poor lubricant, debris in the lubricant, or exposure to moisture. |
| Wear | Surface deterioration on the raceway rings, rolling elements, cage pockets, and/or roller end faces. | Sliding friction between two surfaces, caused in turn by an irregular motion of the rolling elements, poor lubrication, debris intrusions in the lubricant, or as a progression from chemical or electrical corrosion. |
| Fretting | Corrosion happening at the contact area between the raceway ring and the rolling elements. It may happen at regular roller pitch intervals. | Repeated sliding on the fitting surface. |
| False brinelling | Hollow spots that resemble Brinell dents. | Caused by wear, induced in turn by vibration and swaying at the contact points between the raceway and the rolling elements, especially with poor lubrication. |
| Creep | Shiny appearance on the fitting surface, potentially coupled with scoring and wear. | Relative slipping at the fitting surfaces, due to a loose fit or insufficient sleeve tightening. |
| Seizure | Softened, deformed, and/or melt material in the raceway rings, rolling elements, or cage. | Excessive load, speed, shaft bending, poor housing or lubrication, small internal clearance. |
| Electrical corrosion | Corrugations resulting from locally melted material. | Melting by arcing, induced by the passage of electric currents. In turn, these are induced by the electrical potential between the inner and the outer rings. |
| Pit corrosion | Pits on the surface of raceway rings or rolling elements due to chemical corrosion. | Entry of corrosive gas or liquid, improper lubricant, moisture, high humidity, improper handling and storage conditions. |
| Mounting flaws | Scratches on the surface of raceway rings or rolling elements caused by mounting/dismounting. | Incorrect mounting/dismounting (impulse loads, the inclination of inner or outer rings, etc). |
| Discolouration | Discolouration of the cage, rolling elements, or raceway rings. | Poor lubrication and/or high temperature. |
| Mechanical Component | Common Failure Modes |
|---|---|
| Gearbox and drive train | Gear tooth damages, high- or low-speed shafts faults, gearbox bearing failures. |
| Generator | Generator stator failure, generator rotor failure, generator bearing failure. |
| Main bearing | Bearing failure, bearing rubs, bearing looseness |
| Pitch gears | Pitch Gear tooth damages. |
| Yaw gears | Yaw Gear tooth damages. |
| Study | Year | Mentioned Factors |
|---|---|---|
| Henderson et al. [62] | 2003 | Accessibility of the offshore platform and reliability of the monitoring strategy. |
| Nielsen et al. [63] | 2011 | Weather conditions, total power generation, repair strategies, transportation strategies. |
| Dinwoodie et al. [64] | 2012 | Repair time, wave height, wind speed, number of wind turbines in the wind farm, ship availability, availability of spare parts stocks. |
| Scheu et al. [65] | 2012 | Expected typologies of component failures, ship fleet size, ship type, travel time, number of maintenance workers on staff. |
| Besnard et al. [66] | 2013 | Location of accommodation facilities for maintenance staff, vessels for the transfer of crew (type and number), availability of helicopters, organization of work shifts, management of spare parts stocks, technical support, availability of cranes (purchase or contract), environmental conditions (depending on weather and season), economic parameters (electricity prices, ship rental costs). |
| Halvorsen-Weare et al. [67] | 2013 | Investment costs, ship costs (fixed and variable costs), failure probability, downtime costs, meteorological data. |
| Hofmann & Sperstad [68] | 2013 | Weather conditions (including uncertainty), breakdown rates, electricity price, ship price (costs, fleet composition, type, quantity), workers (shift length, quantity), location of the maintenance base of operations. |
| Perveen et al. [69] | 2014 | Protection methodologies, occurrence of cable and component failures, repair strategy, wind speed predictions, and condition monitoring systems. |
| Endrerud et al. [70] | 2015 | Weather conditions, ships (availability, operating limits, costs), availability of maintenance technicians, repair times, wind farm layout, cost of spare parts, logistics (warehousing and other costs). |
| Nguyen & Chou [71] | 2018 | Duration of maintenance (downtime), expected loss of production during maintenance time, the market price of electricity, location of the wind farm. |
| Study | Year | Platform | Computer Vision/Video or Image Processing1 Technique | Application |
|---|---|---|---|---|
| Stokkeland et al. [91] | 2015 | Digital camera-equipped multi-copter UAV. | Computer Vision was also utilized for autonomous navigation (moving along the blades to acquire pictures). | SHM |
| Park et al. [92] | 2015 | Fixed Digital camera (laboratory test only) | Image segmentation, canny edge detection, and Hough Transform are applied to evaluate the angle changes in the nuts. The method is proposed for bolt loosening monitoring in the ring flange joints in WT towers. | SHM |
| Wang et al. [93] | 2017 | Remotely-controlled, digital camera-equipped UAV. | Cascading classifiers (several variants) were applied to detect and locate pixel regions containing cracks in the images. | SHM |
| Reddy et al. [94] | 2019 | Digital camera-equipped multi-copter UAV. | A convolutional neural network (CNN) architecture. | SHM |
| Shihavuddin et al. 1 [95]. | 2019 | Digital camera-equipped multi-copter UAV. | Deep learning-based damage detection and classification. Specifically, the authors used the well-established faster region-based CNN (R-CNN) algorithm [96] and compared it to other similar architectures (R-CNN, Fast R-CNN, SSD, and R-FCN). | SHM |
| Yang et al. [97] | 2021 | Digital camera-equipped UAV. | The authors used the pre-trained CNNs described in Ref. [98] after integrating them with their image dataset via Transfer Learning 2. | SHM |
| Study | Year | Technique | Notes | Application |
|---|---|---|---|---|
| Rumsey & Musial [193] | 2001 | Passive IRT | Infrared thermography was applied by the National Wind Technology Center at the National Renewable Energy Laboratory for the testing of full-size WT blades. One of the tests performed was a fatigue test in which a cyclic load was applied to the WT blade until failure. | SHM |
| Dattoma et al. [194] | 2001 | Active IRT (external heating and readings during the cooling phase) | The IRT procedure was experimentally tested on a WT blade sandwich panel, taken from the box spar. Glue infiltration, water ingress, and skin–core debonding were tested. | SHM |
| Hahn et al. [195] | 2002 | Thermoelastic stress analysis | Used to monitor the stress distribution on a GFRP blade during static and fatigue tests. Strain gauges were applied as well to assess the integrity of the root section. | SHM |
| Cheng & Tian [196] | 2011 | Inductive IRT (pulsed eddy current thermography) | The proposed method is based on inductive thermography for the inspection and assessment of CFRP components. | SHM |
| Pan et al. [197] | 2012 | Pulsed eddy current | The inductor and the IR camera were placed on opposite sides to detect damage in the heat transmission mode on CFRP specimens intended for WT blades. | SHM |
| Cheng & Tian [198] | 2013 | Pulsed eddy current | Detected surface cracks, impact cracks, defects, and delaminations from transient thermal images or videos on CFRP specimens. | SHM |
| Dattoma & Giancane [199] | 2013 | Passive IRT during fatigue tests | Compared DIC and IRT results on a GFRP specimen employed for WT blades. | SHM |
| Galleguillos et al. [200] | 2015 | Passive IRT from a UAV platform | Performed in situ surveys on rotating WT blades (in-service) with passive IRT from an unmanned rotorcraft. | SHM |
| Gao et al. [201] | 2016 | Pulsed eddy current | Developed a multidimensional tensor model based not only on the analysis of a single physical field such as heat conduction (conventional approach) but also on the inclusion of other properties such as electrical conductivity and magnetic permeability as well. | SHM |
| Paulmbo et al. [202] | 2016 | Lock-in IRT analysis (heat source: halogen lamps) | The technique was tested for the debonding of GFRP joints and compared to ultrasonic testing. | SHM |
| Yang et al. [203] | 2016 | Pulsed eddy current | Combined eddy current pulsed thermography and thermal-wave-radar analysis for the assessment of delamination on CFRP blades. | SHM |
| Palumbo et al. [204] | 2017 | Thermoelastic phase analysis | The study focused on the fatigue damage analysis on GFRP specimens, analysing the thermal signal in the frequency domain. | SHM |
| Study | Year | Technique | Notes | Application |
|---|---|---|---|---|
| Jørgensen et al. [289] | 2004 | Ultrasonic immersion test | An early example of UT for the detection of damages and manufacturing defects. The skin, glue, laminate, and sandwich layers were all clearly visible from the scans. | SHM |
| Jasiüniené et al. [290] | 2008 | Ultrasonic immersion test with moving water container | A particular type of ultrasonic immersion test (contact pulse–echo immersion testing) was used to assess internal defects in a WT blade. The geometry of the defects was recognized from the ultrasound images obtained. | SHM |
| Raišutis et al. [291] | 2008 | Air-coupled guided wave ultrasonic test | The authors used an ultrasonic air-coupled technique to transmit guided waves, locating internal defects in a WT blade. | SHM |
| Jüngert [292] | 2008 | Guided wave ultrasonic test | It compared acoustic waves (from hammer tests, using local resonance spectroscopy) with ultrasonic guided waves. Acoustic waves were found to be less subject to scattering and damping while travelling through the fibre-reinforced material but less sensitive to small damages (due to their larger wavelength). | SHM |
| Jüngert & Grosse [293] | 2009 | Contact pulse-echo tests | Compared local resonance spectroscopy (from hammer tests) with contact pulse–echo UT on sandwich composites and pristine and delaminated GFRP. Ultrasonic waves correctly detected debonding at adhesive areas. | SHM |
| Jasiüniené et al. [294] | 2009 | Air-coupled ultrasonic tests, ultrasonic immersion tests with moving water container, and contact pulse–echo tests | UT and radiographic techniques were compared on WT blade specimens. The ultrasonic techniques proved to be more efficient in terms of implementation as they only require access from one side. The best imaging results, however, were obtained by combining RT and UT techniques. | SHM |
| Lee et al. [295] | 2011 | Long distance laser ultrasonic test | To overcome the attenuation due to air travelling, a portable laser-based device was proposed for long-distance UT, up to 40 m (indoor laboratory conditions). | SHM |
| Park et al. [296] | 2013 | Long distance laser ultrasonic test | It proposed a new laser ultrasonic imaging technique, specifically intended for rotating blades | SHM |
| Ye et al. [297] | 2014 | Pulse-echo test | A portable device for 2D (surface) and 3D (volume) UT scanning was proposed and tested on GFRP WT blade specimens. | SHM |
| Park et al. [298] | 2014 | Long-distance laser ultrasonic test | Delamination and debonding were successfully visualized in a GFRP composite wind blade structure. | SHM |
| Park et al. [299] | 2015 | Laser ultrasonic propagation imaging system | A two-step UT imaging strategy was proposed, with an initial coarse scanning followed by a second refined one limited to the areas deemed of major interest after the first step. Tested on a 10 kW GFRP WT blade. | SHM |
| García Marquez & Gómez Muñoz [300] | 2020 | Macro fibre composite transducers and sinusoidal shaped signals | Cross-correlation and wavelet analysis were applied to detect, assess, and localize delaminations in WT blades. | SHM |
| Study | Year | Notes | Application |
|---|---|---|---|
| Papadopoulos et al. [315] | 2000 | An early study on the feasibility of static strain measurements for WT blades. The main potential causes of error were discussed and their impact was experimentally estimated. | SHM |
| Kim et al. [316] | 2011 | FBG sensors were embedded into a 1/23 scale of the 750 kW composite blade to evaluate its deflection. | SHM |
| Dimopoulos et al. [317] | 2012 | The authors used strain measurements from strain gauges to experimentally investigate the buckling behaviour of the thin steel cylindrical shells which make up the HAWT tower. | SHM |
| Choi et al. [318] | 2012 | FBG sensors were applied to estimate the static tip deflection of a 100 kW GFRP blade. This shape sensing is intended to avoid potential collisions with the nearby tower. | SHM |
| Kim et al. [319] | 2013 | Similar to Choi et al. [318], the authors suggested installing FBG sensors at the bonding line between the shear web and spar cap | SHM |
| Sierra-Pérez et al. [320] | 2016 | Compared strain measurements taken from strain gauges, FBG sensors, and Optical Backscatter Reflectometer (OBR) sensors on a prototype GFRP WT blade. | SHM |
| SHM | CM | ||||||
|---|---|---|---|---|---|---|---|
| Tower | Foundations | Blades | Bearings | Shaft | Generator | Gearbox | |
| VI | X | X | X (limited visibility) | X (limited visibility) | X (limited visibility) | ||
| Optical measurements | X | X | |||||
| Shearography | X | ||||||
| IRT | X | X | X | X | X | X | |
| Temperature, non IRT | X | X | X | X | |||
| X-ray CT | X | X | X | X | |||
| ET | X | X (CFRP only) | X | ||||
| AEs | X | X | X | X | X | ||
| UT | X | X | X | ||||
| Oil Monitoring | X | X | X | ||||
| Static strain | X | X | X | ||||
| Method | Advantages | Disadvantages |
|---|---|---|
| VI | Non-contact Very simple Low cost Does not require extensive training or specific instruments (man-made VI) Can be automated (Computer Vision and autonomous unmanned platforms) | Limited to surface damages and defects. Safety hazard for the personnel (if man-made). Low accuracy and highly subjective (if man-made). |
| Optical Measurements and Shearography | Non-contact Full-field Relatively fast to perform High sensitivity to damage | Shearography requires a specific (and expensive) setup. Difficult to quantify the extension of damage. Some techniques (e.g., DIC) require surface treatment. |
| IRT | Non-contact (except vibrothermography) Full-field Relatively fast to perform (except lock-in thermography; depends on the thickness of the material for pulsed and EC pulsed thermography) High sensitivity to damage Many options (surface and volumetric heating, different inputs, etc.) Relatively simple setup (except microwave thermography) Highly standardized (e.g., ISO 10880:2017) Good spatial resolution (depends on the specific option) | Active IRT requires an active source of heating. Only microwaves ensure uniform volumetric heating. Only microwaves and vibrothermography allow selective heating. Only lock-in and pulsed phase thermography are emissivity independent. Surface heating thermography is limited to the outermost layers of the material. Eddy currents cannot be applied to all materials (depending on their conductivity). Pulsed phase thermography requires extensive signal processing to analyze the results. Damage-unrelated factors may cause a rise in temperature. Cannot provide a very accurate damage diagnosis. |
| Temperature, non IRT | Highly standardized (e.g., ISO 15312:2018). | Requires an embedded sensor (subject to sensor faults). Damage-unrelated factors may cause temperature rise. |
| X-ray CT | Non-contact Very high spatial resolution | Radiation hazard Complex (and expensive) setup |
| ET | Non-contact Relatively low-cost. | Sensitive to lift-off Limited by the material conductivity Requires specific instruments. |
| AEs | Passive (no input required) Able to detect early-stage cracks and small defects. Can be applied on-site and in-service Can be applied also to low-speed rotating machinery. Can cover relatively large areas/volume. High signal-to-noise ratio. Frequency range far from load perturbation. | Relatively expensive. Requires a very high sampling rate. Acoustic wave attenuation in the material. Only detect damages at their inception or during their growth. Difficult to quantify the extension of damage In general, very noisy and difficult to interpret. |
| UT | Can be applied on-site and in-service Many options Can cover relatively large areas/volume, also with complex geometries | Require an active source of ultrasounds Coupling issues (especially for water-incompatible materials) Ultrasound attenuation in the material The analysis of the results requires an expert user |
| Oil Monitoring | Easy to install. Enables the direct characterisation of several oil parameters. The results are easy to interpret | Only viable for mechanical systems with a closed-loop oil supply system. Expensive for continuous online monitoring. |
| Static strain | Can provide both damage detection and shape sensing capabilities. Conventional strain gauges are easy to install. Can be used to monitor dynamic strain as well (for vibration-based inspection). | Fibre optics are still expensive and difficult to install. |
Publisher’s Note: MDPI stays neutral with regard to jurisdictional claims in published maps and institutional affiliations. |
© 2022 by the authors. Licensee MDPI, Basel, Switzerland. This article is an open access article distributed under the terms and conditions of the Creative Commons Attribution (CC BY) license (https://creativecommons.org/licenses/by/4.0/).
Share and Cite
Civera, M.; Surace, C. Non-Destructive Techniques for the Condition and Structural Health Monitoring of Wind Turbines: A Literature Review of the Last 20 Years. Sensors 2022, 22, 1627. https://doi.org/10.3390/s22041627
Civera M, Surace C. Non-Destructive Techniques for the Condition and Structural Health Monitoring of Wind Turbines: A Literature Review of the Last 20 Years. Sensors. 2022; 22(4):1627. https://doi.org/10.3390/s22041627
Chicago/Turabian StyleCivera, Marco, and Cecilia Surace. 2022. "Non-Destructive Techniques for the Condition and Structural Health Monitoring of Wind Turbines: A Literature Review of the Last 20 Years" Sensors 22, no. 4: 1627. https://doi.org/10.3390/s22041627