
A Nondestructive Measurement Method of Optical Fiber Young’s Modulus Based on OFDR

 , ,
, , 
Abstract
:1. Introduction
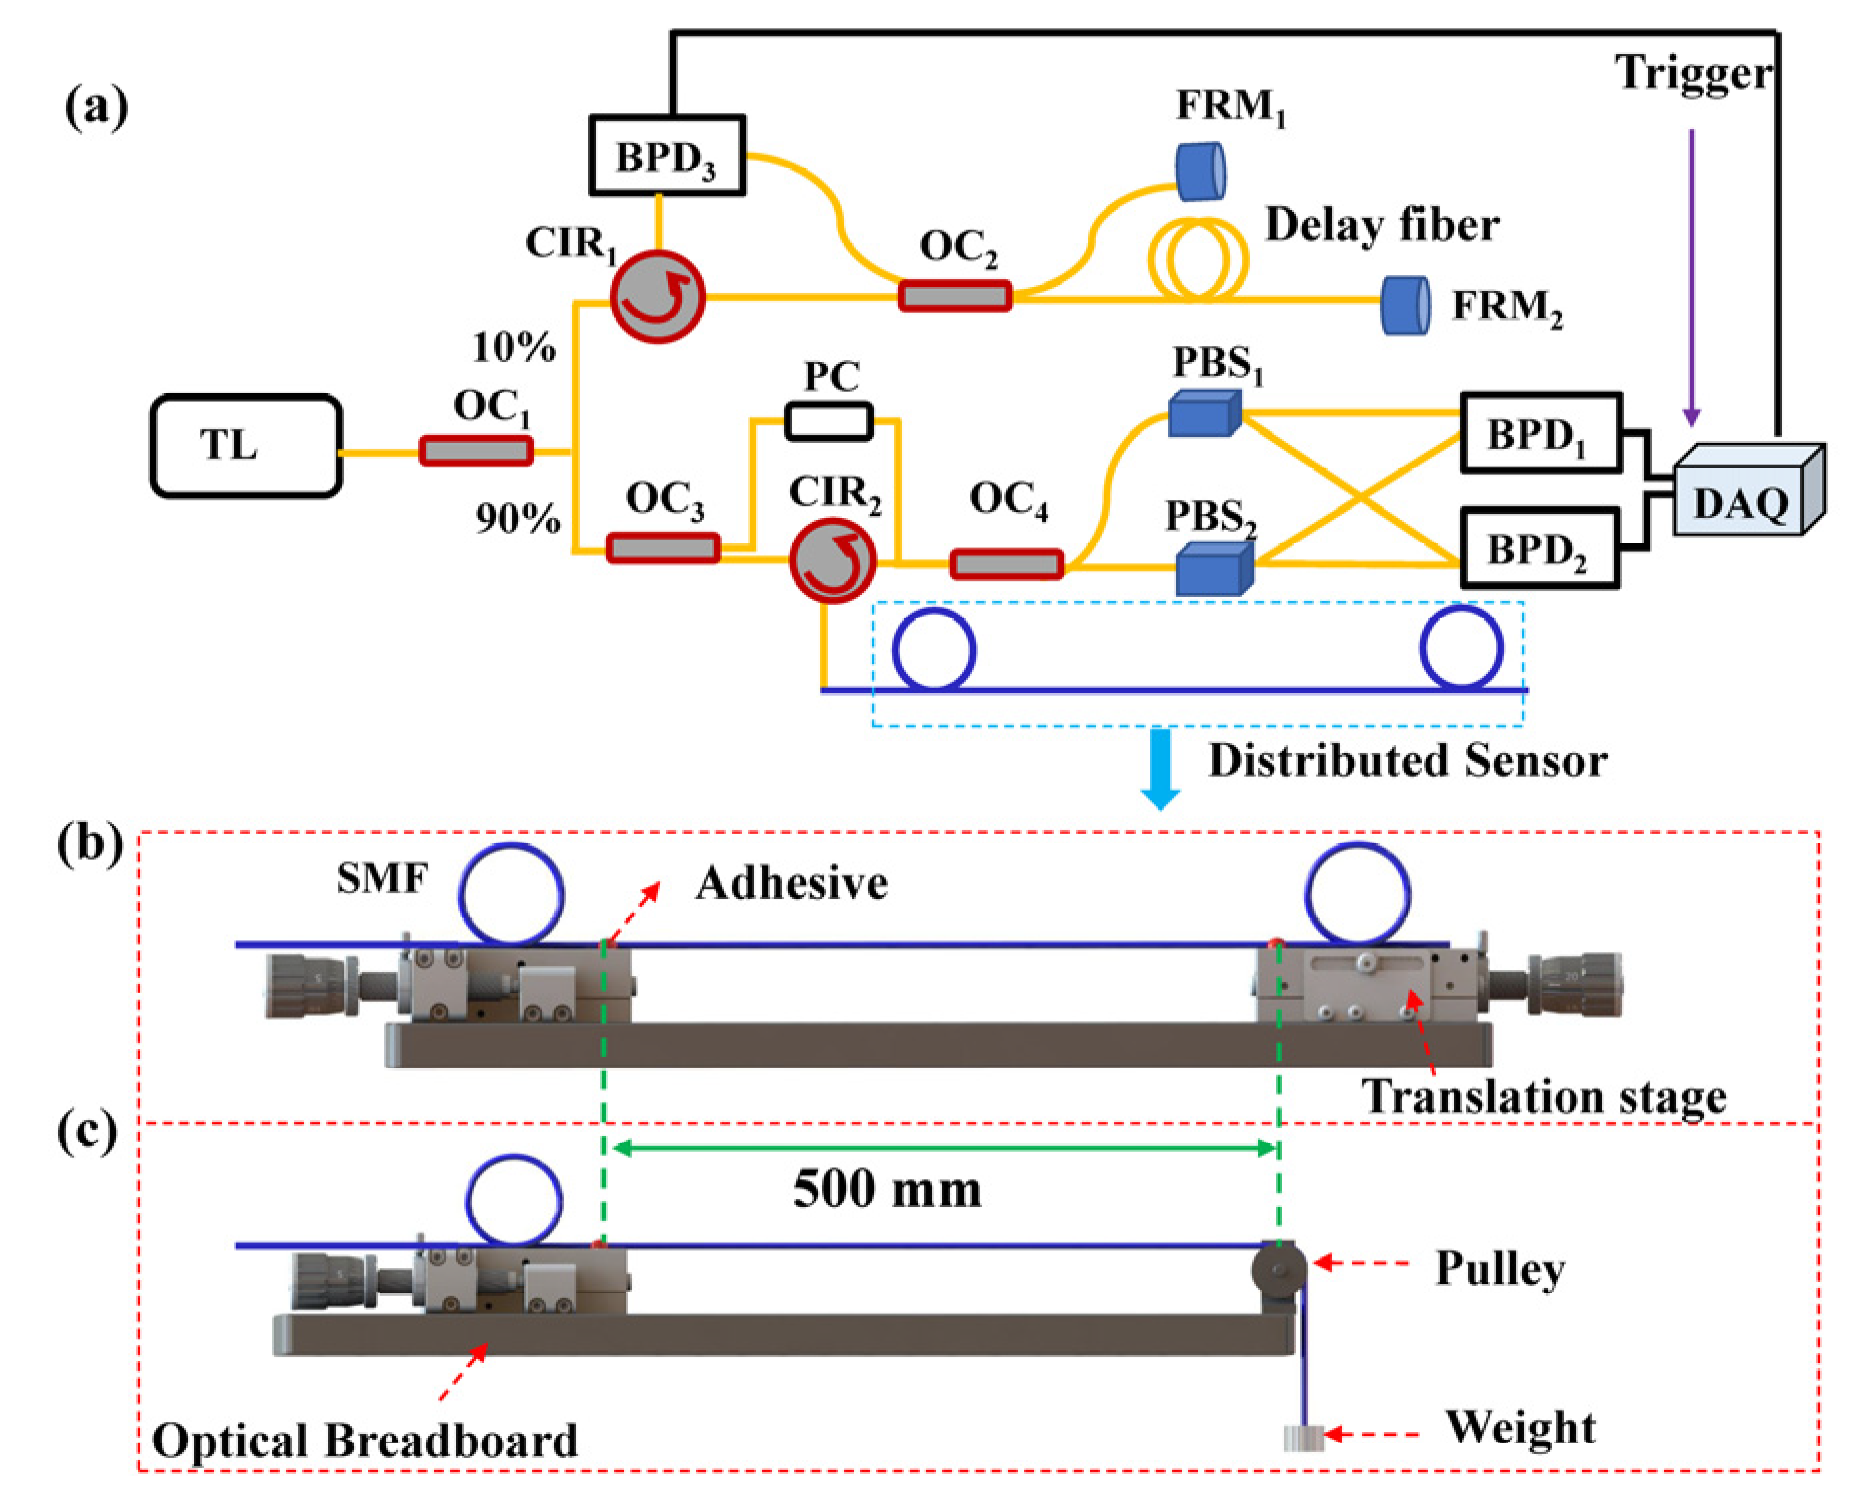
2. Test Design
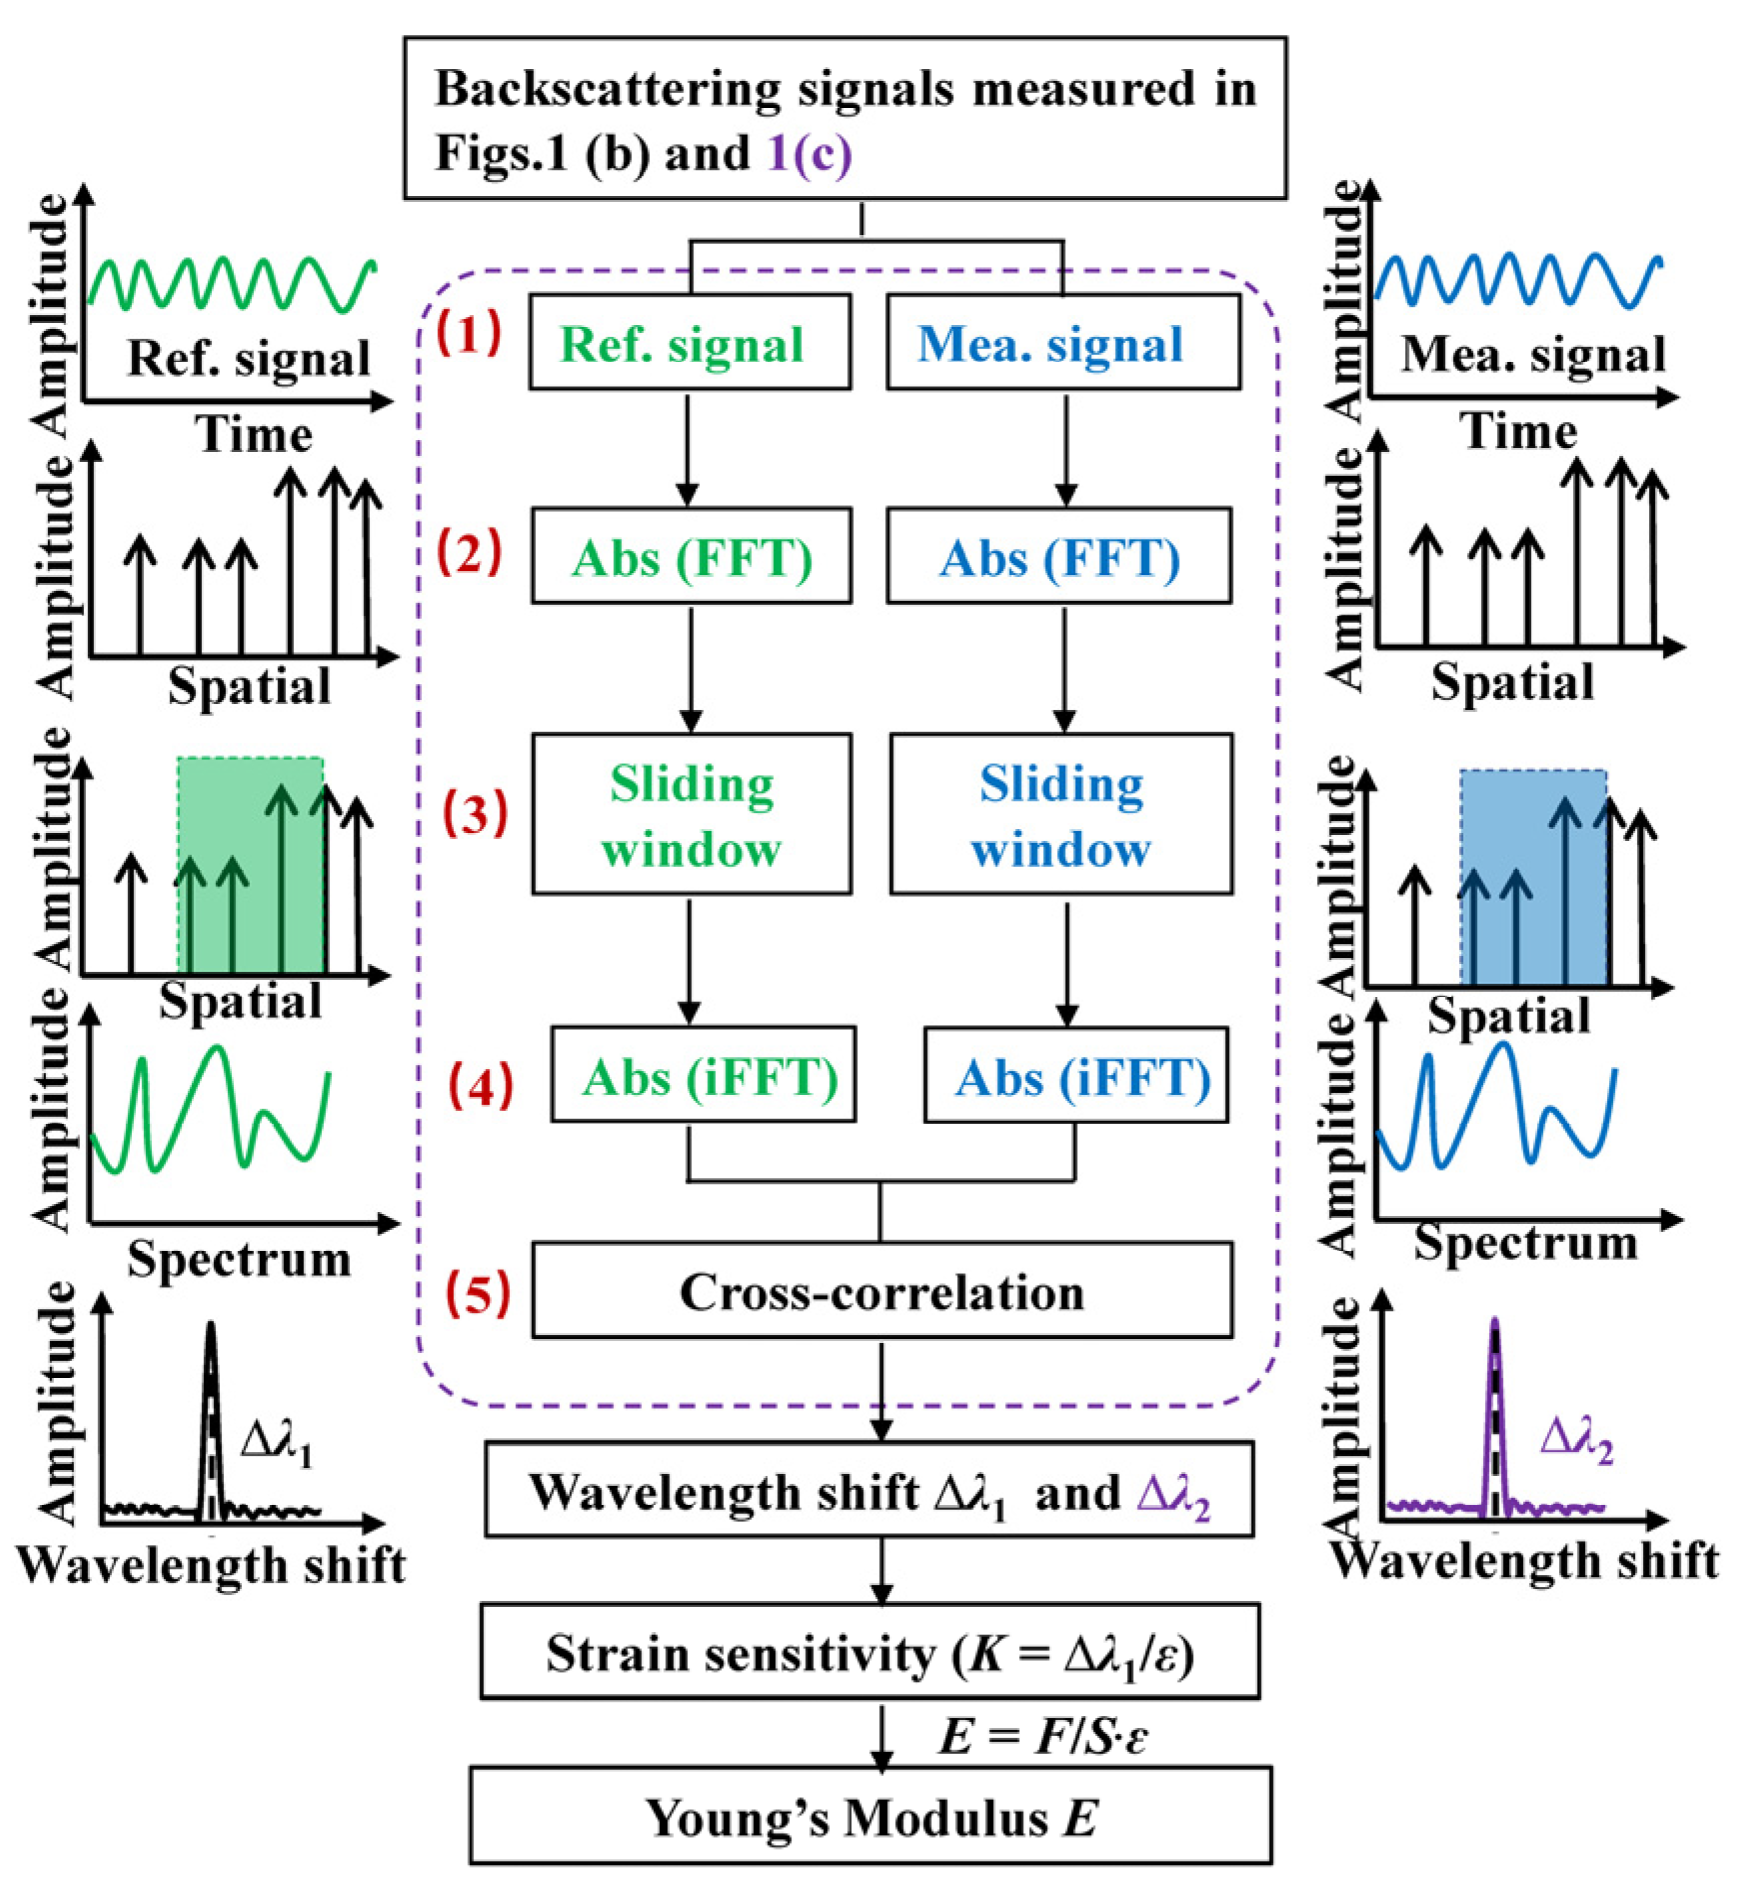
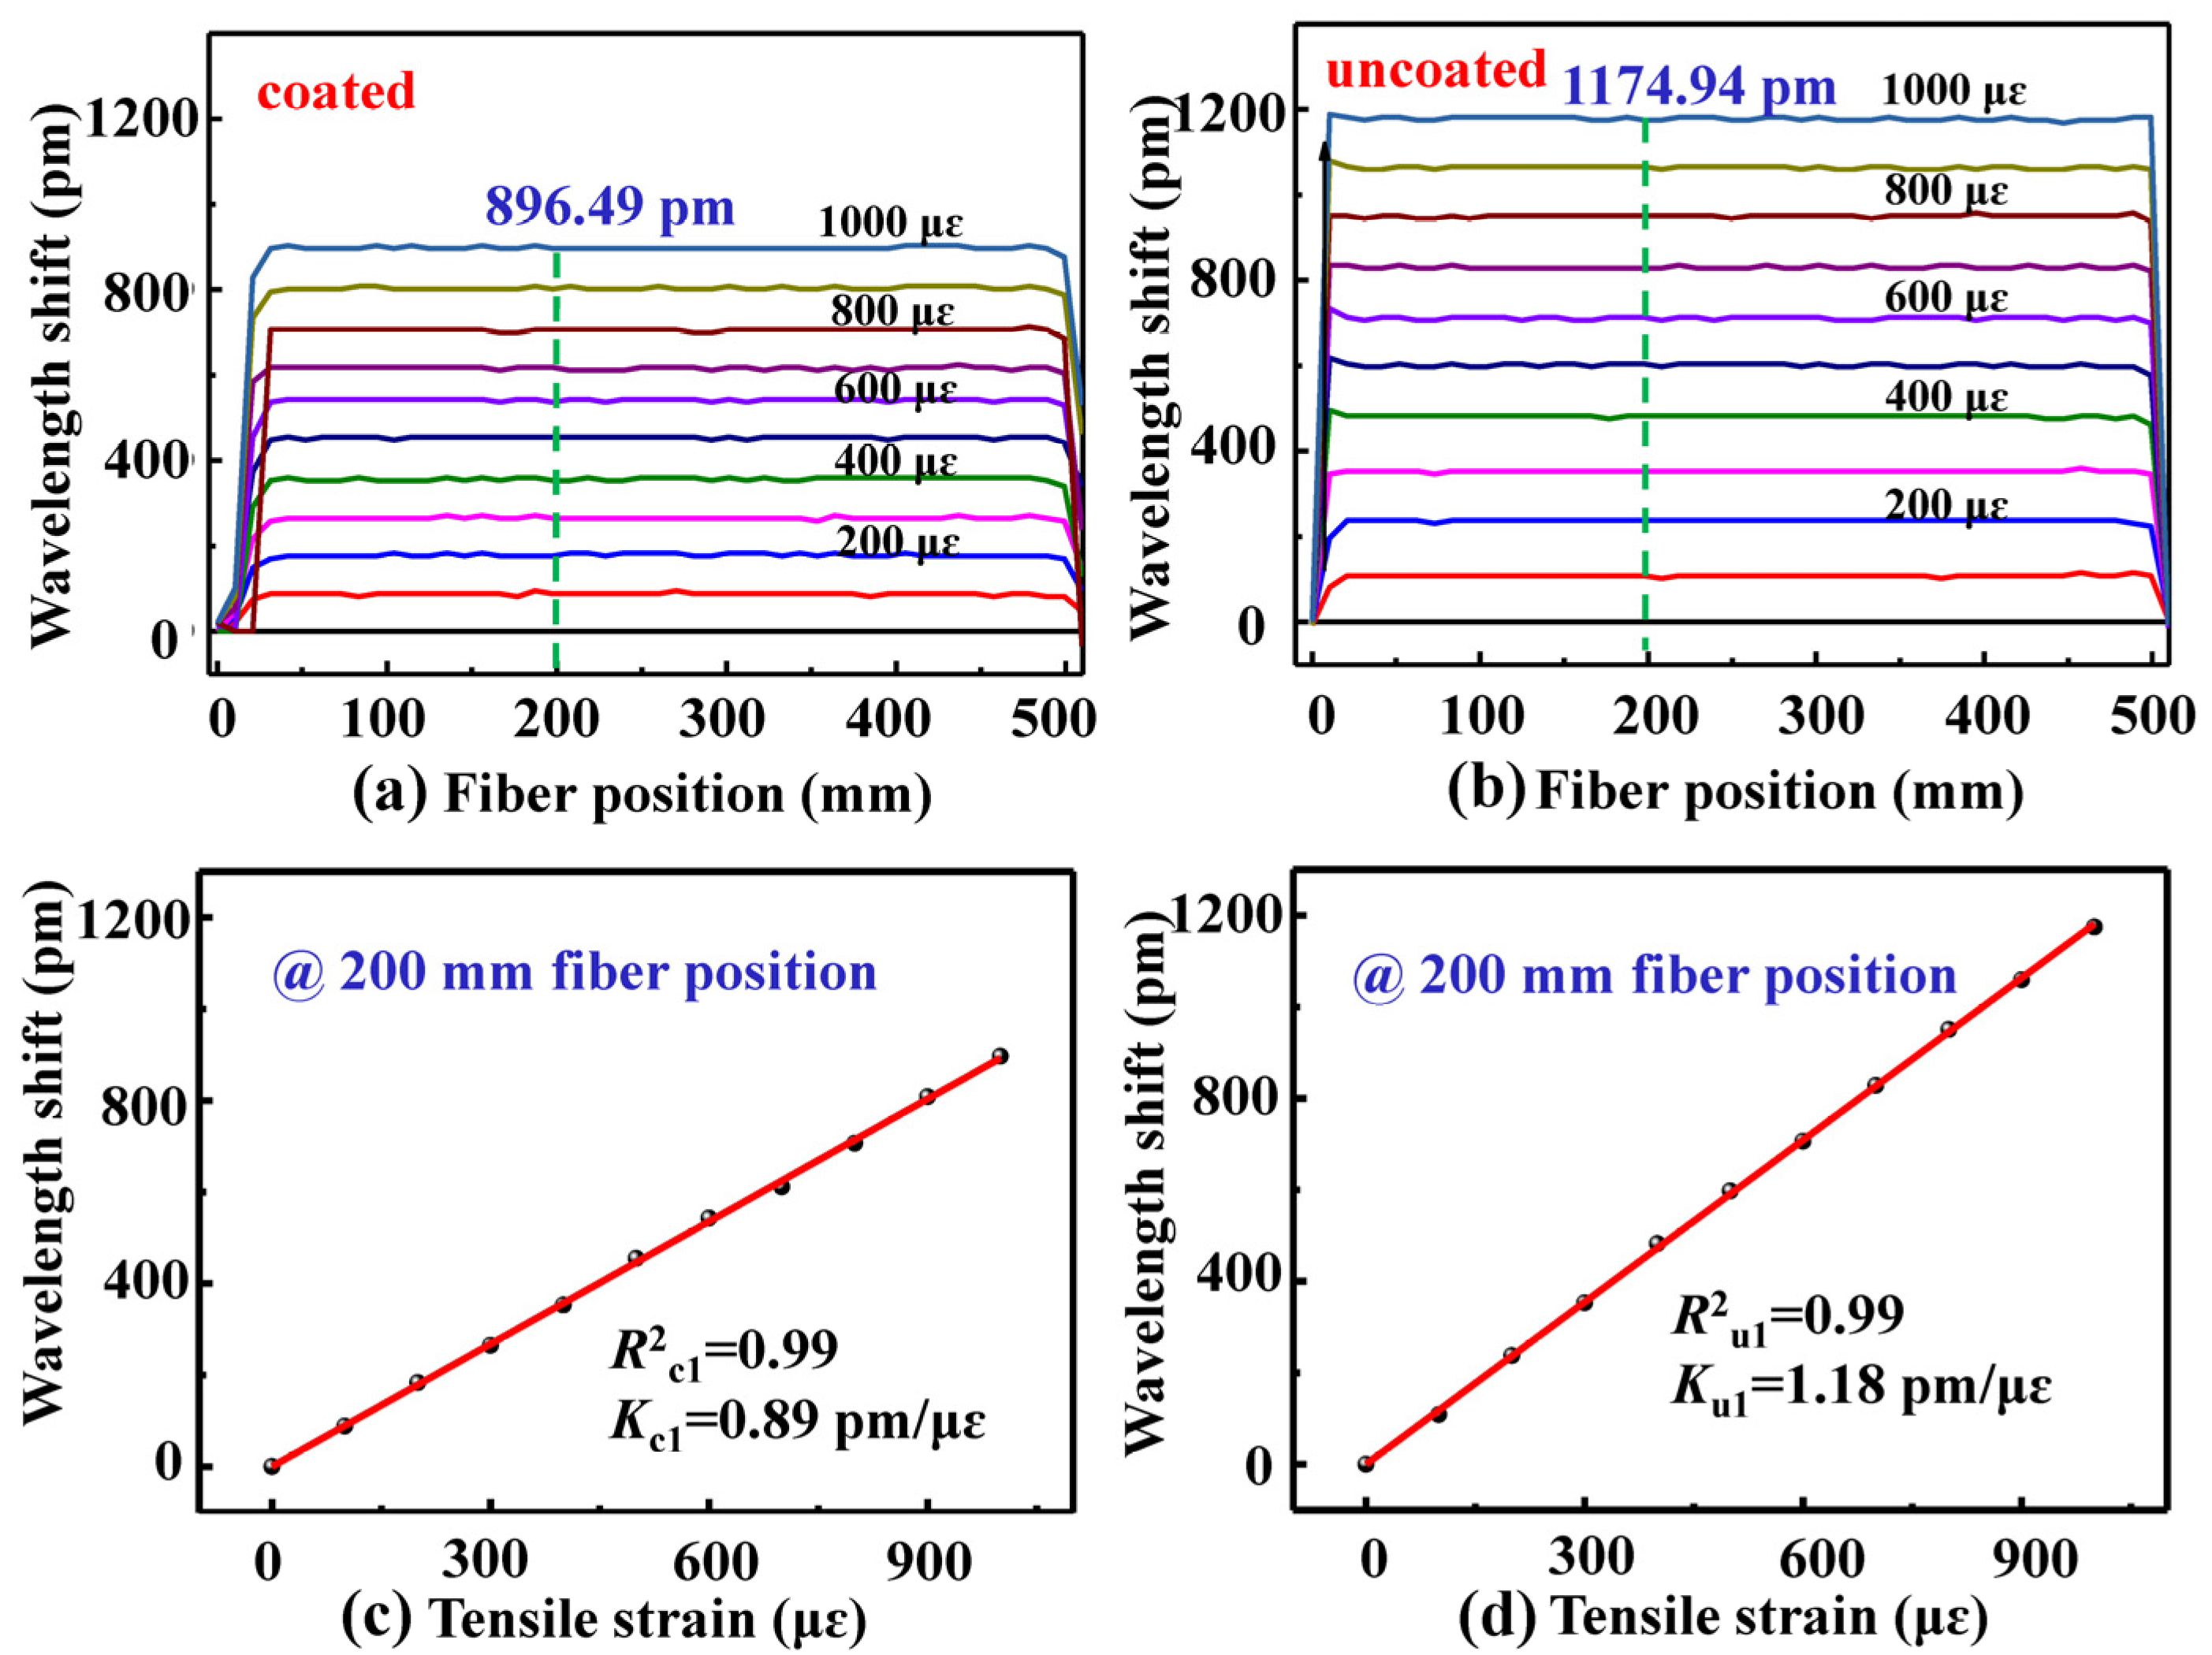
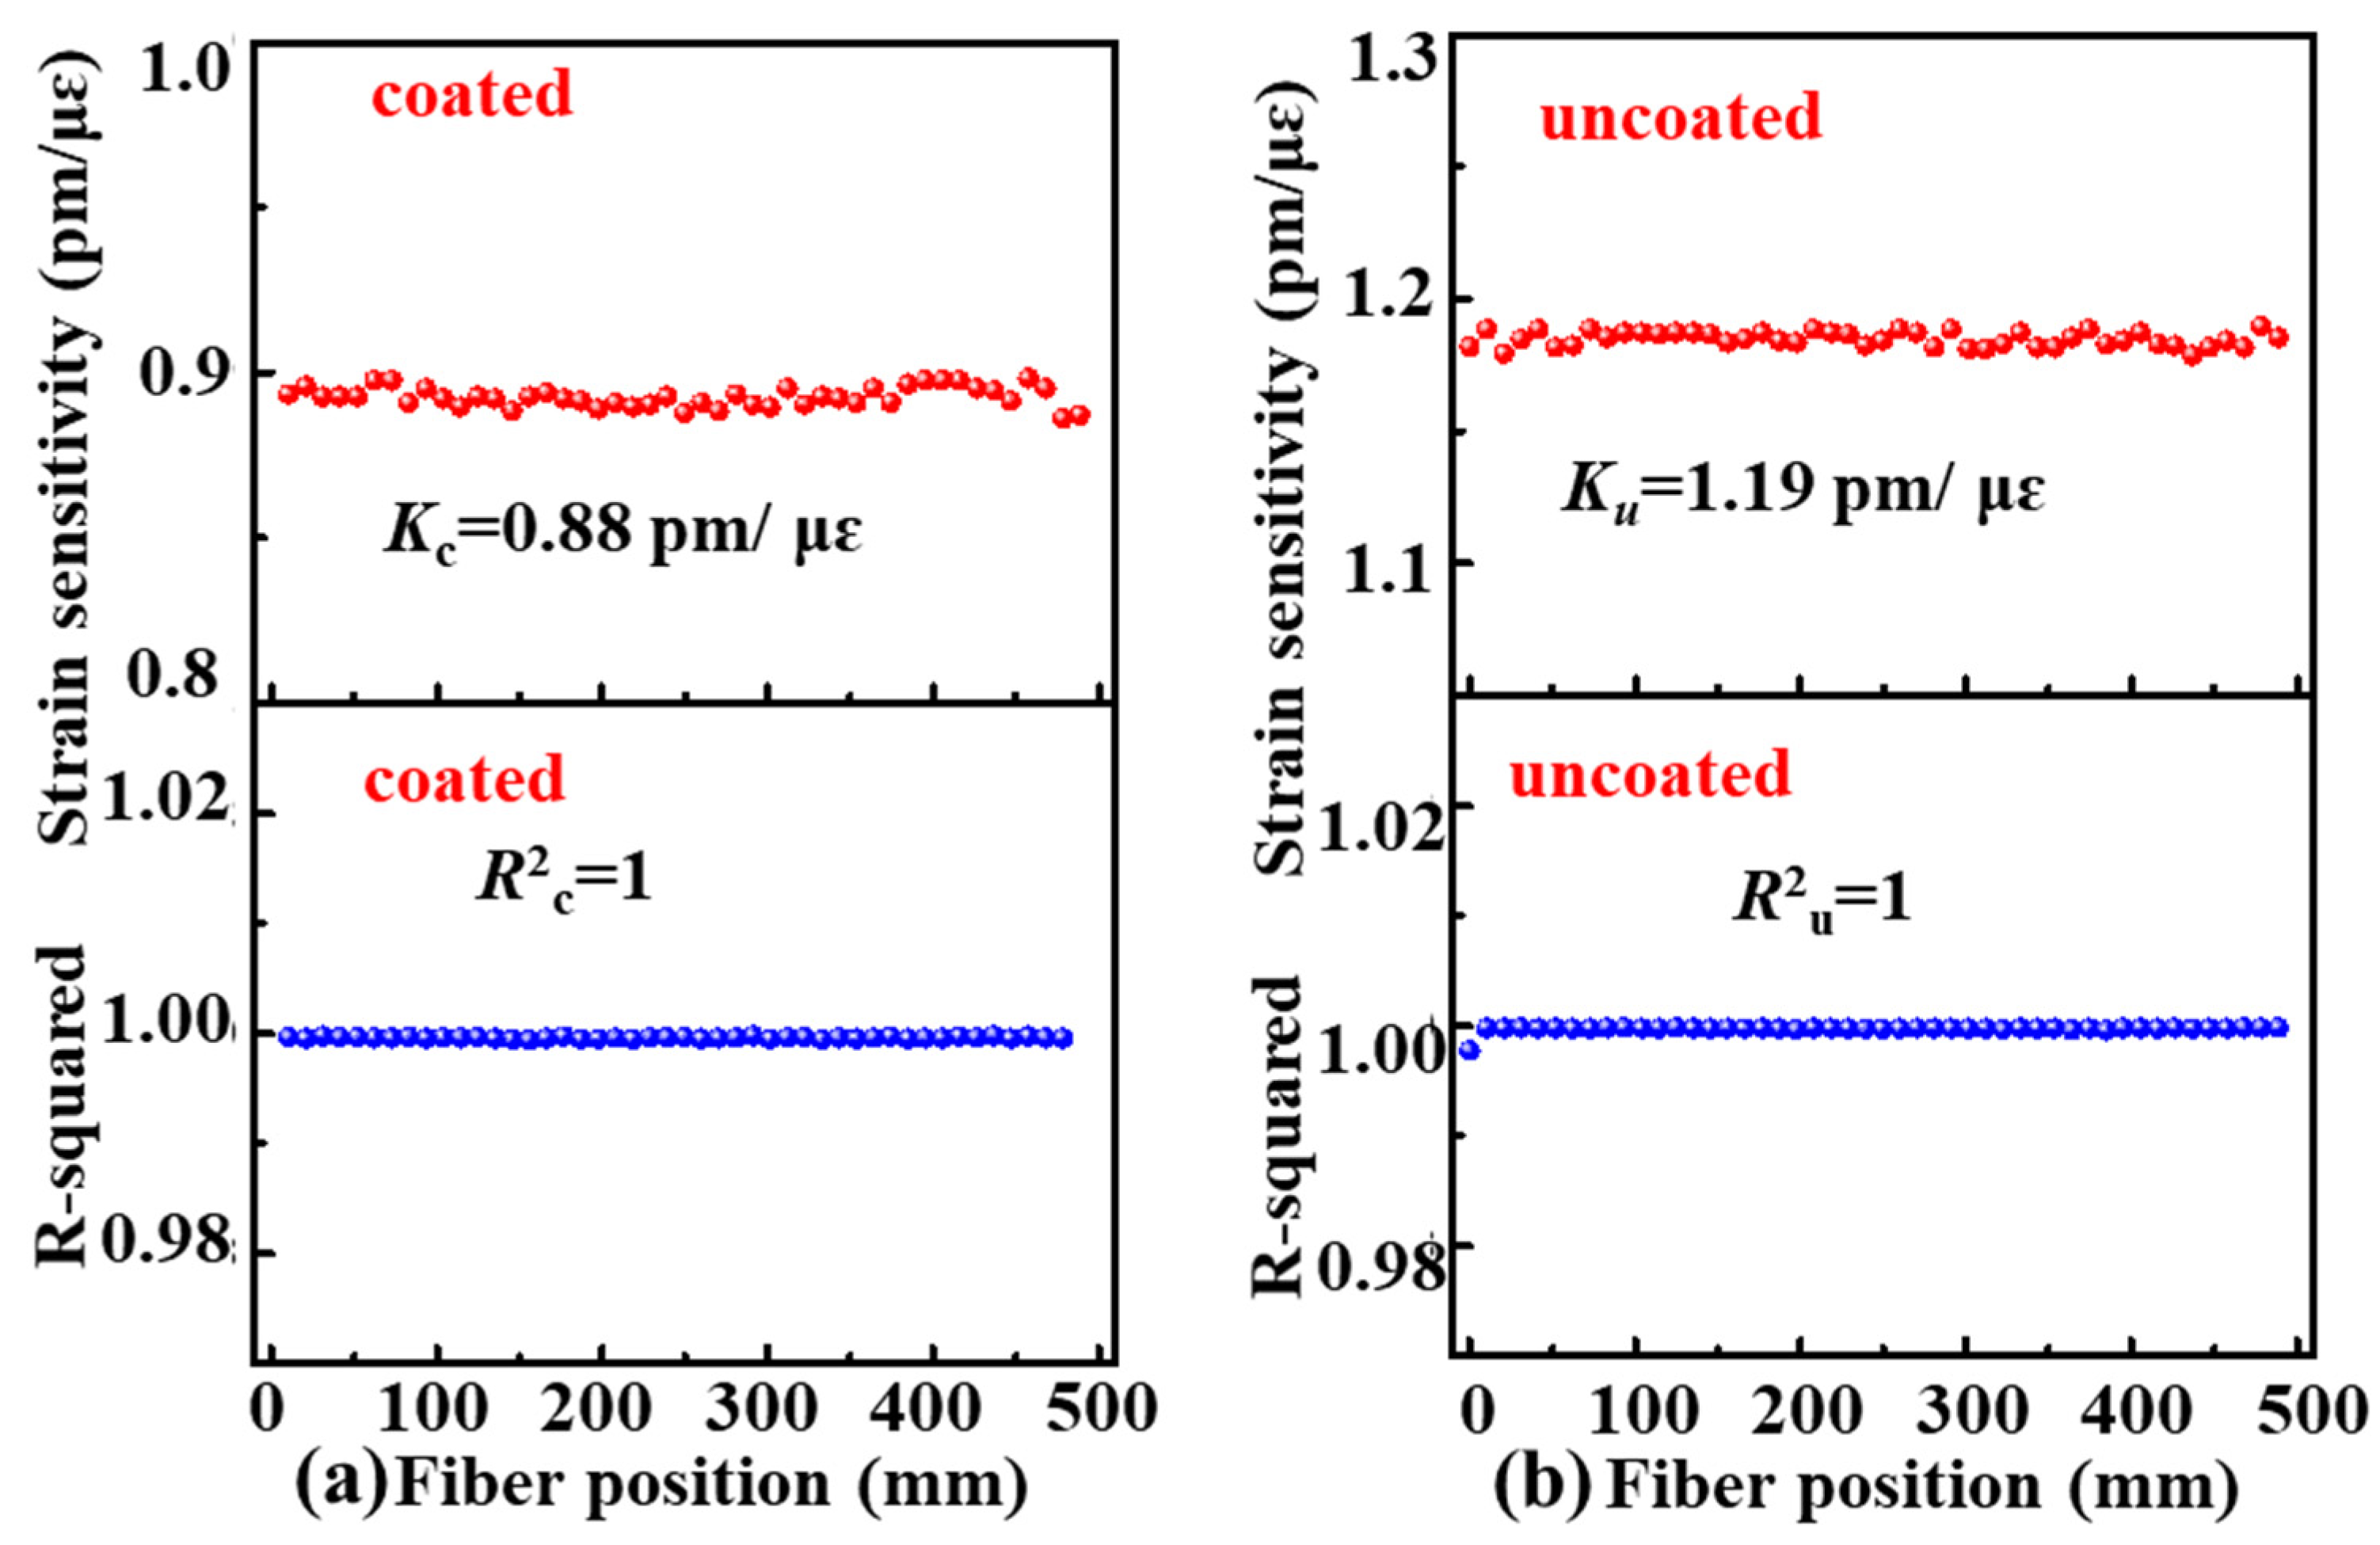
3. Experimental Results and Discussions
4. Conclusions
Author Contributions
Funding
Institutional Review Board Statement
Informed Consent Statement
Data Availability Statement
Conflicts of Interest
References
- Makovetskii, A. The bending of a quartz fiber with a nonconcentric protective coating. J. Opt. Technol. 2010, 77, 334–347. [Google Scholar] [CrossRef]
- Shiue, S.T. Thermally-induced microbending losses in double-coated optical fibers at low temperature. Mater. Chem. Phys. 1994, 38, 187–190. [Google Scholar]
- Pigeon, F.; Pelissier, S.; Mure-Ravaud, A.; Gagnaire, H.; Veillas, C. Optical fiber Young modulus measurement using an optical method. Electron. Lett. 1992, 28, 1034–1035. [Google Scholar] [CrossRef]
- EI-Diasty, F. Theory and measurement of Young’s modulus radial profiles of bent single-mode optical fibers with the multiple-beam interference technique. J. Opt. Soc. Am. A 2001, 18, 1171–1175. [Google Scholar] [CrossRef]
- Antunes, P.; Lima, H.; Monteiro, J.; André, P.S. Elastic constant measurement for standard and photosensitive single mode optical fibres. Opt. Technol. Let. 2008, 50, 2467–2469. [Google Scholar] [CrossRef]
- Sokkar, T.Z.N.; Shams El-Din, M.A.; El-Tawargy, A.S. On Young’s modulus profile across anisotropic nonhomogeneous polymeric fibre using automatic transverse interferometric method. Opt. Laser Eng. 2012, 50, 1223–1229. [Google Scholar] [CrossRef]
- Huether, J.; Rupp, P.; Kohlschreiber, I.; Weidenmann, K.A. An enhanced method to determine the Young’s modulus of technical single fibres by means of high-resolution digital image correlation. Meas. Sci. Technol. 2018, 29, 045601. [Google Scholar] [CrossRef]
- Leal-Junior, A.; Campos, V.; Frizera, A.; Marques, C. Low-cost and high-resolution pressure sensors using highly stretchable polymer optical fibers. Mater. Lett. 2020, 271, 127810. [Google Scholar] [CrossRef]
- Leal-Junior, A.; Frizera, A.; Marques, C.; Sánchez, M.; Santos, W.; Siqueira, A.; Segatto, M.; Pontes, M. Polymer optical fiber for angle and torque measurement of a series elastic actuator’s spring. J. Lightwave Technol. 2018, 36, 1698–1705. [Google Scholar] [CrossRef]
- Zhang, X.; Yin, Y.; Yin, X.; Wen, Y.; Zhang, X.; Liu, X.; Lv, H. Characterizing microring resonators using optical frequency domain reflectometry. Opt. Lett. 2021, 46, 2400–2403. [Google Scholar] [CrossRef]
- Feng, K.; Cui, J.; Jiang, D.; Jin, Y.; Sun, X.; Niu, Y.; Tan, J. Improvement of the strain measurable range of an OFDR based on local similar characteristics of a Rayleigh scattering spectrum. Opt. Lett. 2018, 43, 3293–3296. [Google Scholar] [CrossRef] [PubMed]
- Qu, S.; Qin, Z.; Xu, Y.; Liu, Z.; Cong, Z.; Wang, H.; Li, Z. Distributed sparse signal sensing based on compressive sensing OFDR. Opt. Lett. 2020, 45, 3288–3291. [Google Scholar] [CrossRef] [PubMed]
- Yao, Z.; Mauldin, T.; Xu, Z.; Hefferman, G.; Wei, T. Breaking limitations of fiber identification in traditional OFDR systems via compensation of initial optical frequency instability. Opt. Lett. 2020, 45, 6086–6089. [Google Scholar] [CrossRef]
- Luo, M.; Liu, J.; Tang, C.; Wang, X.; Lan, T.; Kan, B. 0.5 mm spatial resolution distributed fiber temperature and strain sensor with position-deviation compensation based on OFDR. Opt. Express 2019, 27, 35823–35829. [Google Scholar] [CrossRef]
- Xu, B.; He, J.; Du, B.; Xiao, X.; Xu, X.; Fu, C.; He, J.; Liao, C.; Wang, Y. Femtosecond laser point-by-point inscription of an ultra-weak fiber Bragg grating array for distributed high-temperature sensing. Opt. Express 2021, 29, 32615–32626. [Google Scholar] [CrossRef] [PubMed]
- Froggatt, M.; Moore, J. High-spatial-resolution distributed strain measurement in optical fiber with Rayleigh scatter. Appl. Opt. 1998, 37, 1735–1740. [Google Scholar] [CrossRef]
- Wei, C.; Chen, H.; Chen, X.; Chen, D.; Li, Z.; Yao, X. Distributed transverse stress measurement along an optic fiber using polarimetric OFDR. Opt. Lett. 2016, 41, 2819–2822. [Google Scholar] [CrossRef] [Green Version]
- Ding, Z.; Wang, C.; Liu, K.; Jiang, J.; Yang, D.; Pan, G.; Liu, T. Distributed Optical Fiber Sensors Based on Optical Frequency Domain Reflectometry: A review. Sensors 2018, 18, 1072. [Google Scholar] [CrossRef] [Green Version]
- Amanzadeh, M.; Aminossadati, S.M.; Kizil, M.S.; Rakić, A.D. Recent developments in fibre optic shape sensing. Measurement 2018, 128, 119–137. [Google Scholar] [CrossRef] [Green Version]
- Ding, Z.; Sun, K.; Liu, K.; Jiang, J.; Yang, D.; Yu, Z.; Li, J.; Liu, T. Distributed refractive index sensing based on tapered fibers in optical frequency domain reflectometry. Opt. Express 2018, 26, 13042–13054. [Google Scholar] [CrossRef]
- Rizzolo, S.; Périsse, J.; Boukenter, A.; Ouerdane, Y.; Marin, E.; Macé, J.-R.; Cannas, M.; Girard, S. Real time monitoring of water level and temperature in storage fuel pools through optical fibre sensors. Sci. Rep. 2017, 7, 8766. [Google Scholar] [CrossRef] [PubMed] [Green Version]
- Li, P.; Fu, C.; Du, B.; He, J.; Zhong, H.; Du, C.; Wang, L.; Wang, Y. High-Spatial-Resolution strain sensor based on distance compensation and image wavelet denoising method in OFDR. J. Lightwave Technol. 2021, 39, 6334–6339. [Google Scholar] [CrossRef]


Publisher’s Note: MDPI stays neutral with regard to jurisdictional claims in published maps and institutional affiliations. |
© 2022 by the authors. Licensee MDPI, Basel, Switzerland. This article is an open access article distributed under the terms and conditions of the Creative Commons Attribution (CC BY) license (https://creativecommons.org/licenses/by/4.0/).
Share and Cite
Li, P.; Fu, C.; Zhong, H.; Du, B.; Guo, K.; Meng, Y.; Du, C.; He, J.; Wang, L.; Wang, Y. A Nondestructive Measurement Method of Optical Fiber Young’s Modulus Based on OFDR. Sensors 2022, 22, 1450. https://doi.org/10.3390/s22041450
Li P, Fu C, Zhong H, Du B, Guo K, Meng Y, Du C, He J, Wang L, Wang Y. A Nondestructive Measurement Method of Optical Fiber Young’s Modulus Based on OFDR. Sensors. 2022; 22(4):1450. https://doi.org/10.3390/s22041450
Chicago/Turabian StyleLi, Pengfei, Cailing Fu, Huajian Zhong, Bin Du, Kuikui Guo, Yanjie Meng, Chao Du, Jun He, Lei Wang, and Yiping Wang. 2022. "A Nondestructive Measurement Method of Optical Fiber Young’s Modulus Based on OFDR" Sensors 22, no. 4: 1450. https://doi.org/10.3390/s22041450