
A Review of Infrared Thermography for Delamination Detection on Infrastructures and Buildings


Abstract
:1. Introduction
2. Related Review Works on IRT
3. Infrared Thermography
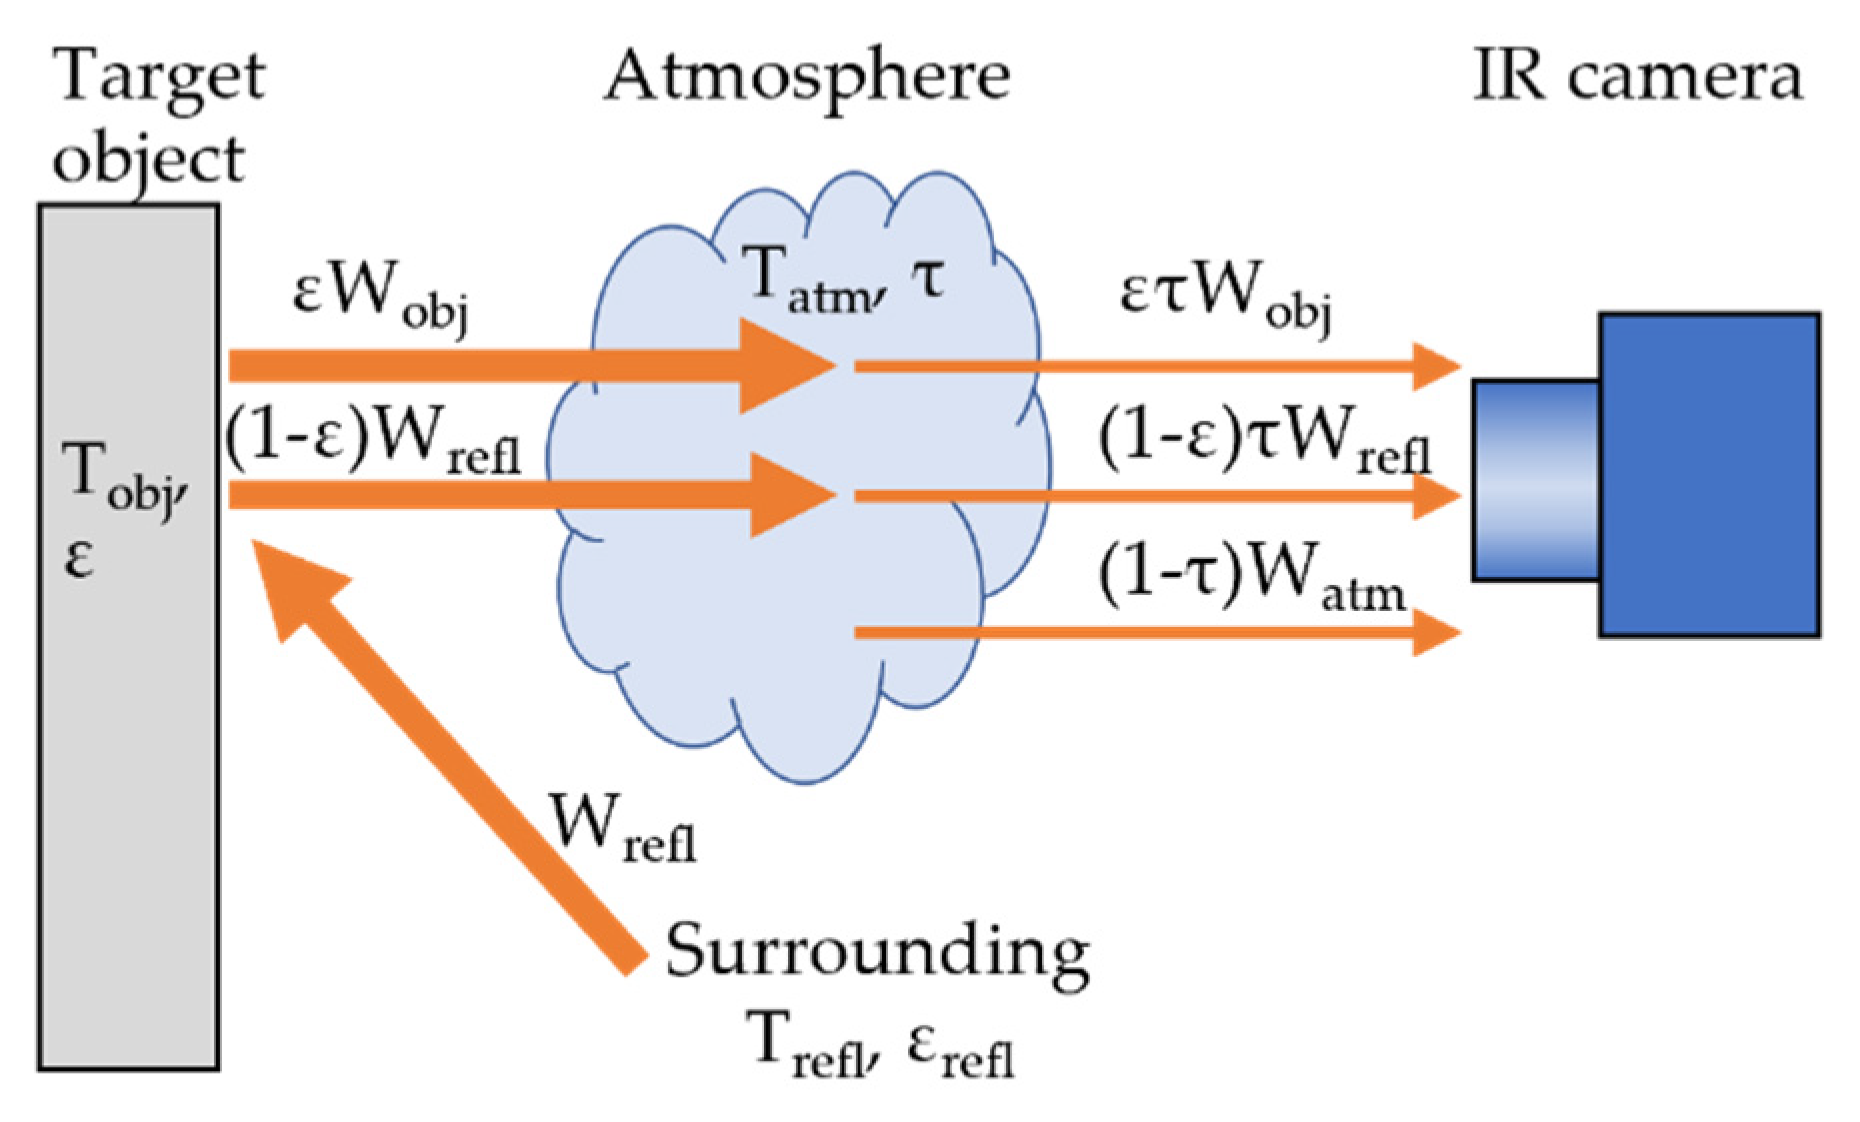
3.1. Theory of Temperature Measurement
3.2. Classification of IRT
3.2.1. Analysis Scheme
3.2.2. Mode
3.2.3. Measurement Method
4. Delamination Detection
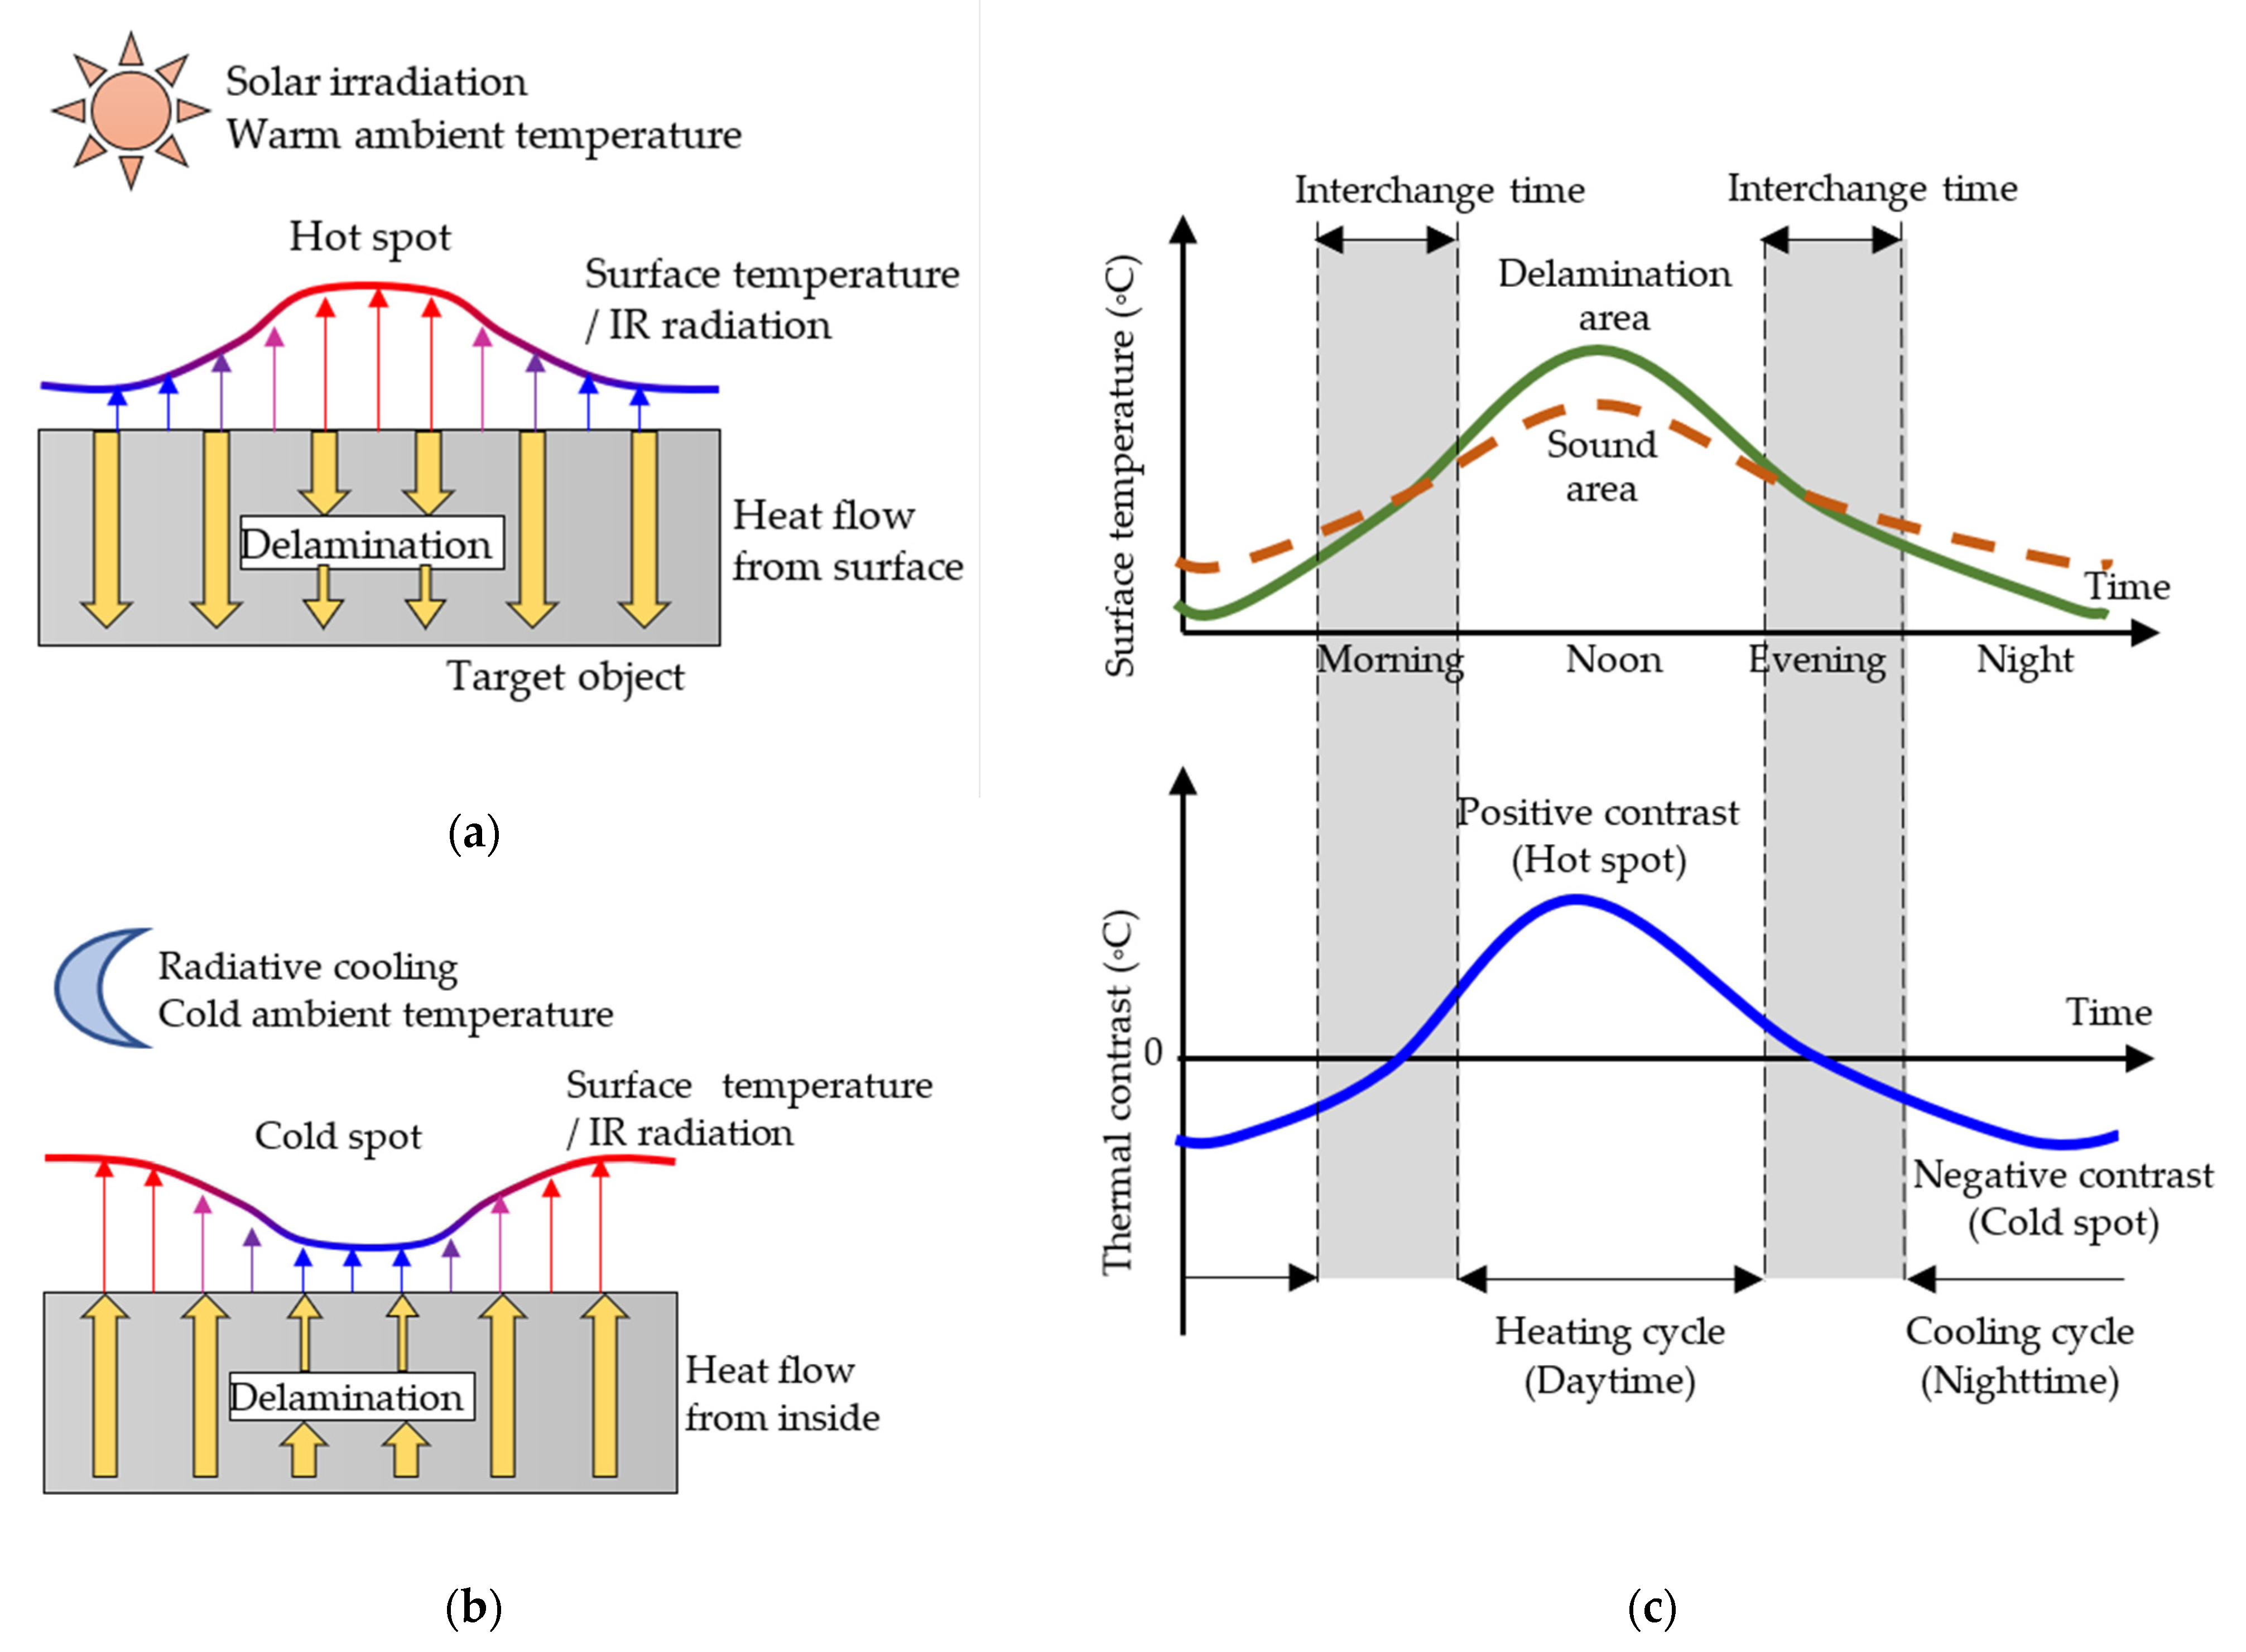
4.1. Principle of Delamination Detection
4.2. Analysis Method
4.2.1. One-Time Data Analysis
- (a)
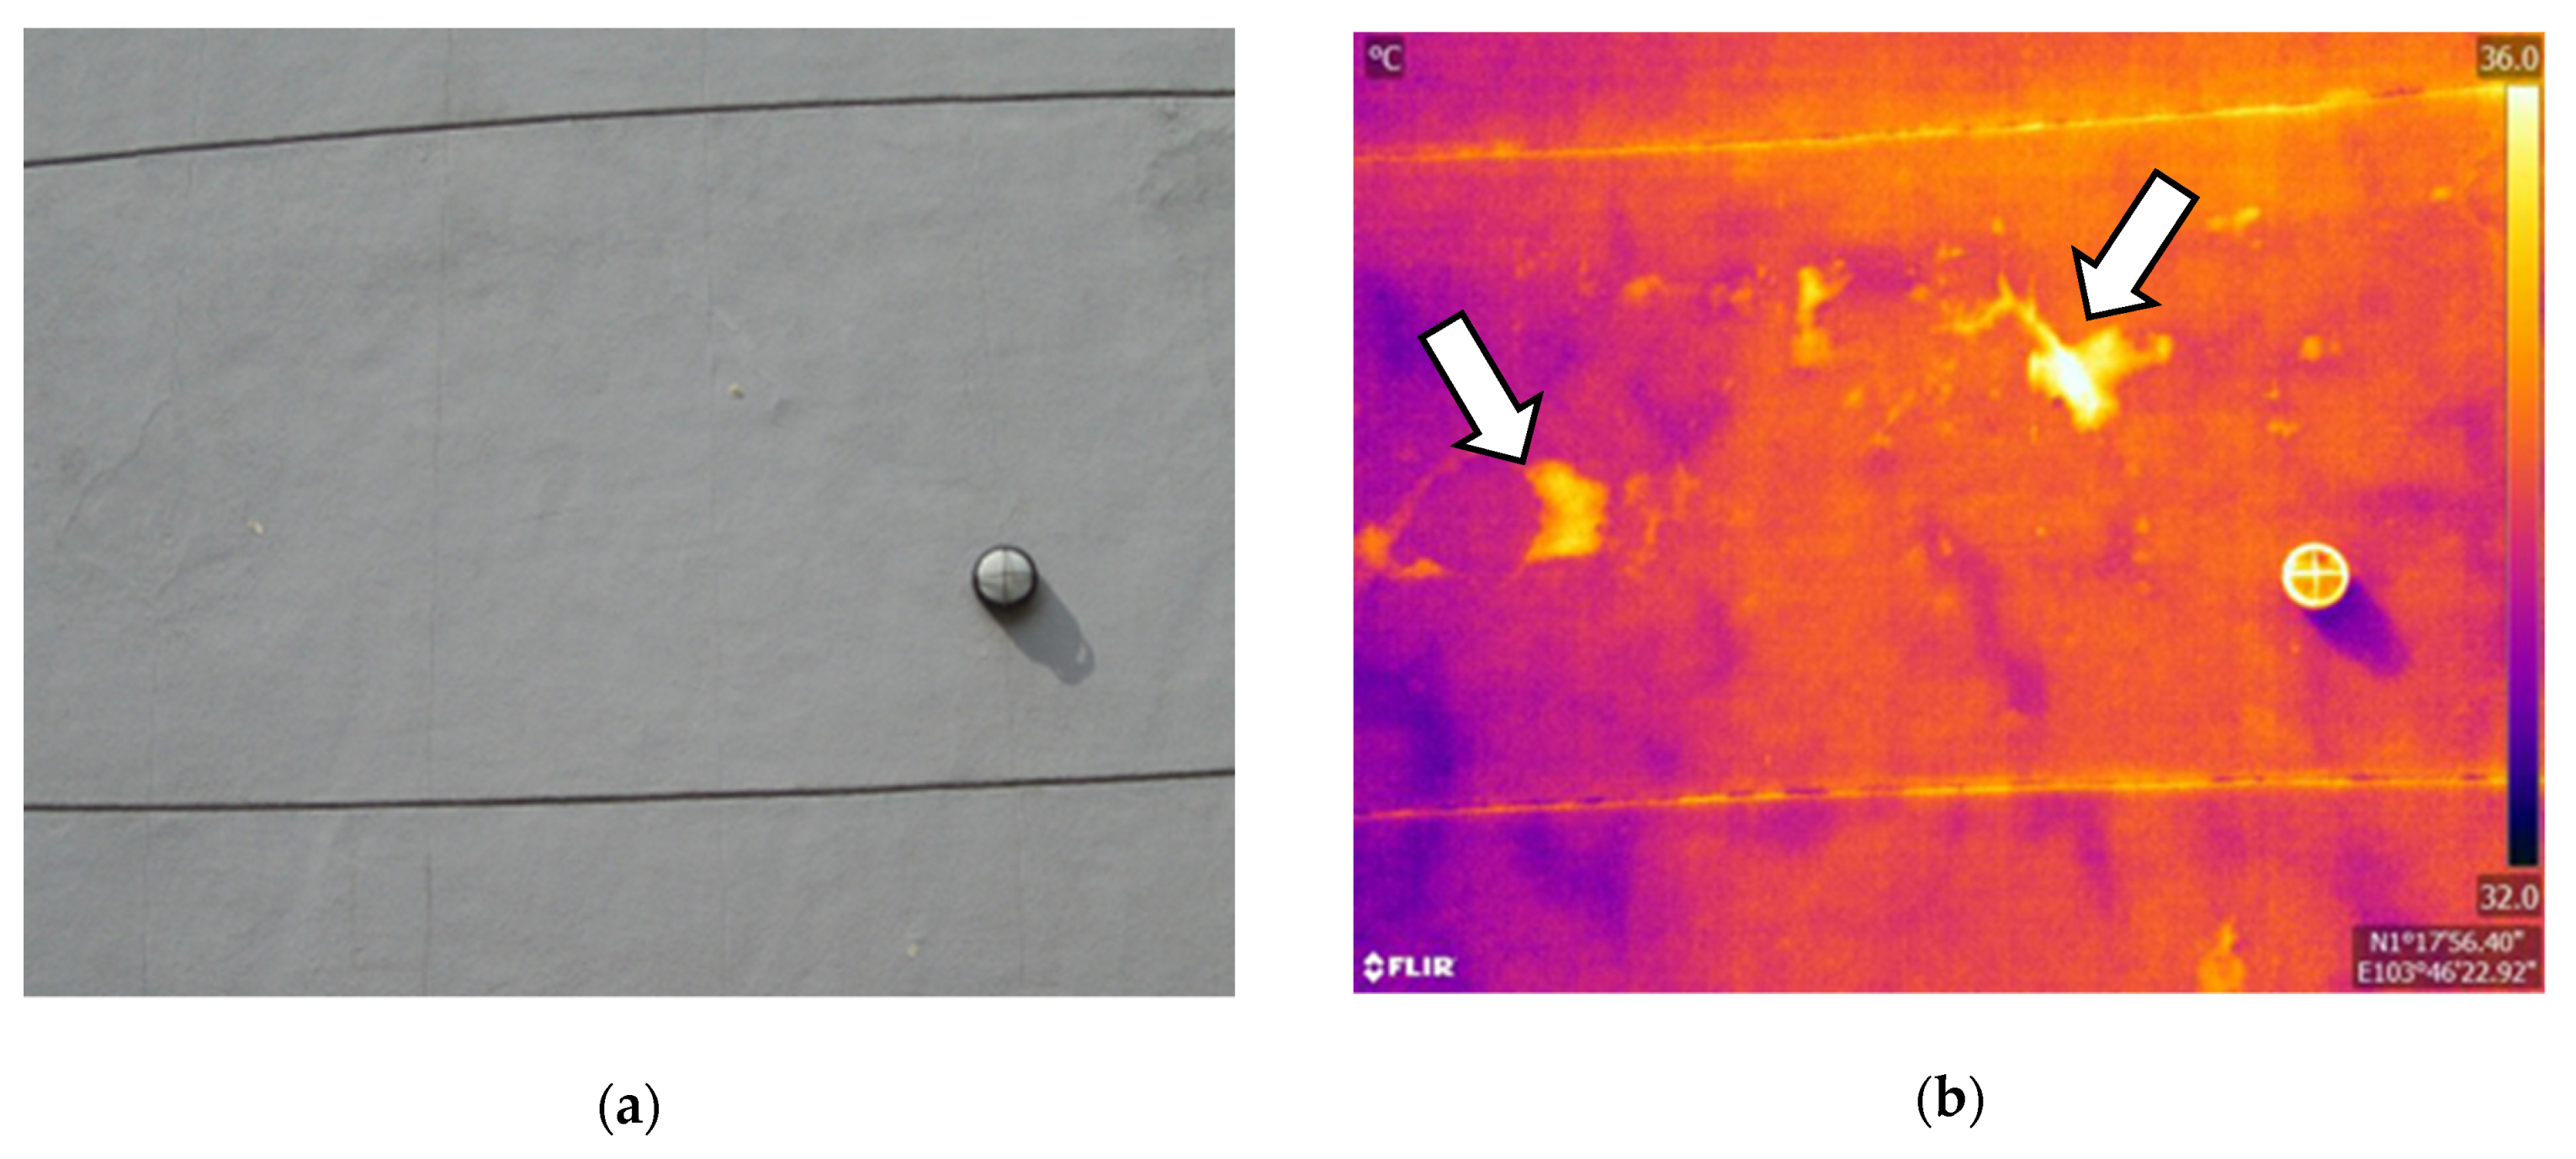
- Visual Evaluation
- (b)
- Thermal Contrast
- (c)
- Image Processing
4.2.2. Time-Series Data Analysis
4.3. Standards and Guidelines
4.4. Comparison with Other NDTs
5. Recent Studies of Affecting Factors on IRT for Infrastructures and Buildings
5.1. Test Method
5.2. Target Object
5.3. Test Location
5.4. Metric and Criterion
6. Affecting Factors of Detectability
6.1. Environmental Conditions
6.1.1. Time Window
6.1.2. Irradiation
6.1.3. Ambient Temperature
6.1.4. Wind
6.1.5. Relative Humidity
6.1.6. Others
6.2. Delamination Properties
6.2.1. Size
6.2.2. Depth
6.2.3. Width to Depth Ratio
6.2.4. Thickness
6.2.5. Material
6.3. Target Object
6.3.1. Thermal Property
6.3.2. Others
6.4. IR Camera
6.4.1. IR Camera Type
6.4.2. Distance and Spatial Resolution
6.4.3. Angle
6.4.4. Platform
7. Conclusions
- Suitable time windows for the inspection depend on the direction of the inspection surface and delamination depth. For shallow delamination on a horizontal surface or south elevation, the windows are noon to early afternoon and late evening to early night.
- A large amount of total solar irradiation is desirable because irradiation is the primary heat source to generate thermal contrast.
- High daily ambient temperature change allows IRT even in shaded areas.
- A low wind velocity is preferable in sunny areas.
- Fine weather is optimum for the heating and cooling cycles because of solar irradiation, high daily ambient temperature changes, and radiative cooling.
- Delamination of large size has high thermal contrast and is easy to detect.
- The detectable depth of delamination is greatly affected by environmental conditions. Delamination of at least 3–5 cm or less could be detected in outdoor conditions.
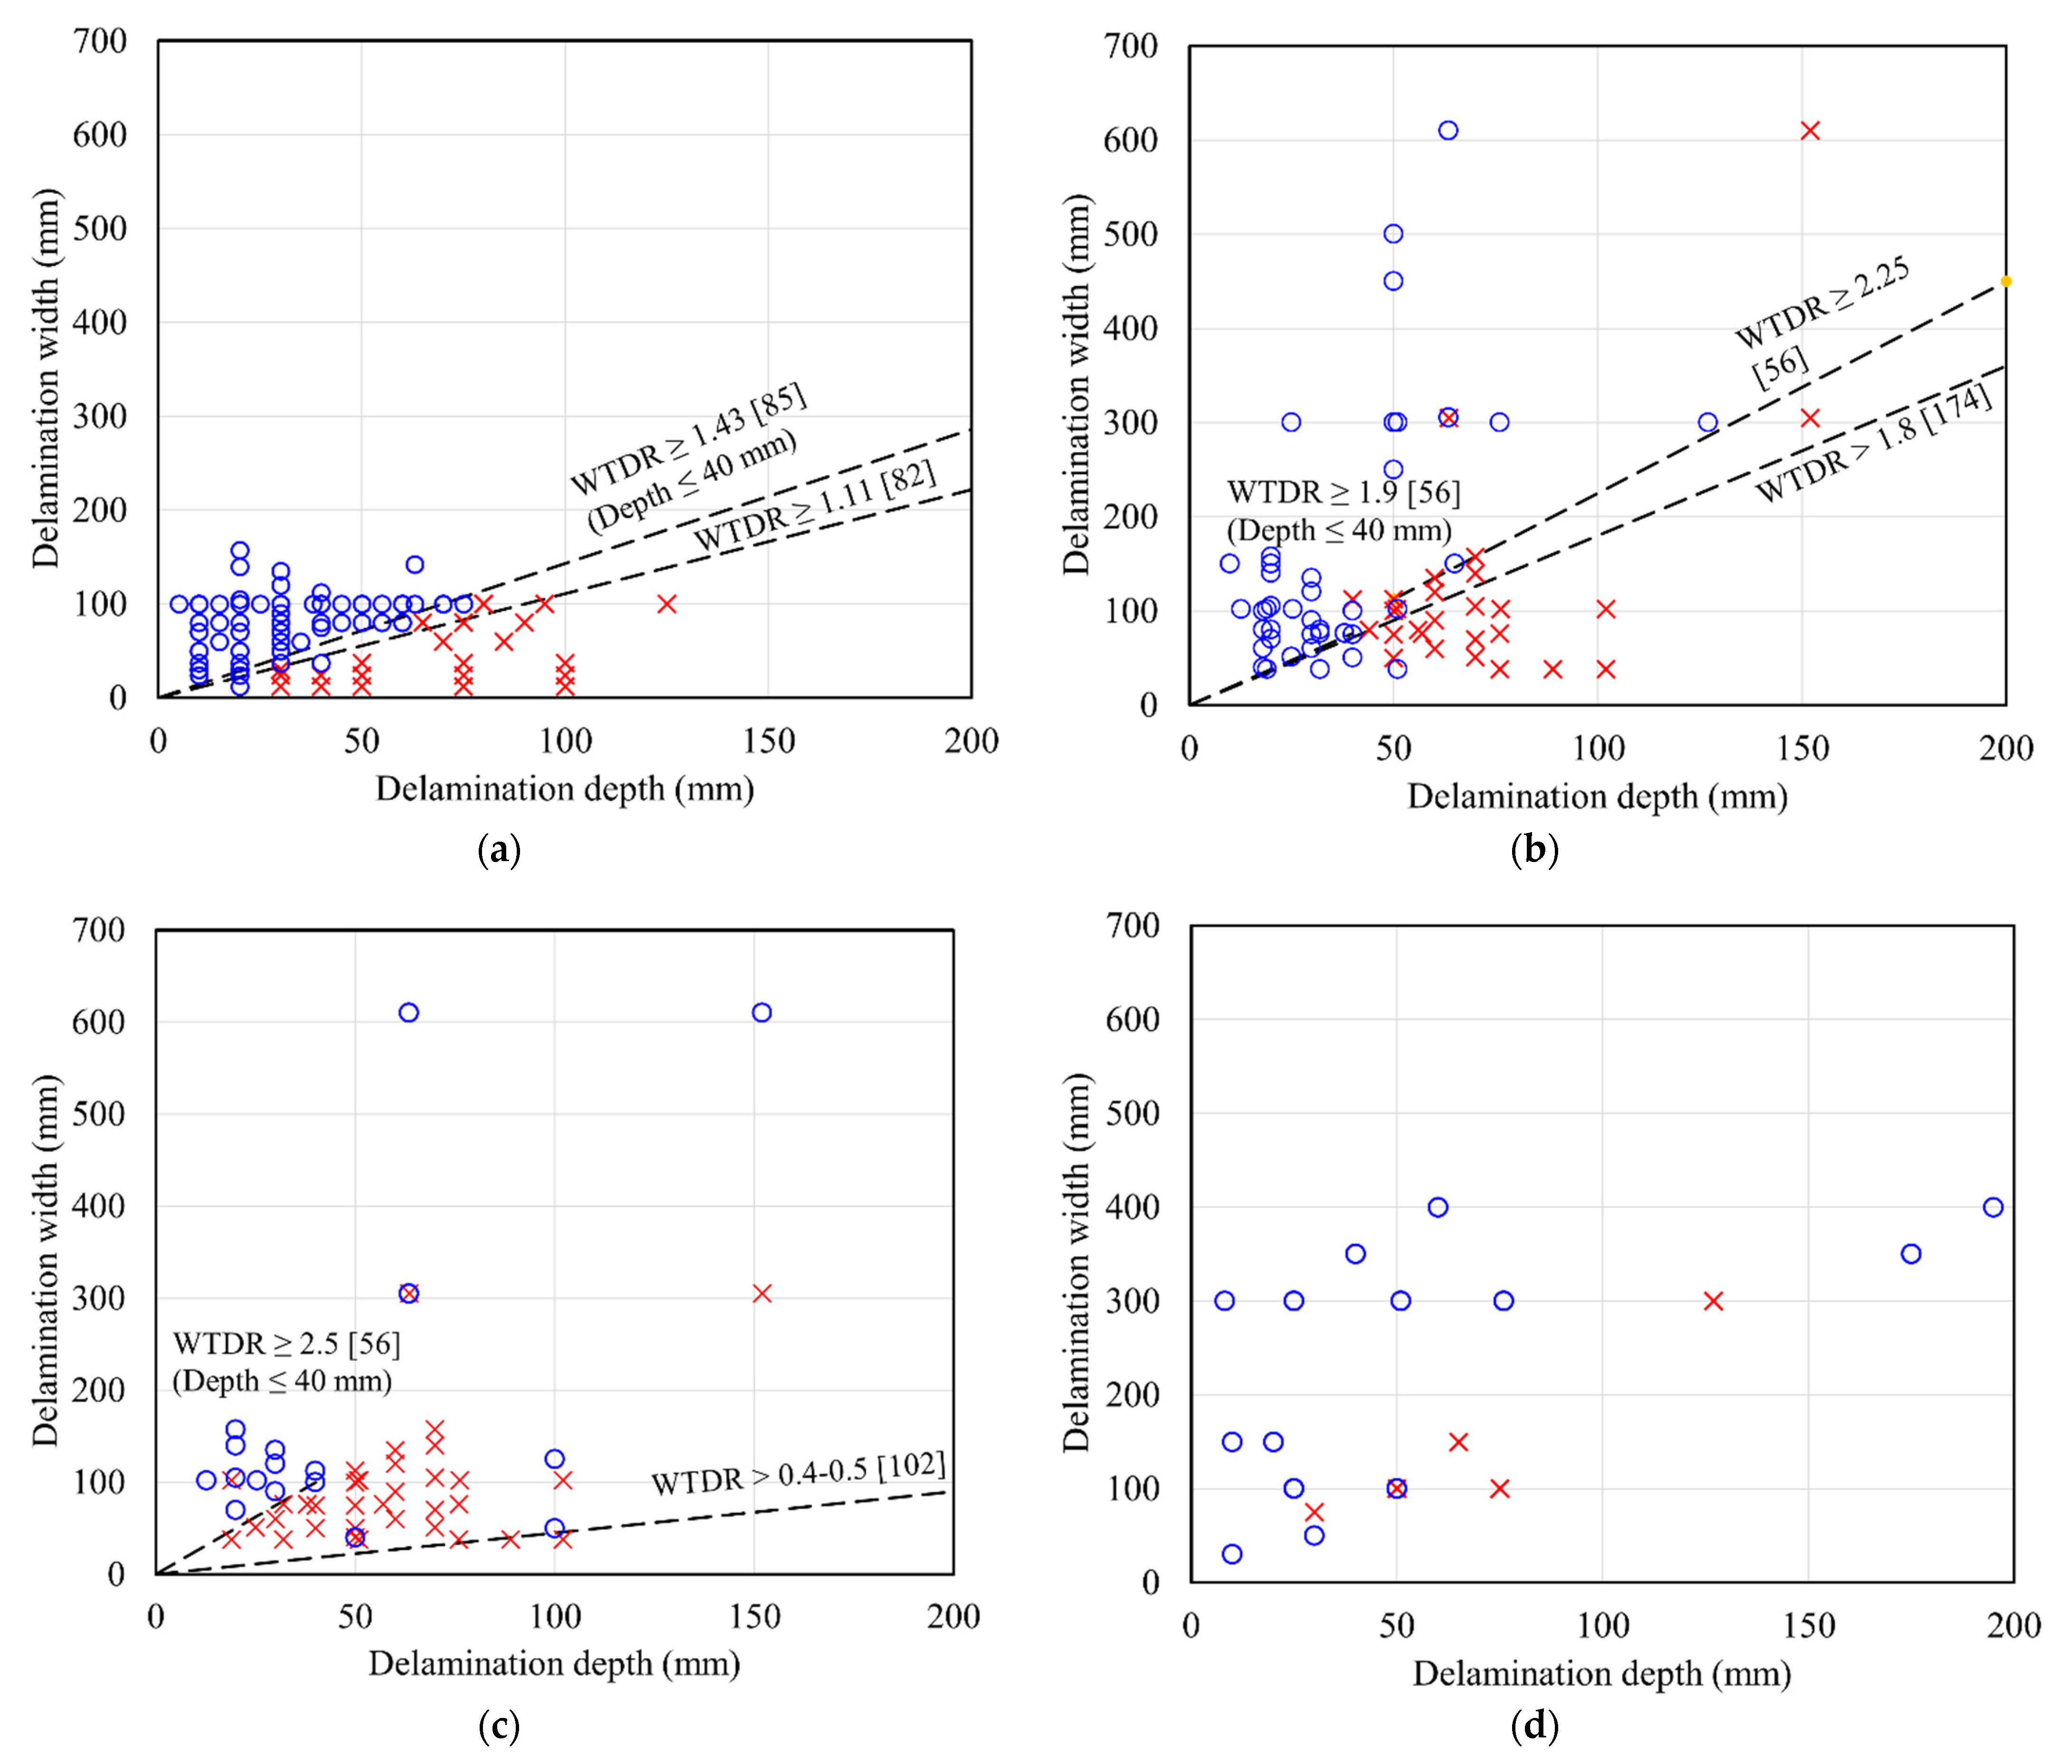
- The width to depth ratio (WDTR) of delamination also affects detectability. The WTDR criteria of detectable delamination are 1.25 under laboratory conditions and 2–2.5 under outdoor conditions.
- The target object with high thermal conductivity has high thermal contrast, and the detectability is low on the insulation walls or low-strength concrete.
- Water penetration into delamination causes the opposite behavior of the thermal contrast of delamination.
- Dark color surfaces in sunny areas are advantageous for inspection.
- The influence of obstacles on the surface can be removed by complementing IR images with visual images.
- Both types of SW cameras and LW cameras can be used for inspection. An appropriate type should be selected according to the noise of the surrounding environment.
- The close distance from an IR camera to a target object is desirable in terms of atmospheric attenuation, captured area, and spatial resolution while balancing productivity and limitation of accessibility.
- When IR camera platforms, such as vehicles or UAVs, move quickly, SW cameras can collect clear IR images compared with LW cameras.
Author Contributions
Funding
Institutional Review Board Statement
Informed Consent Statement
Data Availability Statement
Conflicts of Interest
References
- American Road and Transportation Builders Association. Bridge Conditions Report 2021. Available online: https://artbabridgereport.org/ (accessed on 8 October 2021).
- Chew, M.Y.L. Façade Inspection for Falling Objects from Tall Buildings in Singapore. Int. J. Build. Pathol. Adapt. 2021. ahead-of-print. [Google Scholar] [CrossRef]
- U.S. Department of Transportation. Highway Bridge Inspections. Available online: https://www.transportation.gov/testimony/highway-bridge-inspections (accessed on 8 October 2021).
- Kimura, T.; Zhang, T.; Fukuda, H. A Proposal for the Development of a Building Management System for Extending the Lifespan of Housing Complexes in Japan. Sustainability 2019, 11, 5622. [Google Scholar] [CrossRef] [Green Version]
- Hong Kong Government Buildings Department. Mandatory Building Inspection Scheme. Available online: https://www.bd.gov.hk/en/safety-inspection/mbis/index.html (accessed on 8 October 2021).
- Mohammadi, J. Building Facade Inspection Process: Administration and Management Matters. Pract. Period. Struct. Des. Constr. 2021, 26, 02521001. [Google Scholar] [CrossRef]
- BS EN 13187; Thermal Performance of Buildings. Qualitative Detection of Thermal Irregularities in Building Envelopes. Infrared Method. British Standards Institute: London, UK, 1999.
- Chew, M.Y.L.; De Silva, N. Factorial Method for Performance Assessment of Building Facades. J. Constr. Eng. Manag. 2004, 130, 525–533. [Google Scholar] [CrossRef]
- Lourenço, T.; Matias, L.; Faria, P. Anomaly Diagnosis in Ceramic Claddings by Thermography—A Review. In Proceedings of the 7th International Conference on Safety and Durability of Structures (ICOSADOS 2016), Vila Real, Portugal, 10–12 May 2016; pp. 1–8. [Google Scholar]
- Tran, Q.H.; Huh, J.; Kang, C.; Lee, B.Y.; Kim, I.-T.; Ahn, J.-H. Detectability of Subsurface Defects with Different Width-to-Depth Ratios in Concrete Structures Using Pulsed Thermography. J. Nondestruct. Eval. 2018, 37, 32. [Google Scholar] [CrossRef]
- Chew, M.Y.L. The Study of Adhesion Failure of Wall Tiles. Build. Environ. 1992, 27, 493–499. [Google Scholar] [CrossRef]
- Chew, M.Y.L.; Tan, S.S.; Kang, K.H. Contribution Analysis of Maintainability Factors for Cladding Facades. Archit. Sci. Rev. 2005, 48, 215–227. [Google Scholar] [CrossRef]
- Chew, M.Y.L.; Tan, S.S.; Kang, K.H. A Technical Evaluation Index for Curtain Wall and Cladding Facades. Struct. Surv. 2004, 22, 210–227. [Google Scholar] [CrossRef]
- Bauer, E.; de Freitas, V.P.; Mustelier, N.; Barreira, E.; de Freitas, S.S. Infrared Thermography—Evaluation of the Results Reproducibility. Struct. Surv. 2015, 33, 20–35. [Google Scholar] [CrossRef]
- El Masri, Y.; Rakha, T. A Scoping Review of Non-Destructive Testing (NDT) Techniques in Building Performance Diagnostic Inspections. Constr. Build. Mater. 2020, 265, 120542. [Google Scholar] [CrossRef]
- Dwivedi, S.K.; Vishwakarma, M.; Soni, P.A. Advances and Researches on Non Destructive Testing: A Review. Mater. Today Proc. 2018, 5, 3690–3698. [Google Scholar] [CrossRef]
- McCann, D.M.; Forde, M.C. Review of NDT Methods in the Assessment of Concrete and Masonry Structures. NDT E Int. 2001, 34, 71–84. [Google Scholar] [CrossRef]
- Omar, T.; Nehdi, M. Condition Assessment of Reinforced Concrete Bridges: Current Practice and Research Challenges. Infrastructures 2018, 3, 36. [Google Scholar] [CrossRef] [Green Version]
- National Academies of Sciences, Engineering, and Medicine. Nondestructive Testing to Identify Concrete Bridge Deck Deterioration; The National Academies Press: Washington, DC, USA, 2012. [Google Scholar] [CrossRef]
- Edis, E.; Flores-Colen, I.; De Brito, J. Building Thermography: Detection of Delamination of Adhered Ceramic Claddings Using the Passive Approach. J. Nondestruct. Eval. 2015, 34, 1–13. [Google Scholar] [CrossRef]
- Kylili, A.; Fokaides, P.A.; Christou, P.; Kalogirou, S.A. Infrared Thermography (IRT) Applications for Building Diagnostics: A Review. Appl. Energy 2014, 134, 531–549. [Google Scholar] [CrossRef]
- Garrido, I.; Lagüela, S.; Arias, P. Infrared Thermography’s Application to Infrastructure Inspections. Infrastructures 2018, 3, 35. [Google Scholar] [CrossRef] [Green Version]
- Usamentiaga, R.; Venegas, P.; Guerediaga, J.; Vega, L.; Molleda, J.; Bulnes, F.G. Infrared Thermography for Temperature Measurement and Non-Destructive Testing. Sensors 2014, 14, 12305–12348. [Google Scholar] [CrossRef] [PubMed] [Green Version]
- Pozzer, S.; Pravia, Z.M.C.; Rezazadeh Azar, E.; Dalla Rosa, F. Statistical Analysis of Favorable Conditions for Thermographic Inspection of Concrete Slabs. J. Civ. Struct. Health Monit. 2020, 10, 609–626. [Google Scholar] [CrossRef]
- Grinzato, E.; Ludwig, N.; Cadelano, G.; Bertucci, M.; Gargano, M.; Bison, P. Infrared Thermography for Moisture Detection: A Laboratory Study and in-Situ Test. Mater. Eval. 2011, 69, 97–104. [Google Scholar]
- ASTM C1153-10; Standard Practice for Location of Wet Insulation in Roofing Systems Using Infrared Imaging. ASTM Internatinal: West Conshohocken, PA, USA, 2015. [CrossRef]
- Barreira, E.; Almeida, R.M. Infrared Thermography for Building Moisture Inspection; Springer: Cham, Switzerland, 2019. [Google Scholar] [CrossRef]
- Garrido, I.; Solla, M.; Lagüela, S.; Fernández, N. IRT and GPR Techniques for Moisture Detection and Characterisation in Buildings. Sensors 2020, 20, 6421. [Google Scholar] [CrossRef]
- Ruiz Valero, L.; Flores Sasso, V.; Prieto Vicioso, E. In Situ Assessment of Superficial Moisture Condition in Façades of Historic Building Using Non-Destructive Techniques. Case Stud. Constr. Mater. 2019, 10, e00228. [Google Scholar] [CrossRef]
- Avdelidis, N.P.; Moropoulou, A.; Theoulakis, P. Detection of Water Deposits and Movement in Porous Materials by Infrared Imaging. Infrared Phys. Technol. 2003, 44, 183–190. [Google Scholar] [CrossRef]
- Barreira, E.; Almeida, R.M.S.F. Drying Evaluation Using Infrared Thermography. Energy Procedia 2015, 78, 170–175. [Google Scholar] [CrossRef] [Green Version]
- Fox, M.; Goodhew, S.; De Wilde, P. Building Defect Detection: External Versus Internal Thermography. Build. Environ. 2016, 105, 317–331. [Google Scholar] [CrossRef] [Green Version]
- ASTM C1060-11a; Standard Practice for Thermographic Inspection of Insulation Installations in Envelope Cavities of Frame Buildings. ASTM Internatinal: West Conshohocken, PA, USA, 2015. [CrossRef]
- Tejedor, B.; Barreira, E.; Almeida, R.M.S.F.; Casals, M. Thermographic 2d U-Value Map for Quantifying Thermal Bridges in Building Façades. Energy Build. 2020, 224, 110176. [Google Scholar] [CrossRef]
- Taylor, T.; Counsell, J.; Gill, S. Energy Efficiency Is More Than Skin Deep: Improving Construction Quality Control in New-Build Housing Using Thermography. Energy Build. 2013, 66, 222–231. [Google Scholar] [CrossRef]
- Ibarra-Castanedo, C.; Sfarra, S.; Klein, M.; Maldague, X. Solar Loading Thermography: Time-Lapsed Thermographic Survey and Advanced Thermographic Signal Processing for the Inspection of Civil Engineering and Cultural Heritage Structures. Infrared Phys. Technol. 2017, 82, 56–74. [Google Scholar] [CrossRef]
- Bauer, E.; Milhomem, P.M.; Aidar, L.A.G. Evaluating the Damage Degree of Cracking in Facades Using Infrared Thermography. J. Civ. Struct. Health Monit. 2018, 8, 517–528. [Google Scholar] [CrossRef]
- Jo, J.; Jadidi, Z. A High Precision Crack Classification System Using Multi-Layered Image Processing and Deep Belief Learning. Struct. Infrastruct. Eng. 2020, 16, 297–305. [Google Scholar] [CrossRef]
- Aggelis, D.G.; Kordatos, E.Z.; Strantza, M.; Soulioti, D.V.; Matikas, T.E. NDT Approach for Characterization of Subsurface Cracks in Concrete. Constr. Build. Mater. 2011, 25, 3089–3097. [Google Scholar] [CrossRef]
- Dufour, M.B.; Derome, D.; Zmeureanu, R. Analysis of Thermograms for the Estimation of Dimensions of Cracks in Building Envelope. Infrared Phys. Technol. 2009, 52, 70–78. [Google Scholar] [CrossRef]
- Barreira, E.; Almeida, R.M.S.F.; Moreira, M. An Infrared Thermography Passive Approach to Assess the Effect of Leakage Points in Buildings. Energy Build. 2017, 140, 224–235. [Google Scholar] [CrossRef]
- Lerma, J.L.; Cabrelles, M.; Portalés, C. Multitemporal Thermal Analysis to Detect Moisture on a Building Façade. Constr. Build. Mater. 2011, 25, 2190–2197. [Google Scholar] [CrossRef]
- Moropoulou, A.; Avdelidis, N.; Karoglou, M.; Delegou, E.; Alexakis, E.; Keramidas, V. Multispectral Applications of Infrared Thermography in the Diagnosis and Protection of Built Cultural Heritage. Appl. Sci. 2018, 8, 284. [Google Scholar] [CrossRef]
- Theodorakeas, P.; Avdelidis, N.P.; Cheilakou, E.; Koui, M. Quantitative Analysis of Plastered Mosaics by Means of Active Infrared Thermography. Constr. Build. Mater. 2014, 73, 417–425. [Google Scholar] [CrossRef]
- Yousefi, B.; Sfarra, S.; Ibarra-Castanedo, C.; Avdelidis, N.P.; Maldague, X.P.V. Thermography Data Fusion and Nonnegative Matrix Factorization for the Evaluation of Cultural Heritage Objects and Buildings. J. Therm. Anal. Calorim. 2018, 136, 943–955. [Google Scholar] [CrossRef] [Green Version]
- Sfarra, S.; Yao, Y.; Zhang, H.; Perilli, S.; Scozzafava, M.; Avdelidis, N.P.; Maldague, X.P.V. Precious Walls Built in Indoor Environments Inspected Numerically and Experimentally within Long-Wave Infrared (Lwir) and Radio Regions. J. Therm. Anal. Calorim. 2019, 137, 1083–1111. [Google Scholar] [CrossRef]
- ASTM D4788-03; Standard Test Method for Detecting Delaminations in Bridge Decks Using Infrared Thermography. ASTM Internatinal: West Conshohocken, PA, USA, 2013. [CrossRef]
- Residential Energy Services Network. Resnet Interim Guidelines for Thermographic Inspections of Buildings; Residential Energy Services Network: Oceanside, CA, USA, 2010. [Google Scholar]
- Rumbayan, R.; Washer, G.A. Modeling of Environmental Effects on Thermal Detection of Subsurface Damage in Concrete. Res. Nondestruct. Eval. 2014, 25, 235–252. [Google Scholar] [CrossRef]
- Kirimtat, A.; Krejcar, O. A Review of Infrared Thermography for the Investigation of Building Envelopes: Advances and Prospects. Energy Build. 2018, 176, 390–406. [Google Scholar] [CrossRef]
- Milovanović, B.; Banjad Pečur, I. Review of Active IR Thermography for Detection and Characterization of Defects in Reinforced Concrete. J. Imaging 2016, 2, 11. [Google Scholar] [CrossRef]
- Du, B.; He, Y.; He, Y.; Zhang, C. Progress and Trends in Fault Diagnosis for Renewable and Sustainable Energy System Based on Infrared Thermography: A Review. Infrared Phys. Technol. 2020, 109, 103383. [Google Scholar] [CrossRef]
- Lehmann, B.; Ghazi Wakili, K.; Frank, T.; Vera Collado, B.; Tanner, C. Effects of Individual Climatic Parameters on the Infrared Thermography of Buildings. Appl. Energy 2013, 110, 29–43. [Google Scholar] [CrossRef]
- Meola, C. Infrared Thermography of Masonry Structures. Infrared Phys. Technol. 2007, 49, 228–233. [Google Scholar] [CrossRef]
- Garrido, I.; Lagüela, S.; Otero, R.; Arias, P. Thermographic Methodologies Used in Infrastructure Inspection: A Review—Data Acquisition Procedures. Infrared Phys. Technol. 2020, 111, 103481. [Google Scholar] [CrossRef]
- Mac, V.H.; Tran, Q.H.; Huh, J.; Doan, N.S.; Kang, C.; Han, D. Detection of Delamination with Various Width-to-Depth Ratios in Concrete Bridge Deck Using Passive IRT: Limits and Applicability. Materials 2019, 12, 3996. [Google Scholar] [CrossRef] [Green Version]
- Lahiri, B.B.; Bagavathiappan, S.; Jayakumar, T.; Philip, J. Medical Applications of Infrared Thermography: A Review. Infrared Phys. Technol. 2012, 55, 221–235. [Google Scholar] [CrossRef] [PubMed]
- Ciampa, F.; Mahmoodi, P.; Pinto, F.; Meo, M. Recent Advances in Active Infrared Thermography for Non-Destructive Testing of Aerospace Components. Sensors 2018, 18, 609. [Google Scholar] [CrossRef] [PubMed] [Green Version]
- Li, L.; Zhang, Q.; Huang, D. A Review of Imaging Techniques for Plant Phenotyping. Sensors 2014, 14, 20078–20111. [Google Scholar] [CrossRef] [PubMed]
- Bagavathiappan, S.; Lahiri, B.B.; Saravanan, T.; Philip, J.; Jayakumar, T. Infrared Thermography for Condition Monitoring—A Review. Infrared Phys. Technol. 2013, 60, 35–55. [Google Scholar] [CrossRef]
- Sarawade, A.A.; Charniya, N.N. Infrared Thermography and Its Applications: A Review. In Proceedings of the International Conference on Communication and Electronics Systems (ICCES), Coimbatore, India, 15–16 October 2018; pp. 280–285. [Google Scholar] [CrossRef]
- Alfredo Osornio-Rios, R.; Antonino-Daviu, J.A.; de Jesus Romero-Troncoso, R. Recent Industrial Applications of Infrared Thermography: A Review. IEEE Trans. Ind. Inform. 2019, 15, 615–625. [Google Scholar] [CrossRef]
- Doshvarpassand, S.; Wu, C.; Wang, X. An Overview of Corrosion Defect Characterization Using Active Infrared Thermography. Infrared Phys. Technol. 2019, 96, 366–389. [Google Scholar] [CrossRef]
- Gallardo-Saavedra, S.; Hernández-Callejo, L.; Duque-Perez, O. Technological Review of the Instrumentation Used in Aerial Thermographic Inspection of Photovoltaic Plants. Renew. Sustain. Energy Rev. 2018, 93, 566–579. [Google Scholar] [CrossRef]
- Yumnam, M.; Gupta, H.; Ghosh, D.; Jaganathan, J. Inspection of Concrete Structures Externally Reinforced with Frp Composites Using Active Infrared Thermography: A Review. Constr. Build. Mater. 2021, 310, 125265. [Google Scholar] [CrossRef]
- Yang, R.; He, Y. Optically and Non-Optically Excited Thermography for Composites: A Review. Infrared Phys. Technol. 2016, 75, 26–50. [Google Scholar] [CrossRef]
- Vergani, L.; Colombo, C.; Libonati, F. A Review of Thermographic Techniques for Damage Investigation in Composites. Frat. Ed Integritá Strutt. 2013, 8, 1–12. [Google Scholar] [CrossRef] [Green Version]
- Mercuri, F.; Orazi, N.; Paoloni, S.; Cicero, C.; Zammit, U. Pulsed Thermography Applied to the Study of Cultural Heritage. Appl. Sci. 2017, 7, 1010. [Google Scholar] [CrossRef]
- Orazi, N. The Study of Artistic Bronzes by Infrared Thermography: A Review. J. Cult. Herit. 2020, 42, 280–289. [Google Scholar] [CrossRef]
- Lucchi, E. Applications of the Infrared Thermography in the Energy Audit of Buildings: A Review. Renew. Sustain. Energy Rev. 2018, 82, 3077–3090. [Google Scholar] [CrossRef]
- Nardi, I.; Lucchi, E.; de Rubeis, T.; Ambrosini, D. Quantification of Heat Energy Losses through the Building Envelope: A State-of-the-art Analysis with Critical and Comprehensive Review on Infrared Thermography. Build. Environ. 2018, 146, 190–205. [Google Scholar] [CrossRef] [Green Version]
- Bienvenido-Huertas, D.; Moyano, J.; Marín, D.; Fresco-Contreras, R. Review of in Situ Methods for Assessing the Thermal Transmittance of Walls. Renew. Sustain. Energy Rev. 2019, 102, 356–371. [Google Scholar] [CrossRef]
- Sirca, G.F., Jr.; Adeli, H. Infrared Thermography for Detecting Defects in Concrete Structures. J. Civ. Eng. Manag. 2018, 24, 508–515. [Google Scholar] [CrossRef]
- Garrido, I.; Lagüela, S.; Otero, R.; Arias, P. Thermographic Methodologies Used in Infrastructure Inspection: A Review—Post-Processing Procedures. Appl. Energy 2020, 266, 114857. [Google Scholar] [CrossRef]
- Fox, M.; Coley, D.; Goodhew, S.; de Wilde, P. Thermography Methodologies for Detecting Energy Related Building Defects. Renew. Sustain. Energy Rev. 2014, 40, 296–310. [Google Scholar] [CrossRef] [Green Version]
- FLIR. User’s Manual, Flir Ex Series. Available online: https://www.flir-direct.com/pdfs/cache/www.flir-direct.com/e5/manual/e5-manual.pdf (accessed on 8 October 2021).
- Fokaides, P.A.; Kalogirou, S.A. Application of Infrared Thermography for the Determination of the Overall Heat Transfer Coefficient (U-Value) in Building Envelopes. Appl. Energy 2011, 88, 4358–4365. [Google Scholar] [CrossRef]
- Avdelidis, N.P.; Moropoulou, A. Emissivity Considerations in Building Thermography. Energy Build. 2003, 35, 663–667. [Google Scholar] [CrossRef]
- Walker, N.J. Infrared Thermography Handbook—Volume 1. Principles and Practice; The British Institute of Non-Destructive Testing: Northampton, UK, 2004. [Google Scholar]
- Lo, T.Y.; Choi, K.T.W. Building Defects Diagnosis by Infrared Thermography. Struct. Surv. 2004, 22, 259–263. [Google Scholar] [CrossRef]
- Zhang, H.; Yang, R.; He, Y.; Foudazi, A.; Cheng, L.; Tian, G. A Review of Microwave Thermography Nondestructive Testing and Evaluation. Sensors 2017, 17, 1123. [Google Scholar] [CrossRef] [PubMed]
- Cotič, P.; Kolarič, D.; Bosiljkov, V.; Bosiljkov, V.B.; Jagličić, Z. Determination of the Applicability and Limits of Void and Delamination Detection in Concrete Structures Using Infrared Thermography. NDT E Int. 2015, 74, 87–93. [Google Scholar] [CrossRef]
- BS ISO 9869-2; Thermal Insulation. Building Elements. In-Situ Measurement of Thermal Resistance and Thermal Transmittance, Part 2: Infrared Method for Frame Structure Dwelling. British Standards Institute: London, UK, 2018.
- Biddulph, P.; Gori, V.; Elwell, C.A.; Scott, C.; Rye, C.; Lowe, R.; Oreszczyn, T. Inferring the Thermal Resistance and Effective Thermal Mass of a Wall Using Frequent Temperature and Heat Flux Measurements. Energy Build. 2014, 78, 10–16. [Google Scholar] [CrossRef] [Green Version]
- Huh, J.; Mac, V.; Tran, Q.; Lee, K.-Y.; Lee, J.-I.; Kang, C. Detectability of Delamination in Concrete Structure Using Active Infrared Thermography in Terms of Signal-to-Noise Ratio. Appl. Sci. 2018, 8, 1986. [Google Scholar] [CrossRef] [Green Version]
- Barreira, E.; Almeida, R.M.S.F.; Simões, M.L.; Rebelo, D. Quantitative Infrared Thermography to Evaluate the Humidification of Lightweight Concrete. Sensors 2020, 20, 1664. [Google Scholar] [CrossRef] [Green Version]
- Washer, G.; Fenwick, R.; Bolleni, N. Development of Hand-Held Thermographic Inspection Technologies; OR10-007; Department of Transportation: Jefferson City, MO, USA, 2009. [Google Scholar]
- Hiasa, S.; Birgul, R.; Catbas, F.N. Effect of Defect Size on Subsurface Defect Detectability and Defect Depth Estimation for Concrete Structures by Infrared Thermography. J. Nondestruct. Eval. 2017, 36, 1–21. [Google Scholar] [CrossRef]
- Kee, S.-H.; Oh, T.; Popovics, J.S.; Arndt, R.W.; Zhu, J. Nondestructive Bridge Deck Testing with Air-Coupled Impact-Echo and Infrared Thermography. J. Bridge Eng. 2012, 17, 928–939. [Google Scholar] [CrossRef]
- Hiasa, S.; Birgul, R.; Matsumoto, M.; Necati Catbas, F. Experimental and Numerical Studies for Suitable Infrared Thermography Implementation on Concrete Bridge Decks. Measurement 2018, 121, 144–159. [Google Scholar] [CrossRef]
- Qu, Z.; Jiang, P.; Zhang, W. Development and Application of Infrared Thermography Non-Destructive Testing Techniques. Sensors 2020, 20, 3851. [Google Scholar] [CrossRef] [PubMed]
- Omar, T.; Nehdi, M.L.; Zayed, T. Infrared Thermography Model for Automated Detection of Delamination in RC Bridge Decks. Constr. Build. Mater. 2018, 168, 313–327. [Google Scholar] [CrossRef]
- Balaras, C.A.; Argiriou, A.A. Infrared Thermography for Building Diagnostics. Energy Build. 2002, 34, 171–183. [Google Scholar] [CrossRef]
- Cheng, C.; Na, R.; Shen, Z. Thermographic Laplacian-Pyramid Filtering to Enhance Delamination Detection in Concrete Structure. Infrared Phys. Technol. 2019, 97, 162–176. [Google Scholar] [CrossRef] [Green Version]
- Clark, M.R.; McCann, D.M.; Forde, M.C. Application of Infrared Thermography to the Non-Destructive Testing of Concrete and Masonry Bridges. NDT E Int. 2003, 36, 265–275. [Google Scholar] [CrossRef]
- Japan Building and Equipment Long-Life Cycle Association. Periodic Inspection Manual for Exterior Tile Wall and Plaster Wall (Engl. Transl.), 3rd ed.; BELCA: Tokyo, Japan, 2009. [Google Scholar]
- Edis, E.; Flores-Colen, I.; de Brito, J. Passive Thermographic Inspection of Adhered Ceramic Claddings: Limitation and Conditioning Factors. J. Perform. Constr. Facil. 2013, 27, 737–747. [Google Scholar] [CrossRef]
- Rao, D.P. Infrared Thermography and Its Applications in Civil Engineering. Indian Concr. J. 2008, 82, 41–50. [Google Scholar]
- BS EN ISO 6781-3; Performance of Buildings—Detection of Heat, Air and Moisture Irregularities in Buildings by Infrared Methods—Part 3: Qualifications of Equipment Operators, Data Analysts and Report Writers. British Standards Institute: London, UK, 2015.
- Washer, G.; Fenwick, R.; Nelson, S.; Rumbayan, R. Guidelines for Thermographic Inspection of Concrete Bridge Components in Shaded Conditions. Transp. Res. Rec. 2013, 2360, 13–20. [Google Scholar] [CrossRef]
- Janků, M.; Březina, I.; Grošek, J. Use of Infrared Thermography to Detect Defects on Concrete Bridges. Procedia Eng. 2017, 190, 62–69. [Google Scholar] [CrossRef]
- Farrag, S.; Yehia, S.; Qaddoumi, N. Investigation of Mix-Variation Effect on Defect-Detection Ability Using Infrared Thermography as a Nondestructive Evaluation Technique. J. Bridge Eng. 2016, 21, 4015055. [Google Scholar] [CrossRef]
- Rocha, J.H.A.; Póvoas, Y.V.; Santos, C.F. Detection of Delaminations in Sunlight-Unexposed Concrete Elements of Bridges Using Infrared Thermography. J. Nondestruct. Eval. 2018, 38, 8. [Google Scholar] [CrossRef]
- Oh, T.; Kee, S.-H.; Arndt, R.W.; Popovics, J.S.; Zhu, J. Comparison of NDT Methods for Assessment of a Concrete Bridge Deck. J. Eng. Mech. 2013, 139, 305–314. [Google Scholar] [CrossRef]
- Garrido, I.; Lagüela, S.; Sfarra, S.; Madruga, F.J.; Arias, P. Automatic Detection of Moistures in Different Construction Materials from Thermographic Images. J. Therm. Anal. Calorim. 2019, 138, 1649–1668. [Google Scholar] [CrossRef]
- Omar, T.; Nehdi, M.L. Remote Sensing of Concrete Bridge Decks Using Unmanned Aerial Vehicle Infrared Thermography. Autom. Constr. 2017, 83, 360–371. [Google Scholar] [CrossRef]
- Park, G.; Lee, M.; Jang, H.; Kim, C. Thermal Anomaly Detection in Walls via CNN-Based Segmentation. Autom. Constr. 2021, 125, 103627. [Google Scholar] [CrossRef]
- Cheng, C.; Shang, Z.; Shen, Z. Bridge Deck Delamination Segmentation Based on Aerial Thermography through Regularized Grayscale Morphological Reconstruction and Gradient Statistics. Infrared Phys. Technol. 2019, 98, 240–249. [Google Scholar] [CrossRef] [Green Version]
- Lai, W.W.-L.; Lee, K.-K.; Poon, C.-S. Validation of Size Estimation of Debonds in External Wall’s Composite Finishes Via Passive Infrared Thermography and a Gradient Algorithm. Constr. Build. Mater. 2015, 87, 113–124. [Google Scholar] [CrossRef]
- Cheng, C.; Shen, Z. The Application of Gray-Scale Level-Set Method in Segmentation of Concrete Deck Delamination Using Infrared Images. Constr. Build. Mater. 2020, 240, 117974. [Google Scholar] [CrossRef]
- Edis, E.; Flores-Colen, I.; De Brito, J. Time-Dependent Passive Building Thermography for Detecting Delamination of Adhered Ceramic Cladding. J. Nondestruct. Eval. 2015, 34, 1–16. [Google Scholar] [CrossRef]
- Milovanović, B.; Banjad Pečur, I.; Štirmer, N. The Methodology for Defect Quantification in Concrete Using Ir Thermography. J. Civ. Eng. Manag. 2017, 23, 573–582. [Google Scholar] [CrossRef]
- Marinetti, S.; Grinzato, E.; Bison, P.G.; Bozzi, E.; Chimenti, M.; Pieri, G.; Salvetti, O. Statistical Analysis of IR Thermographic Sequences by PCA. Infrared Phys. Technol. 2004, 46, 85–91. [Google Scholar] [CrossRef]
- Krankenhagen, R.; Maierhofer, C. Pulse Phase Thermography for Characterising Large Historical Building Façades after Solar Heating and Shadow Cast—A Case Study. Quant. InfraRed Thermogr. J. 2014, 11, 10–28. [Google Scholar] [CrossRef]
- Marinetti, S.; Finesso, L.; Marsilio, E. Matrix Factorization Methods: Application to Thermal NDT/E. NDT E Int. 2006, 39, 611–616. [Google Scholar] [CrossRef]
- Al Gharawi, M.; Adu-Gyamfi, Y.; Washer, G. A Framework for Automated Time-Lapse Thermography Data Processing. Constr. Build. Mater. 2019, 227, 116507. [Google Scholar] [CrossRef]
- Japan Public Works Research Institute. Inspection Manual for Prevention of Delamination and Spalling on Concrete Infrastructure by Infrared Thermography (Engl. Transl.); Japan Public Works Research Institute: Tokyo, Japan, 2005.
- NDIS 3428; Non-Destructive Testing Method for Evaluation of Defects and Deteriorations in Surface Layer of Buildings and Structures by Infrared Thermography. Standard of the Japanese Society for Non-Destructive Inspection (NDIS): Tokyo, Japan, 2009.
- Singleton, F. The Beaufort Scale of Winds—Its Relevance, and Its Use by Sailors. Weather 2008, 63, 37–41. [Google Scholar] [CrossRef]
- ASTM E1543-14; Standard Practice for Noise Equivalent Temperature Difference of Thermal Imaging Systems. ASTM Internatinal: West Conshohocken, PA, USA, 2018. [CrossRef]
- Xie, C.; Hazzard, E. Infrared Imaging for Inquiry-Based Learning. Phys. Teach. 2011, 49, 368–372. [Google Scholar] [CrossRef] [Green Version]
- Kashif Ur Rehman, S.; Ibrahim, Z.; Memon, S.A.; Jameel, M. Nondestructive Test Methods for Concrete Bridges: A Review. Constr. Build. Mater. 2016, 107, 58–86. [Google Scholar] [CrossRef] [Green Version]
- ACI Committee 228. ACI PRC-228.2-13 Report on Nondestructive Test Methods for Evaluation of Concrete in Structures; American Concrete Institute: Farmington Hills, MI, USA, 2013. [Google Scholar]
- ASTM D4580/D4580M-12(2018); Standard Practice for Measuring Delaminations in Concrete Bridge Decks by Sounding. ASTM Internatinal: West Conshohocken, PA, USA, 2018. [CrossRef]
- Skłodowski, R.; Drdácký, M.; Skłodowski, M. Identifying Subsurface Detachment Defects by Acoustic Tracing. NDT E Int. 2013, 56, 56–64. [Google Scholar] [CrossRef]
- Lin, S.; Meng, D.; Choi, H.; Shams, S.; Azari, H. Laboratory Assessment of Nine Methods for Nondestructive Evaluation of Concrete Bridge Decks with Overlays. Constr. Build. Mater. 2018, 188, 966–982. [Google Scholar] [CrossRef]
- Dorafshan, S.; Azari, H. Evaluation of Bridge Decks with Overlays Using Impact Echo, a Deep Learning Approach. Autom. Constr. 2020, 113, 103133. [Google Scholar] [CrossRef]
- Lagüela, S.; Solla, M.; Puente, I.; Prego, F.J. Joint Use of GPR, IRT and TLS Techniques for the Integral Damage Detection in Paving. Constr. Build. Mater. 2018, 174, 749–760. [Google Scholar] [CrossRef]
- Sultan, A.A.; Washer, G.A. Comparison of Two Nondestructive Evaluation Technologies for the Condition Assessment of Bridge Decks. Transp. Res. Rec. 2018, 2672, 113–122. [Google Scholar] [CrossRef]
- Dinh, K.; Gucunski, N. Factors Affecting the Detectability of Concrete Delamination in GPR Images. Constr. Build. Mater. 2021, 274, 121837. [Google Scholar] [CrossRef]
- Vaghefi, K.; Ahlborn, T.M.; Harris, D.K.; Brooks, C.N. Combined Imaging Technologies for Concrete Bridge Deck Condition Assessment. J. Perform. Constr. Facil. 2015, 29, 04014102. [Google Scholar] [CrossRef]
- Yehia, S.; Abudayyeh, O.; Nabulsi, S.; Abdelqader, I. Detection of Common Defects in Concrete Bridge Decks Using Nondestructive Evaluation Techniques. J. Bridge Eng. 2007, 12, 215–225. [Google Scholar] [CrossRef]
- Cheng, C.-C.; Cheng, T.-M.; Chiang, C.-H. Defect Detection of Concrete Structures Using Both Infrared Thermography and Elastic Waves. Autom. Constr. 2008, 18, 87–92. [Google Scholar] [CrossRef]
- Khan, F.; Bartoli, I. Detection of Delamination in Concrete Slabs Combining Infrared Thermography and Impact Echo Techniques: A Comparative Experimental Study. In Proceedings of the Structural Health Monitoring and Inspection of Advanced Materials, Aerospace, and Civil Infrastructure, San Diego, CA, USA, 8–12 March 2015; pp. 94370I-1–94370I-11. [Google Scholar] [CrossRef]
- Janků, M.; Cikrle, P.; Grošek, J.; Anton, O.; Stryk, J. Comparison of Infrared Thermography, Ground-Penetrating Radar and Ultrasonic Pulse Echo for Detecting Delaminations in Concrete Bridges. Constr. Build. Mater. 2019, 225, 1098–1111. [Google Scholar] [CrossRef]
- Cotič, P.; Jagličić, Z.; Niederleithinger, E.; Stoppel, M.; Bosiljkov, V. Image Fusion for Improved Detection of near-Surface Defects in NDT-Ce Using Unsupervised Clustering Methods. J. Nondestruct. Eval. 2014, 33, 384–397. [Google Scholar] [CrossRef]
- Chew, M.Y.L. Assessing Building Façades Using Infra-Red Thermography. Struct. Surv. 1998, 16, 81–86. [Google Scholar] [CrossRef]
- Maierhofer, C.; Brink, A.; Röllig, M.; Wiggenhauser, H. Transient Thermography for Structural Investigation of Concrete and Composites in the near Surface Region. Infrared Phys. Technol. 2002, 43, 271–278. [Google Scholar] [CrossRef]
- Maierhofer, C.; Wiggenhauser, H.; Brink, A.; Röllig, M. Quantitative Numerical Analysis of Transient IR-Experiments on Buildings. Infrared Phys. Technol. 2004, 46, 173–180. [Google Scholar] [CrossRef]
- Maierhofer, C.; Brink, A.; Röllig, M.; Wiggenhauser, H. Quantitative Impulse-Thermography as Non-Destructive Testing Method in Civil Engineering—Experimental Results and Numerical Simulations. Constr. Build. Mater. 2005, 19, 731–737. [Google Scholar] [CrossRef]
- Meola, C.; Di Maio, R.; Roberti, N.; Carlomagno, G.M. Application of Infrared Thermography and Geophysical Methods for Defect Detection in Architectural Structures. Eng. Fail. Anal. 2005, 12, 875–892. [Google Scholar] [CrossRef]
- Maierhofer, C.; Arndt, R.; Röllig, M.; Rieck, C.; Walther, A.; Scheel, H.; Hillemeier, B. Application of Impulse-Thermography for Non-Destructive Assessment of Concrete Structures. Cem. Concr. Compos. 2006, 28, 393–401. [Google Scholar] [CrossRef]
- Maierhofer, C.; Arndt, R.; Röllig, M. Influence of Concrete Properties on the Detection of Voids with Impulse-Thermography. Infrared Phys. Technol. 2007, 49, 213–217. [Google Scholar] [CrossRef]
- Washer, G.; Fenwick, R.; Bolleni, N.; Harper, J. Effects of Environmental Variables on Infrared Imaging of Subsurface Features of Concrete Bridges. Transp. Res. Rec. 2009, 2108, 107–114. [Google Scholar] [CrossRef]
- Washer, G.; Fenwick, R.; Bolleni, N. Effects of Solar Loading on Infrared Imaging of Subsurface Features in Concrete. J. Bridge Eng. 2010, 15, 384–390. [Google Scholar] [CrossRef]
- Washer, G.; Bolleni, N.; Fenwick, R. Thermographic Imaging of Subsurface Deterioration in Concrete Bridges. Transp. Res. Rec. 2010, 2201, 27–33. [Google Scholar] [CrossRef]
- Scott, M.; Luttig, H.; Strydom, M.; Gonelli, M.; Kruger, D.; Rankine, R.; Broodryk, T. Passive Infrared Thermography as a Diagnostic Tool in Civil Engineering Structural Material Health Monitoring. In Proceedings of the Concrete Repair, Rehabilitation and Retrofitting III: 3rd International Conference on Concrete Repair, Rehabilitation and Retrofitting, Cape Town, South Africa, 3–5 September 2012; p. 274. [Google Scholar]
- de Freitas, S.S.; de Freitas, V.P.; Barreira, E. Detection of Façade Plaster Detachments Using Infrared Thermography—A Nondestructive Technique. Constr. Build. Mater. 2014, 70, 80–87. [Google Scholar] [CrossRef]
- Scott, M.; Kruger, D. Infrared Thermography as a Diagnostic Tool for Subsurface Assessments of Concrete Structures. In Construction Materials and Structures; IOS Press: Amsterdam, The Netherlands, 2014; pp. 904–909. [Google Scholar] [CrossRef]
- Alfredo-Cruz, R.; Quintero-Ortiz, L.A.; Galán-Pinilla, C.A.; Espinosa-García, E.J. Non-Destructive Techniques in Concrete Elements for Bridges’ Evalutation. Rev. Fac. De Ing. 2015, 24, 81. [Google Scholar] [CrossRef] [Green Version]
- Khan, F.; Bolhassani, M.; Kontsos, A.; Hamid, A.; Bartoli, I. Modeling and Experimental Implementation of Infrared Thermography on Concrete Masonry Structures. Infrared Phys. Technol. 2015, 69, 228–237. [Google Scholar] [CrossRef]
- Watase, A.; Birgul, R.; Hiasa, S.; Matsumoto, M.; Mitani, K.; Catbas, F.N. Practical Identification of Favorable Time Windows for Infrared Thermography for Concrete Bridge Evaluation. Constr. Build. Mater. 2015, 101, 1016–1030. [Google Scholar] [CrossRef]
- Bauer, E.; Pavón, E.; Pereira, C.H.F.; Nascimento, M.L.M. Criteria for Identification of Ceramic Detachments in Building Facades with Infrared Thermography. In Recent Developments in Building Diagnosis Techniques; Delgado, J.M.P.Q., Ed.; Springer: Singapore, 2016; pp. 51–68. [Google Scholar] [CrossRef]
- Bauer, E.; Pavón, E.; Barreira, E.; Kraus De Castro, E. Analysis of Building Facade Defects Using Infrared Thermography: Laboratory Studies. J. Build. Eng. 2016, 6, 93–104. [Google Scholar] [CrossRef]
- Ellenberg, A.; Kontsos, A.; Moon, F.; Bartoli, I. Bridge Deck Delamination Identification from Unmanned Aerial Vehicle Infrared Imagery. Autom. Constr. 2016, 72, 155–165. [Google Scholar] [CrossRef]
- Hiasa, S.; Birgul, R.; Catbas, F.N. Infrared Thermography for Civil Structural Assessment: Demonstrations with Laboratory and Field Studies. J. Civ. Struct. Health Monit. 2016, 6, 619–636. [Google Scholar] [CrossRef]
- Huh, J.; Tran, Q.H.; Lee, J.-H.; Han, D.; Ahn, J.-H.; Yim, S. Experimental Study on Detection of Deterioration in Concrete Using Infrared Thermography Technique. Adv. Mater. Sci. Eng. 2016, 2016, 1053856. [Google Scholar] [CrossRef] [Green Version]
- Chiang, L.-W.; Guo, S.-J. The Research of Infrared Thermal Image Diagnostic Model for Building External Wall Tiles. Adv. Technol. Innov. 2017, 2, 56–60. [Google Scholar]
- Hiasa, S.; Birgul, R.; Catbas, F.N. Investigation of Effective Utilization of Infrared Thermography (IRT) through Advanced Finite Element Modeling. Constr. Build. Mater. 2017, 150, 295–309. [Google Scholar] [CrossRef]
- Hiasa, S.; Necati Catbas, F.; Matsumoto, M.; Mitani, K. Considerations and Issues in the Utilization of Infrared Thermography for Concrete Bridge Inspection at Normal Driving Speeds. J. Bridge Eng. 2017, 22, 4017101. [Google Scholar] [CrossRef]
- Hiasa, S.; Catbas, F.N.; Matsumoto, M.; Mitani, K. Monitoring Concrete Bridge Decks Using Infrared Thermography with High Speed Vehicles. Struct. Monit. Maint. 2016, 3, 277–296. [Google Scholar] [CrossRef]
- Lourenço, T.; Matias, L.; Faria, P. Anomalies Detection in Adhesive Wall Tiling Systems by Infrared Thermography. Constr. Build. Mater. 2017, 148, 419–428. [Google Scholar] [CrossRef]
- Sultan, A.A.; Washer, G. A Pixel-by-Pixel Reliability Analysis of Infrared Thermography (IRT) for the Detection of Subsurface Delamination. NDT E Int. 2017, 92, 177–186. [Google Scholar] [CrossRef]
- Tran, Q.H.; Han, D.; Kang, C.; Haldar, A.; Huh, J. Effects of Ambient Temperature and Relative Humidity on Subsurface Defect Detection in Concrete Structures by Active Thermal Imaging. Sensors 2017, 17, 1718. [Google Scholar] [CrossRef]
- Escobar-Wolf, R.; Oommen, T.; Brooks, C.N.; Dobson, R.J.; Ahlborn, T.M. Unmanned Aerial Vehicle (UAV)-Based Assessment of Concrete Bridge Deck Delamination Using Thermal and Visible Camera Sensors: A Preliminary Analysis. Res. Nondestruct. Eval. 2018, 29, 183–198. [Google Scholar] [CrossRef]
- Güray, E.; Birgül, R. Determination of Favorable Time Window for Infrared Inspection by Numerical Simulation of Heat Propagation in Concrete. In Proceedings of the 3rd International Sustainable Buildings Symposium, Dubai, United Arab Emirates, 15–17 March 2018; pp. 577–591. [Google Scholar] [CrossRef]
- Tran, Q.H.; Huh, J.; Mac, V.H.; Kang, C.; Han, D. Effects of Rebars on the Detectability of Subsurface Defects in Concrete Bridges Using Square Pulse Thermography. NDT E Int. 2018, 100, 92–100. [Google Scholar] [CrossRef]
- Vyas, V.; Patil, V.J.; Singh, A.P.; Srivastava, A. Application of Infrared Thermography for Debonding Detection in Asphalt Pavements. J. Civ. Struct. Health Monit. 2019, 9, 325–337. [Google Scholar] [CrossRef]
- Milovanovic, B.; Gasi, M.; Gumbarevic, S. Principal Component Thermography for Defect Detection in Concrete. Sensors 2020, 20, 3891. [Google Scholar] [CrossRef]
- Raja, B.N.K.; Miramini, S.; Duffield, C.; Sofi, M.; Mendis, P.; Zhang, L. The Influence of Ambient Environmental Conditions in Detecting Bridge Concrete Deck Delamination Using Infrared Thermography (IRT). Struct. Control. Health Monit. 2020, 27, e2506. [Google Scholar] [CrossRef]
- Cheng, C.; Shen, Z. Semi Real-Time Detection of Subsurface Consolidation Defects During Concrete Curing Stage. Constr. Build. Mater. 2021, 270, 121489. [Google Scholar] [CrossRef]
- Mac, V.H.; Huh, J.; Doan, N.S.; Lee, B.Y.; Haldar, A. A Comprehensive Study on Identification of Both Deck and Soffit Defects in Concrete Bridge Decks through Thermographic Investigation of Shaded Side under Natural Conditions. Constr. Build. Mater. 2021, 303, 124452. [Google Scholar] [CrossRef]
- Pozzer, S.; Dalla Rosa, F.; Pravia, Z.M.C.; Rezazadeh Azar, E.; Maldague, X. Long-Term Numerical Analysis of Subsurface Delamination Detection in Concrete Slabs Via Infrared Thermography. Appl. Sci. 2021, 11, 4323. [Google Scholar] [CrossRef]
- Zheng, D.; Tan, S.; Li, X.; Cai, H. Research on the Infrared Thermographic Detection of Concrete under Solar Heating. Adv. Civ. Eng. 2021, 2021, 6692729. [Google Scholar] [CrossRef]
- Edis, E.; Flores-Colen, I.; de Brito, J. Quasi-Quantitative Infrared Thermographic Detection of Moisture Variation in Facades with Adhered Ceramic Cladding Using Principal Component Analysis. Build. Environ. 2015, 94, 97–108. [Google Scholar] [CrossRef]
- Li, Z.; Yao, W.; Lee, S.; Lee, C.; Yang, Z. Application of Infrared Thermography Technique in Building Finish Evaluation. J. Nondestruct. Eval. 2000, 19, 11–19. [Google Scholar] [CrossRef]
- Barreira, E.; Almeida, R.M.S.F.; Delgado, J.M.P.Q. Infrared Thermography for Assessing Moisture Related Phenomena in Building Components. Constr. Build. Mater. 2016, 110, 251–269. [Google Scholar] [CrossRef]
- Kumar, S.; Mullick, S.C. Wind Heat Transfer Coefficient in Solar Collectors in Outdoor Conditions. Sol. Energy 2010, 84, 956–963. [Google Scholar] [CrossRef]
- Zhang, J.; Gupta, A.; Baker, J. Effect of Relative Humidity on the Prediction of Natural Convection Heat Transfer Coefficients. Heat Transf. Eng. 2007, 28, 335–342. [Google Scholar] [CrossRef]
- Washer, G.A.; Fuchs, P.A. Developments in the Use of Infrared Thermography for the Condition Assessment of Concrete. In Proceedings of the International Symposium Non-Destructive Testing in Civil Engineering, Berlin, Germany, 15–17 September 2015. [Google Scholar]
- SS EN 1992-1-1; Eurocode 2: Design of Concrete Structures, Part 1-1 General Rules and Rules for Buildings. Singapore Standards Council: Singapore, 2008.
- American Association of State Highway and Transportation Officials (AASHTO). Aashto Guide Manual for Bridge Element Inspection; AASHTO: Washington, DC, USA, 2011. [Google Scholar]
- Maldague, X.P.V. Nondestructive Evaluation of Materials by Infrared Thermography; Springer: Berlin/Heidelberg, Germany, 2012. [Google Scholar] [CrossRef]
- Maldague, X.P.V. Theory and Practice of Infrared Technology for Nondestructive Testing; Wiley: New York, NY, USA, 2001. [Google Scholar]
- Meola, C. Infrared Thermography in the Architectural Field. Sci. World 2013, 2013, 323948. [Google Scholar] [CrossRef] [Green Version]
- Pozzer, S.; Rezazadeh Azar, E.; Dalla Rosa, F.; Chamberlain Pravia, Z.M. Semantic Segmentation of Defects in Infrared Thermographic Images of Highly Damaged Concrete Structures. J. Perform. Constr. Facil. 2021, 35, 04020131. [Google Scholar] [CrossRef]
- Deshmukh, G.; Birwal, P.; Datir, R.; Patel, S. Thermal Insulation Materials: A Tool for Energy Conservation. J. Food Process. Technol. 2017, 8, 1–4. [Google Scholar] [CrossRef]
- Edis, E.; Flores-Colen, I.; de Brito, J. Passive Thermographic Detection of Moisture Problems in Façades with Adhered Ceramic Cladding. Constr. Build. Mater. 2014, 51, 187–197. [Google Scholar] [CrossRef]
- Minkina, W.; Dudzik, S. Infrared Thermography: Errors and Uncertainties, 3rd ed.; J. Wiley: Chichester, UK, 2009. [Google Scholar] [CrossRef]
- Ortiz-Sanz, J.; Gil-Docampo, M.; Arza-García, M.; Cañas-Guerrero, I. IR Thermography from UAVs to Monitor Thermal Anomalies in the Envelopes of Traditional Wine Cellars: Field Test. Remote Sens. 2019, 11, 1424. [Google Scholar] [CrossRef]
- Minkina, W.; Klecha, D. Atmospheric Transmission Coefficient Modelling in the Infrared for Thermovision Measurements. J. Sens. Sens. Syst. 2016, 5, 17–23. [Google Scholar] [CrossRef] [Green Version]
- Tashan, J.; Al-Mahaidi, R.; Mamkak, A. Defect Size Measurement and Far Distance Infrared Detection in CFRP-Concrete and CFRP-Steel Systems. Aust. J. Struct. Eng. 2015, 17, 2–13. [Google Scholar] [CrossRef] [Green Version]
- Vollmer, M.; Möllmann, K.-P. Infrared Thermal Imaging: Fundamentals, Research and Applications, 2nd ed.; Wiley-VCH: Weinheim, Germany, 2018. [Google Scholar] [CrossRef]
- Muniz, P.R.; Cani, S.P.N.; Magalhaes, R.d.S. Influence of Field of View of Thermal Imagers and Angle of View on Temperature Measurements by Infrared Thermovision. IEEE Sens. J. 2014, 14, 729–733. [Google Scholar] [CrossRef]
- Omar, T.; Nehdi, M.L.; Zayed, T. Rational Condition Assessment of RC Bridge Decks Subjected to Corrosion-Induced Delamination. J. Mater. Civ. Eng. 2018, 30, 04017259. [Google Scholar] [CrossRef]
- Ahmed, H.; La, H.M.; Gucunski, N. Review of Non-Destructive Civil Infrastructure Evaluation for Bridges: State-of-the-Art Robotic Platforms, Sensors and Algorithms. Sensors 2020, 20, 3954. [Google Scholar] [CrossRef] [PubMed]
- Lattanzi, D.; Miller, G. Review of Robotic Infrastructure Inspection Systems. J. Infrastruct. Syst. 2017, 23, 04017004. [Google Scholar] [CrossRef]
- Carrio, A.; Pestana, J.; Sanchez-Lopez, J.-L.; Suarez-Fernandez, R.; Campoy, P.; Tendero, R.; García-De-Viedma, M.; González-Rodrigo, B.; Bonatti, J.; Rejas-Ayuga, J.G. Ubristes: UAV-Based Building Rehabilitation with Visible and Thermal Infrared Remote Sensing. In Proceedings of the Robot 2015: Second Iberian Robotics Conference, Lisbon, Portugal, 19–21 November 2015; pp. 245–256. [Google Scholar] [CrossRef]
- Pan, N.-H.; Tsai, C.-H.; Chen, K.-Y.; Sung, J. Enhancement of External Wall Decoration Material for the Building in Safety Inspection Method. J. Civ. Eng. Manag. 2020, 26, 216–226. [Google Scholar] [CrossRef]


| Document | Target Object | Recommended/Required Environmental Conditions | |||
|---|---|---|---|---|---|
| Solar Irradiation | Ambient Temperature | Wind | Weather | ||
| ASTM D47888-03 [47] | Bridge deck | A minimum direct solar irradiation for 3 h | An air temperature rise of 11 °C with 4 h of sun for concrete in winter An air temperature rise of 11 °C with 6 h of sun for asphalt in winter | Wind speed of less than 15 mph (6.7 m/s) | Dry for at least 24 h before the survey |
| Japan Public Work Research Institute [117] | Concrete infrastructure | A minimum direct solar irradiation of 350 Wh/h for 2–3 h | Daily temperature change of more than 10 °C in shaded areas Not suitable for 3–4 h after the maximum or minimum air temperatures | Wind speed of less than 5 m/s | Fine weather |
| British Instiute of Non-Destructive Testing [79] | Structural finishes | Strong solar exposure | Low wind speed | Fine weather | |
| Japanese Society for Non-Destructive Inspection [118] | Concrete infrastructure, Tile façade, Shotcrete | A minimum direct solar exposure for 2 h | Fine or partly cloudy weather | ||
| Japan Building and Equipment Long-Life Cycle Association [96] | Tile façade, Render façade | Around the period of maximum solar irradiation on each elevation 2–4 h after sunset | Daily temperature change of more than 10 °C for shaded elevations | Wind speed of less than 5 m/s | No rain from one day before |
| Author | Year | Test Method | Target Object | Test Location (Outdoor Test or Field Survey) | Study Factors | ||||||||||||
|---|---|---|---|---|---|---|---|---|---|---|---|---|---|---|---|---|---|
| Environmental Conditions | Delamination Properties | Target Object | IR Camera | ||||||||||||||
| Region | Direction | Time window | Irradiation | Ambient Temperature | Wind | Others | Size * (cm) | Depth (cm) | Thickness (cm) | Material | Thermal Property | Others | |||||
| Chew [137] | 1998 | Laboratory test, Outdoor test | Concrete + Tile | Singapore | Vertical | ✓ | ✓ | ✓ | 1–15 | 1 | 1–1.5 | ✓ | |||||
| Maierhofer et al. [138] | 2002 | Laboratory test, Numerical simulation | Concrete, Concrete + CFRP | ✓ | 10–20 | 1–10 | 10 | ||||||||||
| Clark et al. [95] | 2003 | Field survey | Concrete, Stonemasonry | UK | Vertical, Soffit | No detail | ✓ | ||||||||||
| Maierhofer et al. [139] | 2004 | Laboratory test, Numerical simulation | Concrete | ✓ | 10–20 | 1–10 | 10 | ✓ | |||||||||
| Maierhofer et al. [140] | 2005 | Laboratory test, Numerical simulation | Concrete | ✓ | 10–20 | 1–10 | 10 | ✓ | |||||||||
| Meola et al. [141] | 2005 | Laboratory test, Field survey | Brick/Marble/Tuff + Render | Italy | Vertical | 4–10 | 1–5.5 | 0.1–0.2 | ✓ | ✓ | |||||||
| Maierhofer et al. [142] | 2006 | Laboratory test, Numerical simulation, Field survey | Concrete, Concrete + CFRP/Stone, Asphalt, | Germany | Horizon | 10–20 | 2–8 | 10 | ✓ | Rebar | |||||||
| Meola [54] | 2007 | Laboratory test | Brick/Marble/Tuff + Render, Concrete | 2–10 | 1–1.5 | 0.1–3 | ✓ | ✓ | Water | ||||||||
| Maierhofer et al. [143] | 2007 | Laboratory test, Numerical simulation | Concrete | 10 | 6–10 | 5 | ✓ | ✓ | Concrete age, Rebar | ||||||||
| Yehia et al. [132] | 2007 | Outdoor test | Concrete | USA | Horizon | 3.8–10.2 | 1.9–10.2 | 1.3–5.1 | ✓ | ||||||||
| Cheng et al. [133] | 2008 | Laboratory test | Concrete, Concrete + Tile | 5–16 | 0.5–3 | 7–9.5 | |||||||||||
| Washer et al. [144] | 2009 | Outdoor test | Concrete | USA | South | ✓ | ✓ | ✓ | 30 | 2.5–12.7 | 1.3 | ||||||
| Washer et al. [145] | 2010 | Outdoor test | Concrete | USA | South | ✓ | ✓ | 30 | 2.5–12.7 | 1.3 | |||||||
| Washer et al. [146] | 2010 | Outdoor test, Field survey | Concrete | USA | North | ✓ | ✓ | 30 | 2.5–12.7 | 1.3 | |||||||
| Gucunski [19] | 2012 | Outdoor test | Concrete | USA | Horizon | ✓ | 30–61 | 6.4–15.2 | 0.03–0.2 | ||||||||
| Kee et al. [89] | 2012 | Outdoor test | Concrete | USA | Horizon | ✓ | 30–61 | 6.4–15.2 | 0.03–0.2 | ||||||||
| Scott et al. [147] | 2012 | Outdoor test | Concrete | South Africa | North | ✓ | ✓ | ✓ | 15–40 | 1–6.5 | 1 | Rebar | ✓ | ||||
| Edis et al. [97] | 2013 | Field survey | Tile finish | Portugal | Vertical | ✓ | Reflection | No detail | Color, Texture, Moisture | ✓ | |||||||
| Washer et al. [100] | 2013 | Outdoor test, Field survey | Concrete | USA | North, Soffit | ✓ | ✓ | 30 | 2.5–12.7 | 1.3 | |||||||
| Freitas et al. [148] | 2014 | Laboratory test, Field survey, Numerical simulation | Concrete + Render | Portugal | South | ✓ | ✓ | Weather | No detail | ||||||||
| Rumbayan & Washer [49] | 2014 | Numerical simulation | Concrete | USA | South, North | ✓ | ✓ | ✓ | 30 | 2.5–12.7 | 1.3 | ||||||
| Scott & Kruger [149] | 2014 | Outdoor test | Concrete | South Africa | North | ✓ | 25–52 | 5–10 | 5 | ||||||||
| Alfredo-Cruz et al. [150] | 2015 | Outdoor test | Concrete | Colombia | Horizon | ✓ | 15 | 2.5–7.5 | 1 | ||||||||
| Bauer et al. [14] | 2015 | Laboratory test | Concrete + Render | No detail | ✓ | ||||||||||||
| Cotič et al. [82] | 2015 | Laboratory test, Numerical simulation | Concrete | 1.2–10 | 0.5–12.5 | 0.5 | ✓ | ||||||||||
| Edis et al. [20] | 2015 | Field survey, Numerical simulation | Brick + Tile | Portugal | Vertical | ✓ | ✓ | ✓ | Season | 10 | 1 | 1–2 | |||||
| Edis et al. [111] | 2015 | Field survey | Brick + Tile | Portugal | South, West | ✓ | No detail | Moisture content | |||||||||
| Khan et al. [151] | 2015 | Laboratory test, Numerical simulation | Concrete masonry | ✓ | 20–142 | No detail | Size | ||||||||||
| Lai et al. [109] | 2015 | Outdoor test | Concrete + Tile/Render | Hong Kong | East | ✓ | 7.5 | 0.3–2 | 0.3–2 | ||||||||
| Vaghefi et al. [131] | 2015 | Field survey | Concrete | USA | Horizon | No detail | 5.1–7.9 | No detail | |||||||||
| Watase et al. [152] | 2015 | Outdoor test | Concrete | USA | Horizon, Soffit | ✓ | ✓ | ✓ | Relative humidity, Pressure | 10 | 1–3 | 0.1 | |||||
| Bauer et al. [153] | 2016 | Laboratory test, Field survey | Concrete + Tile | Brazil | East | ✓ | 4 | 0.4–0.8 | 0.2 | ||||||||
| Bauer et al. [154] | 2016 | Laboratory test | Concrete, Concrete + Tile | ✓ | 4 | 0.4–0.8 | 0.2 | ||||||||||
| Ellenberg et al. [155] | 2016 | Outdoor test | Concrete | USA | Horizon | 30–61 | 6.4–15.2 | No detail | ✓ | ||||||||
| Farrag et al. [102] | 2016 | Outdoor test | Concrete | UAE | Horizon | ✓ | ✓ | ✓ | Season | 1.2–12.5 | 2.5–12.5 | 1.2–5.0 | ✓ | ✓ | Rebar | ||
| Hiasa et al. [156] | 2016 | Laboratory test | Concrete | 10 | 1–3 | 0.1 | ✓ | ||||||||||
| Huh et al. [157] | 2016 | Laboratory test | Concrete | ✓ | 3–10 | 1–3 | 1 | ||||||||||
| Chiang & Guo [158] | 2017 | Field survey | Concrete + Tile | Taiwan | East, West, South, North | ✓ | No detail | ||||||||||
| Hiasa et al. [88] | 2017 | Outdoor test, Field survey, Numerical simulation | Concrete | USA | Horizon | 5–90 | 1.3–10.2 | 0.1–10 | ✓ | ||||||||
| Hiasa et al. [88] | 2017 | Outdoor test, Field survey, Numerical simulation | Concrete | USA | Horizon | 5–90 | 1.3–10.2 | 0.1–10 | ✓ | ||||||||
| Hiasa et al. [159] | 2017 | Outdoor test, Numerical simulation | Concrete | USA | Horizon | Season | 10–30 | 1.3–7.6 | 0.1–10 | ✓ | |||||||
| Hiasa et al. [160] | 2017 | Field survey | Concrete | USA | Horizon | ✓ | No detail | ✓ | |||||||||
| Hiasa et al. [161] | 2017 | Outdoor test | Concrete | USA | Horizon | ✓ | 10.2 | 1.3–7.6 | 0.32 | ✓ | |||||||
| Janků et al. [101] | 2017 | Outdoor test, Field survey | Concrete | Czech | SouthwestShaded area | ✓ | ✓ | ✓ | Weather | No detail | 1–4 | No detail | |||||
| Milovanović et al. [112] | 2017 | Laboratory test | Concrete | 3–15 | 1–7 | 1–4 | ✓ | Concrete age, Rebar | |||||||||
| Lourenço et al. [162] | 2017 | Outdoor test | IEICS / Brick + Tile | Portugal | West | ✓ | Weather | 30 | 0.82 | 0.3 | ✓ | Color, Water penetration | ✓ | ||||
| Sultan & Washer [163] | 2017 | Outdoor test, Field survey | Concrete | USA | Horizon | 15.2–60.9 | 5 | 2.54 | |||||||||
| Tran et al. [164] | 2017 | Laboratory test | Concrete | ✓ | ✓ | Relative humidity | 3–10 | 1–3 | 1 | ||||||||
| Escobar-Wolf et al. [165] | 2018 | Laboratory test, Field survey | Concrete | USA | Horizon | 2.5–10.2 | 2.5–5 | 1 | ✓ | ||||||||
| Güray & Birgül et al. [166] | 2018 | Numerical simulation | Concrete | Horizon | ✓ | 10 | 1.1–4.1 | 0.2 | Water penetration | ||||||||
| Hiasa et al. [90] | 2018 | Outdoor test, Numerical simulation | Concrete | USA | Horizon | ✓ | Weather | 10 | 1.3–2.5 | 0.3 | Surface obstacle | ||||||
| Huh et al. [85] | 2018 | Laboratory test | Concrete | ✓ | 10 | 1–8 | 1 | Rebar | |||||||||
| Moropoulou et al. [43] | 2018 | Laboratory test, Numerical simulation | Stone | ✓ | 1–3 | 2.5–3.5 | No detail | ✓ | |||||||||
| Rocha et al. [103] | 2018 | Outdoor test | Concrete | Brazil | Horizon, Shaded area | ✓ | ✓ | Relative humidity, Weather | 10 | 2.5–7.5 | 0.3–1.2 | ✓ | |||||
| Tran et al. [167] | 2018 | Laboratory test | Concrete | ✓ | 7–15 | 2–8 | 1 | Rebar | |||||||||
| Al Gharawi et al. [116] | 2019 | Outdoor test | Concrete | USA | South, North | ✓ | Month | 30 | 2.5–12.7 | 1.3 | ✓ | ||||||
| Cheng et al. [94] | 2019 | Laboratory test, Outdoor test, Numerical simulation | Concrete | USA | Horizon | ✓ | ✓ | 5.1–15.2 | 3.8–8.9 | 0.4 | |||||||
| Mac et al. [56] | 2019 | Outdoor test | Concrete | Korea | Horizon | ✓ | Weather | 5–15.8 | 2–7 | 1 | ✓ | ||||||
| Vyas et al. [168] | 2019 | Outdoor test | Asphalt | India | Horizon | ✓ | 60 | 5–10 | No detail | ✓ | |||||||
| Cheng & Shen [110] | 2019 | Outdoor test, Field test | Concrete | USA | Horizon | ✓ | 25 | 4.4–9.5 | 0.4 | ||||||||
| Milovanovic et al. [169] | 2020 | Laboratory test | Concrete | ✓ | 3–10 | 1–5 | 1–4 | ||||||||||
| Pozzer et al. [24] | 2020 | Outdoor test | Concrete | Brazil | Horizon | ✓ | ✓ | ✓ | ✓ | Relative humidity, Pressure | 5–15 | 1–5 | 3 | ||||
| Raja et al. [170] | 2020 | Laboratory test, Numerical simulation | Concrete | ✓ | ✓ | 7–17 | 2.5–6.3 | 0.5 | |||||||||
| Cheng & Shen [171] | 2021 | Laboratory test, Outdoor test | Concrete | USA | Horizon | ✓ | ✓ | ✓ | 3–6 | 2.5–10 | 1–2 | ||||||
| Mac et al. [172] | 2021 | Outdoor test | Concrete | Korea | Soffit | ✓ | ✓ | Relative humidity | 35–40 | 4–19.5 | 1 | ||||||
| Pozzer et al. [173] | 2021 | Outdoor test, Numerical simulation | Concrete | Brazil | Horizon | ✓ | Season | 5–15 | 2–5 | 3 | |||||||
| Zheng et al. [174] | 2021 | Laboratory testOutdoor test | Concrete | China | Horizon | 4–10 | 1.8–5 | 2.4–6.2 | |||||||||
| Direction | Author | Year | Time Windows |
|---|---|---|---|
| Horizontal surface | Yehia et al. [132] | 2007 | Defects of up to 3.8 cm deep can be detected between 10 a.m. and 3 p.m. Any defects cannot be detected during cooling cycle. |
| Gucunski et al. [19] | 2012 | Defects at 40 min after sunrise are more apparent than at noon. | |
| Kee et al. [89] | 2012 | IR images obtained during cooling cycle are more evident than those obtained during heating cycle. Defects cannot be detected 3:45 h after sunrise. Shallow defects of 6.4 cm can be detected 7 h after sunrise. | |
| Watase et al. [152] | 2015 | Any time of day is suitable for 1 cm deep delamination, and 6 a.m. is best time. | |
| Hiasa et al. [90] | 2018 | Defects can be detected between 10 a.m. and 3 p.m. Defects can be detected between 5 p.m. and 8 am, and maximum contrast appears at 7 p.m. Cooling cycle is more suitable than the heating cycle for the inspection. | |
| Güray et al. [166] | 2018 | Favorable time window is between 3 p.m. and 7 p.m. | |
| Mac et al. [56] | 2019 | Optimal time windows for up to 4 cm deep defects are between 10 a.m. and 3 p.m. and between 7:30 p.m. and 2:00 a.m. | |
| Vyas et al. [168] | 2019 | Interchange times for asphalt unbonded by sand are between 8 a.m. and 10 a.m. and between 2:30 p.m. and 3:30 p.m. | |
| Pozzer et al. [24] | 2020 | Ideal time window is between 12 p.m. and 3 p.m. | |
| South elevation (in the Northern Hemisphere) | Washer et al. [144] | 2009 | Optimum time is from 5–9 h after sunrise. |
| Washer et al. [145] | 2010 | Optimum time is after 5:40 h after sunrise for 2.5 cm deep delamination and 9 h after for 12.7 cm. | |
| Scott et al. [147] | 2012 | Recommended time window is between 12 a.m. and 3 p.m. for under 6.5 cm deep delamination. | |
| Scott & Kruger [149] | 2014 | Optimum time window is between 11 a.m. and 1 p.m. for under 5 cm deep defects. | |
| Edis et al. [20] | 2015 | Interchange times occur between 5:30 a.m. and 6:50 a.m. and between 4:30 p.m. and 5:50 p.m. | |
| Chiang & Guo [158] | 2017 | Available time window is between 10 a.m. and 12 p.m. | |
| Janků et al. [101] | 2017 | Best time is around noon. Interchange time occurs at 4 p.m. | |
| Freitas et al. [148] | 2018 | Best time window is during hours of exposure to sunlight. Defects are less evident during cooling cycle than heating cycle. | |
| East elevation | Bauer et al. [153] | 2016 | Defects are better visualized in early morning and late afternoon. Interchange time is around 12:30 p.m. |
| Chiang & Guo [158] | 2017 | Available time window is between 9 a.m. and 11 a.m. | |
| West elevation | Chiang & Guo [158] | 2017 | Available time window is between 12 p.m. and 2 p.m. |
| Lourenço et al. [162] | 2017 | Desirable time during heating cycle is first 1:30 h after beginning of irradiation exposure. Desirable time during cooling cycle is beginning of cycle or 1 h after beginning of shadowing. | |
| Shaded area/Soffit/North elevation (in the Northern Hemisphere) | Watase et al. [152] | 2015 | Favorable time window is midnight. |
| Chiang & Guo [158] | 2017 | Available time window time is between 11 a.m. and 1 p.m. | |
| Janků et al. [101] | 2017 | Best conditions occur around noon. | |
| Rocha et al. [103] | 2018 | Best time window is between 10 a.m. 2 pm, specifically at noon. Interchange times are around 7 a.m. and 5 p.m. | |
| Mac et al. [172] | 2021 | First optimal time window is 7 h after decks are exposed to sunlight until 0.5 h after decks are not exposed. Second one is from 1.5 h to 3.5 h after decks are exposed to sunlight. Third one is 8 h after decks are not exposed to sunlight until 1 h after decks are exposed. |
| Conditions | Maximum Detectable Depth in Literature |
|---|---|
| (a) Laboratory test | 6 cm [143], 7 cm [10,85,167], 7.5 cm [82], 10 cm [138] |
| (b) Outdoor test with solar irradiation measured during heating cycle (daytime) | 3 cm [159], 3.2 cm [174], 4 cm [56,101], 5.1 cm [88,132], 6.5 cm [147], 7.5cm [150],10 cm [102], 12.7 cm [87,144] |
| (c) Outdoor test with solar irradiation measured during cooling cycle (nighttime) | 3 cm [159], 4 cm [56,101] 10.2 cm [88], 12.5 cm [102], 12.7 cm [87], 15.2 cm [89] |
| (d) Outdoor test in shaded areas | 4 cm [101] 5 cm [103], 7.6 cm [87], 19.5 cm [172] |
| Items | Short-Wavelength (SW) Camera | Long-Wavelength (LW) Camera |
|---|---|---|
| Spectral range | 3–5 μm | 8–14 μm |
| Detector type | InSb, Quantum detector | Microbolometer, Thermal detector |
| Cooling | Cooling | Uncooling |
| Thermal sensitivity, NETD | Fine | Middle |
| Shutter speed | Fast (e.g., 10 μs–10 ms) | Slow (e.g., 10 ms) |
| Camera cost | High | Low–middle |
Publisher’s Note: MDPI stays neutral with regard to jurisdictional claims in published maps and institutional affiliations. |
© 2022 by the authors. Licensee MDPI, Basel, Switzerland. This article is an open access article distributed under the terms and conditions of the Creative Commons Attribution (CC BY) license (https://creativecommons.org/licenses/by/4.0/).
Share and Cite
Tomita, K.; Chew, M.Y.L. A Review of Infrared Thermography for Delamination Detection on Infrastructures and Buildings. Sensors 2022, 22, 423. https://doi.org/10.3390/s22020423
Tomita K, Chew MYL. A Review of Infrared Thermography for Delamination Detection on Infrastructures and Buildings. Sensors. 2022; 22(2):423. https://doi.org/10.3390/s22020423
Chicago/Turabian StyleTomita, Ko, and Michael Yit Lin Chew. 2022. "A Review of Infrared Thermography for Delamination Detection on Infrastructures and Buildings" Sensors 22, no. 2: 423. https://doi.org/10.3390/s22020423