

Coaxial Mach–Zehnder Digital Strain Sensor Made from a Tapered Depressed Cladding Fiber
by
 ,
,
Sergio Celaschi
1,*,
Nicolas Grégoire
2,
Younès Messaddeq
2,
Claudecir R. Biazoli
1 and
Gilliard N. Malheiros-Silveira
3 1
Centro de Tecnologia da Informação Renato Archer, Campinas 13069-901, Brazil
2
Centre d’Optique, Photonique et Laser, Université Laval, Quebec City, QC G1V 0A6, Canada
3
Department of Communications, School of Electrical and Computer Engineering, University of Campinas (UNICAMP), Campinas 13083-852, Brazil
*
Author to whom correspondence should be addressed.
Sensors 2022, 22(19), 7145; https://doi.org/10.3390/s22197145
Submission received: 6 July 2022
/
Revised: 29 July 2022
/
Accepted: 3 August 2022
/
Published: 21 September 2022
(This article belongs to the Topic Advance and Applications of Fiber Optic Measurement)
Abstract
:An in-line digital optical sensor was proposed. It was built from a tapered depressed-cladding single-mode fiber and modeled as a coaxial Mach–Zehnder interferometer. The principle of operation of the optical digital sensor is based on the computation of the number of optical power transfer turning points (PTTP) from the transmission data of the component. Biconic tapers with high values of PTTP, high spectral resolution, high extinction ratio, and low insertion loss were modeled, fabricated, and characterized. As a proof of concept, an in-line digital strain sensor was fabricated and characterized. It presents a free spectral range of 1.3 nm, and produced 96 PTTP, at λ0 = 1.55 μm, under stretch of ΔL = 707 µm, therefore producing a digital resolution of 7.4 µm/PTTP. The sensor also produced a quasi-symmetric response to stretch and compression.
1. Introduction
Optical devices based on fiber tapers (FT) encounter diversified practical uses in a broad range of applications [1,2]. In optical communication, they can be used as passive notch filters [3,4], acousto-optic tunable filters [5], super-continuum light generation [6], tunable fiber lasers [7], to name a few. In sensing, they can be used to probe a myriad of measurands: physical (strain [8,9,10], stress [11,12], force [13], pressure [14], angle [15,16] and temperature [17,18,19]), chemical [20,21], bio [22], etc. Those FTs may be fabricated by different processes, most frequent, stretching a heated length of commercial single-mode fiber is the preferable one because of the cost and simplicity of fabrication.
Fiber Optic Analog Sensors (FOAS) are crucial to several applications as mentioned above. The intrinsic bandwidth of such sensors offers distinct advantages in their ability to probe and transport the resultant signal, in addition to being lightweight and small size. The FOAS may be modeled by assuming different mechanisms of operation, and modal interferometry, may produce the most sensitive devices, but they have a drawback: they present a very low linear dynamic range due to their intrinsic sine square transfer function. As well-known, tapering a communication single mode fiber may allow a spectral transmission exhibiting a sine square spectral oscillatory behavior, which can be characterized by a free spectral range (FSR). As previously reported in the literature [4], the tapering of a single-mode depressed-cladding fiber (DCF), or W-type fiber, with adiabatic fiber prolife [4,23,24], may result in only two super-modes HE11 and HE12 propagating along it. In contrast to using a commercial fiber such as SMF-28 under the same tapering conditions, the DCF may produce low-loss transmission, large modulation depth, and very short FSR [4]. In general lines, the HE11 and HE12 creation-annihilation at the phase matching regions and their transmission at the taper waist length behave like a coaxial Mach–Zehnder interferometer (CMZI) [4,9,12,17]. The principle of operation of this optical component as a sensor can occur in two ways widely explored in literature: by sensing its optical length, or probing its external refractive index [2]. However, when properly designed, the FT can be seen as an all-optical intrinsic digital sensor enabled to probe external force fields. To the best of our knowledge, such an approach has not been reported in the literature up to now.
In this manuscript, we propose an all-optical all-fiber digital sensor based on a biconic taper. In comparison to FOAS, it can also be applied to probe the external refractive index or the variation of the optical length/path, but, in contrast, the way the output signal is observed is intrinsically digital. As a proof of concept, we demonstrate the sensor operation as a digital strain sensor using an in-line taper based on DCF. In this case, the principle of operation is based on sensing the optical length of the component. As an example of preliminary experimental result, 96 optical power transfer turning points (PTTP) were produced, at λ0 = 1.55 μm, when the sensor 104 mm long, with FSR = 1.3 nm, was stretched by ΔL = 707 µm, thus producing a digital resolution of 7.4 µm/PTTP. The results also demonstrated a quasi-symmetric response to stretch and compression. For comparison’s sake, the same sensor produced an analog spectral resolution (1/2 FSR = 1 PTTP) of about 0.7 nm, thus demonstrating the advantage of using this special DCF as either digital (our proposal) or analog (standard approach) in-line all-fiber sensor. Additionally, those results do not mean the limit of resolution of this sensor was reached, since the sensibility is increased as the FSR gets smaller [25]. This type of taper, assuming diameters ranging from 0.32 to 0.51 µm, was reported in [26]; those waist dimensions can reach FSR values in the pm scale, i.e., values one order of magnitude lower than the mentioned in our preliminary results reported here, revealing that even higher resolutions are possible.
2. Materials and Methods
2.1. Characteristics of the Highly DCF
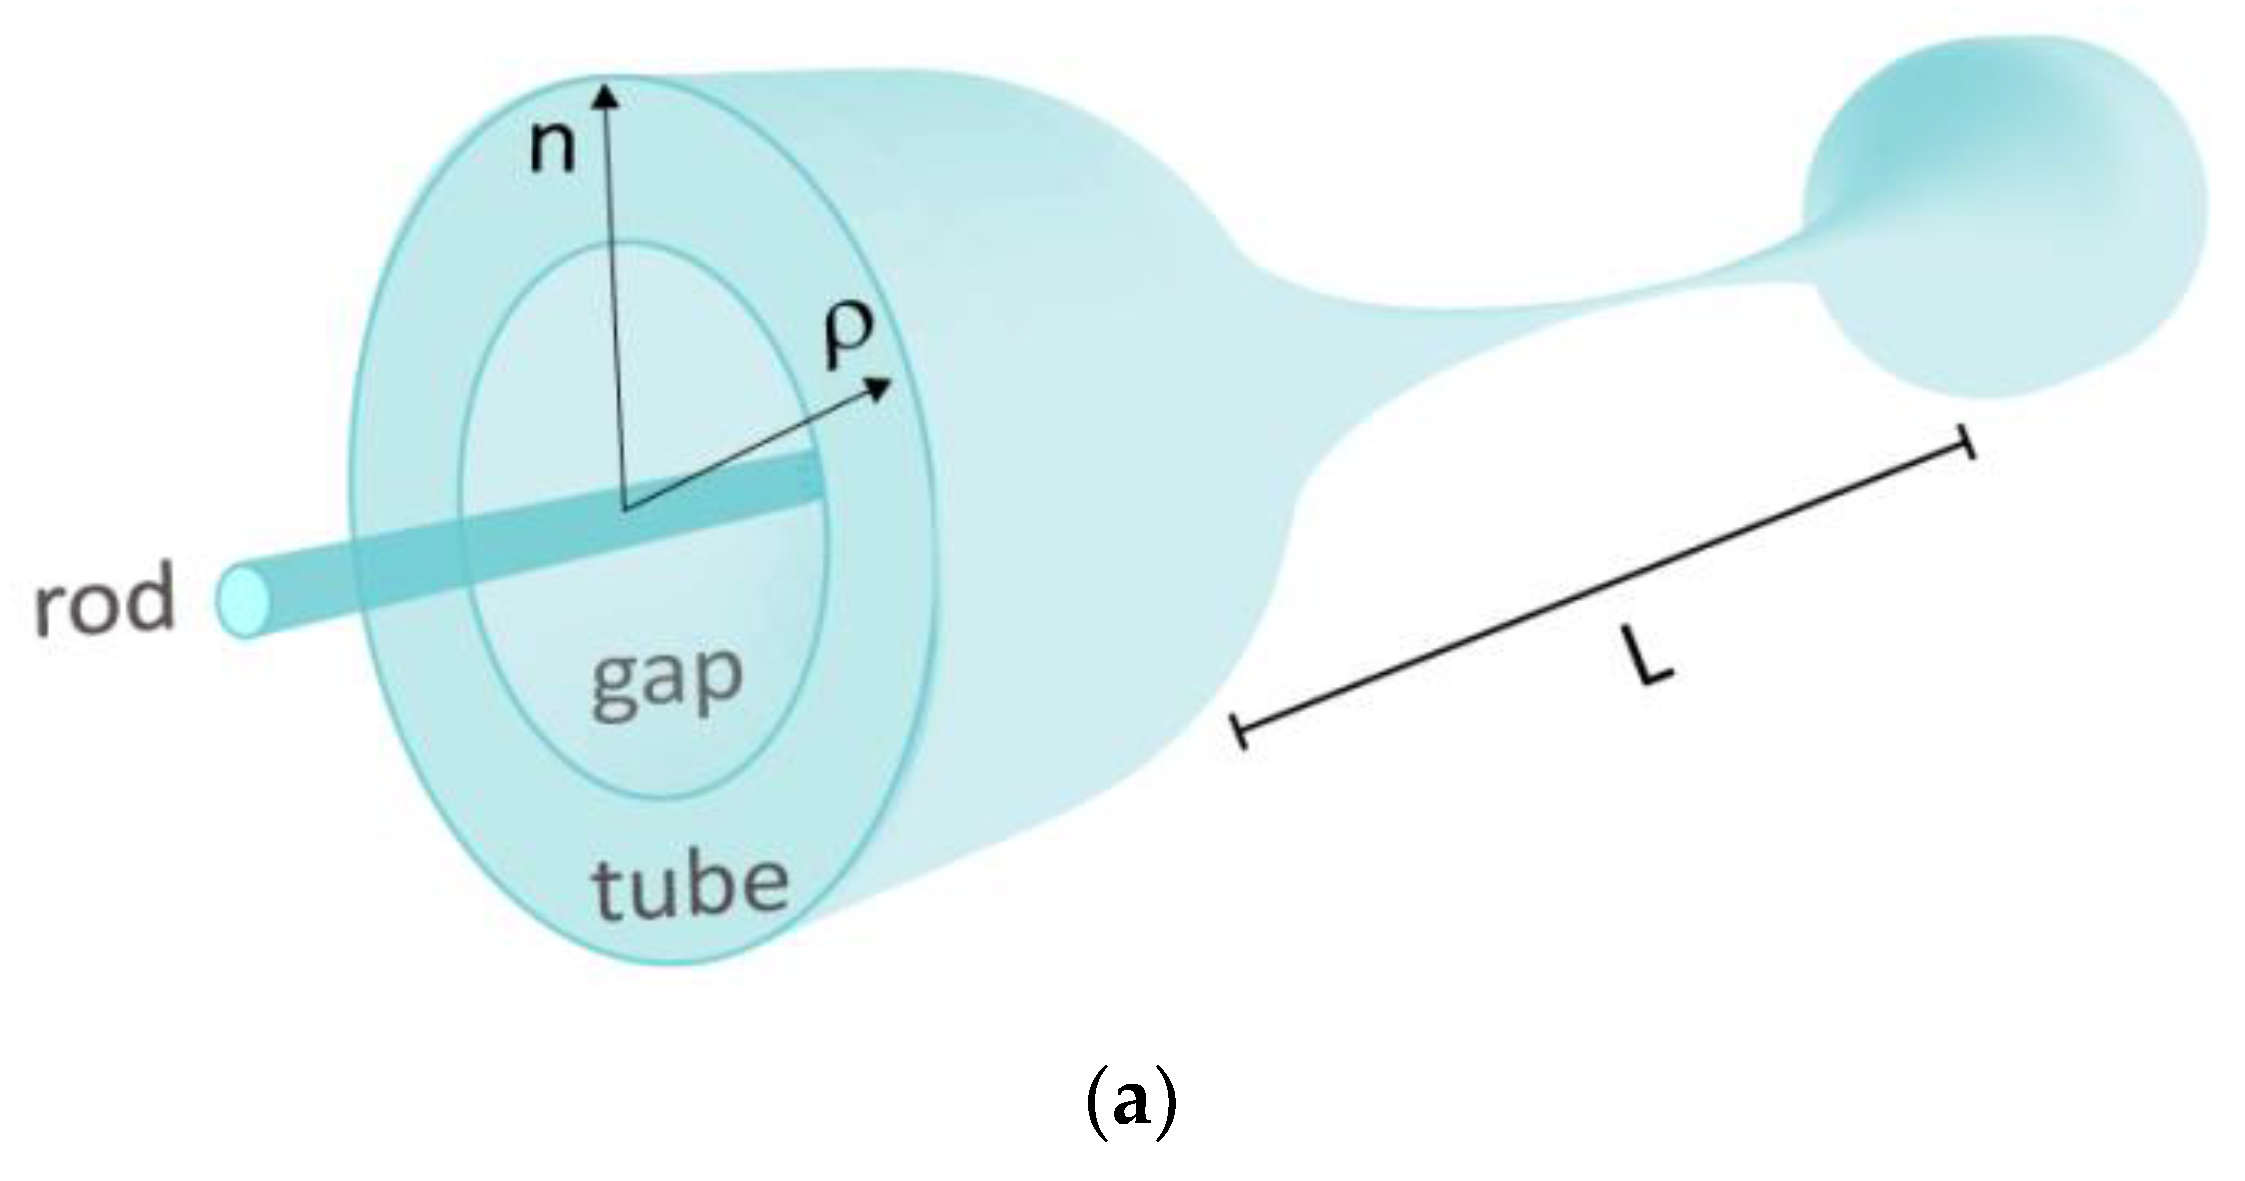
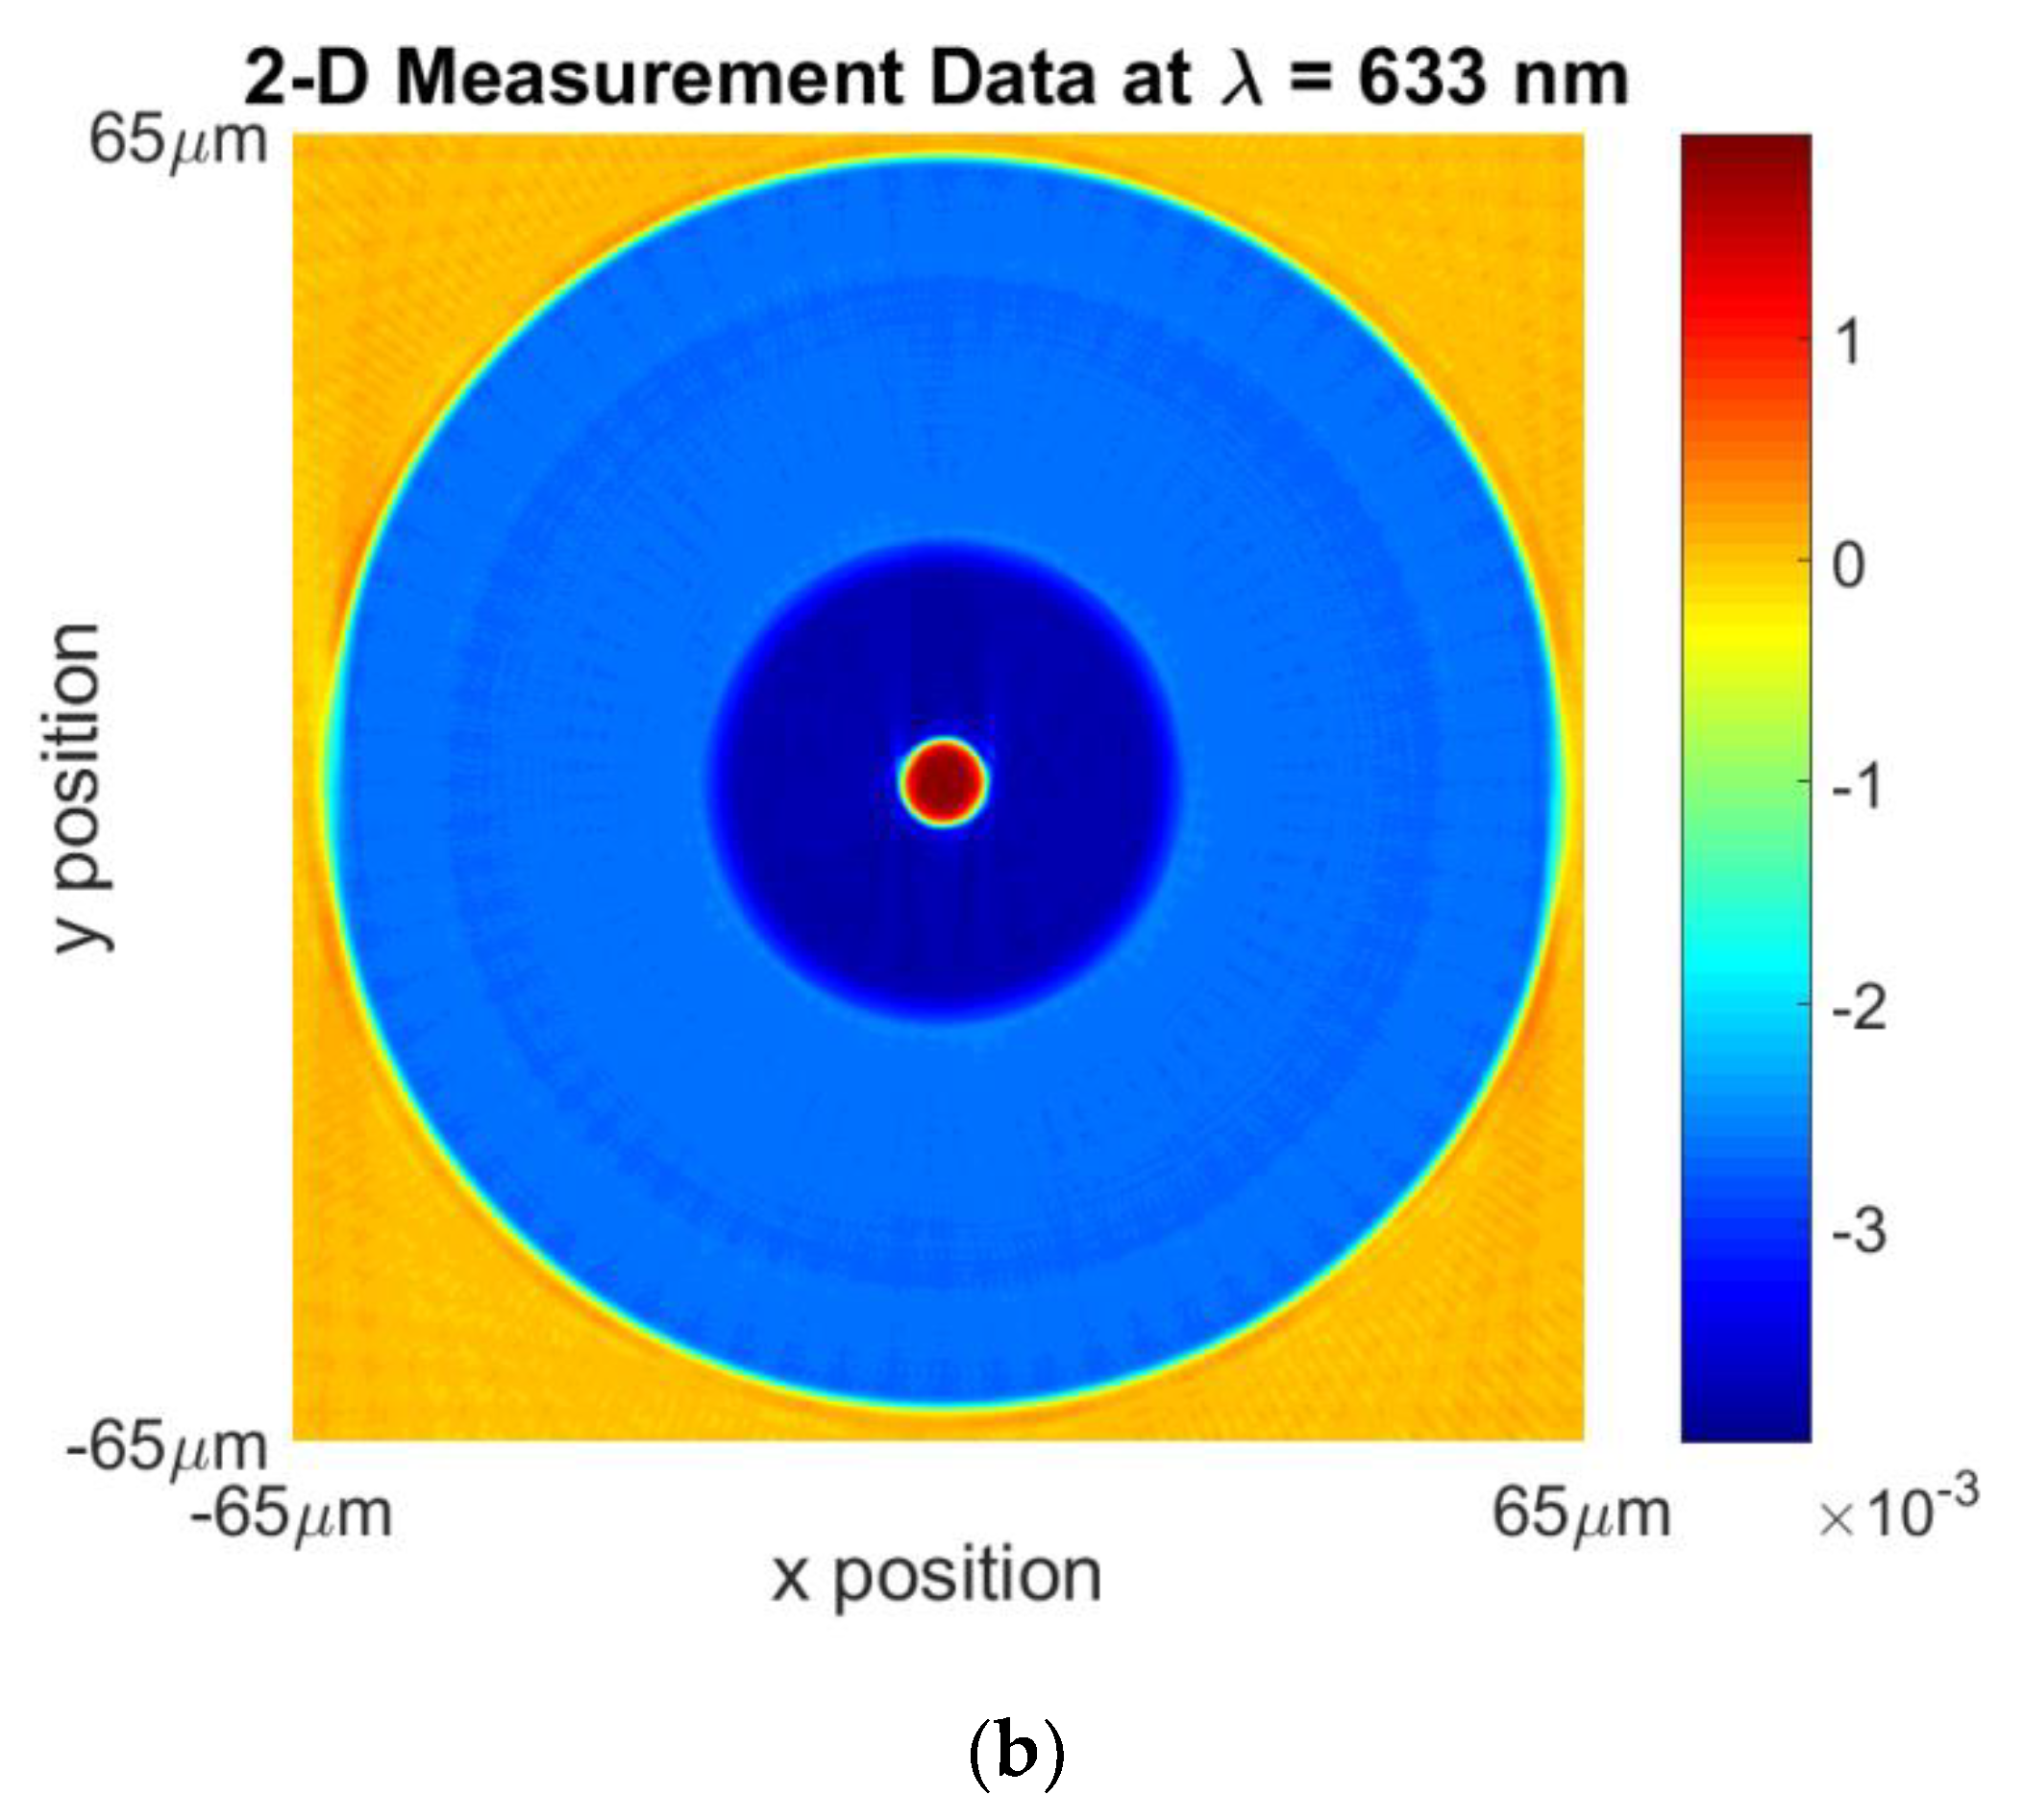
The initial geometric (layer radius, ρ) and optical (refractive indexes, n) parameters for each layer (rod, gap, and tube) of the highly DCF are presented, as a schematic, in Figure 1a, where one of the taper end’s faces highlight its refractive indexes distribution. The values of these parameters used in this study, before tapering the fiber are: ρrod = 4.5 µm, ρgap = 22 µm, ρtube = 62.5 µm, nrod = 1.4485, ngap = 1.4428, ntube = 1.4440, nexternal = 1. Figure 1b shows the refractive index distribution of this fiber measured at λ0 = 633 nm, by the equipment IFA-100 Fiber Index Profiler Version 10.0, located at COPL/ULAVAL, where the indexes contrast is evident. In the non-tapered fiber, its core (or rod) is single mode starting at λ0 = 1.45 µm to longer wavelengths.
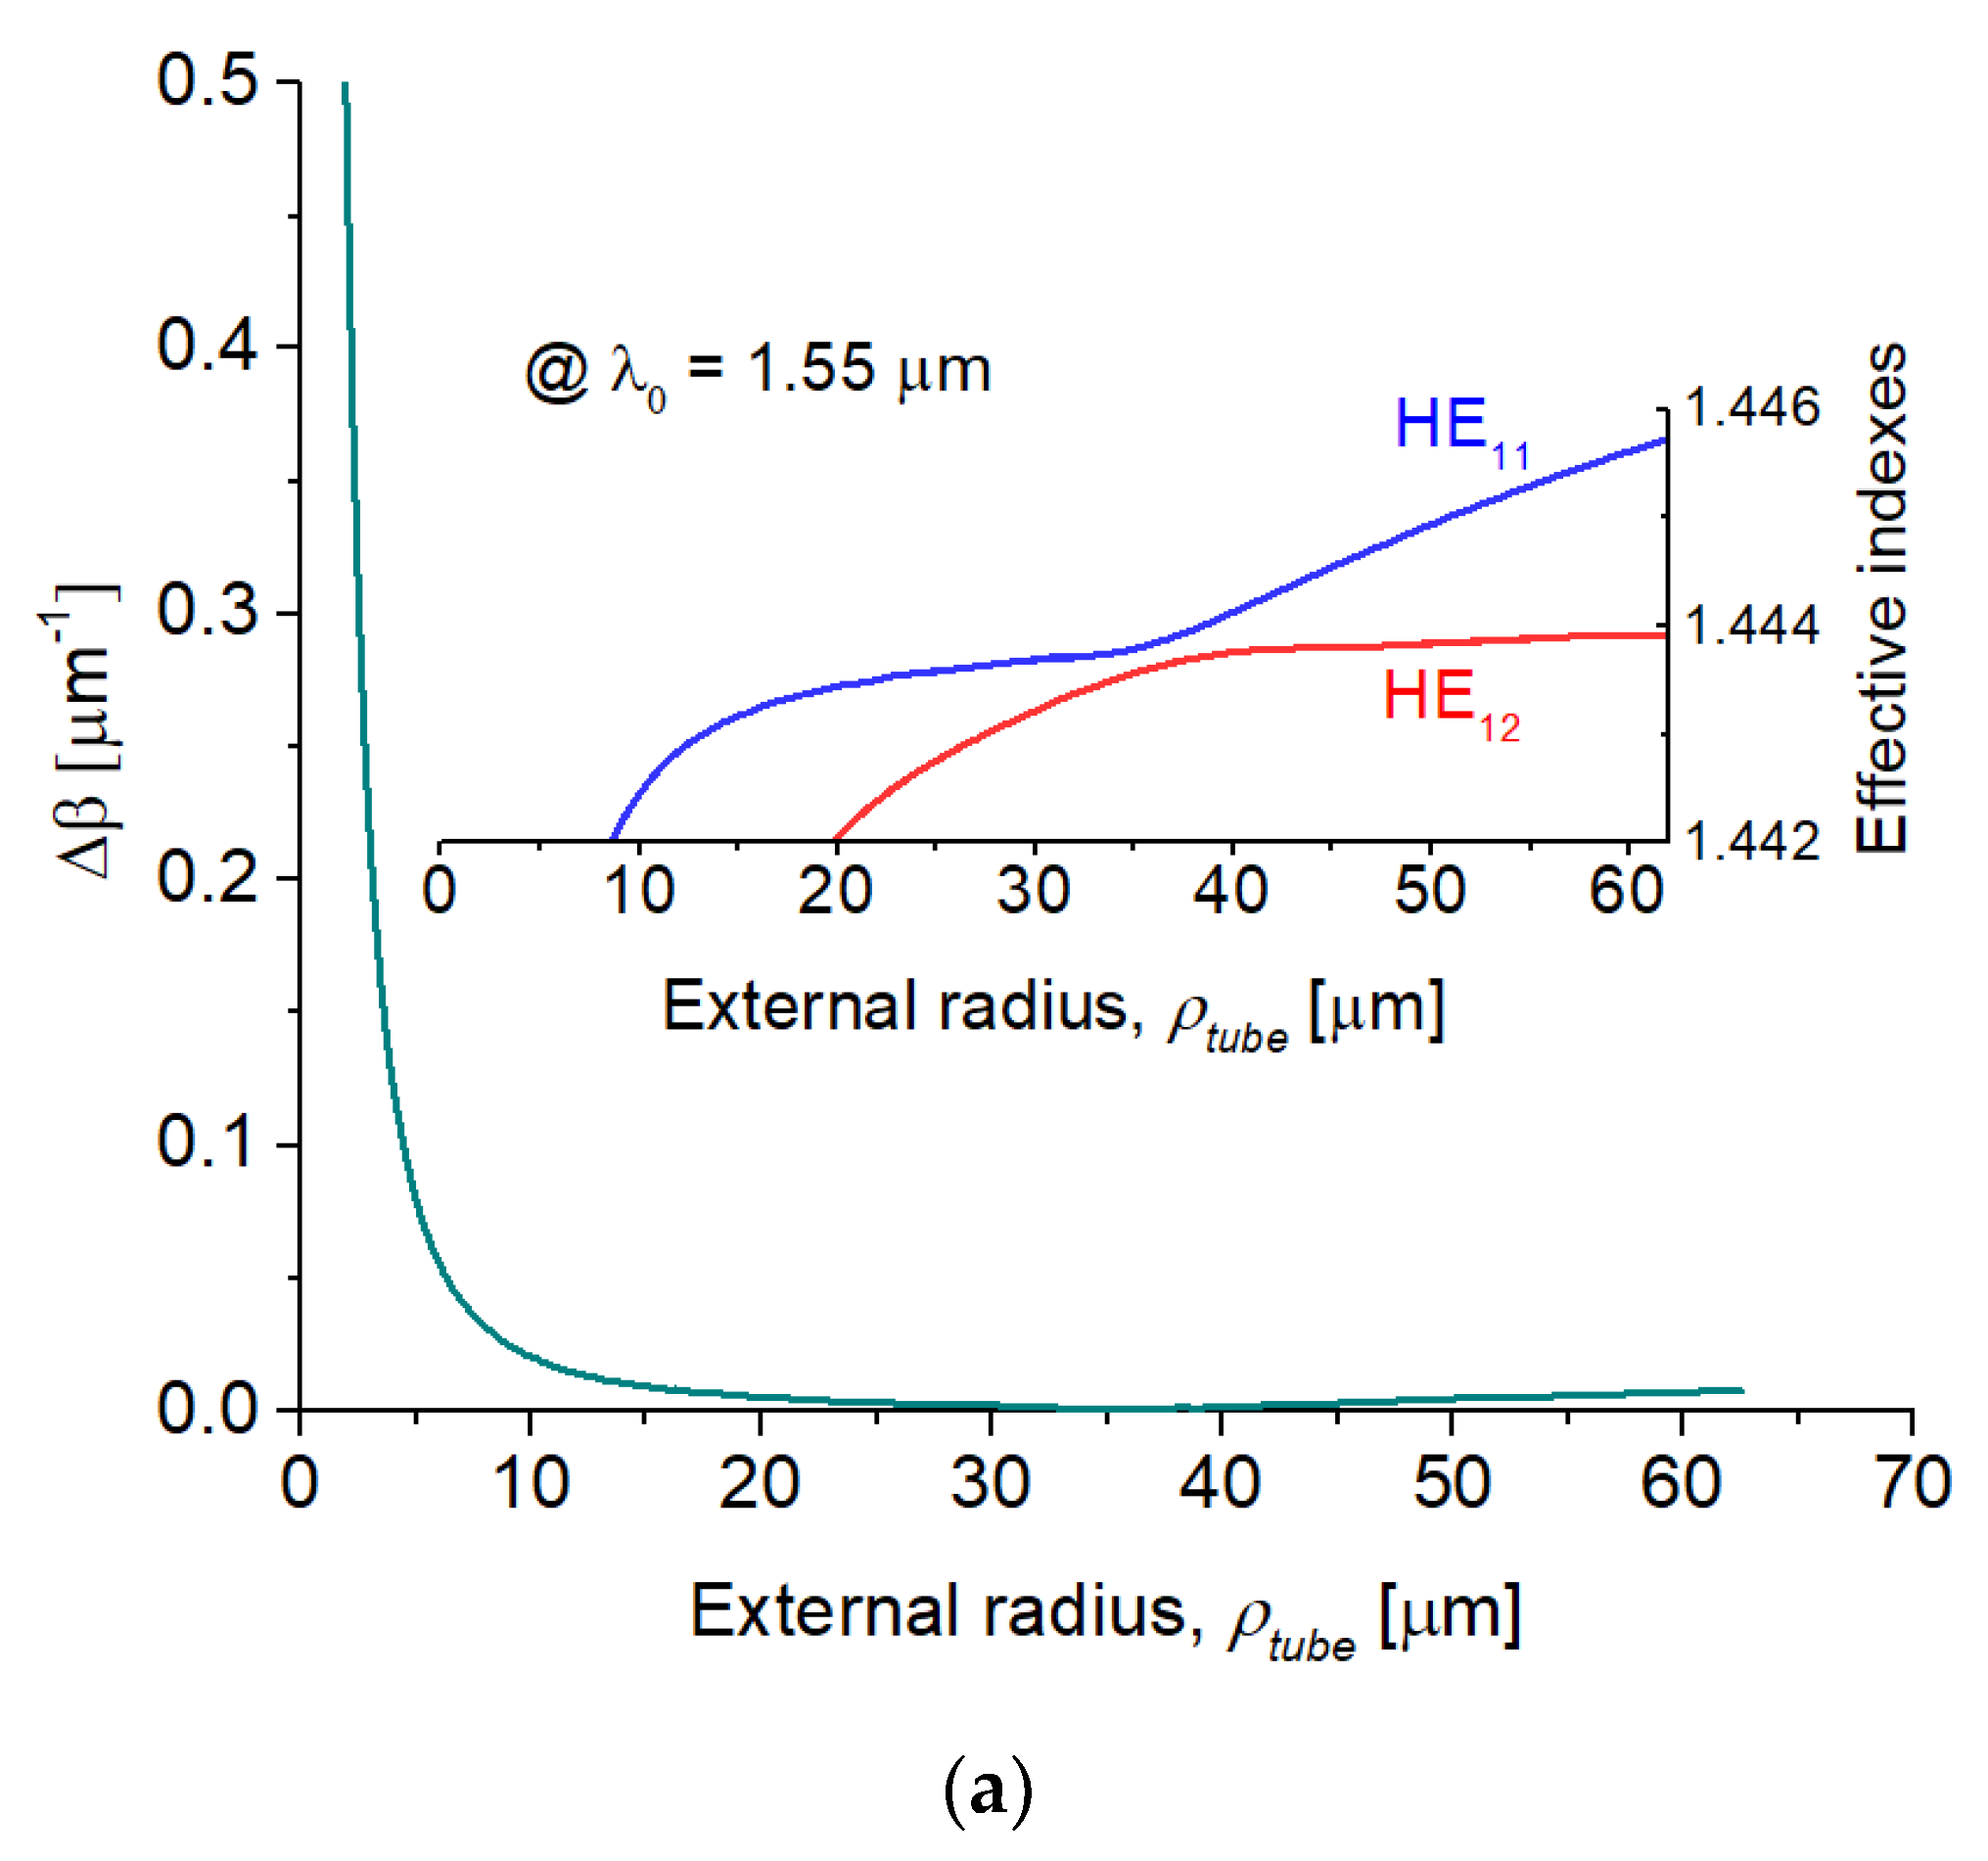
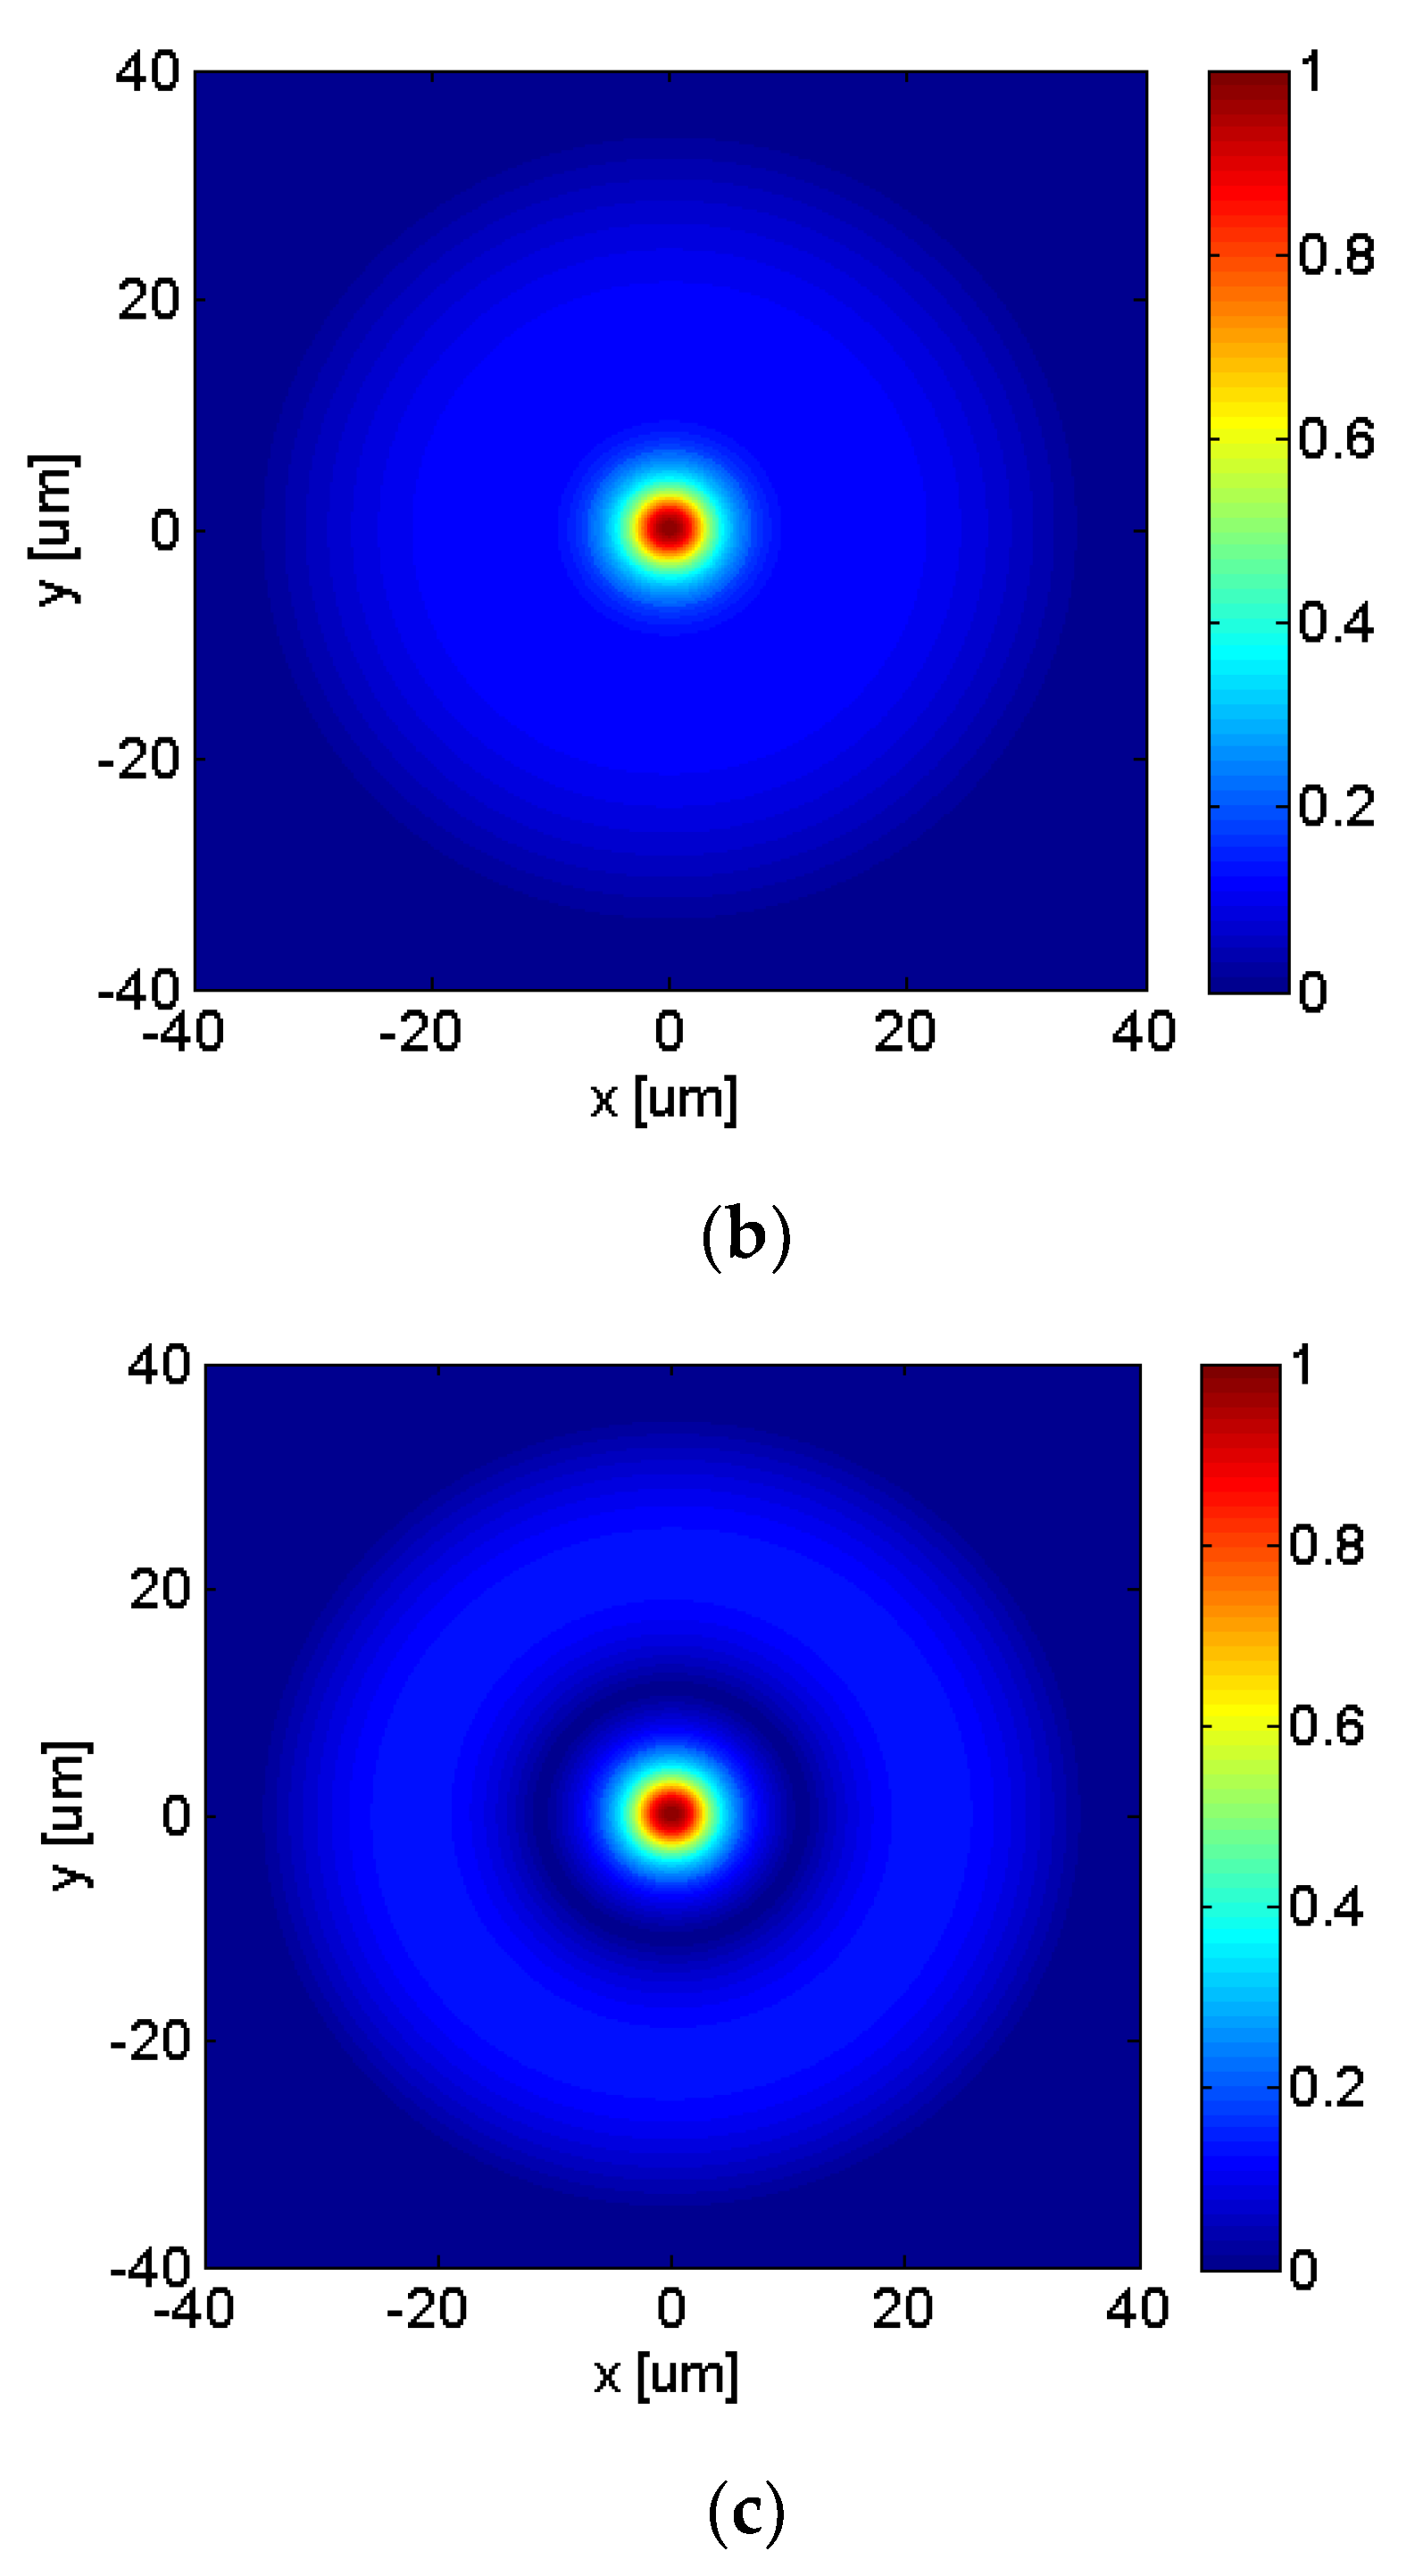
The numerical calculation of the optical properties from the propagating modes involved during the process was performed by means of the frequency-domain finite element method [27]. For this simulation, the ratio of the DCF layers along the taper regions is supposed to remain constant during the tapering. Figure 2a shows the dependence of the difference between the propagation constants, ∆β = β1 − β2, versus the external radius variation. β1 and β2 are, in this case, the respective propagation constants of the modes HE11 and HE12. The phase matching between the modes HE11 and HE12 occurs at ρtube ~ 36 µm as shown in the inset. Additionally, according to our simulations, the HE12 mode cut-off occurs at ρtube ~ 1 µm. Figure 2b,c shows the normalized modulus of the E-field for the modes HE11 and HE12, respectively.
2.2. Modeling of the Biconic Taper Profiles
The modeling of such taper profiles, as depicted in Figure 1a, can be obtained from two coupled partial differential equations. The mass conservation is governed by the continuity Equation (1), and the axial-momentum conservation by the 1-D Equation (2) [4,28]:
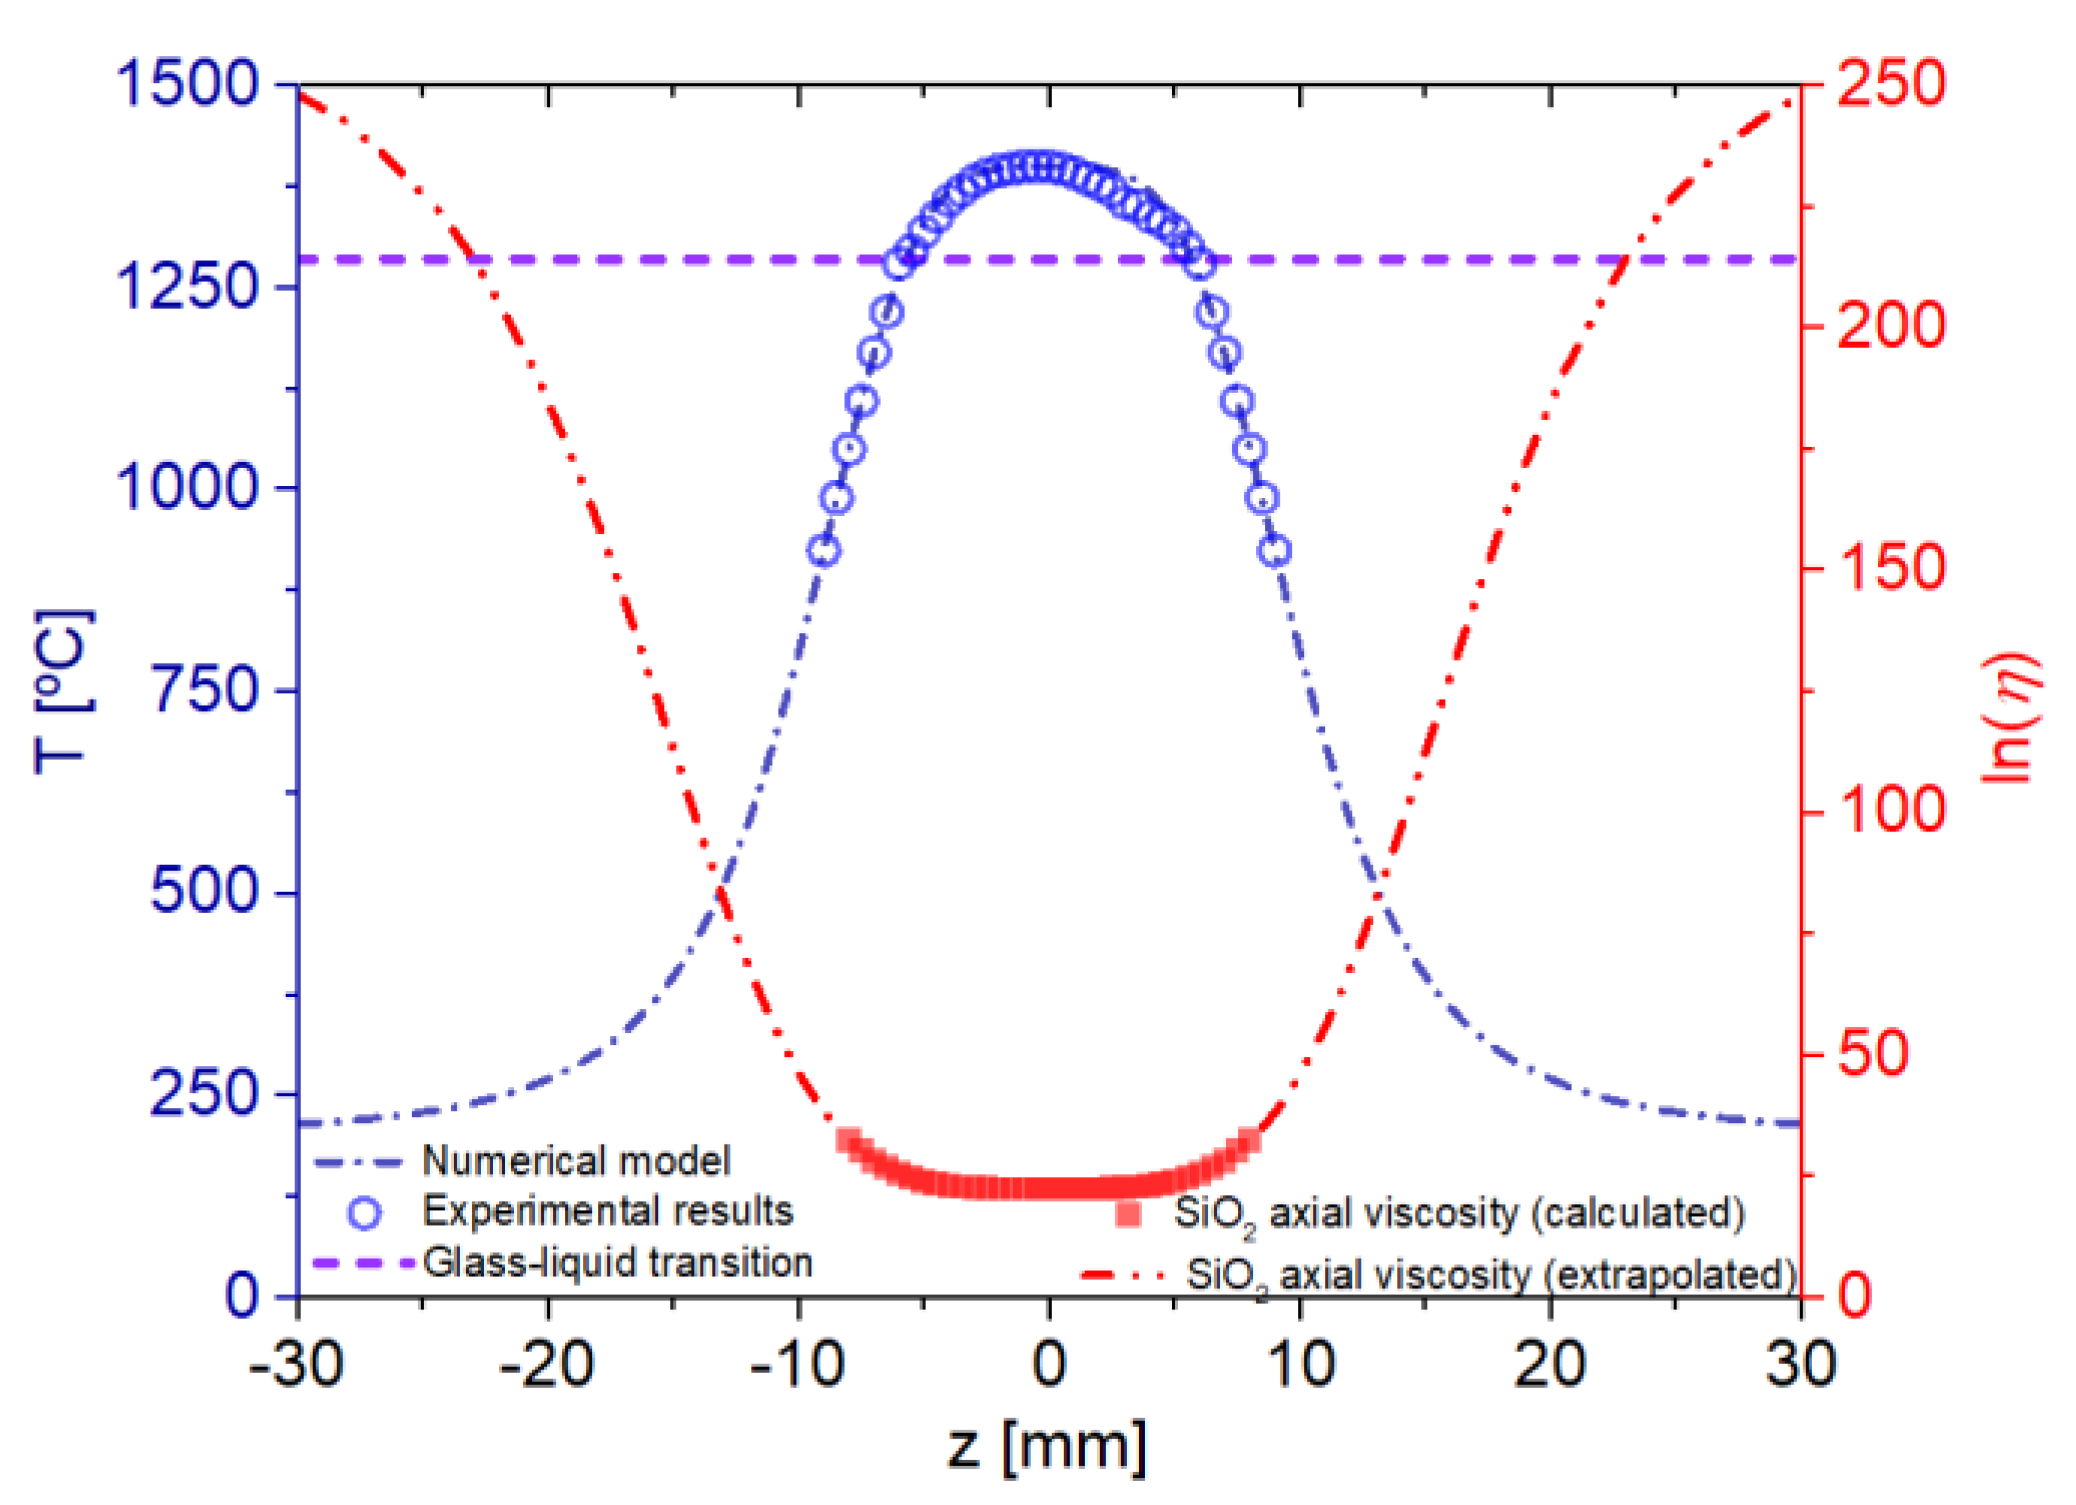
These equations relate the axial velocity, v(z,t), and the normalized cross-section area of the taper, An(z,t) = ρ2tube(z,t)/ro2. The temperature profile of the heating element, T(z), the total time, tT, the pulling velocity, vo, and the taper elongation length L, determine the taper profiles. We assumed the axial viscosity, η(z), of the fiber material to be uniform, and composed of pure SiO2.
Figure 3 shows the graphite heater temperature curve (a cylindrical tube 28 mm long). The temperature profile (in Celsius) numerical and experimental are represented respectively in dark-blue dash-dot line and open circle. The axial viscosity η(z) is presented in the red dash-dot line and solid squares.
The temperature profile model from the heating element is obtained by fitting the experimental profile with the following expressions:
where To = 200 °C, zo = 10, Th = 1400 °C, Tg (glass-liquid transition temperature) = 1285 °C, and b = 2. The axial viscosity curve of the SiO2 fiber material shown in Figure 3 was obtained by fitting data from [29], down to 1000 °C, using the following equation:
where c = 2.4 × 10⁵.
2.3. Adiabatic Taper Profile
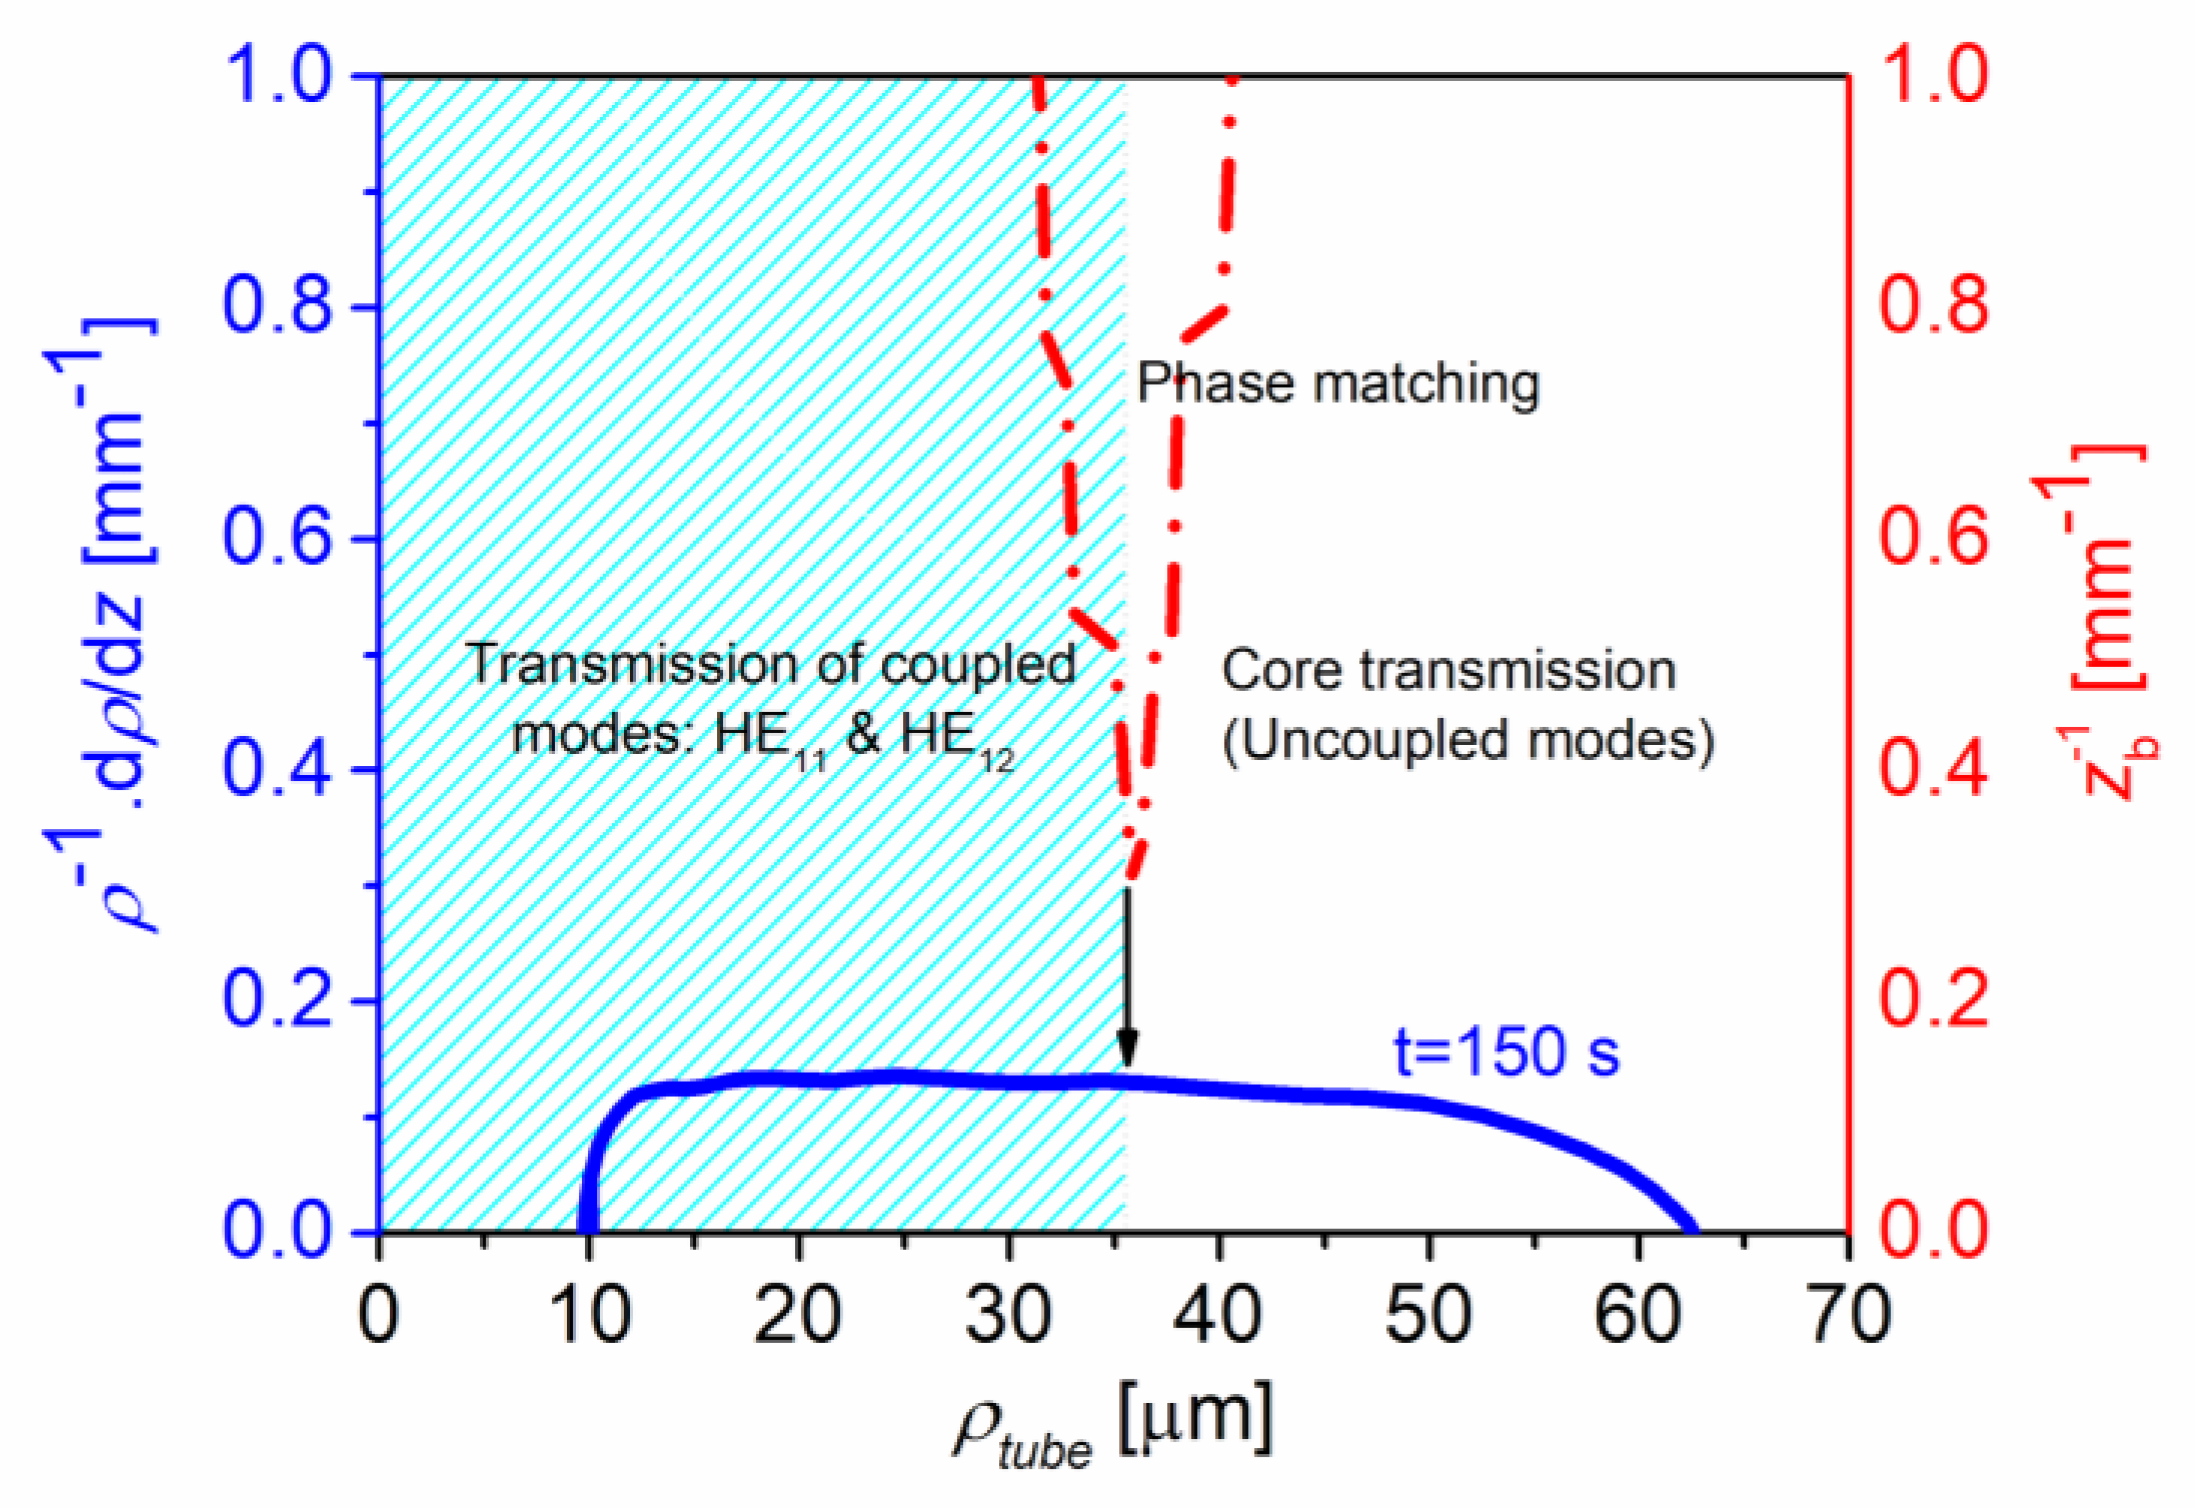
In slowly varying waveguides, the total E-field can present variations along a distance equals to the beat length, zb = 2Δ/(β1 − β2). Thus, in order to assure the local mode solution, the non-uniformities of the guide should occur over a distance larger than zb. Thus, this adiabatic condition is respected when the waveguide radius does not vary, significantly, along a distance zb [23]:
The shape of the tapered region is determined by the dynamics of the fiber heating-and-pulling process, and the temperature profile of the heating element. The FT profiles were measured using an optical microscope, also modeled numerically [4]. Figure 4 shows that the first term of the relation (6) is below the second one. Therefore, confirming the taper profile fabricated obeys the adiabatic slowness criterion [24].
2.4. All-Fiber CMZI
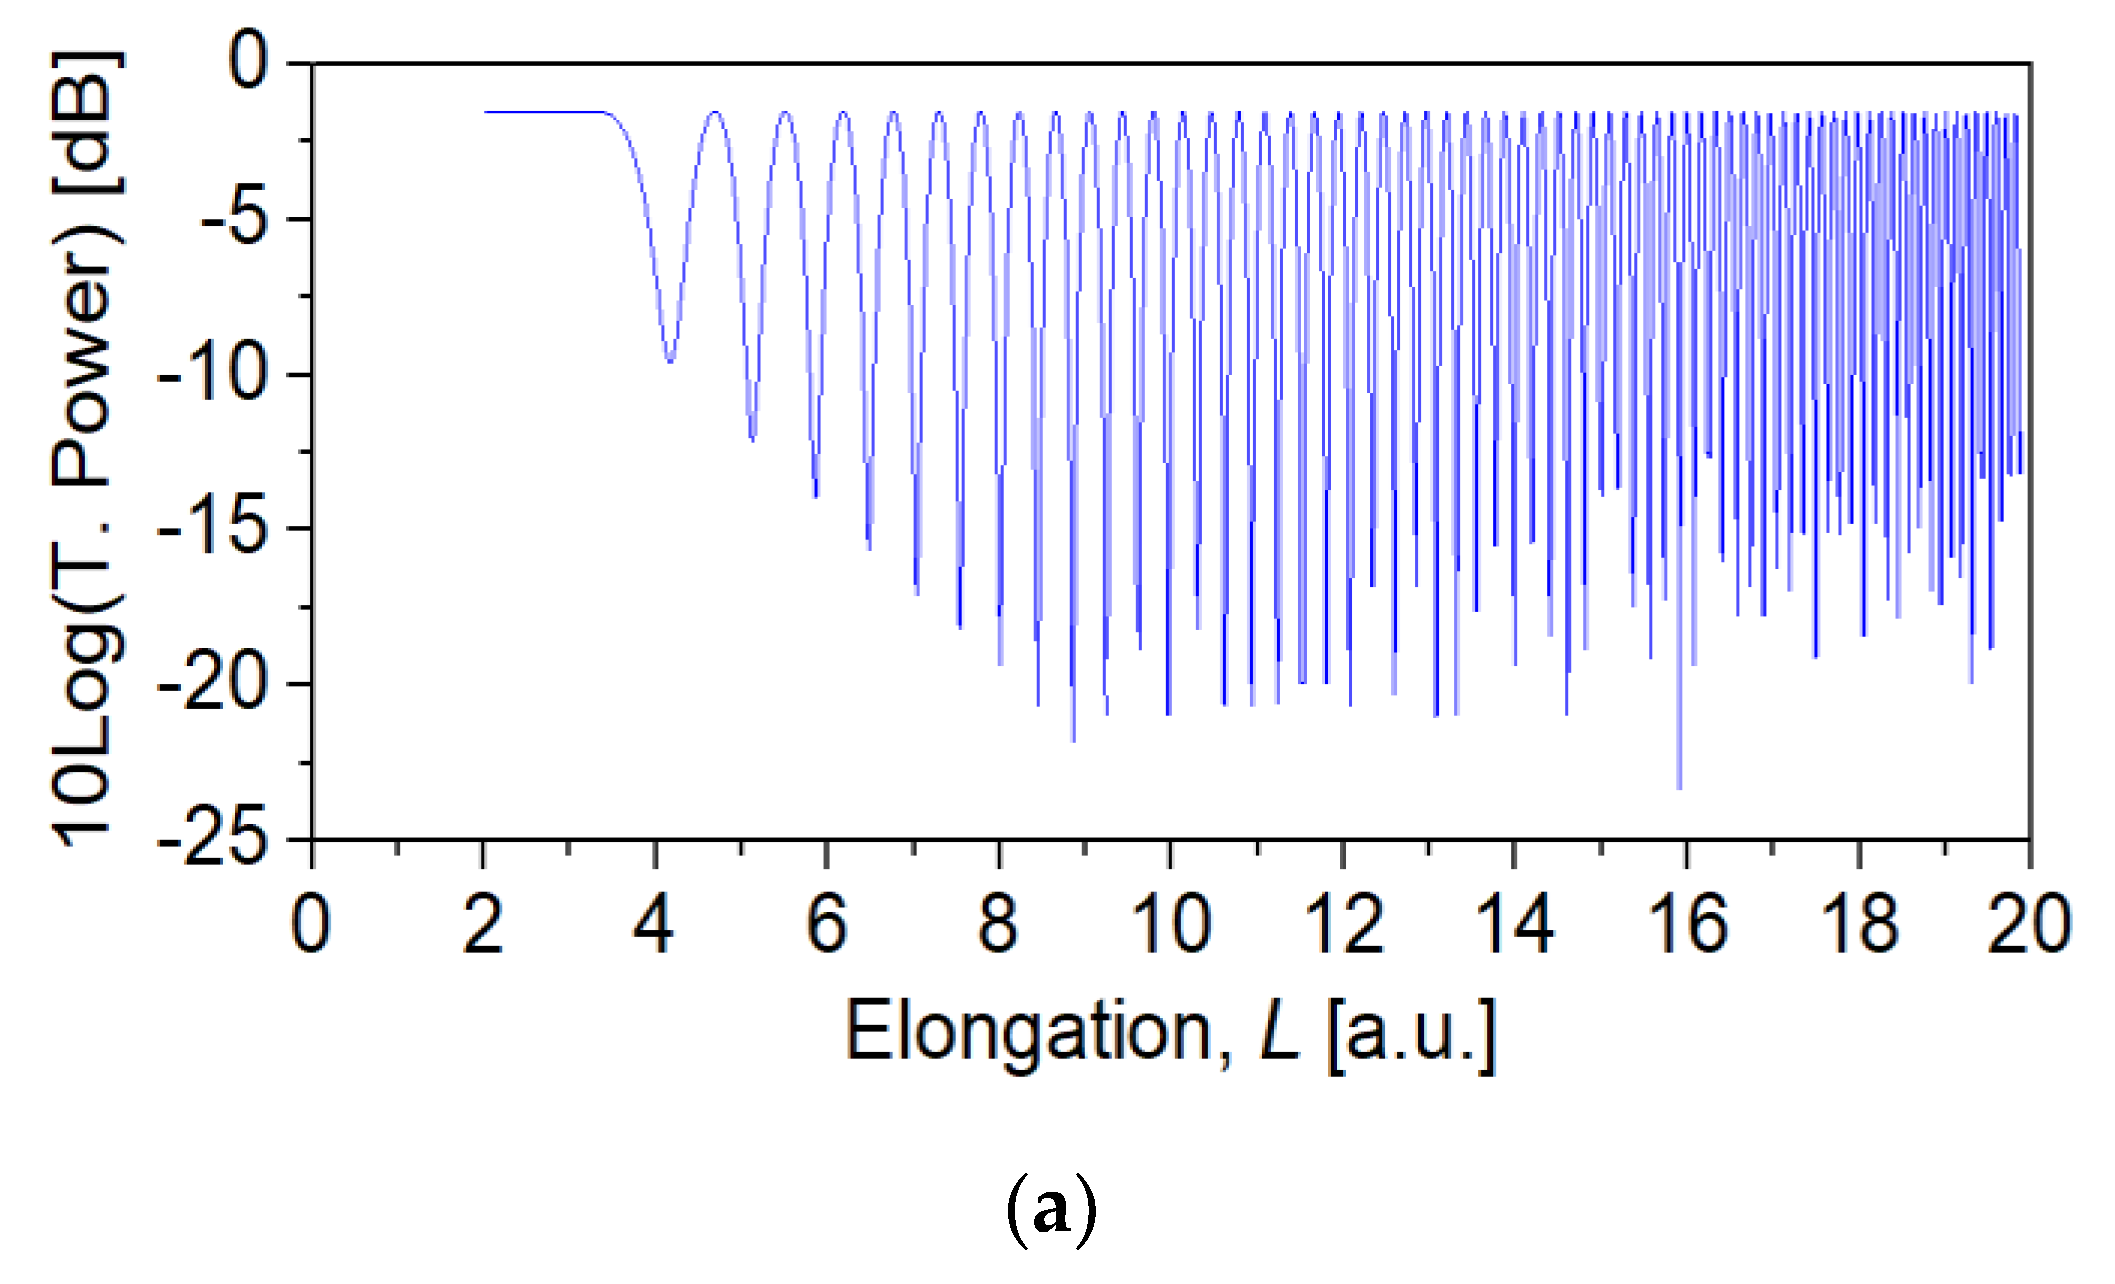
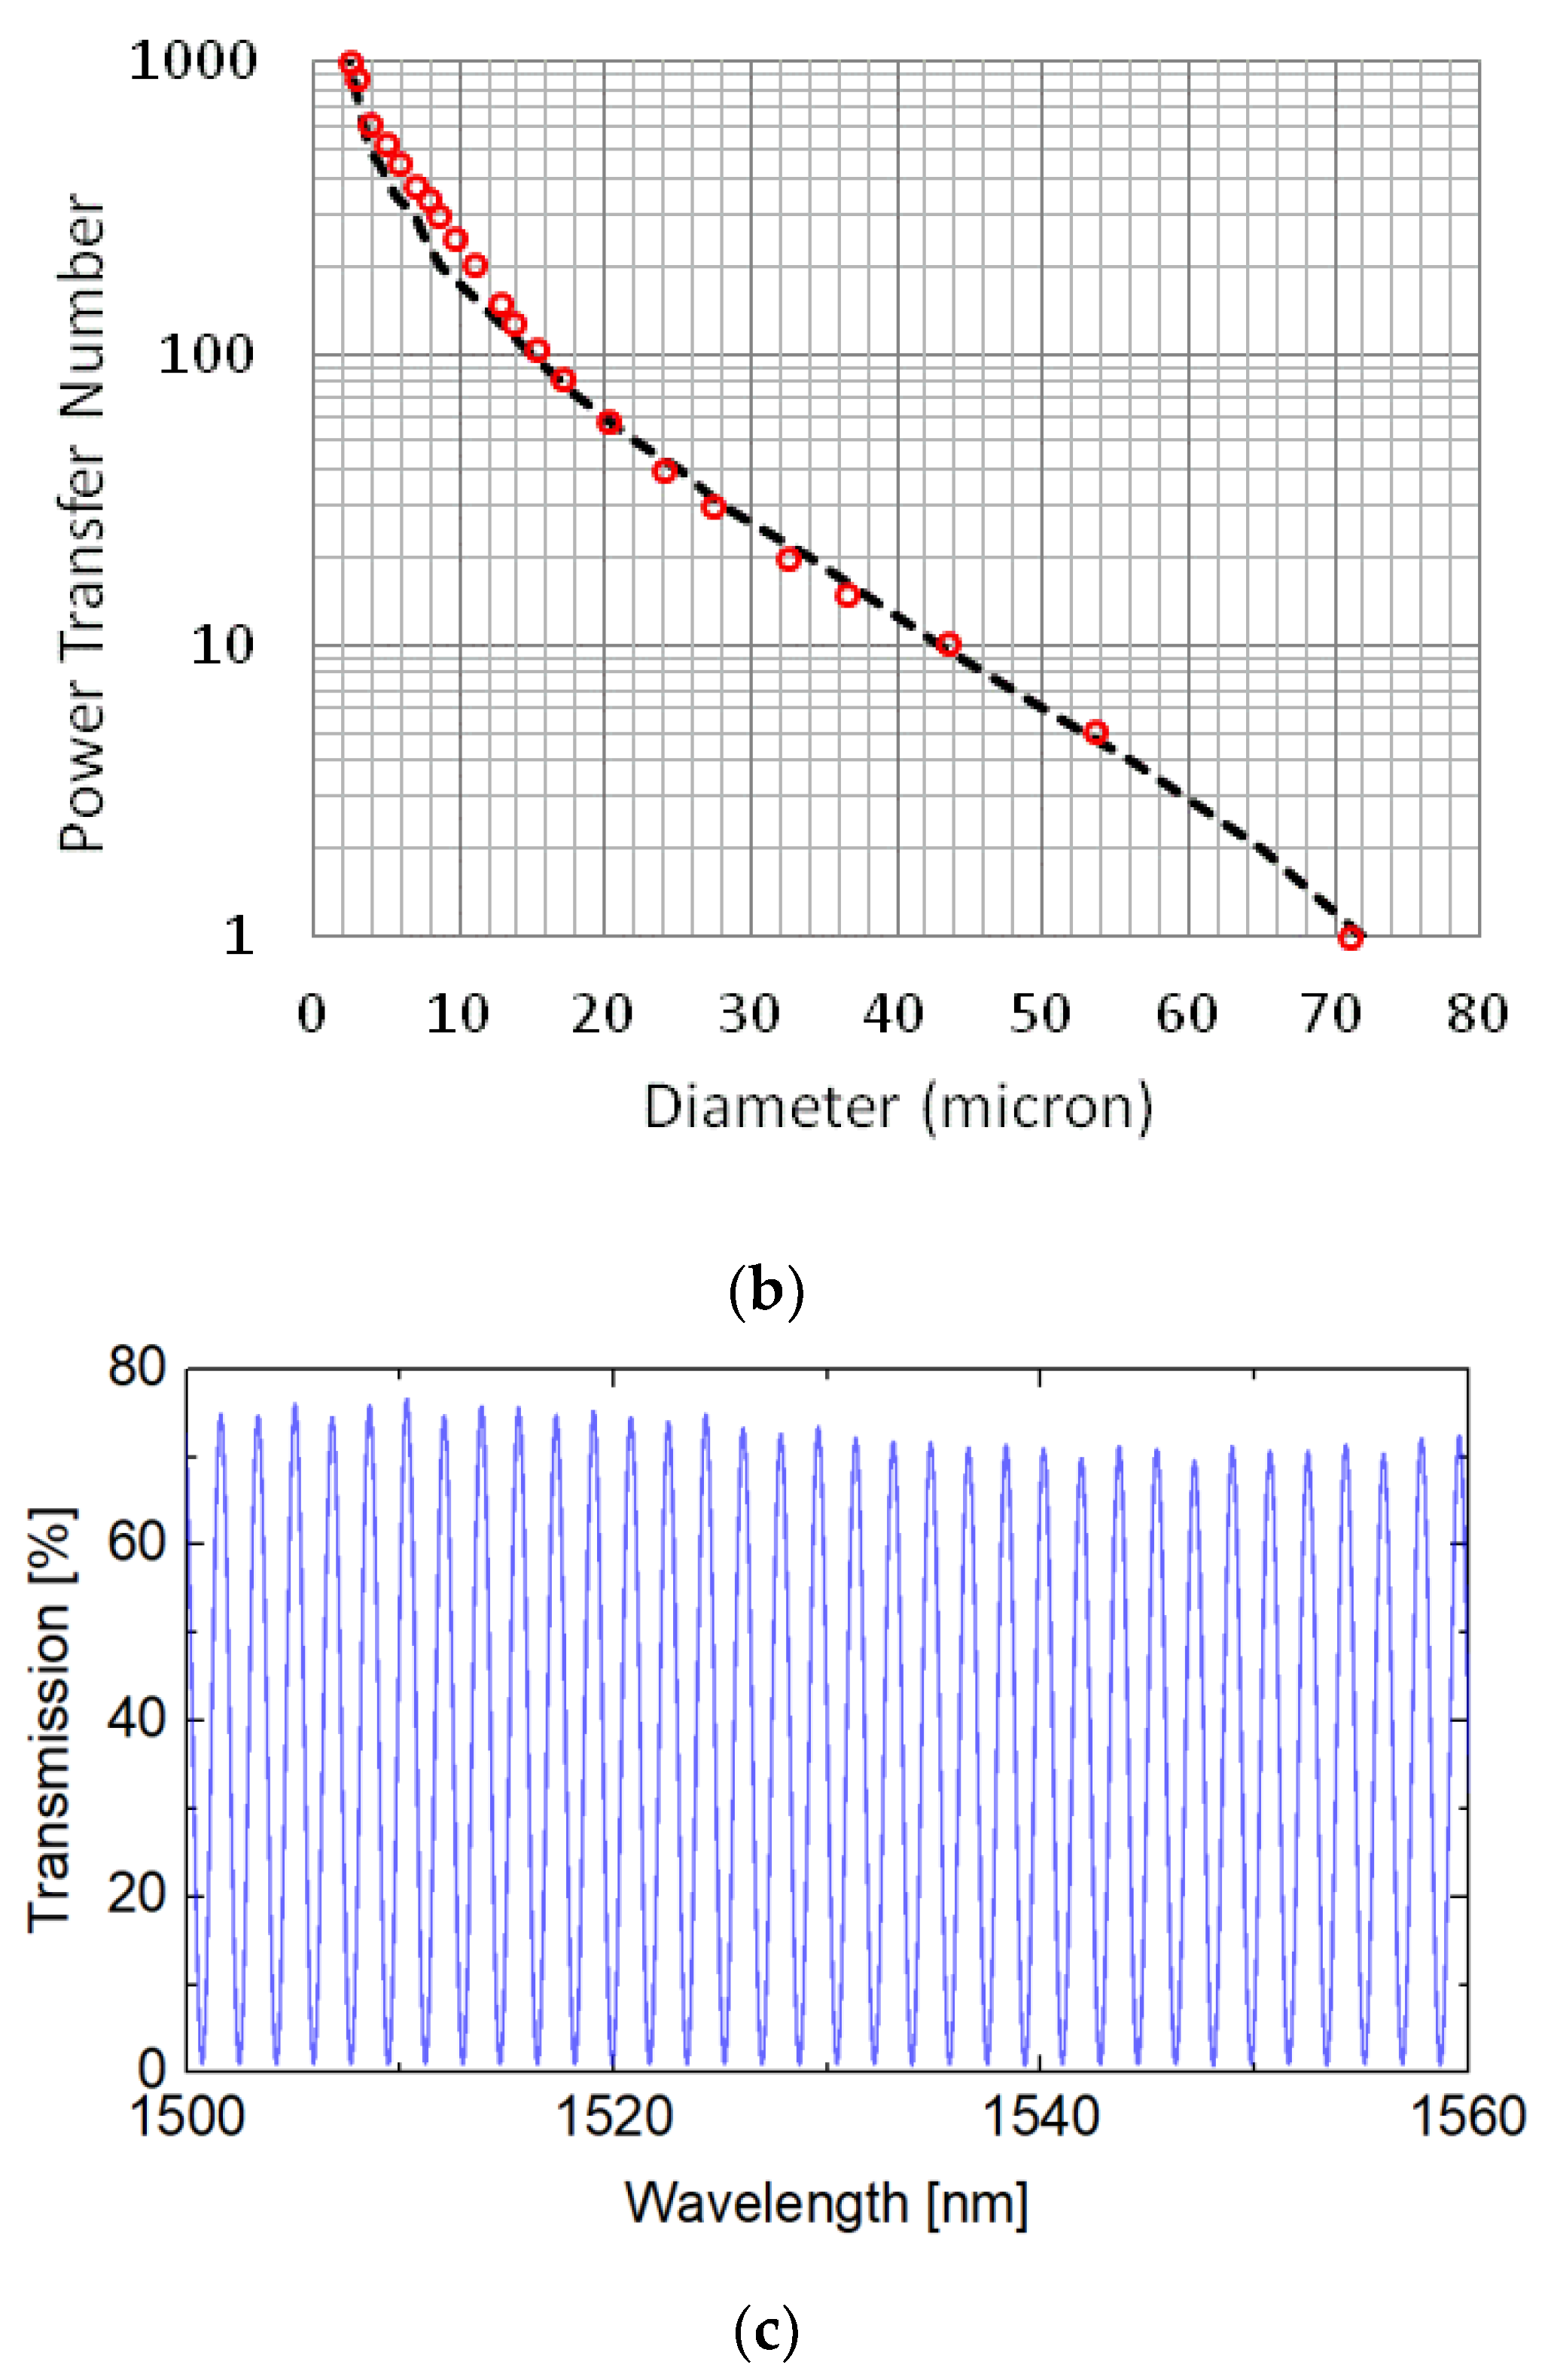
Figure 5a shows the first 65 power oscillations recorded at λ0 = 1.55 μm from the fiber core output during the taper fabrication. The number of times the transmitted power drops, and returns to its maximum value is named power transfer number (PTN). Additionally, the PTN of such a device assume higher values as the taper elongation increases. Figure 5b shows the PTN as a function of the taper external diameter, producing up to roughly 103 PTNs.
The PTN affects dramatically the spectral response of such tapers, i.e., tapers with higher PTNs produce higher resolution FSR. For example, a taper 76 mm long showing PTN = 907, at λ0 = 1.55 μm, produced FSR ~1.7 nm. The measured spectral response of this taper is shown in Figure 5c, which presents an insertion loss ~1.1 dB.
3. Results and Discussion
As shown in the previous session, the specific refractive index profile and adiabatic tapering condition of this DCF could produce high PTNs and high-resolution spectral filters; not easily reproduced or obtained using standard commercial fibers. We use these characteristics to demonstrate a digital linear strain sensor in this session.
The output power of this FT experiences, at a fixed wavelength, a number of PTTP when it is under stress, and this PTTP is directly proportional to ΔL/Lc. An intrinsic sine square transfer function has two PTTP per cycle. We modeled the axial strain, ε = ΔL/Lc, where Lc is the intra clamps length, on the optical length of the interferometer, by applying a strain σ = F/π·r2(z,tT) [N/m2] at the FT clamp points. F is the applied external force. For approximation’s sake we derived Equation (7) from Hooke’s Law, and assumed a Young’s Modulus of r = 7 × 10¹⁰ N/m2 for SiO2.
To preserve the sensor integrity, the elastic limit of the SiO2, of the FTs were restricted to an axial stress of σ ~ 5 × 10⁶ N/m2, i.e., 0.007% of the Young’s Modulus of the SiO2. From the solution of Equations (1) and (2), an unstressed FT ~ 80 mm long has a minimum radius at the waist 3 < ρwaist < 4 μm, and PTN ~840 at λ0 = 1.55 μm. According to Equation (7), when this FT is submitted to σe, it will be elongated by ΔL ~700 µm, ΔL/Lc ~ 0.7%, which is equivalent to an increase ΔPTN ~ 50, or a number of PTTP ~ 100.
Case Study: In-Line All-Fiber Digital Optical Strain Sensor
For this case study, we fabricated a biconic taper using the same DCF, but by using a different fused and pull process, known as the flame brushing technique [30], in special, to explore the advantage of this special fiber in producing optical components in an easy and fast way. The fabrication involves heating a well-defined portion of fiber with a cyclic moving flame, from 14 to 6.7 mm in amplitude, while applying a tensile force by pulling the fiber with translation stages, each one having sub micrometer resolution. The fiber has an initial Lc = 20 mm, 14 mm of it being tapered down to form the fiber transition regions, and the taper waist. The transition regions can have a controllable shape [30], being linear in the tapered structure presented here.
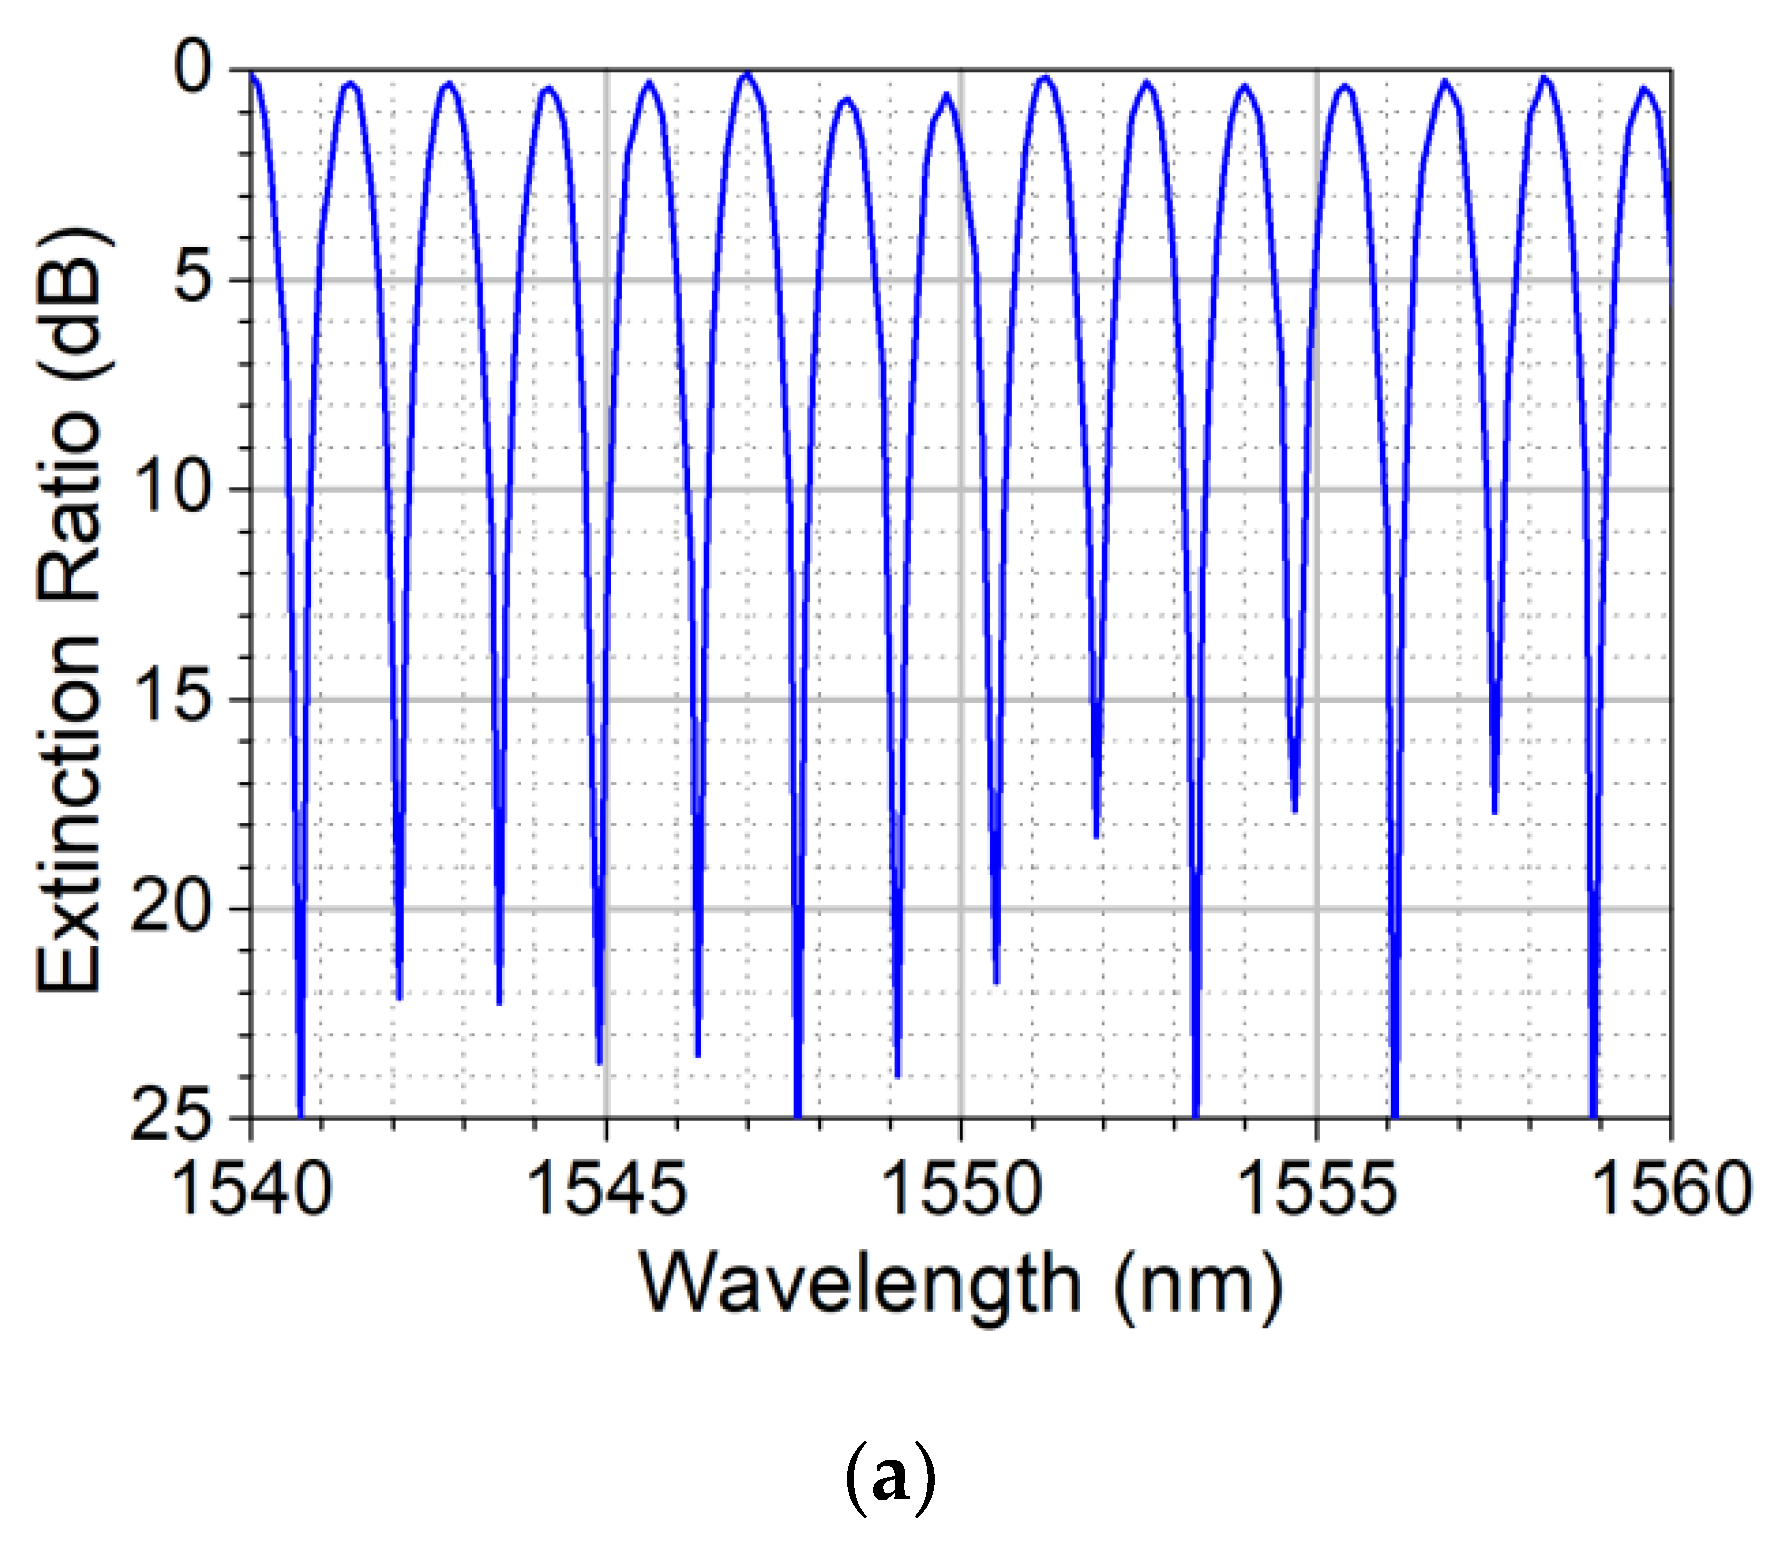
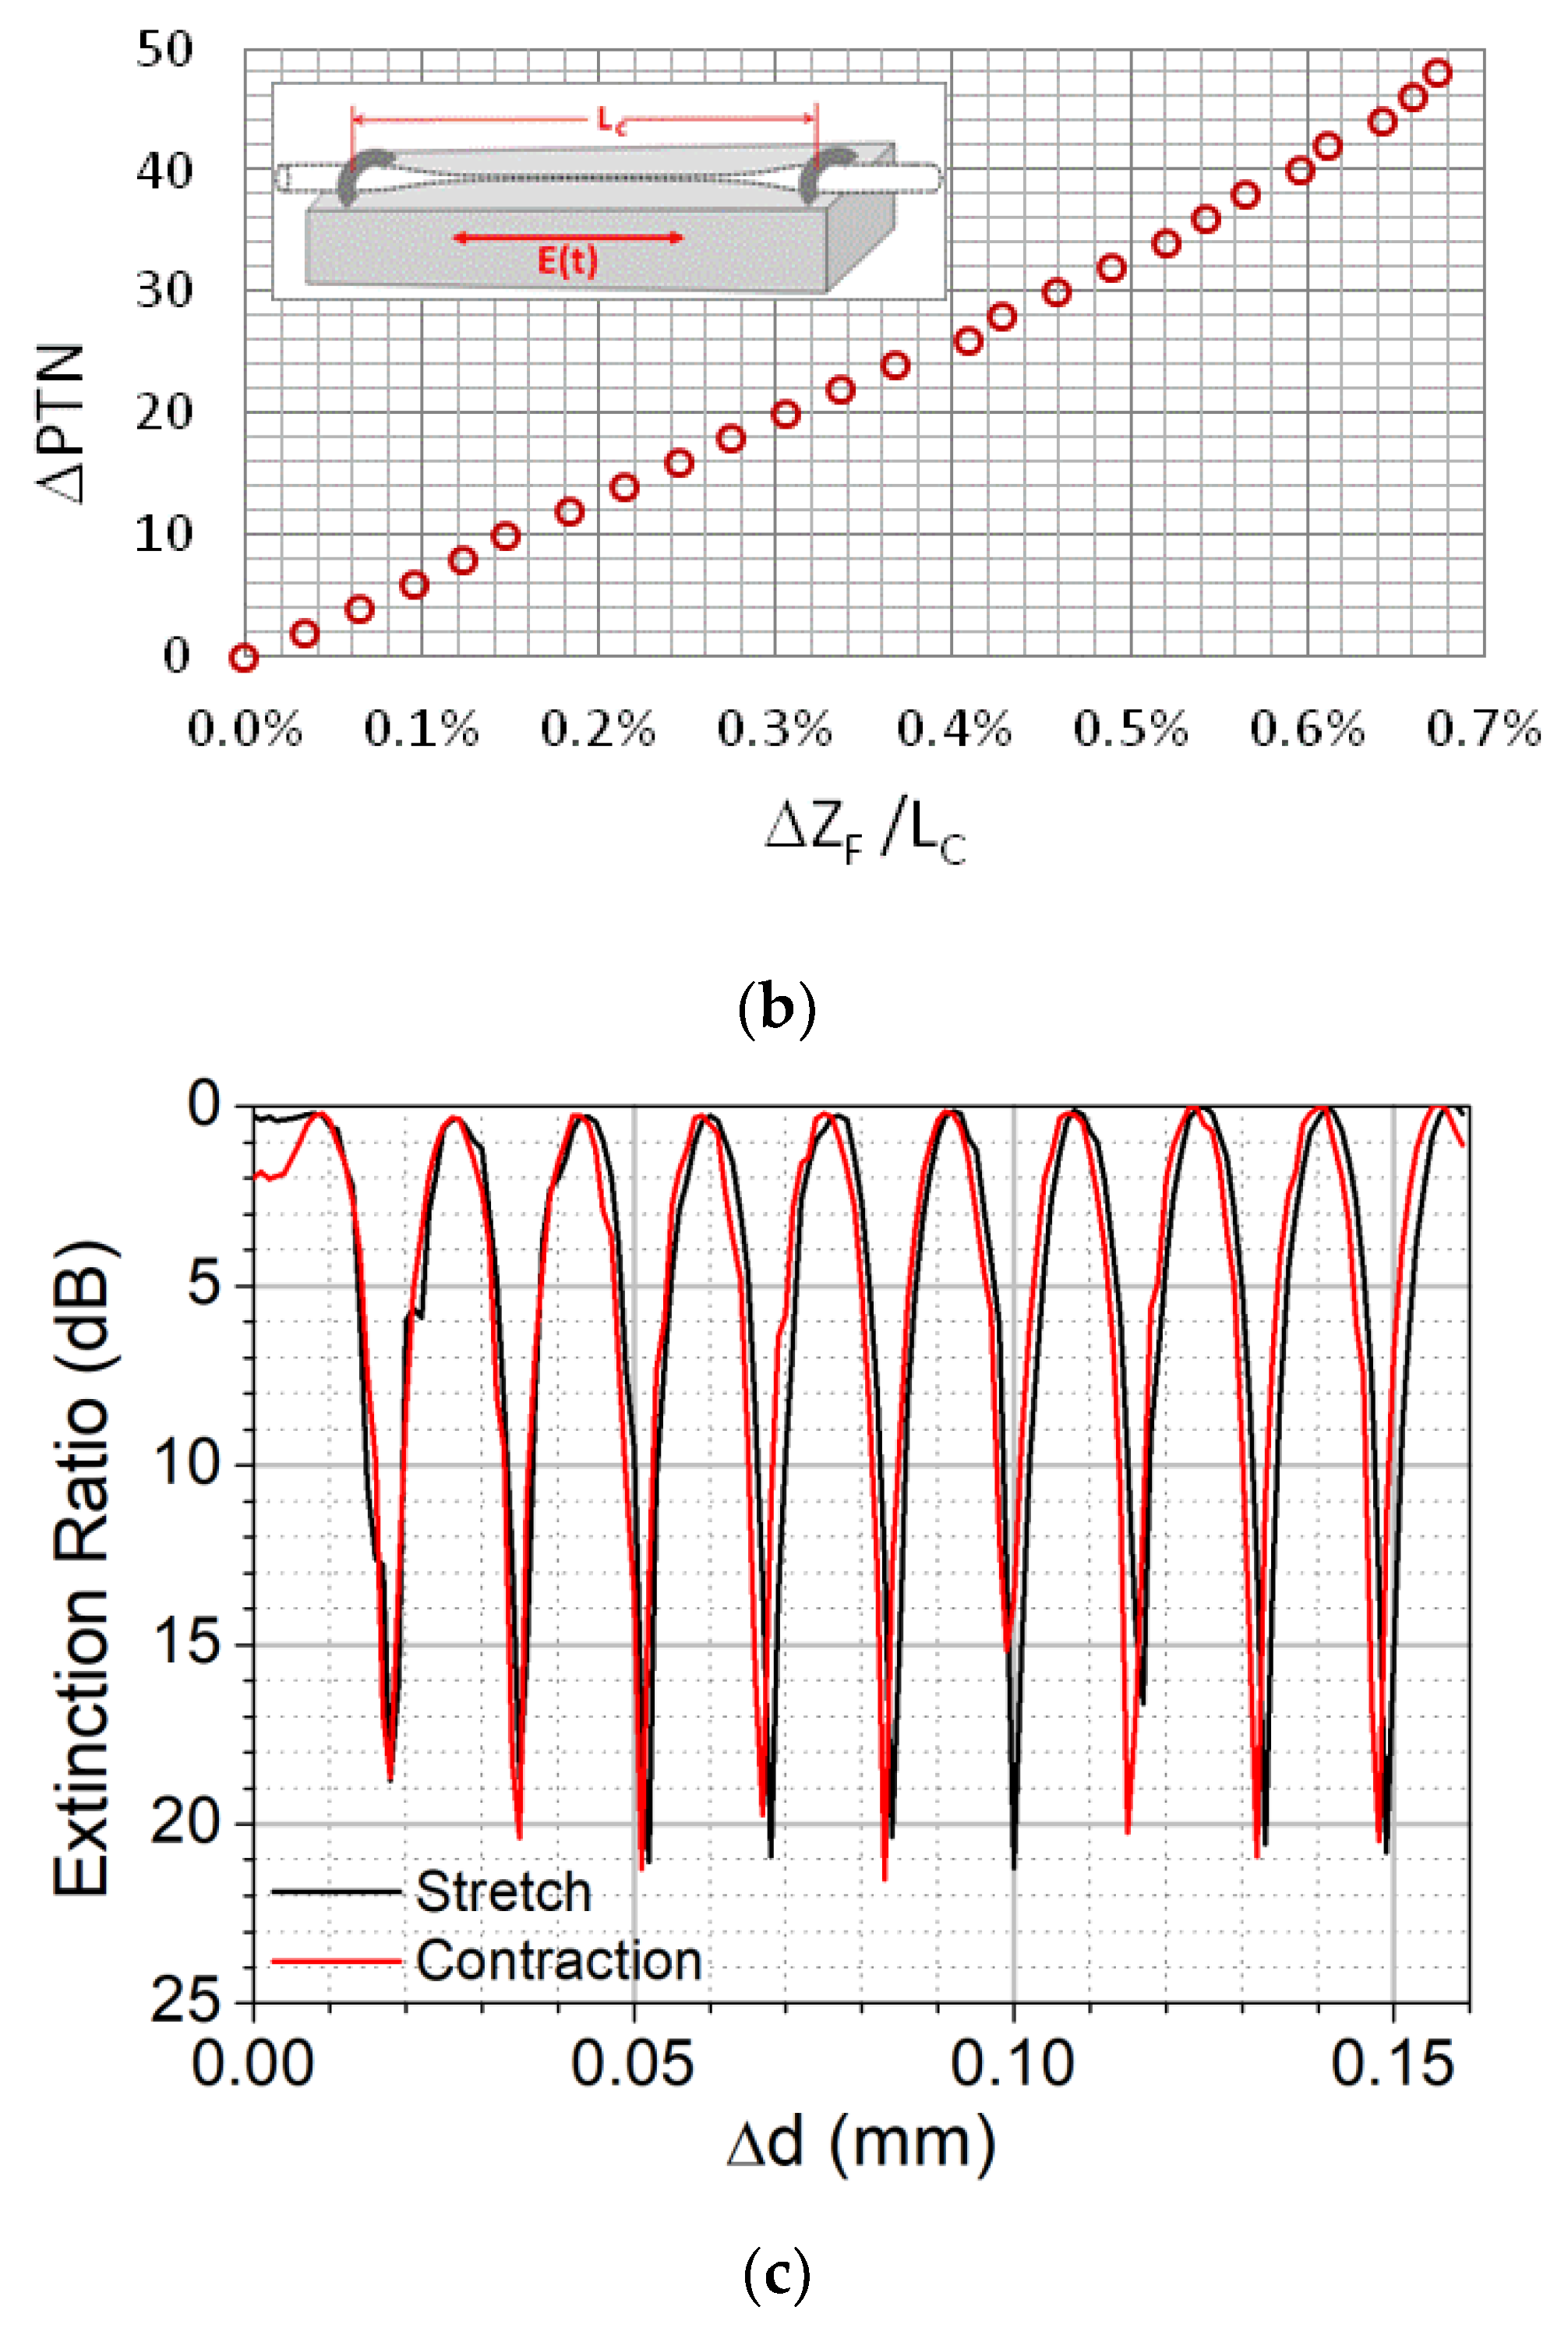
Figure 6a shows the experimental optical spectral window, from 1.54 to 1.56 μm, of the taper structure (L = 84 mm, Lc = 104 mm) when, after over 950 PTNs, the DCF diameter was reduced from the original 125 μm to 3.9 μm (ρwaist ~ 2 μm). The FT optical spectra exhibits an insertion loss under 1 dB, an FSR = 1.3 nm, and an extinction ratio above 17 dB. The linear response of this in-line digital strain sensor is presented in Figure 6b, where the ΔPTN is shown as a function of the applied strain (ΔZF/Lc). It can be noticed from this figure that the in-line digital strain sensor operates by counting the PTTP = 2ΔPTN when it is under traction/compression along the longitudinal direction, with a digital resolution of 7.4 μm/PTTN. A quasi-symmetric response of this sensor under stretch and contraction up till Δd = 0.15 mm (along its longitudinal direction) presented in Figure 6c allows us to visualize the low backlash. It is important to mention that the transmission and detection of two distinct wavelengths spectrally spaced by an odd multiple of FSR/4 are necessary for sensing and distinguishing compression from traction. For comparison’s sake, the analog response of this same sensor shows a resolution of about 0.7 nm; which is a very high analog resolution for a tapered-based CMZI sensor. Furthermore, this sensor presents a practical digital dynamic range for a myriad of applications.
The proposed digital and linear optical sensing device, with at least two orders of magnitude of dynamic range, operates by counting either PTN or PTTP when submitted to an external force field. The transmission and detection of two wavelengths, spaced apart by an odd multiple of FSR/2, are required to sense traction and compression in this device.
4. Conclusions
We demonstrated an all-fiber digital sensor approach with a linear response based on biconic taper. The tapers-based CMZI were fabricated from a highly DCF using two distinct adiabatic tapering processes, resulting in tapers with a high-quality spectral response. As a proof of concept, we fabricated and characterized an optical axial strain sensor with FSR = 1.3 nm. The sensor is modeled to probe up to 0.7% of strain, returning PTTP = 96, at λ0 = 1.55 μm, when it is under stress. In such a sensor, when an external force field acts on the optical path of both modes HE11 and HE12, it produces a linear variation of the PTTP which was used as a discrete/digital response in opposition to the conventional approach (analog), commonly used in interferometric sensors. Also, the axial strain sensor showed a quasi-symmetric response to stretch and compression, thus allowing not only the sensing of these forces but also to distinguish compression and traction. When this sensor was elongated by ΔL = 707 µm produced a digital resolution of 7.4 µm/PTTP. Also, the analog response of this same component shows a resolution of about 0.7 nm; which is a very high analog resolution for a taper-based CMZI sensor.
Author Contributions
Conceptualization, S.C.; methodology, S.C. and G.N.M.-S.; software, S.C. and G.N.M.-S.; resources, N.G., S.C. and Y.M.; validation, S.C. and G.N.M.-S.; formal analysis investigation, S.C. and G.N.M.-S.; resources, digital optical strain sensor experimental data, C.R.B., S.C. and Y.M.; data curation, S.C. and G.N.M.-S.; writing—original draft preparation, S.C. and G.N.M.-S.; writing—review and editing, S.C., G.N.M.-S. and Y.M.; supervision, S.C.; project administration, S.C.; funding acquisition, S.C. All authors have read and agreed to the published version of the manuscript.
Funding
This research had the following funding: Author S.C. was supported under researchship CNPq-DTI grant 381532/2021-6, and FUNTTEL financial grant # 01.16.0053.01 FINEP/MCTI-Brazilian Ministry of Science, Communications, and Innovations. Author C.R.B was supported under CNPq-PCI grant number 300616/2022-8. G.N.M.-S. would like to thank the support of the INCT FOTONICOM/CNPq/FAPESP.
Institutional Review Board Statement
Not applicable.
Informed Consent Statement
Not applicable.
Data Availability Statement
Not applicable.
Acknowledgments
We thank F.M. Smolka, and Cristiano M. de B. Cordeiro, for the assistance with the heat-and-pulling stations, and C.P. Guerra for the assistance with some optical measurements.
Conflicts of Interest
The authors declare no conflict of interest.
References
- Brambilla, G.; Xu, F.; Horak, P.; Jung, Y.; Koizumi, F.; Sessions, N.P.; Koukharenko, E.; Feng, X.; Murugan, G.S.; Wilkinson, J. Optical fiber nanowires and microwires: Fabrication and applications. Adv. Opt. Photonics 2009, 1, 107. [Google Scholar] [CrossRef]
- Korposh, S.; James, S.; Lee, S.-W.; Tatam, R. Tapered Optical Fibre Sensors: Current Trends and Future Perspectives. Sensors 2019, 19, 2294. [Google Scholar] [CrossRef] [PubMed]
- Gonthier, F.; Lacroix, S.; Daxhelet, X.; Black, R.J.; Bures, J. Broadband all-fiber filters for wavelength division multiplexing application. Appl. Phys. Lett. 1989, 54, 1290–1292. [Google Scholar] [CrossRef]
- Celaschi, S.; Malheiros-Silveira, G.N. High-Resolution and Low-Loss All-Fiber Spectral Filters Based on Biconic Tapers. J. Lightwave Technol. 2017, 35, 5381–5384. [Google Scholar] [CrossRef]
- Dimmick, T.E.; Kakarantzas, G.; Birks, T.A.; Diez, A.; Russell, P.S.J. Compact all-fiber acoustooptic tunable filters with small bandwidth-length product. IEEE Photonics Technol. Lett. 2000, 12, 1210–1212. [Google Scholar] [CrossRef]
- Birks, T.A.; Wadsworth, W.J.; Russell, P.S.J. Supercontinuum generation in tapered fibers. Opt. Lett. 2000, 25, 1415. [Google Scholar] [CrossRef]
- Kieu, K.; Mansuripur, M. Tuning of fiber lasers by use of a single-mode biconic fiber taper. Opt. Lett. 2006, 31, 2435. [Google Scholar] [CrossRef]
- Du, W.; Tao, X.; Tam, H.-Y. Temperature independent strain measurement with a fiber grating tapered cavity sensor. IEEE Photonics Technol. Lett. 1999, 11, 596–598. [Google Scholar]
- Tian, Z.; Yam, S.S.-H. In-Line Abrupt Taper Optical Fiber Mach–Zehnder Interferometric Strain Sensor. IEEE Photonics Technol. Lett. 2009, 21, 161–163. [Google Scholar] [CrossRef]
- Wu, D.; Zhu, T.; Chiang, K.S.; Deng, M. All Single-Mode Fiber Mach–Zehnder Interferometer Based on Two Peanut-Shape Structures. J. Lightwave Technol. 2012, 30, 805–810. [Google Scholar] [CrossRef]
- Martins, T.J.M.; Marques, M.B.; Roy, P.; Jamier, R.; Fevrier, S.; Frazao, O. Temperature-Independent Multi-Parameter Measurement Based on a Tapered Bragg Fiber. IEEE Photonics Technol. Lett. 2016, 28, 1565–1568. [Google Scholar] [CrossRef] [Green Version]
- Zhu, C.; Yu, Y.; Zhang, X.; Chen, C.; Liang, J.; Liu, Z.; Sun, H.-B. Compact Mach–Zehnder Interferometer Based on Tapered Hollow Optical Fiber. IEEE Photonics Technol. Lett. 2015, 27, 1277–1280. [Google Scholar] [CrossRef]
- Wieduwilt, T.; Brückner, S.; Bartelt, H. High force measurement sensitivity with fiber Bragg gratings fabricated in uniform-waist fiber tapers. Meas. Sci. Technol. 2011, 22, 075201. [Google Scholar] [CrossRef]
- Bock, W.J.; Chen, J.; Mikulic, P.; Eftimov, T. A Novel Fiber-Optic Tapered Long-Period Grating Sensor for Pressure Monitoring. IEEE Trans. Instrum. Meas. 2007, 56, 1176–1180. [Google Scholar] [CrossRef]
- Osuch, T.; Markowski, K.; Jedrzejewski, K. Temperature Independent Tapered Fiber Bragg Grating-Based Inclinometer. IEEE Photonics Technol. Lett. 2015, 27, 2312–2315. [Google Scholar] [CrossRef]
- Gong, H.; Qian, Z.; Yang, X.; Zhao, C.; Dong, X. Optical Fiber Inclinometer Based on a Fiber Taper Cascading a Peanut-Shape Structure. IEEE Sens. J. 2015, 15, 3917–3920. [Google Scholar] [CrossRef]
- Geng, Y.; Li, X.; Tan, X.; Deng, Y.; Yu, Y. High-Sensitivity Mach–Zehnder Interferometric Temperature Fiber Sensor Based on a Waist-Enlarged Fusion Bitaper. IEEE Sens. J. 2011, 11, 2891–2894. [Google Scholar] [CrossRef]
- Gan, L.; Wang, R.; Liu, D.; Duan, L.; Liu, S.; Fu, S.; Tang, M. Spatial-Division Multiplexed Mach–Zehnder Interferometers in Heterogeneous Multicore Fiber for Multiparameter Measurement. IEEE Photonics J. 2016, 8, 15716155. [Google Scholar] [CrossRef]
- Guerra, C.P.; Malheiros-Silveira, G.N.; Celaschi, S. Thermal response of a packaged narrowband optical filter based on biconically tapered depressed-cladding fibre. Electron. Lett. 2019, 55, 849–851. [Google Scholar] [CrossRef]
- Cusano, A.; Pilla, P.; Contessa, L.; Iadicicco, A.; Campopiano, S.; Cutolo, A.; Guerra, G. High-sensitivity optical chemosensor based on coated long-period gratings for sub-ppm chemical detection in water. Appl. Phys. Lett. 2005, 87, 234105. [Google Scholar] [CrossRef]
- Korposh, S.; Selyanchyn, R.; Yasukochi, W.; Lee, S.-W.; James, S.W.; Tatam, R.P. Optical fibre long period grating with a nanoporous coating formed from silica nanoparticles for ammonia sensing in water. Mater. Chem. Phys. 2012, 133, 784–792. [Google Scholar] [CrossRef]
- Chen, L.H.; Chan, C.C.; Ni, K.; Hu, P.B.; Li, T.; Wong, W.C.; Leong, K.C. Label-free fiber-optic interferometric immunosensors based on waist-enlarged fusion taper. Sens. Actuators B Chem. 2013, 178, 176–184. [Google Scholar] [CrossRef]
- Snyder, A.W.; Love, J.D. Optical Waveguide Theory; Springer: Boston, MA, USA, 1984. [Google Scholar]
- Celaschi, S.; Malheiros-Silveira, G.N.; Grégoire, N.; Morency, S.; Messaddeq, Y.; Floridia, C.; Rosolem, J.B. Design Tolerances of Devices Based on Tapered Depressed-Cladding Fibers. In Proceedings of theLatin America Optics and Photonics Conference, Lima, Peru, 12–15 November 2018. [Google Scholar]
- Kieu, K.Q.; Mansuripur, M. Biconical Fiber Taper Sensors. IEEE Photonics Technol. Lett. 2006, 18, 2239–2241. [Google Scholar] [CrossRef]
- Wiedemann, U.; Karapetyan, K.; Dan, C.; Pritzkau, D.; Alt, W.; Irsen, S.; Meschede, D. Measurement of submicrometre diameters of tapered optical fibres using harmonic generation. Opt. Express 2010, 18, 7693–7704. [Google Scholar] [CrossRef]
- Mores, J.A., Jr.; Malheiros-Silveira, G.N.; Fragnito, H.L.; Hernández-Figueroa, H.E. Efficient calculation of higher-order optical waveguide dispersion. Opt. Express 2010, 18, 19522. [Google Scholar] [CrossRef] [PubMed]
- Sorensen, H.L.; Polzik, E.S.; Appel, J. Heater Self-Calibration Technique for Shape Prediction of Fiber Tapers. J. Lightwave Technol. 2014, 32, 1886–1891. [Google Scholar] [CrossRef]
- Bansal, N.P.; Doremus, R.H. Handbook of Glass Properties; Elsevier: Amsterdam, The Netherlands, 1986. [Google Scholar]
- Biazoli, C.R.; Silva, S.; Franco, M.A.R.; Frazão, O.; Cordeiro, C.M.B. Multimode interference tapered fiber refractive index sensors. Appl. Optics 2012, 51, 5941–5945. [Google Scholar] [CrossRef] [Green Version]
Figure 1.
(a) 3-D schematics of a biconic FT based on a DCF. L represents the biconic taper elongation length, ρ and n are the radii and the refractive indexes of each DCF layer (rod, gap, tube), respectively. The refractive index in each layer is highlighted at the taper end’s face. (b) 2-D experimental data of the refractive index distribution from the DCF used in this work.


Figure 2.
(a) ∆β of the modes HE11 and HE12 during ρtube variation at λ0 = 1.55 μm. Inset outlines the effective refractive indexes near the phase-matching. (b,c) show the normalized modulus of the E-field for the modes HE11 and HE12, respectively, at the phase matching condition.
Figure 2.
(a) ∆β of the modes HE11 and HE12 during ρtube variation at λ0 = 1.55 μm. Inset outlines the effective refractive indexes near the phase-matching. (b,c) show the normalized modulus of the E-field for the modes HE11 and HE12, respectively, at the phase matching condition.


Figure 3.
Experimental and modeled temperature curves of the graphite tube (heating element). The SiO2 glass liquid transition temperature is shown in (dash line). Axial viscosity of the fiber material is shown in squares (red color). Below 1000 °C, extrapolation follows the temperature curve model of the graphite element.

Figure 4.
Normalized slope of the taper (blue solid line) and 1/zb (dashed point red line) versus outer radii, ρtube, for the elongation time, tT = 150 s.
Figure 4.
Normalized slope of the taper (blue solid line) and 1/zb (dashed point red line) versus outer radii, ρtube, for the elongation time, tT = 150 s.

Figure 5.
(a) Transmitted power recorded at λ0 = 1.55 μm during taper fabrication for the first 65 oscillations. (b) PTN versus taper waist diameter. The experimental results are represented in red open circles, and the model simulation by black dashed line. According to the simulation, longer tapers (L ~ 85 mm) result in PTN ~ 103, 1.4 < FSR < 1.8 nm, and 4 < ρwaist < 6 µm. (c) Spectral response obtained from a taper 76 mm long, FSR = 1.7 nm, taper waist diameter ~5.6 µm, and insertion loss ~1.1 dB.


Figure 6.
(a) Experimental optical transmission spectra of the tapered structure (L = 84 mm, Lc = 104 mm) showing FSR = 1.3 nm, insertion loss below 1 dB, and extinction ratio above 17 dB. (b) Linear strain sensing response: ΔPTN versus strain ΔZF/Lc at 1.55 μm ranging from 0 to 0.7%. (c) Symmetric response of the sensor under stretch and contraction for length variation of Δd = 0.15 mm.


Publisher’s Note: MDPI stays neutral with regard to jurisdictional claims in published maps and institutional affiliations. |
© 2022 by the authors. Licensee MDPI, Basel, Switzerland. This article is an open access article distributed under the terms and conditions of the Creative Commons Attribution (CC BY) license (https://creativecommons.org/licenses/by/4.0/).
Share and Cite
MDPI and ACS Style
Celaschi, S.; Grégoire, N.; Messaddeq, Y.; Biazoli, C.R.; Malheiros-Silveira, G.N. Coaxial Mach–Zehnder Digital Strain Sensor Made from a Tapered Depressed Cladding Fiber. Sensors 2022, 22, 7145. https://doi.org/10.3390/s22197145
AMA Style
Celaschi S, Grégoire N, Messaddeq Y, Biazoli CR, Malheiros-Silveira GN. Coaxial Mach–Zehnder Digital Strain Sensor Made from a Tapered Depressed Cladding Fiber. Sensors. 2022; 22(19):7145. https://doi.org/10.3390/s22197145
Chicago/Turabian StyleCelaschi, Sergio, Nicolas Grégoire, Younès Messaddeq, Claudecir R. Biazoli, and Gilliard N. Malheiros-Silveira. 2022. "Coaxial Mach–Zehnder Digital Strain Sensor Made from a Tapered Depressed Cladding Fiber" Sensors 22, no. 19: 7145. https://doi.org/10.3390/s22197145
Note that from the first issue of 2016, this journal uses article numbers instead of page numbers. See further details here.