
Stroke Risk Prediction with Machine Learning Techniques


Department of Computer Engineering and Informatics, University of Patras, 26504 Patras, Greece
*
Author to whom correspondence should be addressed.
Sensors 2022, 22(13), 4670; https://doi.org/10.3390/s22134670
Submission received: 27 May 2022
/
Revised: 16 June 2022
/
Accepted: 20 June 2022
/
Published: 21 June 2022
(This article belongs to the Special Issue Machine Learning for Biomedical Sensing and Healthcare)
Abstract
:A stroke is caused when blood flow to a part of the brain is stopped abruptly. Without the blood supply, the brain cells gradually die, and disability occurs depending on the area of the brain affected. Early recognition of symptoms can significantly carry valuable information for the prediction of stroke and promoting a healthy life. In this research work, with the aid of machine learning (ML), several models are developed and evaluated to design a robust framework for the long-term risk prediction of stroke occurrence. The main contribution of this study is a stacking method that achieves a high performance that is validated by various metrics, such as AUC, precision, recall, F-measure and accuracy. The experiment results showed that the stacking classification outperforms the other methods, with an AUC of 98.9%, F-measure, precision and recall of 97.4% and an accuracy of 98%.
1. Introduction
According to the World Stroke Organization [1], 13 million people get a stroke each year, and approximately 5.5 million people will die as a result. It is the leading cause of death and disability worldwide, and that is why its imprint is serious in all aspects of life. Stroke not only affects the patient but also affects the patient’s social environment, family and workplace. In addition, contrary to popular belief, it can happen to anyone, at any age, regardless of gender or physical condition [2].
A stroke is defined as an acute neurological disorder of the blood vessels in the brain that occurs when the blood supply to an area of the brain stops and the brain cells are deprived of the necessary oxygen. Stroke is divided into ischemic and hemorrhagic. It can be mild to very severe with permanent or temporary damage. Hemorrhages are rare and involve the rupture of a blood vessel resulting in cerebral hemorrhage. Ischemic strokes, which are the most common, involve the cessation of blood flow to an area of the brain due to a narrowing or blockage of an artery [3,4].
Factors that increase the chance of having a stroke are the existence of a similar stroke in the past, the existence of a transient stroke, the presence of myocardial infarction, and other heart diseases, such as heart failure, atrial fibrillation, age (if someone is over 55 years of age, they are clearly more likely to be affected, although stroke is described at any age, even in children), hypertension, carotid stenosis from atherosclerosis, smoking, high blood cholesterol, diabetes, obesity, sedentary lifestyle, alcohol consumption, blood clotting disorders, estrogen therapy and the use of euphoric substances such as cocaine and amphetamines [5,6,7].
Moreover, stroke progresses rapidly, and its symptoms can vary. Symptoms can sometimes develop slowly and sometimes it can develop quickly. It is even possible for someone to wake up while sleeping with symptoms. A stroke occurs with the sudden onset of one or more symptoms. The main ones are paralysis of the arms or legs (usually on one side of the body), numbness in the arms or legs or sometimes on the face, difficulty speaking, difficulty walking, dizziness, decreased vision, headache and vomiting and a drop in the angle of the mouth (crooked mouth). Finally, in severe strokes, the patient loses consciousness and falls into a coma [8,9].
Once the patient has had a stroke, a computerized tomography (CT) scan immediately provides a diagnosis. In the case of ischemic stroke, magnetic resonance imaging (MRI) is efficient. Other ancillary diagnostic tests are carotid triplex and cardiac triplex. Strokes can be severe (extensive) or mild. In the vast majority of cases, the first 24 h are crucial. The diagnosis will highlight the treatment, which is usually pharmaceutical, and, in a few cases, surgical. Intubation and mechanical ventilation in the intensive care unit are necessary when the patient has fallen into a coma [10,11].
Although some patients recover after a stroke, the vast majority continue to have problems depending on the severity of the stroke, such as memory, concentration and attention problems, difficulty speaking or understanding speech, emotional problems such as depression, loss of balance or the ability to walk, loss of sensation on one side of the body and difficulty swallowing food [12,13].
Recovery helps to regain lost function after a stroke. The appropriate plan is created so that the patient immediately returns psychologically and socially with kinesiotherapy, speech therapy and the contribution of neurologists [14,15]. In order to minimize the chances of having a stroke, it is necessary to regularly monitor blood pressure, exercise regularly, maintain a normal weight, quit smoking and drinking alcohol and follow a healthy diet without fat and salt [16,17].
Information and communication technologies (ICTs), and especially the fields of artificial intelligence (AI) and machine learning (ML), now play an important role in the early prediction of various diseases, such as diabetes (as a classification [18] or regression task for continuous glucose prediction [19,20]), hypertension [21], cholesterol [22], COVID-19 [23], COPD [24], CVDs [25], ALF [26], sleep disorders [27], hepatitis C [28], CKD [29], etc. In particular, the stroke will concern us in the context of this study. For this specific disease, many research studies have been conducted with the aid of machine learning models.
In this research work, a methodology for designing effective binary classification ML models for stroke occurrence is presented. Since class balancing is crucial for the design of efficient methods in stroke prediction, the synthetic minority over-sampling technique (SMOTE) [30] method was applied. Then, various models are developed, configured and assessed in the balanced dataset. For our purpose, naive Bayes, logistic regression, stochastic gradient descent (SGD), K-NN, decision trees, random forests and multi-layer perception were evaluated. In addition, the majority voting and stacking methods were applied, with the latter being the main contribution of the current study. The experiments revealed the efficacy of the stacking method against the single models and the voting, achieving a high AUC, precision, recall, F-measure and accuracy.
The rest of the paper is organized as follows. Section 2 describes the relevant works with the subject under consideration. Then, in Section 3, a dataset description and analysis of the methodology followed is made. In addition, in Section 4, we describe the experimental setup and discuss the acquired research results. Finally, conclusions and future directions are outlined in Section 5.
2. Related Work
The research community has shown great interest in developing tools and methods for monitoring and predicting various diseases that have a significant impact on human health. In this section, we will present the latest works that utilize machine learning techniques for stroke risk prediction.
Firstly, the authors in [31] applied four machine learning algorithms, such as naive Bayes, J48, K-nearest neighbor and random forest, in order to detect accurately a stroke. The accuracy of the naive Bayes classifier was 85.6%, whereas the accuracy for J48, K-nearest neighbor and random forest was 99.8%.
In [32], the authors proposed a methodology in order to find out the various symptoms associated with the stroke disease and preventive measures for a stroke from social media resources. They defined an architecture for clustering tweets based on the content iteratively using spectral clustering. For the experiments, the ten-fold cross-validation, naive Bayes, support vector machine and probability neural network (PNN) were applied. The PNN had a better performance compared to other algorithms, with an accuracy of 89.90%.
In addition, in [33], logistic regression, naive Bayes, Bayesian network, decision tree, neural network, random forest, bagged decision tree, voting and boosting model with decision trees were applied in order to classify stroke risk levels. The experiment results showed that the boosting model with decision trees achieved the highest recall (99.94%), whereas the random forest achieved the highest precision (97.33%).
Moreover, the Kaggle dataset [34] is applied in [35]. This research work suggests the implementation of various machine learning algorithms, such as logistic regression, decision tree, random forest, K-nearest neighbor, support vector machine and naive Bayes. The naive Bayes, compared to the other algorithms, achieved a better accuracy, with 82% for the prediction of stroke.
In addition, the authors in [36] aim to acquire a stroke dataset from Sugam Multispecialty Hospital, India and classify the type of stroke by using mining and machine learning algorithms. The categories of support vector machine and ensemble (bagged) provided 91% accuracy, while an artificial neural network trained with the stochastic gradient descent algorithm outperformed other algorithms, with a higher classification accuracy greater than 95%.
In addition, an analysis of patients’ electronic health records in order to identify the impact of risk factors on stroke prediction was performed in [37]. The classification accuracy of the neural network, decision tree and random forest over 1000 experiments on the dataset of electronic health records was 75.02%, 74.31% and 74.53%, respectively.
Finally, in [38], the ability of ML techniques to analyze diffusion-weighted imaging (DWI) and fluid-attenuated inversion recovery (FLAIR) images of patients with stroke within 24 h of symptom onset was investigated by applying automatic image processing approaches. Three ML models were developed to estimate the stroke onset for binary classification (≤4.5 h), such as logistic regression, support vector machine and random forest. The ML model evaluation was based on the sensitivity and specificity for identifying patients within 4.5 h and compared to the ones of human readings of DWI-FLAIR mismatch.
3. Materials and Methods
3.1. Dataset Description
Our research was based on a dataset from Kaggle [34]. From this dataset, we focused on participants who are over 18 years old. The number of participants was 3254, and all of the attributes (10 as input to ML models and 1 for target class) are described as follows:
- Age (years) [39]: This feature refers to the age of the participants who are over 18 years old.
- Gender [39]: This feature refers to the participant’s gender. The number of men is 1260, whereas the number of women is 1994.
- Hypertension [40]: This feature refers to whether this participant is hypertensive or not. The percentage of participants who have hypertension is 12.54%.
- Heart_disease [41]: This feature refers to whether this participant suffers from heart disease or not. The percentage of participants suffering from heart disease is 6.33%.
- Ever married [42]: This feature represents the marital status of the participants, 79.84% of whom are married.
- Work type [43]: This feature represents the participant’s work status and has 4 categories (private 65.02%, self-employed 19.21%, govt_job 15.67% and never_worked 0.1%).
- Residence type [44]: This feature represents the participant’s living status and has 2 categories (urban 51.14%, rural 48.86%).
- Avg glucose level (mg/dL) [45]: This feature captures the participant’s average glucose level.
- BMI (Kg/m2) [46]: This feature captures the body mass index of the participants.
- Smoking Status [47]: This feature captures the participant’s smoking status and has 3 categories (smoke 22.37%, never smoked 52.64% and formerly smoked 24.99%).
- Stroke: This feature represents if the participant previously had a stroke or not. The percentage of participants who have suffered a stroke is 5.53%.
Most features are nominal except for the age, average glucose level and BMI, which are numerical.
3.2. Long-Term Stroke Risk Assessment
To assess the long-term risk of stroke occurring, the initial dataset was separated into a training and a test set. A binary variable c denotes the class label of an instance i in the dataset. The class variable has two possible states, e.g., or . The risk factors associated with stroke constitute the features with which ML models are fed to predict the class of new instance. The features vector of an instance i is denoted as .
The following analysis aims to design machine learning models that achieve high recall (or, else, sensitivity) and area under curve, ensuring the correct prediction of stroke instances. The proposed methodology for stroke prediction consisted of several steps, which are explained below.
Data Preprocessing
The raw data quality may degrade the final prediction quality, either due to missing values and/or noisy data. Hence, data preprocessing is necessary, including redundant values reduction, feature selection and data discretization to make it more appropriate for mining and analysis [48]. In addition, part of data preprocessing is class balancing via the employment of a resampling method. In the proposed framework, we employed the so-called SMOTE [30] to address the imbalanced distribution of participants among the stroke and non-stroke classes. More specifically, the minority class, in this case, the ‘stroke’, was oversampled, such that the participants were equally distributed. In addition, there were not missing or null values, so neither dropping nor data imputation was applied.
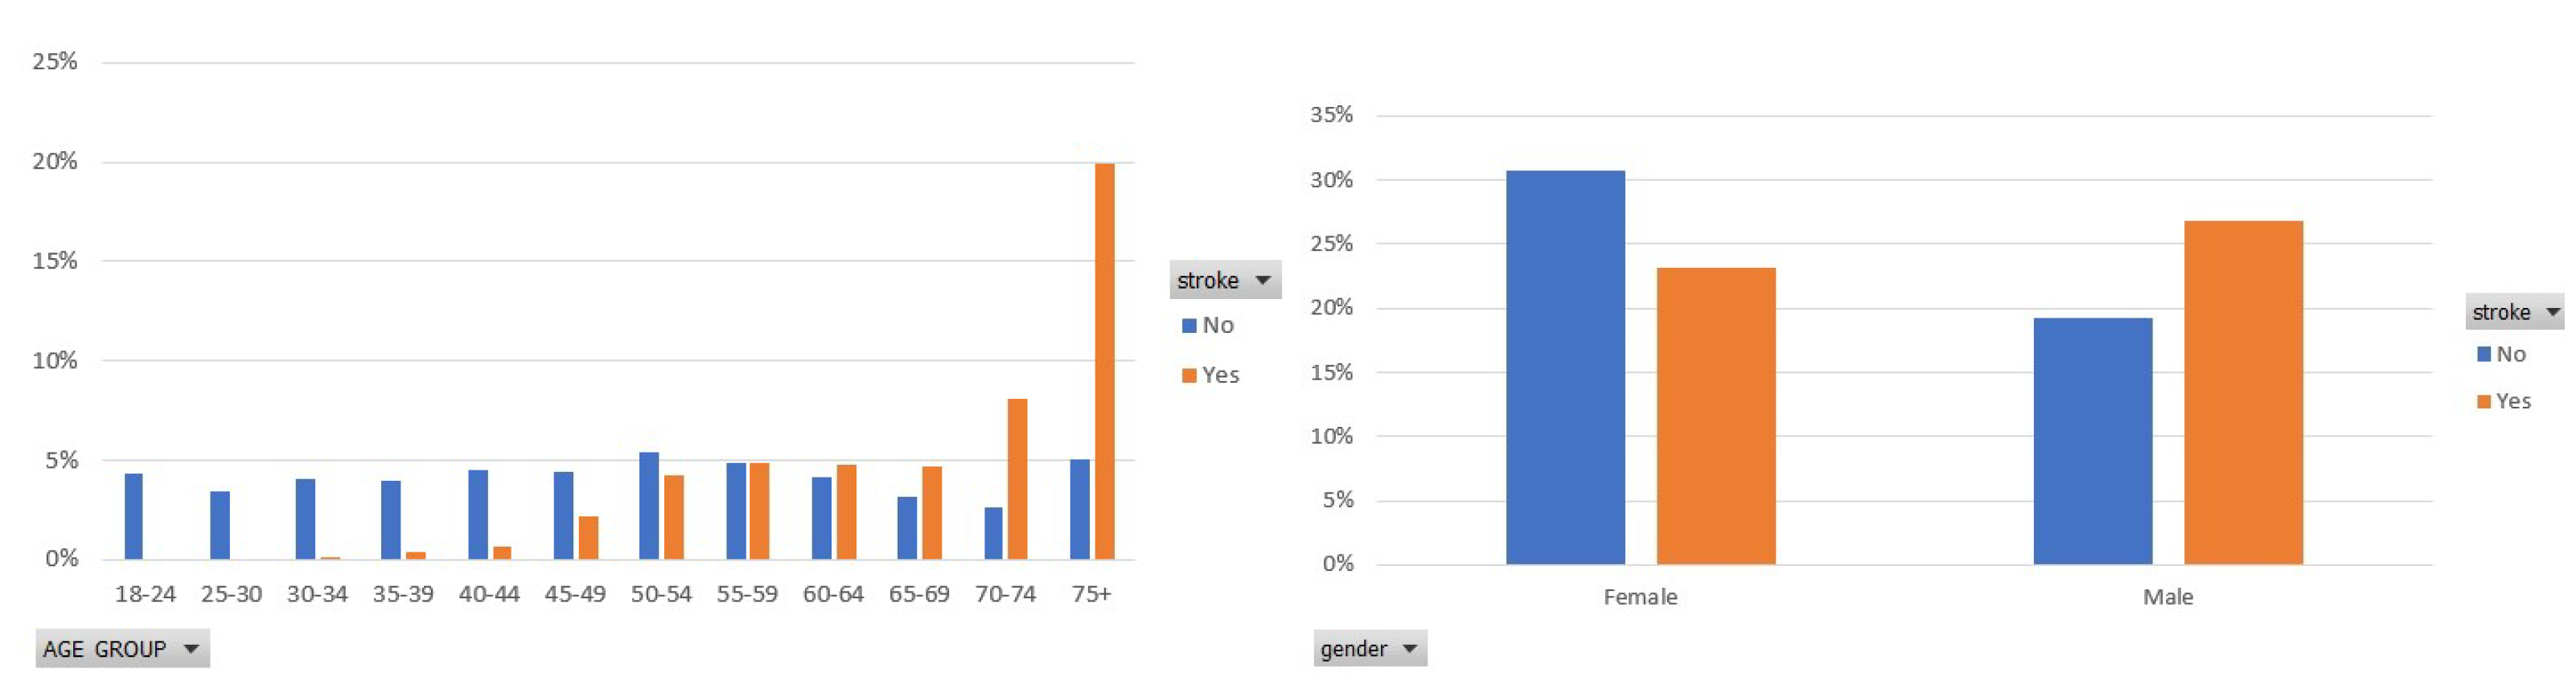
Figure 1 illustrates the participants’ distribution in each class in terms of the age group that they belong to and the gender of each participant. Focusing on the stroke class, in the left figure, a significant percentage of the participants are older than 74 years, whereas the second, most frequently occurring age group is 70–74. In addition, in this figure, we see that stroke mainly concerns elderly people. In the right figure of Figure 1, the percentage of women and men who had a stroke is approximately 23% and 26%, respectively. That shows that men are by 3% more prone to stroke disease, which, however, still targets men and women.
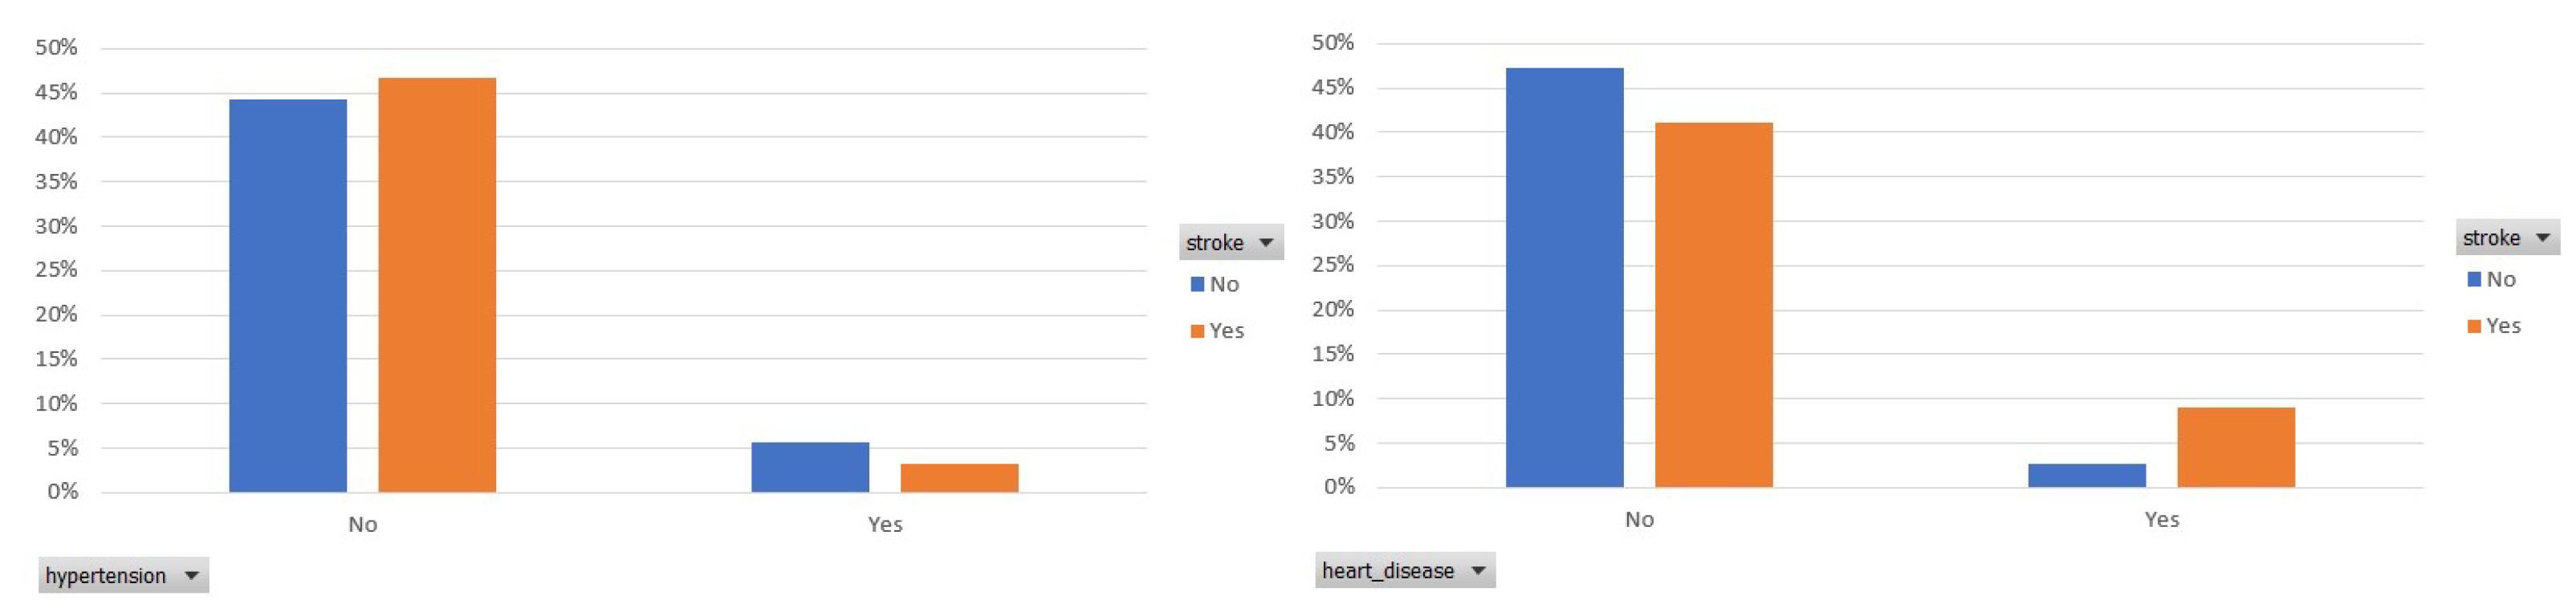
In the following, Figure 2 presents the prevalence of hypertension and heart disease among the participants who had a stroke. In both figures, we observe that an essential ratio of participants who had a stroke has not been diagnosed with hypertension or heart disease.
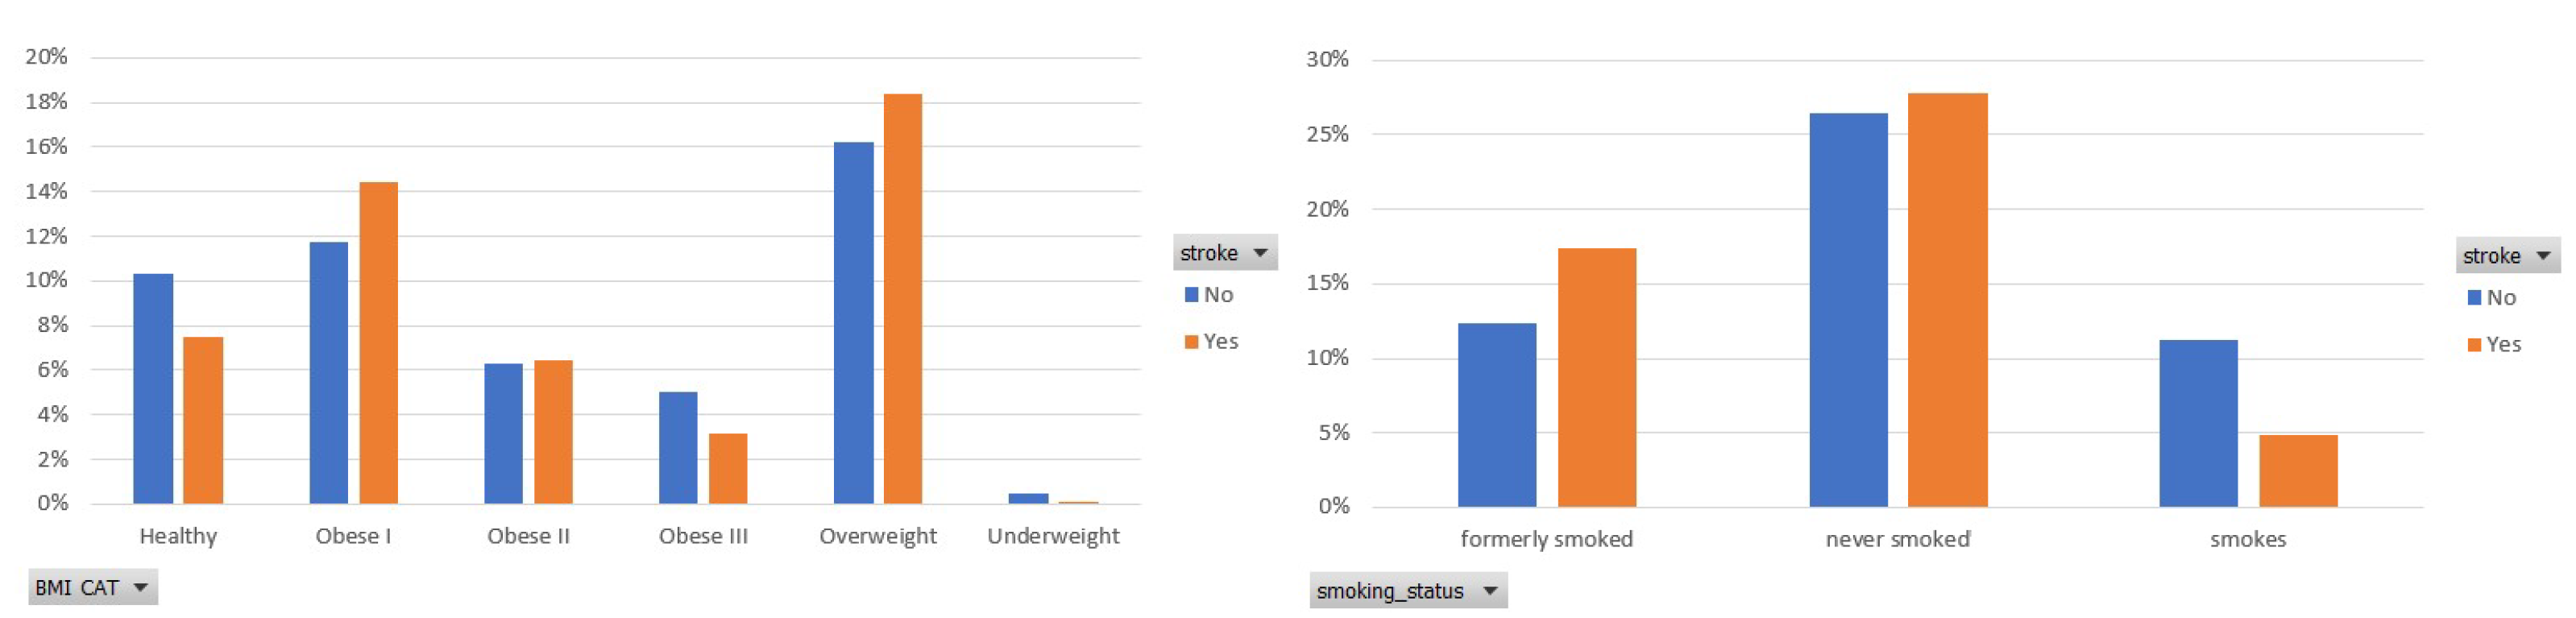
Next, Figure 3 depicts the participants’ distribution among the six categories of BMI [19] and the three ones of smoking habits. As for the BMI, an important number of participants (25%) belong to an obese class, whereas 18% of them are overweight. The importance of BMI is also captured by the ranking score assigned by the selected feature importance method in the balanced data.
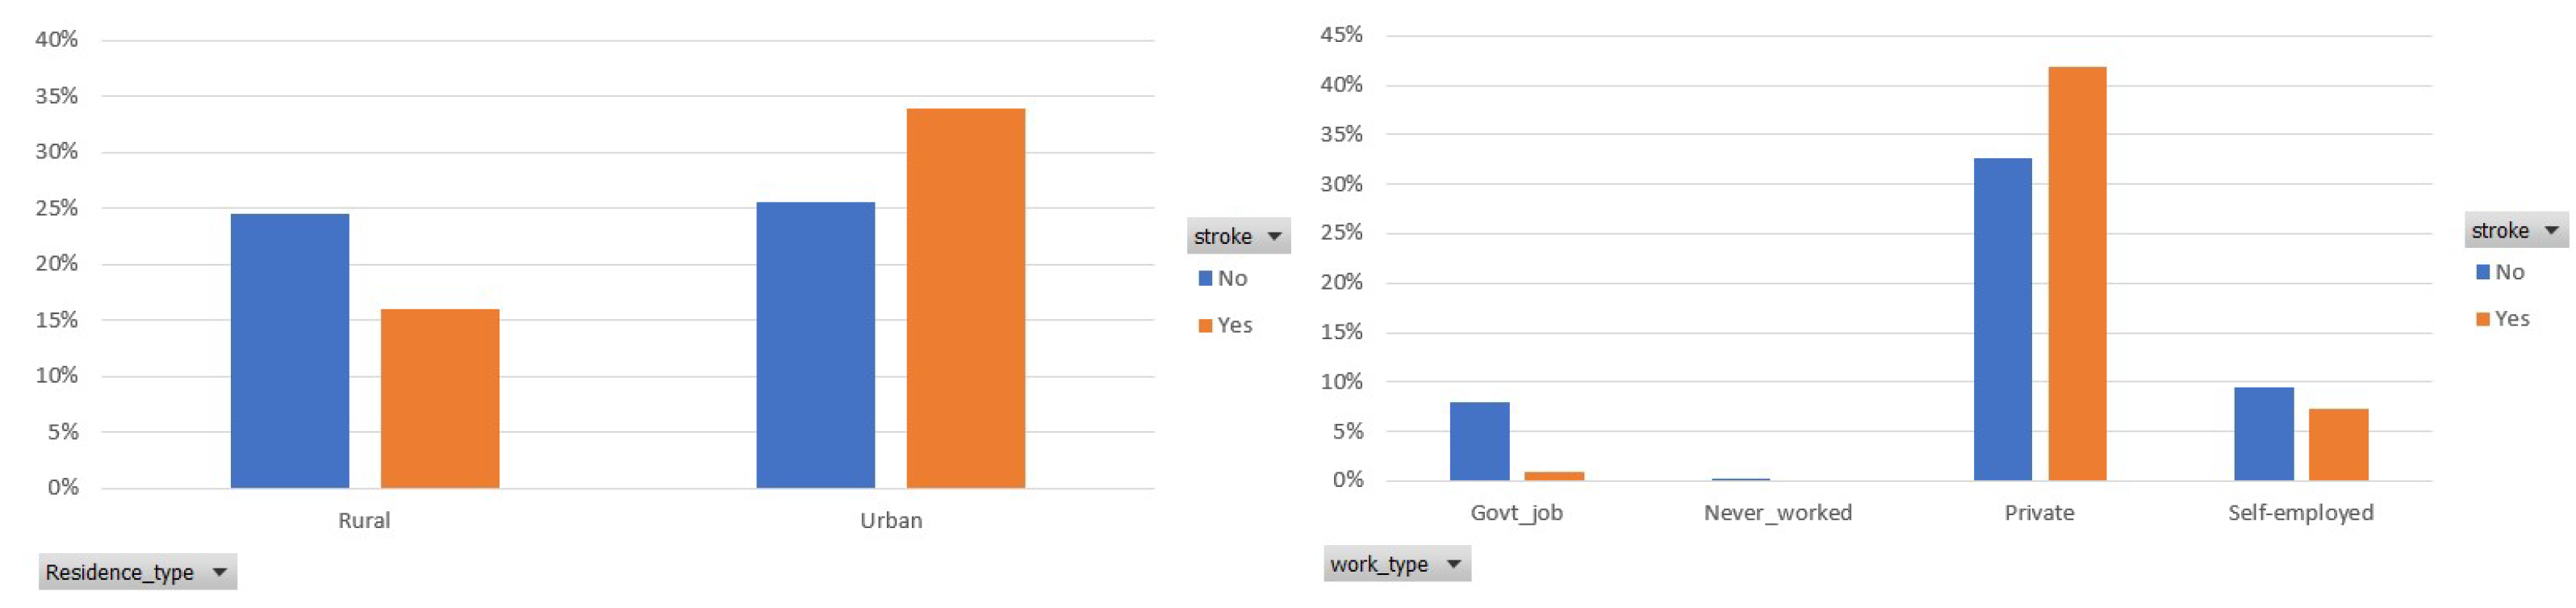
Finally, Figure 4 demonstrates the participants’ distribution among the two classes, in terms of the residence and work type. It is observed that 34% of the participants who had a stroke live in the urban area, whereas 16% of them live in the rural area. In addition, most of the participants’ (75%) occupation is private and 42% of them had a stroke.
In classification analysis, feature importance constitutes a core component that facilitates the development of accurate and high-fidelity ML models. The accuracy of the classifiers improves until an optimal number of features is considered. The performance of ML models may deteriorate if irrelevant features are assumed for the models’ training. Feature ranking is defined as the process of assigning a score to each feature in a dataset. In this way, the most significant or relevant ones are considered, namely, those ones that may contribute greatly to the target variable to enhance the model accuracy.
In Table 1, we present the dataset features’ importance concerning the stroke class. For this purpose, we considered two different methods. The former utilize a random forest classifier to assign a ranking score, whereas the latter is based on the information gain method [49]. Both methods show that the age is the most important and relevant risk factor for the occurrence of stroke. In addition, we observe that each method has assigned a different ranking order for the rest features, except for the work type and hypertension. The feature hypertension is last in the ordering because, in the dataset, a significant percentage of participants who have had a stroke do not suffer from hypertension. Moreover, all scores are positive, which means that the features may enhance the models’ performance.
3.3. Machine Learning Models
In this section, we present the models that will be utilized in the classification framework for stroke occurrence. For this purpose, various types of classifiers are employed.
3.3.1. Naive Bayes
Firstly, the naive Bayes (NB) classifier was considered, which ensures probability maximization if the features are highly independent [50]. A new subject i with features vector is classified at that class c for which is maximized. The conditional probability is defined as
where is the features probability given class, is the prior probability of features and is the prior probability of class. The maximization of (1) was achieved by maximizing its numerator, formulating the following optimization problem
where .
3.3.2. Random Forest
Random forest (RF) [19] ensembles many independent decision trees and, by resampling, creates different subsets of instances to perform classification and regression tasks. Each decision tree exports its own classification outcome, and then the final class is derived through majority voting.
3.3.3. Logistic Regression
Another model, which will be part of the proposed framework, is logistic regression (LR) [51]. It is a statistical classification method, initially designed for binary tasks that have been extended to multi-class ones as well. The model output is a binary variable in which denotes the probability of an instance to belong in the “Stroke” class, thus captures the probability of an instance belonging in the “Non-Stroke” class. The linear relationship between log-odds with base b and model parameters is as follows:
3.3.4. K-Nearest Neighbors
K-nearest neighbors (K-NNs) classifier is a distance-based (i.e., Euclidean, Manhattan) method that computes similarity or difference between two instances in the dataset under investigation [52]. The Euclidean distance is the simplest and most commonly used. Let be the features vector of the new sample to be classified either as stroke or non-stroke. The KNN classifier determines the closest K vectors (neighbors) to . Then, is assigned to the class that most of its neighbors belong to.
3.3.5. Stochastic Gradient Descent
Stochastic gradient descent (SGD) [53] is an optimization technique that can be utilized to learn various linear models and does not belong to a specific family of ML models. It is an efficient approach that, at each iteration, computes the gradient using a single sample. It allows minibatch, and thus it is suitable for large-scale problems.
3.3.6. Decision Tree
For the development of decision tree (DT) [54], we considered J48 as single classifier and RepTree [55] as base classifier in the stacking method. The internal nodes of a DT represent a feature, and the leaf nodes denote the classes. J48 splits a single feature at each node using the Gini index, whereas the latter is a simple and fast decision learner that builds a decision tree using information gain as an impurity measure and prunes it using reduced-error pruning.
3.3.7. Multilayer Percepton
3.3.8. Majority Voting
Assuming an ensemble of K basis models, simple majority voting applies hard or soft voting to predict the class label of an input instance [58]. The former aggregates the votes that relate to each class label and outputs the one with the most votes as a candidate class. The latter sums the predicted probabilities for each class label and predicts the class label with the largest probability. Here, hard voting was adopted. Its general function is captured by the following equation:
where is the prediction or probability of k-th model in class c, where .
3.3.9. Stacking
Stacking [59] belongs to ensemble learning methods that exploit several heterogeneous classifiers whose predictions were, in the following, combined in a meta-classifier. The base models were trained on the training set, whereas the meta-model was trained on the outputs of the base models. In this study, the stacking ensemble comprises naive Bayes, random forests, RepTree [54] and J48 [60] as base classifiers, whose predictions were used to train a logistic regression meta-classifier.
3.4. Evaluation Metrics
Under the evaluation process of the considered ML models, several performance metrics were recorded. In the current analysis, we will consider the most commonly used in the relevant literature [61].
Recall (true positive rate) or, otherwise, sensitivity, corresponds to the proportion of participants who had a stroke and were correctly considered as positive, with respect to all positive participants. Precision and recall are more suitable to identify the errors of a model when dealing with imbalanced data. Precision indicates how many of those who had a stroke actually belong to this class. Recall shows how many of those who had a stroke are correctly predicted. F-measure is the harmonic mean of the precision and recall and sums up the predictive performance of a model.
Notice that TP: true positive, TN: true negative, FP: false positive and FN: false negative.
Area under curve (AUC) is a useful metric, whose values lie in the range . The closer to one, the better the ML model performance is in distinguishing stroke from non-stroke instances. The perfect discrimination among the instances of two classes means that the AUC equals one. On the other side, when all non-strokes are classified as strokes and vice versa, the AUC equals 0.
4. Results and Discussion
4.1. Experiments Setup
In this section, the ML models performance is evaluated in the WEKA 3.8.6 [62] environment. WEKA is a free JAVA-based data mining tool created and distributed under the GNU General Public License. It provides a library of various models for data preprocessing, classification, clustering, forecasting, visualization, etc. The PC in which experiments were carried out has the following characteristics: Intel(R) Core(TM) i7-9750H CPU @ 2.60 GHz 2.59 GHz 16 GB Memory, Windows 10 Home, 64-bit Operating System, x64-based processor. For our experiments, 10-cross validation was applied to assess the models’ efficiency in the balanced dataset of 6148 instances.
For the implementation of the stacking model, four base classifiers were combined. More specifically, naive Bayes, random forest, J48 and RepTree were selected, and their outcomes were fed into a logistic regression meta-classifier. As for the majority voting, we considered the same models with the stacking method, except for naive Bayes. J48 was used to design the decision tree model. In the Weka tool, J48 is an open-source implementation of the C4.5 algorithm. The settings of J48 were as follows: the confidence factor was set to 0.25, and unpruned was set to false. The minimum number of instances per leaf node was set to the default value, and the binary split was set to false. Concerning the MLP, the hidden layers were configured to ‘a’, the learning rate was set to 0.3, the momentum factor was 0.2 and the training time was 500. The momentum term involves weight updates and attempts to improve the convergence speed and avoid stacking at local minima [63].
4.2. Evaluation
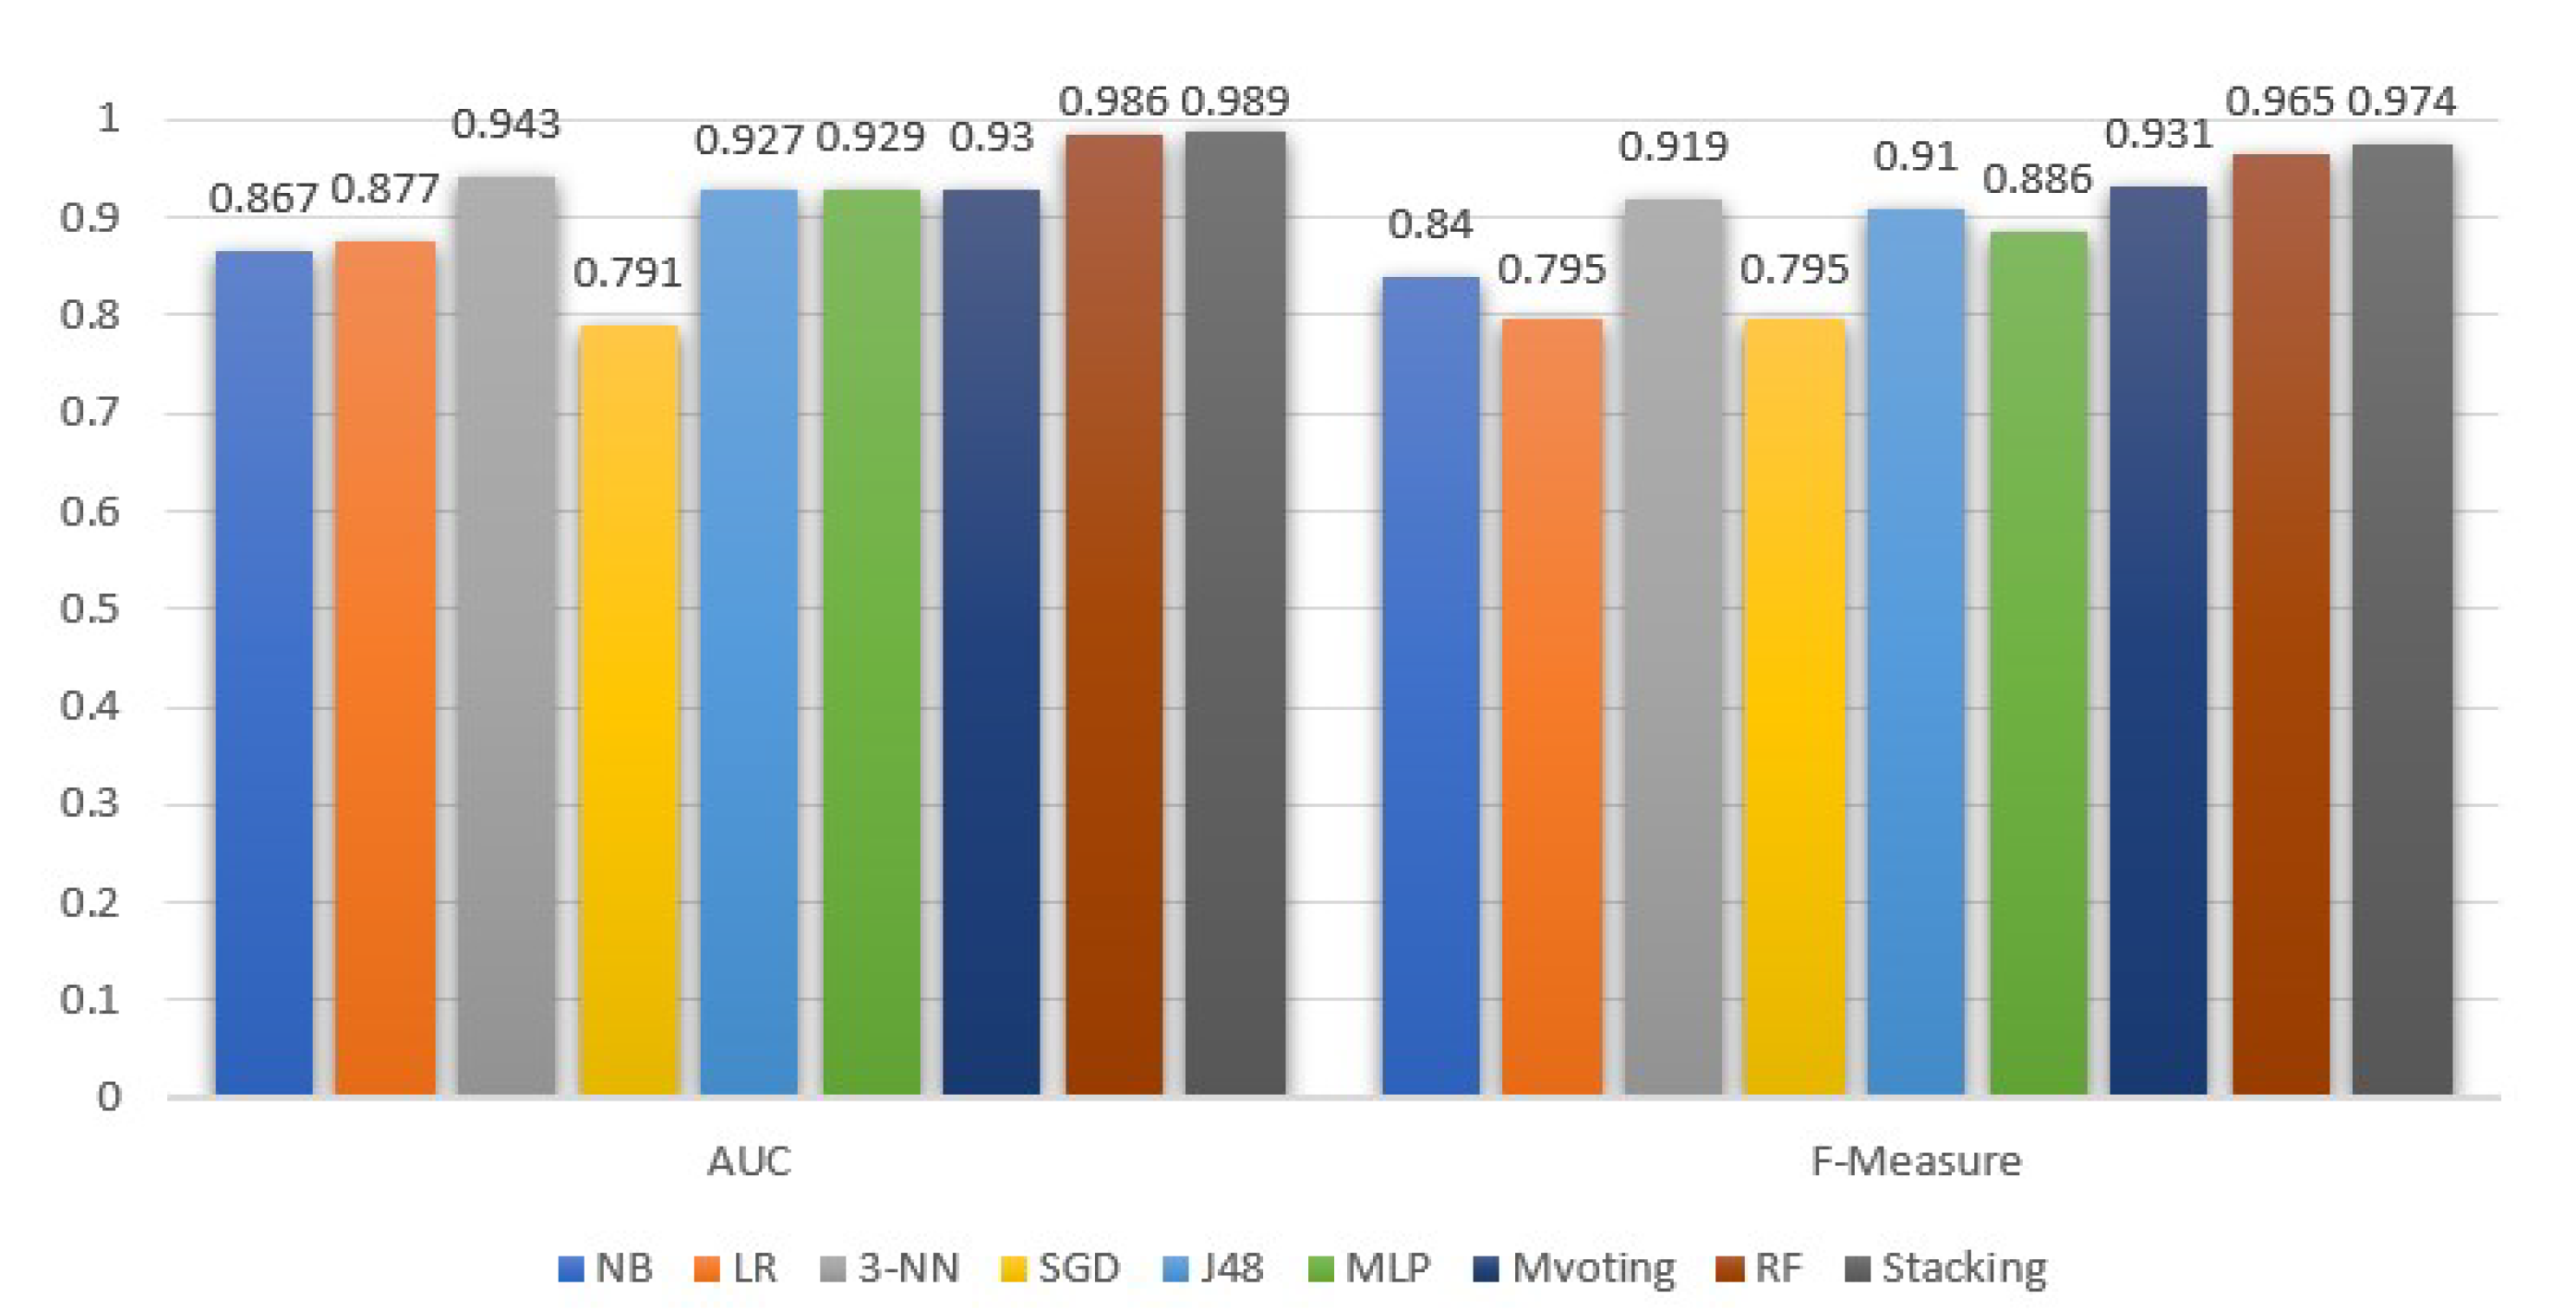
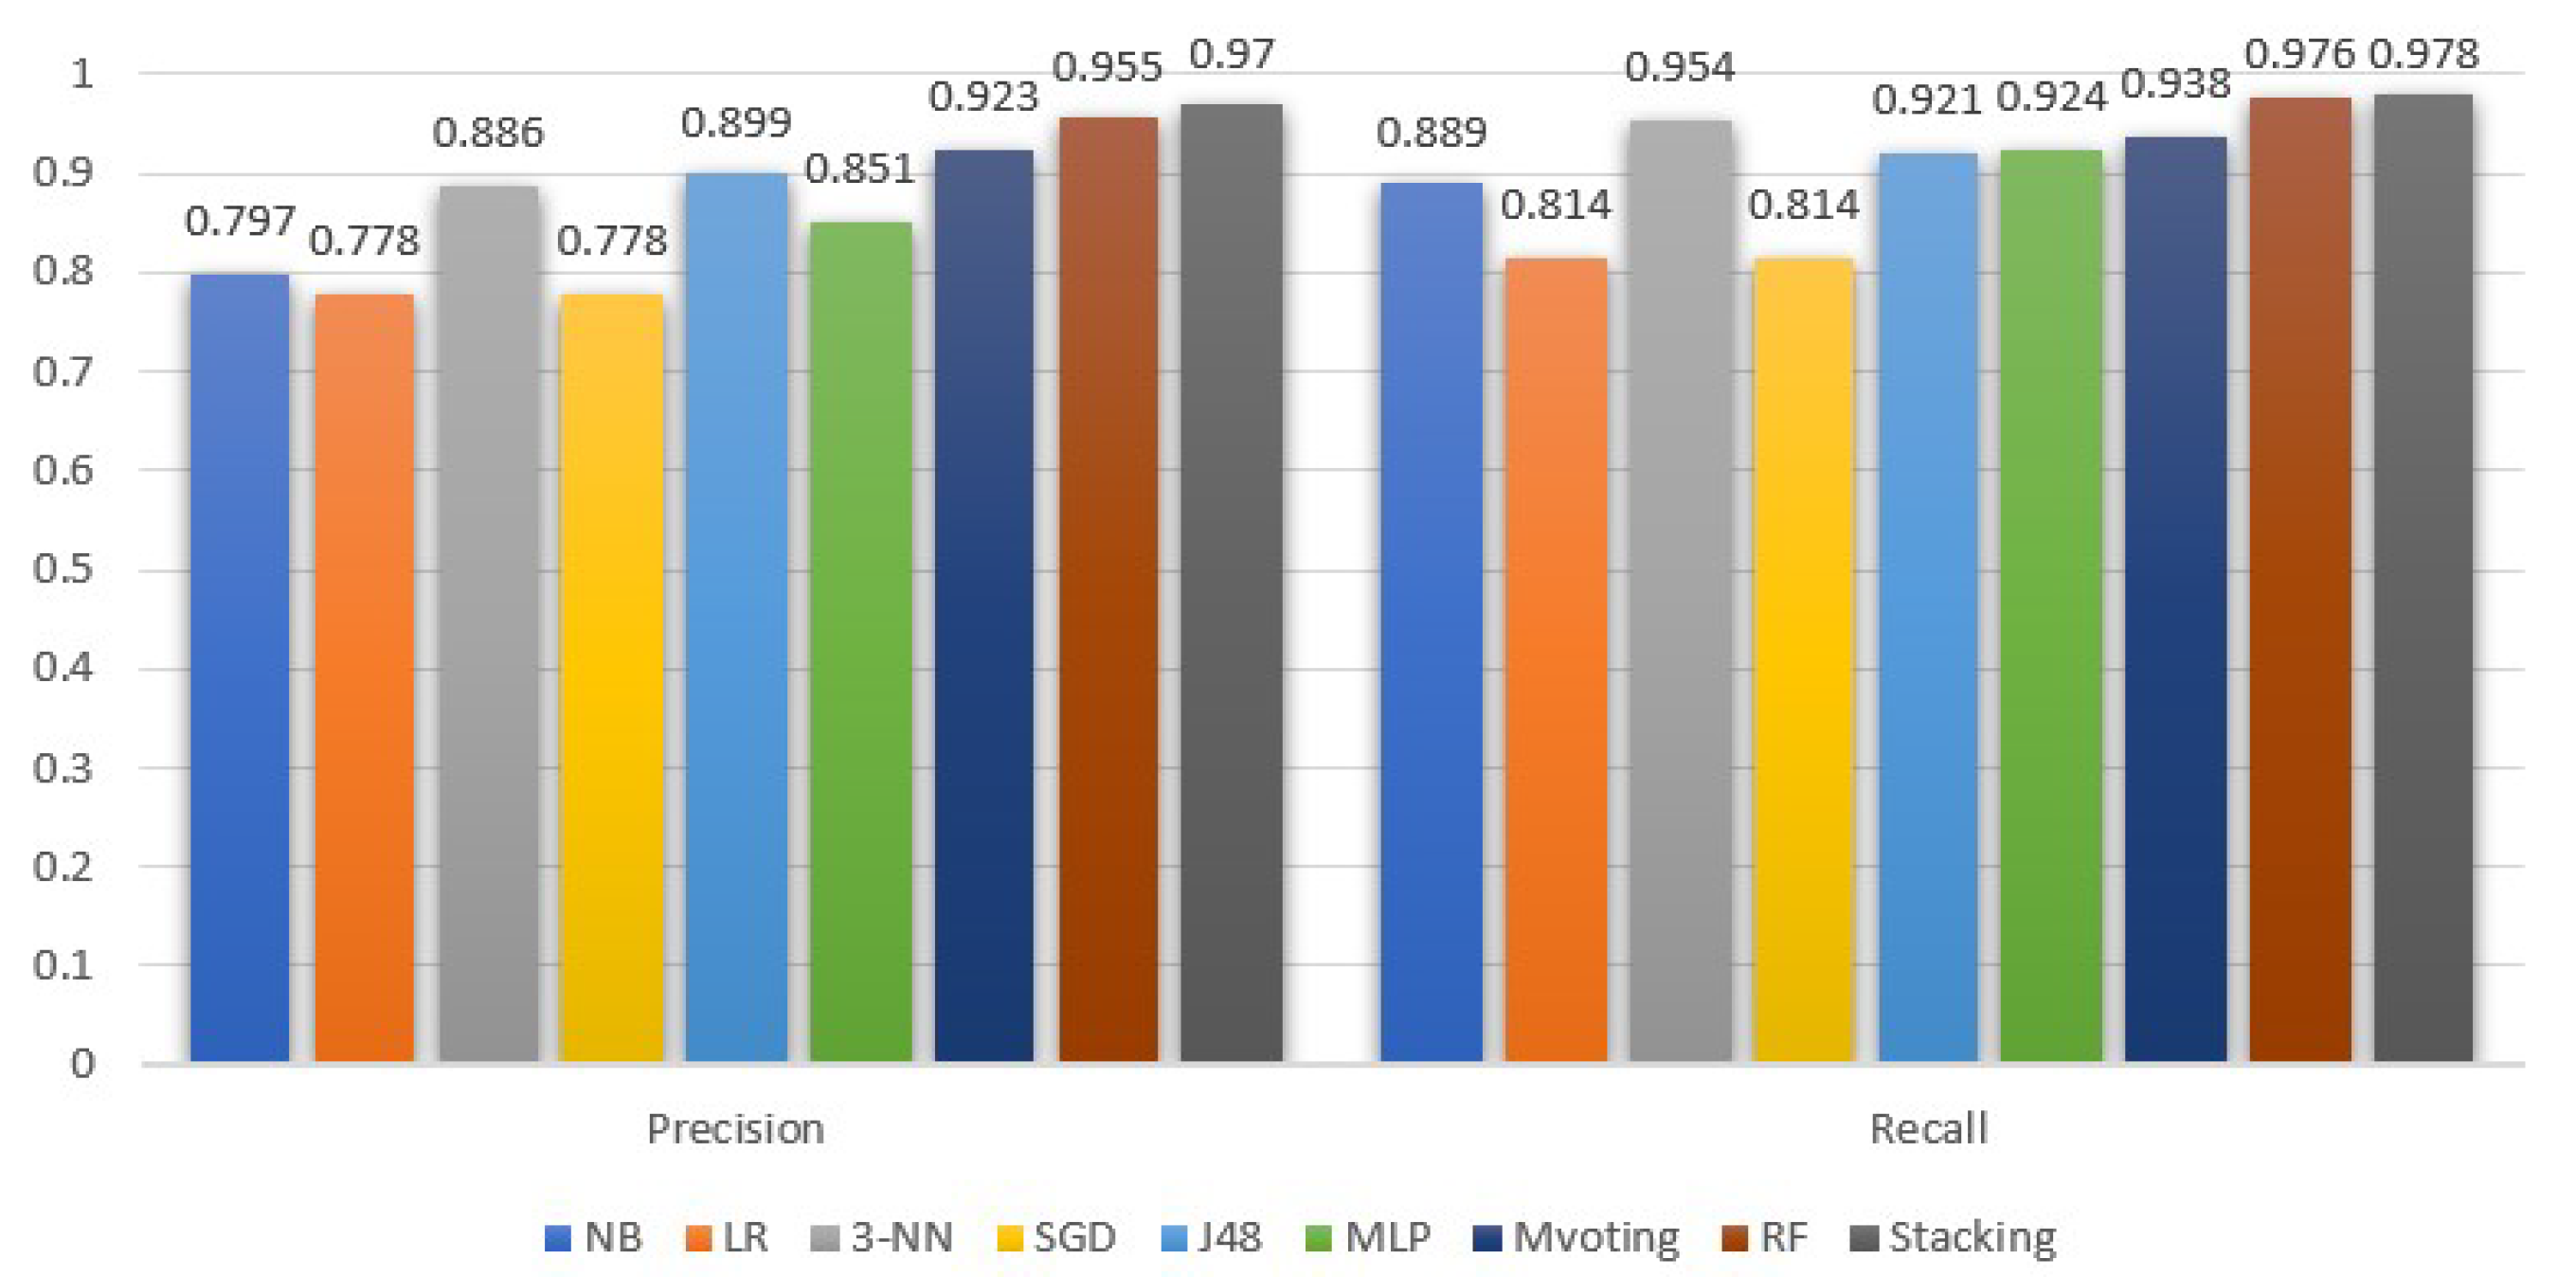
Figure 5 and Figure 6 demonstrate the ML models performance, exclusively for the stroke class, in terms of precision, recall, F-measure and AUC. In addition, in Table 2, we summarize the average performance of the selected models.
The stacking model under the selected base models was the most efficient in all metrics under consideration. Similarly, high values were achieved by the RF and majority voting classifiers. Focusing on the AUC metric, the stacking and RF models have approximately similar discrimination abilities, which show that, with a high probability of 98.9% and 98.6%, respectively, both models can successfully identify the stroke from the non-stroke instances. Besides stacking and RF, the 3-NN model is the next one, with an essentially high AUC equal to 94.3%.
Moreover, comparing Figure 5 and Table 2, we observe that the AUC values for the stroke class follow the average behavior. Contrary to AUC, the precision metric for the stroke class is higher than the average. As for the recall metric, the outcomes for the stroke class are higher than the average performance for all models, except for RF, which is 0.1% lower compared to its mean performance. In addition, from Figure 6, we see that, in the case of stroke class, the recall metric values are more or less higher than the precision metric. Notice that the stacking classifier performed a better recall than the rest.
In addition, comparing the average precision and recall, they are either equal, or the former is 0.2–0.3% higher than the latter. A higher difference with a precision lower than the recall is observed in the naive Bayes model. In either case, since the dataset is balanced, the F-measure is a suitable ratio that can reflect the performance (i.e., the accuracy) of the ML models on the dataset. From the F-measure perspective, stacking is 0.8% higher than the RFs, and 5.9% and 6.5% higher than 3-NN and DT (J48), respectively.
In Table 3, the outcomes of the current research work are compared with the research study in [35] under the same dataset [34]. In relation to [35], all suggested models, especially DT and RF, significantly outperform their performance, in terms of recall, F-measure and accuracy. In conclusion, the stacking method remains the best performing method and the main suggestion of our study.
A limitation of this study is that it was based on a publicly available dataset. These data are of specific size and features as opposed to data from a hospital or institute. Although the latter could give more rich information data models with various features capturing a detailed health profile of the participants, acquiring access to such data is usually time-consuming and difficult for privacy reasons.
5. Conclusions
A stroke constitutes a threat to a human’s life that should be prevented and/or treated to avoid unexpected complications. Nowadays, with the rapid evolution of AI/ML, the clinical providers, medical experts and decision-makers can exploit the established models to discover the most relevant features (or, else, risk factors) for the stroke occurrence, and can assess the respective probability or risk.
In this direction, machine learning can aid in the early prediction of stroke and mitigate the severe consequences. This study investigates the effectiveness of various ML algorithms to identify the most accurate algorithm for predicting stroke based on several features that capture the participants’ profiles.
The performance evaluation of the classifiers using AUC, F-measure (which summarizes precision and recall) and accuracy is essentially suitable for the models’ interpretation, demonstrating their classification performance. In addition, they reveal the models’ validity and predictive ability in terms of the stroke class. Stacking classification outperforms the other methods, with an AUC of 98.9%, F-measure, precision and recall of 97.4% and an accuracy of 98%. Hence, a stacking method is an efficient approach for identifying those at high risk of experiencing a stroke in the long term. The AUC values show that the model has a high predictive ability and distinguishability among the two classes. The future purpose of this study is to enhance the ML framework via the employment of deep learning methods. Finally, a challenging but promising direction is to collect image data from brain CT scans and to evaluate the predictive ability of deep learning models in stroke occurrence.
Author Contributions
E.D. and M.T. conceived of the idea, designed and performed the experiments, analyzed the results, drafted the initial manuscript and revised the final manuscript. All authors have read and agreed to the published version of the manuscript.
Funding
This research received no external funding.
Institutional Review Board Statement
Not applicable.
Informed Consent Statement
Not applicable.
Data Availability Statement
Not applicable.
Conflicts of Interest
The authors declare no conflict of interest.
References
- Learn about Stroke. Available online: https://www.world-stroke.org/world-stroke-day-campaign/why-stroke-matters/learn-about-stroke (accessed on 25 May 2022).
- Elloker, T.; Rhoda, A.J. The relationship between social support and participation in stroke: A systematic review. Afr. J. Disabil. 2018, 7, 1–9. [Google Scholar] [CrossRef] [PubMed] [Green Version]
- Katan, M.; Luft, A. Global burden of stroke. In Seminars in Neurology; Thieme Medical Publishers: New York, NY, USA, 2018; Volume 38, pp. 208–211. [Google Scholar]
- Bustamante, A.; Penalba, A.; Orset, C.; Azurmendi, L.; Llombart, V.; Simats, A.; Pecharroman, E.; Ventura, O.; Ribó, M.; Vivien, D.; et al. Blood biomarkers to differentiate ischemic and hemorrhagic strokes. Neurology 2021, 96, e1928–e1939. [Google Scholar] [CrossRef] [PubMed]
- Xia, X.; Yue, W.; Chao, B.; Li, M.; Cao, L.; Wang, L.; Shen, Y.; Li, X. Prevalence and risk factors of stroke in the elderly in Northern China: Data from the National Stroke Screening Survey. J. Neurol. 2019, 266, 1449–1458. [Google Scholar] [CrossRef] [PubMed] [Green Version]
- Alloubani, A.; Saleh, A.; Abdelhafiz, I. Hypertension and diabetes mellitus as a predictive risk factors for stroke. Diabetes Metab. Syndr. Clin. Res. Rev. 2018, 12, 577–584. [Google Scholar] [CrossRef]
- Boehme, A.K.; Esenwa, C.; Elkind, M.S. Stroke risk factors, genetics, and prevention. Circ. Res. 2017, 120, 472–495. [Google Scholar] [CrossRef]
- Mosley, I.; Nicol, M.; Donnan, G.; Patrick, I.; Dewey, H. Stroke symptoms and the decision to call for an ambulance. Stroke 2007, 38, 361–366. [Google Scholar] [CrossRef]
- Lecouturier, J.; Murtagh, M.J.; Thomson, R.G.; Ford, G.A.; White, M.; Eccles, M.; Rodgers, H. Response to symptoms of stroke in the UK: A systematic review. BMC Health Serv. Res. 2010, 10, 1–9. [Google Scholar] [CrossRef] [Green Version]
- Gibson, L.; Whiteley, W. The differential diagnosis of suspected stroke: A systematic review. J. R. Coll. Physicians Edinb. 2013, 43, 114–118. [Google Scholar] [CrossRef]
- Rudd, M.; Buck, D.; Ford, G.A.; Price, C.I. A systematic review of stroke recognition instruments in hospital and prehospital settings. Emerg. Med. J. 2016, 33, 818–822. [Google Scholar] [CrossRef]
- Delpont, B.; Blanc, C.; Osseby, G.; Hervieu-Bègue, M.; Giroud, M.; Béjot, Y. Pain after stroke: A review. Rev. Neurol. 2018, 174, 671–674. [Google Scholar] [CrossRef]
- Kumar, S.; Selim, M.H.; Caplan, L.R. Medical complications after stroke. Lancet Neurol. 2010, 9, 105–118. [Google Scholar] [CrossRef]
- Ramos-Lima, M.J.M.; Brasileiro, I.d.C.; Lima, T.L.d.; Braga-Neto, P. Quality of life after stroke: Impact of clinical and sociodemographic factors. Clinics 2018, 73, e418. [Google Scholar] [CrossRef]
- Gittler, M.; Davis, A.M. Guidelines for adult stroke rehabilitation and recovery. JAMA 2018, 319, 820–821. [Google Scholar] [CrossRef]
- Pandian, J.D.; Gall, S.L.; Kate, M.P.; Silva, G.S.; Akinyemi, R.O.; Ovbiagele, B.I.; Lavados, P.M.; Gandhi, D.B.; Thrift, A.G. Prevention of stroke: A global perspective. Lancet 2018, 392, 1269–1278. [Google Scholar] [CrossRef]
- Feigin, V.L.; Norrving, B.; George, M.G.; Foltz, J.L.; Roth, G.A.; Mensah, G.A. Prevention of stroke: A strategic global imperative. Nat. Rev. Neurol. 2016, 12, 501–512. [Google Scholar] [CrossRef]
- Fazakis, N.; Kocsis, O.; Dritsas, E.; Alexiou, S.; Fakotakis, N.; Moustakas, K. Machine learning tools for long-term type 2 diabetes risk prediction. IEEE Access 2021, 9, 103737–103757. [Google Scholar] [CrossRef]
- Alexiou, S.; Dritsas, E.; Kocsis, O.; Moustakas, K.; Fakotakis, N. An approach for Personalized Continuous Glucose Prediction with Regression Trees. In Proceedings of the 2021 6th South-East Europe Design Automation, Computer Engineering, Computer Networks and Social Media Conference (SEEDA-CECNSM), Preveza, Greece, 24–26 September 2001; IEEE: Piscataway, NJ, USA, 2021; pp. 1–6. [Google Scholar]
- Dritsas, E.; Alexiou, S.; Konstantoulas, I.; Moustakas, K. Short-term Glucose Prediction based on Oral Glucose Tolerance Test Values. In Proceedings of the International Joint Conference on Biomedical Engineering Systems and Technologies—HEALTHINF, Lisbon, Portugal, 12–15 January 2022; Volume 5, pp. 249–255. [Google Scholar]
- Dritsas, E.; Fazakis, N.; Kocsis, O.; Fakotakis, N.; Moustakas, K. Long-Term Hypertension Risk Prediction with ML Techniques in ELSA Database. In Proceedings of the International Conference on Learning and Intelligent Optimization, Athens, Greece, 20–25 June 2021; Springer: Berlin/Heidelberg, Germany, 2021; pp. 113–120. [Google Scholar]
- Fazakis, N.; Dritsas, E.; Kocsis, O.; Fakotakis, N.; Moustakas, K. Long-Term Cholesterol Risk Prediction with Machine Learning Techniques in ELSA Database. In Proceedings of the 13th International Joint Conference on Computational Intelligence (IJCCI), Valletta, Malta, 25–27 October 2021; SCIPTRESS: Atlanta, GA, USA, 2021; pp. 445–450. [Google Scholar]
- Kwekha-Rashid, A.S.; Abduljabbar, H.N.; Alhayani, B. Coronavirus disease (COVID-19) cases analysis using machine-learning applications. Appl. Nanosci. 2021, 2021, 1–13. [Google Scholar] [CrossRef]
- Moll, M.; Qiao, D.; Regan, E.A.; Hunninghake, G.M.; Make, B.J.; Tal-Singer, R.; McGeachie, M.J.; Castaldi, P.J.; Estepar, R.S.J.; Washko, G.R.; et al. Machine learning and prediction of all-cause mortality in COPD. Chest 2020, 158, 952–964. [Google Scholar] [CrossRef]
- Dritsas, E.; Alexiou, S.; Moustakas, K. Cardiovascular Disease Risk Prediction with Supervised Machine Learning Techniques. In Proceedings of the 8th International Conference on Information and Communication Technologies for Ageing Well and e-Health—ICT4AWE, INSTICC, Online, 22–24 April 2022; SciTePress: Setúbal, Portugal, 2022; pp. 315–321. [Google Scholar]
- Speiser, J.L.; Karvellas, C.J.; Wolf, B.J.; Chung, D.; Koch, D.G.; Durkalski, V.L. Predicting daily outcomes in acetaminophen-induced acute liver failure patients with machine learning techniques. Comput. Methods Programs Biomed. 2019, 175, 111–120. [Google Scholar] [CrossRef]
- Konstantoulas, I.; Kocsis, O.; Dritsas, E.; Fakotakis, N.; Moustakas, K. Sleep Quality Monitoring with Human Assisted Corrections. In Proceedings of the International Joint Conference on Computational Intelligence (IJCCI), Valletta, Malta, 25–27 October 2021; SCIPTRESS: Atlanta, GA, USA, 2021; pp. 435–444. [Google Scholar]
- Konerman, M.A.; Beste, L.A.; Van, T.; Liu, B.; Zhang, X.; Zhu, J.; Saini, S.D.; Su, G.L.; Nallamothu, B.K.; Ioannou, G.N.; et al. Machine learning models to predict disease progression among veterans with hepatitis C virus. PLoS ONE 2019, 14, e0208141. [Google Scholar] [CrossRef]
- Wang, W.; Chakraborty, G.; Chakraborty, B. Predicting the risk of chronic kidney disease (ckd) using machine learning algorithm. Appl. Sci. 2020, 11, 202. [Google Scholar] [CrossRef]
- Maldonado, S.; López, J.; Vairetti, C. An alternative SMOTE oversampling strategy for high-dimensional datasets. Appl. Soft Comput. 2019, 76, 380–389. [Google Scholar] [CrossRef]
- Shoily, T.I.; Islam, T.; Jannat, S.; Tanna, S.A.; Alif, T.M.; Ema, R.R. Detection of stroke disease using machine learning algorithms. In Proceedings of the 2019 10th International Conference on Computing, Communication and Networking Technologies (ICCCNT), Kanpur, India, 6–8 July 2019; IEEE: Piscataway, NJ, USA, 2019; pp. 1–6. [Google Scholar]
- Pradeepa, S.; Manjula, K.; Vimal, S.; Khan, M.S.; Chilamkurti, N.; Luhach, A.K. DRFS: Detecting risk factor of stroke disease from social media using machine learning techniques. Neural Process. Lett. 2020, 2020, 1–19. [Google Scholar] [CrossRef]
- Li, X.; Bian, D.; Yu, J.; Li, M.; Zhao, D. Using machine learning models to improve stroke risk level classification methods of China national stroke screening. BMC Med. Inf. Decis. Mak. 2019, 19, 1–7. [Google Scholar] [CrossRef]
- Stroke Prediction Dataset. Available online: https://www.kaggle.com/datasets/fedesoriano/stroke-prediction-dataset (accessed on 25 May 2022).
- Sailasya, G.; Kumari, G.L.A. Analyzing the performance of stroke prediction using ML classification algorithms. Int. J. Adv. Comput. Sci. Appl. 2021, 12, 539–545. [Google Scholar] [CrossRef]
- Govindarajan, P.; Soundarapandian, R.K.; Gandomi, A.H.; Patan, R.; Jayaraman, P.; Manikandan, R. Classification of stroke disease using machine learning algorithms. Neural Comput. Appl. 2020, 32, 817–828. [Google Scholar] [CrossRef]
- Nwosu, C.S.; Dev, S.; Bhardwaj, P.; Veeravalli, B.; John, D. Predicting stroke from electronic health records. In Proceedings of the 2019 41st Annual International Conference of the IEEE Engineering in Medicine and Biology Society (EMBC), Berlin, Germany, 23–27 July 2019; IEEE: Piscataway, NJ, USA, 2019; pp. 5704–5707. [Google Scholar]
- Lee, H.; Lee, E.J.; Ham, S.; Lee, H.B.; Lee, J.S.; Kwon, S.U.; Kim, J.S.; Kim, N.; Kang, D.W. Machine learning approach to identify stroke within 4.5 hours. Stroke 2020, 51, 860–866. [Google Scholar] [CrossRef]
- Rexrode, K.M.; Madsen, T.E.; Yu, A.Y.; Carcel, C.; Lichtman, J.H.; Miller, E.C. The impact of sex and gender on stroke. Circ. Res. 2022, 130, 512–528. [Google Scholar] [CrossRef]
- Dubow, J.; Fink, M.E. Impact of hypertension on stroke. Curr. Atheroscler. Rep. 2011, 13, 298–305. [Google Scholar] [CrossRef]
- Tsao, C.W.; Aday, A.W.; Almarzooq, Z.I.; Alonso, A.; Beaton, A.Z.; Bittencourt, M.S.; Boehme, A.K.; Buxton, A.E.; Carson, A.P.; Commodore-Mensah, Y.; et al. Heart Disease and Stroke Statistics—2022 Update: A Report From the American Heart Association. Circulation 2022, 145, e153–e639. [Google Scholar] [CrossRef]
- Andersen, K.; Olsen, T. Stroke case-fatality and marital status. Acta Neurol. Scand. 2018, 138, 377–383. [Google Scholar] [CrossRef]
- Cox, A.M.; McKevitt, C.; Rudd, A.G.; Wolfe, C.D. Socioeconomic status and stroke. Lancet Neurol. 2006, 5, 181–188. [Google Scholar] [CrossRef]
- Howard, G. Rural-urban differences in stroke risk. Prev. Med. 2021, 152, 106661. [Google Scholar] [CrossRef]
- Cai, Y.; Wang, C.; Di, W.; Li, W.; Liu, J.; Zhou, S. Correlation between blood glucose variability and the risk of death in patients with severe acute stroke. Rev. Neurol. 2020, 176, 582–586. [Google Scholar] [CrossRef]
- Elsayed, S.; Othman, M. The effect of body mass index (BMI) on the mortality among patients with stroke. Eur. J. Mol. Clin. Med. 2021, 8, 181–187. [Google Scholar]
- Shah, R.S.; Cole, J.W. Smoking and stroke: The more you smoke the more you stroke. Expert Rev. Cardiovasc. Ther. 2010, 8, 917–932. [Google Scholar] [CrossRef]
- Fan, C.; Chen, M.; Wang, X.; Wang, J.; Huang, B. A review on data preprocessing techniques toward efficient and reliable knowledge discovery from building operational data. Front. Energy Res. 2021, 9, 652801. [Google Scholar] [CrossRef]
- Trabelsi, M.; Meddouri, N.; Maddouri, M. A new feature selection method for nominal classifier based on formal concept analysis. Procedia Comput. Sci. 2017, 112, 186–194. [Google Scholar] [CrossRef]
- Berrar, D. Bayes’ theorem and naive Bayes classifier. In Encyclopedia of Bioinformatics and Computational Biology: ABC of Bioinformatics; Elsevier: Amsterdam, The Netherlands, 2018; p. 403. [Google Scholar]
- Nusinovici, S.; Tham, Y.C.; Yan, M.Y.C.; Ting, D.S.W.; Li, J.; Sabanayagam, C.; Wong, T.Y.; Cheng, C.Y. Logistic regression was as good as machine learning for predicting major chronic diseases. J. Clin. Epidemiol. 2020, 122, 56–69. [Google Scholar] [CrossRef]
- Cunningham, P.; Delany, S.J. k-Nearest neighbour classifiers-A Tutorial. ACM Comput. Surv. (CSUR) 2021, 54, 1–25. [Google Scholar] [CrossRef]
- Deepa, N.; Prabadevi, B.; Maddikunta, P.K.; Gadekallu, T.R.; Baker, T.; Khan, M.A.; Tariq, U. An AI-based intelligent system for healthcare analysis using Ridge-Adaline Stochastic Gradient Descent Classifier. J. Supercomput. 2021, 77, 1998–2017. [Google Scholar] [CrossRef]
- Al Snousy, M.B.; El-Deeb, H.M.; Badran, K.; Al Khlil, I.A. Suite of decision tree-based classification algorithms on cancer gene expression data. Egypt. Inf. J. 2011, 12, 73–82. [Google Scholar] [CrossRef] [Green Version]
- Dinesh, K.G.; Arumugaraj, K.; Santhosh, K.D.; Mareeswari, V. Prediction of cardiovascular disease using machine learning algorithms. In Proceedings of the 2018 International Conference on Current Trends towards Converging Technologies (ICCTCT), Coimbatore, India, 1–3 March 2018; IEEE: Piscataway, NJ, USA, 2018; pp. 1–7. [Google Scholar]
- Abirami, S.; Chitra, P. Energy-efficient edge based real-time healthcare support system. In Advances in Computers; Elsevier: Amsterdam, The Netherlands, 2020; Volume 117, pp. 339–368. [Google Scholar]
- Shankar, K.; Zhang, Y.; Liu, Y.; Wu, L.; Chen, C.H. Hyperparameter tuning deep learning for diabetic retinopathy fundus image classification. IEEE Access 2020, 8, 118164–118173. [Google Scholar] [CrossRef]
- Dogan, A.; Birant, D. A weighted majority voting ensemble approach for classification. In Proceedings of the 2019 4th International Conference on Computer Science and Engineering (UBMK), Samsun, Turkey, 11–15 September 2019; IEEE: Piscataway, NJ, USA, 2019; pp. 1–6. [Google Scholar]
- Rajagopal, S.; Kundapur, P.P.; Hareesha, K.S. A stacking ensemble for network intrusion detection using heterogeneous datasets. Secur. Commun. Netw. 2020, 2020, 4586875. [Google Scholar] [CrossRef] [Green Version]
- Pandey, P.; Prabhakar, R. An analysis of machine learning techniques (J48 & AdaBoost)-for classification. In Proceedings of the 2016 1st India International Conference on Information Processing (IICIP), Delhi, India, 12–14 August 2016; IEEE: Piscataway, NJ, USA, 2016; pp. 1–6. [Google Scholar]
- Hossin, M.; Sulaiman, M.N. A review on evaluation metrics for data classification evaluations. Int. J. Data Min. Knowl. Manag. Process 2015, 5, 1. [Google Scholar]
- Weka Tool. Available online: https://www.weka.io/ (accessed on 25 May 2022).
- Raj, P.; David, P.E. The Digital Twin Paradigm for Smarter Systems and Environments: The Industry Use Cases; Academic Press: Cambridge, MA, USA, 2020. [Google Scholar]
Figure 1.
Participants distribution per age group and gender type in the balanced dataset.

Figure 2.
Participants distribution per hypertension and heart disease status in the balanced dataset.
Figure 2.
Participants distribution per hypertension and heart disease status in the balanced dataset.

Figure 3.
Participants distribution per BMI category and smoke status in the balanced dataset.

Figure 4.
Participants distribution per residence and work type in the balanced dataset.

Figure 5.
Machine learning models AUC and F-measure evaluation for the stroke class.

Figure 6.
Machine learning models precision and recall evaluation for the stroke class.


Table 1.
Features importance in the balanced data.
| Random Forest | Information Gain | ||
|---|---|---|---|
| Attribute | Rank | Attribute | Rank |
| Age | 0.4702 | Age | 0.75627 |
| BMI | 0.404 | Ever_married | 0.09382 |
| Avg_glucose_level | 0.1139 | BMI | 0.06991 |
| Ever_married | 0.0929 | Avg_glucose_level | 0.06265 |
| Work_type | 0.0898 | Work_type | 0.05651 |
| Smoking_status | 0.0661 | Heart_disease | 0.02777 |
| Residence_type | 0.0537 | Smoking_status | 0.02554 |
| Gender | 0.0500 | Residence_type | 0.02129 |
| Heart_disease | 0.0499 | Gender | 0.01667 |
| Hypertension | 0.0177 | Hypertension | 0.00523 |
Table 2.
Average performance of ML models.
| Precision | Recall | F-Measure | AUC | Accuracy | |
|---|---|---|---|---|---|
| NB | 0.812 | 0.860 | 0.835 | 0.867 | 0.84 |
| LR | 0.791 | 0.791 | 0.791 | 0.877 | 0.79 |
| 3-NN | 0.918 | 0.916 | 0.915 | 0.943 | 0.81 |
| SGD | 0.791 | 0.791 | 0.791 | 0.791 | 0.88 |
| DT(J48) | 0.909 | 0.909 | 0.909 | 0.927 | 0.91 |
| MLP | 0.884 | 0.881 | 0.881 | 0.929 | 0.92 |
| MVoting | 0.93 | 0.93 | 0.93 | 0.93 | 0.93 |
| RF | 0.966 | 0.966 | 0.966 | 0.986 | 0.97 |
| Stacking | 0.974 | 0.974 | 0.974 | 0.989 | 0.98 |
Table 3.
Comparison of ML models performance.
| Precision | Recall | F-Measure | Accuracy | |||||
|---|---|---|---|---|---|---|---|---|
| Proposed | [35] | Proposed | [35] | Proposed | [35] | Proposed | [35] | |
| NB | 0.812 | 0.786 | 0.860 | 0.857 | 0.835 | 0.823 | 0.84 | 0.82 |
| LR | 0.791 | 0.775 | 0.791 | 0.760 | 0.791 | 0.776 | 0.79 | 0.78 |
| 3-NN | 0.918 | 0.774 | 0.916 | 0.838 | 0.915 | 0.804 | 0.81 | 0.80 |
| DT | 0.909 | 0.909 | 0.909 | 0.775 | 0.909 | 0.776 | 0.88 | 0.66 |
| RF | 0.974 | 0.720 | 0.974 | 0.735 | 0.974 | 0.727 | 0.98 | 0.73 |
Publisher’s Note: MDPI stays neutral with regard to jurisdictional claims in published maps and institutional affiliations. |
© 2022 by the authors. Licensee MDPI, Basel, Switzerland. This article is an open access article distributed under the terms and conditions of the Creative Commons Attribution (CC BY) license (https://creativecommons.org/licenses/by/4.0/).
Share and Cite
MDPI and ACS Style
Dritsas, E.; Trigka, M. Stroke Risk Prediction with Machine Learning Techniques. Sensors 2022, 22, 4670. https://doi.org/10.3390/s22134670
AMA Style
Dritsas E, Trigka M. Stroke Risk Prediction with Machine Learning Techniques. Sensors. 2022; 22(13):4670. https://doi.org/10.3390/s22134670
Chicago/Turabian StyleDritsas, Elias, and Maria Trigka. 2022. "Stroke Risk Prediction with Machine Learning Techniques" Sensors 22, no. 13: 4670. https://doi.org/10.3390/s22134670
Note that from the first issue of 2016, this journal uses article numbers instead of page numbers. See further details here.