
Real-Time Structural Health Monitoring and Damage Identification Using Frequency Response Functions along with Finite Element Model Updating Technique


Abstract
:1. Introduction
2. Analytical Methodology
2.1. Finite Element Method (FEM)
2.1.1. Pre-Processing
2.1.2. Processing
2.1.3. Post-Processing
2.2. Modal Analysis
2.3. Finite Element Model Updating
3. Experimental Methodology
4. Experimental Results
5. Discussion
6. Conclusions
Author Contributions
Funding
Conflicts of Interest
References
- Mishra, M.; Lourenço, P.B.; Ramana, G.V. Structural health monitoring of civil engineering structures by using the internet of things: A review. J. Build. Eng. 2022, 48, 103954. [Google Scholar] [CrossRef]
- Wu, Z.; Zhang, Q.; Cheng, L.; Hou, S.; Tan, S. The VMTES: Application to the structural health monitoring and diagnosis of rotating machines. Renew. Energy 2020, 162, 2380–2396. [Google Scholar] [CrossRef]
- Zhou, H.; Huang, X.; Wen, G.; Lei, Z.; Dong, S.; Zhang, P.; Chen, X. Construction of health indicators for condition monitoring of rotating machinery: A review of the research. Expert Syst. Appl. 2022, 203, 117297. [Google Scholar] [CrossRef]
- Al-Nasar, M.K.R.; Al-Zwainy, F.M.S. A systematic review of structural materials health monitoring system for girder-type bridges. Mater. Today Proc. 2022, 49, A19–A28. [Google Scholar] [CrossRef]
- He, Z.; Li, W.; Salehi, H.; Zhang, H.; Zhou, H.; Jiao, P. Integrated structural health monitoring in bridge engineering. Autom. Constr. 2022, 136, 104168. [Google Scholar] [CrossRef]
- Singh, T.; Sehgal, S. Structural Health Monitoring of Composite Materials. Arch. Comput. Methods Eng. 2021, 29, 1997–2017. [Google Scholar] [CrossRef]
- Adams, R.D.; Cawley, P.; Pye, C.J.; Stone, B.J. A Vibration Technique for Non-Destructively Assessing the Integrity of Structures. J. Mech. Eng. Sci. 1978, 20, 93–100. [Google Scholar] [CrossRef]
- Cawley, P.; Adams, R.D. The location of defects in structures from measurements of natural frequencies. J. Strain Anal. Eng. Des. 1979, 14, 49–57. [Google Scholar] [CrossRef]
- Kessler, S.S.; Spearing, S.M.; Atalla, M.J.; Cesnik, C.E.S.; Soutis, C. Structural health monitoring in composite materials using frequency response methods. Nondestruct. Eval. Mater. Compos. V 2001, 4336, 1–11. [Google Scholar] [CrossRef] [Green Version]
- Goi, Y.; Kim, C.-W. Damage detection of a truss bridge utilizing a damage indicator from multivariate autoregressive model. J. Civ. Struct. Health Monit. 2017, 7, 153–162. [Google Scholar] [CrossRef]
- González, M.P.; Zapico, J.L. Seismic damage identification in buildings using neural networks and modal data. Comput. Struct. 2008, 86, 416–426. [Google Scholar] [CrossRef]
- Ochôa, P.A.; Groves, R.M.; Benedictus, R. Effects of high-amplitude low-frequency structural vibrations and machinery sound waves on ultrasonic guided wave propagation for health monitoring of composite aircraft primary structures. J. Sound Vib. 2020, 475, 115289. [Google Scholar] [CrossRef]
- Mishra, M. Machine learning techniques for structural health monitoring of heritage buildings: A state-of-the-art review and case studies. J. Cult. Herit. 2020, 47, 227–245. [Google Scholar] [CrossRef]
- Gopinath, V.; Ramadoss, R. Review on structural health monitoring for restoration of heritage buildings. Mater. Today Proc. 2020, 43, 1534–1538. [Google Scholar] [CrossRef]
- Clemente, P. Extending the life-span of cultural heritage structures. J. Civ. Struct. Health Monit. 2018, 8, 171–179. [Google Scholar] [CrossRef] [Green Version]
- Cigada, A.; Dell’Acqua, L.C.; Castiglione, B.M.V.; Scaccabarozzi, M.; Vanali, M.; Zappa, E. Structural Health Monitoring of an Historical Building: The Main Spire of the Duomo Di Milano. Int. J. Archit. Herit. 2017, 11, 501–518. [Google Scholar] [CrossRef]
- Zou, Y.; Tong, L.; Steven, G.P. Vibration-based model-dependent damage (delamination) identification and health monitoring for composite structures—A Review. J. Sound Vib. 2000, 230, 357–378. [Google Scholar] [CrossRef]
- Fan, W.; Qiao, P. Vibration-based damage identification methods: A review and comparative study. Struct. Health Monit. 2011, 10, 83–111. [Google Scholar] [CrossRef]
- Yan, Y.J.; Cheng, L.; Wu, Z.Y.; Yam, L.H. Development in vibration-based structural damage detection technique. Mech. Syst. Signal Process. 2007, 21, 2198–2211. [Google Scholar] [CrossRef]
- Alavi, A.H.; Hasni, H.; Lajnef, N.; Chatti, K.; Faridazar, F. An intelligent structural damage detection approach based on self-powered wireless sensor data. Autom. Constr. 2016, 62, 24–44. [Google Scholar] [CrossRef]
- Tran, H.; Khatir, S.; Thang, L.; De Roeck, G.; Bui-Tien, T.; Abdel Wahab, M. Finite element model updating of a multispan bridge with a hybrid metaheuristic search algorithm using experimental data from wireless triaxial sensors. Eng. Comput. 2021. [Google Scholar] [CrossRef]
- Hsu, T.Y.; Huang, S.K.; Lu, K.C.; Loh, C.H. A damage detection algorithm integrated with a wireless sensing system. J. Phys. Conf. Ser. 2011, 305, 12042. [Google Scholar] [CrossRef]
- Feng, L.; Yi, X.; Zhu, D.; Xie, X.; Wang, Y. Damage detection of metro tunnel structure through transmissibility function and cross correlation analysis using local excitation and measurement. Mech. Syst. Signal Process. 2015, 60–61, 59–74. [Google Scholar] [CrossRef]
- Lucena, C.; Queiroz, P.; Debs, A.; Mendonca, A. Dynamic analysis of buildings using the Finite Element Method. In Proceedings of the 10th World Congress on Computational Mechanics, São Paulo, Brazil, 8–13 July 2012; pp. 4712–4726. [Google Scholar] [CrossRef] [Green Version]
- Pathak, M.V.; Bhaskar, G.B. Finite element analysis program of frames. Int. J. Technol. Res. Eng. 2016, 3, 2455–2459. [Google Scholar]
- Jain, A.K. Dynamics of Structures with MATLAB® Applications; Pearson Education: Chennai, India, 2017; ISBN 9789332558557. [Google Scholar]
- Sehgal, S.; Kumar, H. Structural Dynamic Model Updating Techniques: A State of the Art Review. Arch. Comput. Methods Eng. 2016, 23, 515–533. [Google Scholar] [CrossRef]
- Bais, R.S.; Gupta, A.K.; Nakra, B.C.; Kundra, T.K. Studies in dynamic design of drilling machine using updated finite element models. Mech. Mach. Theory 2004, 39, 1307–1320. [Google Scholar] [CrossRef]
- Baruch, M.; Bar Itzhack, I.Y. Optimal weighted orttiogonalization of measured modes. AIAA J. 1978, 16, 346–351. [Google Scholar] [CrossRef]
- Berman, A.; Nagy, E.J. Improvement of a large analytical model using test data. AIAA J. 1983, 21, 1168–1173. [Google Scholar] [CrossRef]
- Arora, V.; Singh, S.P.; Kundra, T.K. Damped model updating using complex updating parameters. J. Sound Vib. 2009, 320, 438–451. [Google Scholar] [CrossRef]
- Simoen, E.; De Roeck, G.; Lombaert, G. Dealing with uncertainty in model updating for damage assessment: A review. Mech. Syst. Signal Process. 2015, 56, 123–149. [Google Scholar] [CrossRef] [Green Version]
- Teughels, A.; De Roeck, G. Damage detection and parameter identification by finite element model updating. Arch. Comput. Methods Eng. 2005, 12, 123–164. [Google Scholar] [CrossRef]
- Gesualdi, G.; Cardone, D.; Rosa, G. Finite element model updating of base-isolated buildings using experimental results of in-situ tests. Soil Dyn. Earthq. Eng. 2019, 119, 422–432. [Google Scholar] [CrossRef]
- Tian, W.; Weng, S.; Xia, Q.; Xia, Y. Dynamic condensation approach for response-based finite element model updating of large-scale structures. J. Sound Vib. 2021, 506, 116176. [Google Scholar] [CrossRef]
- Hosoya, N.; Kato, J.; Kajiwara, I. Spherical projectile impact using compressed air for frequency response function measurements in vibration tests. Mech. Syst. Signal Process. 2019, 134, 106295. [Google Scholar] [CrossRef]


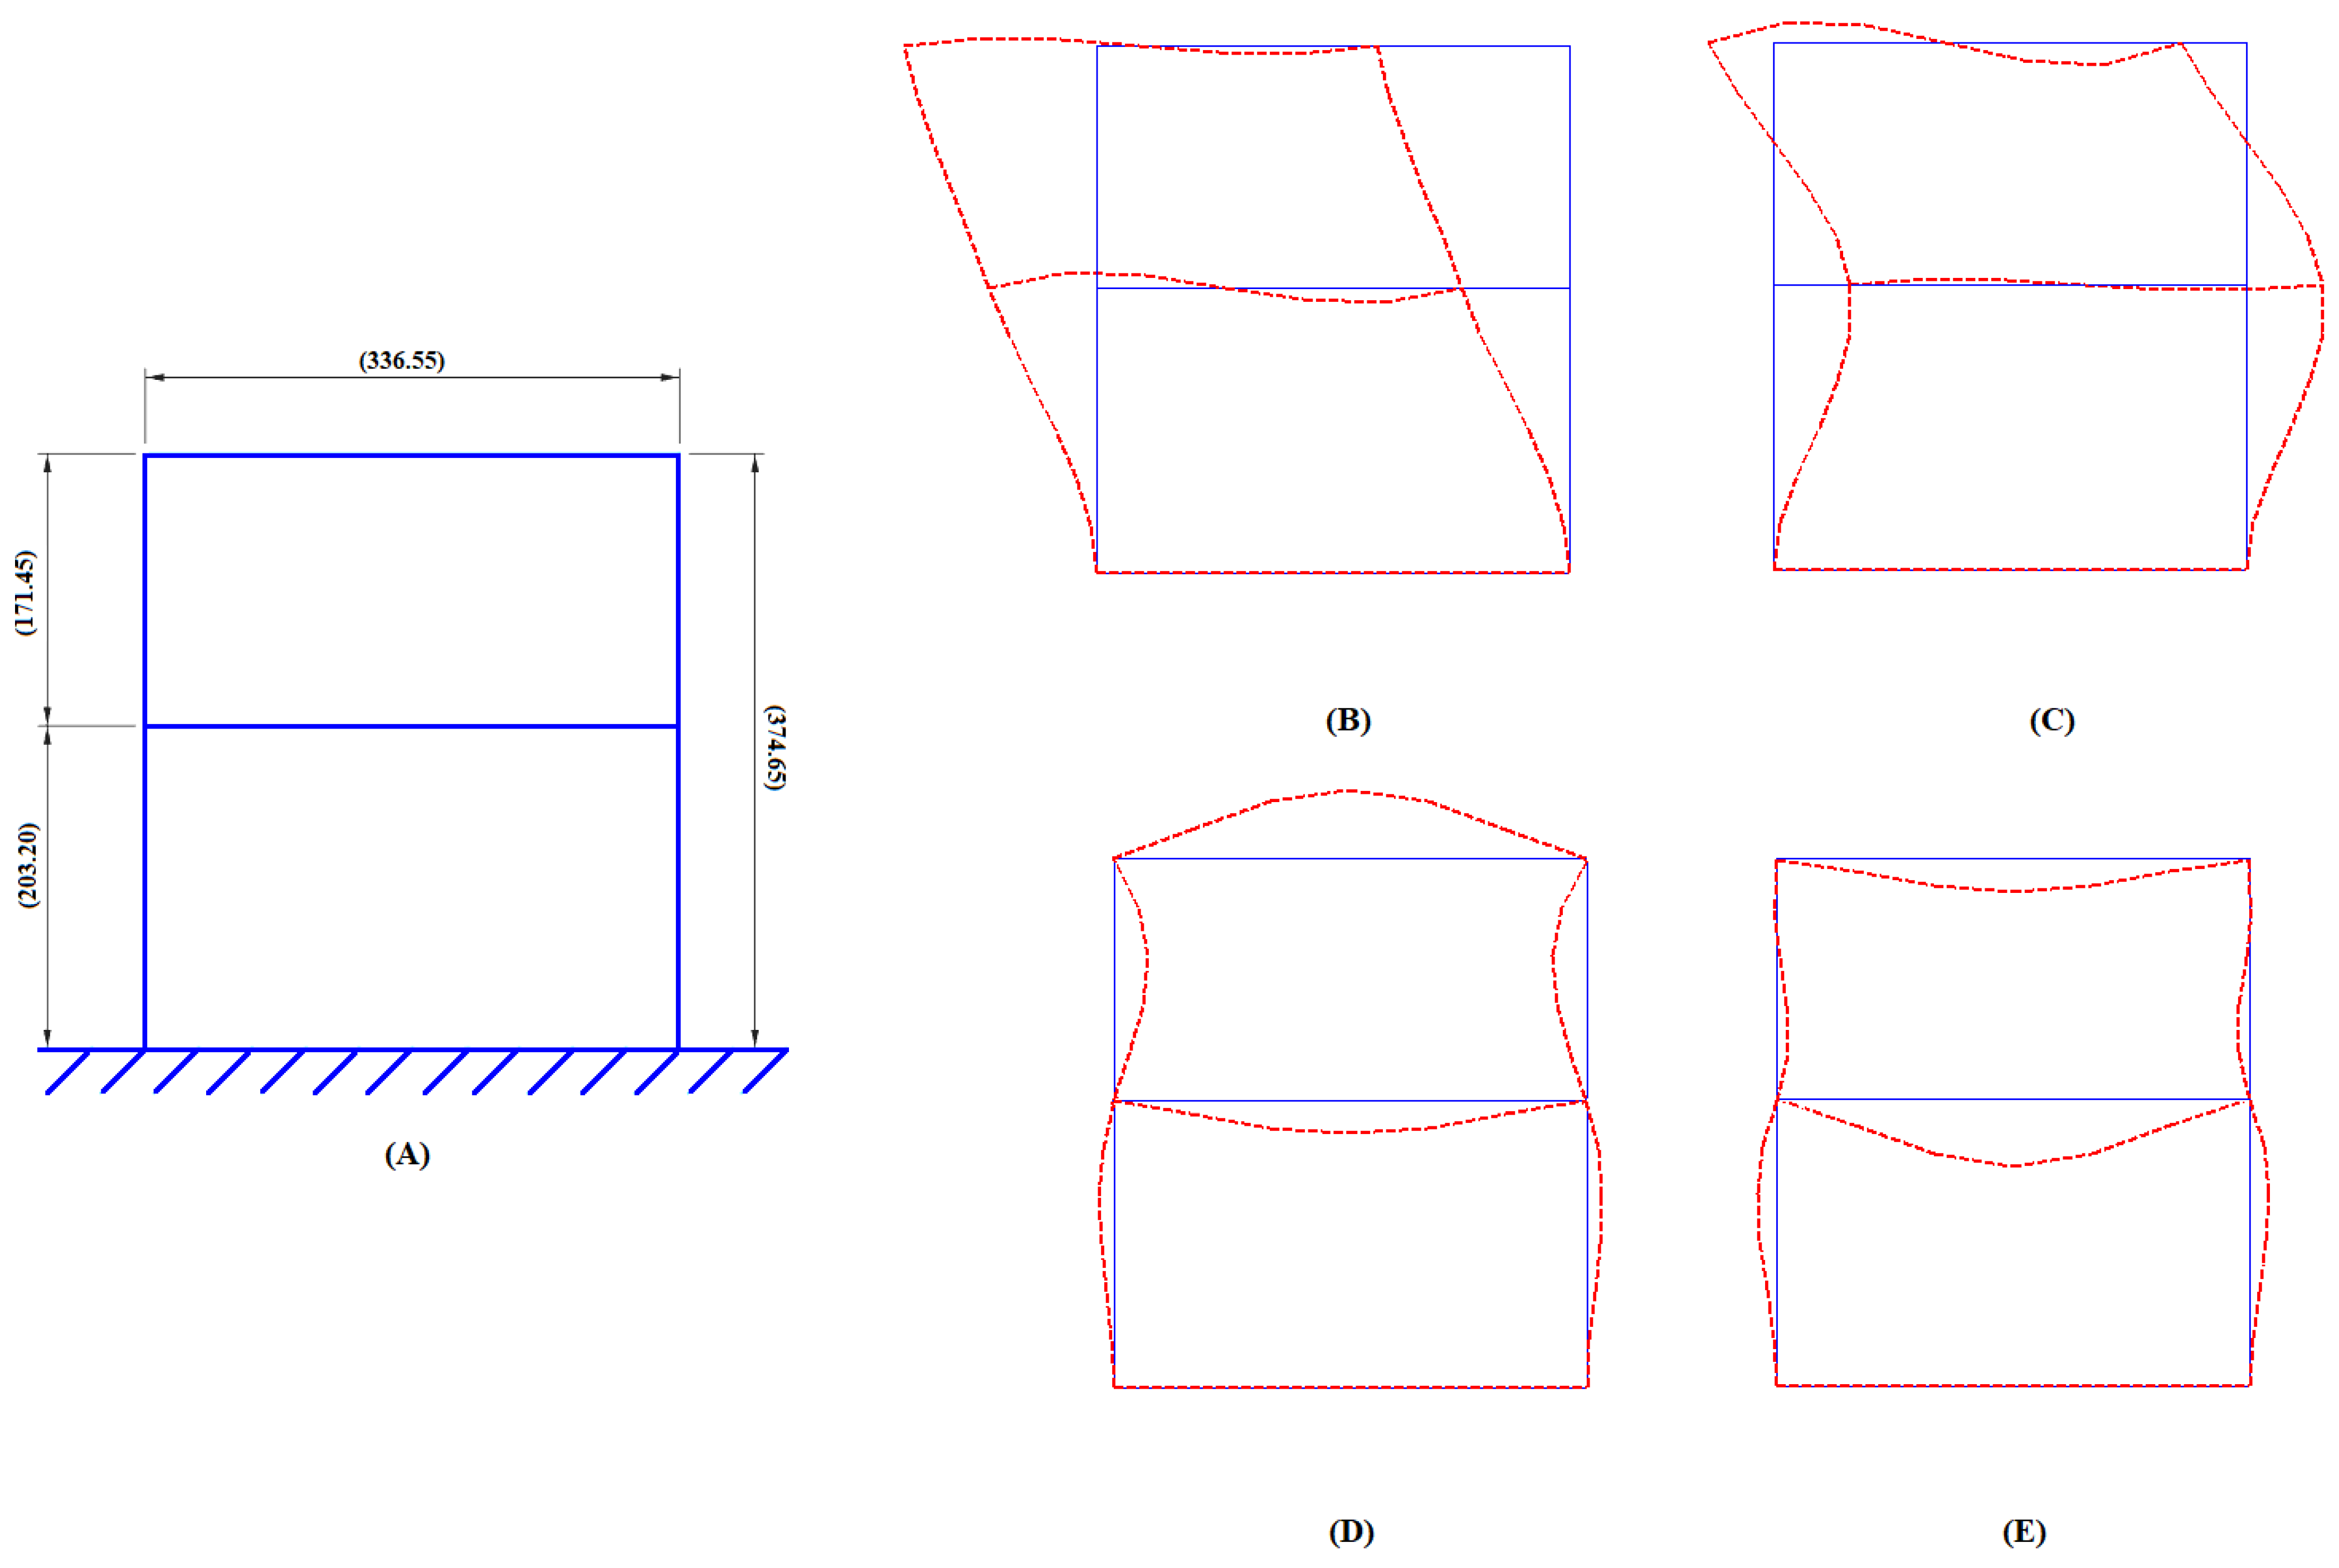
| Mode Number | 1 | 2 | 3 | 4 |
|---|---|---|---|---|
| Analytical natural frequency (Hz) | 90.357 | 325.91 | 381.84 | 455.27 |
| Sr No. | Condition | Image | Description |
|---|---|---|---|
| 1 | Undamaged |  | The two-story building model was made from MS flats of 50 mm width and 12 mm thickness. The dimensions (mm) of the scaled-down building model are shown in the image. |
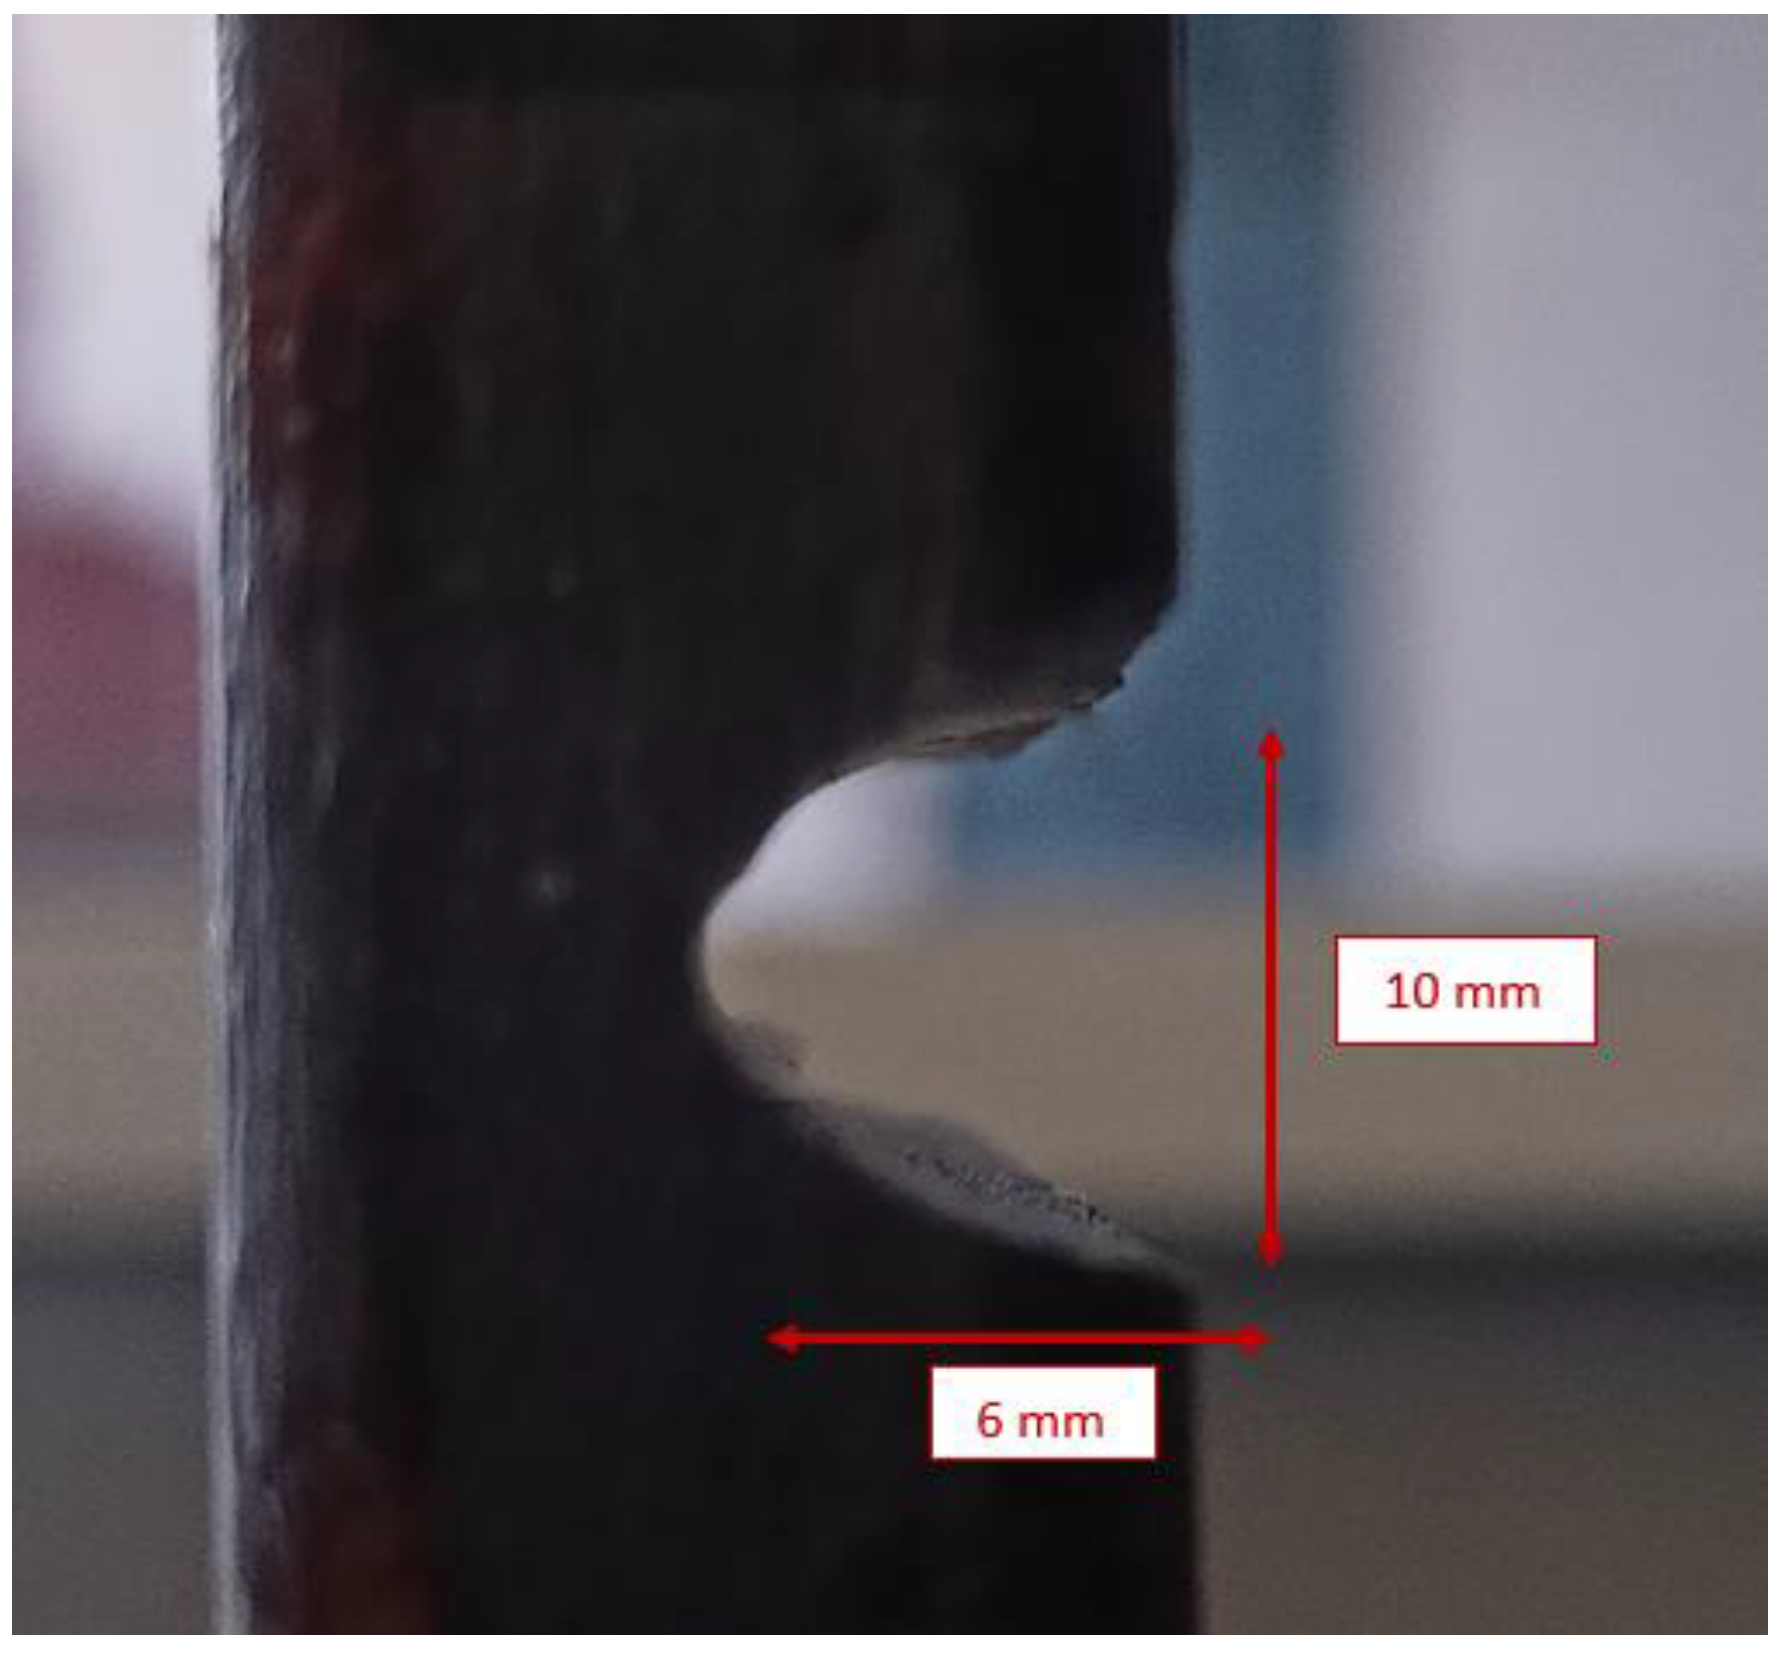
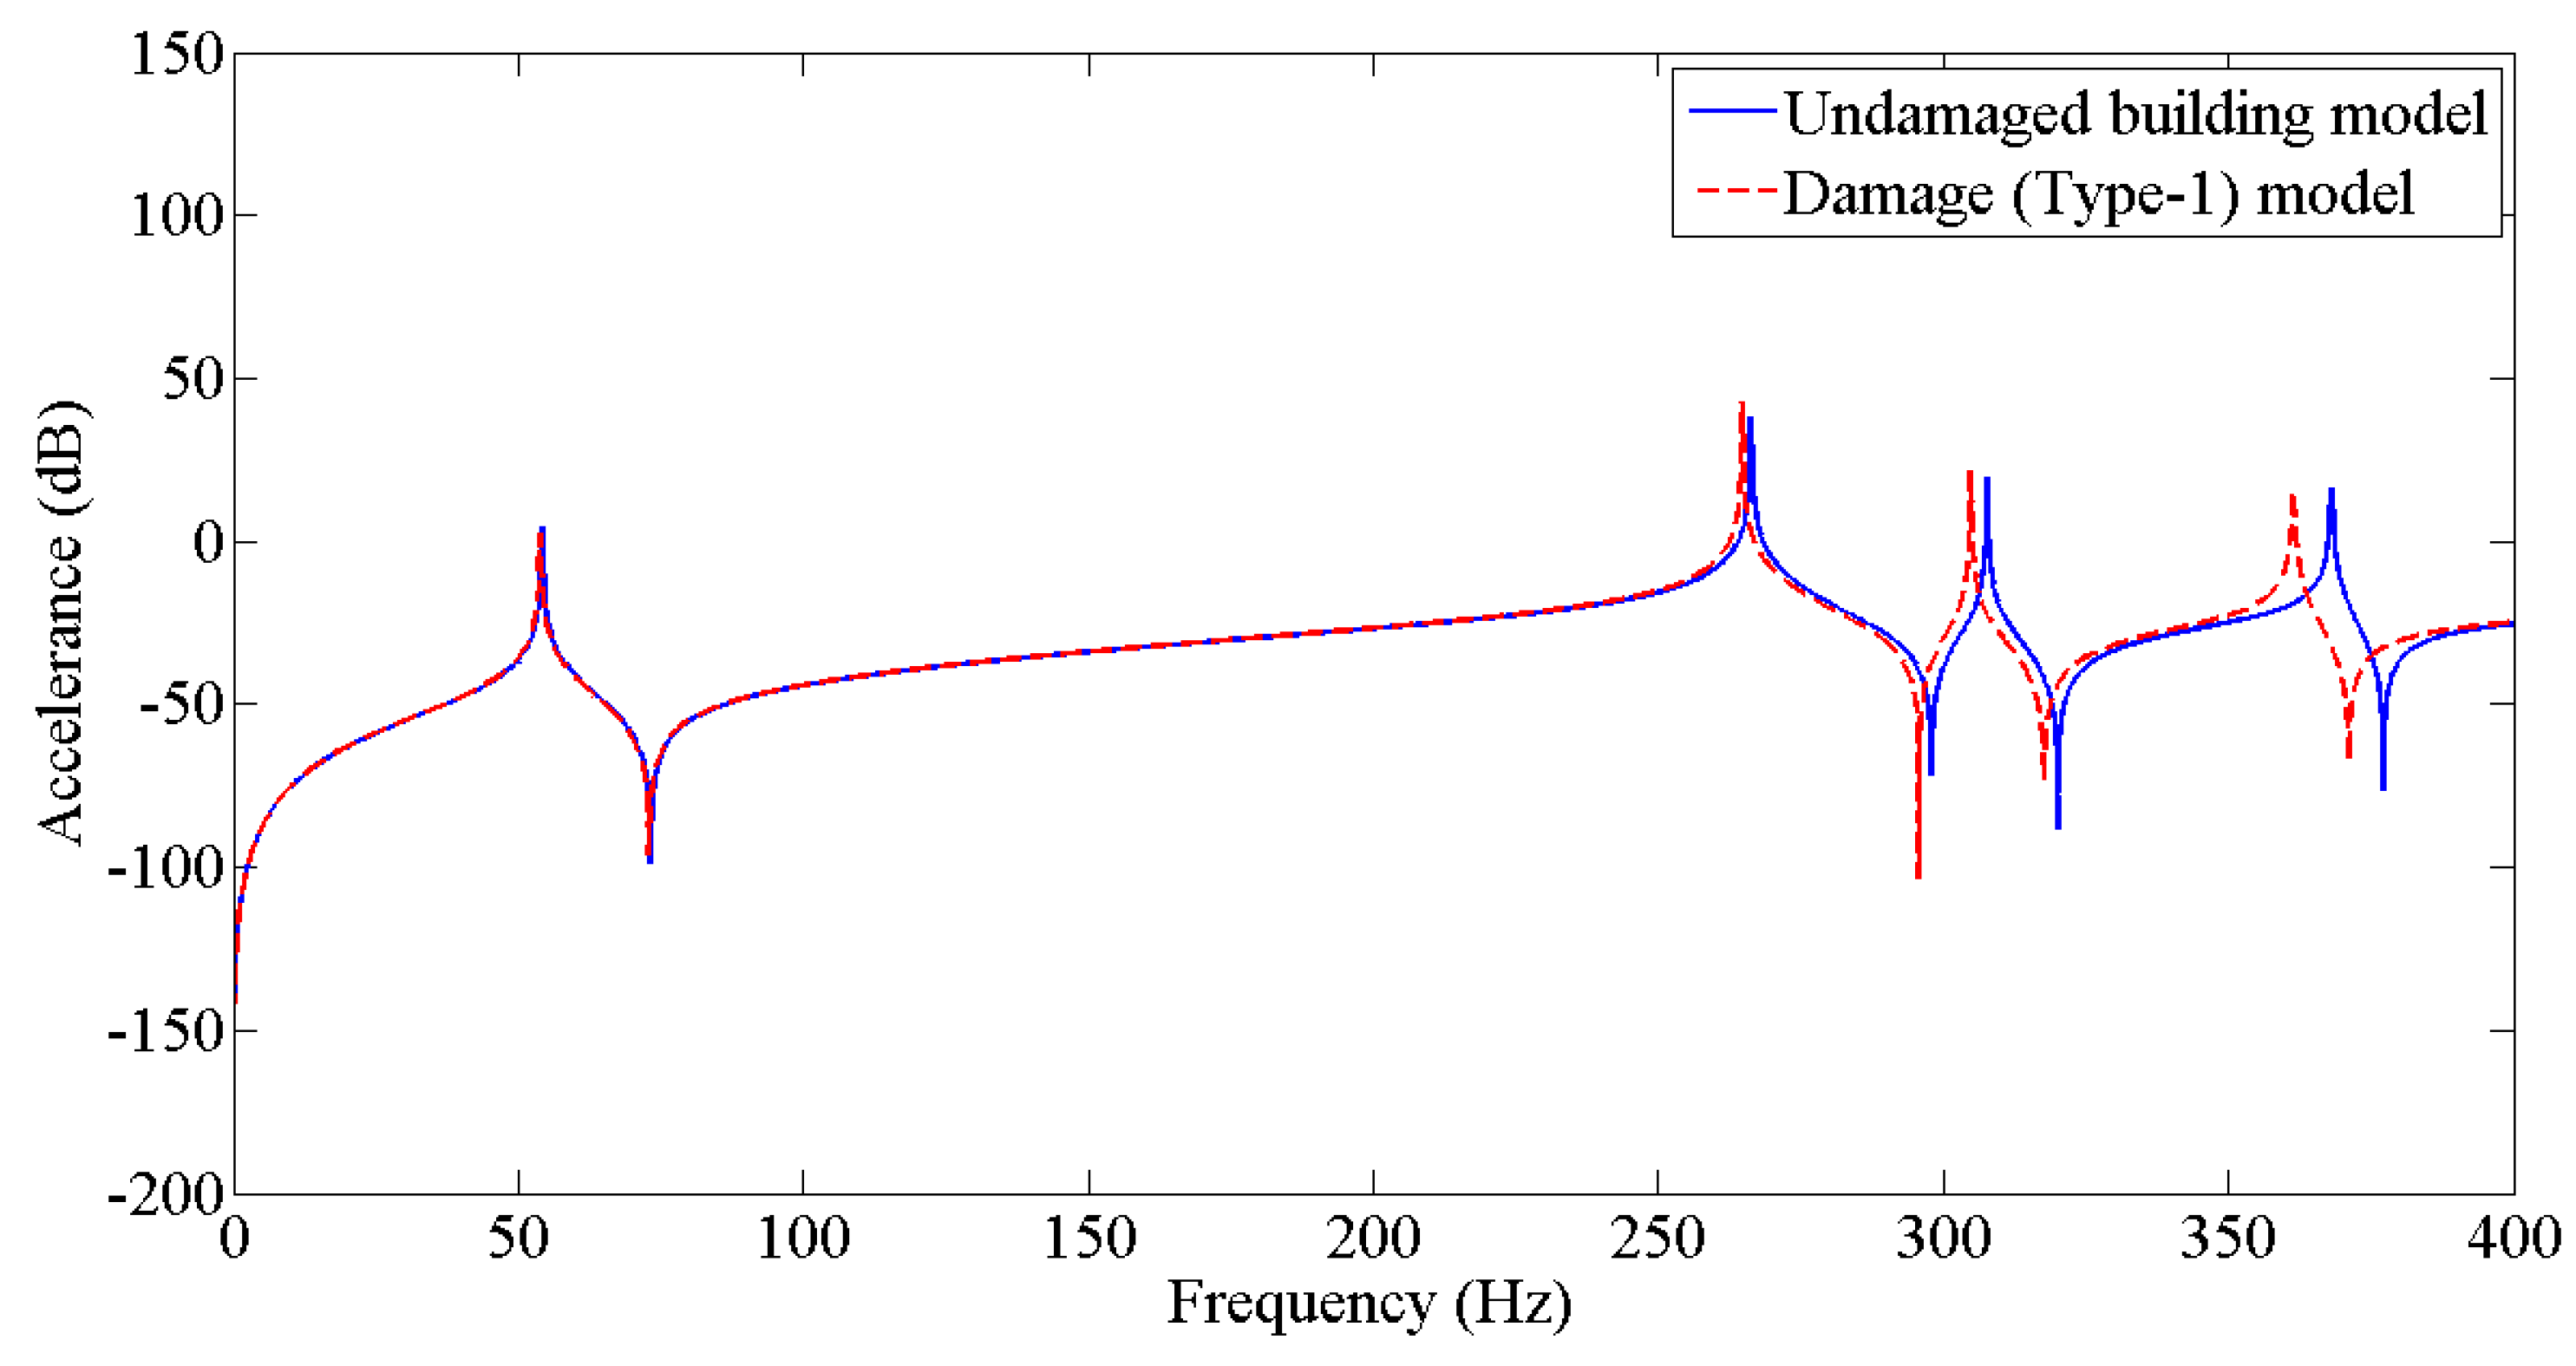
| 2 | Damaged (Type−1) |  | The damage condition (Type−1) was introduced to the walls of the first-floor of the building model, as shown, to study its dynamic responses. The damage was established using a cutting tool to cut slots of 10 × 6 mm2 along the width of the columns of the model at a height of 104.78 mm from the base. |
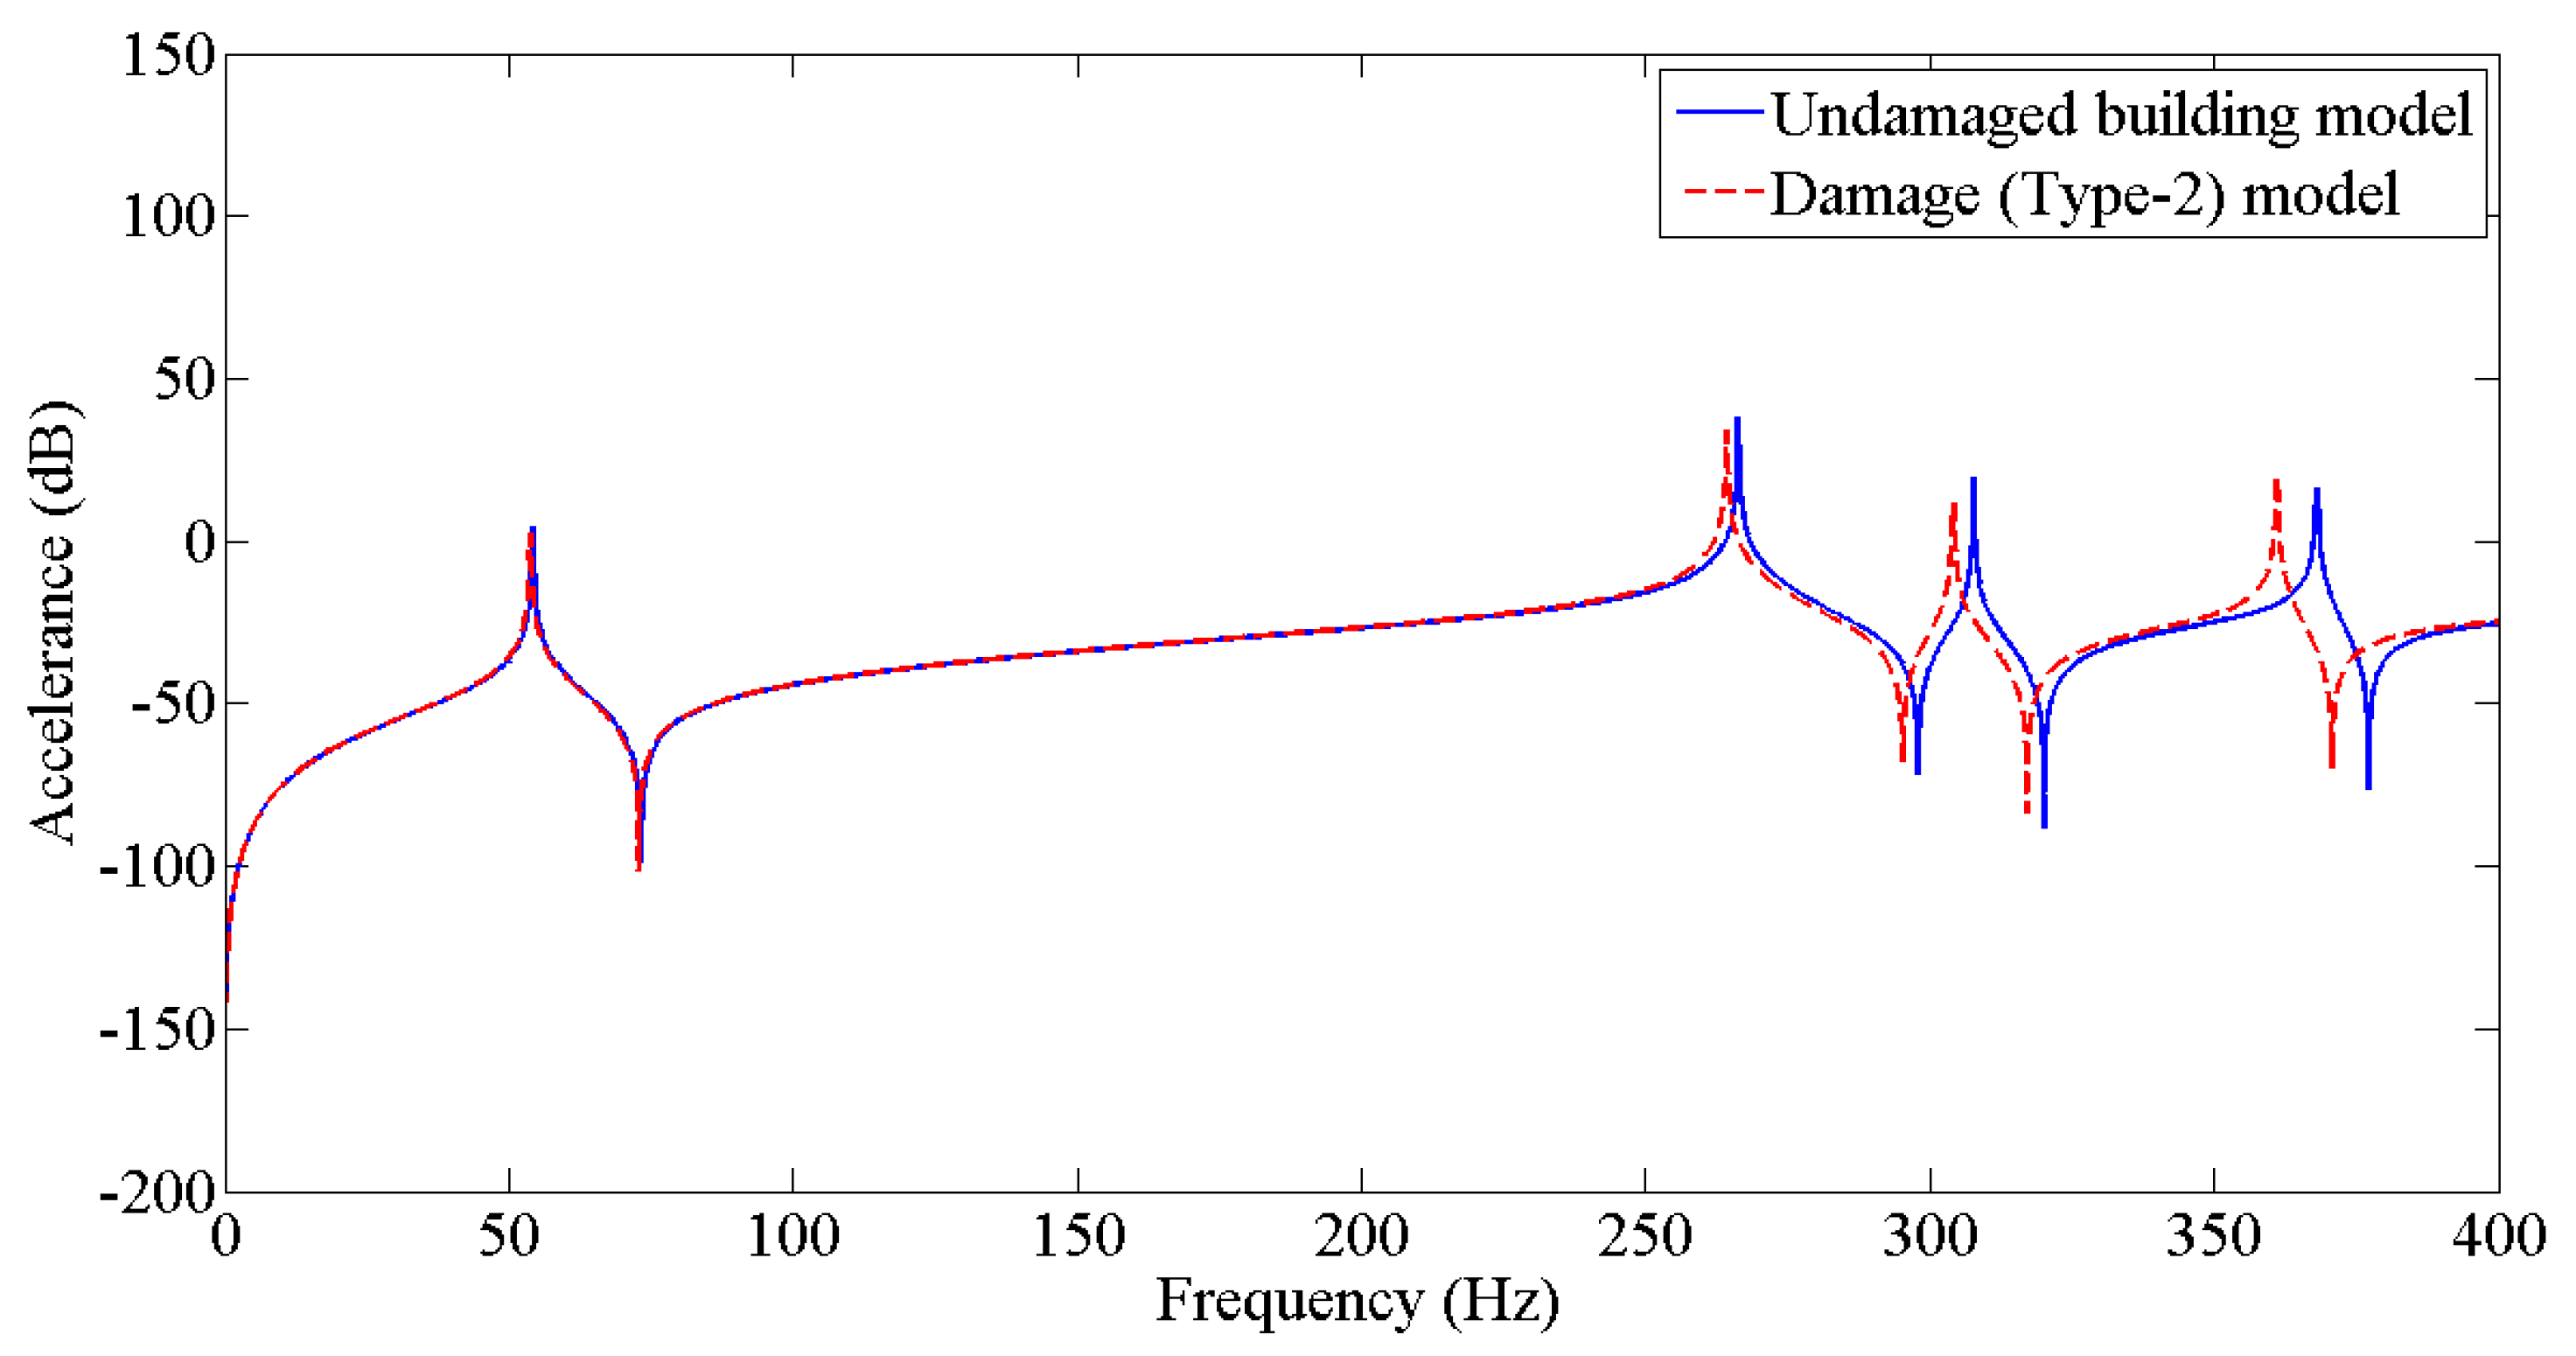
| 3 | Damaged (Type−2) |  | The damage condition (Type−2) was introduced to the walls of the first-floor of the building model, as shown, to study its dynamic responses. The damage was established using a cutting tool to cut slots of 10 × 6 mm2 along the width of the columns of the model at a height of 58.74 mm from the base. |
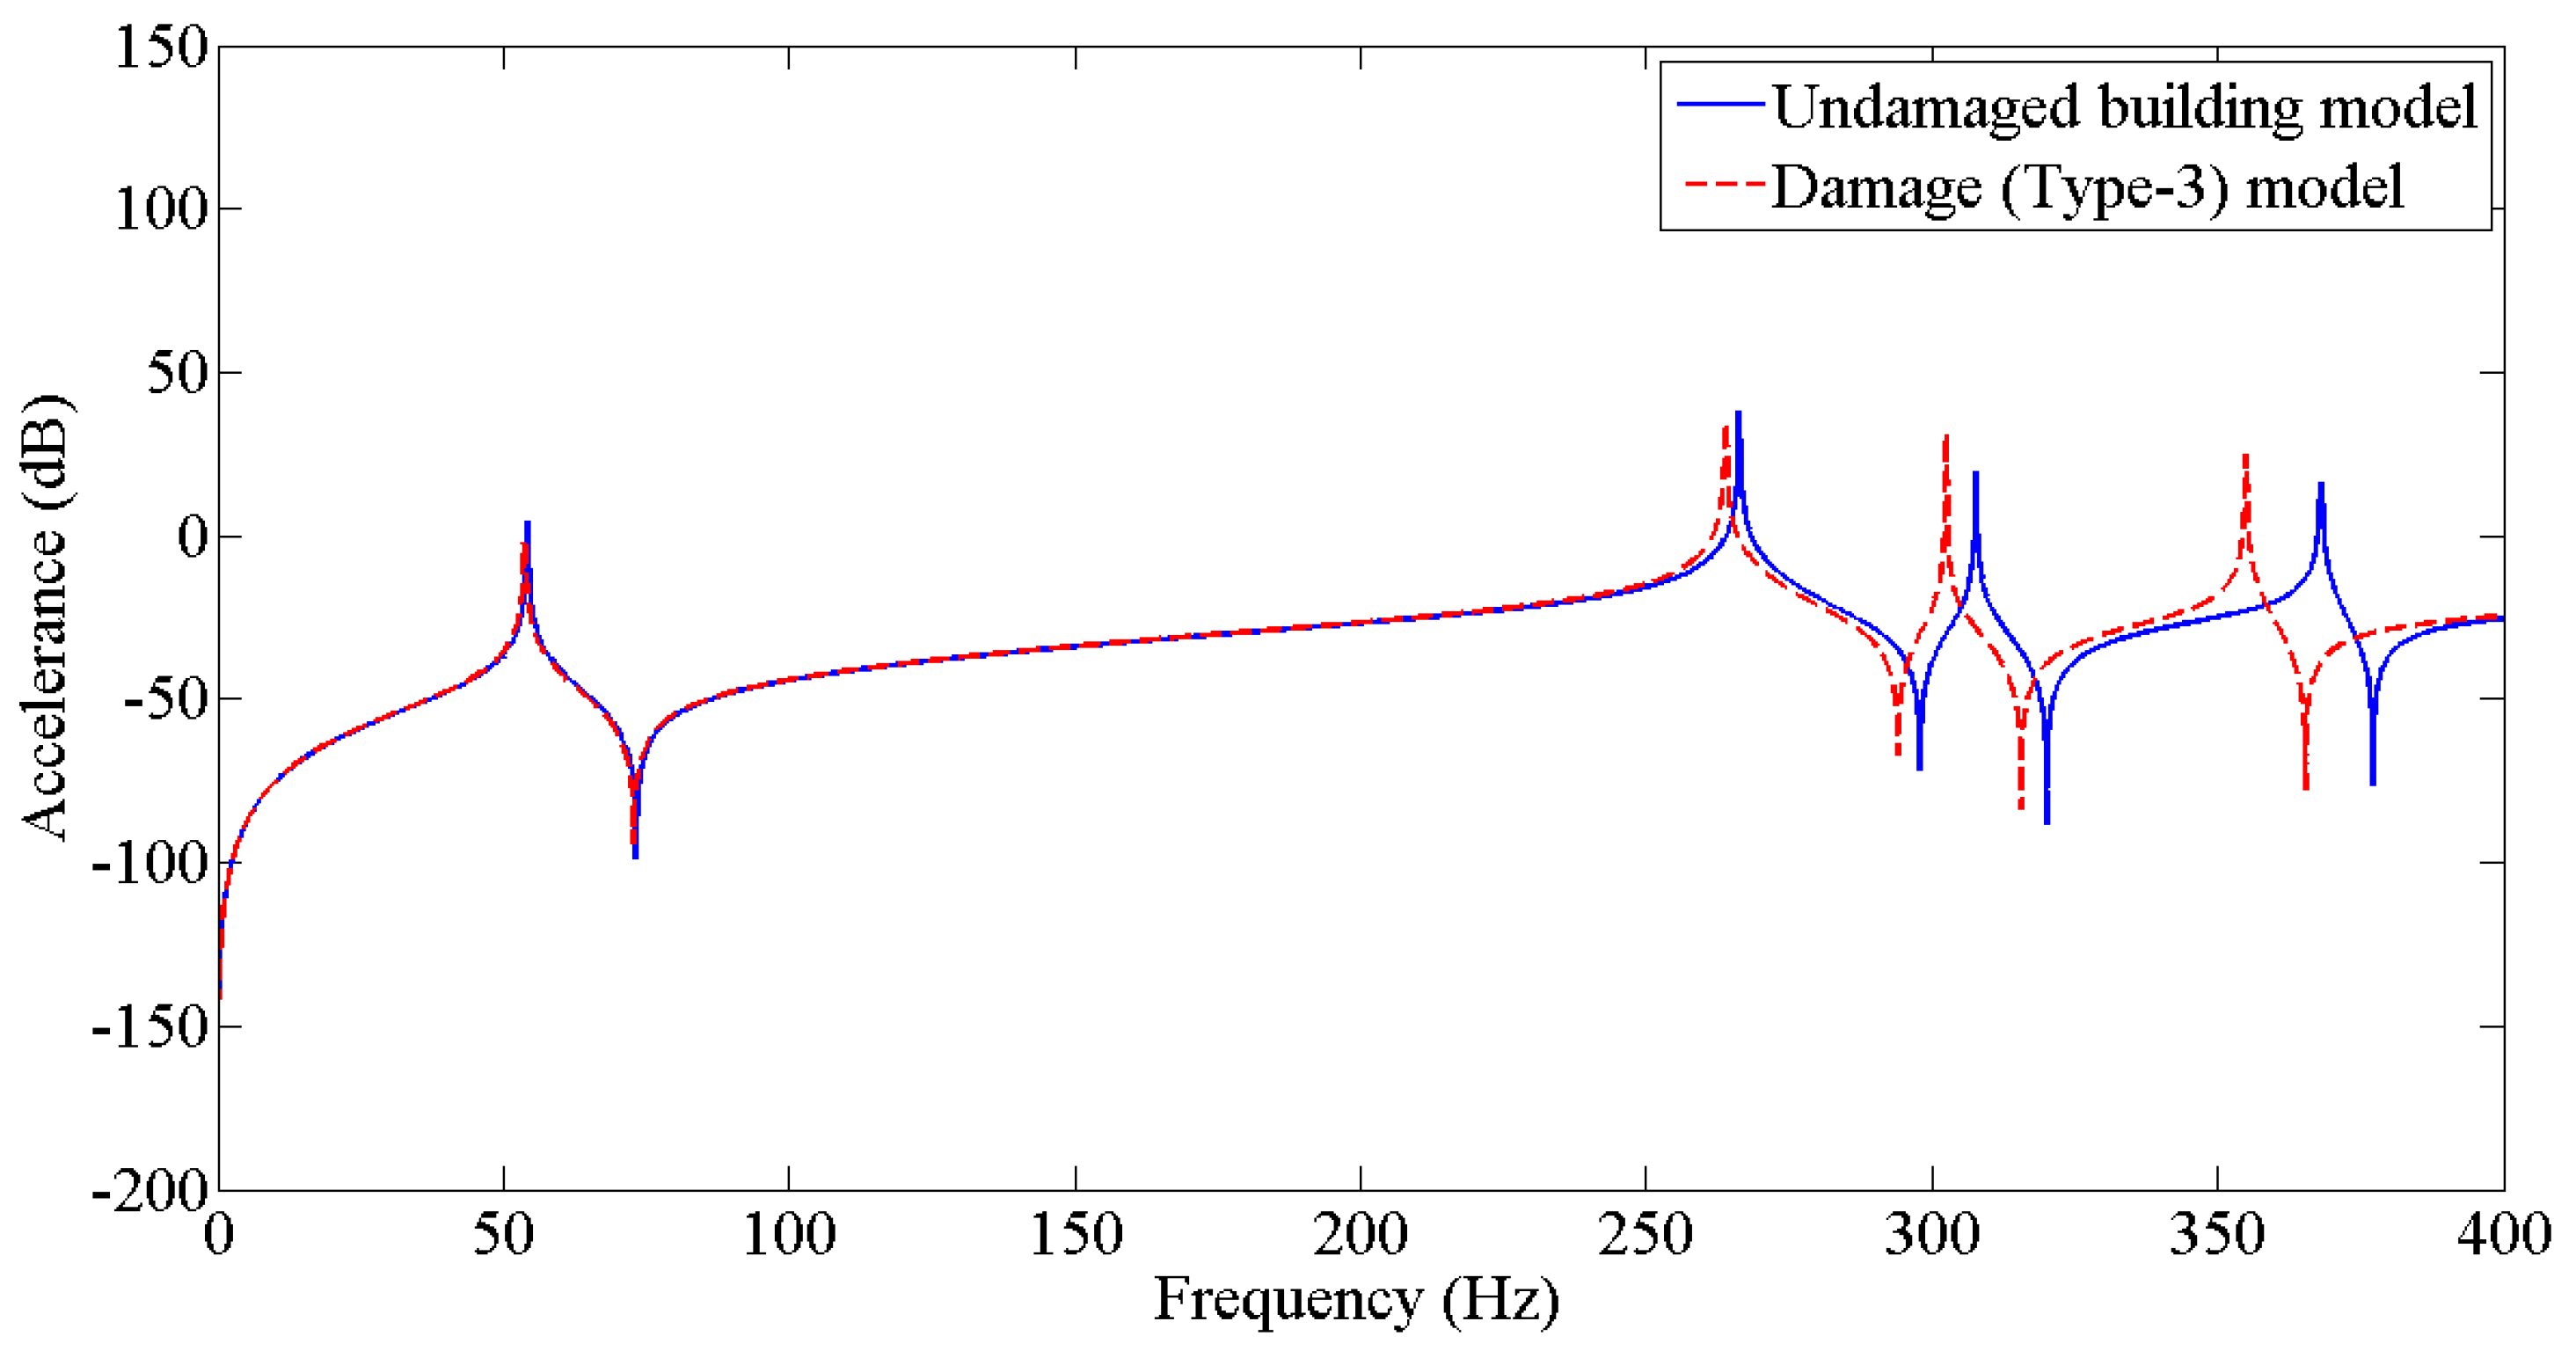
| 4 | Damaged (Type−3) |  | The damage condition (Type−3) was introduced to the walls of the first-floor of the building model, as shown, to study its dynamic responses. The damage was established using a cutting tool to cut slots of 10 × 6 mm2 along the width of the columns of the model at a height of 150.81 mm from the base. |
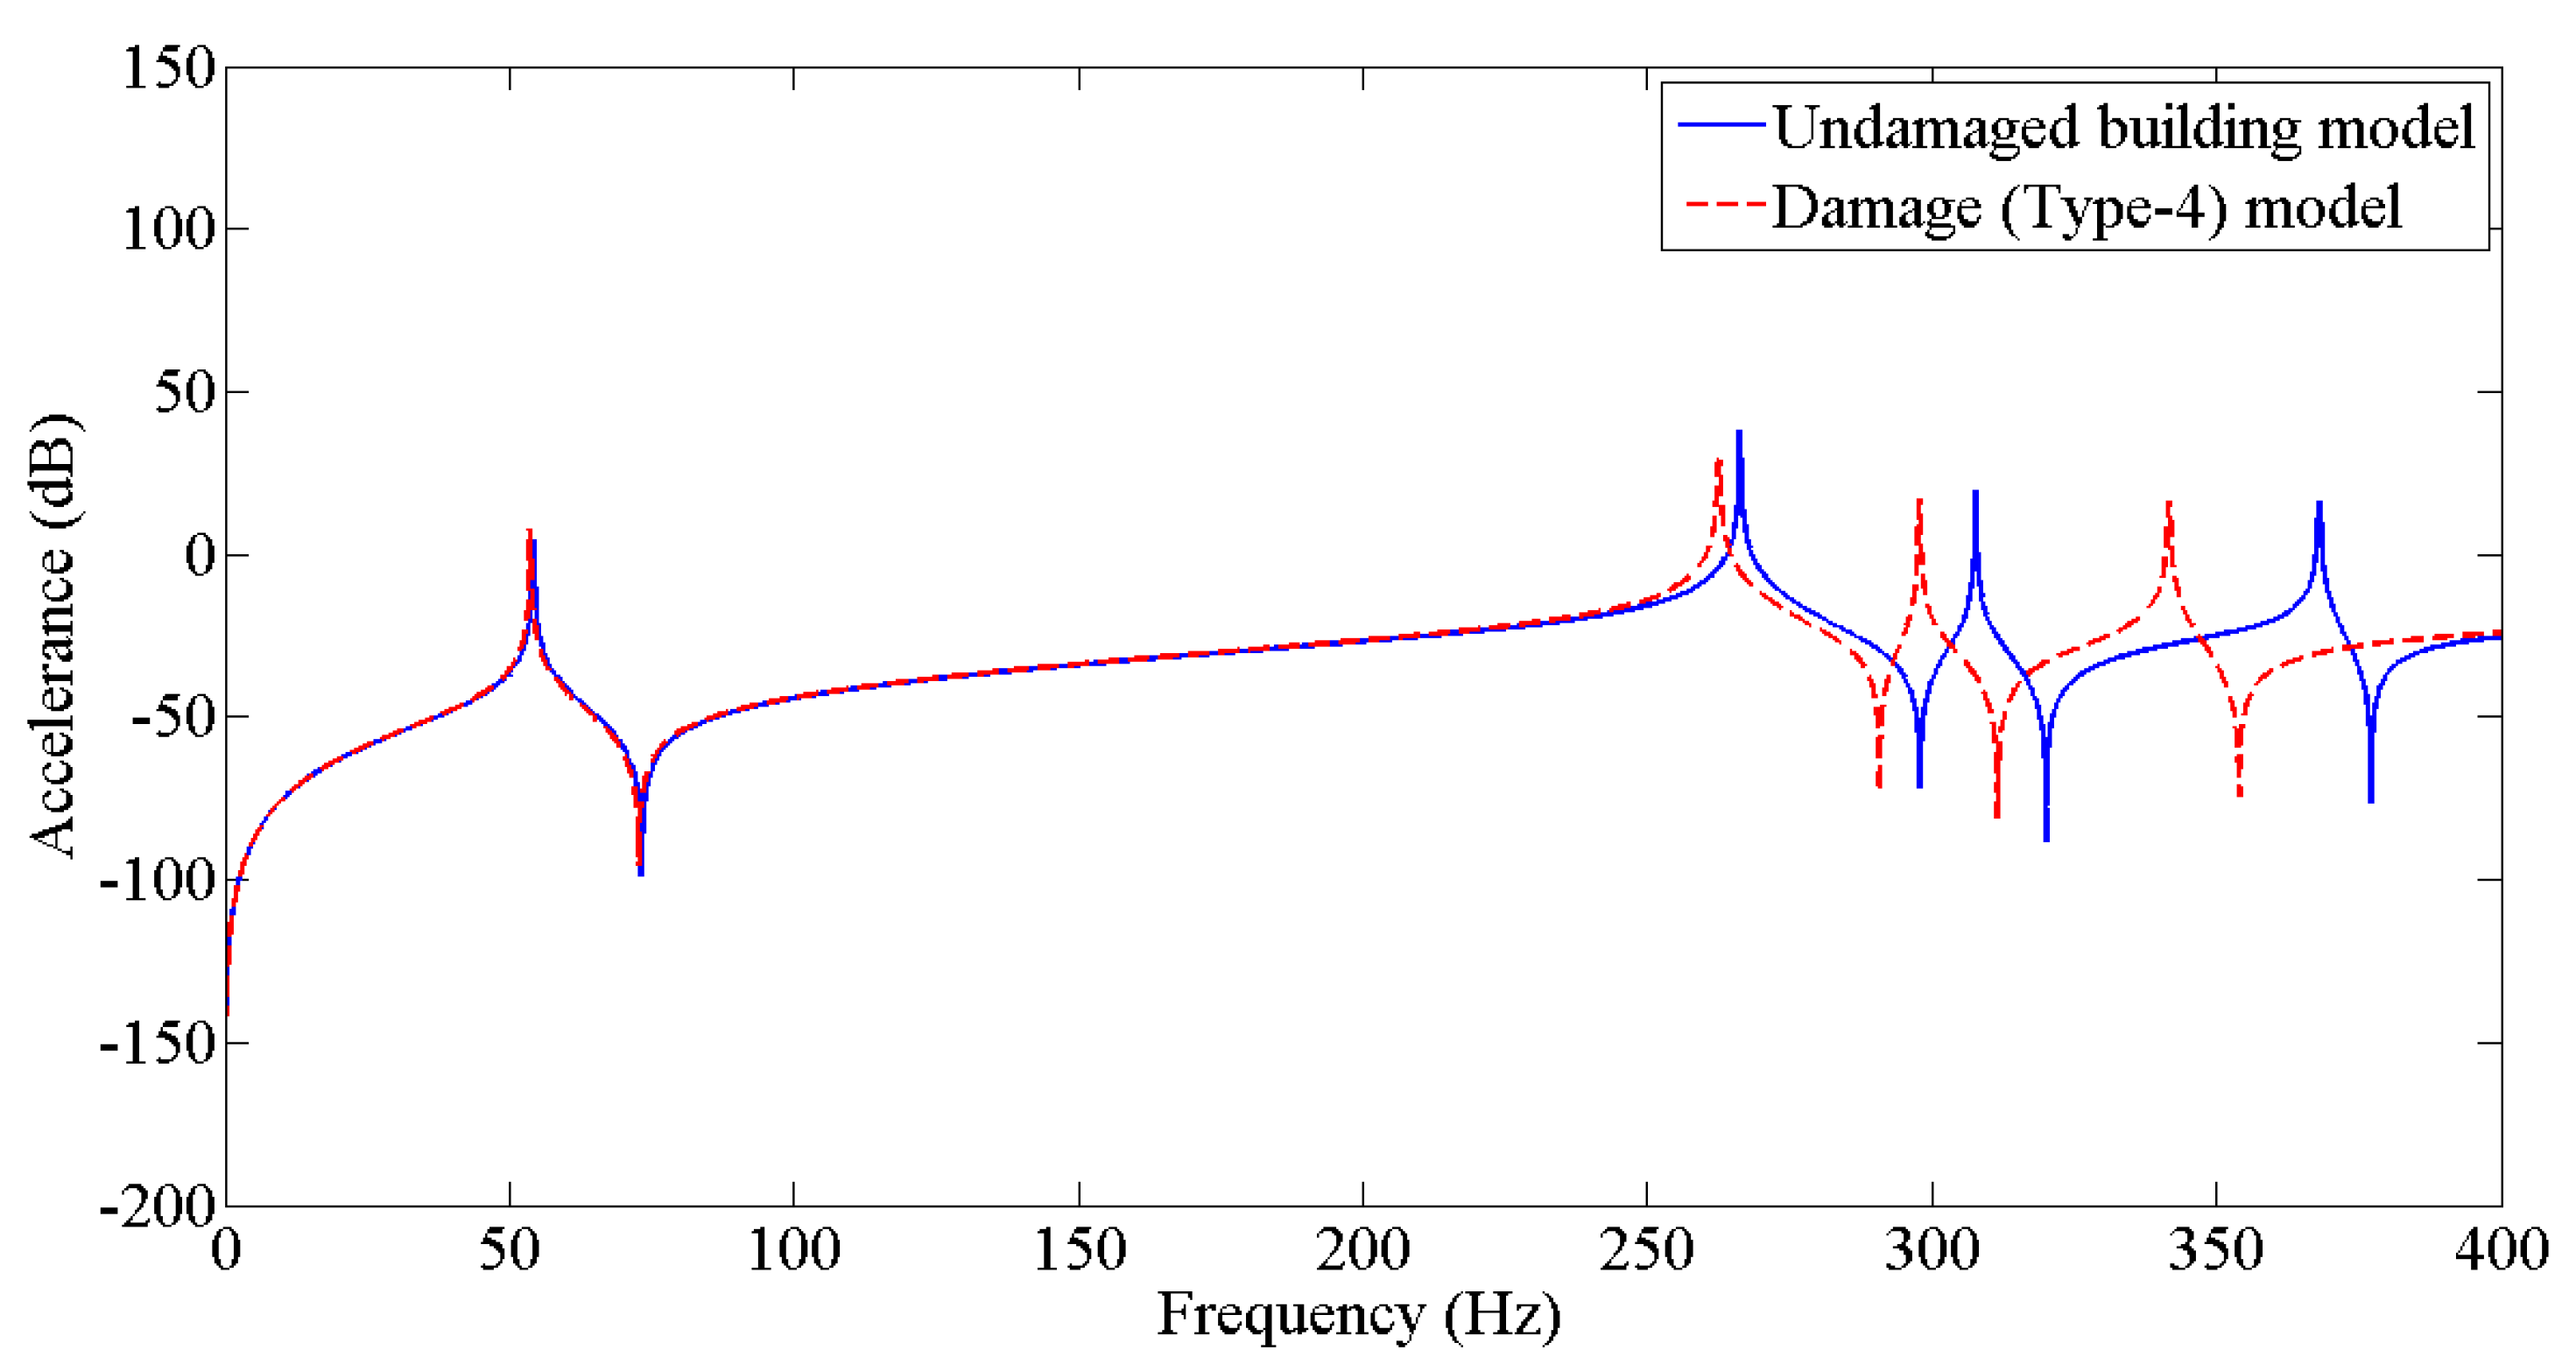
| 5 | Damaged (Type−4) |  | The damage condition (Type−4) was introduced to the walls of the second-floor of the building model, as shown, to study its dynamic responses. The damage was established using a cutting tool to cut slots of 10 × 6 mm2 along the width of the columns of the model at a height of 288.93 mm from the base. |
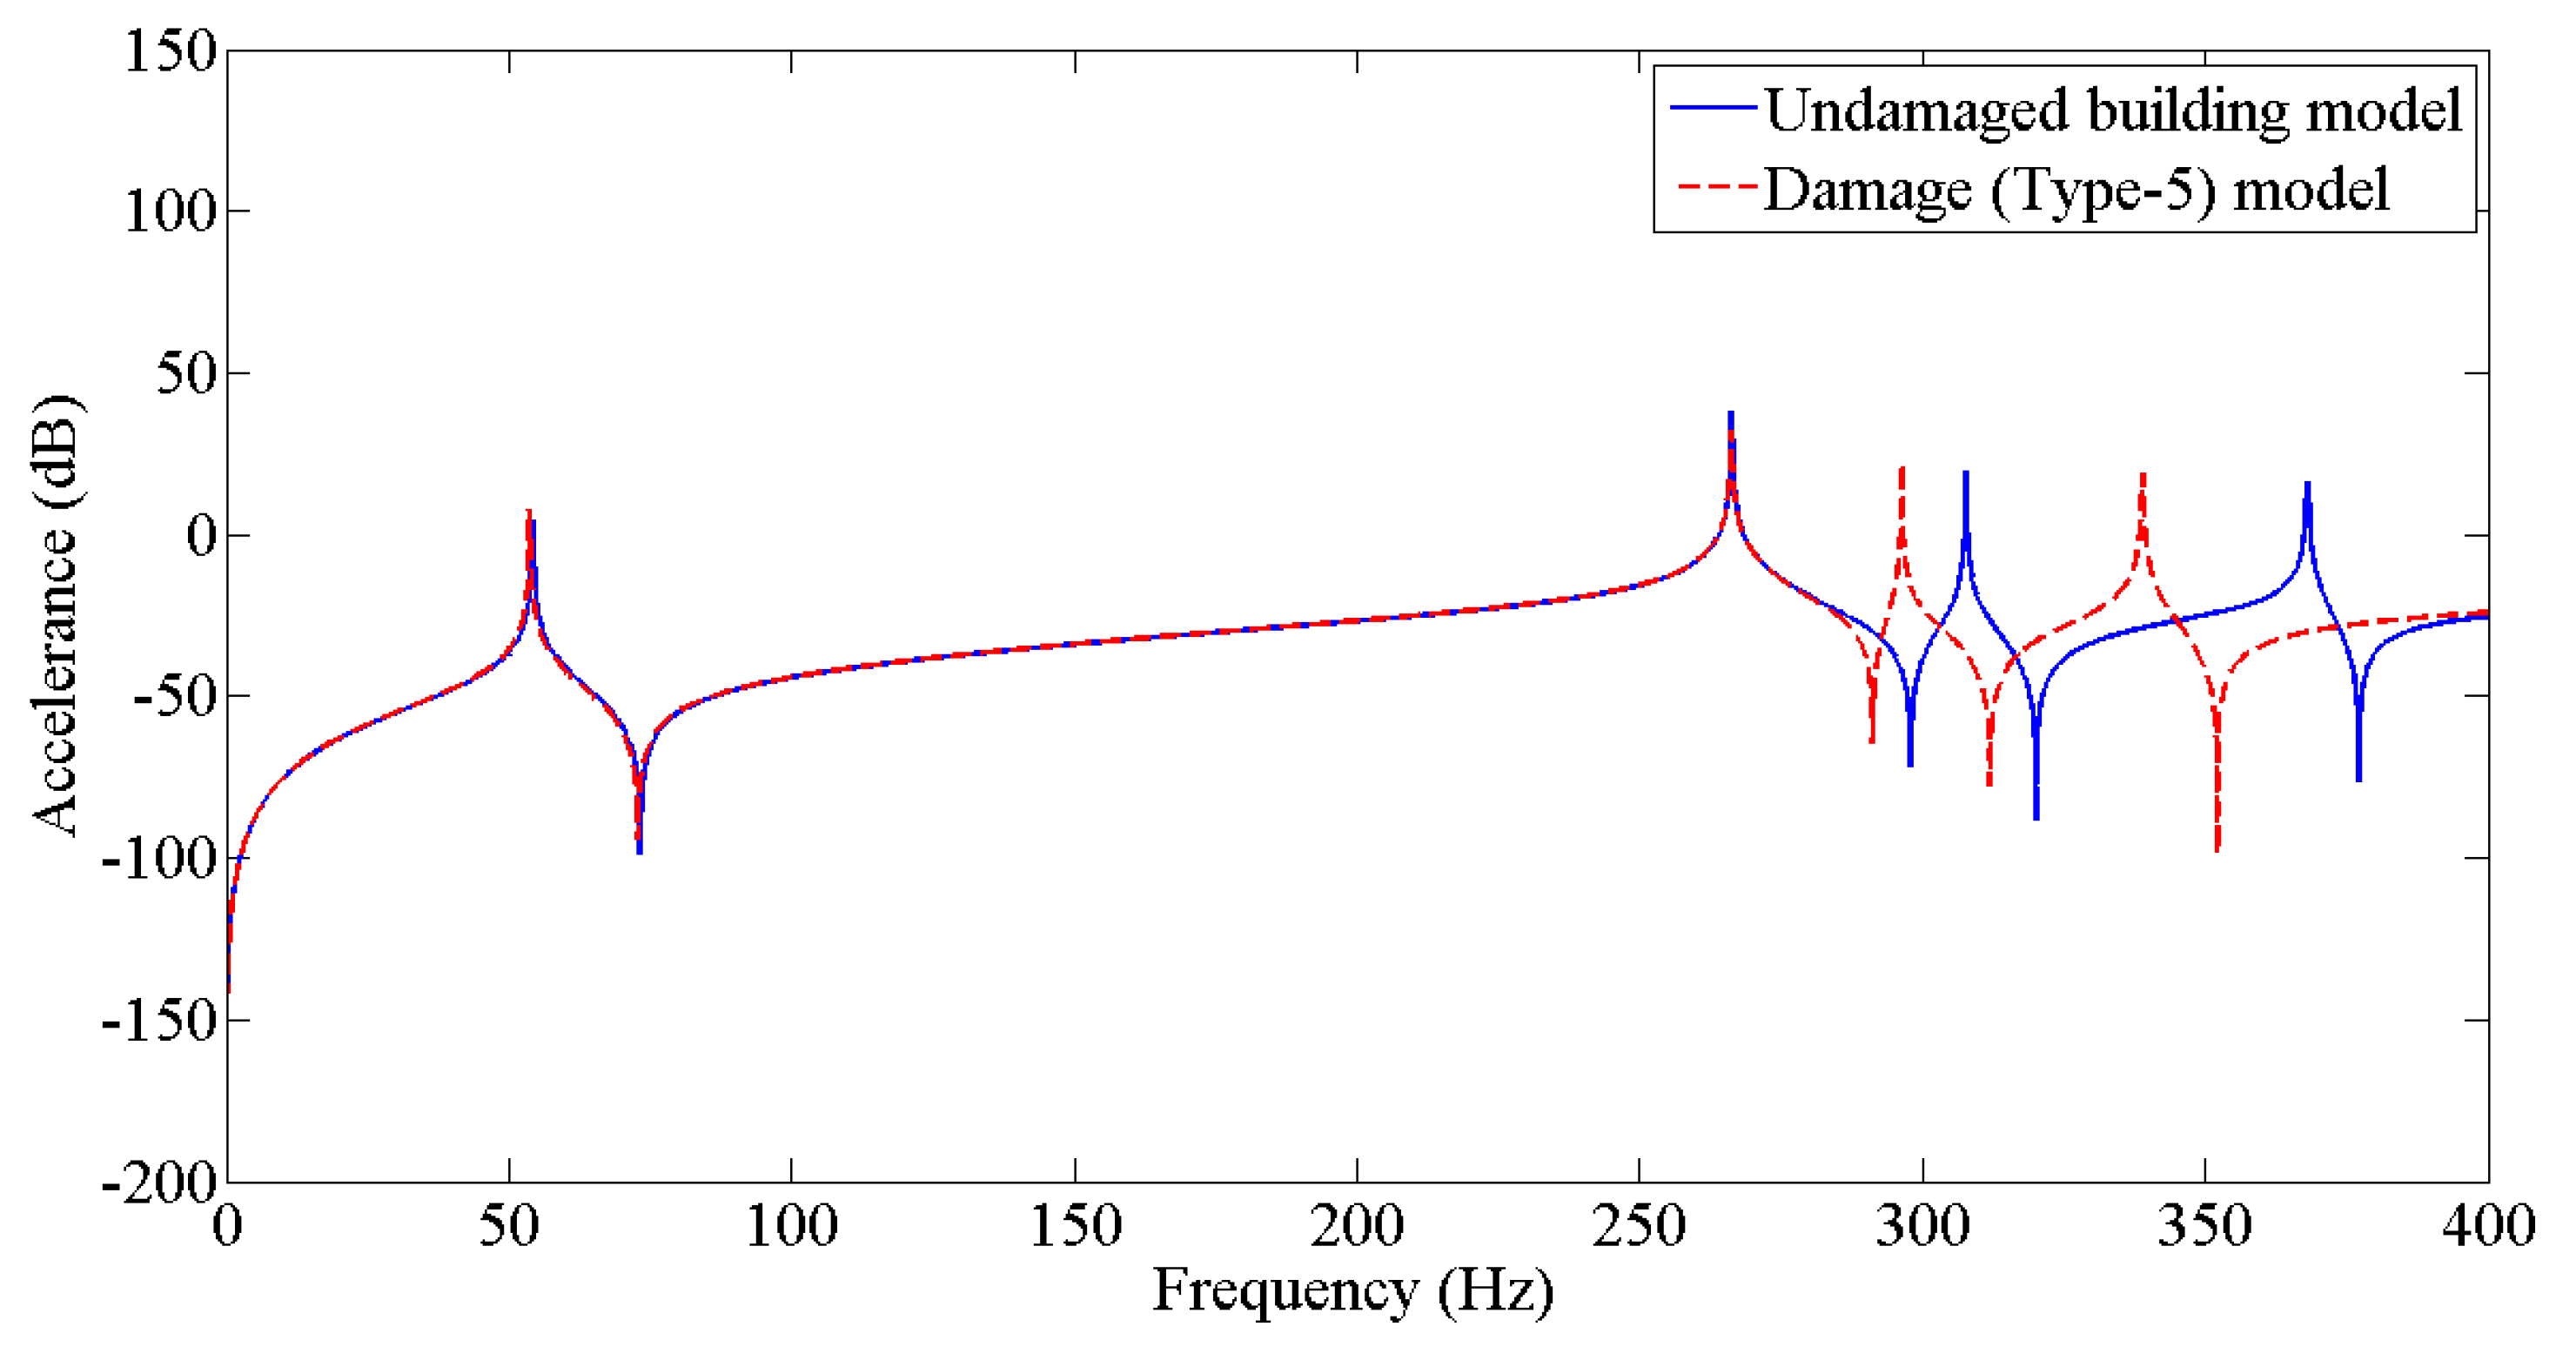
| 6 | Damaged (Type−5) |  | The damage condition (Type−5) was introduced to the walls of the second floor of the building model, as shown, to study its dynamic responses. The damage was established using a cutting tool to cut slots of 10 × 6 mm2 along the width of the columns of the model at a height of 249.24 mm from the base. |
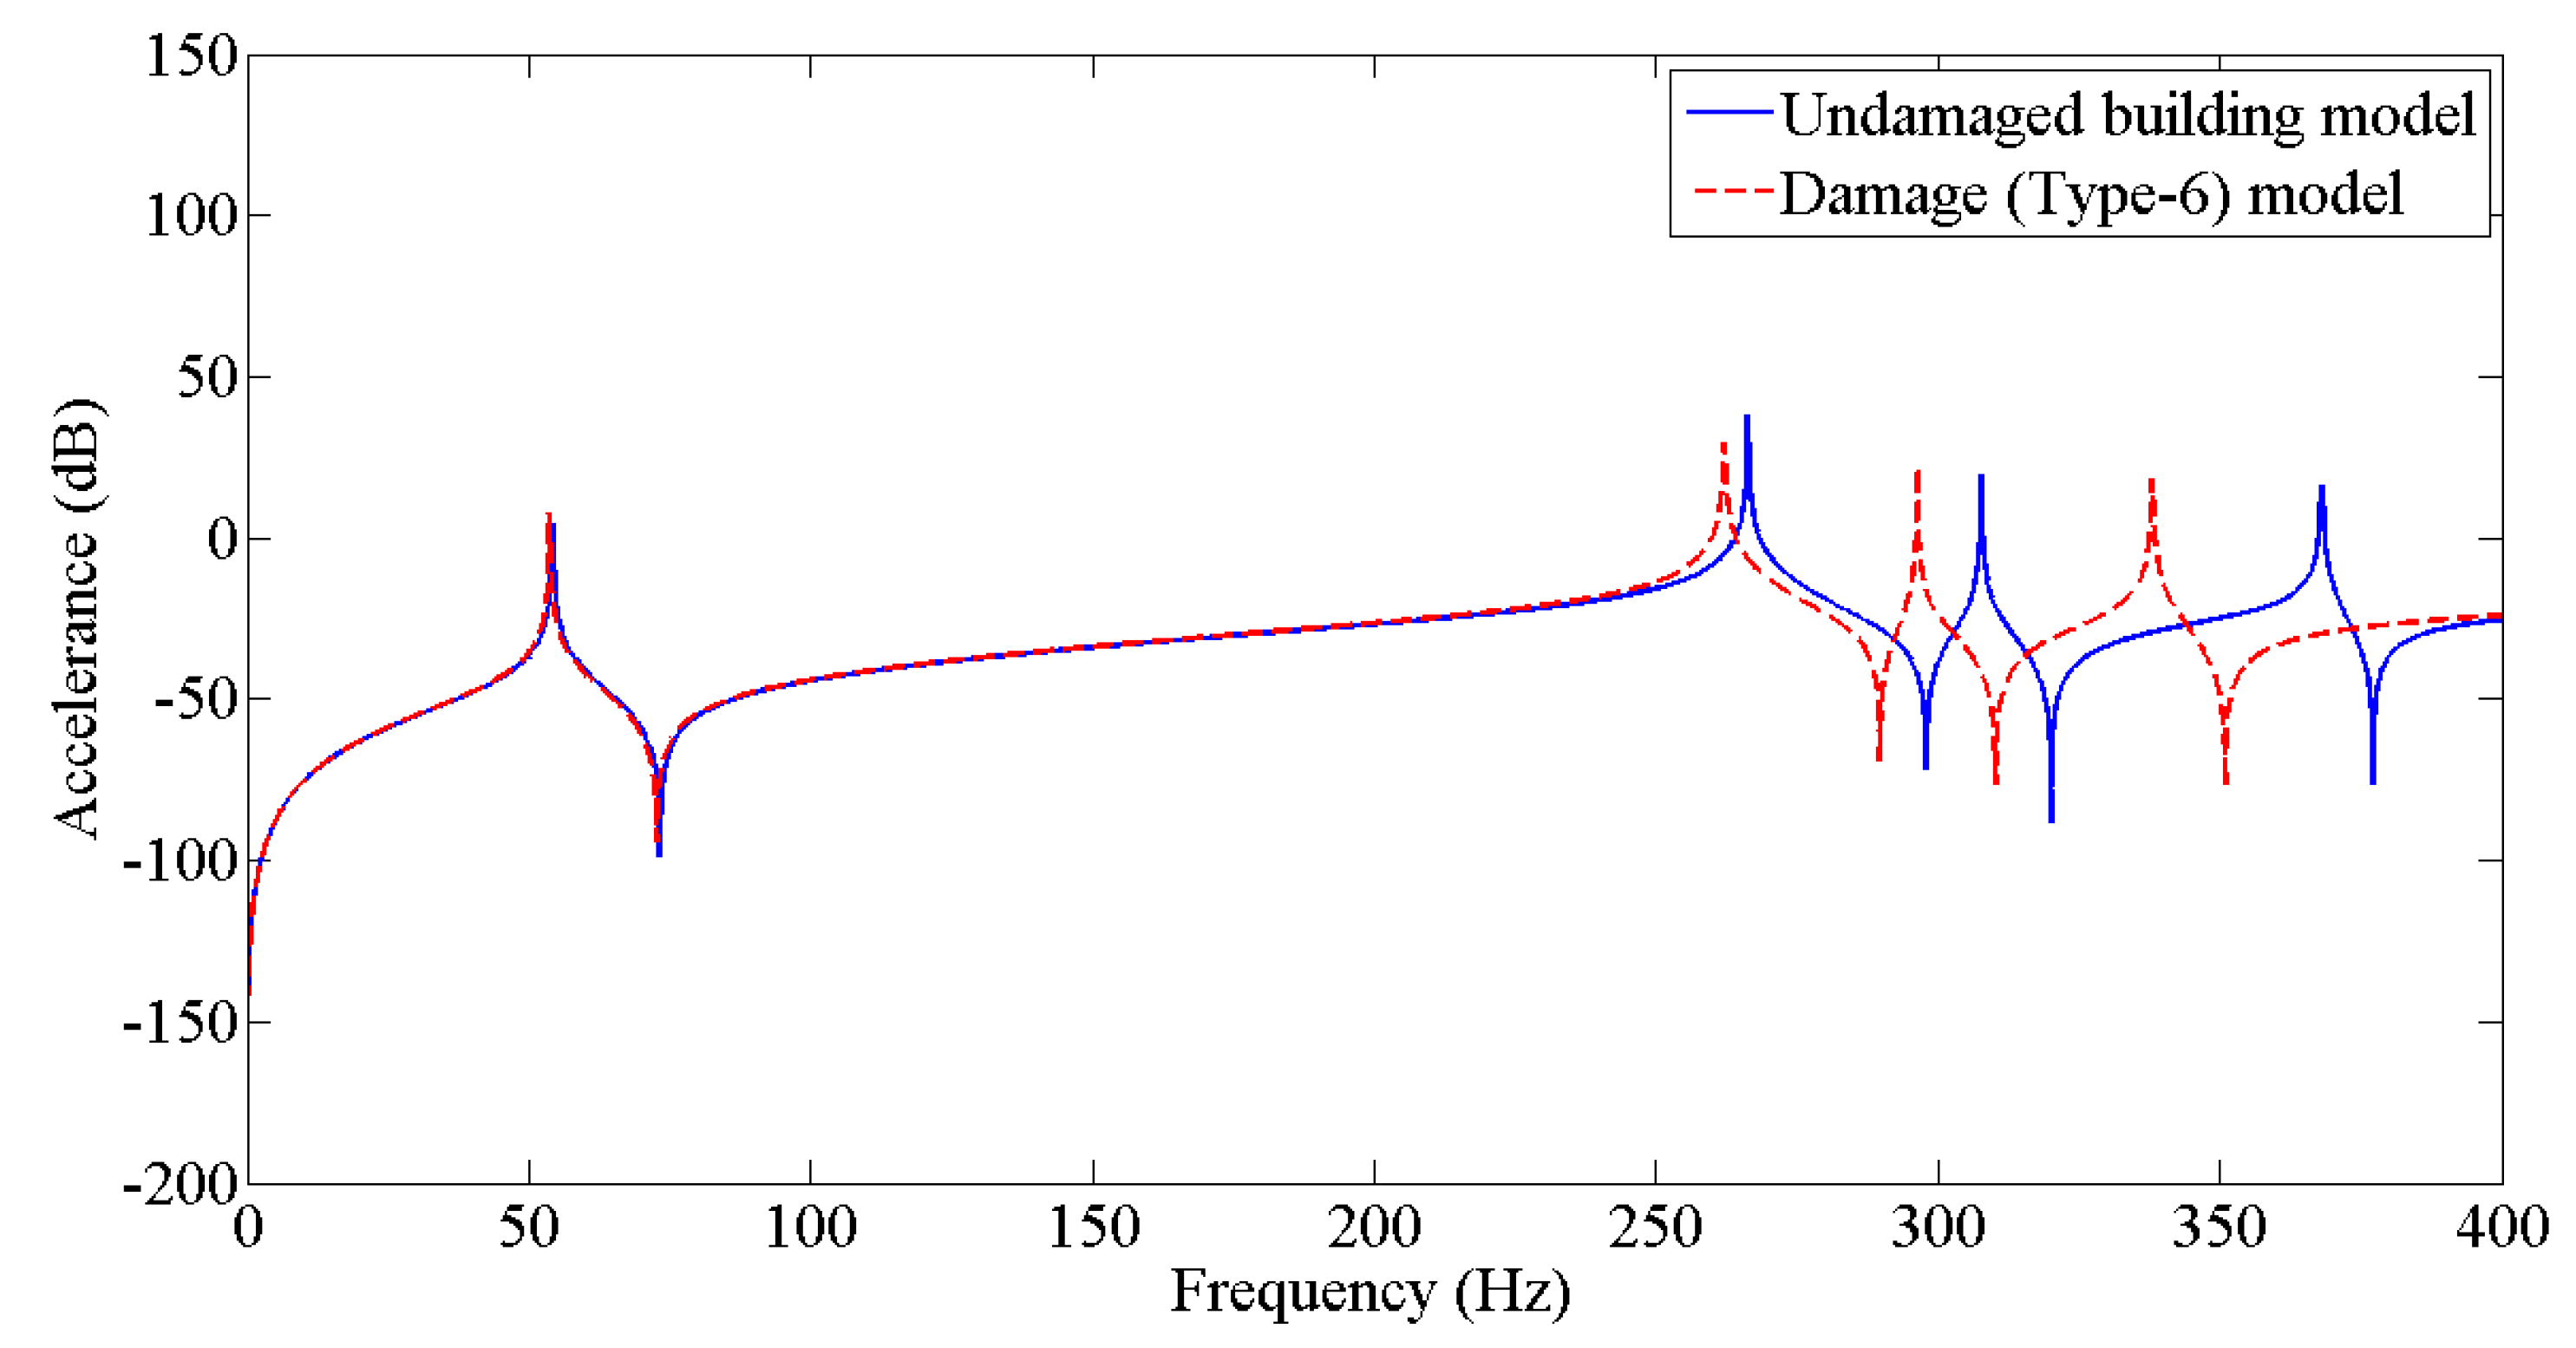
| 7 | Damaged (Type−6) |  | The damage condition (Type−6) was introduced to the walls of the second-floor of the building model, as shown, to study its dynamic responses. The damage was established using a cutting tool to cut slots of 10 × 6 mm2 along the width of the columns of the model at a height of 328.62 mm from the base. |
| Mode No. | Natural Frequency (Hz) of the Building Model | ||||||
|---|---|---|---|---|---|---|---|
| Un- Damaged | Damaged | ||||||
| Type−1 | Type−2 | Type−3 | Type−4 | Type−5 | Type−6 | ||
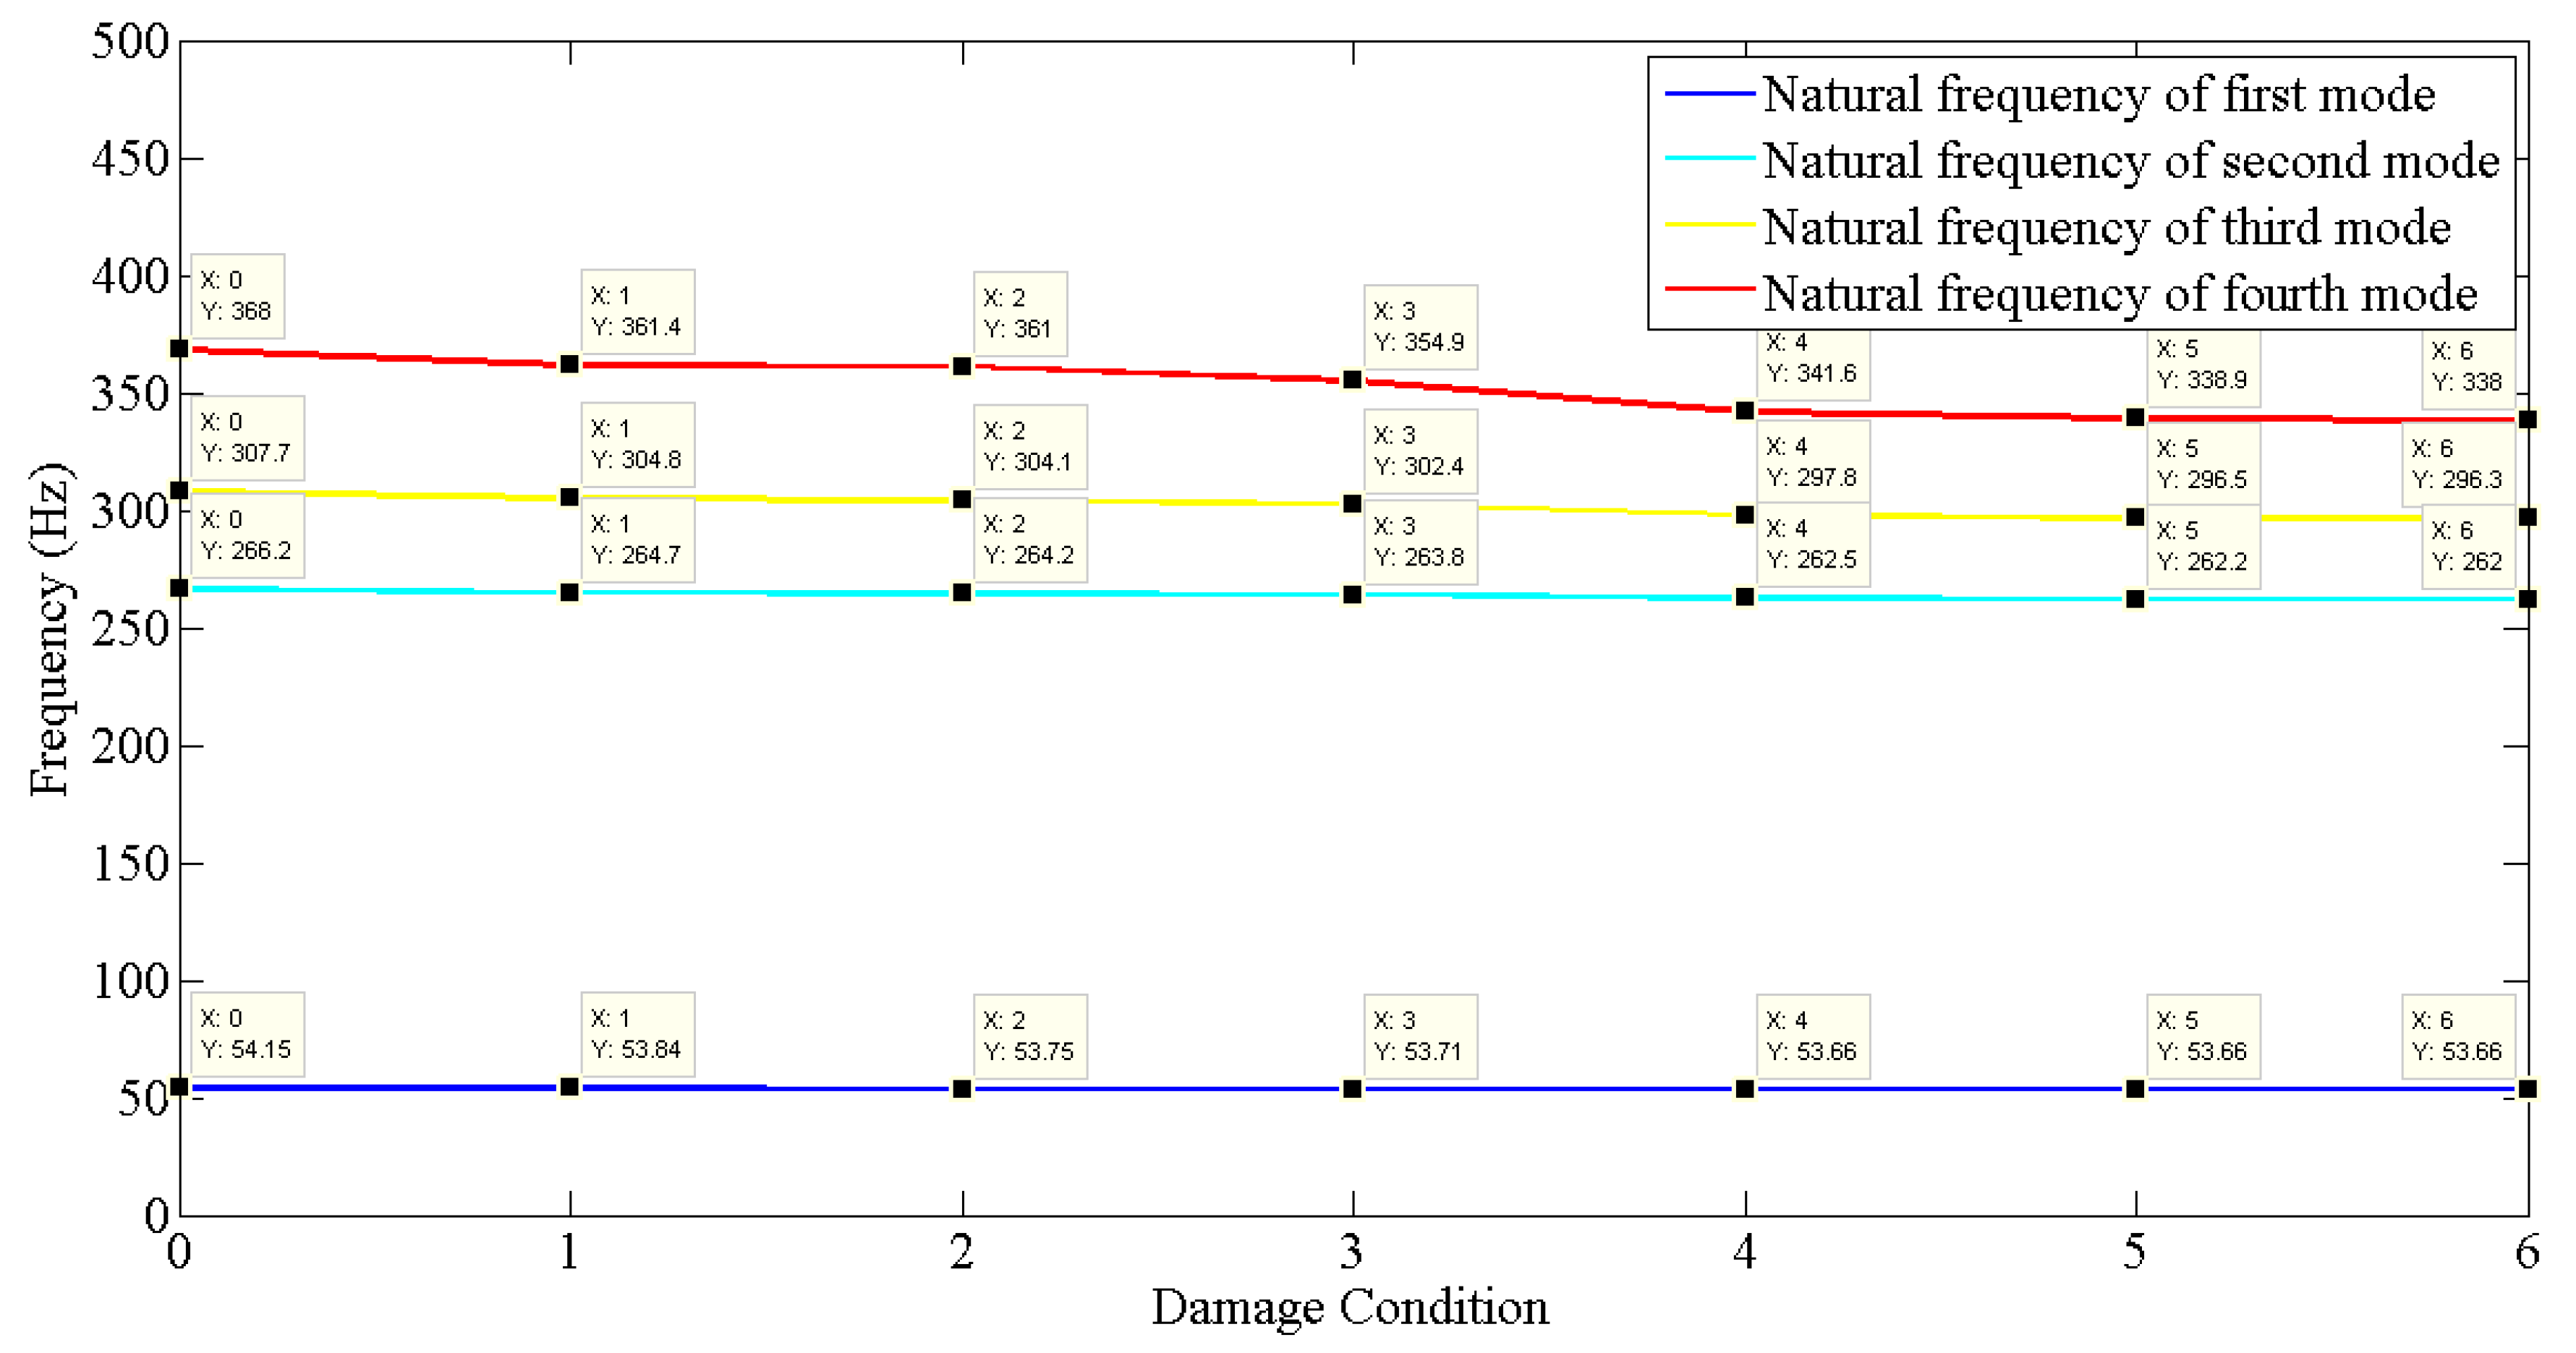
| 1. | 54.15 | 53.84 | 53.75 | 53.71 | 53.66 | 53.66 | 53.66 |
| 2. | 266.24 | 264.69 | 264.24 | 263.84 | 262.53 | 262.16 | 262.04 |
| 3. | 307.67 | 304.80 | 304.09 | 302.40 | 297.81 | 296.51 | 296.33 |
| 4. | 368.04 | 361.36 | 361.01 | 354.89 | 341.64 | 338.89 | 337.99 |
| Damaged Condition | Type−1 | Type−2 | Type−3 | Type−4 | Type−5 | Type−6 |
|---|---|---|---|---|---|---|
| Elevation (mm) | 104.78 | 58.74 | 150.81 | 288.93 | 249.24 | 328.62 |
Publisher’s Note: MDPI stays neutral with regard to jurisdictional claims in published maps and institutional affiliations. |
© 2022 by the authors. Licensee MDPI, Basel, Switzerland. This article is an open access article distributed under the terms and conditions of the Creative Commons Attribution (CC BY) license (https://creativecommons.org/licenses/by/4.0/).
Share and Cite
Singh, T.; Sehgal, S.; Prakash, C.; Dixit, S. Real-Time Structural Health Monitoring and Damage Identification Using Frequency Response Functions along with Finite Element Model Updating Technique. Sensors 2022, 22, 4546. https://doi.org/10.3390/s22124546
Singh T, Sehgal S, Prakash C, Dixit S. Real-Time Structural Health Monitoring and Damage Identification Using Frequency Response Functions along with Finite Element Model Updating Technique. Sensors. 2022; 22(12):4546. https://doi.org/10.3390/s22124546
Chicago/Turabian StyleSingh, Tarunpreet, Shankar Sehgal, Chander Prakash, and Saurav Dixit. 2022. "Real-Time Structural Health Monitoring and Damage Identification Using Frequency Response Functions along with Finite Element Model Updating Technique" Sensors 22, no. 12: 4546. https://doi.org/10.3390/s22124546