
Impact of Structural Health Monitoring on Aircraft Operating Costs by Multidisciplinary Analysis


Abstract
:1. Introduction
2. Materials and Methods
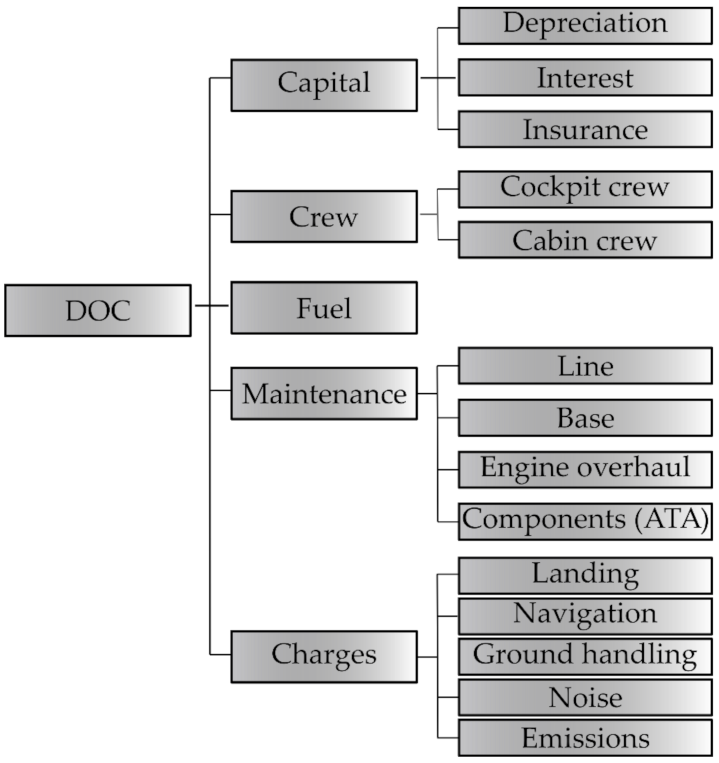
2.1. Direct Operating Costs Methodologies
- To provide a means to compare aircraft designs operating costs under a specific set of conditions;
- To assist airlines and the aircraft manufacturer in assessing the aircraft economic on given routes.
- Capital cost: depreciation, insurance, interest;
- Crew cost: cockpit and cabin;
- Fuel cost;
- Maintenance cost: line, base, engine overhaul, aircraft components;
- Charges: landing, navigation, ground handling, noise, emissions.
2.1.1. Capital Costs
- Depreciation of the initial investment, that is the allocation of aircraft’s acquisition cost over a certain period;
- Interest charges on capital employed;
- Aircraft and passengers’ insurance.
2.1.2. Fuel Costs
2.1.3. Charges: Landing, Navigation, Ground Handling, Noise, and Emissions
- En-route charges;
- Charges for terminal air navigation services;
- Air navigation charges;
- Communication charges.
2.1.4. Crew Costs
2.1.5. Maintenance Costs
- by dividing maintenance in different tasks, such as line and base maintenance, engine overhaul and subsystems’ maintenance; then the cost of each activity can be estimated by itself;
- calculate the cost of labour and material for both engines and airframe maintenance.
2.2. On Condition vs. Scheduled Maintenance
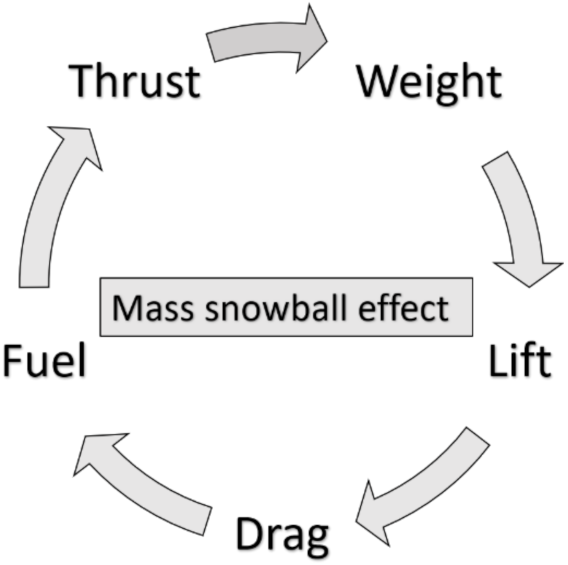
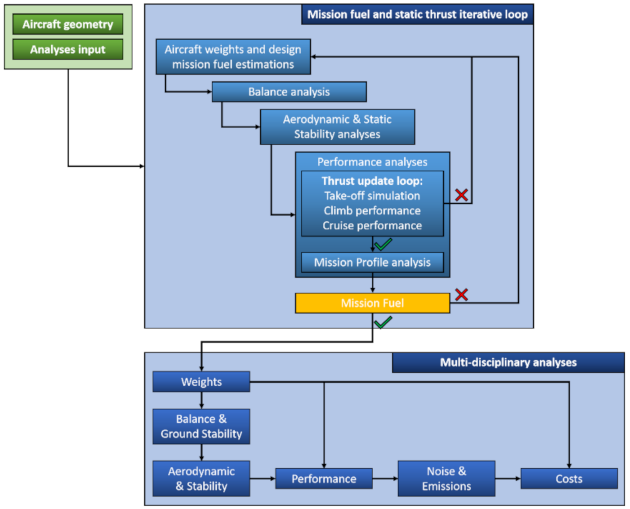
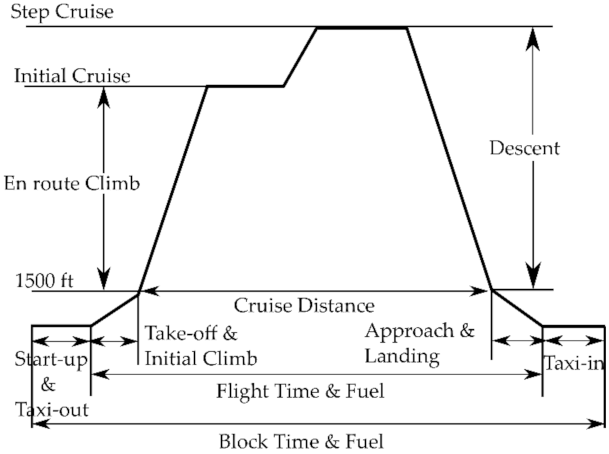
2.3. Aircraft Performance Estimation
- greater required lift;
- larger wing;
- higher aerodynamic drag;
- therefore, the thrust must be increased;
- this leads to larger engines;
- this increases the weight again.
3. Results
- 50% of line maintenance since it should not be necessary to perform any preventive actions thanks to the information gathered through the sensors;
- 50% of base maintenance since it seems unrealistic the hypothesis for which it is possible to eliminate completely the so-called Check C (from regulation point of view).
4. Conclusions
Author Contributions
Funding
Institutional Review Board Statement
Informed Consent Statement
Data Availability Statement
Conflicts of Interest
References
- Boller, C.; Chang, F.; Fujino, Y. Encyclopedia of Structural Health Monitoring; John Wiley & Sons: Hoboken, NJ, USA, 2009. [Google Scholar]
- Tschöke, K.; Mueller, I.; Memmolo, V.; Moix-Bonet, M.; Moll, J.; Lugovtsova, Y.; Golub, M.; Venkat, R.S.; Schubert, L. Feasibility of Model-Assisted Probability of Detection Principles for Structural Health Monitoring Systems based on Guided Waves for Fibre-Reinforced Composites. IEEE Trans. Ultrason. Ferroelectr. Freq. Control. 2021, 68, 3156–3173. [Google Scholar] [CrossRef] [PubMed]
- Memmolo, V.; Boffa, N.D.; Maio, L.; Monaco, E.; Ricci, F. Damage Localization in Composite Structures Using a Guided Waves Based Multi-Parameter Approach. Aerospace 2018, 5, 111. [Google Scholar] [CrossRef] [Green Version]
- Coppe, A.; Pais, M.J.; Haftka, R.T.; Kim, N.H. Using a simple crack growth model in predicting remaining useful life. J. Aircr. 2012, 49, 1965–1973. [Google Scholar] [CrossRef]
- Monaco, E.; Boffa, N.D.; Memmolo, V.; Ricci, F.; Testoni, N.; De Marchi, L.; Marzani, A.; Hettler, J.; Tabatabaeipour, M.; Delrue, S.; et al. Methodologies for Guided Wave-Based SHM System Implementation on Composite Wing Panels: Results and Perspectives from SARISTU Scenario 5. In Smart Intelligent Aircraft Structures (SARISTU); Wölcken, P., Papadopoulos, M., Eds.; Springer: Cham, Switzerland, 2016. [Google Scholar] [CrossRef]
- United States Government Accountability Office. Aviation Safety: Status of FAA’s Actions to Oversee the Safety of Composite Airplanes; United States Government Accountability Office: Washington, DC, USA, 2011.
- Abrate, S. Impact on Composite Structures; Cambridge University Press: Cambridge, UK, 1998. [Google Scholar]
- Maio, L.; Monaco, E.; Ricci, F.; Lecce, L. Simulation of low velocity impact on composite laminates with progressive failure analysis. Compos. Struct. 2013, 103, 75–85. [Google Scholar] [CrossRef]
- Alderliesten, R.C. Introduction to Aerospace Structures and Materials; TU Delft: Delft, The Netherlands, 2018. [Google Scholar] [CrossRef]
- US Department of Defense. MIL-HDBK 17-3F Composite Materials Handbook. In Department of Defense Handbook; US Department of Defense: Washington, DC, USA, 2002. [Google Scholar]
- U.S. Department of Transportation—Federal Aviation Administration. AC No. 20-107B, Composite Aircraft Structures; U.S. Department of Transportation—Federal Aviation Administration: Oklahoma City, OK, USA, 2009.
- U.S. Department of Transportation—Federal Aviation Administration. AC No. 25,571-1D, Damage Tolerance and Fatigue Evaluation of Structures; U.S. Department of Transportation—Federal Aviation Administration: Oklahoma City, OK, USA, 2011.
- Soutis, C. Carbon fiber reinforced plastics in aircraft construction. Mater. Sci. Eng. A 2005, 412, 171–176. [Google Scholar] [CrossRef]
- Federal Aviation Administration. Report Damage Tolerance and Fatigue Evaluation of Structure Document Information; Tech. Rep. AC 25.571-1D; FAA: Washington, DC, USA, January 2011. Available online: https://perma.cc/7HYK-ZPXN (accessed on 12 May 2021).
- European Union Aviation Safety Agency (EASA). Acceptable Means of Compliance 20–29 Amendment 6. 2010. Available online: https://perma.cc/KQX3-KBZL (accessed on 12 May 2021).
- National Research Council. New Materials for Next-Generation Commercial Transports; The National Academies Press: Washington, DC, USA, 1996. [Google Scholar] [CrossRef]
- Giurgiutiu, V. Structural Health Monitoring with Piezoelectric Wafer Active Sensors, 2nd ed.; Academic Press: Cambridge, MA, USA, 2014. [Google Scholar]
- Cottone, G.; Golliwitzer, S.; Heckenberger, U.; Srauss, D. Reliability-oriented optimization of replacement strategies for monitored composite panels for Aircraft Structures. In Proceedings of the 9th International Workshop on Structural Health Monitoring (IWSHM), Stanford, CA, USA, 10–12 September 2013; Volume 2, pp. 118–125. [Google Scholar]
- Apicella, A.; Cottone, G.; De Marchi, L.; Heckenberger, U.; Marzani, A. ROC and cost curves for SHM performance characterization in a multilevel damage classification Framework: Application to Impact Damage in Aircraft Composites Structures. In Proceedings of the 10th International Workshop on Structural Health Monitoring (IWSHM), Stanford, CA, USA, 1–3 September 2015; Volume 2, pp. 118–125. [Google Scholar]
- Thons, S. On the Value of Monitoring Information for the Structural Integrity and Risk Management. Comput.-Aided Civ. Infrastruct. Eng. 2018, 33, 79–94. [Google Scholar] [CrossRef]
- Huang, M.; Xu, Z.; Li, L.; Lei, Y. Construction and Application of Bridge Expansion and Contraction Installation Replacement Decision System Based on the Analytic Hierarchy Process. Materials 2020, 13, 4177. [Google Scholar] [CrossRef] [PubMed]
- Ali Shan, S.A.; Solangi, Y.A.; Ikram, M. Analysis of barriers to the adoption of cleaner energy technologies in Pakistan using Modified Delphi and Fuzzy Analytical Hierarchy Process. J. Clean. Prod. 2019, 239, 1037–1050. [Google Scholar] [CrossRef]
- Pattabhiraman, S.; Gogu, C.; Kim, N.H.; Haftka, R.T.; Bes, C. Skipping unnecessary structural airframe maintenance using an on-board structural health monitoring system. J. Risk Reliab. 2012, 226, 549–560. [Google Scholar] [CrossRef]
- Gerdes, M.; Scholz, D.; Galar, D. Effects of condition-based maintenance on costs caused by unscheduled maintenance of aircraft. J. Qual. Maint. Eng. 2016, 22, 394–417. [Google Scholar] [CrossRef]
- Hölzel, N.; Schilling, T.; Gollnick, V. An aircraft lifecycle approach for the cost-benefit analysis of prognostics and condition-based maintenance based on discrete event simulation. In Proceedings of the Annual Conference of the Prognostics and Health Management Society 2014, Fort Worth, TX, USA, 29 September–2 October 2014; pp. 442–457. Available online: https://apps.dtic.mil/sti/citations/AD1002744 (accessed on 12 May 2021).
- Fioriti, M.; Pavan, G.; Corpino, S.; Fusaro, R. Impacts of a prognostics and health management system on aircraft fleet operating cost during conceptual design phase by using parametric estimation. In Proceedings of the 5th CEAS Air & Space Conference, Delft, The Netherlands, 7–11 September 2015; Available online: http://hdl.handle.net/11583/2627572 (accessed on 12 May 2021).
- Leao, B.P.; Fitzgibbon, K.T.; Puttini, L.C.; de Melo, G.P. Cost-benefit analysis methodology for PHM applied to legacy commercial aircraft. In Proceedings of the 2008 IEEE Aerospace Conference, Big Sky, MT, USA, 1–8 March 2008; pp. 1–13. [Google Scholar]
- Feldman, K.; Jazouli, T.; Sandborn, P.A. A methodology for determining the return on investment associated with prognostics and health management. IEEE Trans. Reliab. 2009, 58, 305–316. [Google Scholar] [CrossRef]
- Dong, T.; Kim, N. Cost-effectiveness of structural health monitoring in fuselage maintenance of the civil aviation industry. Aerospace 2018, 5, 87. [Google Scholar] [CrossRef] [Green Version]
- Dienel, C.; Meyer, H.; Werwer, M.; Willberg, C. Estimation of airframe weight reduction by integration of piezoelectric and guided wave-based structural health monitoring. Struct. Health Monit. 2018, 18, 1778–1788. [Google Scholar] [CrossRef] [Green Version]
- Buderath, M.; Adhikari, P.P. Simulation Framework and Certification Guidance for Condition Monitoring and Prognostic Health Management. In Proceedings of the European Conference of the Prognostics and Health Management Society, Dresden, Germany, 3–5 July 2012. [Google Scholar]
- Adhikari, P.P.; Buderath, M. A Framework for Aircraft Maintenance Strategy including CBM. In Proceedings of the PHM Society European Conference, Bilbao, Spain, 5–8 July 2016; Volume 3. [Google Scholar] [CrossRef]
- Adhikari, P.P.; Makhecha, D.; Buderath, M. A Certifiable Approach towards Integrated Solution for Aircraft Readiness Management. In Proceedings of the PHM Society European Conference, Nantes, France, 8–10 July 2014; Volume 2. [Google Scholar] [CrossRef]
- REMAP—Integrated Fleet Management Solution Aimed at Replacing Fixed-Interval Inspections with Adaptive Condition-based Interventions. Available online: https://h2020-remap.eu/ (accessed on 12 May 2021).
- Jenkinson, L.; Simpkin, P.; Rhodes, D. Civil Jet Aircraft Design; Butterworth-Heinemann: Oxford, UK, 1999; ISBN 978-0340741528. [Google Scholar]
- ATA. Standard Method of Estimating Comparative Direct Operating Costs of Turbine Powered Transport Airplanes; Air Transport Association of America: Washington, DC, USA, 1967. Available online: https://perma.cc/W7XV-XE2P (accessed on 11 May 2021).
- International Civil Aviation Organization. ICAO’s Policies on Charges for Airports and Air Navigation Services, 9th ed.; International Civil Aviation Organization: Montreal, QC, Canada, 2012; Available online: https://perma.cc/E9EZ-52KN (accessed on 11 May 2021).
- Franz, K.; Lammering, T.; Risse, K.; Antond, E.; Hoernschemeyer, R. Economics of Laminar Aircraft Considering Off-Design Performance. In Proceedings of the 53rd AIAA/ASME/ASCE/AHS/ASC Structures, Structural Dynamics and Materials Conference, Honolulu, HI, USA, 23–26 April 2012. [Google Scholar] [CrossRef]
- Association of European Airlines. Short-Medium Range Aircraft AEA Requirements; (G(T)5656); AEA: Brussels, Belgium, 1989. [Google Scholar]
- International Civil Aviation Organization. Annex 16 Environmental Protection—Volume I Aircraft Noise. 2011. Available online: https://perma.cc/6P66-ZNRH (accessed on 11 May 2021).
- European Union. Amended Proposal COM 2002/683 of the European Parliament and the Council for a Directive on the Establishment of a Community Framework for Noise Classification for Civil Subsonic Aircraft of 29.11.2002. 2002. Available online: https://ec.europa.eu/transparency/documents-register/detail?ref=COM(2002)683 (accessed on 18 October 2021).
- European Civil Aviation Conference. Recommendation ECAC/27-4, NOx Emission Classification Scheme. 2003. Available online: https://perma.cc/E2XA-997S (accessed on 11 May 2021).
- Fioriti, M.; Vercella, V.; Viola, N. Cost-estimating model for aircraft maintenance. J. Aircr. 2018, 55, 1564–1575. [Google Scholar] [CrossRef]
- Harris, F.D. An Economic Model of U.S. Airline Operating Expenses; NASA/CR–2005-213476; NASA: Washington, DC, USA, 2005. Available online: https://ntrs.nasa.gov/citations/20060024033 (accessed on 11 May 2021).
- Kundu, A.K. Aircraft Design; Cambridge University Press: Cambridge, UK, 2010; ISBN 9780511844652. [Google Scholar] [CrossRef]
- European Aviation Safety Agency (EASA). Acceptable Means of Compliance (AMC) and Guidance Material (GM) to Annex II (PART-145) to Regulation (EU) No 1321/2014, Issue 2. 2015. Available online: https://perma.cc/2FBZ-FP3P (accessed on 12 May 2021).
- Parodi, M.; Fiaschi, C.; Memmolo, V.; Ricci, F.; Maio, L. Interaction of Guided Waves with Delamination in a Bilayered Aluminum-Composite Pressure Vessel. J. Mater. Eng. Perform. 2019, 28, 3281–3291. [Google Scholar] [CrossRef]
- Memmolo, V.; Elahi, H.; Eugeni, M.; Monaco, E.; Ricci, F.; Pasquali, M.; Gaudenzi, P. Experimental and Numerical Investigation of PZT Response in Composite Structures with Variable Degradation Levels. J. Mater. Eng. Perform. 2019, 28, 3239–3246. [Google Scholar] [CrossRef]
- Maio, L.; Hervin, F.; Fromme, P. Guided wave scattering analysis around a circular delamination in a quasi-isotropic fiber-composite laminate. In Proceedings of the SPIE—The International Society for Optical Engineering, Virtual, 23 April 2020; Volume 11381, p. 113810Q. [Google Scholar] [CrossRef]
- Maio, L.; Memmolo, V.; Ricci, F.; Boffa, N.D.; Monaco, E. Investigation on fundamental modes of guided waves propagating in symmetric and nonsymmetric composite laminates. Proc. Inst. Mech. Eng. Part C J. Mech. Eng. Sci. 2017, 231, 2988–3000. [Google Scholar] [CrossRef]
- Hervin, F.; Maio, L.; Fromme, P. Guided wave scattering at a delamination in a quasi-isotropic composite laminate: Experiment and simulation. Comp. Struct. 2021, 275, 114406. [Google Scholar] [CrossRef]
- Fan, H.; Qiao, P. Vibration-based damage identification methods: A review and comparative study. Struct. Health Monit. 2011, 10, 83–111. [Google Scholar] [CrossRef]
- Deraemaeker, A.; Worden, K. New Trends in Vibration Based Structural Health Monitoring; CISM International Centre for Mechanical Sciences Series; Springer: Vienna, Austria, 2012. [Google Scholar]
- Sinou, J. A review of damage detection and health monitoring of mechanical systems from changes in the measurement of linear and non-linear vibrations. In Mechanical Vibrations: Measurement, Effects and Control; Sapri, R.C., Ed.; Nova Science Publishers, Inc.: Hauppauge, NY, USA, 2013; pp. 647–702. [Google Scholar]
- Viktorov, I. Rayleigh and Lamb Waves: Physical Theory and Applications; Ultrasonic Technology Series; Springer: New York, NY, USA, 1967. [Google Scholar]
- Lugovtsova, Y.; Johannesmann, S.; Henning, B.; Prager, J. Analysis of Lamb wave mode repulsion and its implications to the characterisation of adhesive bonding strength. Proc. Mtgs. Acoust. 2019, 38, 030005. [Google Scholar] [CrossRef] [Green Version]
- Lugovtsova, Y.; Bulling, J.; Boller, C.; Prager, J. Analysis of Guided Wave Propagation in a Multi-Layered Structure in View of Structural Health Monitoring. Appl. Sci. 2019, 9, 4600. [Google Scholar] [CrossRef] [Green Version]
- Moll, J.; Schulte, R.T.; Hartmann, T.; Fritzen, C.P.; Nelles, O. Multi-site damage localization in anisotropic plate-like structures using an active guided wave structural health monitoring system. Smart Mater. Struct. 2010, 14, 045022. [Google Scholar] [CrossRef]
- Park, G.; Inman, D.J. Structural health monitoring using piezoelectric impedance measurements. Philos. Trans. R. Soc. Lond. A Math. Phys. Eng. Sci. 2007, 365, 373–392. [Google Scholar] [CrossRef]
- Neuschwander, K.; Moll, J.; Memmolo, V.; Schmidt, M.; Bücker, M. Simultaneous load and structural monitoring of a carbon fiber rudder stock: Experimental results from a quasi-static tensile test. J. Intell. Mater. Syst. Struct. 2019, 30, 272–282. [Google Scholar] [CrossRef]
- Khuc, T.; Catbas, F.N. Structural identification using computer vision-based bridge health monitoring. J. Struct. Eng. 2018, 144, 04017202. [Google Scholar] [CrossRef]
- Feng, D.; Feng, M.Q. Vision-based multipoint displacement measurement for structural health monitoring. Struct. Control Health Monit. 2016, 23, 876–890. [Google Scholar] [CrossRef]
- Yi, T.; Li, H.; Gu, M. Recent research and applications of gps based technology for bridge health monitoring. Sci. China Technol. Sci. 2010, 53, 2597–2610. [Google Scholar] [CrossRef]
- Kharkovsky, S.; Zoughi, R. Microwave and millimeter wave nondestructive testing and evaluation—Overview and recent advances. IEEE Instrum. Meas. Mag. 2010, 10, 26–38. [Google Scholar] [CrossRef]
- Moll, J.; Bechtel, K.; Hils, B.; Krozer, V. Mechanical vibration sensing for structural health monitoring using a millimeter-wave doppler radar sensor. In Proceedings of the 7th European Workshop on Structural Health Monitoring (EWSHM)—2nd European Conference of the Prognostics and Health Management (PHM) Society, Nantes, France, 8–11 July 2014; pp. 1802–1808. [Google Scholar]
- Moll, J.; Krozer, V. Radar-based mechanical vibration sensing for structural health monitoring applications: A comparison of radar transceiver measurements at 24 ghz and 100 ghz. In Proceedings of the 8th European Workshop on Structural Health Monitoring (EWSHM), Bilbao, Spain, 5–8 July 2016; Volume 3, pp. 2128–2133. [Google Scholar]
- Li, C.; Chen, W.; Liu, G.; Yan, R.; Xu, H.; Qi, Y. A noncontact fmcw radar sensor for displacement measurement in structural health monitoring. Sensors 2015, 15, 7412–7433. [Google Scholar] [CrossRef] [PubMed] [Green Version]
- Memmolo, V.; Moll, J.; Nguyen, D.H.; Krozer, V. Damage Detection in Metallic Plates Using Guided Electromagnetic Waves. In Proceedings of the 15th European Conference on Antennas and Propagation (EuCAP), Dusseldorf, Germany, 22–26 March 2021; pp. 1–4. [Google Scholar] [CrossRef]
- Rytter, A. Vibrational Based Inspection of Civil Engineering Structures. Ph.D. Thesis, University of Aalborg, Aalborg, Denmark, 1993. [Google Scholar]
- Memmolo, V.; Maio, L.; Monaco, E.; Ciminiello, N.; Di Giampaolo, B. A multi-channel system for on-line structural health monitoring using guided waves. In Proceedings of the 2019 IEEE 5th International Workshop on Metrology for AeroSpace (MetroAeroSpace), Torino, Italy, 19–21 June 2019; pp. 209–213. [Google Scholar] [CrossRef]
- Nicolosi, F.; De Marco, A.; Attanasio, L.; Della Vecchia, P. Development of a java-based framework for aircraft preliminary design and optimization. J. Aerosp. Inf. Syst. 2016, 13, 234–242. [Google Scholar] [CrossRef] [Green Version]
- De Marco, A.; Cusati, V.; Trifari, V.; Ruocco, M.; Nicolosi, F.; Della Vecchia, P. A java toolchain of programs for aircraft design. In Proceedings of the Aerospace Europe 6th CEAS Conference, Bucharest, Romania, 16–20 October 2017; Council of European Aerospace Societies: Brussels, Belgium, 2017. Available online: http://hdl.handle.net/11588/696606 (accessed on 11 May 2021).
- Trifari, V.; Ruocco, M.; Cusati, V.; Nicolosi, F.; De Marco, A. Multi-disciplinary analysis and optimization tool for aircraft design. In Proceedings of the 31st ICAS Conference (International Council of the Aeronautical Sciences), Belo Horizonte, Brazil, 9–14 September 2018; Available online: http://hdl.handle.net/11588/748237 (accessed on 11 May 2021).
- Nicolosi, F.; Corcione, S.; Trifari, V.; De Marco, A. Design and Optimization of a Large Turboprop Aircraft. Aerospace 2021, 8, 132. [Google Scholar] [CrossRef]
- Torenbeek, E. Synthesis of Subsonic Airplane Design; Delft University Press: Delft, The Netherlands, 1976; ISBN 978-94-017-3202-4. Available online: http://resolver.tudelft.nl/uuid:229f2817-9be9-49b6-959a-d653b5bac054 (accessed on 11 May 2021).
- Airport Planning Publication. Tech. Rep. BD500-3AB48-32000-00 Issue 13. Available online: https://perma.cc/PKT3-K4QP (accessed on 13 May 2021).
- Type-Certificate Data Sheet for BD-500 (A220 Series). In Tech. Rep. EASA.IM.A.570; European Aviation Safety Agency (EASA): Cologne, Germany, 2019; Available online: https://perma.cc/2TUL-KALL (accessed on 13 May 2021).
- Type-Certificate Data Sheet for PW1500G Series Engines. In Tech. Rep. EASA.IM.A.090; European Aviation Safety Agency (EASA): Cologne, Germany, 2018; Available online: https://perma.cc/L243-JHZU (accessed on 13 May 2021).
- BOMBARDIER BD-500 CSeries CS300. Available online: https://perma.cc/J26A-U69U (accessed on 13 May 2021).
- Nuic, A.; Poles, D.; Mouillet, V. BADA: An advanced aircraft performance model for present and future ATM systems. Int. J. Adapt. Control Signal Process. 2010, 24, 850–866. [Google Scholar] [CrossRef]
- Jet Fuel Price Monitor. Available online: https://perma.cc/S3KC-WNV4 (accessed on 13 May 2021).
- Airbus 2018 Price List Press Release. Available online: https://perma.cc/6HNA-XCCQ (accessed on 13 May 2021).
- JetBlue Picks Pratt Over CFM for Engines Valued at $1.03 Billion. Available online: https://perma.cc/AL3M-Z8EJ (accessed on 13 May 2021).
- Memmolo, V. Structural Health Monitoring of Complex Structures Based on Propagation and Scattering of Guided Ultrasonic Waves in Composite Media. Ph.D. Thesis, University of Naples Federico II, Naples, Italy, 2018. Available online: http://www.fedoa.unina.it/id/eprint/12174 (accessed on 13 May 2021).
- Association of European Airlines. Long Range Aircraft AEA Requirements; (G(T)5655); AEA: Brussels, Belgium, 1989. [Google Scholar]


| Symbol | Explanation |
|---|---|
| DP | Depreciation Period (years) |
| TI | Total Investment |
| RV | Residual Value |
| DOCdep | DOC of depreciation per year |
| Symbol | Explanation |
|---|---|
| TI | Total Investment |
| ri | Annual rate |
| DOCint | DOC of interest per year |
| Symbol | Explanation |
|---|---|
| ADP | Aircraft Delivery Price |
| ra | Annual rate |
| DOCins | DOC of insurance per year |
| Symbol | Explanation |
|---|---|
| Pfuel | Fuel Price |
| mf | Fuel Mass |
| DOCfuel | DOC fuel |
| Symbol | Explanation |
|---|---|
| Kldg | Unit rate (US$/t) equal to 7.8 for short-medium range and to 6 for long range |
| MTOW | Maximum Take-Off Weight |
| DOCldg | DOC landing |
| Symbol | Explanation |
|---|---|
| Knav | Unit rate (US$/km∗) equal to 0.5 for short-medium range and to 0.17 for long range * |
| Distance factor | |
| R | Range (km) |
| DOCnav | DOC related to en-route navigation charge |
| Symbol | Explanation |
|---|---|
| Kgrd | Unit rate (US$/t) equal to 100 for short-medium range and 103 for long range * |
| PL | Payload |
| DOCgrd | DOC related to ground-handling charges |
| Symbol | Explanation |
|---|---|
| Cnoise | Unit noise rate ($) |
| Lapproach | Certified noise level—approach measure point (EPNdB) |
| Lflyover | Certified noise level—approach measure point (EPNdB) |
| Llateral | Certified noise level—lateral measure point (EPNdB) |
| Td | departure airport threshold noise (EPNdB) |
| Ta | arrival airport threshold noise (EPNdB) |
| DOCnoise | DOC related to noise emissions |
| Symbol | Explanation |
|---|---|
| CNOx | Unit rate (US$) for NOx |
| mNOx,LTO | mass of NOx emitted during LTO kg |
| DOCNOx | DOC related to NOx emissions |
| Symbol | Explanation |
|---|---|
| LR | Labour Rate |
| ncm | Number of crew member |
| Symbol | Explanation |
|---|---|
| U | Utilization (h/day) |
| FH | Flight hour |
| FC | Flight cycle |
| Aircraft average age (years) | |
| Age of type of aircraft (months) | |
| Number of engines | |
| Thrust (lbf) | |
| DOC related to Line maintenance | |
| DOC related to Base maintenance | |
| DOC related to Engine overhaul | |
| DOC related to Burden | |
| DOC related to total direct maintenance |
| TLAR | |
|---|---|
| Accommodation (Typical-Full Economy) | 135 |
| Design range (typical) | 3100 NM |
| Take-Off Field Length (Max Take-Off Weight, ISA conditions, Sea Level) | 1890 m |
| Landing Field Length (Max Take-Off Weight, ISA conditions, Sea Level) | 1509 m |
| Cruise Mach number (typical) | 0.78–0.80 |
| Cruise altitude (typical) | 37,000 ft |
| Max cruise Mach number at 37,000 ft | 0.82 |
| Max operating altitude | 41,000 ft |
| Alternate cruise range (assumed by authors) | 200 NM |
| Alternate cruise altitude (assumed by authors) | 20,000 ft |
| Holding duration (assumed by authors) | 30 min |
| Holding altitude (assumed by authors) | 1500 ft/min |
| Residual fuel reserve (assumed by authors) | 5% |
| Geometrical and Operational Data | |
| Wing area | 112.3 m2 |
| Wingspan | 35.1 m |
| Wing aspect ratio | 10.97 |
| Fuselage length | 38.71 m |
| Fuselage diameter | 3.7 m |
| Single engine static thrust | 24,400 lbf |
| Engine by-pass ratio | 12:1 |
| Max Take-Off Weight | 67,585 kg |
| Max Landing Weight | 58,740 kg |
| Max Zero-Fuel Weight | 55,792 kg |
| Operating Empty Weight | 37,081 kg |
| Max Payload | 18,711 kg |
| Max Fuel Mass | 17,726 kg |
| BADA averaged climb speed (CAS) | 271 kt |
| BADA averaged rate of climb | 1642 ft/min |
| BADA maximum rate of climb | 2862 ft/min |
| BADA averaged descent speed (CAS) | 218 kt |
| BADA averaged rate of descent | 2186 ft/min |
| BADA maximum rate of descent | 3700 ft/min |
| Parameters | JPAD | A220-300 | Difference (%) |
|---|---|---|---|
| Max Take-Off Weight (kg) | 66,956 | 67,585 | −0.93% |
| Max Landing Weight (kg) | 56,875 | 58,740 | −3.18% |
| Max fuel Mass (kg) | 17,553 | 17,726 | −0.98% |
| Max Zero-Fuel Weight (kg) | 53,951 | 55,792 | −3.30% |
| Operating Empty Weight (kg) | 36,916 | 37,081 | −0.45% |
| Take-Off Field Length (m) | 1837 | 1890 | −2.78% |
| Landing Field Length (m) | 1509 | 1509 | 0.00% |
| Life span | 16 | years |
| Residual value | 10% | |
| No. seats | 135 | |
| Aircraft price | 101.8 | US$ million |
| Engine price (each) | 12 | US$ million |
| Spares | 14.9 | US$ million |
| Interest | 5.4% | per year |
| Insurance | 0.5% | per year |
| No. of flights | 558 | |
| Utilization | 3750 | h/year |
| Block Time | 6.72 | h |
| Block Fuel (mission) | 14,402 | kg |
| Age of type of aircraft | 24 | months |
| Average age | 1 | years |
| Fleet size | 30 | |
| Fuel Price | 1.4 | US$/gal |
| Performance 16 Years | ||
|---|---|---|
| Range | 3100 NM | |
| Mach cruise | ~0.80 | |
| SFC (Specific Fuel Consumption at cruise) | 0.532 | lb/(lb ∗ h) |
| T0 (thrust) | 24,400 | lb |
| Weights | ||
| MTOW | 66,956 | kg |
| OEW | 36,916 | kg |
| PAYLOAD | 14,648 | kg |
| FUEL (mission) | 15,393 | kg |
| Density (nr./m2) | Sensors Weight (kg) | OEW (kg) | MTOW (kg) | Fuselage Weight (kg) | Wing Weight (kg) | H-Tail Weight (kg) | V-Tail Weight (kg) |
|---|---|---|---|---|---|---|---|
| 0 | 0 | 36,916 | 66,956 | 7101 | 6880 | 812 | 653 |
| 15 | 880 | 38,134 (+3%) | 68,388 (+2%) | 7580 (+7%) | 7265 (+6%) | 880 (+8%) | 710 (+9%) |
| 20 | 1173 | 38,540 (+4%) | 68,866 (+3%) | 7740 (+9%) | 7393 (+7%) | 903 (+11%) | 728 (+11%) |
| 25 | 1466 | 38,930 (+5%) | 69,257 (+3%) | 7899 (+11%) | 7519 (+9%) | 926 (+14%) | 747 (+14%) |
| 30 | 1759 | 39,333 (+7%) | 69,717 (+4%) | 8059 (+13%) | 7647 (+11%) | 949 (+17%) | 766 (+17%) |
| 35 | 2053 | 39,738 (+8%) | 70,191 (+5%) | 8218 (+16%) | 7775 (+13%) | 972 (+20%) | 784 (+20%) |
| 40 | 2346 | 40,144 (+9%) | 70,669 (+6%) | 8378 (+18%) | 7902 (+15%) | 995 (+23%) | 803 (+23%) |
| 45 | 2639 | 40,576 (+10%) | 71,300 (+6%) | 8537 (+20%) | 8032 (+17%) | 1018 (+25%) | 822 (+26%) |
| 50 | 2932 | 40,986 (+11%) | 71,807 (+7%) | 8697 (+22%) | 8160 (+19%) | 1040 (+28%) | 841 (+29%) |
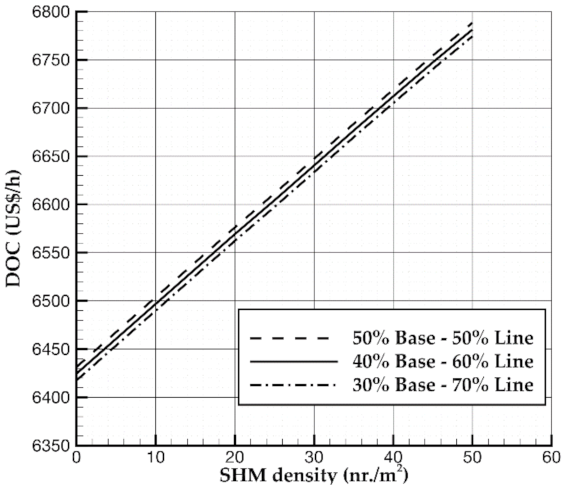
| Density (nr./m2) | DOC (US$/h) | TO Field Length (m) | Time to Climb (min) | M Cruise | Landing Distance (m) | Block Fuel (kg) | Block Time (min) |
|---|---|---|---|---|---|---|---|
| 0 | 6675.2 | 1837 | 17.38 | 0.80 | 1509 | 13,706 | 401 |
| 15 | 6540.0 (−2.03%) | 1912 (+4%) | 18.22 (+5%) | 0.79 (−1%) | 1516 (+1%) | 13,897 (+1%) | 400 (+0.1%) |
| 20 | 6576.2 (−1.48%) | 1938 (+5%) | 18.51 (+7%) | 0.79 (−1%) | 1518 (+1%) | 13,961 (+2%) | 400 (+0.1%) |
| 25 | 6611.3 (−0.96%) | 1958 (+7%) | 18.76 (+8%) | 0.79 (−1%) | 1519 (+1%) | 14,011 (+2%) | 400 (+0.1%) |
| 30 | 6647.3 (−0.42%) | 1983 (+8%) | 19.06 (+10%) | 0.78 (−2%) | 1521 (+1%) | 14,073 (+3%) | 400 (+0.2%) |
| 35 | 6683.6 (+0.12%) | 2009 (+9%) | 19.37 (+11%) | 0.78 (−2%) | 1523 (+1%) | 14,137 (+3%) | 400 (+0.2%) |
| 40 | 6719.1 (+0.66%) | 2035 (+11%) | 19.70 (+13%) | 0.78 (−2%) | 1526 (+1%) | 14,207 (+4%) | 400 (+0.1%) |
| 45 | 6754.4 (+1.19%) | 2070 (+13%) | 20.14 (+16%) | 0.77 (−3%) | 1531 (+1%) | 14,315 (+4%) | 402 (+0.3%) |
| 50 | 6788.4 (+1.70%) | 2099 (+14%) | 20.51 (+18%) | 0.77 (−3%) | 1534 (+2%) | 14,402 (+5%) | 403 (+0.7%) |
| Component | Density (nr./m2) | Estimated Costs (€) | Weight (kg) |
|---|---|---|---|
| Fuselage | 50 | 4,476,163 | 1596 |
| Wing | 50 | 2,582,084 | 921 |
| Horizontal tail | 50 | 641,506 | 229 |
| Vertical tail | 50 | 524,632 | 187 |
Publisher’s Note: MDPI stays neutral with regard to jurisdictional claims in published maps and institutional affiliations. |
© 2021 by the authors. Licensee MDPI, Basel, Switzerland. This article is an open access article distributed under the terms and conditions of the Creative Commons Attribution (CC BY) license (https://creativecommons.org/licenses/by/4.0/).
Share and Cite
Cusati, V.; Corcione, S.; Memmolo, V. Impact of Structural Health Monitoring on Aircraft Operating Costs by Multidisciplinary Analysis. Sensors 2021, 21, 6938. https://doi.org/10.3390/s21206938
Cusati V, Corcione S, Memmolo V. Impact of Structural Health Monitoring on Aircraft Operating Costs by Multidisciplinary Analysis. Sensors. 2021; 21(20):6938. https://doi.org/10.3390/s21206938
Chicago/Turabian StyleCusati, Vincenzo, Salvatore Corcione, and Vittorio Memmolo. 2021. "Impact of Structural Health Monitoring on Aircraft Operating Costs by Multidisciplinary Analysis" Sensors 21, no. 20: 6938. https://doi.org/10.3390/s21206938