
Wearable Devices for Environmental Monitoring in the Built Environment: A Systematic Review


Abstract
:1. Introduction
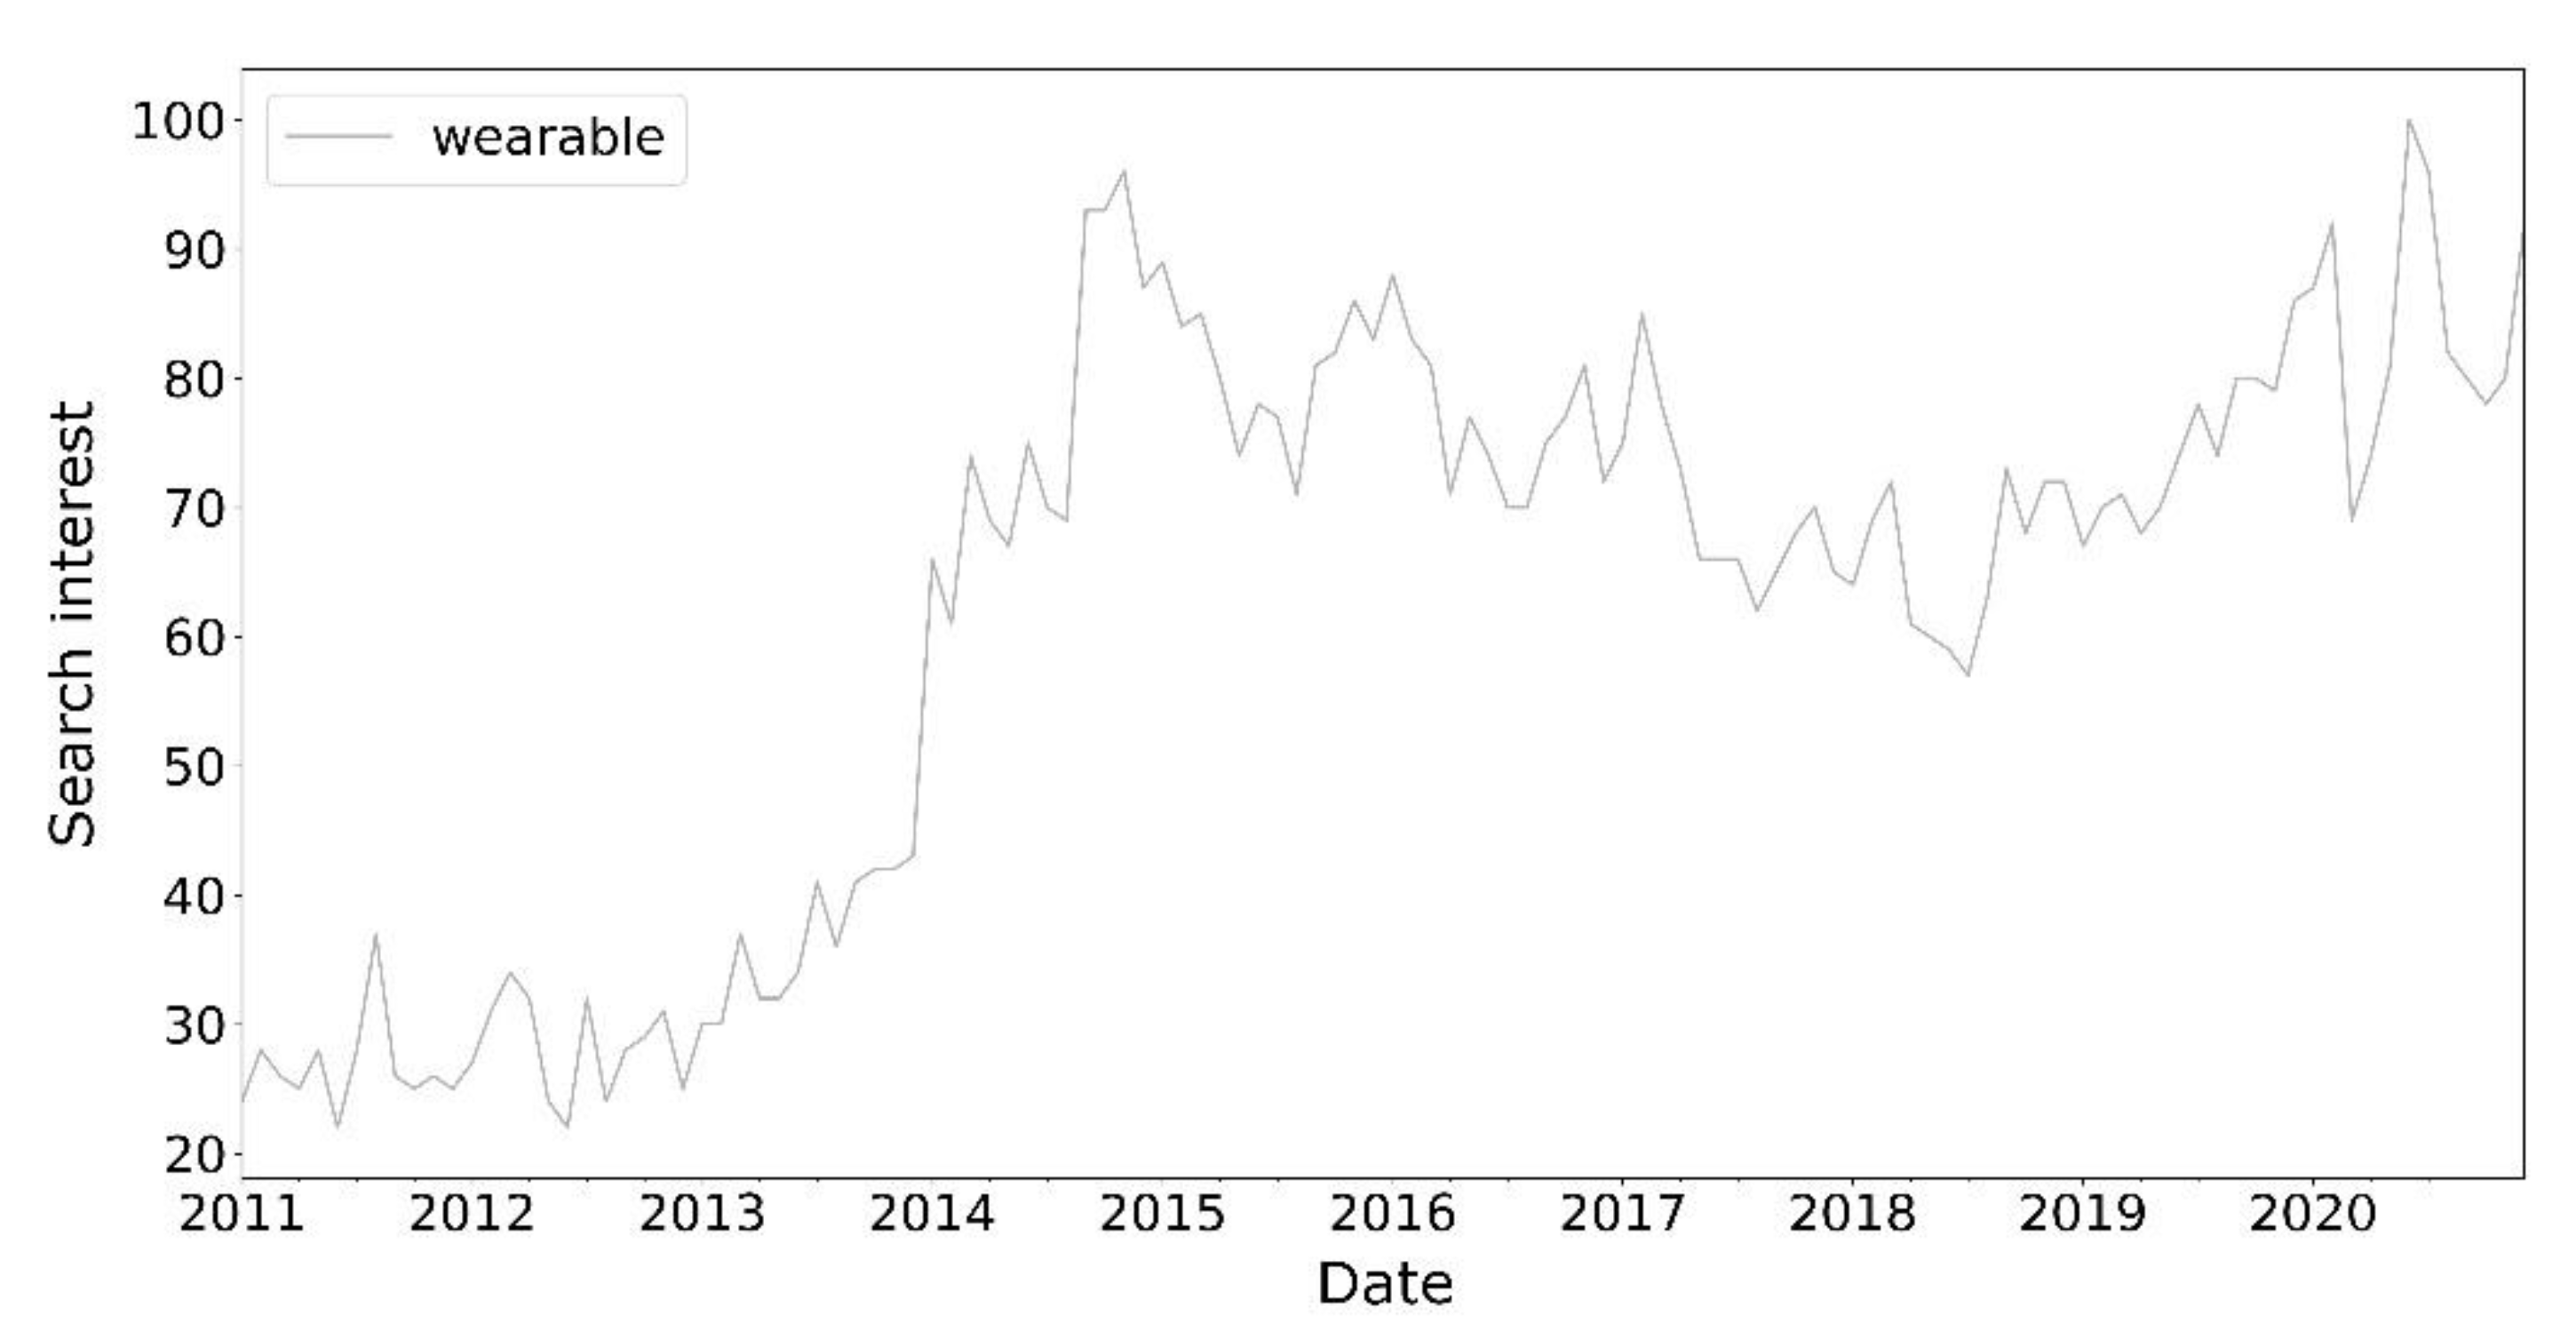
1.1. Introduction to Wearables
1.2. Environmental Factors to Be Monitored
2. Methodology
- The TITLE-ABS-KEY field code (in black) was considered so that only documents in which the selected words appear in the titles, in the abstracts, and in the keywords could be extracted and collected. In particular, the KEY field refers to a combined search that considers, among the other things, the keywords (AUTHKEY) assigned to the document by the author and the controlled vocabulary terms (INDEXTERMS) assigned to the document. Researchers sometimes pay limited attention to the definition of the AUTHKEY, even though keywords play an important role in communicating scientific results [48]. While the INDEXTERMS are added by a team of professional indexers at Scopus, based on different vocabularies [49]. In both cases, when the research area is new or changing rapidly, it is possible to highlight a highly clustered set of new keywords [50].
- The first set of keywords (in red) was related to the overall topic of wearables, also considering the synonymous acronym PEMS (Personal Environmental Monitoring Systems) or WEMS (Wearable Environmental Monitoring Systems). The operator OR joins the three words such that at least one of the considered terms is included. This Section 2 is the same for all queries that refer to all four EFs.
- The second set of words (in blue) was connected to the first set of keywords with the operator AND. Section three of the query is characterised by a set of targeted keywords representing each of the four EFs. In particular, Section 3a specifies physical quantities, Section 3b specifies instruments, and Section 3c specifies domains for each EF.
- Two additional keywords, “environmental” and “monitoring” (in green), were linked to the previous sections with the operator AND. These two terms are separated by the proximity factor “w/3” indicating that they should be within three words of each other without considering the order, thus capturing the simplest form “environmental monitoring” but also more constructed forms such as “monitoring of the environmental (conditions, impacts, etc.)” or “environmental analysis and monitoring”, etc.
- The “AND NOT” operator (in orange) was used to exclude documents that contain the term specified in the search: “proton exchange membrane” or “fuel cell”, since the acronym PEMS in Section 2 can be misleading because it can refer to a portable environmental monitoring system but also to “proton exchange membranes”, which is often associated with “fuel cell” (the related correct acronym is PEMs with lowercase “s”, but Scopus’ search engine takes into account lemmatisation, that is the process of grouping the inflected forms of a term).
- The operator OR, associated with the acronym EID, which stands for “Electronic IDentifier” and is a unique alphanumeric string created to identify a record in Scopus, was used to add some other documents, not already considered and derived mainly from the biography screening of both other literature reviews [18,19,20,21,22,23] and the extracted papers derived from Scopus searches with query consisting of Sections 1–5 and 8 of the overall query structure here presented (Figure 2).
- The operator AND NOT associated with EID was used to exclude some other documents that do not match the research purpose. In particular, Section 7a refers to paper excluded through the screening process performed considering the title and the abstract, while Section 7b refers to manuscripts that were not considered after full-article assessment.
- The last part of the query (in grey) was used to exclude certain types of documents. In this sense, “cr” stands for “conference review”.
3. Systematic Review
3.1. Monitoring of Visual EF with Wearables
3.2. Monitoring of Acoustic EF with Wearables
3.3. Monitoring of Thermal EF with Wearables
3.4. Monitoring of Air Quality EF with Wearables
4. Discussion and Conclusions
Author Contributions
Funding
Institutional Review Board Statement
Informed Consent Statement
Data Availability Statement
Conflicts of Interest
Appendix A
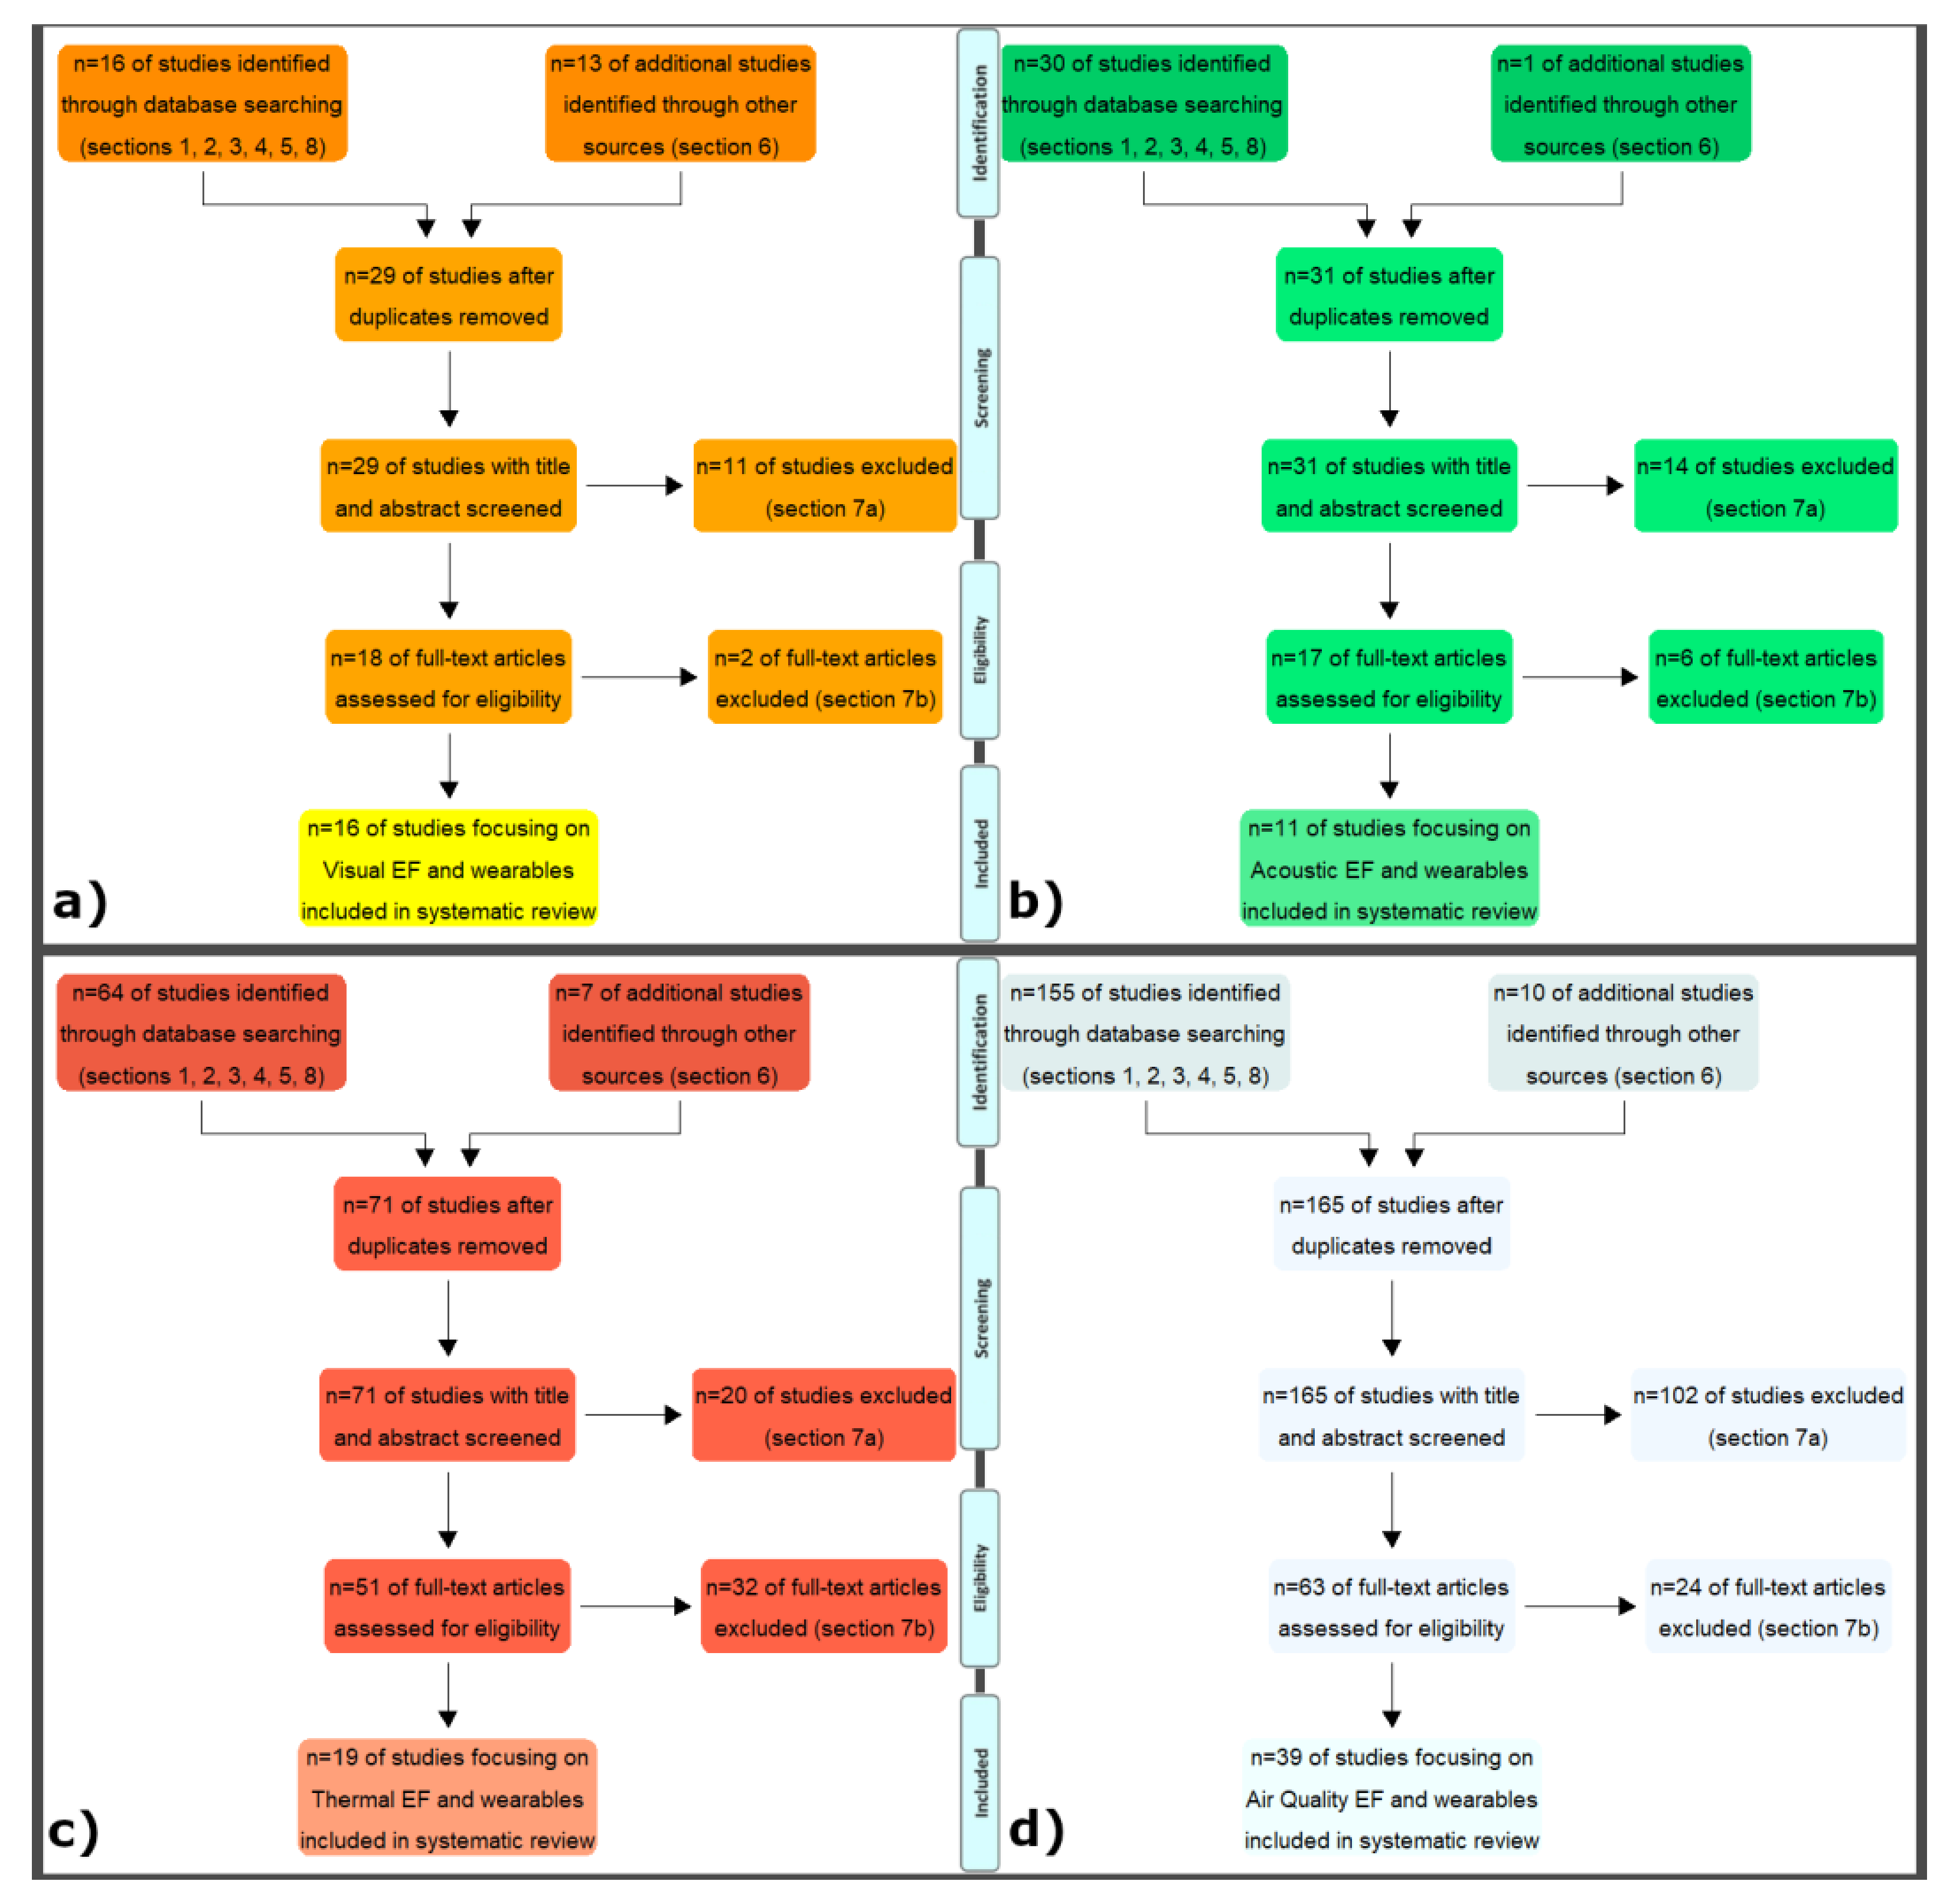
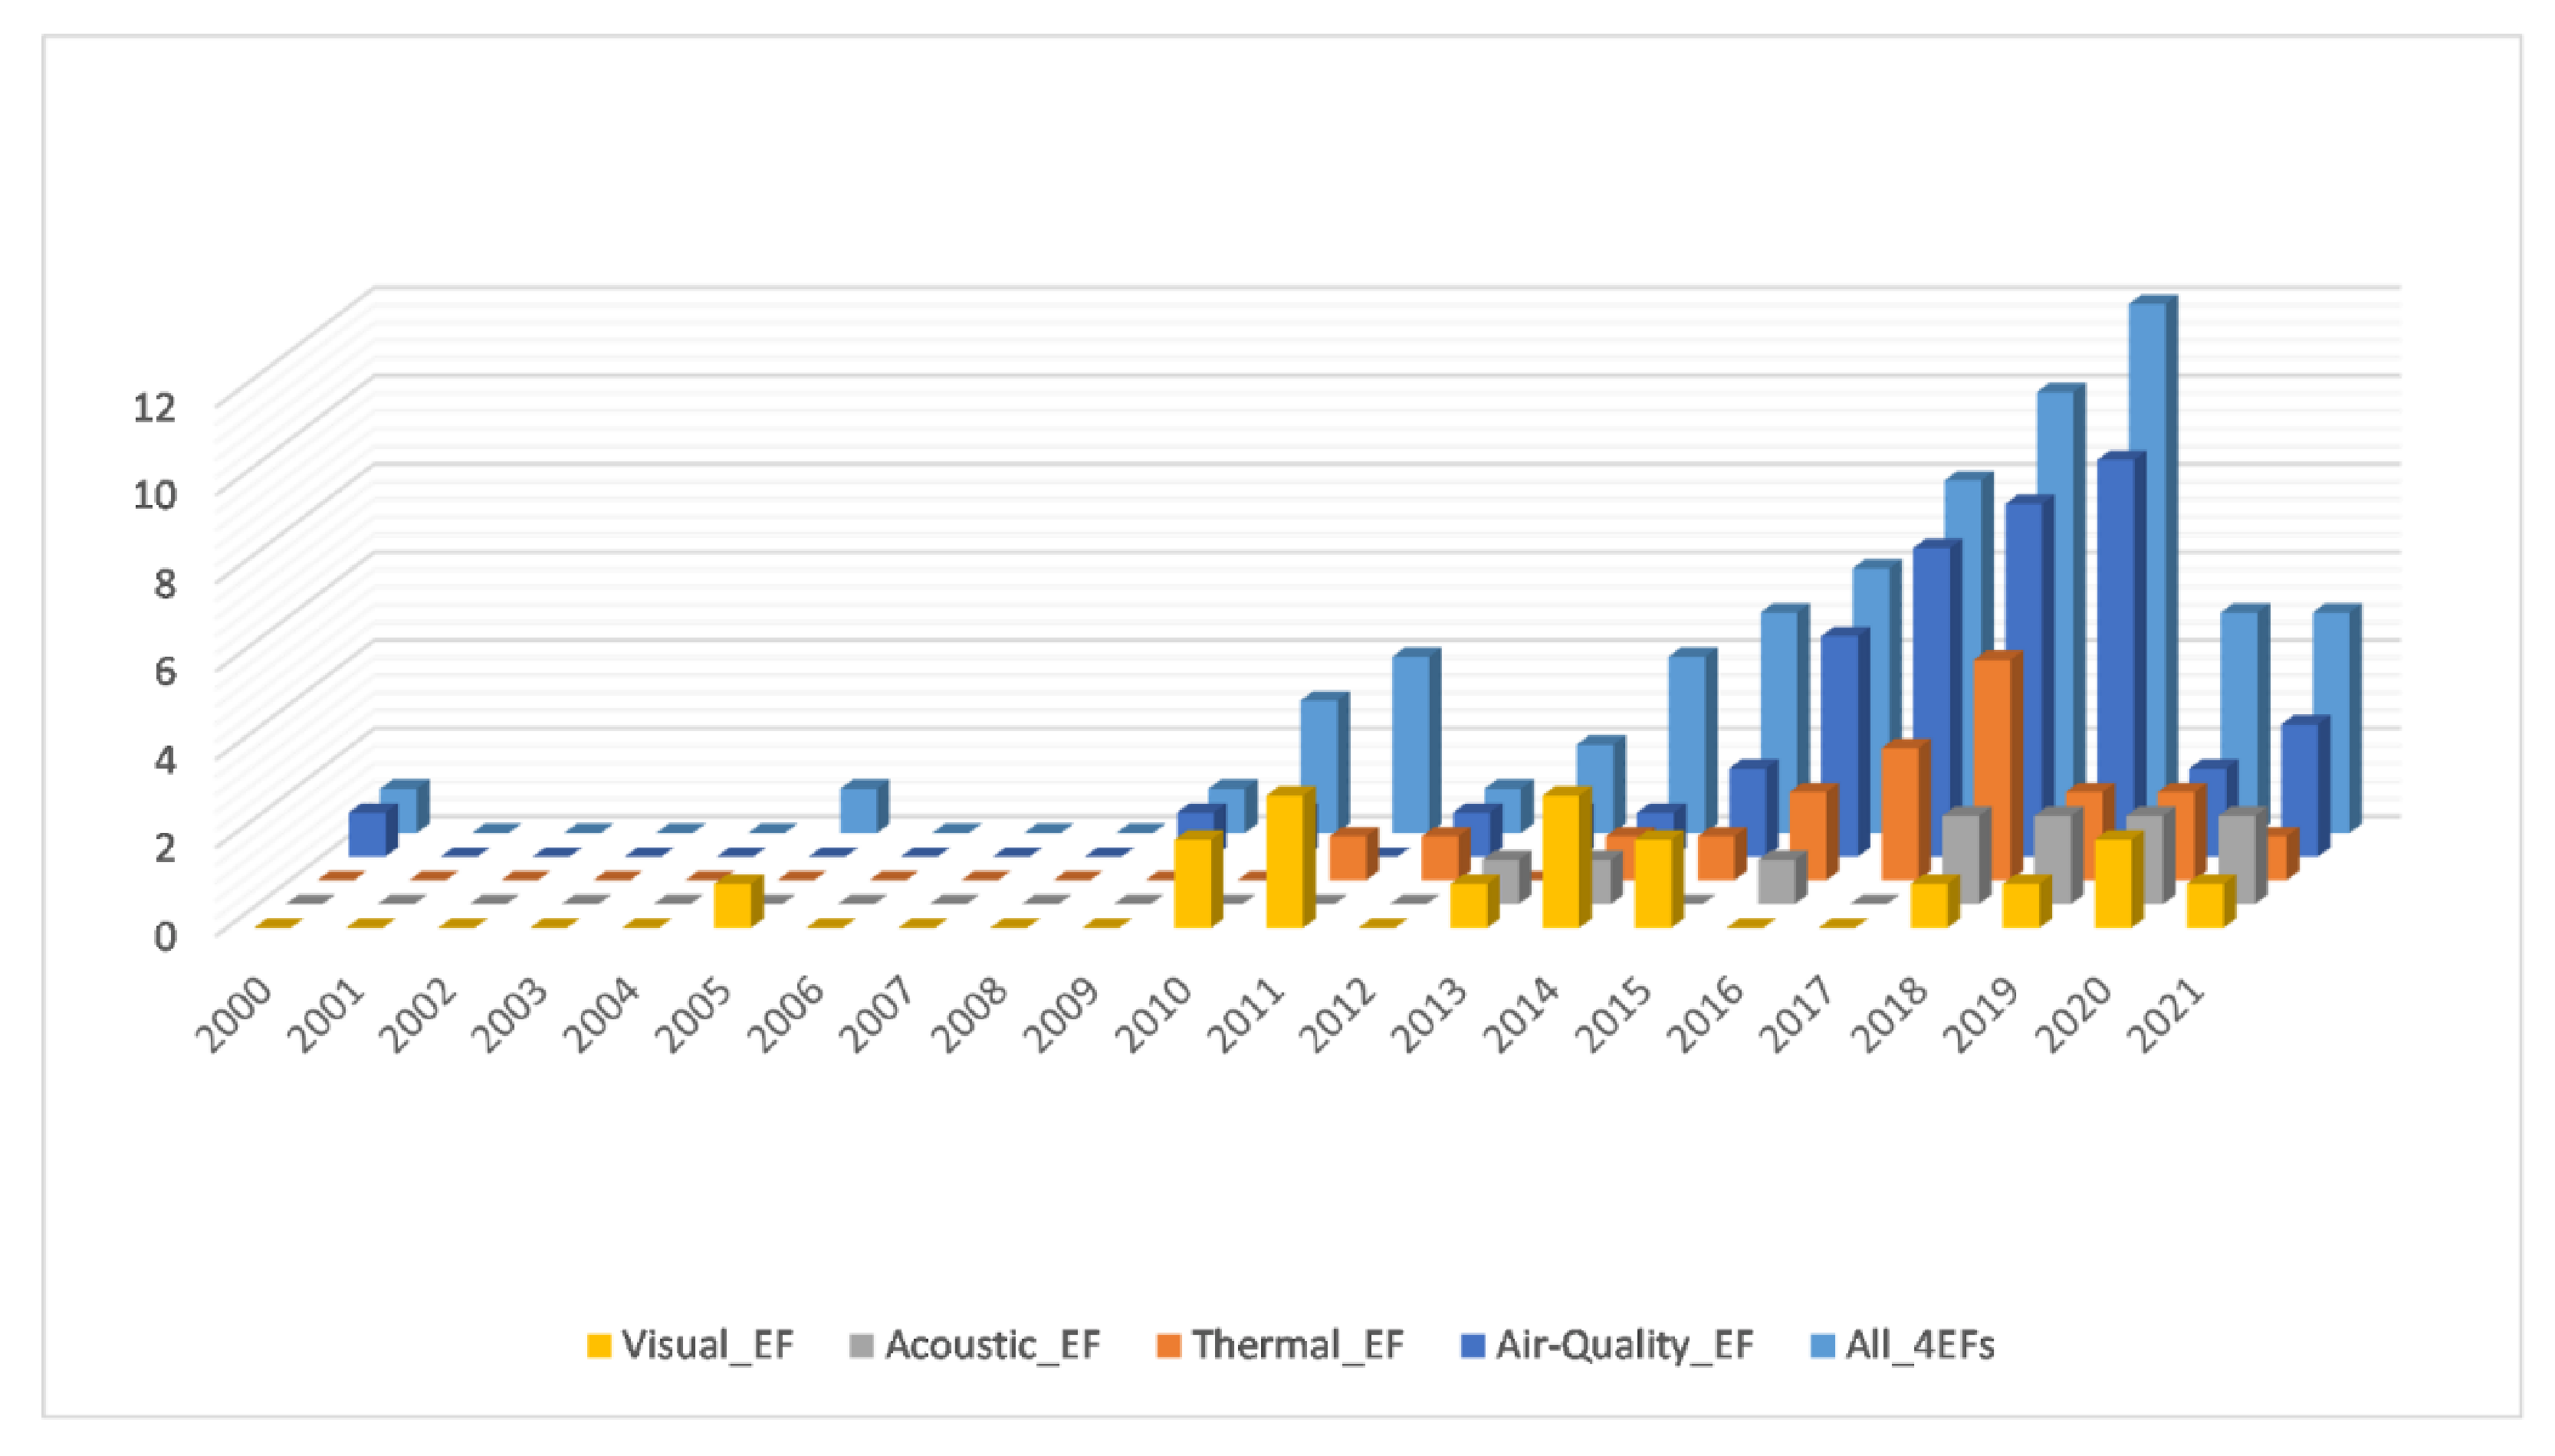
- Visual (16 resulting papers from 2005 to 2021): TITLE-ABS-KEY ((wearable OR pems OR wems) AND (daylight OR “color temperature” OR lighting OR luminance OR glare OR “dosimeter” OR “lux meter” OR “light meter” OR “color meter” OR colorimeter OR “luminance meter” OR photometry OR visual) AND (environmental W/3 monitoring) AND NOT (“proton exchange membrane” OR “fuel cell”)) OR EID (2-s2.0-27344452309 OR 2-s2.0-77956754851 OR 2-s2.0-85042561689 OR 2-s2.0-79957588325 OR 2-s2.0-84879967631 OR 2-s2.0-77953632392 OR 2-s2.0-81255124342 OR 2-s2.0-79952959932 OR 2-s2.0-84928173018 OR 2-s2.0-84960113897 OR 2-s2.0-84918811426 OR 2-s2.0-84907667703 OR 2-s2.0-85096669247) AND NOT EID ((2-s2.0-41849089305 OR 2-s2.0-85047120790 OR 2-s2.0-85052730774 OR 2-s2.0-84933505542 OR 2-s2.0-85044290759 OR 2-s2.0-84885042666 OR 2-s2.0-84952011313 OR 2-s2.0-85066239722 OR 2-s2.0-85087571429 OR 2-s2.0-85067399950 OR 2-s2.0-84855470006) OR (2-s2.0-85030837996 OR 2-s2.0-85086035889)) AND (EXCLUDE (DOCTYPE, “cr”))
- Acoustic (11 resulting papers from 2013 to 2021): TITLE-ABS-KEY ((wearable OR pems OR wems) AND (“sound pressure” OR “noise” OR soundscape OR loudness OR “sound level meter” OR sound OR acoustic) AND (environmental W/3 monitoring) AND NOT (“proton exchange membrane” OR “fuel cell”)) OR EID (2-s2.0-85101714199) AND NOT EID ((2-s2.0-84055184752 OR 2-s2.0-85074627122 OR 2-s2.0-85038856331 OR 2-s2.0-85102682462 OR 2-s2.0-37549066979 OR 2-s2.0-84885042666 OR 2-s2.0-84929223038 OR 2-s2.0-85045751469 OR 2-s2.0-84991109042 OR 2-s2.0-85069766055 OR 2-s2.0-85087571429 OR 2-s2.0-85068142712 OR 2-s2.0-85066081213 OR 2-s2.0-85097010457) OR (2-s2.0-85010934316 OR 2-s2.0-84984935795 OR 2-s2.0-84955466350 OR 2-s2.0-85015726258 OR 2-s2.0-85052392384 OR 2-s2.0-85086035889)) AND (EXCLUDE (DOCTYPE, “cr”))
- Thermal (19 resulting papers from 2011 to 2021): TITLE-ABS-KEY ((wearable OR pems OR wems) AND (“air temperature” OR “relative humidity” OR “radiant temperature” OR “air velocity” OR “wind velocity” OR “solar radiation” OR thermometer OR “temperature sensor” OR “humidity sensor” OR “Thermo Hygrometer” OR “Globe-Thermometer” OR “black globe temperature sensor” OR “anemometer” OR pyranometer OR thermal) AND (environmental W/3 monitoring) AND NOT (“proton exchange membrane” OR “fuel cell”)) OR EID (2-s2.0-79960211999 OR 2-s2.0-84991057252 OR 2-s2.0-84990882596 OR 2-s2.0-84864975130 OR 2-s2.0-85012992224 OR 2-s2.0-85025664819 OR 2-s2.0-85041373985) AND NOT EID ((2-s2.0-85044576922 OR 2-s2.0-85102274461 OR 2-s2.0-85087280469 OR 2-s2.0-85042584638 OR 2-s2.0-79959682725 OR 2-s2.0-85101604122 OR 2-s2.0-84962616057 OR 2-s2.0-85067457161 OR 2-s2.0-85009960940 OR 2-s2.0-84891667975 OR 2-s2.0-85050642807 OR 2-s2.0-85021806905 OR 2-s2.0-85054856073 OR 2-s2.0-85100893557 OR 2-s2.0-0032856815 OR 2-s2.0-85099112380 OR 2-s2.0-84984696179 OR 2-s2.0-85089441482 OR 2-s2.0-85079714972 OR 2-s2.0-84959878599 OR 2-s2.0-85101108646 OR 2-s2.0-85103300483 OR 2-s2.0-85103941705 OR 2-s2.0-85096397030 OR 2-s2.0-85084811022 OR 2-s2.0-85086035889) OR (2-s2.0-85090275198 OR 2-s2.0-85079494843 OR 2-s2.0-85090949175 OR 2-s2.0-85058283726 OR 2-s2.0-85053684980 OR 2-s2.0-85053504654 OR 2-s2.0-85055675218 OR 2-s2.0-85034043945 OR 2-s2.0-85029159022 OR 2-s2.0-85027702156 OR 2-s2.0-85014596472 OR 2-s2.0-85037707375 OR 2-s2.0-84994102143 OR 2-s2.0-84974605210 OR 2-s2.0-85100591108 OR 2-s2.0-84934900174 OR 2-s2.0-84943615704 OR 2-s2.0-84896698814 OR 2-s2.0-70349666850 OR 2-s2.0-58149381900 OR 2-s2.0-41849089305 OR 2-s2.0-34347376912 OR 2-s2.0-85077977296 OR 2-s2.0-85076783804 OR 2-s2.0-85072645464 OR 2-s2.0-84991661572)) AND (EXCLUDE (DOCTYPE, “cr”))
- Air Quality (39 resulting papers from 2000 to 2021): TITLE-ABS-KEY ((wearable OR pems OR wems) AND (“CO2” OR “carbon dioxide” OR “VOCs” OR “volatile organic compounds” OR “NOx” OR “nitrogen oxides” OR “SOx” OR “sulphure oxides” OR “PM” OR “particulate matter” OR “concentration sensor” OR “air quality” OR pollution) AND (environmental W/3 monitoring) AND NOT (“proton exchange membrane” OR “fuel cell”)) OR EID (2-s2.0-84991057252 OR 2-s2.0-84990882596 OR 2-s2.0-84864975130 OR 2-s2.0-77950842815 OR 2-s2.0-85012992224 OR 2-s2.0-85019211807 OR 2-s2.0-85025664819 OR 2-s2.0-85032633215 OR 2-s2.0-85041373985 OR 2-s2.0-84978821913) AND NOT EID ((2-s2.0-84891667975 OR 2-s2.0-84991628256 OR 2-s2.0-79951809148 OR 2-s2.0-34548598391 OR 2-s2.0-85084482031 OR 2-s2.0-84865570477 OR 2-s2.0-84934900174 OR 2-s2.0-85103821669 OR 2-s2.0-79952613338 OR 2-s2.0-85059670087 OR 2-s2.0-85092552189 OR 2-s2.0-85045622832 OR 2-s2.0-84860692258 OR 2-s2.0-84930205795 OR 2-s2.0-72849107023 OR 2-s2.0-84942599257 OR 2-s2.0-0042123766 OR 2-s2.0-85083203437 OR 2-s2.0-85021741462 OR 2-s2.0-84880273197 OR 2-s2.0-84868228523 OR 2-s2.0-85017422700 OR 2-s2.0-85045234275 OR 2-s2.0-79960504035 OR 2-s2.0-84991661572 OR 2-s2.0-37549066979 OR 2-s2.0-0033626567 OR 2-s2.0-50849117829 OR 2-s2.0-85064530053 OR 2-s2.0-84958243072 OR 2-s2.0-85084696209 OR 2-s2.0-85097756884 OR 2-s2.0-85028048241 OR 2-s2.0-85053816691 OR 2-s2.0-85034962458 OR 2-s2.0-0035186649 OR 2-s2.0-85042029752 OR 2-s2.0-85060148578 OR 2-s2.0-85075976987 OR 2-s2.0-0032856815 OR 2-s2.0-85021647526 OR 2-s2.0-85100893557 OR 2-s2.0-85073126584 OR 2-s2.0-85092086462 OR 2-s2.0-80054756044 OR 2-s2.0-85085695131 OR 2-s2.0-84984935795 OR 2-s2.0-85044659217 OR 2-s2.0-85009268800 OR 2-s2.0-26244441016 OR 2-s2.0-84955466350 OR 2-s2.0-84978821913 OR 2-s2.0-85091572416 OR 2-s2.0-85066239722 OR 2-s2.0-85094163061 OR 2-s2.0-84890910781 OR 2-s2.0-0029825012 OR 2-s2.0-85015715897 OR 2-s2.0-34347229727 OR 2-s2.0-85098538986 OR 2-s2.0-85010934316 OR 2-s2.0-0034164368 OR 2-s2.0-85084811022 OR 2-s2.0-85084471284 OR 2-s2.0-84994174400 OR 2-s2.0-77956922071 OR 2-s2.0-0033179964 OR 2-s2.0-20444468078 OR 2-s2.0-70449564549 OR 2-s2.0-84900342694 OR 2-s2.0-24344499484 OR 2-s2.0-84953404270 OR 2-s2.0-84898682763 OR 2-s2.0-85077723989 OR 2-s2.0-85098056476 OR 2-s2.0-84870825370 OR 2-s2.0-0033207046 OR 2-s2.0-85090275198 OR 2-s2.0-85086135361 OR 2-s2.0-84885225815 OR 2-s2.0-85049913644 OR 2-s2.0-85064598441 OR 2-s2.0-85050642807 OR 2-s2.0-85054856073 OR 2-s2.0-85041278840 OR 2-s2.0-84991109042 OR 2-s2.0-84964470801 OR 2-s2.0-85061341557 OR 2-s2.0-79951790941 OR 2-s2.0-85101690645 OR 2-s2.0-0032261477 OR 2-s2.0-85015726258 OR 2-s2.0-85039737118 OR 2-s2.0-43049149412 OR 2-s2.0-84922212195 OR 2-s2.0-77954398091 OR 2-s2.0-84994102143 OR 2-s2.0-84864283881 OR 2-s2.0-84947241573 OR 2-s2.0-85089441482 OR 2-s2.0-85064164959 OR 2-s2.0-85053439823) OR (2-s2.0-85076971711 OR 2-s2.0-85075795237 OR 2-s2.0-85071043860 OR 2-s2.0-85086035889 OR 2-s2.0-85074049696 OR 2-s2.0-78650619960 OR 2-s2.0-0034849917 OR 2-s2.0-0036306120 OR 2-s2.0-0025717462 OR 2-s2.0-85077977296 OR 2-s2.0-85077051133 OR 2-s2.0-34250637151 OR 2-s2.0-85042542326 OR 2-s2.0-85013042267 OR 2-s2.0-84994468982 OR 2-s2.0-84883570280 OR 2-s2.0-85076783804 OR 2-s2.0-85089002492 OR 2-s2.0-85052392384 OR 2-s2.0-85096397030 OR 2-s2.0-85058283726 OR 2-s2.0-85046162925 OR 2-s2.0-85104610177 OR 2-s2.0-85052751178)) AND (EXCLUDE (DOCTYPE, “cr”))
Appendix B

| Reference Number of the Research Study | Visual Physical Variables Monitored (in Brackets the Name of the Used Wearable, if Available) | Other Factors Monitored (in Brackets the Name of Used Wearable if Available) | Indoor/Outdoor and Field of Application | Practical Implication | Limitation of the Considered Wearable |
|---|---|---|---|---|---|
| [68] | Lighting [lx] | Thermal, Air quality | Outdoor. Wearable used to study pedestrians’ exposure to urban environmental conditions | A miniaturized microclimate station, specifically tailored to be worn while walking or biking | |
| [60] | Circadian stimulus (Daysimeter) | Indoor. Office sites | CS 0.3 during daytime hours is associated with an acute alerting effect on office workers | ||
| [61] | Personal light exposures: illuminance, circadian light (CLA), and circadian stimulus (CS) levels (Daysimeter) | Interdaily Stability (IS) and Intradaily Variability (IV) | Indoor. Household environment | The lighting intervention significantly increased circadian entrainment and significantly reduced symptoms of depression in the participants with ADRD | |
| [62] | Personal light exposures: illuminance, circadian light (CLA), and circadian stimulus (CS) levels (Daysimeter) | Biometric monitoring (Actigraph) | Indoor. Household environment | Flashing blue light delivered through closed eyelids during sleep can change the circadian phase, thus allowing to promote sleep health in those suffering from circadian sleep disorders. | |
| [58] | Personal light exposures: illuminance, circadian light (CLA), and circadian stimulus (CS) levels (Daysimeter) | Rest/activity monitoring with three orthogonally oriented, solid-state accelerometers (Daysimeter) | Indoor. Household environment | Circadian phase changes resulting from a light intervention are consistent with those predicted by previously published Phase Response Curves [132] | |
| [63] | Personal light exposures: illuminance, circadian light (CLA), and circadian stimulus (CS) levels (Daysimeter) | Indoor. | A lighting intervention, tailored to increase daytime circadian stimulation, can be used to increase sleep quality and improve behavior in patients with ADRD | ||
| [59] | Personal light exposures: illuminance, circadian light (CLA), and circadian stimulus (CS) levels (Daysimeter) | Indoor/Outdoor | |||
| [64] | Photopic illuminance in lux from 400 to 900 nm (Philips Actiwatch-L) and photopic illuminance in lux from 400 to 700 nm (Daysimeter) | Indoor. Hospital | Study describes the difference between light levels measured at the wrist (Actiwatch-L) | ||
| [65] | Personal circadian and photopic light exposures (Daysimeter) | Acceleration and temperature data (Daysimeter) | Indoor. School | Not significant difference between two groups, one of which was wearing orange glasses | |
| [66] | Photopic illuminance in lux from 400 to 900 nm (Philips Actiwatch-L) and photopic illuminance in lux from 400 to 700 nm (Daysimeter) | Indoor. Hospital (day-shift nurse) | |||
| [57] | Photopic illuminance in lux from 400 to 900 nm (Philips Actiwatch-L) and photopic illuminance in lux from 400 to 700 nm (Daysimeter) | Indoor. Hospital | These measurement and analysis techniques may provide important insights into the relationship between circadian disruption and well-being. | ||
| [67] | Personal light exposures (illuminance, circadian light (CLA), and circadian stimulus (CS) levels) (Daysimeter) | Biometric monitoring (Actigraph) | Indoor. Home | This case study provides beginning support for the use of the daysimeter in the home | |
| [55] | Personal light exposures (illuminance, circadian light (CLA), and circadian stimulus (CS) levels) (Daysimeter) | Indoor. Laboratory and Home | A system of measurement of optical radiation for the circadian system is essential in many applications concerning human wellbeing | ||
| [69] | Ambient light color balance (Eco-Mini) | Ozone, Sulfur Dioxide, Volatile Organic Compounds, humidity, temperature, and sound level, 3-axis accelerometer and GPS location (Eco-Mini) | Indoor/Outdoor | The presented wearable environmental monitoring, called “Eco-Mini”, overcomes pratical challenges (calibration, reproducibility, form factor, and battery life) and can be used in clinical studies. | |
| [70] | UV light and IR radiation | Indoor/Outdoor | The fibers and their textiles showed stable practical performance and outstanding sensitivity to UV/IR radiation to achieve energy-free, real-time visual monitoring of the IR radiation temperature, and UV index. | ||
| [71] | UV Light, light intensity [lx], color temperature [K], and color components | Indoor/Outdoor | Practical value within disciplines such as environmental and health psychology, which seek to relate psychological outcomes to environmental exposure. Completely open-source allowing replicability. |
| Reference Number of the Research Study | Acoustic Physical Variables Monitored (in Brackets the Name of Used Wearable, if Available) | Other Factors Monitored (in Brackets the Name of Used Wearable, if Available) | Indoor/Outdoor and Field of Application | Practical Implication | Limitation of the Considered Wearable |
|---|---|---|---|---|---|
| [72] | Sound pressure level [db] (MLMS-EMGN-4.0) | Thermal: air humidity, temperature. Air quality: CO and NO2. Air pressure | Indoor. Laboratory | This device measures several physical and chemical environmental parameters, which are known to be hazardous. | |
| [76] | Noise exposure (NEATVIBEwear) | Air quality: ultrafine particles (UFP, <100 nm diameter) | Indoor. Transit, home, school | Personal measurements of UFP (ultrafine particle) and noise will enable researchers to investigate the independent and/or joint-effects of these health-relevant environmental exposures. | NEATVIBEwear, in its current release, does not allow for 1/3-octave band or spectral measurements of traffic noise. |
| [73] | Sound pressure level [db] | Thermal: air humidity, temperature. Air quality: CO and NO2. Air pressure. Motion activity (9 Degree of Freedom(DoF)) motion tracking by accelerometer (KX122-1037), gyroscope (KXG03-1034) and magnetometer (KMX62-1031). | Indoor/Outdoor | This device measures several physical and chemical environmental parameters, which are known to be hazardous. The wearable solution may overcome the issue of stationary climate sites, which are rare in cities due to their size, cost, and maintenance. | |
| [74] | Sound pressure level [db] | Thermal: air humidity, temperature. Air quality: CO and NO2. Air pressure. Motion activity (9 Degree of Freedom(DoF)) motion tracking by accelerometer r (KX122-1037), gyroscope (KXG03-1034) and magnetometer (KMX62-1031). | Indoor/Outdoor | This device is measuring several physical and chemical environmental parameters, which are known to be hazardous. The wearable solution may overcome the issue of stationary climate sites, which are rare in cities due to their size, cost, and maintenance. | |
| [77] | Smartphone with NoiseSpy application | Heart Rate Variability (Empatica E4) | Outdoor | The study shows the preliminary results of user study with early data analysis results, suggesting a noticeable relationship between noise and heart variability. | |
| [78] | Noise levels (Quest DLX-1) | Biological monitoring in saliva and in urine to evaluate the exposure to styrene | Indoor. Workers employed in molding and in artifacts refining | A significant negative correlation was found between the otoacoustic emission levels and the concentration of the styrene urinary metabolites. Otoacoustic emissions, and particularly distortion products, were able to discriminate the exposed workers from the controls, providing also a rough estimate of the slope of the dose-response relation between otoacoustic levels and styrene exposure | |
| [69] | Sound pressure level (Eco-Mini) | Ozone, Sulfur Dioxide, Volatile Organic Compounds, humidity, temperature, and ambient light color balance, 3-axis accelerometer and GPS location (Eco-Mini) | Indoor/Outdoor | The presented wearable environmental monitoring, called “Eco-Mini”, overcomes practical challenges (calibration, reproducibility, form factor, and battery life) and can be used in clinical studies. | |
| [79] | Noise [db] (LENA-Language Environment Analysis System) | Thermal: air humidity, temperature. Air quality: PM2.5 an PM10. (PLANTOWER PM5003). | Indoor. School, Home. | Preliminary results indicate that it is feasible to gather personal Particulate Matter (PM2.5), language, and noise data, cognitive assessments, and biospecimens from a sample of 3-4-year-old children. | |
| [75] | Sound level [db] | Air quality: NO2, CO. Thermal: air temperature and relative humidity. UV. Biometrics: skin temperature, heart rate. Motion activity (9 Degree of Freedom(DoF)) motion tracking by accelerometer, gyroscope and magnetometer. | Indoor/Outdoor | Wrist-worn devices can integrate parameters from the environmental, behavioral, and physiological domain | |
| [80] | Noise level [db] | Outdoor | The main function of the proposed study is to provide an example of real-time information on the acoustic impact on the city. | This work is currently in progress at this stage of the project so that calibration and adjustment of the final acoustic sensor can be carried out | |
| [81] | Ambient sound level (PONG) | Air quality: VOC and NO2. Visual: UVA and UVB. Thermal: air temperature, relative humidity. Air pressure. (PONG) | Outdoor | The developed device has the potential to serve as a personal pollution monitor. | Further work is required to investigate the accuracy of the data |
| Reference Number of The Research Study | Thermal Physical Variables Monitored (in Brackets the Name of Used Sensor or Wearable, if Available) | Other Factors Monitored (in Brackets the Name of Used Sensor or Wearable, if Available) | Indoor/Outdoor and Field of Application | Practical Implication | Limitation of the Considered Wearable |
|---|---|---|---|---|---|
| [81] | Air temperature [°C], Relative Humidity [%]. (PONG). | Air Quality: VOCS and CO2. Visual: UV. Acoustic: ambient sound levels. Air pressure. (PONG). | Outdoor | The developed device has the potential to serve as a personal pollution monitor. | |
| [82] | Air Temperature [°C], Relative Humidity [%], Wind Direction [°], Wind Speed [m/s] | Air quality: VOCs [kOhm], CO2 [ppm]. Visual: Solar radiation [W/m2]. Air pressure [hPa]. | Outdoor. | The data are representative of intra-urban microclimate conditions at a pedestrian height during a heat wave in a historical hilly town located in central Italy. These data can be used to investigate microclimate variation within the city imputable to urban configuration and architectural layout, human activity, and anthropogenic actions responsible for local overheating, and to compute direct thermal indexes for human comfort evaluation. | |
| [83] | Temperature [°C] | Visual: UV | Outdoor. | This unit can demonstrate different colors in four different temperature ranges (blue at T < 15 °C, green at 15 °C < T < 33 °C, red at 33 °C < T < 65 °C, and white T > 65 °C | Due to the limitation of the reaction chemistry, it’s usually very difficult to change these color change styles for better stimuli sensing performance |
| [84] | Air Temperature and relative humidity (Model HTR-170) | Visual: UV (UV dosimeter badge). Air quality: Polycyclic aromatic hydrocarbons—PAHs, oxygenated PAHs—OPAHs, Polychlorinated biphenyls—PCBs, Pesticides, organophophorous flame retardants—OPFRs. (MyExposome); surface ozone content—SOC (2BTech Personal Ozone Monitor) | Outdoor. | Polycyclic aromatic hydrocarbons (PAH) indicate possible causes of hair damages. This is the first meteorotropic study of its kind, combining environmental aggressors related to hair damage, opening new research hypothesis and further studies on exposome. | |
| [85] | Thermometers clipped on workers’ shoes (HOBO Pendant or iButton DS1922L) | Indoor/Outdoor. | Temperature from wearable thermometers, together with meteorological data, can serve as an additional method to identify occupational heat stress exposure and recommend work–rest schedules. | ||
| [86] | Air Temperature and relative humidity (BME680 mounted on a WE-Safe wearable sensor node) | UV (si1145 mounted on a WE-Safe wearable sensor node) | Indoor/Outdoor. | The proposed sensor network system presents a good example of an Internet of Things (IoT) platform in health care and safety applications. | |
| [87] | Temperature [°C] | Indoor/Outdoor. | This study investigates an artificial low-cost skin-like temperature sensor that was highly flexible and allowed for visual evaluation of the temperature. It can be used to provide real-time warnings to people for preventing any health issues resulting from extreme changes in human body temperature. | ||
| [68] | Air Temperature [°C], Relative Humidity [%] (BME280). Wind Direction [°], Wind Speed [m/s] (LCJ-CAPTEURS CV07-OEM). Surface Temperature [°C] (Flir vue Pro R) | Air quality: CO (DDScientific GD) and CO2 (Dynament MSH-P-CO2/NC) concentration [ppm], VOCs [kOhm] (Figaro TGS8100). Visual: Illuminance [lx], Global solar radiance [W/m2] (SP-215) | Outdoor. Wearable used to study pedestrians’ exposure to urban environmental conditions | A miniaturized microclimate station, specifically tailored to be worn while walking or biking and therefore to collect data according to the pedestrian perspective in anthropized areas. | |
| [88] | Air Temperature [°C] (ATxmega16E5 in-built temperature sensor) | Combustible gas concentration (NTC IGD) | Indoor. Employee state monitoring | In this work, the authors demonstrated a wearable wireless sensor system, which can be attached to a uniform and used for monitoring combustible gas concentration and temperature. The main feature of the wireless system is the possibility to be activated remotely by an RF control signal. | |
| [89] | Temperature [°C], Relative Humidity [%]. | Breath sensing and ethanol adulteration | Indoor/Outdoor. | A novel MoS2/Cu2S hybrid grown on disposable cellulose paper by the hydrothermal method is reported for its utilization in humidity, temperature and breath sensing, and ethanol adulteration wherein the data can be wirelessly transmitted to a smartphone with dedicated application. | |
| [90] | Temperature [°C], Relative Humidity [%] (EnviroSensor 2.0). | Air quality: ozone, particulate matter, CO. Position: Latitude and longitude (EnviroSensor 2.0). | Laboratory test | Portable air quality sensors have the potential to fill in the gap left by traditional air pollution monitoring. | Power draw of the sensor |
| [97] | Air temperature [°C], Relative Humidity [%]. (BME280 mounted on the ultrasonic personal aerosol sampler—UPAS) | Air pressure [hPa] (BME280). Visual: UV, IR (SI1145-A10-GMR). Mass air flow (Omron D6F). Air Quality: PM2.5 Accelerometer/Magnetometer (LSM303DLHCTR) (UPAS). | Laboratory test | Laboratory tests of the UPAS prototype demonstrate excellent agreement with equivalent federal reference method samplers for gravimetric analysis of PM2.5 across a broad range of concentrations. | |
| [91] | Temperature [°C], Relative Humidity [%] (SHT11) | Air quality: CO2 [ppm] | Indoor. | The system based on custom wearable sensor nodes, connected to a static WSN has been developed for a hazardous gas environment, but could be applied to a number of other safety applications or in other areas, such as the tracking of medical devices in a hospital. | |
| [92] | Temperature [°C], Relative Humidity [%]. | Air quality: Ozone. Biometric parameters: Herat rate, respiratory rate and expiratory airflow, skin impedance. Acceleration. | Indoor. | The system consists of a wristband, a chest patch, and a handheld spirometer. | |
| [93] | Temperature [°C], Relative Humidity [%] (MyPart). | Air quality: distinguishing and counting differently sized particles (MyPart) | Indoor/Outdoor. | The study reports the results of a preliminary user study conducted to evaluate the experience of using a new PEMS for air monitoring. | |
| [98] | Temperature [°C], Relative Humidity [%] (DHT11). | Body temperature [°C] (TMP102). | Indoor. People suffering from chronic diseases. | This type of monitoring systems are not suitable for critical situations, but many people suffering from chronic diseases and their families can benefit from this type of system. | |
| [94] | ambient temperature, humidity, wind speed (U) and short/long-wave radiation (S and L) | Physio-psychological parameters: skin temperature, pulse rate, subjective thermal sensation and state of body motion. | Outdoor. | A clear dependence of sweating on gender and body size was found; males were found to sweat more than females; overweight subjects sweat more than standard/underweight subjects. Tskin had a linear relationship with SET and depended on gender and body size differences. Tskin of the higher-sweating groups was lower than that of the lower-sweating groups, reflecting differences in evaporative cooling by perspiration. | |
| [95] | Temperature [°C], Relative Humidity [%]. | Air quality: N02, 03 and CO | Outdoor. | Author reports the design and initial deployment of the Citisense mobile air quality sensing system. | |
| [96] | Temperature [°C] | Air Quality: O2, CO and CO2 | Laboratory test | This paper presents in-depth knowledge on sensor selection and calibration. |
| Reference Number of the Research Study | Air Quality Physical Variables Monitored (in Brackets the Name of Used Sensor or Wearable, if Available) | Other Factors Monitored (in Brackets the Name of Used Sensor or Wearable, if Available) | Indoor/Outdoor and Field of Application | Practical Implication | Limitation of the Considered Wearable |
|---|---|---|---|---|---|
| [101] | 14 volatile organic compounds (Microfabricated Preconcentrator Chip—μPC) | Thermal: temperature and humidity data. GPS. (Microfabricated Preconcentrator Chip—μPC) | Outdoor. | This wearable has potential applications, including hazardous VOC exposure monitoring in occupational hazard assessment for certain professions, for example in industries | |
| [102] | 15 volatile organic compounds (Microfabricated Preconcentrator Chip—μPC) | Thermal: temperature and humidity data. GPS. (Microfabricated Preconcentrator Chip—μPC) | Outdoor. | This device can be useful to collect personal exposure data for epidemiology studies, and may be especially relevant for asthma studies involving VOC triggers. | Size and weight |
| [104] | TVOCs | Thermal: temperature and humidity data. | Indoor/Outdoor | The study demonstrate the potential of the device for environmental monitoring, individual health (biomarkers detection) and population health studies. | |
| [105] | VOCs, CO | Indoor/Outdoor | The proposed VOC device is adequate to characterize personal exposure in many real-world scenarios and is applicable for personal daily use. | ||
| [106] | VOCs, CO | Indoor/Outdoor | This integrated approach offers a cost-effective and reliable platform for personal exposure assessment. | ||
| [107] | Ozone (MiCS-2614), TVOCs (SGPC3) | Thermal: Air Temperature and Relative humidity (SHT30-DIS-B). Accelerometer for activity level (NXP MMA8652FC) | Indoor/Outdoor | This work shows that an inexpensive and compact wearable device can be built, and it also reveals additional improvement, particularly in shortening of response time, reducing cross interference from unintended gases present in air, and determining when recalibration is necessary are all important for a device intended for use under real-world scenarios. | |
| [45] | CO, NO2, O3, and SO2. | Thermal: Air Temperature and Relative humidity. Visual: UV. Accelerometer to track a user’s activity. | Indoor/Outdoor | Outdoor and indoor air quality assessment. | The system had not been fully developed in terms of the Internet connectivity and smartphone application. |
| [110] | Particulate matter—PM2.5 (Ultrasonic Personal Aerosol Sampler—UPAS) | Indoor. Rural Honduran women who use wood-burning cookstoves. | Using the UPAS as a personal exposure monitor for household air pollution studies. | ||
| [69] | Ozone, Sulfur Dioxide, Volatile Organic Compounds (Eco-Mini) | Acoustic: Sound pressure level. Thermal: relative humidity, temperature. Visual: ambient light color balance, 3-axis accelerometer and GPS location (Eco-Mini) | Indoor/Outdoor | New forms of low-cost portable monitors have begun to emerge that enable the collection of higher spatial density “crowd sourced” data. | |
| [112] | PM1, PM2.5, PM10 (Alphasense OPC-N2) | Relative humidity and air temperature (DHT22) because the velocities of the particles change under varying temperature and humidity conditions according to the Ideal Gas Law and it is important for the system to be examined separately under each variable condition in a controlled manner. | Indoor/Outdoor | The results of this study show that a reliable wireless environmental monitoring system for real-time remote air quality and health monitoring applications is feasible. | battery size and lifespan |
| [121] | NO2, CO | Indoor. Laboratory test | A low-power sensing platform for health and environment monitoring with embedded sensors and external sensors was developed and tested. | ||
| [113] | PM1, PM2.5, PM10 | Indoor (second and fourth floor flats, cafes, cars, restaurants, underground metro). Outdoor. | The study showed that the residences’ air quality was determined by the type and intensity of outdoor sources and their vertical distance from the street. Indoor activities such as cooking and cleaning further increased PM levels and formulated the air quality, while particulate accumulation was evident. | ||
| [125] | CO2 (COZIR-GC0012) | Thermal: air temperature, relative humidity (BME280). Pressure (BME280). Visual: illuminance (TSL2591) | Indoor Environmental Quality assessment | The proposed work provides an effective and reliable solution for long-term monitoring that presents many opportunities in safety related monitoring applications, by using a wireless sensor network for wearable environmental monitoring. | |
| [122] | NO2, CO and SO2 additionally (Ubiqsens) | Thermal: air temperature, relative humidity. Pressure. Acoustic: noise level. Accelerometer, Gyroscope, Magnetometer. (Ubiqsense) | Indoor. Laboratory test. | The wearables for gas monitoring under real laboratory conditions show high potential. | |
| [114] | PM2.5 | GPS | Indoor/Outdoor. Children in their everyday environments | The overall findings of this study indicate that both the choice of transport mode and the type of neighborhood built environment have an influence on children’s exposure to fine particulate matter during their school commute. This study has revealed how the school commute can be a target for various mitigation strategies by city planners, transportation engineers, school boards, and parents aimed at reducing the burden of air pollution on children. The finding that mean PM2.5 exposure was lowest among those who walked to and from school and higher among those who were driven should be of particular interest to public health professionals promoting active school travel. | |
| [111] | PM2.5, PM10 | Indoor. Two Buddhist temples in Tai-Chung | This study was conducted to assess worshippers’ exposure to PM10 and PM2.5 in two different types of Buddhist temples in Tai-Chung. As a result, people should spend less time in Buddhist temples, choose a well-ventilated temple, or avoid visiting temples on the 1st and 15th days of the lunar month. | ||
| [115] | PM2.5 | GPS, Wearable cameras. | Indoor (household). Outdoor. | The study investigates the relationship between particulate air pollution from outdoor and household sources with markers of atherosclerosis in Telangana, India. | |
| [123] | NO2, CO | Thermal: temperature, humidity. Air pressure. | Indoor/Outdoor | In this work, a preliminary innovative working prototype of a wrist-worn watch health sensor monitoring system for environment air quality (physical and chemical parameters) was introduced. | |
| [68] | CO (DDScientific GD) and CO2 (Dynament MSH-P-CO2/NC) concentration [ppm], VOCs [kOhm] (Figaro TGS8100) | Air Temperature [°C], Relative Humidity [%] (BME280). Wind Direction [°], Wind Speed [m/s] (LCJ-CAPTEURS CV07-OEM). Surface Temperature [°C] (Flir vue Pro R). Visual: Illuminance [lx], Global solar radiance [W/m2] (SP-215) | Outdoor. Wearable used to study pedestrians’ exposure to urban environmental conditions | A miniaturized microclimate station, specifically tailored to be worn while walking or biking and therefore to collect data according to the pedestrian perspective in anthropized areas. | |
| [116] | PM2.5 | GPS, Wearable cameras. | Indoor (household). Outdoor. | The study investigates the relationship between particulate air pollution from outdoor and household sources with markers of atherosclerosis in Telangana, India. | |
| [76] | ultrafine particles (UFP, <100 nm diameter) | Noise exposure (NEATVIBEwear) | Indoor. Transit, home, school | Personal measurements of UFP (ultrafine particle) and noise will enable researchers to investigate the independent and/or joint-effects of these health-relevant environmental exposures. | NEATVIBEwear, in its current release, does not allow for 1/3-octave band or spectral measurements of traffic noise. |
| [126] | CO and CO2 (WE-Safe) | Thermal: Air Temperature and Relative humidity. Visual: UV. (WE-Safe) | Indoor/Outdoor | This paper presented a wearable for people working in extreme and harsh environments when they are not in safe zones. Such an IoT platform will present new opportunities for saving lives or preventing health issues etc. | |
| [108] | O3, NOx, COx, and VOCs | Thermal: Air Temperature and Relative humidity. Visual: UV, ambient light. | Indoor/Outdoor | The aim of this study is to develop a wearable environmental monitoring system (WEMS), an IoT device, to measure environmental variables. Such an IoT platform will present new opportunities for saving lives or preventing health issues, etc. | |
| [117] | PM (with 6 particle size channels: 0.3 µm, 0.5 µm, 1.0 µm, 2.5 µm, 5.0 µm, 10 µm) (CEM DT-9881) | Thermal: Air Temperature and Relative humidity (CEM DT-9881). Heart rate and the cadence of walking or cycling speed (Wahoo Fitness sensor TICKR RUN). Subjective data about the feelings of air quality and the symptoms (e.g., cough, sore throat, eye itchiness, etc.) reported via the smartphone App CrowdAir | Outdoor | The data collection operation and data analysis results demonstrate the feasibility of the adopted methodology and the developed platform to identify the correlations among air quality indicators, participants’ subjective feelings of air quality, physical activity status measured by wearable sensors, and reported symptoms. | |
| [79] | PM2.5 an PM10 (PLANTOWER PM5003). | Thermal: air humidity, temperature (PLANTOWER PM5003). Noise [db] (LENA—Language Environment Analysis System) | Indoor. School, Home. | Preliminary results indicate that it is feasible to gather personal Particulate Matter (PM2.5 and PM10), language, and noise data, cognitive assessments, and biospecimens from a sample of 3-4-year-old children. | |
| [88] | Combustible gas concentration (NTC IGD) | Air Temperature [°C] (ATxmega16E5 in-built temperature sensor) | Indoor. Employee state monitoring | A wearable wireless sensor system can be attached to a uniform and used for monitoring combustible gas concentration and temperature. The main feature of the wireless system is the possibility to be activated remotely by an RF control signal. | |
| [127] | explosive and nerve-agent | Indoor. Laboratory test | The study describes a wireless wearable ring-based sensor system for rapid electrochemical monitoring of explosive and nerve-agent threats in vapor and liquid phases. Overall, such a fully integrated ring-based wearable platform holds considerable promise for meeting rapidly growing defense and security sensing needs. | ||
| [90] | Ozone, particulate matter, CO (EnviroSensor 2.0). | Thermal: Temperature [°C], Relative Humidity [%]. Position: Latitude and longitude (EnviroSensor 2.0). | Laboratory test | Portable air quality sensors have the potential to fill in the gap left by traditional air pollution monitoring. | Power draw of the sensor |
| [124] | CO2 (COZIR-AJ-5000) | Thermal: Temperature [°C], Relative Humidity [%] (SHT21). Air pressure (BMP180). Acceleration and angular velocity (MPU-6050). | Indoor/Outdoor | The device capability has been assessed using a testing strategy that included three scenarios: indoor measurements, outdoor measurements, and indoor-outdoor measurements. It has shown promising results and a good match with the values found in the literature. | |
| [91] | CO2 [ppm] | Temperature [°C], Relative Humidity [%] (SHT11) | Indoor. | This indoor smart environment monitoring system for safety applications is based on custom wearable sensor nodes, connected to a static WSN. The system has been developed for a hazardous gas environment, but could be applied to a number of other safety applications or in other areas such as the tracking of medical devices in a hospital. | |
| [92] | Ozone. | Thermal: Temperature [°C], Relative Humidity [%]. Biometric parameters: Herat rate, respiratory rate and expiratory airflow, skin impedance. Acceleration. | Indoor. | The system consists of a wristband, a chest patch, and a handheld spirometer. | |
| [93] | distinguishing and counting differently sized particles (My Part) | Thermal: Temperature [°C], Relative Humidity [%] (My Part). | Indoor/Outdoor. | The study reports the results of a preliminary user study conducted to evaluate the experience of using the overall system in terms of accuracy, low cost, and portability. | |
| [95] | NO2, O3 and CO | Thermal: Temperature [°C], Relative Humidity [%]. | Outdoor. | The author reports the design and initial deployment of the Citisense mobile air quality sensing system. | |
| [103] | VOCs (Figaro TG2620 sensor) | Outdoor. | The authors presented WearAir, an expressive T-shirt to sense the surrounding air quality, as indicated by the measured volatile organic compounds. It can motivate others to study ways to convey environmental information more effectively. | ||
| [118] | PM2.5 (RTI MicroPEM v3.2b) | Thermal: Temperature [°C], Relative Humidity [%]. Acceleration. (RTI MicroPEM v3.2b). | Outdoor. | Authors developed a machine learning model for identifying periods of bicycling activity using passively collected data from the MicroPEM wearable. This finding helps strengthen the case for using wearable monitors in exposure assessment studies, as it becomes possible to estimate potential inhaled doses if personal exposure data is combined with respiration rate. | |
| [84] | Polycyclic aromatic hydrocarbons—PAHs, oxygenated PAHs—OPAHs, Polychlorinated biphenyls—PCBs, Pesticides, organophophorous flame retardants—OPFRs. (MyExposome). Surface ozone content—SOC (2BTech Personal Ozone Monitor) | Thermal: Air Temperature and relative humidity (Model HTR-170). Visual: UV (UV dosimeter badge). | Outdoor. | Polycyclic aromatic hydrocarbons (PAH) indicate possible causes of hair damages. This is the first meteorotropic study of its kind, combining environmental aggressors related to hair damage, opening new research hypothesis further studies on exposome. | |
| [72] | CO and NO2 | Thermal: air humidity, temperature. Acoustic: Sound pressure level [db] (MLMS-EMGN-4.0). Air pressure | Indoor. Laboratory | This device measures several physical and chemical environmental parameters that are known to be hazardous. | |
| [75] | NO2, CO | Acoustic: Sound level [db]. Thermal: air temperature and relative humidity. UV. Biometrics: skin temperature, heart rate. Motion activity (9 Degree of Freedom(DoF)) motion tracking by accelerometer, gyroscope and magnetometer. | Indoor/Outdoor | Wrist-worn devices can integrate parameters from the environmental, behavioral, and physiological domains. | |
| [78] | Styrene exposure derived by biological monitoring in saliva and urine | Noise levels (Quest DLX-1) | Indoor. Workers employed in molding and in artifacts refining | A significant negative correlation was found between otoacoustic emission levels and the concentration of the styrene exposure. |
References
- Marques, G.; Pitarma, R. mHealth: Indoor Environmental Quality Measuring System for Enhanced Health and Well-Being Based on Internet of Things. J. Sens. Actuator Netw. 2019, 8, 43. [Google Scholar] [CrossRef] [Green Version]
- Xia, F.; Yang, L.T.; Wang, L.; Vinel, A. Internet of Things. Int. J. Commun. Syst. 2012, 25, 1101–1102. [Google Scholar] [CrossRef]
- Gubbi, J.; Buyya, R.; Marusic, S.; Palaniswami, M. Internet of Things (IoT): A vision, architectural elements, and future directions. Futur. Gener. Comput. Syst. 2013, 29, 3028–3043. [Google Scholar] [CrossRef] [Green Version]
- Lee, G.M.; Crespi, N.; Choi, J.K.; Boussard, M. Internet of Things. In Transactions on Petri Nets and Other Models of Concurrency XV; Springer Science and Business Media LLC: Berlin/Heidelberg, Germany, 2013; pp. 257–282. [Google Scholar]
- Atzori, L.; Iera, A.; Morabito, G. The Internet of Things: A survey. Comput. Netw. 2010, 54, 2787–2805. [Google Scholar] [CrossRef]
- Lamonaca, F.; Polimeni, G.; Barbé, K.; Grimaldi, D. Health parameters monitoring by smartphone for quality of life improvement. Measurement 2015, 73, 82–94. [Google Scholar] [CrossRef]
- Montoliu, R.; Blom, J.; Gatica-Perez, D. Discovering places of interest in everyday life from smartphone data. Multimedia Tools Appl. 2012, 62, 179–207. [Google Scholar] [CrossRef] [Green Version]
- Lachmann, B.; Sindermann, C.; Sariyska, R.Y.; Luo, R.; Melchers, M.C.; Becker, B.; Cooper, A.; Montag, C. The Role of Empathy and Life Satisfaction in Internet and Smartphone Use Disorder. Front. Psychol. 2018, 9, 398. [Google Scholar] [CrossRef] [PubMed]
- Zhao, S.; Li, S.; Ramos, J.; Luo, Z.; Jiang, Z.; Dey, A.K.; Pan, G. User profiling from their use of smartphone applications: A survey. Pervas. Mob. Comput. 2019, 59, 101052. [Google Scholar] [CrossRef]
- Sama, R. Impact of Media Advertisements on Consumer Behaviour. J. Creat. Commun. 2019, 14, 54–68. [Google Scholar] [CrossRef]
- Jung, Y.; Kim, S.; Choi, B. Consumer valuation of the wearables: The case of smartwatches. Comput. Hum. Behav. 2016, 63, 899–905. [Google Scholar] [CrossRef]
- Peake, J.M.; Kerr, G.; Sullivan, J.P. A critical review of consumer wearables, mobile applications, and equipment for providing biofeedback, monitoring stress, and sleep in physically active populations. Front. Physiol. 2018, 9, 743. [Google Scholar] [CrossRef]
- Stefana, E.; Marciano, F.; Rossi, D.; Cocca, P.; Tomasoni, G. Wearable Devices for Ergonomics: A Systematic Literature Review. Sensors 2021, 21, 777. [Google Scholar] [CrossRef]
- Kristoffersson, A.; Lindén, M. A Systematic Review on the Use of Wearable Body Sensors for Health Monitoring: A Qualitative Synthesis. Sensors 2020, 20, 1502. [Google Scholar] [CrossRef] [Green Version]
- Lu, L.; Zhang, J.; Xie, Y.; Gao, F.; Xu, S.; Wu, X.; Ye, Z. Wearable Health Devices in Health Care: Narrative Systematic Review. JMIR mHealth uHealth 2020, 8, e18907. [Google Scholar] [CrossRef]
- Khakurel, J.; Melkas, H.; Porras, J. Tapping into the wearable device revolution in the work environment: A systematic review. Inf. Technol. People 2018, 31, 791–818. [Google Scholar] [CrossRef] [Green Version]
- Svertoka, E.; Saafi, S.; Rusu-Casandra, A.; Burget, R.; Marghescu, I.; Hosek, J.; Ometov, A. Wearables for Industrial Work Safety: A Survey. Sensors 2021, 21, 3844. [Google Scholar] [CrossRef]
- Morawska, L.; Thai, P.K.; Liu, X.; Asumadu-Sakyi, A.; Ayoko, G.; Bartonova, A.; Bedini, A.; Chai, F.; Christensen, B.; Dunbabin, M.; et al. Applications of low-cost sensing technologies for air quality monitoring and exposure assessment: How far have they gone? Environ. Int. 2018, 116, 286–299. [Google Scholar] [CrossRef]
- Singla, S.; Bansal, D.; Misra, A.; Raheja, G. Towards an integrated framework for air quality monitoring and exposure estimation—A review. Environ. Monit. Assess. 2018, 190, 562. [Google Scholar] [CrossRef]
- Borghi, F.; Spinazzè, A.; Rovelli, S.; Campagnolo, D.; Del Buono, L.; Cattaneo, A.; Cavallo, D.M. Miniaturized Monitors for Assessment of Exposure to Air Pollutants: A Review. Int. J. Environ. Res. Public Health 2017, 14, 909. [Google Scholar] [CrossRef] [Green Version]
- Kumar, A.; Kim, H.; Hancke, G.P. Environmental Monitoring Systems: A Review. IEEE Sens. J. 2013, 13, 1329–1339. [Google Scholar] [CrossRef] [Green Version]
- Al Mamun, A.; Yuce, M.R. Sensors and Systems for Wearable Environmental Monitoring Toward IoT-Enabled Applications: A Review. IEEE Sens. J. 2019, 19, 7771–7788. [Google Scholar] [CrossRef]
- Coulby, G.; Clear, A.; Jones, O.; Godfrey, A. A Scoping Review of Technological Approaches to Environmental Monitoring. Int. J. Environ. Res. Public Health 2020, 17, 3995. [Google Scholar] [CrossRef] [PubMed]
- Bass, T. The Eudaemonic Pie; Houghton Mifflin Harcourt: Boston, MA, USA, 1985. [Google Scholar]
- Mann, S. Wearable computing: A first step toward personal imaging. Computer 1997, 30, 25–32. [Google Scholar] [CrossRef]
- Starner, T. Human-powered wearable computing. IBM Syst. J. 1996, 35, 618–629. [Google Scholar] [CrossRef]
- Picard, R.W. Affective Wearables. Affect. Comput. 2000, 90–97. [Google Scholar] [CrossRef]
- Gao, W.; Emaminejad, S.; Nyein, H.Y.Y.; Challa, S.; Chen, K.; Peck, A.; Fahad, H.M.; Ota, H.; Shiraki, H.; Kiriya, D.; et al. Fully integrated wearable sensor arrays for multiplexed in situ perspiration analysis. Nat. Cell Biol. 2016, 529, 509–514. [Google Scholar] [CrossRef] [Green Version]
- Lee, J.; Kim, D.; Ryoo, H.-Y.; Shin, B.-S. Sustainable Wearables: Wearable Technology for Enhancing the Quality of Human Life. Sustainability 2016, 8, 466. [Google Scholar] [CrossRef] [Green Version]
- Palmer, B.; Gershbein, D. Wearables for Good: Use Case Handbook, Unicef. 2012, pp. 17–20. Available online: https://www.unicef.org/innovation/media/1416/file/Wearablesforgood.pdf (accessed on 9 June 2021).
- Seneviratne, S.; Hu, Y.; Nguyen, T.; Lan, G.; Khalifa, S.; Thilakarathna, K.; Hassan, M.; Seneviratne, A. A Survey of Wearable Devices and Challenges. IEEE Commun. Surv. Tutor. 2017, 19, 2573–2620. [Google Scholar] [CrossRef]
- Düking, P.; Giessing, L.; Frenkel, M.O.; Koehler, K.; Holmberg, H.-C.; Sperlich, B. Wrist-Worn Wearables for Monitoring Heart Rate and Energy Expenditure While Sitting or Performing Light-to-Vigorous Physical Activity: Validation Study. JMIR mHealth uHealth 2020, 8, e16716. [Google Scholar] [CrossRef]
- Klepeis, N.E.; Nelson, W.C.; Ott, W.R.; Robinson, J.P.; Tsang, A.M.; Switzer, P.; Behar, J.V.; Hern, S.C.; Engelmann, W.H. The National Human Activity Pattern Survey (NHAPS): A resource for assessing exposure to environmental pollutants. J. Expo. Sci. Environ. Epidemiol. 2001, 11, 231–252. [Google Scholar] [CrossRef] [Green Version]
- Mohamed, M.F.; Raman, S.N.; Pratama, T.M.I.; Yusoff, W.F.M. Outdoor Environment of Low-cost Housing: A case study of Flat Taman Desa Sentosa. E3S Web Conf. 2014, 3, 01005. [Google Scholar] [CrossRef] [Green Version]
- Clarke, J.; Allard, F.; La Rochelle, Ł.D. Workplace productivity and individual thermal satisfaction. Build. Environ. 2009, 91, 7001. [Google Scholar]
- Kleerekoper, L.; Esch, M.P.-V.; Salcedo, T.B. How to make a city climate-proof, addressing the urban heat island effect. Resour. Conserv. Recycl. 2012, 64, 30–38. [Google Scholar] [CrossRef]
- Jones, A. Indoor air quality and health. Atmos. Environ. 1999, 33, 4535–4564. [Google Scholar] [CrossRef]
- Lee, S.; Chang, M. Indoor and outdoor air quality investigation at schools in Hong Kong. Chemosphere 2000, 41, 109–113. [Google Scholar] [CrossRef]
- Hwang, T.; Kim, J.T. Effects of indoor lighting on occupants’ visual comfort and eye health in a green building. Indoor Built Environ. 2011, 20, 75–90. [Google Scholar] [CrossRef]
- Brown, A.; Gjestland, T.; Dubois, D. Acoustic Environments and Soundscapes. In Soundscape and the Built Environment; CRC Press: Boca Raton, FL, USA, 2016; pp. 1–16. [Google Scholar]
- Basner, M.; Babisch, W.; Davis, A.; Brink, M.; Clark, C.; Janssen, S.; Stansfeld, S. Auditory and non-auditory effects of noise on health. Lancet 2014, 383, 1325–1332. [Google Scholar] [CrossRef] [Green Version]
- Stansfeld, S.A. Environmental noise guidelines for the european region. Proc. Inst. Acoust. 2019, 41, 17–20. Available online: https://www.euro.who.int/en/publications/abstracts/environmental-noise-guidelines-for-the-european-region-2018 (accessed on 9 June 2021).
- Masullo, M.; Maffei, L.; Sorrentino, F.; Ruggiero, G.; Rapuano, M. Effects of fan coils noise on cognitive performances in offices. In Proceedings of the 25th International Congress on Sound and Vibration (ICSV25), Hiroshima, Japan, 8–12 July 2018. [Google Scholar]
- Puyana-Romero, V.; Lopez-Segura, L.S.; Maffei, L.; Hernández-Molina, R.; Masullo, M. Interactive Soundscapes: 360°-Video Based Immersive Virtual Reality in a Tool for the Participatory Acoustic Environment Evaluation of Urban Areas. Acta Acust. United Acust. 2017, 103, 574–588. [Google Scholar] [CrossRef]
- Cho, H. Personal Environmental Monitoring System and network platform. In Proceedings of the 2015 9th International Conference on Sensing Technology (ICST), Auckland, New Zealand, 8–10 December 2015; pp. 751–756. [Google Scholar]
- Falagas, M.E.; Pitsouni, E.I.; Malietzis, G.; Pappas, G. Comparison of PubMed, Scopus, Web of Science, and Google Scholar: Strengths and weaknesses. FASEB J. 2007, 22, 338–342. [Google Scholar] [CrossRef]
- Scopus Search Guide. Available online: http://schema.elsevier.com/dtds/document/bkapi/search/SCOPUSSearchTips.htm (accessed on 9 June 2021).
- Uddin, S.; Khan, A. The impact of author-selected keywords on citation counts. J. Inf. 2016, 10, 1166–1177. [Google Scholar] [CrossRef]
- Campedelli, G.M. Where are we? Using Scopus to map the literature at the intersection between artificial intelligence and research on crime. J. Comput. Soc. Sci. 2020, 1–28. [Google Scholar] [CrossRef]
- Choi, J.; Yi, S.; Lee, K.C. Analysis of keyword networks in MIS research and implications for predicting knowledge evolution. Inf. Manag. 2011, 48, 371–381. [Google Scholar] [CrossRef]
- Smith, J.; Noble, H. Bias in research: Table 1. Évid. Based Nurs. 2014, 17, 100–101. [Google Scholar] [CrossRef] [Green Version]
- Buscemi, N.; Hartling, L.; Vandermeer, B.; Tjosvold, L.; Klassen, T. Single data extraction generated more errors than double data extraction in systematic reviews. J. Clin. Epidemiol. 2006, 59, 697–703. [Google Scholar] [CrossRef]
- Bidwell, S.; Chalmers, S.I.; Clarke, M.; Crosbie, G.; Eastwood, A.; Fry-smith, A.; Harbour, R.; Lewis, R. Undertaking Systematic Reviews of Research on Effectiveness CRD’s Guidance for those Carrying Out or Commissioning Reviews. CRD Rep. Number 4 2nd Ed. 4. 2001, p. 152. Available online: http://opensigle.inist.fr/handle/10068/534964 (accessed on 9 June 2021).
- Page, M.J.; McKenzie, J.E.; Bossuyt, P.M.; Boutron, I.; Hoffmann, T.C.; Mulrow, C.D.; Shamseer, L.; Tetzlaff, J.M.; Akl, E.A.; Brennan, S.E.; et al. The PRISMA 2020 statement: An updated guideline for reporting systematic reviews. Syst. Rev. 2021, 10, 1–11. [Google Scholar] [CrossRef]
- Bierman, A.; Klein, T.R.; Rea, M.S. The Daysimeter: A device for measuring optical radiation as a stimulus for the human circadian system. Meas. Sci. Technol. 2005, 16, 2292–2299. [Google Scholar] [CrossRef]
- Rea, M.S.; Figueiro, M.G.; Bullough, J.D.; Bierman, A. A model of phototransduction by the human circadian system. Brain Res. Rev. 2005, 50, 213–228. [Google Scholar] [CrossRef]
- Miller, D.; Bierman, A.; Figueiro, M.; Schernhammer, E.; Rea, M. Ecological measurements of light exposure, activity and circadian disruption. Light. Res. Technol. 2010, 42, 271–284. [Google Scholar] [CrossRef] [Green Version]
- Figueiro, M.G.; Plitnick, B.; Rea, M.S. The effects of chronotype, sleep schedule and light/dark pattern exposures on circadian phase. Sleep Med. 2014, 15, 1554–1564. [Google Scholar] [CrossRef]
- Figueiro, M.G.; Hamner, R.; Bierman, A.; Rea, M.S. Comparisons of three practical field devices used to measure personal light exposures and activity levels. Light. Res. Technol. 2013, 45, 421–434. [Google Scholar] [CrossRef] [PubMed]
- Figueiro, M.; Kalsher, M.; Steverson, B.; Heerwagen, J.; Kampschroer, K.; Rea, M. Circadian-effective light and its impact on alertness in office workers. Light. Res. Technol. 2018, 51, 171–183. [Google Scholar] [CrossRef]
- Figueiro, M.G.; Hunter, C.M.; Higgins, P.A.; Hornick, T.R.; Jones, G.; Plitnick, B.; Brons, J.; Rea, M.S. Tailored lighting intervention for persons with dementia and caregivers living at home. Sleep Health 2015, 1, 322–330. [Google Scholar] [CrossRef] [PubMed] [Green Version]
- Figueiro, M.G. Individually tailored light intervention through closed eyelids to promote circadian alignment and sleep health. Sleep Health 2015, 1, 75–82. [Google Scholar] [CrossRef] [Green Version]
- Figueiro, M.G.; Plitnick, B.A.; Lok, A.; Jones, G.; Higgins, P.; Hornick, T.R.; Rea, M.S. Tailored lighting intervention improves measures of sleep, depression, and agitation in persons with Alzheimer’s disease and related dementia living in long-term care facilities. Clin. Interv. Aging 2014, 9, 1527–1537. [Google Scholar] [CrossRef] [Green Version]
- Jardim, A.C.N.; Pawley, M.D.M.; Cheeseman, J.F.; Guesgen, M.J.; Steele, C.T.; Warman, G.R. Validating the Use of Wrist-Level Light Monitoring for In-Hospital Circadian Studies. Chrono Int. 2011, 28, 834–840. [Google Scholar] [CrossRef]
- Figueiro, M.; Brons, J.; Plitnick, B.; Donlan, B.; Leslie, R.; Rea, M. Measuring circadian light and its impact on adolescents. Light. Res. Technol. 2010, 43, 201–215. [Google Scholar] [CrossRef] [Green Version]
- Rea, M.S. Human health and well-being: Promises for a bright future from solid-state lighting. SPIE OPTO 2011, 7954, 795404. [Google Scholar] [CrossRef]
- Higgins, P.A.; Hornick, T.R.; Figueiro, M.G. Rest-activity and light exposure patterns in the home setting: A methodological case study. Am. J. Alzheimers Dis. Other Demen. 2010, 25, 353–361. [Google Scholar] [CrossRef] [Green Version]
- Pigliautile, I.; Pisello, A.L. A new wearable monitoring system for investigating pedestrians’ environmental conditions: Development of the experimental tool and start-up findings. Sci. Total Environ. 2018, 630, 690–706. [Google Scholar] [CrossRef]
- Fletcher, R.R.; Oreskovic, N.M.; Robinson, A.I. Design and clinical feasibility of personal wearable monitor for measurement of activity and environmental exposure. In Proceedings of the 2014 36th Annual International Conference of the IEEE Engineering in Medicine and Biology Society, Chicago, IL, USA, 26–30 August 2014. [Google Scholar]
- Wei, Y.; Zhang, W.; Hou, C.; Zhang, Q.; Li, Y.; Wang, H. Independent dual-responsive Janus chromic fibers. Sci. China Mater. 2021, 64, 1770–1779. [Google Scholar] [CrossRef]
- Rhudy, M.B.; Greenauer, N.; Mello, C. Wearable light data logger for studying physiological and psychological effects of light data. HardwareX 2020, 8, e00157. [Google Scholar] [CrossRef]
- Haghi, M.; Thurow, K.; Stoll, N. Four-layer wrist worn device for sound level and hazardous gases environmental monitoring. In Proceedings of the 2017 2nd International Conference on System Reliability and Safety (ICSRS), Milan, Italy, 20–22 December 2017. [Google Scholar]
- Haghi, M.; Stoll, R.; Thurow, K. A Low-Cost, Standalone, and Multi-Tasking Watch for Personalized Environmental Monitoring. IEEE Trans. Biomed. Circuits Syst. 2018, 12, 1144–1154. [Google Scholar] [CrossRef]
- Haghi, M.; Thurow, K. Toward a New Approach in Wearable Devices in Safety Monitoring: Miniaturization and 3D Space Utilization. SLAS Technol. Transl. Life Sci. Innov. 2019, 24, 444–447. [Google Scholar] [CrossRef]
- Haghi, M.; Danyali, S.; Thurow, K.; Warnecke, J.M.; Wang, J.; Deserno, T.M. Hardware Prototype for Wrist-Worn Simultaneous Monitoring of Environmental, Behavioral, and Physiological Parameters. Appl. Sci. 2020, 10, 5470. [Google Scholar] [CrossRef]
- Leaffer, D.; Wolfe, C.; Doroff, S.; Gute, D.; Wang, G.; Ryan, P. Wearable Ultrafine Particle and Noise Monitoring Sensors Jointly Measure Personal Co-Exposures in a Pediatric Population. Int. J. Environ. Res. Public Health 2019, 16, 308. [Google Scholar] [CrossRef] [Green Version]
- Guerrache, F.; Younis, E.M.G.; Kanjo, E. Quantifying Environmental Noise impact on Heart Rate Variability. In Proceedings of the 8th EAI International Conference on Mobile Computing, Applications and Services, Cambridge, UK, 30 November–1 December 2016. [Google Scholar] [CrossRef]
- Sisto, R.; Cerini, L.; Gatto, M.P.; Gherardi, M.; Gordiani, A.; Sanjust, F.; Paci, E.; Tranfo, G.; Moleti, A. Otoacoustic emission sensitivity to exposure to styrene and noise. J. Acoust. Soc. Am. 2013, 134, 3739–3748. [Google Scholar] [CrossRef]
- Schultz, A.A.; Malecki, K.M.; Olson, M.M.; Selman, S.B.; Olaiya, O.-I.; Spicer, A.; Schauer, J.J.; Edwards, R.; Kirkorian, H.L.; Dilworth-Bart, J. Investigating Cumulative Exposures among 3- to 4-Year-Old Children Using Wearable Ultrafine Particle Sensors and Language Environment Devices: A Pilot and Feasibility Study. Int. J. Environ. Res. Public Health 2020, 17, 5259. [Google Scholar] [CrossRef]
- Hernandez-Jayo, U.; Goñi, A. Zaratamap: Noise Characterization in the Scope of a Smart City through a Low Cost and Mobile Electronic Embedded System. Sensors 2021, 21, 1707. [Google Scholar] [CrossRef]
- Frampton, T.H.; Tiele, A.; Covington, J.A. Development of a Personalised Environmental Quality Monitoring System (PONG). IEEE Sens. J. 2021, 21, 15230–15236. [Google Scholar] [CrossRef]
- Pioppi, B.; Pigliautile, I.; Pisello, A.L. Data collected by coupling fix and wearable sensors for addressing urban microclimate variability in an historical Italian city. Data Brief 2020, 29, 105322. [Google Scholar] [CrossRef]
- Zeng, S.; Sun, H.; Park, C.; Zhang, M.; Zhu, M.; Yan, M.; Chov, N.; Li, E.; Smith, A.T.; Xu, G.; et al. Multi-stimuli responsive chromism with tailorable mechanochromic sensitivity for versatile interactive sensing under ambient conditions. Mater. Horizons 2019, 7, 164–172. [Google Scholar] [CrossRef]
- De Vecchi, R.; Ripper, J.D.S.C.; Roy, D.; Breton, L.; Marciano, A.G.; De Souza, P.M.B.; Corrêa, M.D.P. Using wearable devices for assessing the impacts of hair exposome in Brazil. Sci. Rep. 2019, 9, 1–10. [Google Scholar] [CrossRef] [Green Version]
- Wang, S.; Richardson, M.B.; Wu, C.Y.; Cholewa, C.D.; Lungu, C.T.; Zaitchik, B.; Gohlke, J.M. Estimating Occupational Heat Exposure From Personal Sampling of Public Works Employees in Birmingham, Alabama. J. Occup. Environ. Med. 2019, 61, 518–524. [Google Scholar] [CrossRef]
- Wu, F.; Redoute, J.-M.; Yuce, M.R. A Self-Powered Wearable Body Sensor Network System for Safety Applications. In Proceedings of the 2018 IEEE Sensors Applications Symposium (SAS), New Delhi, India, 28–31 October 2018. [Google Scholar]
- Hao, L.; Ding, J.; Yuan, N.; Xu, J.; Zhou, X.; Dai, S.; Chen, B. Visual and flexible temperature sensor based on a pectin-xanthan gum blend film. Org. Electron. 2018, 59, 243–246. [Google Scholar] [CrossRef]
- Spirjakin, D.; Baranov, A.; Akbari, S. Wearable Wireless Sensor System With RF Remote Activation for Gas Monitoring Applications. IEEE Sens. J. 2018, 18, 2976–2982. [Google Scholar] [CrossRef]
- Sahatiya, P.; Kadu, A.; Gupta, H.; Gomathi, P.T.; Badhulika, S. Flexible, Disposable Cellulose-Paper-Based MoS2/Cu2S Hybrid for Wireless Environmental Monitoring and Multifunctional Sensing of Chemical Stimuli. ACS Appl. Mater. Interfaces 2018, 10, 9048–9059. [Google Scholar] [CrossRef]
- Dam, N.; Ricketts, A.; Catlett, B.; Henriques, J. Wearable sensors for analyzing personal exposure to air pollution. In Proceedings of the 2017 Systems and Information Engineering Design Symposium (SIEDS), Charlottesville, VA, USA, 28 April 2017. [Google Scholar]
- Antolín, D.; Medrano, N.; Calvo, B.; Pérez, F. A Wearable Wireless Sensor Network for Indoor Smart Environment Monitoring in Safety Applications. Sensors 2017, 17, 365. [Google Scholar] [CrossRef]
- Dieffenderfer, J.; Goodell, H.; Mills, S.; McKnight, M.; Yao, S.; Lin, F.; Beppler, E.; Bent, B.; Lee, B.; Misra, V.; et al. Low-Power Wearable Systems for Continuous Monitoring of Environment and Health for Chronic Respiratory Disease. IEEE J. Biomed. Health Inform. 2016, 20, 1251–1264. [Google Scholar] [CrossRef]
- Tian, R.; Dierk, C.; Myers, C.; Paulos, E. MyPart. In Proceedings of the 2016 CHI Conference on Human Factors in Computing Systems, San Jose, CA, USA, 7–12 May 2016. [Google Scholar]
- Nakayoshi, M.; Kanda, M.; Shi, R.; De Dear, R. Outdoor thermal physiology along human pathways: A study using a wearable measurement system. Int. J. Biometeorol. 2015, 59, 503–515. [Google Scholar] [CrossRef]
- Bales, E.; Nikzad, N.; Quick, N.; Ziftci, C.; Patrick, K.; Griswold, W. Citisense: Mobile Air Quality Sensing for Individuals and Communities. Design and deployment of the Citisense mobile air-quality system. In Proceedings of the 6th International Conference on Pervasive Computing Technologies for Healthcare, San Diego, CA, USA, 21–24 May 2012. [Google Scholar]
- Shum, L.V.; Rajalakshmi, P.; Afonja, A.; McPhillips, G.; Binions, R.; Cheng, L.; Hailes, S. On the Development of a Sensor Module for Real-Time Pollution Monitoring. In Proceedings of the 2011 International Conference on Information Science and Applications, Jeju Island, Korea, 26–29 April 2010. [Google Scholar]
- Volckens, J.; Quinn, C.; Leith, D.; Mehaffy, J.; Henry, C.; Miller-Lionberg, D. Development and evaluation of an ultrasonic personal aerosol sampler. Indoor Air 2016, 27, 409–416. [Google Scholar] [CrossRef] [PubMed]
- Butca, C.G.; Suciu, G.; Ochian, A.; Fratu, O.; Halunga, S. Wearable sensors and cloud platform for monitoring environmental parameters in e-health applications. In Proceedings of the 2014 11th International Symposium on Electronics and Telecommunications (ISETC), Timisoara, Romania, 14–15 November 2014. [Google Scholar]
- U.S. Environmental Protection Agency, Indoor Air Quality—Building Assessment Survey and Evaluation (BASE) Study. Available online: http://www.epa.gov/iaq/base/index.html (accessed on 9 June 2021).
- US EPA, OAR, ORIA, Volatile Organic Compounds’ Impact on Indoor Air Quality, Epa. (2018) 1. Available online: https://www.epa.gov/indoor-air-quality-iaq/volatile-organic-compounds-impact-indoor-air-quality (accessed on 9 June 2021).
- Rajapakse, M.Y.; Borras, E.; Fung, A.G.; Yeap, D.; McCartney, M.M.; Fabia, F.M.; Kenyon, N.J.; Davis, C.E. An environmental air sampler to evaluate personal exposure to volatile organic compounds. Analyst 2021, 146, 636–645. [Google Scholar] [CrossRef] [PubMed]
- Fung, A.G.; Rajapakse, M.Y.; McCartney, M.; Falcon, A.K.; Fabia, F.M.; Kenyon, N.J.; Davis, C.E. Wearable Environmental Monitor To Quantify Personal Ambient Volatile Organic Compound Exposures. ACS Sens. 2019, 4, 1358–1364. [Google Scholar] [CrossRef] [PubMed]
- Kim, S.; Paulos, E.; Gross, M.D. WearAir. In Proceedings of the Fourth International Conference on Animal-Computer Interaction, Cambridge, MA, USA, 24–27 January 2010. [Google Scholar]
- Tsow, F.; Forzani, E.; Rai, A.; Wang, R.; Tsui, R.; Mastroianni, S.; Knobbe, C.; Gandolfi, A.J.; Tao, N.J. A Wearable and Wireless Sensor System for Real-Time Monitoring of Toxic Environmental Volatile Organic Compounds. IEEE Sens. J. 2009, 9, 1734–1740. [Google Scholar] [CrossRef]
- Deng, Y.; Chen, C.; Xian, X.; Tsow, F.; Verma, G.; McConnell, R.; Fruin, S.; Tao, N.; Forzani, E.S. A Novel Wireless Wearable Volatile Organic Compound (VOC) Monitoring Device with Disposable Sensors. Sensors 2016, 16, 2060. [Google Scholar] [CrossRef]
- Chen, C.; Tsow, F.; Xian, X.; Forzani, E.; Tao, N.; Tsui, R. A Wearable Sensing System for Assessment of Exposures to Environmental Volatile Organic Compounds. Adv. Struct. Saf. Stud. 2015, 1256, 201–211. [Google Scholar] [CrossRef]
- Mallires, K.R.; Wang, D.; Tipparaju, V.V.; Tao, N. Developing a Low-Cost Wearable Personal Exposure Monitor for Studying Respiratory Diseases Using Metal—Oxide Sensors. IEEE Sens. J. 2019, 19, 8252–8261. [Google Scholar] [CrossRef]
- Cho, H. Design and Implementation of a Wearable Environmental Monitoring System. In Proceedings of the 2015 Workshop on ns-3, Florence, Italy, 18 May 2015. [Google Scholar]
- Agency, E.P. Particulate Matter (PM) Pollution, Webpage. (2018) 1. Available online: https://www.epa.gov/pm-pollution/particulate-matter-pm-basics#PM (accessed on 9 June 2021).
- Pillarisetti, A.; Carter, E.; Rajkumar, S.; Young, B.N.; Benka-Coker, M.L.; Peel, J.L.; Johnson, M.; Clark, M. Measuring personal exposure to fine particulate matter (PM2.5) among rural Honduran women: A field evaluation of the Ultrasonic Personal Aerosol Sampler (UPAS). Environ. Int. 2019, 123, 50–53. [Google Scholar] [CrossRef]
- Kao, M.C.; Lung, S.C. Personal particulate exposures in Buddhist temples. Chin. J. Public Health 2000, 19, 138–143. [Google Scholar] [CrossRef]
- Hojaiji, H.; Goldstein, O.; King, C.E.; Sarrafzadeh, M.; Jerrett, M. Design and calibration of a wearable and wireless research grade air quality monitoring system for real-time data collection. In Proceedings of the 2017 IEEE Global Humanitarian Technology Conference (GHTC), San Jose, CA, USA, 19–22 October 2017. [Google Scholar]
- Assimakopoulos, V.; Bekiari, T.; Pateraki, S.; Maggos, T.; Stamatis, P.; Nicolopoulou, P.; Assimakopoulos, M. Assessing personal exposure to PM using data from an integrated indoor-outdoor experiment in Athens-Greece. Sci. Total Environ. 2018, 636, 1303–1320. [Google Scholar] [CrossRef]
- Gilliland, J.; Maltby, M.; Xu, X.; Luginaah, I.; Loebach, J.; Shah, T. Is active travel a breath of fresh air? Examining children’s exposure to air pollution during the school commute. Spat. Spatio-Temporal Epidemiol. 2019, 29, 51–57. [Google Scholar] [CrossRef]
- Tonne, C.; Salmon, M.; Sanchez, M.; Sreekanth, V.; Bhogadi, S.; Sambandam, S.; Balakrishnan, K.; Kinra, S.; Marshall, J.D. Integrated assessment of exposure to PM2.5 in South India and its relation with cardiovascular risk: Design of the CHAI observational cohort study. Int. J. Hyg. Environ. Health 2017, 220, 1081–1088. [Google Scholar] [CrossRef]
- Milà, C.; Salmon, M.; Sanchez, M.; Ambrós, A.; Bhogadi, S.; Sreekanth, V.; Nieuwenhuijsen, M.; Kinra, S.; Marshall, J.D.; Tonne, C. When, Where, and What? Characterizing Personal PM2.5Exposure in Periurban India by Integrating GPS, Wearable Camera, and Ambient and Personal Monitoring Data. Environ. Sci. Technol. 2018, 52, 13481–13490. [Google Scholar] [CrossRef] [Green Version]
- Yang, B.; Castell, N.; Pei, J.; Du, Y.; Gebremedhin, A.; Kirkevold, Ø. Towards Crowd-Sourced Air Quality and Physical Activity Monitoring by a Low-Cost Mobile Platform. Comput. Vis. 2016, 9677, 451–463. [Google Scholar] [CrossRef]
- Chew, R.; Thornburg, J.; Jack, D.; Smith, C.; Yang, Q.; Chillrud, S. Identification of Bicycling Periods Using the MicroPEM Personal Exposure Monitor. Sensors 2019, 19, 4613. [Google Scholar] [CrossRef] [Green Version]
- US EPA, Nitrogen Dioxide (NO2) Pollution, United States Environ. Prot. Agency. (2017) 1. Available online: https://www.epa.gov/no2-pollution/basic-information-about-no2#Effects (accessed on 9 June 2021).
- US EPA, Carbon Monoxide (CO) Pollution in Outdoor Air, 19 January 2017 Web Snapshot. 2020. Available online: https://www.epa.gov/co-pollution (accessed on 9 June 2021).
- Saoutieff, E.; Polichetti, T.; Jouanet, L.; Faucon, A.; Vidal, A.; Pereira, A.; Boisseau, S.; Ernst, T.; Miglietta, M.; Alfano, B.; et al. A Wearable Low-Power Sensing Platform for Environmental and Health Monitoring: The Convergence Project. Sensors 2021, 21, 1802. [Google Scholar] [CrossRef]
- Haghi, M.; Geissler, A.; Fleischer, H.; Stoll, N.; Thurow, K. Ubiqsense: A Personal Wearable in Ambient Parameters Monitoring based on IoT Platform. In Proceedings of the 2019 International Conference on Sensing and Instrumentation in IoT Era (ISSI), Lisbon, Portugal, 29–30 August 2019. [Google Scholar]
- Haghi, M.; Thurow, K.; Stoll, N. A multi-layer multi-sensor wearable device for physical and chemical environmental parameters monitoring (CO & NO2). In Proceedings of the 2017 International Conference on Information and Digital Technologies (IDT), Zilina, Slovakia, 5–7 July 2017. [Google Scholar]
- Serbanescu, M.; Placinta, V.M.; Hutanu, O.E.; Ravariu, C. Smart, low power, wearable multi-sensor data acquisition system for environmental monitoring. In Proceedings of the 2017 10th International Symposium on Advanced Topics in Electrical Engineering (ATEE), Bucharest, Romania, 23–25 March 2017. [Google Scholar]
- Wu, F.; Rüdiger, C.; Redouté, J.-M.; Yuce, M.R. A Wearable Multi-sensor IoT Network System for Environmental Monitoring. In Advances in Body Area Networks; Springer: Cham, Switzerland, 2018; pp. 29–38. [Google Scholar]
- Wu, F.; Rudiger, C.; Redoute, J.-M.; Yuce, M.R. WE-Safe: A wearable IoT sensor node for safety applications via LoRa. In Proceedings of the 2018 IEEE 4th World Forum on Internet of Things (WF-IoT); Institute of Electrical and Electronics Engineers (IEEE), Singapore, 5–8 February 2018. [Google Scholar]
- Sempionatto, J.R.; Mishra, R.K.; Martín, A.; Tang, G.; Nakagawa, T.; Lu, X.; Campbell, A.S.; Lyu, K.M.; Wang, J. Wearable Ring-Based Sensing Platform for Detecting Chemical Threats. ACS Sensors 2017, 2, 1531–1538. [Google Scholar] [CrossRef] [Green Version]
- Sound Pressure Level Extension. Available online: https://gldias.github.io/extensions/SoundPressureLevel/SoundPressureLevel_Devel (accessed on 9 June 2021).
- MIT App Inventor: Sensor Components. Available online: http://ai2.appinventor.mit.edu/reference/components/sensors.html (accessed on 9 June 2021).
- Tsiastoudis, D.; Polatoglou, H. Inclusive education on stem subjects with the arduino platform. In Proceedings of the 8th International Conference on Software Development and Technologies for Enhancing Accessibility and Fighting Info-exclusion, Thessaloniki, Greece, 20–22 June 2018. [Google Scholar]
- Vidal-Silva, C.; Serrano-Malebran, J.; Pereira, F. Scratch and Arduino for Effectively Developing Programming and Computing-Electronic Competences in Primary School Children. In Proceedings of the 2019 38th International Conference of the Chilean Computer Science Society (SCCC), Concepcion, Chile, 4–9 November 2019. [Google Scholar]
- Khalsa, S.B.; Jewett, M.E.; Cajochen, C.; Czeisler, C.A. A Phase Response Curve to Single Bright Light Pulses in Human Subjects. J. Physiol. 2003, 549, 945–952. [Google Scholar] [CrossRef]


Publisher’s Note: MDPI stays neutral with regard to jurisdictional claims in published maps and institutional affiliations. |
© 2021 by the authors. Licensee MDPI, Basel, Switzerland. This article is an open access article distributed under the terms and conditions of the Creative Commons Attribution (CC BY) license (https://creativecommons.org/licenses/by/4.0/).
Share and Cite
Salamone, F.; Masullo, M.; Sibilio, S. Wearable Devices for Environmental Monitoring in the Built Environment: A Systematic Review. Sensors 2021, 21, 4727. https://doi.org/10.3390/s21144727
Salamone F, Masullo M, Sibilio S. Wearable Devices for Environmental Monitoring in the Built Environment: A Systematic Review. Sensors. 2021; 21(14):4727. https://doi.org/10.3390/s21144727
Chicago/Turabian StyleSalamone, Francesco, Massimiliano Masullo, and Sergio Sibilio. 2021. "Wearable Devices for Environmental Monitoring in the Built Environment: A Systematic Review" Sensors 21, no. 14: 4727. https://doi.org/10.3390/s21144727