
Heart Rate Variability in Psychology: A Review of HRV Indices and an Analysis Tutorial


Abstract
:1. Heart Rate Variability for Psychologists: A Review of HRV Metrics and an Analysis Tutorial
2. HRV Indices
3. Time-Domain Analysis
4. Deviation-Based Indices
5. Difference-Based Indices
6. Geometric Indices
7. Frequency-Domain Analysis
8. Time-Frequency Methods of Analysis
9. Non-Linear Dynamics
10. Poincaré Plot
11. Entropy
12. Fractal Measures
13. Respiratory Sinus Arrhythmia (RSA)
14. HRV in Psychological Research
15. HRV and Self-Control
16. HRV and Psychopathology
17. HRV as a Therapeutic Target
18. HRV in Practice: A Tutorial Using Python
19. Data Preprocessing
# Load data
import neurokit2 as nk
data_all = nk.data(‘https://raw.githubusercontent.com/neuropsychology/NeuroKit/dev/data/bio_resting_8min_200hz.json’)
data_participant = data_all[“S01”] # Access the data of the first participant

# Clean signal
clean_signals, info = nk.bio_process(ecg=data_participant[“ECG”],
 rsp=data_participant[“RSP”],
 sampling_rate=200)

# Show the location of the fist 5 R-peaks
info[“ECG_R_Peaks”][0:5]

## array([165, 345, 506, 672, 838])
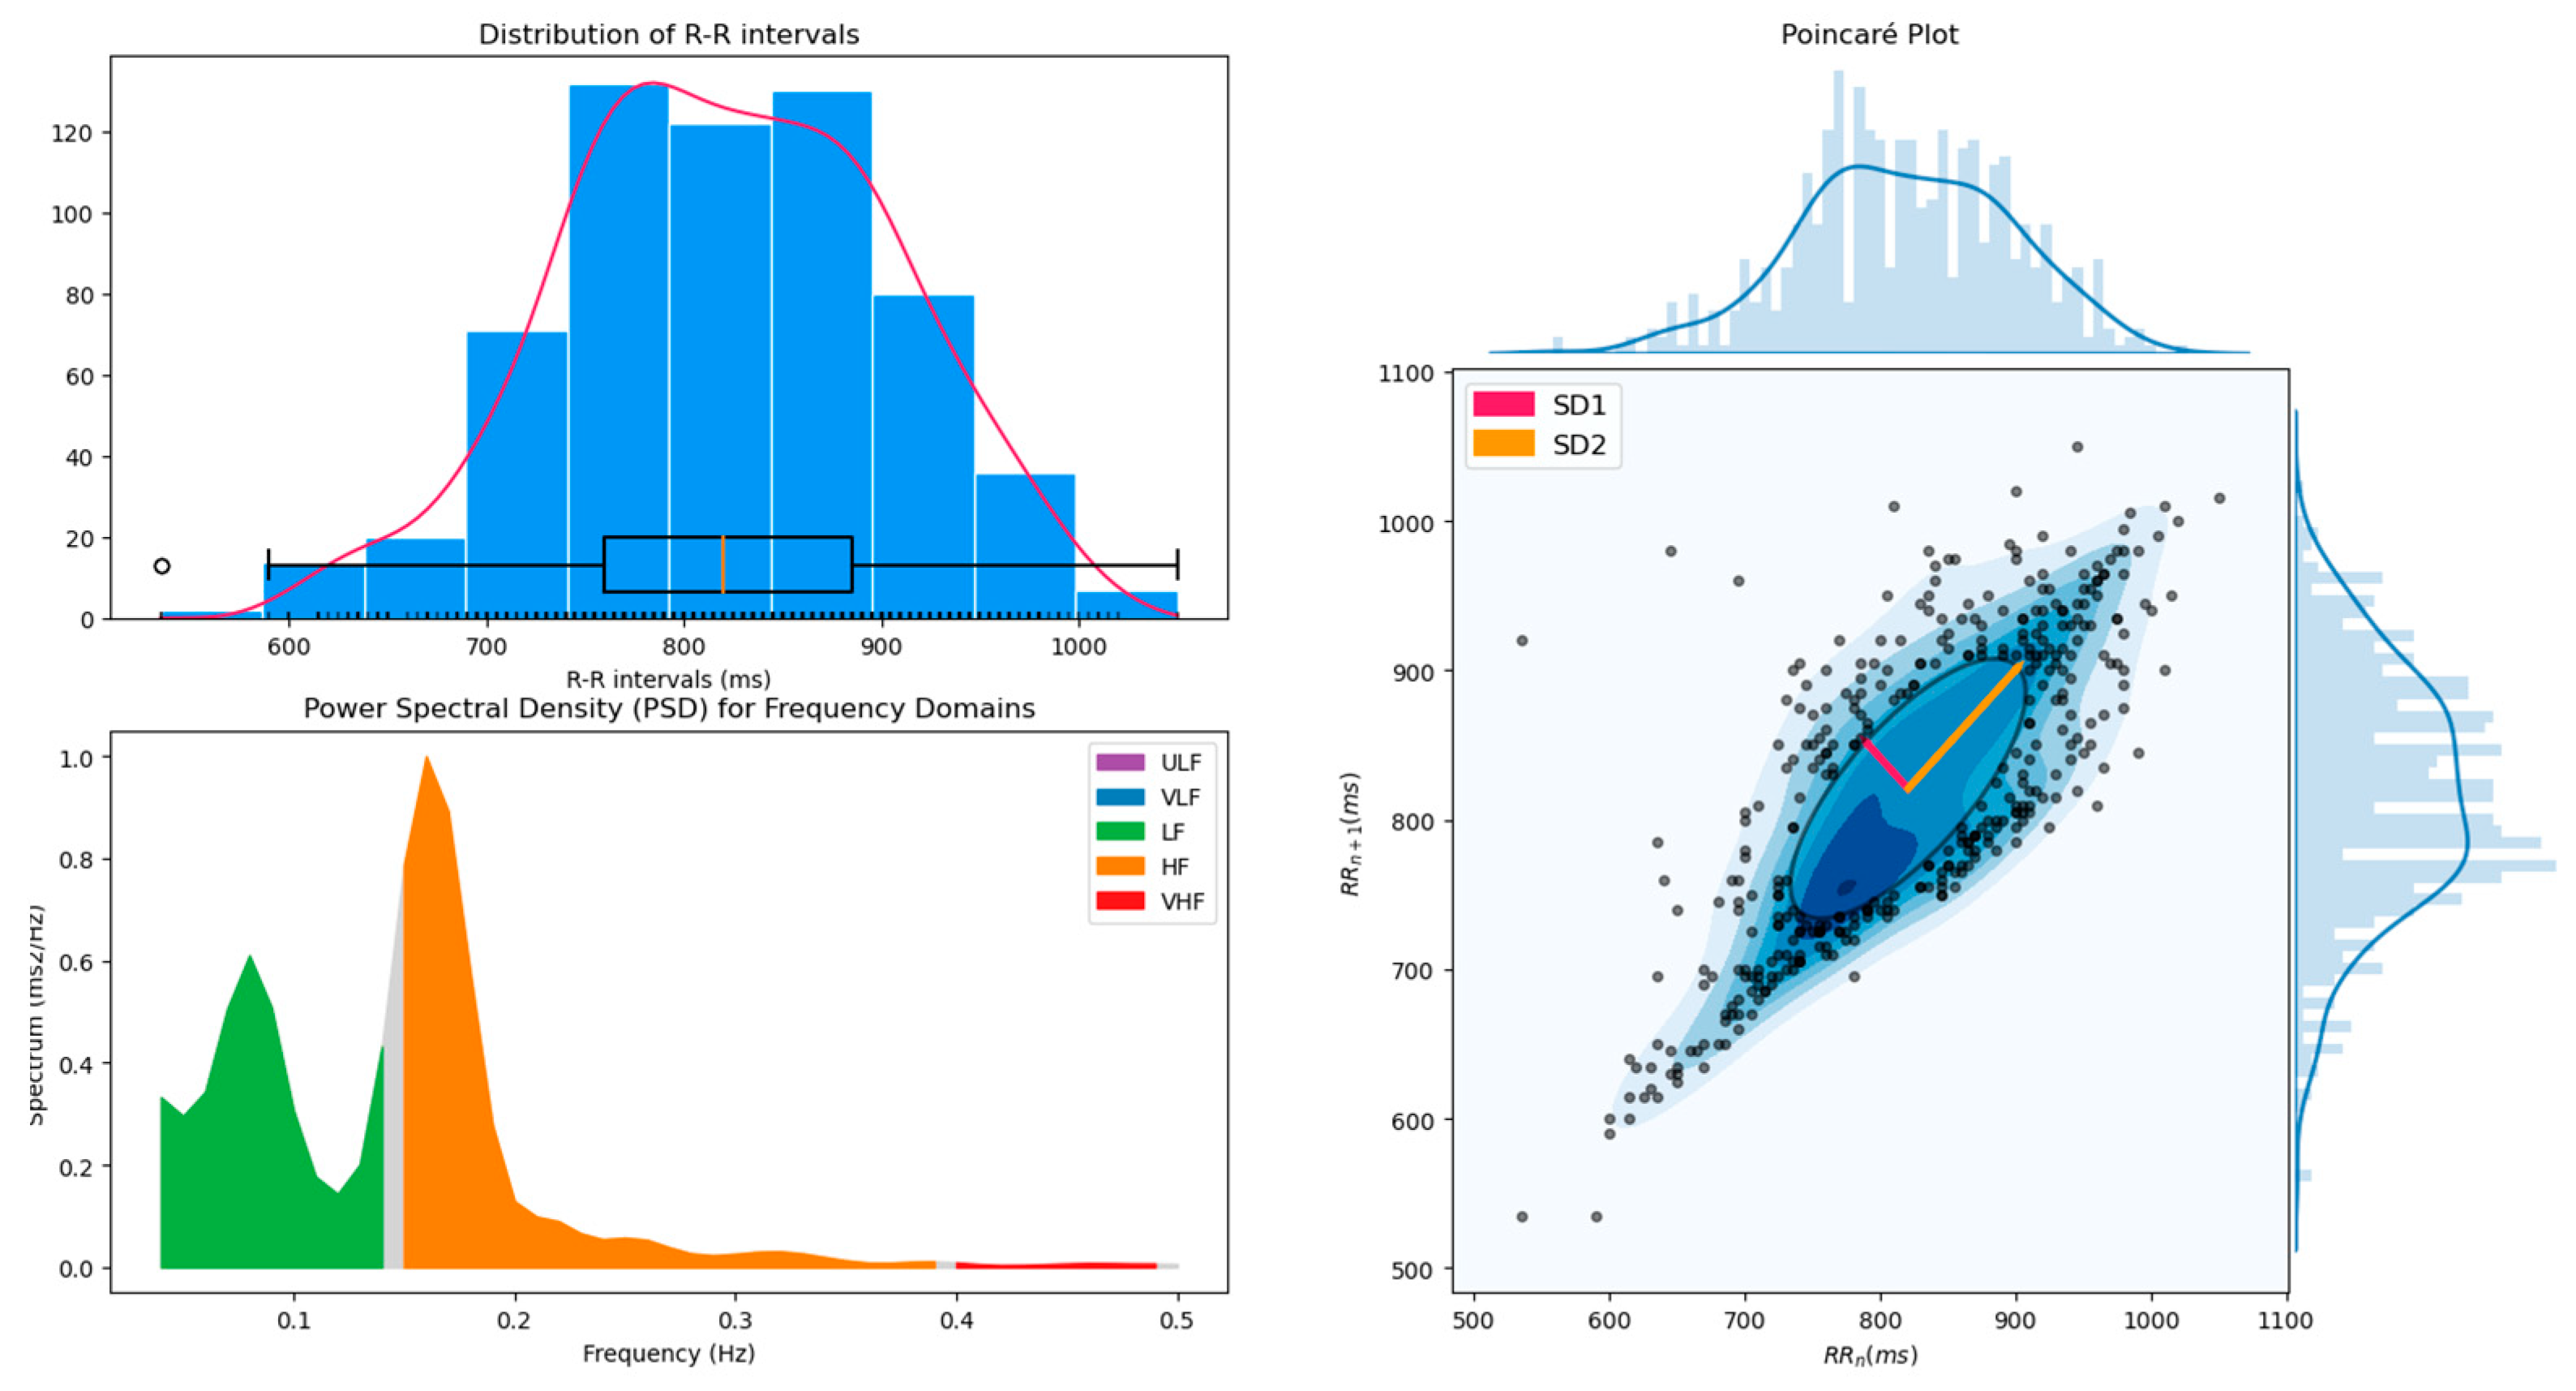
20. HRV Analysis
# Compute all HRV indices and show plots

nk.hrv(info, sampling_rate=200, show=True)
21. Multiple Participants Analysis
# Load data and create list of participants
data_all = nk.data(‘https://raw.githubusercontent.com/neuropsychology/NeuroKit/dev/data/bio_resting_8min_200hz.json’)

list_participants = [“S01”, “S02”, “S03”, “S04”]

# Loop through participants’ names
for participant in list_participants:

 # Get data of current participant
 data_participant = data_all[participant]

 # Clean signal
 clean_signals, info = nk.bio_process(ecg=data_participant[“ECG”],
 rsp=data_participant[“RSP”],
 sampling_rate=200)

 # Compute HRV indices
 results = nk.hrv(info, sampling_rate=200, show=False)

 # Add “Participant” column
 results[“Participant”] = participant

 # If participant is not the first, then append the data
 if participant == “S01”:
 results_all = results
 else:
 results_all = results_all.append(results)
22. Conclusions
Author Contributions
Funding
Institutional Review Board Statement
Informed Consent Statement
Data Availability Statement
Conflicts of Interest
References
- Selye, H. The Stress of Life; Mc Gran-Hill Book Company Inc.: New York, NY, USA, 1956. [Google Scholar]
- Lombardi, F.; Malliani, A.; Pagani, M.; Cerutti, S. Heart Rate Variability and Its Sympatho-Vagal Modulation. Cardiovasc. Res. 1996, 32, 208–216. [Google Scholar] [CrossRef]
- Vila, J.; Guerra, P.; Muñoz, M.A.; Vico, C.; Jesús, M.I.V.-D.; Delgado, L.C.; Perakakis, P.; Kley, E.; Mata, J.L.; Rodríguez, S. Cardiac defense: From attention to action. Int. J. Psychophysiol. 2007, 66, 169–182. [Google Scholar] [CrossRef] [PubMed]
- Obrist, P.A. Cardiovascular Psychophysiology: A Perspective; Springer Science & Business Media: New York, NY, USA, 2012. [Google Scholar]
- Mccraty, R.; Shaffer, F. Heart Rate Variability: New Perspectives on Physiological Mechanisms, Assessment of Self-regulatory Capacity, and Health Risk. Glob. Adv. Heal. Med. 2015, 4, 46–61. [Google Scholar] [CrossRef] [PubMed] [Green Version]
- Tsuji, H.; Larson, M.G.; Venditti, F.J.; Manders, E.S.; Evans, J.C.; Feldman, C.L.; Levy, D. Impact of Reduced Heart Rate Variability on Risk for Cardiac Events: The Framingham Heart Study. Circulation 1996, 94, 2850–2855. [Google Scholar] [CrossRef]
- Ranpuria, R.; Hall, M.; Chan, C.T.; Unruh, M. Heart rate variability (HRV) in kidney failure: Measurement and consequences of reduced HRV. Nephrol. Dial. Transplant. 2007, 23, 444–449. [Google Scholar] [CrossRef] [Green Version]
- Taylor, C.B. Depression, heart rate related variables and cardiovascular disease. Int. J. Psychophysiol. 2010, 78, 80–88. [Google Scholar] [CrossRef]
- Thayer, J.F.; Yamamoto, S.S.; Brosschot, J.F. The relationship of autonomic imbalance, heart rate variability and cardiovascular disease risk factors. Int. J. Cardiol. 2010, 141, 122–131. [Google Scholar] [CrossRef]
- Ziemssen, T.; Siepmann, T. The Investigation of the Cardiovascular and Sudomotor Autonomic Nervous System—A Review. Front. Neurol. 2019, 10, 53. [Google Scholar] [CrossRef] [Green Version]
- Tulen, J.; Bruijn, J.; de Man, K.; van der Velden, E.; Pepplinkhuizen, L.; Veld, A. ’T Anxiety and autonomic regulation in major depressive disorder: An exploratory study. J. Affect. Disord. 1996, 40, 61–71. [Google Scholar] [CrossRef] [Green Version]
- Stein, P.K.; Carney, R.M.; E Freedland, K.; A Skala, J.; Jaffe, A.S.; E Kleiger, R.; Rottman, J.N. Severe depression is associated with markedly reduced heart rate variability in patients with stable coronary heart disease. J. Psychosom. Res. 2000, 48, 493–500. [Google Scholar] [CrossRef]
- Agelink, M.W.; Boz, C.; Ullrich, H.; Andrich, J. Relationship Between Major Depression and Heart Rate Variability.: Clinical Consequences and Implications for Antidepressive Treatment. Psychiatry Res. 2002, 113, 139–149. [Google Scholar] [CrossRef]
- Kemp, A.H.; Quintana, D.S.; Gray, M.A.; Felmingham, K.L.; Brown, K.; Gatt, J.M. Impact of Depression and Antidepressant Treatment on Heart Rate Variability: A Review and Meta-Analysis. Biol. Psychiatry 2010, 67, 1067–1074. [Google Scholar] [CrossRef]
- Kemp, A.H.; Quintana, D.S.; Felmingham, K.L.; Matthews, S.; Jelinek, H.F. Depression, Comorbid Anxiety Disorders, and Heart Rate Variability in Physically Healthy, Unmedicated Patients: Implications for Cardiovascular Risk. PLoS ONE 2012, 7, e30777. [Google Scholar] [CrossRef]
- Gaebler, M.; Daniels, J.K.; Lamke, J.-P.; Fydrich, T.; Walter, H. Heart Rate Variability and Its Neural Correlates During Emotional Face Processing in Social Anxiety Disorder. Biol. Psychol. 2013, 94, 319–330. [Google Scholar] [CrossRef]
- Chalmers, J.A.; Quintana, D.S.; Abbott, M.J.; Kemp, A.H. Anxiety Disorders Are Associated with Reduced Heart Rate Variability: A Meta-Analysis. Front. Psychiatry 2014, 5, 80. [Google Scholar] [CrossRef] [Green Version]
- Force, T. Standards of Measurement, Physiological Interpretation and Clinical Use. Task Force of the European Society of Cardiology and the North American Society of Pacing and Electrophysiology. Circulation 1996, 93, 1043–1065. [Google Scholar]
- Shaffer, F.; McCraty, R.; Zerr, C.L. A healthy heart is not a metronome: An integrative review of the heart’s anatomy and heart rate variability. Front. Psychol. 2014, 5, 1040. [Google Scholar] [CrossRef] [Green Version]
- Shaffer, F.; Ginsberg, J. An Overview of Heart Rate Variability Metrics and Norms. Front. Public Health 2017, 5, 258. [Google Scholar] [CrossRef] [Green Version]
- Berntson, G.G.; Bigger, J.T.; Eckberg, D.L.; Grossman, P.; Kaufmann, P.G.; Malik, M.; Nagaraja, H.N.; Porges, S.W.; Saul, J.P.; Stone, P.H.; et al. Heart rate variability: Origins, methods, and interpretive caveats. Psychophysiology 1997, 34, 623–648. [Google Scholar] [CrossRef]
- Yaroslavsky, I.; Bylsma, L.M.; Rottenberg, J.; Kovacs, M. Combinations of Resting RSA and RSA Reactivity Impact Maladaptive Mood Repair and Depression Symptoms. Biol. Psychol. 2013, 94, 272–281. [Google Scholar] [CrossRef] [Green Version]
- Lewis, G.F.; Furman, S.A.; McCool, M.F.; Porges, S.W. Statistical Strategies to Quantify Respiratory Sinus Arrhythmia: Are Commonly Used Metrics Equivalent? Biol. Psychol. 2012, 89, 349–364. [Google Scholar] [CrossRef] [Green Version]
- Bigger Jr, J.T.; Albrecht, P.; Steinman, R.C.; Rolnitzky, L.M.; Fleiss, J.L.; Cohen, R.J. Comparison of Time-and Frequency Domain-Based Measures of Cardiac Parasympathetic Activity in Holter Recordings After Myocardial Infarction. Am. J. Cardiol. 1989, 64, 536–538. [Google Scholar] [CrossRef]
- Fei, L.; Copie, X.; Malik, M.; Camm, A.J. Short-and Long-Term Assessment of Heart Rate Variability for Risk Stratification After Acute Myocardial Infarction. Am. J. Cardiol. 1996, 77, 681–684. [Google Scholar] [CrossRef]
- Nolan, J.; Batin, P.D.; Andrews, R.; Lindsay, S.J.; Brooksby, P.; Mullen, M.; Baig, W.; Flapan, A.D.; Cowley, A.; Prescott, R.J.; et al. Prospective Study of Heart Rate Variability and Mortality in Chronic Heart Failure: Results of the United Kingdom Heart Failure Evaluation and Assessment of Risk Trial (UK-Heart). Circulation 1998, 98, 1510–1516. [Google Scholar] [CrossRef] [PubMed] [Green Version]
- Kleiger, R.E.; Stein, P.K.; Bigger Jr, J.T. Heart Rate Variability: Measurement and Clinical Utility. Ann. Noninvasive Electrocardiol. 2005, 10, 88–101. [Google Scholar] [CrossRef] [PubMed]
- Schroeder, E.B.; Whitsel, E.A.; Evans, G.W.; Prineas, R.J.; Chambless, L.E.; Heiss, G. Repeatability of Heart Rate Variability Measures. J. Electrocardiol. 2004, 37, 163–172. [Google Scholar] [CrossRef] [PubMed]
- McNames, J.; Aboy, M. Reliability and Accuracy of Heart Rate Variability Metrics Versus ECG Segment Duration. Med. Biol. Eng. Comput. 2006, 44, 747–756. [Google Scholar] [CrossRef]
- Salahuddin, L.; Cho, J.; Jeong, M.G.; Kim, D. Ultra short term analysis of heart rate variability for monitoring mental stress in mobile settings. In Proceedings of the 29th Annual International Conference of the IEEE Engineering in Medicine and Biology Society, Lyon, France, 23–26 August 2007; pp. 4656–4659. [Google Scholar]
- Nussinovitch, U.; Elishkevitz, K.P.; Katz, K.; Nussinovitch, M.; Segev, S.; Volovitz, B.; Nussinovitch, N. Reliability of Ultra-Short ECG Indices for Heart Rate Variability. Ann. Noninvasive Electrocardiol. 2011, 16, 117–122. [Google Scholar] [CrossRef]
- Munoz, M.L.; van Roon, A.; Riese, H.; Thio, C.; Oostenbroek, E.; Westrik, I.; de Geus, E.J.; Gansevoort, R.; Lefrandt, J.; Nolte, I.M.; et al. Validity of (Ultra-) Short Recordings for Heart Rate Variability Measurements. PLoS ONE 2015, 10, e0138921. [Google Scholar] [CrossRef] [Green Version]
- Baek, H.J.; Cho, C.-H.; Cho, J.; Woo, J. Reliability of Ultra-Short-Term Analysis as a Surrogate of Standard 5-Min Analysis of Heart Rate Variability. Telemed. e-Health 2015, 21, 404–414. [Google Scholar] [CrossRef]
- Castaldo, R.; Montesinos, L.; Melillo, P.; James, C.; Pecchia, L. Ultra-short term HRV features as surrogates of short term HRV: A case study on mental stress detection in real life. BMC Med. Inform. Decis. Mak. 2019, 19, 1–13. [Google Scholar] [CrossRef] [Green Version]
- Hon, E.H.; Lee, S.T. ELECTRONIC EVALUATION OF THE FETAL HEART RATE. VIII. PATTERNS PRECEDING FETAL DEATH, FURTHER OBSERVATIONS. Am. J. Obstet. Gynecol. 1963, 87, 814–826. [Google Scholar]
- Akselrod, S.; Gordon, D.; Ubel, F.A.; Shannon, D.C.; Berger, A.; Cohen, R.J. Power Spectrum Analysis of Heart Rate Fluctuation: A Quantitative Probe of Beat-to-Beat Cardiovascular Control. Science 1981, 213, 220–222. [Google Scholar] [CrossRef]
- Cohen, L. Time-frequency distributions-a review. In Proceedings of the IEEE; Institute of Electrical and Electronics Engineers (IEEE): Piscataway, NJ, USA, 1989; Volume 77, pp. 941–981. [Google Scholar]
- Goldberger, A.L.; West, B.J. Applications of Nonlinear Dynamics to Clinical Cardiology. Ann. New York Acad. Sci. 1987, 504, 195–213. [Google Scholar] [CrossRef]
- Denton, T.A.; Diamond, G.A.; Helfant, R.H.; Khan, S.; Karagueuzian, H. Fascinating rhythm: A primer on chaos theory and its application to cardiology. Am. Heart J. 1990, 120, 1419–1440. [Google Scholar] [CrossRef]
- Bigger Jr, J.T.; Steinman, R.C.; Rolnitzky, L.M.; Fleiss, J.L.; Albrecht, P.; Cohen, R.J. Power Law Behavior of RR-Interval Variability in Healthy Middle-Aged Persons, Patients with Recent Acute Myocardial Infarction, and Patients with Heart Transplants. Circulation 1996, 93, 2142–2151. [Google Scholar] [CrossRef]
- Lombardi, F.; Sandrone, G.; Mortara, A.; Torzillo, D.; La Rovere, M.T.; Signorini, M.G.; Cerutti, S.; Malliani, A. Linear and nonlinear dynamics of heart rate variability after acute myocardial infarction with normal and reduced left ventricular ejection fraction. Am. J. Cardiol. 1996, 77, 1283–1288. [Google Scholar] [CrossRef]
- Huikuri, H.V.; Mäkikallio, T.H.; Perkiömäki, J. Measurement of heart rate variability by methods based on nonlinear dynamics. J. Electrocardiol. 2003, 36, 95–99. [Google Scholar] [CrossRef]
- Bassingthwaighte, J.B.; Liebovitch, L.S.; West, B.J.; Stanley, H.E. Fractal Physiology. Phys. Today 1995, 48, 66. [Google Scholar] [CrossRef]
- Acharya, U.R.; Joseph, K.P.; Kannathal, N.; Lim, C.M.; Suri, J.S. Heart rate variability: A review. Med Biol. Eng. Comput. 2006, 44, 1031–1051. [Google Scholar] [CrossRef]
- Abdi, H.; Salkind, N. Coefficient of Variation. Encycl. Res. Des. 2012, 1, 169–171. [Google Scholar] [CrossRef]
- Yılmaz, B.; Asyalı, M.H.; Arıkan, E.; Yetkin, S.; Özgen, F. Sleep stage and obstructive apneaic epoch classification using single-lead ECG. Biomed. Eng. Online 2010, 9, 39. [Google Scholar] [CrossRef] [Green Version]
- Almazaydeh, L.; Elleithy, K.; Faezipour, M. Obstructive sleep apnea detection using SVM-based classification of ECG signal features. In Proceedings of the 2012 Annual International Conference of the IEEE Engineering in Medicine and Biology Society, San Diego, CA, USA, 28 August–1 September 2012; pp. 4938–4941. [Google Scholar]
- Ciccone, A.B.; Siedlik, J.A.; Wecht, J.M.; Deckert, J.A.; Nguyen, N.D.; Weir, J.P. Reminder: RMSSD and SD1 are identical heart rate variability metrics. Muscle Nerve 2017, 56, 674–678. [Google Scholar] [CrossRef]
- Esco, M.R.; Flatt, A.A. Ultra-Short-Term Heart Rate Variability Indexes at Rest and Post-Exercise in Athletes: Evaluating the Agreement with Accepted Recommendations. J. Sports Sci. Med. 2014, 13, 535–541. [Google Scholar]
- Malik, M.; Xia, R.; Odemuyiwa, O.; Staunton, A.; Poloniecki, J.; Camm, A.J. Influence of the recognition artefact in automatic analysis of long-term electrocardiograms on time-domain measurement of heart rate variability. Med Biol. Eng. Comput. 1993, 31, 539–544. [Google Scholar] [CrossRef]
- Jovic, A.; Bogunovic, N. Electrocardiogram analysis using a combination of statistical, geometric, and nonlinear heart rate variability features. Artif. Intell. Med. 2011, 51, 175–186. [Google Scholar] [CrossRef]
- Seyd, P.A.; Ahamed, V.T.; Jacob, J.; Joseph, P. Time and frequency domain analysis of heart rate variability and their correlations in diabetes mellitus. Int. J. Biol. Life Sci. 2008, 4, 24–27. [Google Scholar]
- Goldstein, D.S.; Bentho, O.; Park, M.-Y.; Sharabi, Y. Low-frequency power of heart rate variability is not a measure of cardiac sympathetic tone but may be a measure of modulation of cardiac autonomic outflows by baroreflexes. Exp. Physiol. 2011, 96, 1255–1261. [Google Scholar] [CrossRef]
- Billman, G.E. The LF/HF ratio does not accurately measure cardiac sympatho-vagal balance. Front. Physiol. 2013, 4, 26. [Google Scholar] [CrossRef] [Green Version]
- Takabatake, N.; Nakamura, H.; Minamihaba, O.; Inage, M.; Inoue, S.; Kagaya, S.; Yamaki, M.; Tomoike, H. A novel pathophysiologic phenomenon in cachexic patients with chronic obstructive pulmonary disease: The relationship between the circadian rhythm of circulating leptin and the very low-frequency component of heart rate variability. Am. J. Respir. Crit. Care Med. 2001, 163, 1314–1319. [Google Scholar] [CrossRef]
- Barrett, C.J.; Navakatikyan, M.A.; Malpas, S.C. Long-term control of renal blood flow: What is the role of the renal nerves? Am. J. Physiol. Integr. Comp. Physiol. 2001, 280, R1534–R1545. [Google Scholar] [CrossRef] [PubMed]
- Coenen, A.J.; Kitney, R.; Rompelman, O. Thermally elicited entertainment of heart rate variability [proceedings]. J. Physiol. 1977, 270, 5–6. [Google Scholar]
- Bouzida, N.; Bendada, A.; Maldague, X.P. Visualization of body thermoregulation by infrared imaging. J. Therm. Biol. 2009, 34, 120–126. [Google Scholar] [CrossRef]
- Machado, C.; Estevez, M.; Perez-Nellar, J.; Schiavi, A. Residual vasomotor activity assessed by heart rate variability in a brain-dead case. BMJ Case Rep. 2015, 2015. [Google Scholar] [CrossRef] [Green Version]
- Kim, K.K.; Kim, J.S.; Lim, Y.G.; Park, K.S. The effect of missing RR-interval data on heart rate variability analysis in the frequency domain. Physiol. Meas. 2009, 30, 1039–1050. [Google Scholar] [CrossRef]
- Malik, M.; Bigger, J.T.; Camm, A.J.; Kleiger, R.E.; Malliani, A.; Moss, A.J.; Schwartz, P.J. Heart rate variability: Standards of measurement, physiological interpretation, and clinical use. Eur. Heart J. 1996, 17, 354–381. [Google Scholar] [CrossRef] [Green Version]
- Burr, R.L. Interpretation of Normalized Spectral Heart Rate Variability Indices In Sleep Research: A Critical Review. Sleep 2007, 30, 913–919. [Google Scholar] [CrossRef] [Green Version]
- Cohen, L. Time-Frequency Analysis; Prentice Hall: Englewood Cliffs, NJ, USA, 1995; Volume 778. [Google Scholar]
- Elsenbruch, S.; Wang, Z.; Orr, W.C.; Chen, J.D.Z. Time-frequency analysis of heart rate variability using short-time Fourier analysis. Physiol. Meas. 2000, 21, 229–240. [Google Scholar] [CrossRef]
- Mainardi, L.T. On the quantification of heart rate variability spectral parameters using time–frequency and time-varying methods. Philos. Trans. R. Soc. A Math. Phys. Eng. Sci. 2009, 367, 255–275. [Google Scholar] [CrossRef]
- Voss, A.; Schulz, S.; Schroeder, R.; Baumert, M.; Caminal, P. Methods derived from nonlinear dynamics for analysing heart rate variability. Philos. Trans. R. Soc. A Math. Phys. Eng. Sci. 2008, 367, 277–296. [Google Scholar] [CrossRef]
- Henriques, T.; Ribeiro, M.; Teixeira, A.; Castro, L.; Antunes, L.; Costa-Santos, C. Nonlinear Methods Most Applied to Heart-Rate Time Series: A Review. Entropy 2020, 22, 309. [Google Scholar] [CrossRef] [Green Version]
- Brennan, M.; Palaniswami, M.; Kamen, P. Do existing measures of Poincare plot geometry reflect nonlinear features of heart rate variability? IEEE Trans. Biomed. Eng. 2001, 48, 1342–1347. [Google Scholar] [CrossRef]
- Brennan, M.; Palaniswami, M.; Kamen, P. Poincaré plot interpretation using a physiological model of HRV based on a network of oscillators. Am. J. Physiol. Circ. Physiol. 2002, 283, H1873–H1886. [Google Scholar] [CrossRef] [Green Version]
- Hsu, C.-H.; Tsai, M.-Y.; Huang, G.-S.; Lin, T.-C.; Chen, K.-P.; Ho, S.-T.; Shyu, L.-Y.; Li, C.-Y. Poincaré plot indexes of heart rate variability detect dynamic autonomic modulation during general anesthesia induction. Acta Anaesthesiol. Taiwanica 2012, 50, 12–18. [Google Scholar] [CrossRef]
- Woo, M.A.; Stevenson, W.G.; Moser, D.K.; Trelease, R.B.; Harper, R.M. Patterns of beat-to-beat heart rate variability in advanced heart failure. Am. Heart J. 1992, 123, 704–710. [Google Scholar] [CrossRef]
- Claudia, L.; Oscar, I.; Héctor, P.-G.; Marco, V.J. Poincaré plot indexes of heart rate variability capture dynamic adaptations after haemodialysis in chronic renal failure patients. Clin. Physiol. Funct. Imaging 2003, 23, 72–80. [Google Scholar] [CrossRef]
- Hoshi, R.A.; Pastre, C.M.; Vanderlei, L.C.M.; Godoy, M.F. Poincaré plot indexes of heart rate variability: Relationships with other nonlinear variables. Auton. Neurosci. 2013, 177, 271–274. [Google Scholar] [CrossRef]
- Koichubekov, B.; Riklefs, V.; Sorokina, M.; Korshukov, I.; Turgunova, L.; Laryushina, Y.; Bakirova, R.; Muldaeva, G.; Bekov, E.; Kultenova, M. Informative Nature and Nonlinearity of Lagged Poincaré Plots Indices in Analysis of Heart Rate Variability. Entropy 2017, 19, 523. [Google Scholar] [CrossRef] [Green Version]
- Delgado-Bonal, A.; Marshak, A. Approximate Entropy and Sample Entropy: A Comprehensive Tutorial. Entropy 2019, 21, 541. [Google Scholar] [CrossRef] [Green Version]
- Faes, L.; Gómez-Extremera, M.; Pernice, R.; Carpena, P.; Nollo, G.; Porta, A.; Bernaola-Galván, P. Comparison of methods for the assessment of nonlinearity in short-term heart rate variability under different physiopathological states. Chaos: Interdiscip. J. Nonlinear Sci. 2019, 29, 123114. [Google Scholar] [CrossRef] [Green Version]
- Pincus, S.M. Approximate entropy as a measure of system complexity. Proc. Natl. Acad. Sci. USA 1991, 88, 2297–2301. [Google Scholar] [CrossRef] [Green Version]
- Richman, J.S.; Moorman, J.R. Physiological time-series analysis using approximate entropy and sample entropy. Am. J. Physiol. Circ. Physiol. 2000, 278, H2039–H2049. [Google Scholar] [CrossRef] [Green Version]
- Costa, M.; Goldberger, A.L.; Peng, C.-K. Multiscale Entropy Analysis of Complex Physiologic Time Series. Phys. Rev. Lett. 2002, 89, 068102. [Google Scholar] [CrossRef] [Green Version]
- Al-Angari, H.M.; Sahakian, A.V. Use of Sample Entropy Approach to Study Heart Rate Variability in Obstructive Sleep Apnea Syndrome. IEEE Trans. Biomed. Eng. 2007, 54, 1900–1904. [Google Scholar] [CrossRef]
- Xie, H.-B.; He, W.-X.; Liu, H. Measuring time series regularity using nonlinear similarity-based sample entropy. Phys. Lett. A 2008, 372, 7140–7146. [Google Scholar] [CrossRef]
- Costa, M.; Peng, C.-K.; Goldberger, A.L.; Hausdorff, J.M. Multiscale entropy analysis of human gait dynamics. Phys. A Stat. Mech. Its Appl. 2003, 330, 53–60. [Google Scholar] [CrossRef]
- Costa, M.; Goldberger, A.L.; Peng, C.-K. Multiscale entropy analysis of biological signals. Phys. Rev. E 2005, 71, 021906. [Google Scholar] [CrossRef] [Green Version]
- Wu, S.-D.; Wu, C.-W.; Lin, S.-G.; Wang, C.-C.; Lee, K.-Y. Time Series Analysis Using Composite Multiscale Entropy. Entropy 2013, 15, 1069–1084. [Google Scholar] [CrossRef] [Green Version]
- Wu, S.-D.; Wu, C.-W.; Lin, S.-G.; Lee, K.-Y.; Peng, C.-K. Analysis of complex time series using refined composite multiscale entropy. Phys. Lett. A 2014, 378, 1369–1374. [Google Scholar] [CrossRef]
- Blons, E.; Arsac, L.M.; Gilfriche, P.; McLeod, H.; Lespinet-Najib, V.; Grivel, E.; Deschodt-Arsac, V. Alterations in heart-brain interactions under mild stress during a cognitive task are reflected in entropy of heart rate dynamics. Sci. Rep. 2019, 9, 1–10. [Google Scholar] [CrossRef]
- Deschodt-Arsac, V.; Blons, E.; Gilfriche, P.; Spiluttini, B.; Arsac, L.M. Entropy in Heart Rate Dynamics Reflects How HRV-Biofeedback Training Improves Neurovisceral Complexity during Stress-Cognition Interactions. Entropy 2020, 22, 317. [Google Scholar] [CrossRef] [PubMed] [Green Version]
- Chen, W.; Wang, Z.; Xie, H.; Yu, W. Characterization of Surface EMG Signal Based on Fuzzy Entropy. IEEE Trans. Neural Syst. Rehabil. Eng. 2007, 15, 266–272. [Google Scholar] [CrossRef] [PubMed]
- Liu, C.; Li, K.; Zhao, L.; Liu, F.; Zheng, D.; Liu, C.; Liu, S. Analysis of heart rate variability using fuzzy measure entropy. Comput. Biol. Med. 2013, 43, 100–108. [Google Scholar] [CrossRef] [PubMed]
- Humeau-Heurtier, A. The Multiscale Entropy Algorithm and Its Variants: A Review. Entropy 2015, 17, 3110–3123. [Google Scholar] [CrossRef] [Green Version]
- Castiglioni, P.; Di Rienzo, M. How the threshold “r” influences approximate entropy analysis of heart-rate variability. Comput. Cardiol. 2008, 561–564. [Google Scholar] [CrossRef]
- Graff, B.; Graff, G.; Kaczkowska, A. Entropy Measures of Heart Rate Variability for Short ECG Datasets in Patients with Congestive Heart Failure. Acta Phys. Pol. B Proc. Suppl. 2012, 5, 153–158. [Google Scholar] [CrossRef]
- Graff, B.; Graff, G.; Makowiec, D.; Kaczkowska, A.; Wejer, D.; Budrejko, S.; Kozlowski, D.; Narkiewicz, K. Entropy Measures in the Assessment of Heart Rate Variability in Patients with Cardiodepressive Vasovagal Syncope. Entropy 2015, 17, 1007–1022. [Google Scholar] [CrossRef] [Green Version]
- Mayer, C.C.; Bachler, M.; Hortenhuber, M.; Stocker, C.; Holzinger, A.; Wassertheurer, S. Selection of entropy-measure parameters for knowledge discovery in heart rate variability data. BMC Bioinform. 2014, 15, 1–11. [Google Scholar] [CrossRef] [Green Version]
- Katz, M.J. Fractals and the analysis of waveforms. Comput. Biol. Med. 1988, 18, 145–156. [Google Scholar] [CrossRef]
- Higuchi, T. Relationship between the fractal dimension and the power law index for a time series: A numerical investigation. Phys. D Nonlinear Phenom. 1990, 46, 254–264. [Google Scholar] [CrossRef]
- Peng, C.-K.; Havlin, S.; Stanley, H.E.; Goldberger, A.L. Quantification of scaling exponents and crossover phenomena in nonstationary heartbeat time series. Chaos Interdiscip. J. Nonlinear Sci. 1995, 5, 82–87. [Google Scholar] [CrossRef]
- Penzel, T.; Kantelhardt, J.W.; Grote, L.; Peter, J.-H.; Bunde, A. Comparison of Detrended Fluctuation Analysis and Spectral Analysis for Heart Rate Variability in Sleep and Sleep Apnea. IEEE Trans. Biomed. Eng. 2003, 50, 1143–1151. [Google Scholar] [CrossRef] [Green Version]
- Echeverria, J.; Woolfson, M.; Crowe, J.; Hayes-Gill, B.; Croaker, G.; Vyas, H. Interpretation of heart rate variability via detrended fluctuation analysis and alpha beta filter. Chaos Interdiscip. J. Nonlinear Sci. 2003, 13, 467–475. [Google Scholar] [CrossRef]
- Grossman, P.; Taylor, E.W. Toward Understanding Respiratory Sinus Arrhythmia: Relations to Cardiac Vagal Tone, Evolution and Biobehavioral Functions. Biol. Psychol. 2007, 74, 263–285. [Google Scholar] [CrossRef]
- Porges, S.W.; Bohrer, R.E. The Analysis of Periodic Processes in Psychophysiological Research. In Principles of Psychophysiology: Physical, Social, and Inferential Elements; Cacioppo, J.T., Tassinary, L.G., Eds.; Cambridge University Press: Cambridge, UK, 1990. [Google Scholar]
- Grossman, P.; Van Beek, J.; Wientjes, C. A Comparison of Three Quantification Methods for Estimation of Respiratory Sinus Arrhythmia. Psychophysiology 1990, 27, 702–714. [Google Scholar] [CrossRef]
- Katona, P.G.; Jih, F. Respiratory Sinus Arrhythmia: Noninvasive Measure of Parasympathetic Cardiac Control. Eur. J. Appl. Physiol. 1975, 39, 801–805. [Google Scholar] [CrossRef]
- Thayer, J.F.; Lane, R.D. A model of neurovisceral integration in emotion regulation and dysregulation. J. Affect. Disord. 2000, 61, 201–216. [Google Scholar] [CrossRef] [Green Version]
- Thayer, J.F.; Lane, R.D. Claude bernard and the heart–brain connection: Further elaboration of a model of neurovisceral integration. Neurosci. Biobehav. Rev. 2009, 33, 81–88. [Google Scholar] [CrossRef]
- Thayer, J.F.; Friedman, B.H. Stop that! Inhibition, sensitization, and their neurovisceral concomitants. Scand. J. Psychol. 2002, 43, 123–130. [Google Scholar] [CrossRef]
- Thayer, J.F.; Brosschot, J.F. Psychosomatics and psychopathology: Looking up and down from the brain. Psychoneuroendocrinology 2005, 30, 1050–1058. [Google Scholar] [CrossRef]
- Friedman, B.H. An autonomic flexibility—Neurovisceral integration model of anxiety and cardiac vagal tone. Biol. Psychol. 2007, 74, 185–199. [Google Scholar] [CrossRef] [PubMed]
- Porges, S.W.; Raskin, D.C. Respiratory and heart rate components of attention. J. Exp. Psychol. 1969, 81, 497. [Google Scholar] [CrossRef] [PubMed]
- Richards, J.E.; Casey, B.J. Heart Rate Variability During Attention Phases in Young Infants. Psychophysiology 1991, 28, 43–53. [Google Scholar] [CrossRef] [PubMed]
- Hansen, A.L.; Johnsen, B.H.; Thayer, J.F. Vagal influence on working memory and attention. Int. J. Psychophysiol. 2003, 48, 263–274. [Google Scholar] [CrossRef]
- Hansen, A.L.; Johnsen, B.H.; Thayer, J.F. Relationship between heart rate variability and cognitive function during threat of shock. Anxiety Stress Coping 2009, 22, 77–89. [Google Scholar] [CrossRef] [PubMed]
- Johnsen, B.H.; Thayer, J.F.; Laberg, J.C.; Wormnes, B.; Raadal, M.; Skaret, E.; Kvale, G.; Berg, E. Attentional and physiological characteristics of patients with dental anxiety. J. Anxiety Disord. 2003, 17, 75–87. [Google Scholar] [CrossRef]
- Krypotos, A.-M.; Jahfari, S.; Ast VA van Kindt, M.; Forstmann, B.U. Individual differences in heart rate variability predict the degree of slowing during response inhibition and initiation in the presence of emotional stimuli. Front. Psychol. 2011, 2, 278. [Google Scholar] [CrossRef] [Green Version]
- Park, G.; Van Bavel, J.J.; Vasey, M.W.; Thayer, J.F. Cardiac Vagal Tone Predicts Inhibited Attention to Fearful Faces. Emotion 2012, 12, 1292. [Google Scholar] [CrossRef]
- Colzato, L.S.; Steenbergen, L. High Vagally Mediated Resting-State Heart Rate Variability Is Associated with Superior Action Cascading. Neuropsychologia 2017, 106, 1–6. [Google Scholar] [CrossRef]
- Colzato, L.S.; Jongkees, B.; De Wit, M.; Van Der Molen, M.J.W.; Steenbergen, L. Variable heart rate and a flexible mind: Higher resting-state heart rate variability predicts better task-switching. Cogn. Affect. Behav. Neurosci. 2018, 18, 730–738. [Google Scholar] [CrossRef] [Green Version]
- Fabes, R.A.; Eisenberg, N.; Eisenbud, L. Behavioral and physiological correlates of children’s reactions to others in distress. Dev. Psychol. 1993, 29, 655. [Google Scholar] [CrossRef]
- Fabes, R.A.; Eisenberg, N. Regulatory control and adults’ stress-related responses to daily life events. J. Personal. Soc. Psychol. 1997, 73, 1107. [Google Scholar] [CrossRef]
- Geisler, F.C.; Vennewald, N.; Kubiak, T.; Weber, H. The impact of heart rate variability on subjective well-being is mediated by emotion regulation. Personal. Individ. Differ. 2010, 49, 723–728. [Google Scholar] [CrossRef]
- Thayer, J.F.; Ahs, F.; Fredrikson, M.; Sollers, J.J., III; Wager, T.D. A meta-analysis of heart rate variability and neuroimaging studies: Implications for heart rate variability as a marker of stress and health. Neurosci. Biobehav. Rev. 2012, 36, 747–756. [Google Scholar] [CrossRef]
- Appelhans, B.M.; Luecken, L.J. Heart Rate Variability as an Index of Regulated Emotional Responding. Rev. Gen. Psychol. 2006, 10, 229–240. [Google Scholar] [CrossRef] [Green Version]
- Park, G.; Vasey, M.W.; Van Bavel, J.J.; Thayer, J.F. When Tonic Cardiac Vagal Tone Predicts Changes in Phasic Vagal Tone: The Role of Fear and Perceptual Load. Psychophysiology 2014, 51, 419–426. [Google Scholar] [CrossRef] [Green Version]
- Thayer, J.F.; Friedman, B.H.; Borkovec, T.D. Autonomic characteristics of generalized anxiety disorder and worry. Biol. Psychiatry 1996, 39, 255–266. [Google Scholar] [CrossRef]
- Benvenuti, S.M.; Mennella, R.; Buodo, G.; Palomba, D. Dysphoria is associated with reduced cardiac vagal withdrawal during the imagery of pleasant scripts: Evidence for the positive attenuation hypothesis. Biol. Psychol. 2015, 106, 28–38. [Google Scholar] [CrossRef]
- El-Sheikh, M.; Hinnant, B.; Erath, S. Developmental trajectories of delinquency symptoms in childhood: The role of marital conflict and autonomic nervous system activity. J. Abnorm. Psychol. 2011, 120, 16–32. [Google Scholar] [CrossRef] [Green Version]
- Rottenberg, J.; Salomon, K.; Gross, J.J.; Gotlib, I.H. Vagal Withdrawal to a Sad Film Predicts Subsequent Recovery from Depression. Psychophysiology 2005, 42, 277–281. [Google Scholar] [CrossRef]
- Weber, C.S.; Thayer, J.F.; Rudat, M.; Wirtz, P.H.; Zimmermann-Viehoff, F.; Thomas, A.; Perschel, F.H.; Arck, P.C.; Deter, H.C. Low vagal tone is associated with impaired post stress recovery of cardiovascular, endocrine, and immune markers. Eur. J. Appl. Physiol. 2010, 109, 201–211. [Google Scholar] [CrossRef] [PubMed] [Green Version]
- Beauchaine, T.P.; Gatzke-Kopp, L.; Mead, H.K. Polyvagal Theory and developmental psychopathology: Emotion dysregulation and conduct problems from preschool to adolescence. Biol. Psychol. 2007, 74, 174–184. [Google Scholar] [CrossRef] [Green Version]
- Schwerdtfeger, A.; Derakshan, N. The Time Line of Threat Processing and Vagal Withdrawal in Response to a Self-Threatening Stressor in Cognitive Avoidant Copers: Evidence for Vigilance-Avoidance Theory. Psychophysiology 2010, 47, 786–795. [Google Scholar] [CrossRef] [PubMed]
- Segerstrom, S.C.; Nes, L.S. Heart rate variability reflects self-regulatory strength, effort, and fatigue. Psychol. Sci. 2007, 18, 275–281. [Google Scholar] [CrossRef] [PubMed]
- Butler, E.A.; Wilhelm, F.H.; Gross, J.J. Respiratory Sinus Arrhythmia, Emotion, and Emotion Regulation During Social Interaction. Psychophysiology 2006, 43, 612–622. [Google Scholar] [CrossRef] [PubMed]
- Laborde, S.; Raab, M.; Kinrade, N.P. Is the ability to keep your mind sharp under pressure reflected in your heart? Evidence for the neurophysiological bases of decision reinvestment. Biol. Psychol. 2014, 100, 34–42. [Google Scholar] [CrossRef] [PubMed]
- Laborde, S.; Lautenbach, F.; Allen, M.S. The contribution of coping-related variables and heart rate variability to visual search performance under pressure. Physiol. Behav. 2015, 139, 532–540. [Google Scholar] [CrossRef]
- Laborde, S.; Mosley, E.; Thayer, J.F. Heart rate variability and cardiac vagal tone in psychophysiological research–recommendations for experiment planning, data analysis, and data reporting. Front. Psychol. 2017, 8, 213. [Google Scholar] [CrossRef] [Green Version]
- Beauchaine, T. Vagal tone, development, and Gray’s motivational theory: Toward an integrated model of autonomic nervous system functioning in psychopathology. Dev. Psychopathol. 2001, 13, 183–214. [Google Scholar] [CrossRef] [Green Version]
- Schulz, S.; Koschke, M.; Bar, K.-J.; Voss, A. The altered complexity of cardiovascular regulation in depressed patients. Physiol. Meas. 2010, 31, 303. [Google Scholar] [CrossRef]
- Leistedt, S.J.; Linkowski, P.; Lanquart, J.P.; Mietus, J.; Davis, R.B.; Goldberger, A.L.; Costa, M.D. Decreased neuroautonomic complexity in men during an acute major depressive episode: Analysis of heart rate dynamics. Transl. Psychiatry 2011, 1, e27. [Google Scholar] [CrossRef]
- Koenig, J.; Kemp, A.H.; Beauchaine, T.P.; Thayer, J.F.; Kaess, M. Depression and resting state heart rate variability in children and adolescents—A systematic review and meta-analysis. Clin. Psychol. Rev. 2016, 46, 136–150. [Google Scholar] [CrossRef]
- Piccirillo, G.; Elvira, S.; Bucca, C.; Viola, E.; Cacciafesta, M.; Marigliano, V. Abnormal passive head-up tilt test in subjects with symptoms of anxiety power spectral analysis study of heart rate and blood pressure. Int. J. Cardiol. 1997, 60, 121–131. [Google Scholar] [CrossRef]
- Dalack, G.W.; Roose, S.P. Perspectives on the relationship between cardiovascular disease and affective disorder. J. Clin. Psychiatry 1990, 51, 4–11. [Google Scholar]
- Klein, E.; Cnaani, E.; Harel, T.; Braun, S.; Ben-Haim, S.A. Altered heart rate variability in panic disorder patients. Biol. Psychiatry 1995, 37, 18–24. [Google Scholar] [CrossRef]
- Lakusic, N.; Fuckar, K.; Mahovic, D.; Cerovec, D.; Majsec, M.; Stancin, N. Characteristics of Heart Rate Variability in War Veterans with Post-Traumatic Stress Disorder after Myocardial Infarction. Mil. Med. 2007, 172, 1190–1193. [Google Scholar] [CrossRef] [Green Version]
- Prasko, J.; Latalova, K.; Diveky, T.; Grambal, A.; Kamaradova, D.; Velartova, H.; Salinger, J.; Opavsky, J.; Silhan, P. Panic disorder, autonomic nervous system and dissociation—Changes during therapy. Neuroendocr. Lett. 2011, 32, 101–111. [Google Scholar]
- Hartmann, R.; Schmidt, F.M.; Sander, C.; Hegerl, U. Heart Rate Variability as Indicator of Clinical State in Depression. Front. Psychiatry 2019, 9, 735. [Google Scholar] [CrossRef] [Green Version]
- Dimitriev, D.A.; Saperova, E.V.; Dimitriev, A. State Anxiety and Nonlinear Dynamics of Heart Rate Variability in Students. PLoS ONE 2016, 11, e0146131. [Google Scholar] [CrossRef] [Green Version]
- Kim, K.; Lee, S.; Kim, J.-H. Diminished autonomic neurocardiac function in patients with generalized anxiety disorder. Neuropsychiatr. Dis. Treat. 2016, 12, 3111–3118. [Google Scholar] [CrossRef] [Green Version]
- Cohen, H.; Kaplan, Z.; Kotler, M.; Mittelman, I.; Osher, Y.; Bersudsky, Y. Impaired heart rate variability in euthymic bipolar patients. Bipolar Disord. 2003, 5, 138–143. [Google Scholar] [CrossRef] [PubMed]
- Henry, B.L.; Minassian, A.; Paulus, M.P.; Geyer, M.A.; Perry, W. Heart rate variability in bipolar mania and schizophrenia. J. Psychiatr. Res. 2010, 44, 168–176. [Google Scholar] [CrossRef] [PubMed] [Green Version]
- Lee, J.-S.; Kim, B.; Hong, Y.; Joo, Y.H. Heart rate variability in the subsyndromal depressive phase of bipolar disorder. Psychiatry Clin. Neurosci. 2012, 66, 361–366. [Google Scholar] [CrossRef] [PubMed]
- Chang, H.-A.; Chang, C.-C.; Tzeng, N.-S.; Kuo, T.B.J.; Lu, R.-B.; Huang, S.-Y. Heart rate variability in unmedicated patients with bipolar disorder in the manic phase. Psychiatry Clin. Neurosci. 2014, 68, 674–682. [Google Scholar] [CrossRef] [Green Version]
- Carr, O.; De Vos, M.; Saunders, K.E.A. Heart rate variability in bipolar disorder and borderline personality disorder: A clinical review. Evid. Based Ment. Health 2017, 21, 23–30. [Google Scholar] [CrossRef]
- Ebner-Priemer, U.W.; Welch, S.S.; Grossman, P.; Reisch, T.; Linehan, M.M.; Bohus, M. Psychophysiological ambulatory assessment of affective dysregulation in borderline personality disorder. Psychiatry Res. 2007, 150, 265–275. [Google Scholar] [CrossRef]
- Weinberg, A.; Klonsky, E.D.; Hajcak, G. Autonomic impairment in Borderline Personality Disorder: A laboratory investigation. Brain Cogn. 2009, 71, 279–286. [Google Scholar] [CrossRef]
- Bär, K.J.; Letzsch, A.; Jochum, T.; Wagner, G.; Greiner, W.; Sauer, H. Loss of efferent vagal activity in acute schizophrenia. J. Psychiatr. Res. 2005, 39, 519–527. [Google Scholar] [CrossRef]
- Jindal, R.; MacKenzie, E.M.; Baker, G.B.; Yeragani, V.K. Cardiac risk and schizophrenia. J. Psychiatry Neurosci. 2005, 30, 393. [Google Scholar]
- Bär, K.-J.; Boettger, M.; Koschke, M.; Schulz, S.; Chokka, P.; Yeragani, V.K.; Voss, A. Non-linear complexity measures of heart rate variability in acute schizophrenia. Clin. Neurophysiol. 2007, 118, 2009–2015. [Google Scholar] [CrossRef]
- Chang, J.S.; Yoo, C.S.; Yi, S.H.; Hong, K.H.; Oh, H.S.; Hwang, J.Y.; Kim, S.-G.; Ahn, Y.M.; Kim, Y.S. Differential pattern of heart rate variability in patients with schizophrenia. Prog. Neuro-Psychopharmacol. Biol. Psychiatry 2009, 33, 991–995. [Google Scholar] [CrossRef]
- Valkonen-Korhonen, M.; Tarvainen, M.; Ranta-Aho, P.; Karjalainen, P.A.; Partanen, J.; Karhu, J.; Lehtonen, J. Heart rate variability in acute psychosis. Psychophysiol. 2003, 40, 716–726. [Google Scholar] [CrossRef]
- Toichi, M.; Kubota, Y.; Murai, T.; Kamio, Y.; Sakihama, M.; Toriuchi, T.; Inakuma, T.; Sengoku, A.; Miyoshi, K. The influence of psychotic states on the autonomic nervous system in schizophrenia. Int. J. Psychophysiol. 1999, 31, 147–154. [Google Scholar] [CrossRef] [Green Version]
- Einvik, G.; Hrubos-Strøm, H.; Randby, A.; Nordhus, I.H.; Somers, V.K.; Omland, T.; Dammen, T. Major Depressive Disorder, Anxiety Disorders, and Cardiac Biomarkers in Subjects at High Risk of Obstructive Sleep Apnea. Psychosom. Med. 2011, 73, 378–384. [Google Scholar] [CrossRef]
- Pavlov, V.A.; Tracey, K.J. The vagus nerve and the inflammatory reflex—Linking immunity and metabolism. Nat. Rev. Endocrinol. 2012, 8, 743–754. [Google Scholar] [CrossRef]
- Moon, E.; Lee, S.-H.; Kim, D.-H.; Hwang, B. Comparative Study of Heart Rate Variability in Patients with Schizophrenia, Bipolar Disorder, Post-traumatic Stress Disorder, or Major Depressive Disorder. Clin. Psychopharmacol. Neurosci. 2013, 11, 137–143. [Google Scholar] [CrossRef]
- Hage, B.; Sinacore, J.; Heilman, K.; Porges, S.W.; Halaris, A. Heart Rate Variability Predicts Treatment Outcome in Major Depression. J. Psychiatry Brain Sci. 2017, 2, 1. [Google Scholar] [CrossRef] [Green Version]
- Park, S.-W.; Lee, J.-H.; Kim, J.; Suh, S.; Lee, M.-S. Changes in heart rate variability in first-episode drug-naïve adolescents with major depressive disorder: A 12-week prospective study. J. Affect. Disord. 2018, 238, 250–255. [Google Scholar] [CrossRef]
- Porges, S.W. The polyvagal perspective. Biol. Psychol. 2007, 74, 116–143. [Google Scholar] [CrossRef]
- McCraty, R.; Atkinson, M.; Tomasino, D.; Bradley, R.T. The coherent heart heart-brain interactions, psychophysiological coherence, and the emergence of system-wide order. Integral Rev. A Transdiscipl. Transcult. J. N. Thought Res. Prax. 2009, 5, 354–381. [Google Scholar]
- McCraty, R.; Zayas, M.A. Cardiac coherence, self-regulation, autonomic stability, and psychosocial well-being. Front. Psychol. 2014, 5, 1090. [Google Scholar] [CrossRef] [Green Version]
- Vaschillo, E.G.; Vaschillo, B.; Lehrer, P.M. Characteristics of Resonance in Heart Rate Variability Stimulated by Biofeedback. Appl. Psychophysiol. Biofeedback 2006, 31, 129–142. [Google Scholar] [CrossRef]
- Lehrer, P.M.; Vaschillo, B.; Zucker, T.; Graves, J.; Katsamanis, M.; Aviles, M.; Wamboldt, F.S. Protocol for Heart Rate Variability Biofeedback Training. Biofeedback 2013, 41, 98–109. [Google Scholar] [CrossRef] [Green Version]
- Vaschillo, E.; Lehrer, P.; Rishe, N.; Konstantinov, M. Heart Rate Variability Biofeedback as a Method for Assessing Baroreflex Function: A Preliminary Study of Resonance in the Cardiovascular System. Appl. Psychophysiol. Biofeedback 2002, 27, 1–27. [Google Scholar] [CrossRef]
- Lehrer, P.M.; Vaschillo, E.; Vaschillo, B.; Lu, S.-E.; Eckberg, D.L.; Edelberg, R.; Shih, W.J.; Lin, Y.; Kuusela, T.A.; Tahvanainen, K.U.O.; et al. Heart Rate Variability Biofeedback Increases Baroreflex Gain and Peak Expiratory Flow. Psychosom. Med. 2003, 65, 796–805. [Google Scholar] [CrossRef] [Green Version]
- Hallman, D.M.; Olsson, E.; Von Schéele, B.; Melin, L.; Lyskov, E. Effects of Heart Rate Variability Biofeedback in Subjects with Stress-Related Chronic Neck Pain: A Pilot Study. Appl. Psychophysiol. Biofeedback 2011, 36, 71–80. [Google Scholar] [CrossRef]
- Henriques, G.; Keffer, S.; Abrahamson, C.; Horst, S.J. Exploring the Effectiveness of a Computer-Based Heart Rate Variability Biofeedback Program in Reducing Anxiety in College Students. Appl. Psychophysiol. Biofeedback 2011, 36, 101–112. [Google Scholar] [CrossRef]
- Goessl, V.C.; Curtiss, J.E.; Hofmann, S.G. The effect of heart rate variability biofeedback training on stress and anxiety: A meta-analysis. Psychol. Med. 2017, 47, 2578–2586. [Google Scholar] [CrossRef]
- Karavidas, M.K.; Lehrer, P.M.; Vaschillo, E.; Vaschillo, B.; Marin, H.; Buyske, S.; Malinovsky, I.; Radvanski, D.; Hassett, A. Preliminary Results of an Open Label Study of Heart Rate Variability Biofeedback for the Treatment of Major Depression. Appl. Psychophysiol. Biofeedback 2007, 32, 19–30. [Google Scholar] [CrossRef]
- Siepmann, M.; Aykac, V.; Unterdörfer, J.; Petrowski, K.; Mueck-Weymann, M. A Pilot Study on the Effects of Heart Rate Variability Biofeedback in Patients with Depression and in Healthy Subjects. Appl. Psychophysiol. Biofeedback 2008, 33, 195–201. [Google Scholar] [CrossRef]
- Caldwell, Y.T.; Steffen, P.R. Adding HRV biofeedback to psychotherapy increases heart rate variability and improves the treatment of major depressive disorder. Int. J. Psychophysiol. 2018, 131, 96–101. [Google Scholar] [CrossRef] [PubMed]
- Ginsberg, J.; Berry, E.M.; Powell, A.D. Cardiac coherence and posttraumatic stress disorder in combat veterans. Altern. Ther. Health Med. 2010, 16, 52–60. [Google Scholar] [PubMed]
- Lloyd, A.; Brett, D.; Wesnes, K. Coherence training in children with attention-deficit hyperactivity disorder: Cognitive functions and behavioral changes. Altern. Ther. Health Med. 2010, 16, 34–42. [Google Scholar] [PubMed]
- Lehrer, P.M.; Gevirtz, R. Heart rate variability biofeedback: How and why does it work? Front. Psychol. 2014, 5, 756. [Google Scholar] [CrossRef] [Green Version]
- Makowski, D.; Pham, T.; Lau, Z.J.; Brammer, J.C.; Lespinasse, F.; Pham, H.; Schölzel, C.; Chen, S.H.A. NeuroKit2: A Python toolbox for neurophysiological signal processing. Behav. Res. Methods 2021, 1–8. [Google Scholar] [CrossRef]
- van Gent, P.; Farah, H.; van Nes, N.; van Arem, B. HeartPy: A novel heart rate algorithm for the analysis of noisy signals. Transp. Res. Part F Traffic Psychol. Behav. 2019, 66, 368–378. [Google Scholar] [CrossRef] [Green Version]
- Gomes, P.; Margaritoff, P.; Silva, H. pyHRV: Development and evaluation of an open-source python toolbox for heart rate variability (HRV). In Proceedings of the Int’l Conference on Electrical, Electronic and Computing Engineering (IcETRAN), Srebrno Jezero, Serbia, 3–6 June 2019; pp. 822–828. [Google Scholar]
- Bartels, R.; Peçanha, T. HRV: A Pythonic package for Heart Rate Variability Analysis. J. Open Source Softw. 2020, 5, 1867. [Google Scholar] [CrossRef]
- Tarvainen, M.P.; Niskanen, J.P.; Lipponen, J.A.; Ranta-Aho, P.O.; Karjalainen, P.A. Kubios HRV–heart rate variability analysis software. Comput. Methods Programs Biomed. 2014, 113, 210–220. [Google Scholar] [CrossRef]
- Saboul, D.; Pialoux, V.; Hautier, C. The breathing effect of the LF/HF ratio in the heart rate variability measurements of athletes. Eur. J. Sport Sci. 2011, 14, S282–S288. [Google Scholar] [CrossRef]
- Sassi, R.; Cerutti, S.; Lombardi, F.; Malik, M.; Huikuri, H.V.; Peng, C.-K.; Schmidt, G.; Yamamoto, Y.; Gorenek, B.; Lip, G.Y.; et al. Advances in heart rate variability signal analysis: Joint position statement by the e-Cardiology ESC Working Group and the European Heart Rhythm Association co-endorsed by the Asia Pacific Heart Rhythm Society. Europace 2015, 17, 1341–1353. [Google Scholar] [CrossRef]
- Catai, A.M.; Pastre, C.M.; de Godoy, M.F.; da Silva, E.; Takahashi, A.C.D.M.; Vanderlei, L.C.M. Heart rate variability: Are you using it properly? Standardisation checklist of procedures. Braz. J. Phys. Ther. 2020, 24, 91–102. [Google Scholar] [CrossRef]
- Aeschbacher, S.; Schoen, T.; Dörig, L.; Kreuzmann, R.; Neuhauser, C.; Schmidt-Trucksäss, A.; Probst-Hensch, N.M.; Risch, M.; Risch, L.; Conen, D. Heart rate, heart rate variability and inflammatory biomarkers among young and healthy adults. Ann. Med. 2016, 49, 32–41. [Google Scholar] [CrossRef]
- Umetani, K.; Singer, D.H.; McCraty, R.; Atkinson, M. Twenty-Four Hour Time Domain Heart Rate Variability and Heart Rate: Relations to Age and Gender Over Nine Decades. J. Am. Coll. Cardiol. 1998, 31, 593–601. [Google Scholar] [CrossRef]
- Nunan, D.; Sandercock, G.R.H.; Brodie, D.A. A Quantitative Systematic Review of Normal Values for Short-Term Heart Rate Variability in Healthy Adults. Pacing Clin. Electrophysiol. 2010, 33, 1407–1417. [Google Scholar] [CrossRef]
- Dantas, E.M.; Kemp, A.H.; Andreão, R.V.; Da Silva, V.J.D.; Brunoni, A.R.; Hoshi, R.A.; Bensenor, I.M.; Lotufo, P.A.; Ribeiro, A.L.P.; Mill, J.G. Reference values for short-term resting-state heart rate variability in healthy adults: Results from the Brazilian Longitudinal Study of Adult Health-ELSA-Brasil study. Psychophysiology 2018, 55, e13052. [Google Scholar] [CrossRef] [Green Version]
- Gąsior, J.S.; Sacha, J.; Pawlowski, M.; Zielinski, J.; Jelen, P.J.; Tomik, A.; Ksiazczyk, T.M.; Werner, B.; Dkabrowski, M.J. Normative values for heart rate variability parameters in school-aged children: Simple approach considering differences in average heart rate. Front. Physiol. 2018, 9, 1495. [Google Scholar] [CrossRef]
- Sammito, S.; Böckelmann, I. Reference values for time- and frequency-domain heart rate variability measures. Heart Rhythm. 2016, 13, 1309–1316. [Google Scholar] [CrossRef]
- Berg, M.E.V.D.; Rijnbeek, P.R.; Niemeijer, M.N.; Hofman, A.; Van Herpen, G.; Bots, M.L.; Hillege, H.; Swenne, C.A.; Eijgelsheim, M.; Stricker, B.H.; et al. Normal Values of Corrected Heart-Rate Variability in 10-Second Electrocardiograms for All Ages. Front. Physiol. 2018, 9, 424. [Google Scholar] [CrossRef]


| Analysis Domain | Sub-Domain | Acronym | Description |
|---|---|---|---|
| Time-Domain | Deviation-based approach | SDNN | Standard deviation of NN intervals |
| SDANN | Standard deviation of average NN intervals for each 5 min segment | ||
| SDNN Index | Mean of the standard deviations of NN intervals in 5 min segments | ||
| Difference-based approach | SDSD | Standard deviation of successive NN interval differences | |
| RMSSD | Root mean square of successive NN interval differences | ||
| pNN20 | Proportion of successive NN interval differences larger than 20 ms | ||
| pNN50 | Proportion of successive NN interval differences larger than 50 ms | ||
| Geometric approach | HTI | Integral of the density of the NN interval histogram divided by its height | |
| TTIN | Baseline width of the RR interval histogram | ||
| Frequency-domain | Absolute Power | ULF | Power spectrum in the frequency range of ≤0.003 Hz |
| VLF | Power spectrum in the frequency range of 0.0033–0.04 Hz | ||
| LF | Power spectrum in the frequency range of 0.04–0.15 Hz | ||
| HF | Power spectrum in the frequency range of 0.15–0.4 Hz | ||
| Normalized/Relative Power | LnHF | Natural logarithm of HF | |
| HFn | Normalized HF | ||
| LFn | Normalized LF | ||
| LF/HF | Ratio of LF to HF power | ||
| Time-frequency domain | Linear approach | STFT | Power spectrum estimation using short-term Fourier transform |
| WT | Power spectrum estimation using Wavelet transform | ||
| Quadratic approach | WVD | Power spectrum estimation using Wigner–-Ville distribution | |
| SWVD | Power spectrum estimation using Smoothed Wigner–Ville distribution | ||
| Non-linear domain | Poincaré Plot | SD1 | Poincaré plot standard deviation perpendicular the line of identity |
| SD2 | Poincaré plot standard deviation along the line of identity | ||
| SD1/SD2 | Ratio of SD1 to SD2 | ||
| Entropy | ApEn | Estimation of complexity using approximate entropy | |
| SampEn | Estimation of complexity using sample entropy | ||
| MSE | Estimation of complexity using multiscale entropy | ||
| Fractal Dimensions | DFA | Estimation of signal fluctuations using detrended fluctuation analysis | |
| CD | Estimation of minimum number of variables to define a dynamic model |
| HRV_RMSSD | HRV_MeanNN | … | HRV_DFA | HRV_CorrDim |
|---|---|---|---|---|
| 61.74 | 820.75 | … | 0.66 | 1.40 |
Publisher’s Note: MDPI stays neutral with regard to jurisdictional claims in published maps and institutional affiliations. |
© 2021 by the authors. Licensee MDPI, Basel, Switzerland. This article is an open access article distributed under the terms and conditions of the Creative Commons Attribution (CC BY) license (https://creativecommons.org/licenses/by/4.0/).
Share and Cite
Pham, T.; Lau, Z.J.; Chen, S.H.A.; Makowski, D. Heart Rate Variability in Psychology: A Review of HRV Indices and an Analysis Tutorial. Sensors 2021, 21, 3998. https://doi.org/10.3390/s21123998
Pham T, Lau ZJ, Chen SHA, Makowski D. Heart Rate Variability in Psychology: A Review of HRV Indices and an Analysis Tutorial. Sensors. 2021; 21(12):3998. https://doi.org/10.3390/s21123998
Chicago/Turabian StylePham, Tam, Zen Juen Lau, S. H. Annabel Chen, and Dominique Makowski. 2021. "Heart Rate Variability in Psychology: A Review of HRV Indices and an Analysis Tutorial" Sensors 21, no. 12: 3998. https://doi.org/10.3390/s21123998