Evaluation of the Efficiency of Detection and Capture of Manganese in Aqueous Solutions of FeCeOx Nanocomposites Doped with Nb2O5

 , ,
, ,
Abstract
:1. Introduction
2. Experimental Part
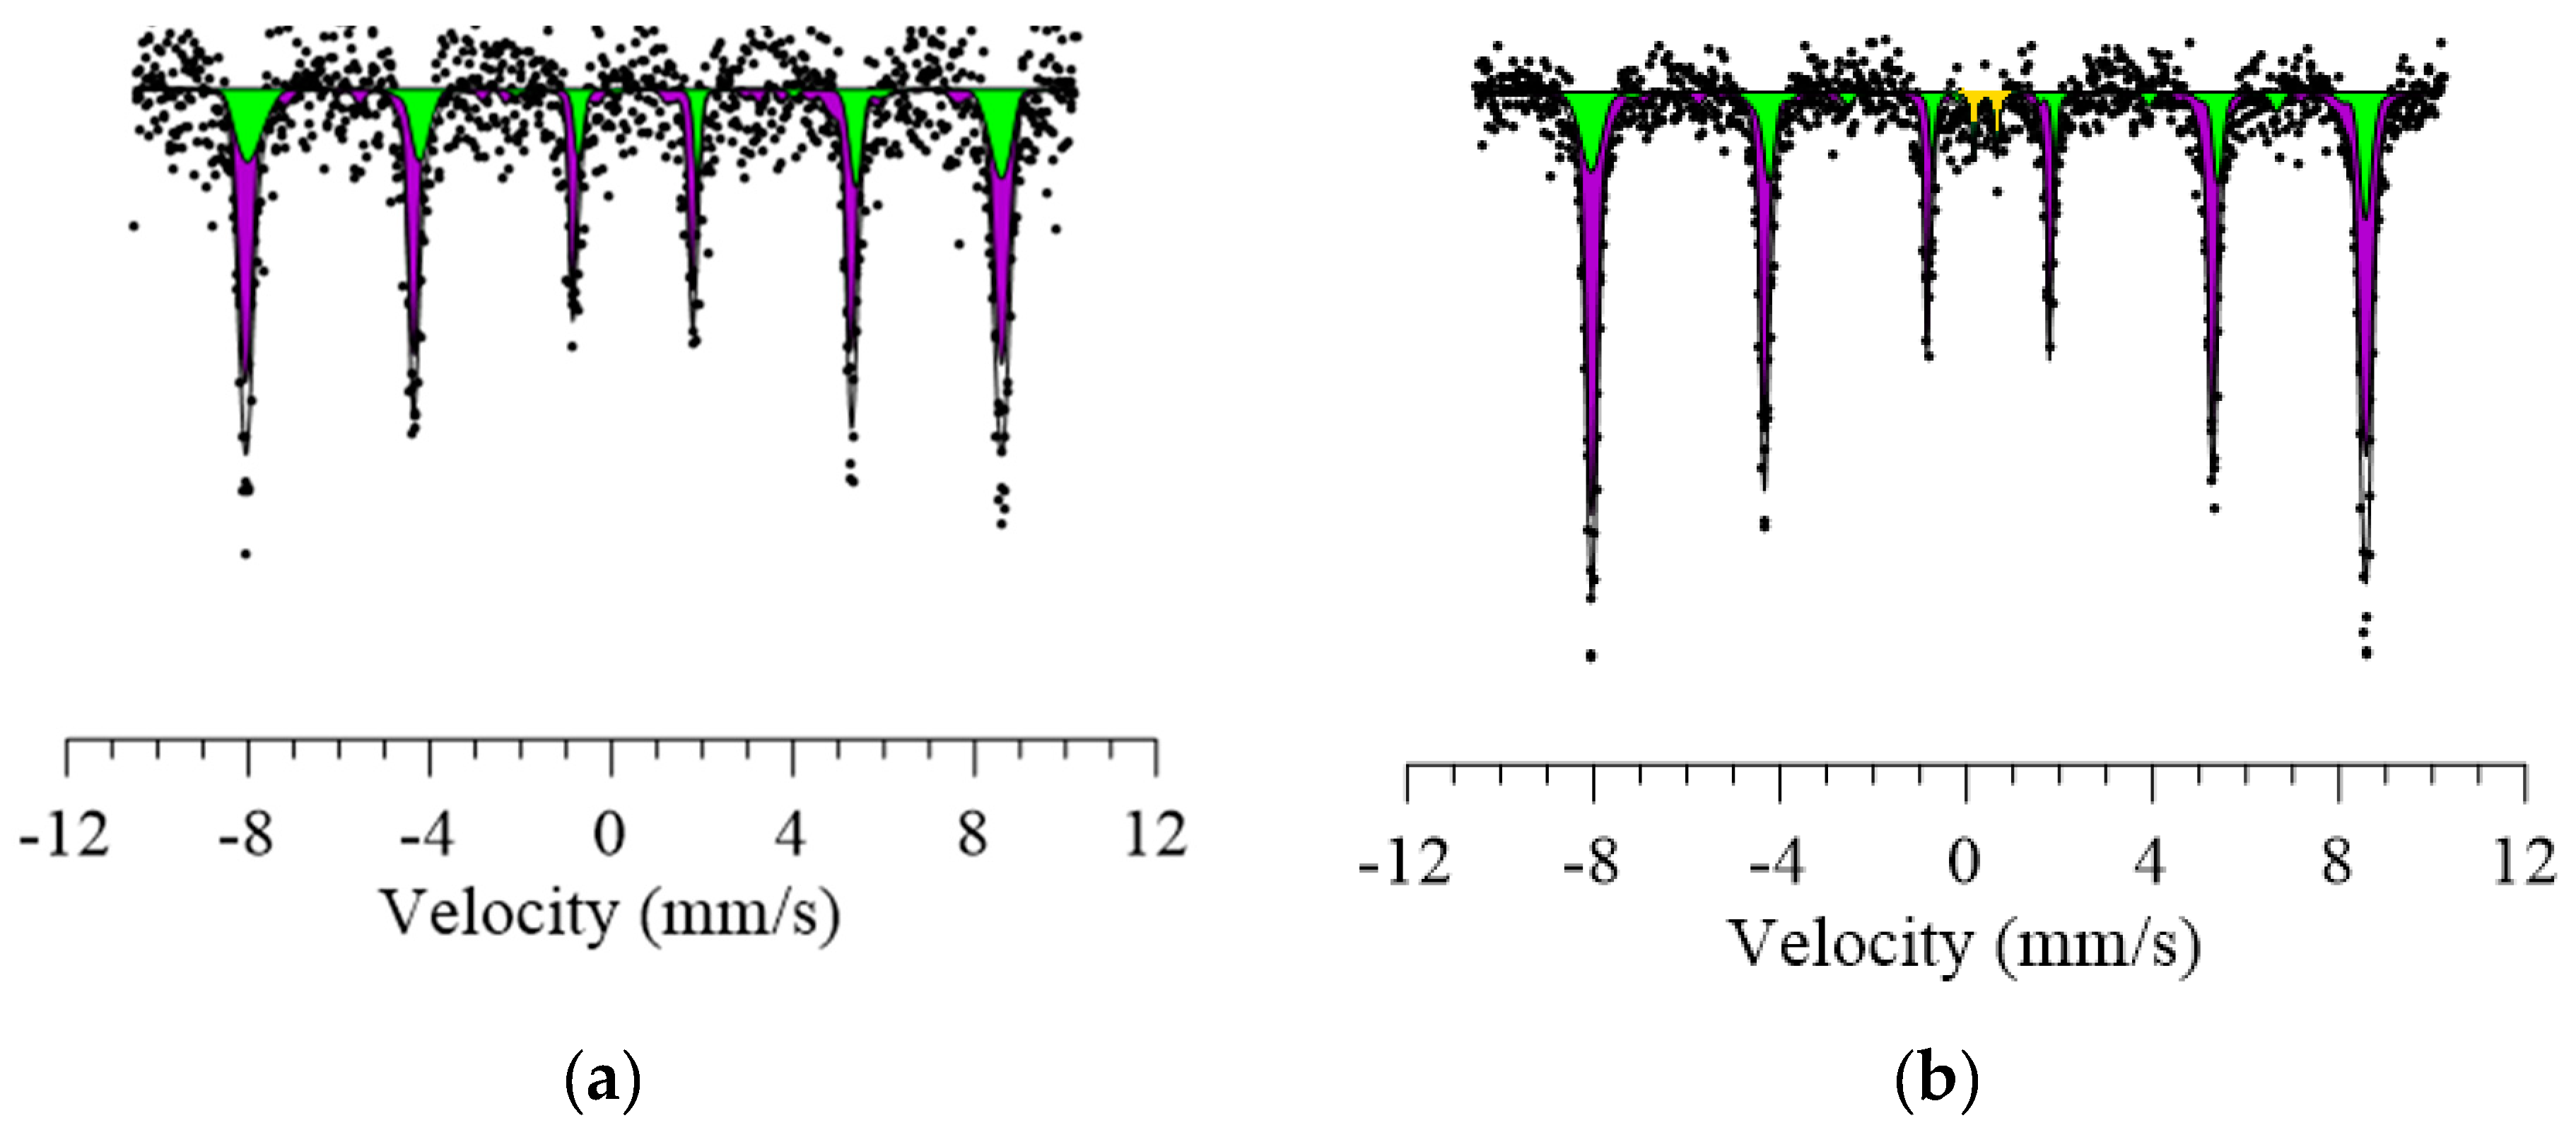
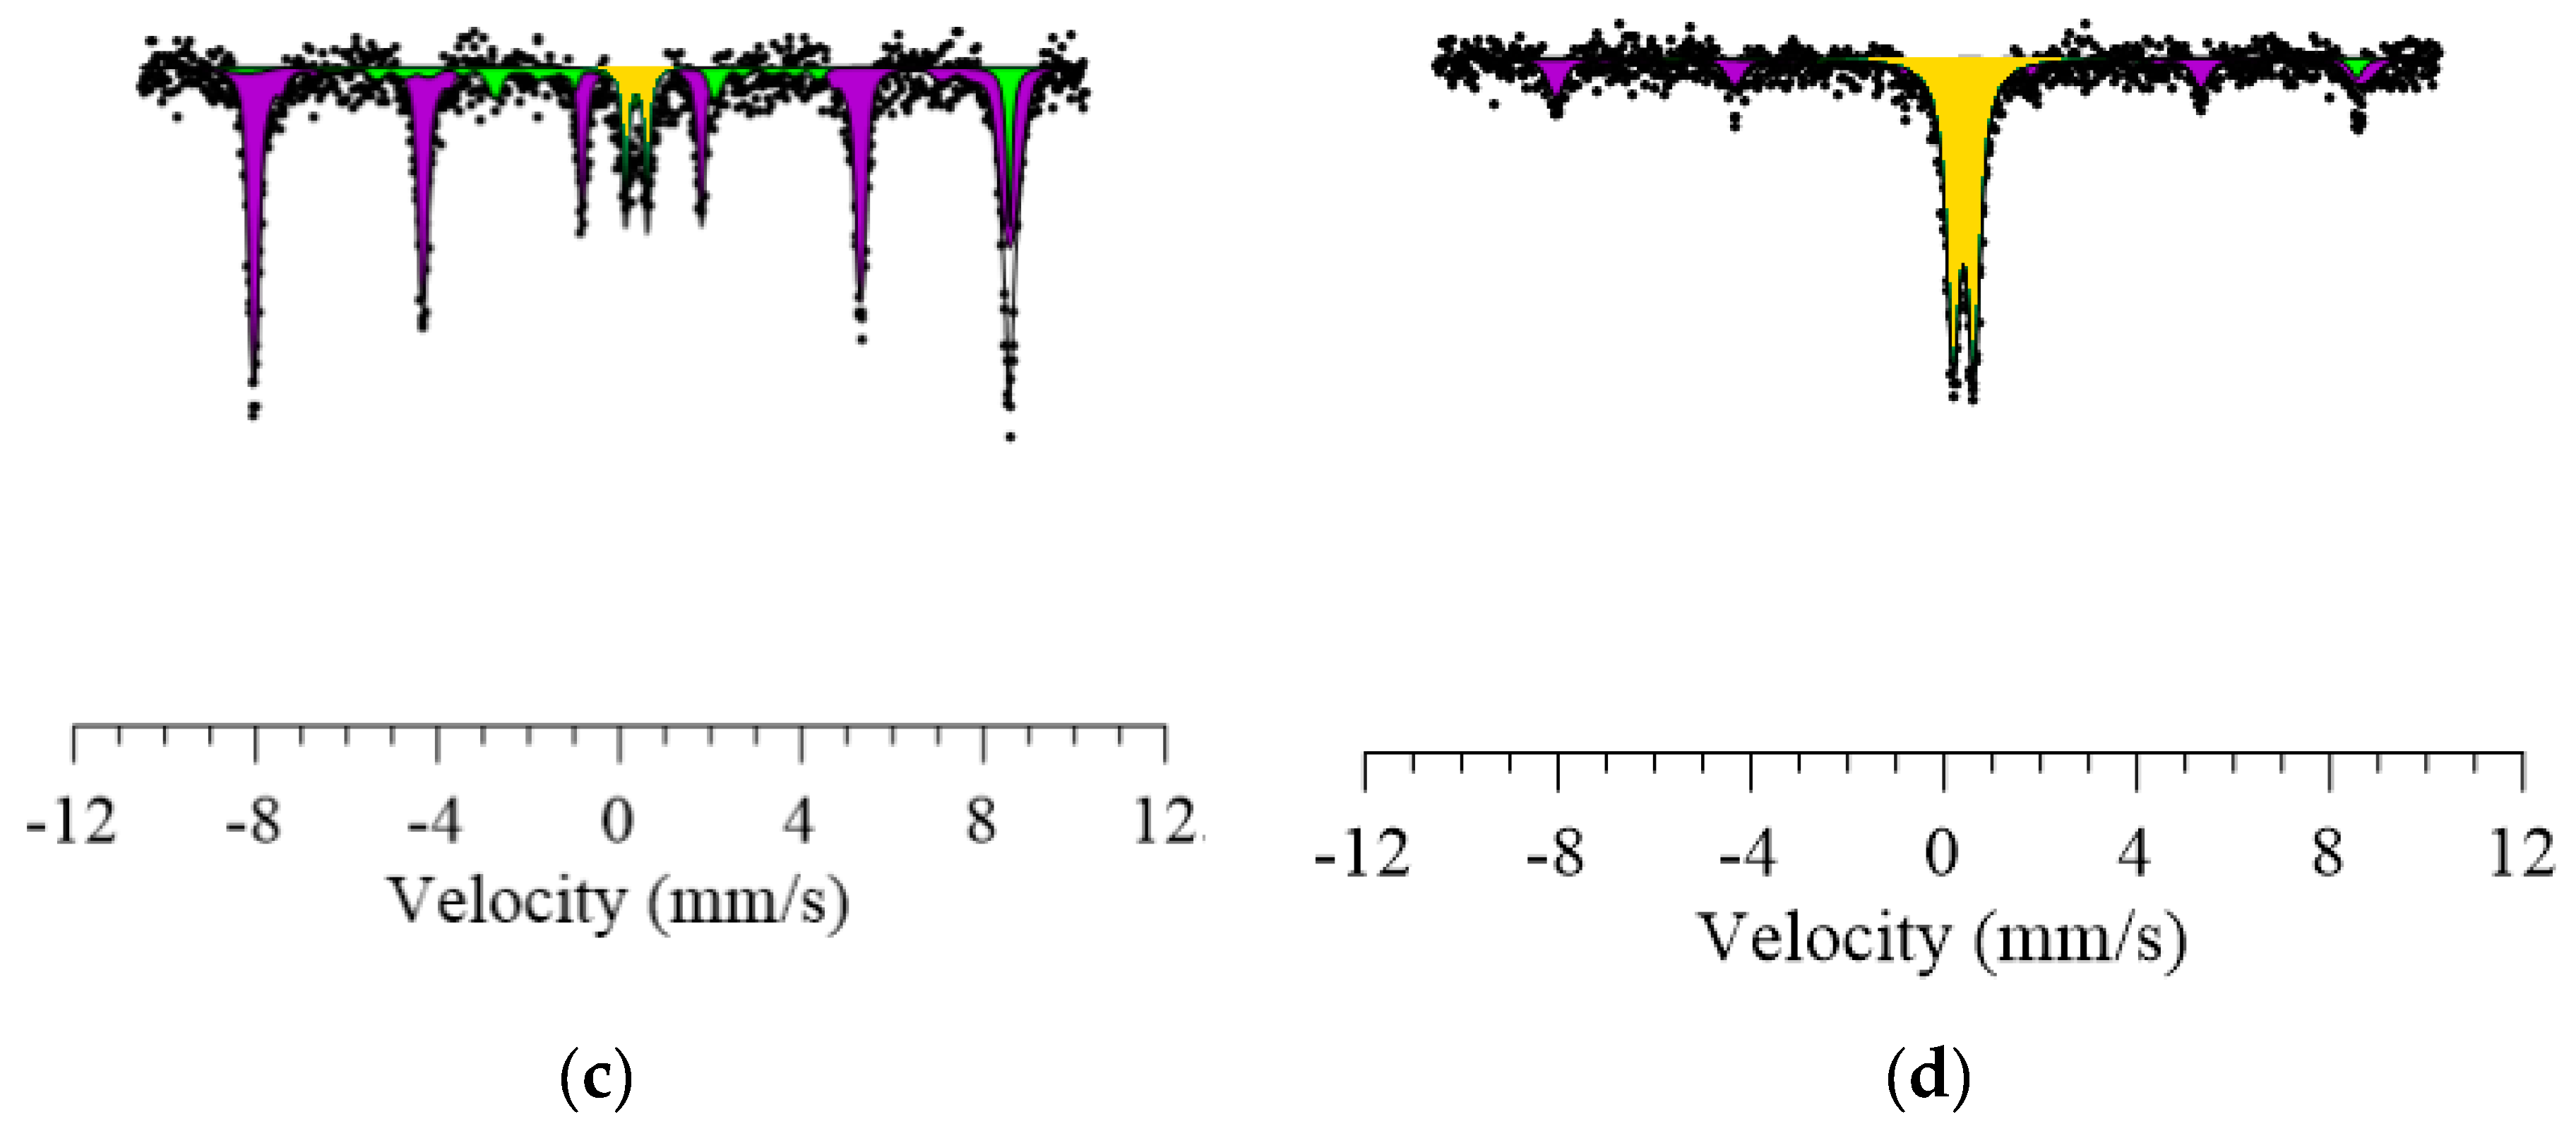
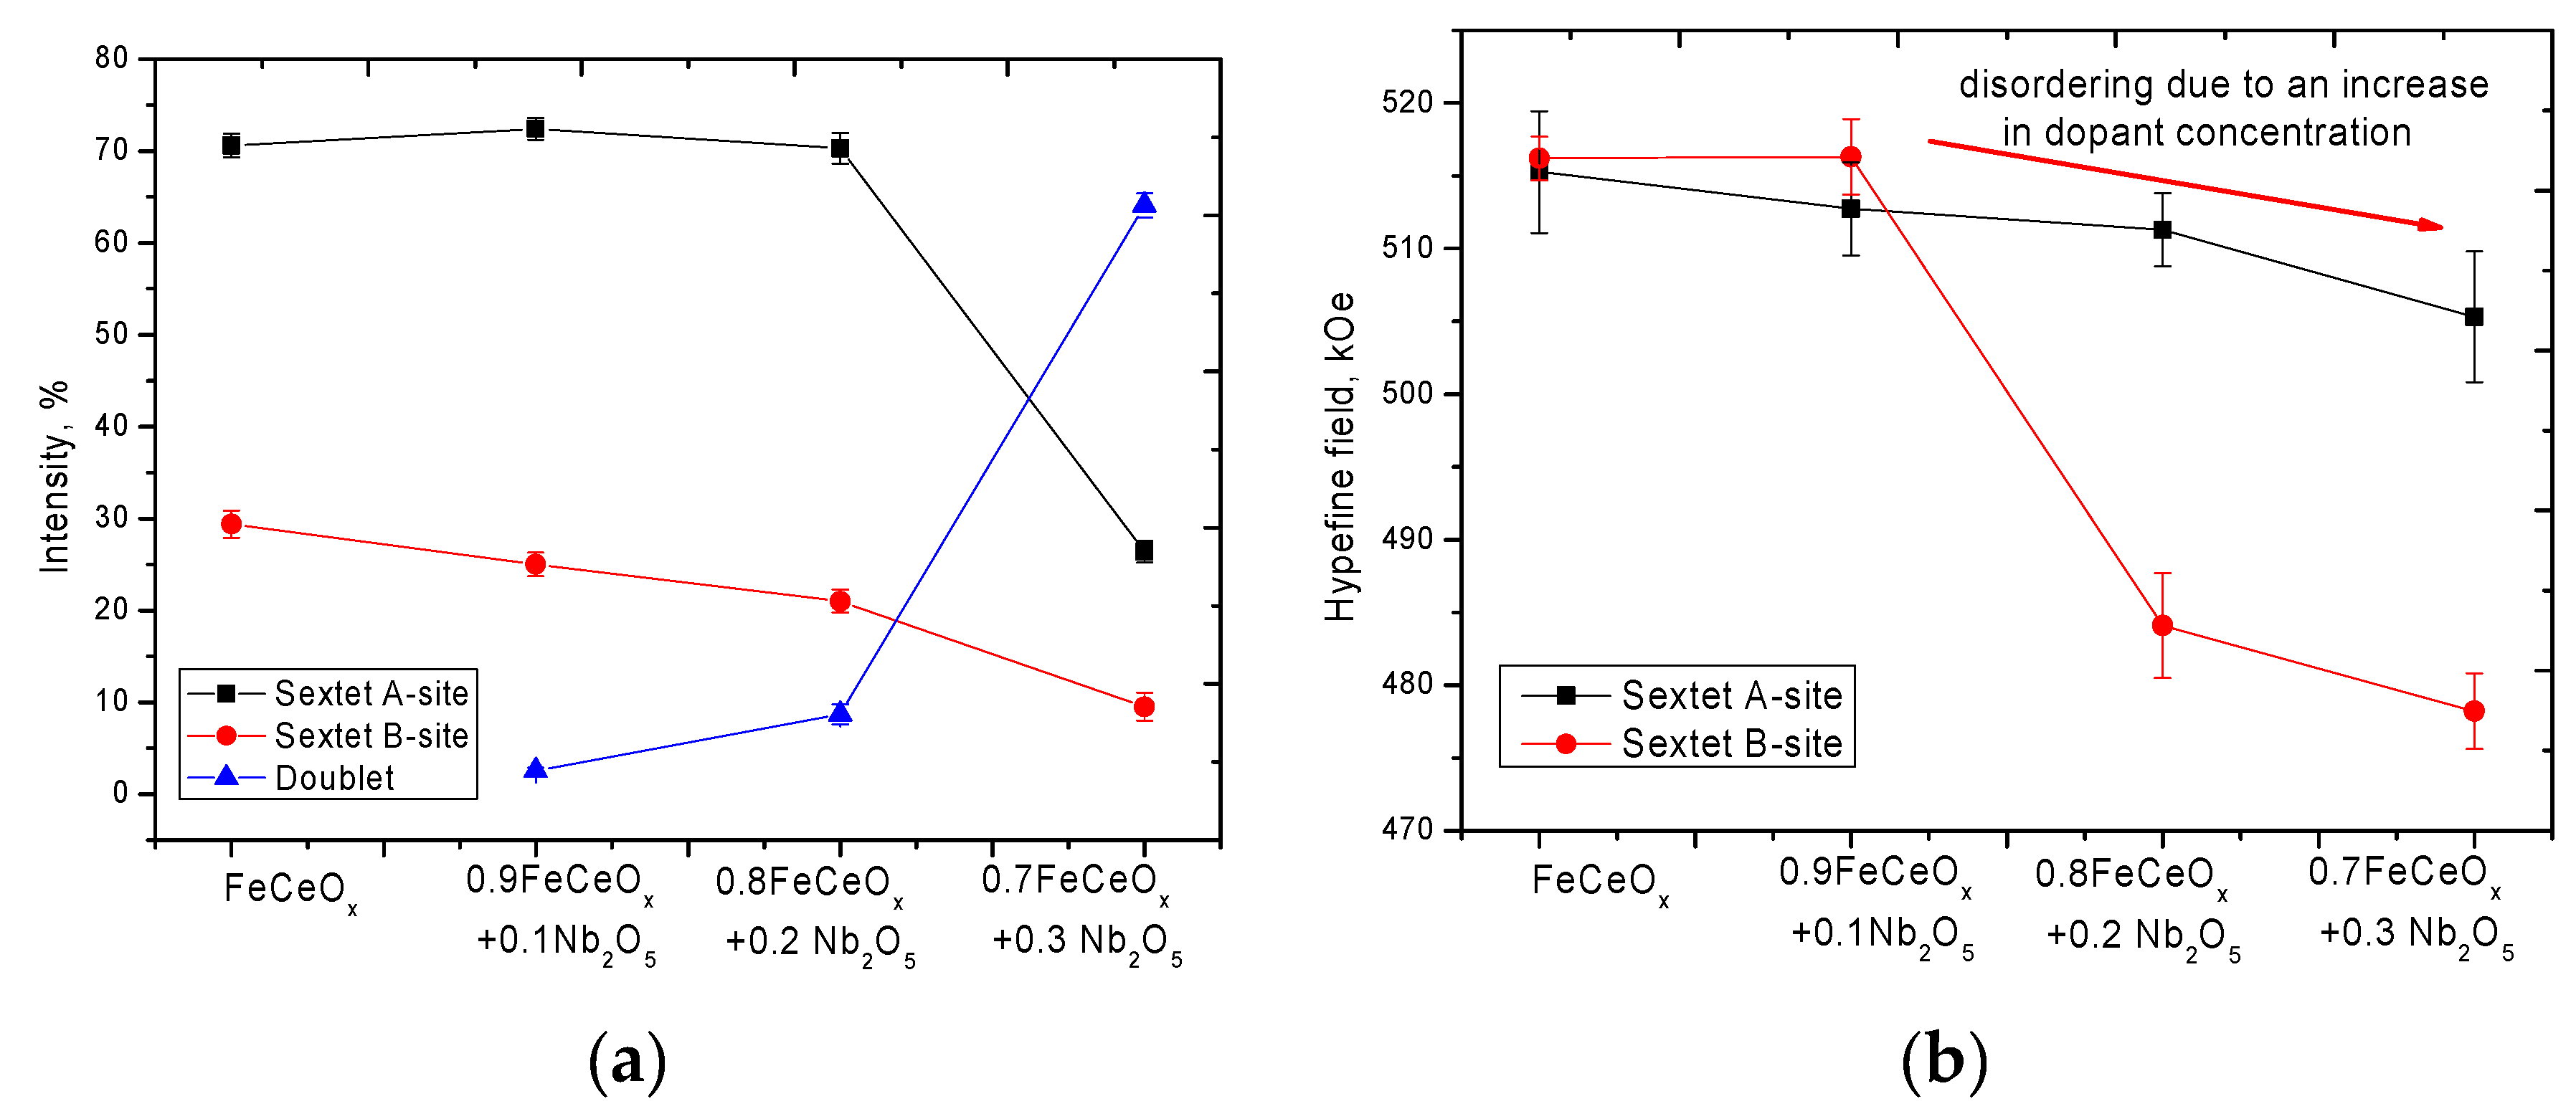
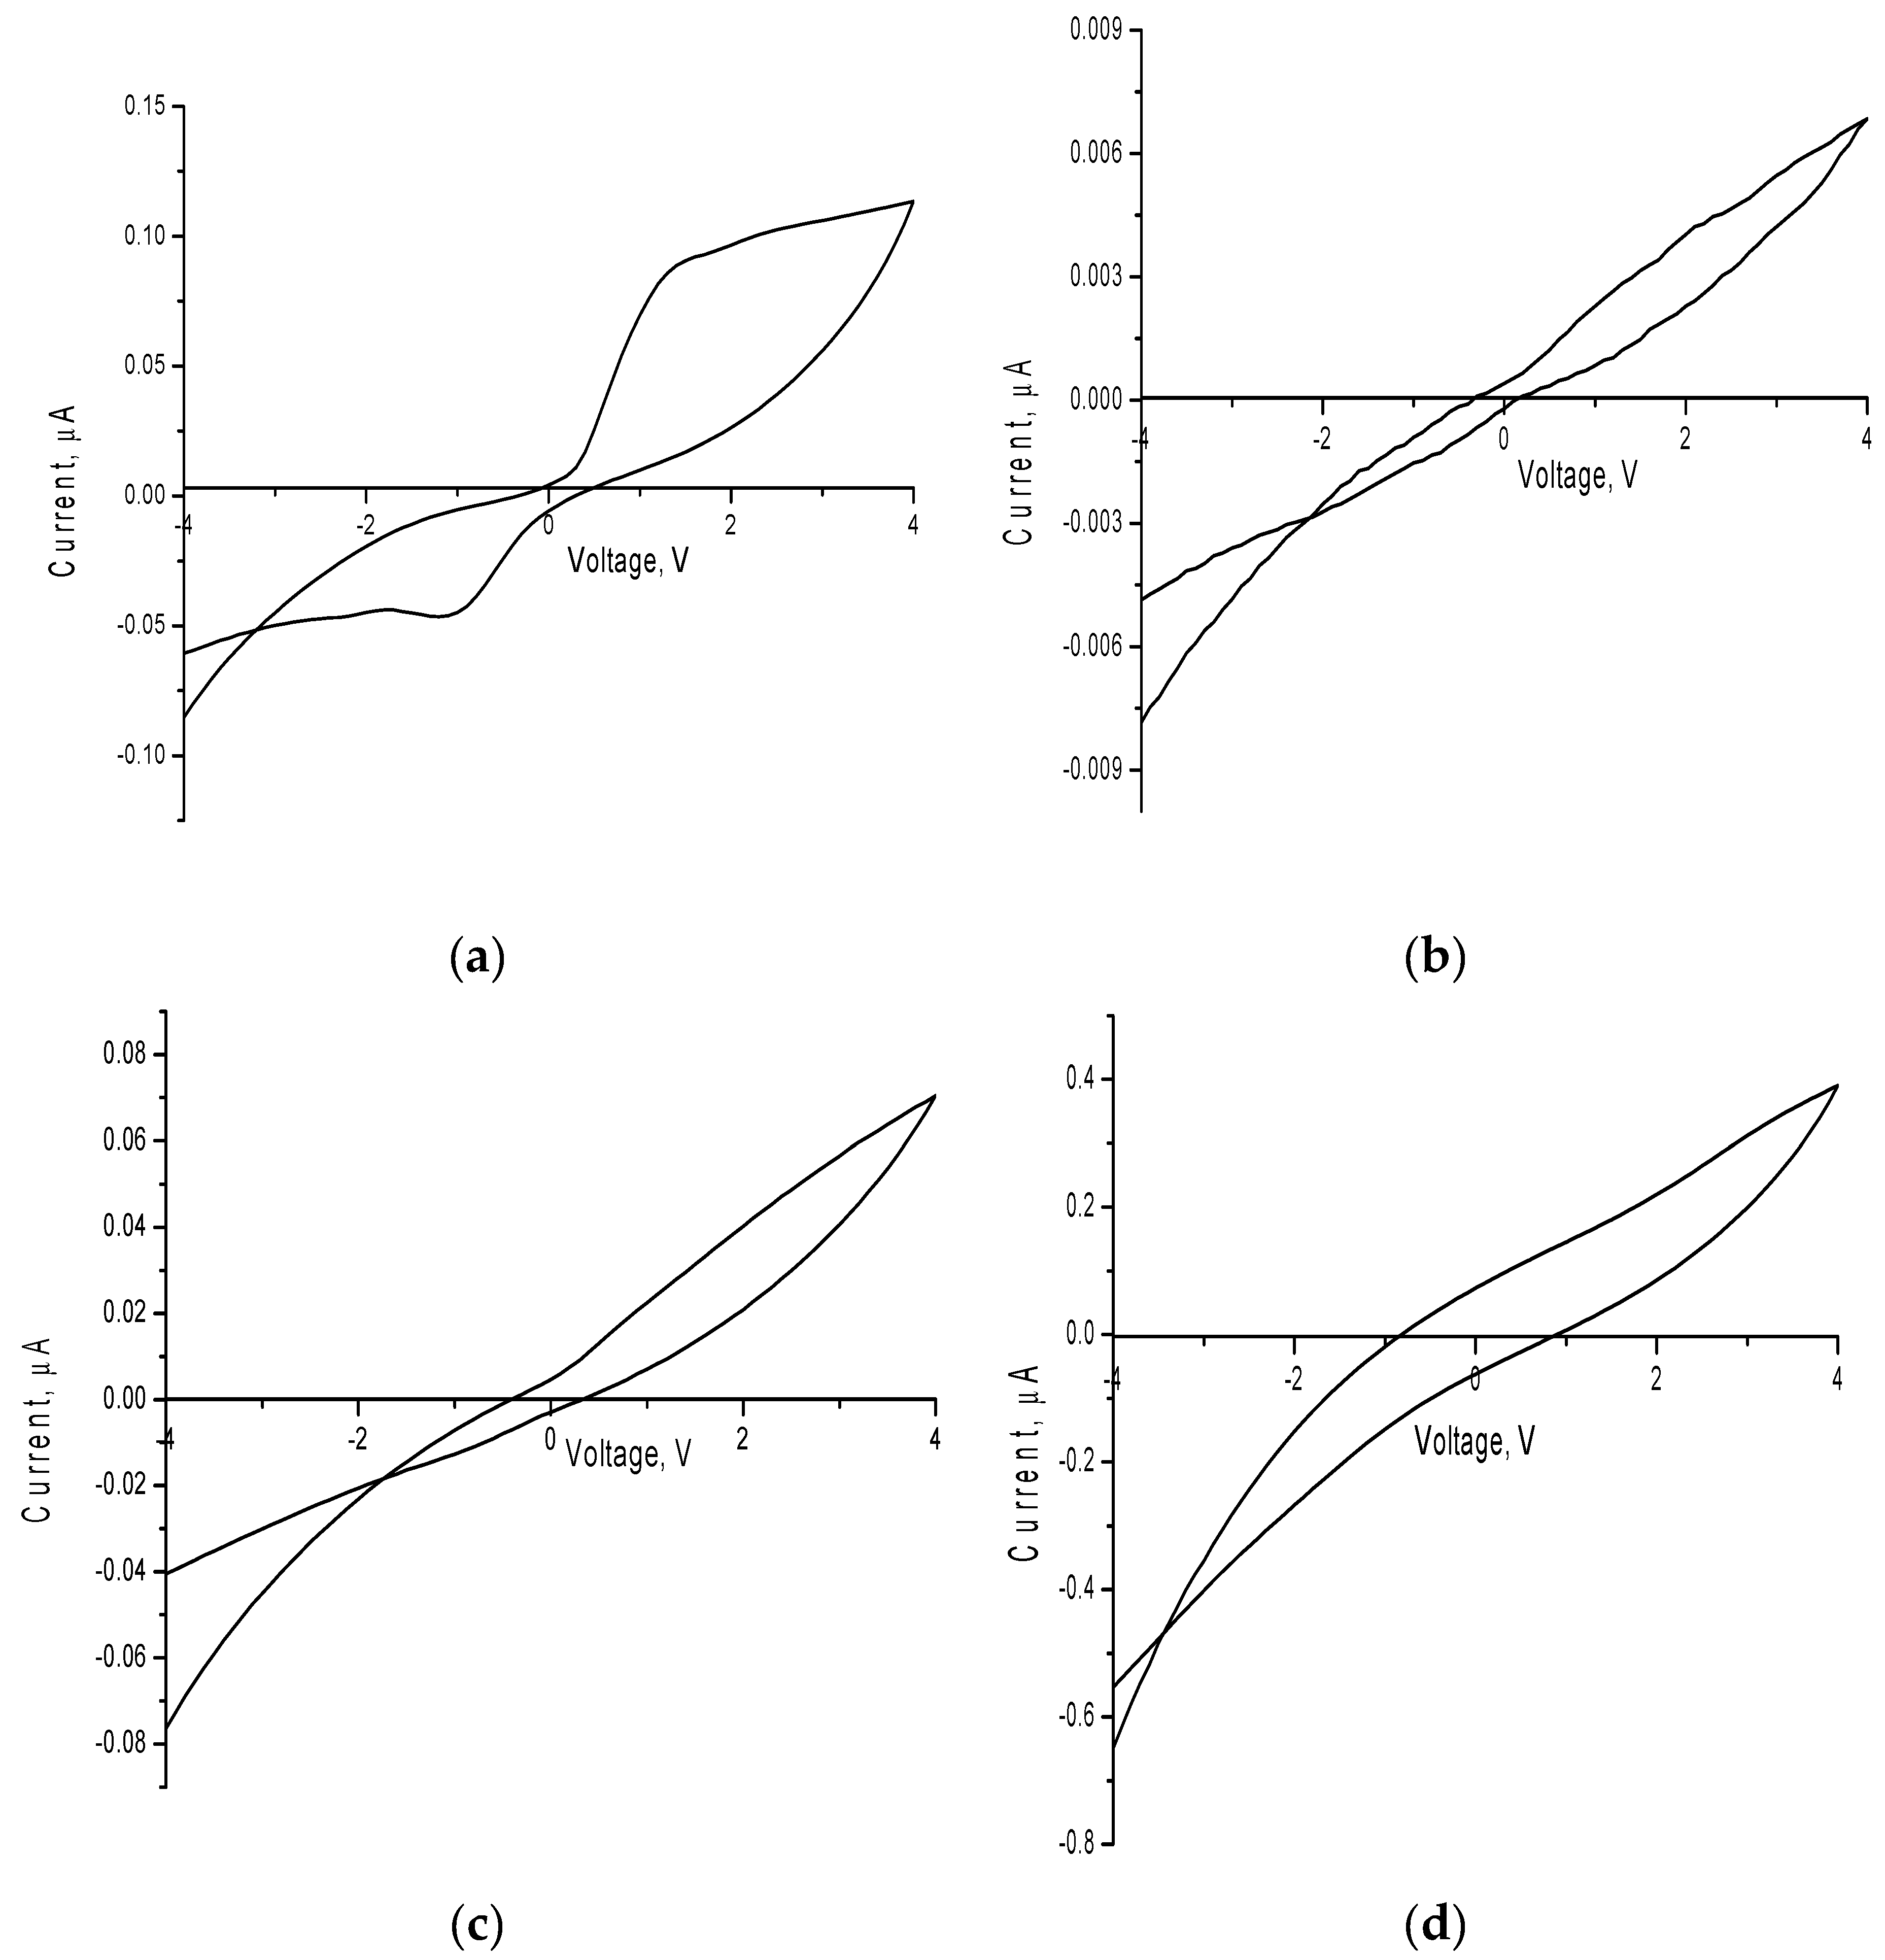
3. Results and Discussion
4. Conclusions
Author Contributions
Funding
Conflicts of Interest
References
- Niu, L.; Wei, T.; Li, Q.; Zhang, G.; Xian, G.; Long, Z.; Ren, Z. Ce-based catalysts used in advanced oxidation processes for organic wastewater treatment: A review. J. Environ. Sci. 2020, 96, 109–116. [Google Scholar] [CrossRef]
- Zhang, Q.; Zhou, W.; Cui, Y.; Lyu, C.; Liu, T.; Zhang, R.; Zhang, R.; Zheng, J.; Shi, Z.; Lu, C.; et al. Iron triad nanomaterials and their sustainable application in the environment. Environ. Sci. Nano 2018, 5, 246–256. [Google Scholar] [CrossRef]
- Balcaen, V.; Poelman, H.; Poelman, D.; Marina, G.B. Kinetic modeling of the total oxidation of propane over Cu-and Ce-based catalysts. J. Catal. 2011, 283, 75–88. [Google Scholar] [CrossRef]
- Zhang, N.; Zhang, G.; Chong, S.; Zhao, H.; Huang, T.; Zhu, J. Ultrasonic impregnation of MnO2/CeO2 and its application in catalytic sono-degradation of methyl orange. J. Environ. Manag. 2017, 205, 134–141. [Google Scholar]
- Weia, X.; Zhuabcd, N.; Huanga, X.; Kanga, N.; Wuabcd, P.; Dangab, Z. Efficient degradation of sodium diclofenac via heterogeneous Fenton reaction boosted by Pd/Fe@Fe3O4 nanoparticles derived from bio-recovered palladium. J. Environ. Manag. 2020, 260, 110072. [Google Scholar] [CrossRef] [PubMed]
- Khataee, A.; Gholami, P.; Kalderis, D.; Pachatouridou, E.; Konsolakis, M. Preparation of novel CeO2-biochar nanocomposite for sonocatalytic degradation of a textile dye. Ultrason. Sonochem. 2018, 41, 503–513. [Google Scholar] [CrossRef] [PubMed]
- Chong, S.; Zhang, G.; Zhang, N.; Liu, Y.; Zhu, J.; Huang, T.; Fang, S. Preparation of FeCeO x by ultrasonic impregnation method for heterogeneous Fenton degradation of diclofenac. Ultrason. Sonochem. 2016, 32, 231–240. [Google Scholar] [CrossRef]
- Huang, F.; Wang, J.; Chen, W.; Wan, Y.; Wang, X.; Cai, N.; Liu, J.; Yu, F. Synergistic peroxidase-like activity of CeO 2 -coated hollow Fe 3 O 4 nanocomposites as an enzymatic mimic for low detection limit of glucose. J. Taiwan Inst. Chem. Eng. 2018, 83, 40–49. [Google Scholar] [CrossRef]
- Mura, S.; Jiang, Y.; Vassalini, I.; Gianoncelli, A.; Alessandri, I.; Granozzi, G.; Calvillo, L.; Senes, N.; Enzo, S.; Innocenzi, P.; et al. Graphene Oxide/Iron Oxide Nanocomposites for Water Remediation. ACS Appl. Nano Mater. 2018, 1, 6724–6732. [Google Scholar] [CrossRef]
- Kang, Y.-G.; Yoon, H.; Lee, C.-S.; Kim, E.-J.; Chang, Y.-S. Advanced oxidation and adsorptive bubble separation of dyes using MnO2-coated Fe3O4 nanocomposite. Water Res. 2019, 151, 413–422. [Google Scholar] [CrossRef]
- Wang, L.; Wang, J.; Liu, X.; Chen, Y.; Cheng, H.; Wu, Y.; Peng, H.; Mab, Z. FeCeOx with improved activity for catalytic reduction of NO with NH3. J. Phys. Chem. Solids 2020, 142, 109472. [Google Scholar] [CrossRef]
- Khataee, A.; Hassandoost, R.; Pouran, S.R. Cerium-substituted magnetite: Fabrication, characterization and sonocatalytic activity assessment. Ultrason. Sonochem. 2018, 41, 626–640. [Google Scholar] [CrossRef] [PubMed]
- Zhou, H.; Zhao, Z. The Preparation, Characterization and Photocatalytic Activity of FexCe1-xO2-n Microstructures. Integr. Ferroelectr. 2015, 164, 33–44. [Google Scholar] [CrossRef]
- Liu, J.; Zhou, J.; Ding, Z.; Zhao, Z.; Xu, X.; Fang, Z. Ultrasound irritation enhanced heterogeneous activation of peroxymonosulfate with Fe 3 O 4 for degradation of azo dye. Ultrason. Sonochem. 2017, 34, 953–959. [Google Scholar] [CrossRef]
- Channei, D.; Inceesungvorn, B.; Wetchakun, N.; Phanichphant, S.; Nakaruk, A.; Koshy, P.; Sorrell, C. Photocatalytic activity under visible light of Fe-doped CeO2 nanoparticles synthesized by flame spray pyrolysis. Ceram. Int. 2013, 39, 3129–3134. [Google Scholar] [CrossRef]
- Zhang, H.; Zhang, M.; Hao, L.; Wang, J.; Ma, Y.; Zhang, Y.; Jiao, T.; Zhang, W.; Chen, S.; Liang, P. Enhanced SO2 tolerance of FeCeOx/CNTs catalyst for NO and Hg0 removal by coating shell SiO2. Fuel Process. Technol. 2020, 201, 106342. [Google Scholar] [CrossRef]
- He, C.; Xu, B.-T.; Shi, J.-W.; Qiao, N.-L.; Hao, Z.; Zhao, J.-L. Catalytic destruction of chlorobenzene over mesoporous ACeOx (A=Co, Cu, Fe, Mn, or Zr) composites prepared by inorganic metal precursor spontaneous precipitation. Fuel Process. Technol. 2015, 130, 179–187. [Google Scholar] [CrossRef]
- Shafiee, M.R.M.; Sadeghian, M.; Kargar, M. ZnFe2O4-Fe2O3-CeO2 composite nanopowder: Preparation, magnetic properties, and 4-chlorophenol removal characterizations. Ceram. Int. 2017, 43, 14068–14073. [Google Scholar] [CrossRef]
- Ouyang, J.; Zhao, Z.; Subi, S.L.; Yang, H. Degradation of Congo Red dye by a Fe2O3@ CeO2-ZrO2/Palygorskite composite catalyst: Synergetic effects of Fe2O3. J. Colloid Interface Sci. 2018, 539, 135–145. [Google Scholar] [CrossRef]
- Shanmugam, V.; Sanjeevamuthu, S.; Jeyaperumal, K.S.; Vairamuthu, R. Construction of α-Fe2O3/CeO2 decorated g-C3N4 nanosheets for magnetically separable efficient photocatalytic performance under visible light exposure and bacterial disinfection. Appl. Surf. Sci. 2019, 488, 763–777. [Google Scholar]
- Liu, Y.; Szeifert, J.M.; Feckl, J.M.; Mandlmeier, B.; Rathousky, J.; Hayden, O.; Fattakhova-Rohlfing, D.; Bein, T. Niobium-Doped Titania Nanoparticles: Synthesis and Assembly into Mesoporous Films and Electrical Conductivity. ACS Nano 2010, 4, 5373–5381. [Google Scholar] [CrossRef] [PubMed]
- Kruefu, V.; Peterson, E.; Khantha, C.; Siriwong, C.; Phanichphant, S.; Carroll, D.L. Flame-made niobium doped zinc oxide nanoparticles in bulk heterojunction solar cells. Appl. Phys. Lett. 2010, 97, 53302. [Google Scholar] [CrossRef]
- Yue, J.; Suchomski, C.; Voepel, P.; Ellinghaus, R.; Rohnke, M.; Leichtweiss, T.; Elm, M.T.; Smarsly, B.M. Mesoporous niobium-doped titanium dioxide films from the assembly of crystalline nanoparticles: Study on the relationship between the band structure, conductivity and charge storage mechanism. J. Mater. Chem. A 2017, 5, 1978–1988. [Google Scholar] [CrossRef] [Green Version]
- Piggott, E.K.; Hope, T.O.; Crabbe, B.W.; Jalbert, P.-M.; Orlova, G.; Hallett-Tapley, G.L. Exploiting the photocatalytic activity of gold nanoparticle-functionalized niobium oxide perovskites in nitroarene reductions. Catal. Sci. Technol. 2017, 7, 5758–5765. [Google Scholar] [CrossRef]
- Zhang, C.; Ikeda, M.; Uchikoshi, T.; Li, J.-G.; Watanabe, T.; Ishigaki, T. High-concentration niobium (V) doping into TiO2 nanoparticles synthesized by thermal plasma processing. J. Mater. Res. 2011, 26, 658–671. [Google Scholar] [CrossRef]
- Kadyrzhanov, K.K.; Egizbek, K.; Kozlovskiy, A.L.; Zdorovets, M. Synthesis and Properties of Ferrite-Based Nanoparticles. Nanomaterials 2019, 9, 1079. [Google Scholar] [CrossRef] [Green Version]
- Gao, S.; Zhang, W.; Zhou, H.; Chen, D. Magnetic composite Fe3O4/CeO2 for adsorption of azo dye. J. Rare Earth 2018, 36, 986–993. [Google Scholar] [CrossRef]
- Channei, D.; Inceesungvorn, B.; Wetchakun, N.; Phanichphant, S. Synthesis of Fe3O4/SiO2/CeO2 core–shell magnetic and their application as photocatalyst. J. Nanosci. Nanotechnol. 2014, 14, 7756–7762. [Google Scholar] [CrossRef] [PubMed]
- Gan, G.; Liu, J.; Zhu, Z.; Yang, Z.; Zhang, C.; Hou, X. A novel magnetic nanoscaled Fe3O4/CeO2 composite prepared by oxidation-precipitation process and its application for degradation of orange G in aqueous solution as Fenton-like heterogeneous catalyst. Chemosphere 2017, 168, 254–263. [Google Scholar] [CrossRef]
- Egizbek, K.; Kozlovskiy, A.L.; Ludzik, K.; Zdorovets, M.V.; Ibragimova, M.A.; Marciniak, B.; Jazdzewska, M.; Chudoba, D.; Nazarova, A.; Kontek, R. Application of Fe2O3/CeO2 nanocomposites for the purification of aqueous media. Appl. Phys. A-Mater. 2020, 126, 477. [Google Scholar] [CrossRef]


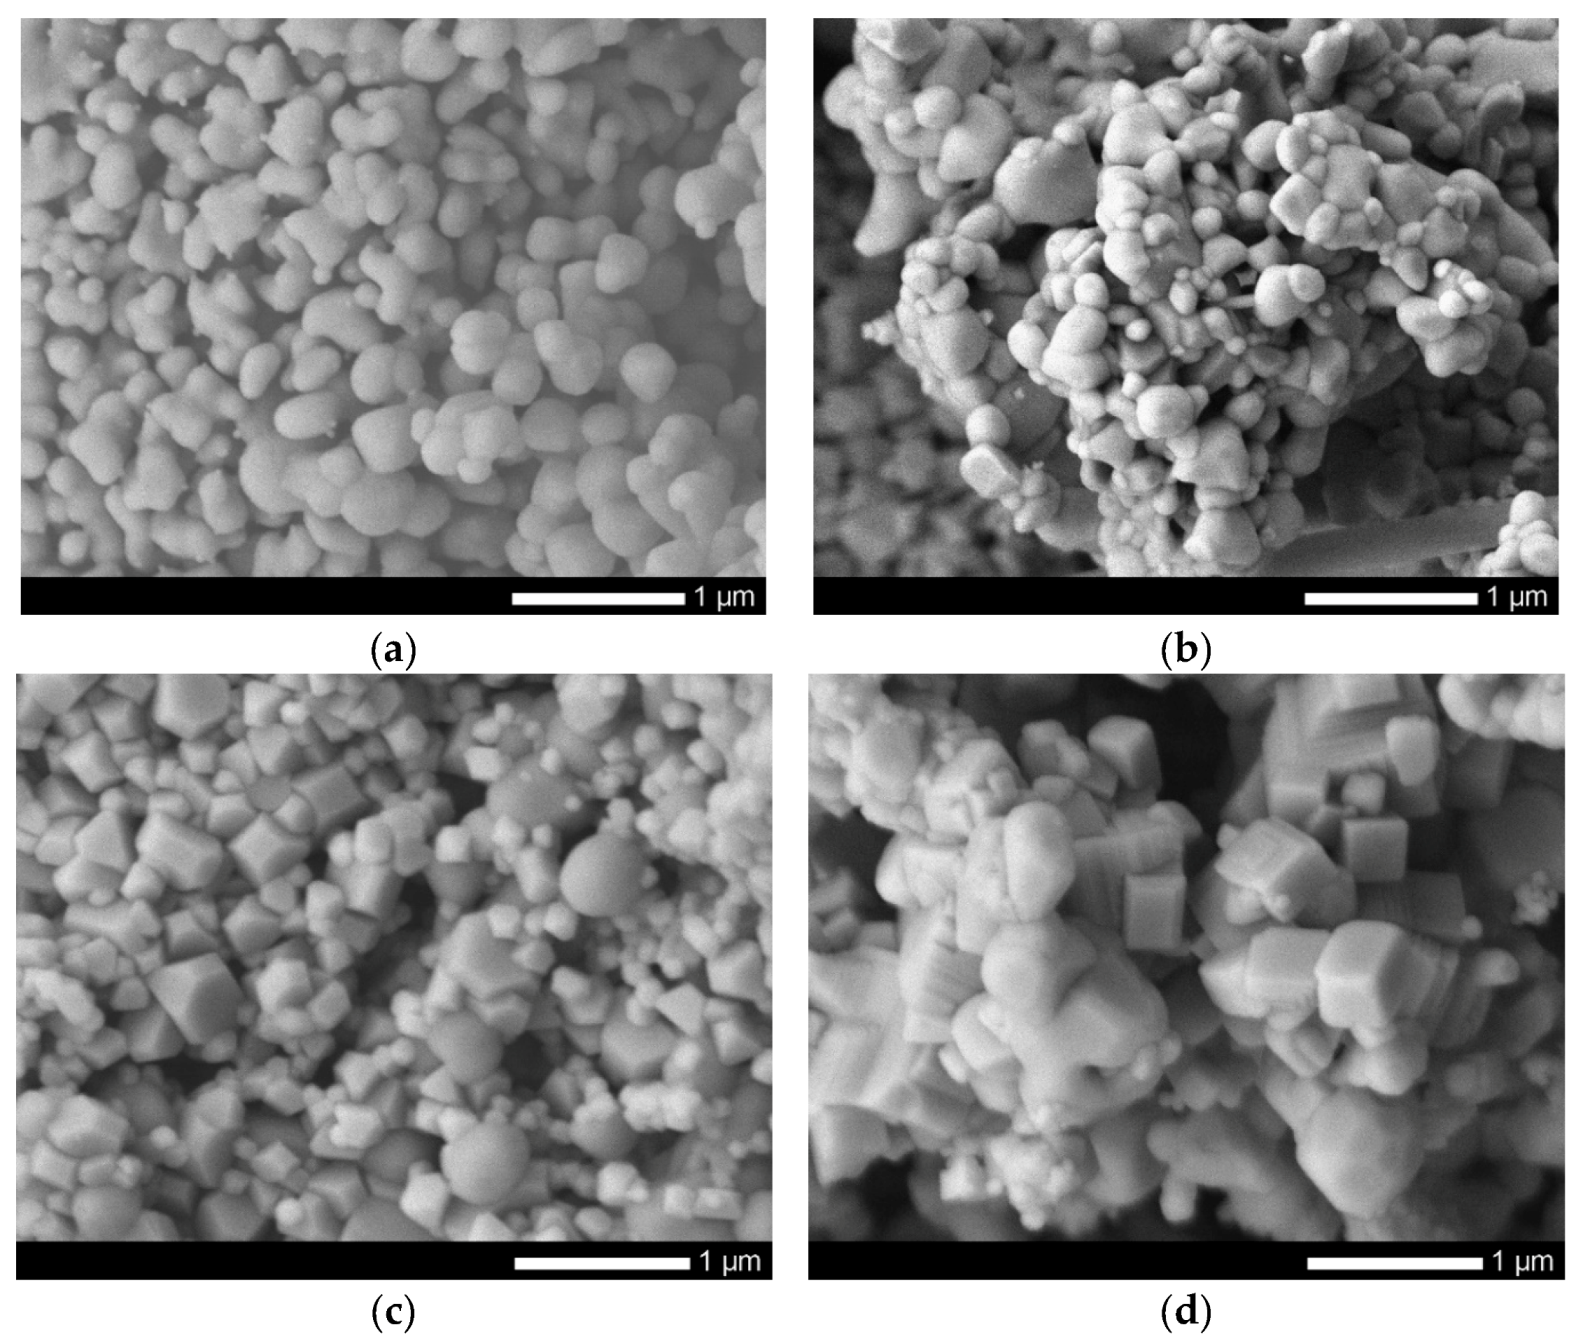
| Sample | Fe, at.w.% | Ce, at.w.% | Nb, at.w.% | O, at.w.% | Specific Surface Area, m2/g | Ratio of Spherical and Cubic Nanoparticles |
|---|---|---|---|---|---|---|
| FeCeOx nanoparticles | 14.1 ± 1.1 | 29.5 ± 2.2 | - | 56.4 ± 3.4 | 0.0087 | 100:0 |
| 0.9FeCeOx + 0.1Nb2O5 nanoparticles | 13.2 ± 1.5 | 22.2 ± 2.1 | 9.2 ± 1.2 | 55.4 ± 3.1 | 0.0109 | 78:22 |
| 0.8FeCeOx + 0.2 Nb2O5 nanoparticles | 13.6 ± 1.2 | 13.4 ± 1.3 | 14.1 ± 1.5 | 58.9 ± 2.5 | 0.0126 | 34:66 |
| 0.7FeCeOx + 0.3 Nb2O5 nanoparticles | 13.2 ± 1.3 | 7.8 ± 0.7 | 19.4 ± 1.2 | 59.6 ± 2.7 | 0.0098 | 3:97 |
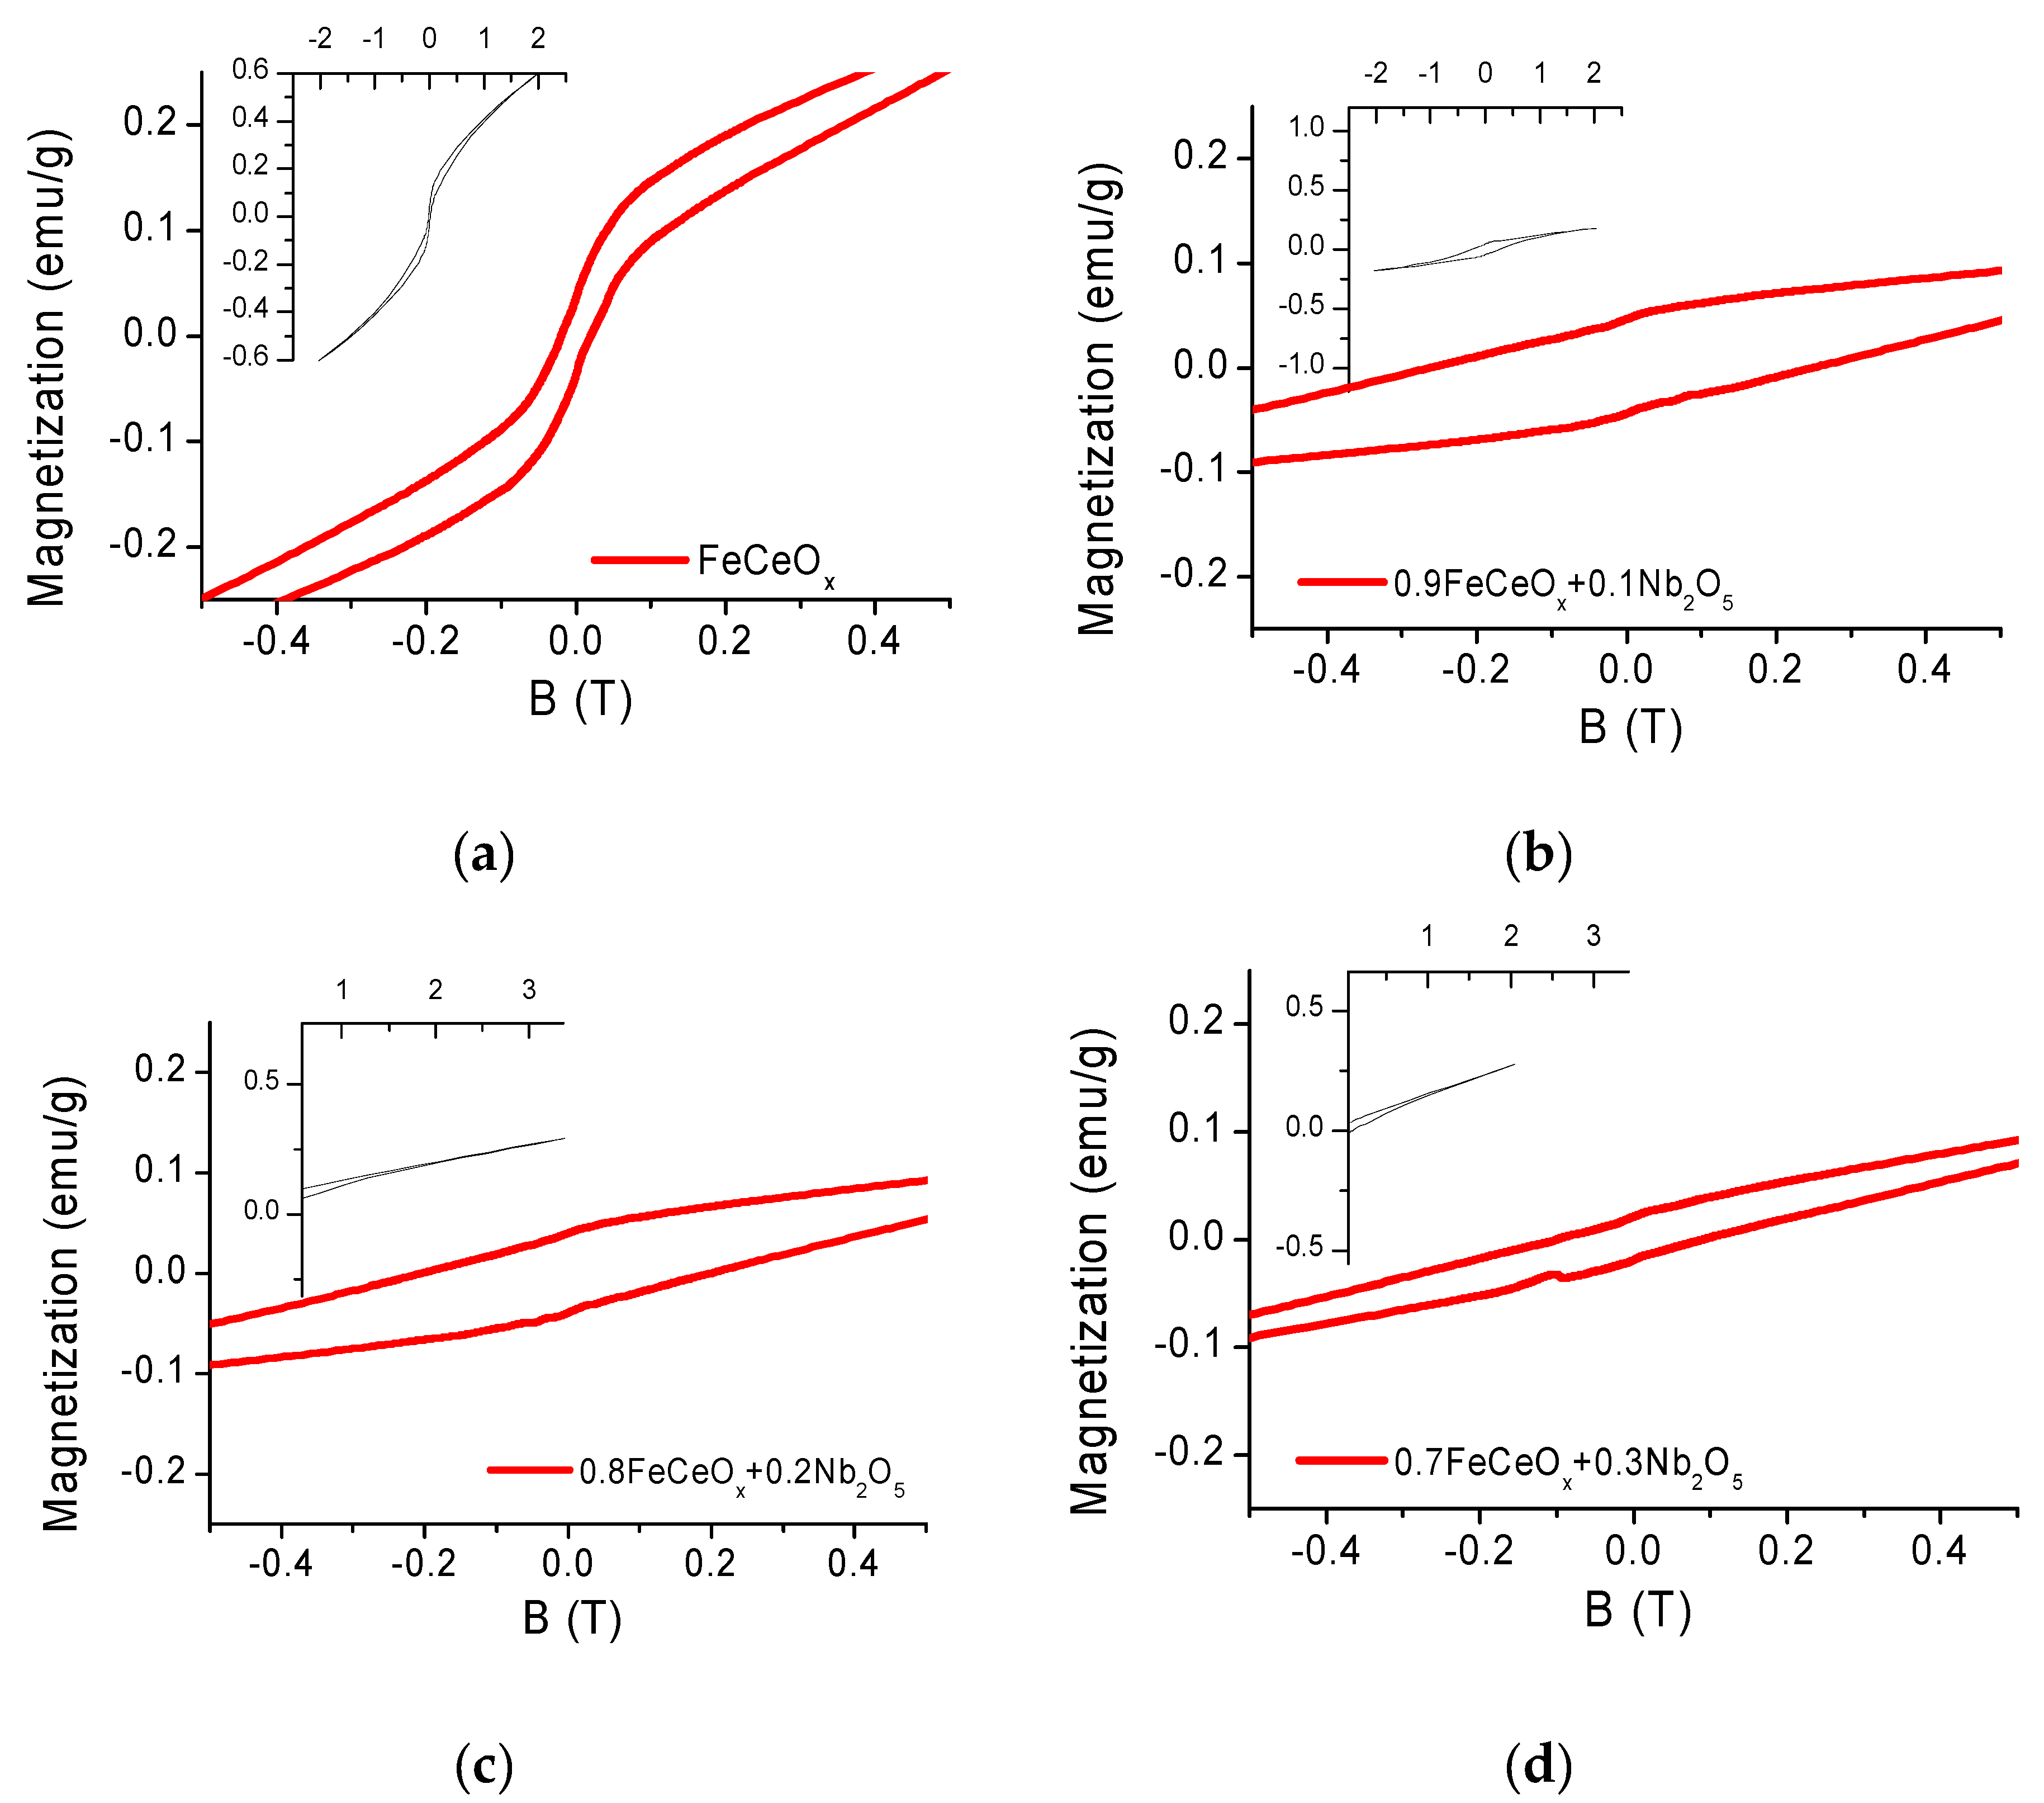
| Sample | Hc, Oe 1 | Mr, emu/g 2 | Ms, emu/g 3 | Mr/Ms 4 |
|---|---|---|---|---|
| FeCeOx nanoparticles | 200 | 0.0375 | 0.26 | 0.144 |
| 0.9FeCeOx + 0.1Nb2O5 nanoparticles | 2586 | 0.0448 | 0.195 | 0.23 |
| 0.8FeCeOx + 0.2Nb2O5 nanoparticles | 2035 | 0.0395 | 0.375 | 0.105 |
| 0.7FeCeOx + 0.3Nb2O5 nanoparticles | 960 | 0.0207 | 0.189 | 0.11 |
© 2020 by the authors. Licensee MDPI, Basel, Switzerland. This article is an open access article distributed under the terms and conditions of the Creative Commons Attribution (CC BY) license (http://creativecommons.org/licenses/by/4.0/).
Share and Cite
Kozlovskiy, A.; Egizbek, K.; Zdorovets, M.V.; Ibragimova, M.; Shumskaya, A.; Rogachev, A.A.; Ignatovich, Z.V.; Kadyrzhanov, K. Evaluation of the Efficiency of Detection and Capture of Manganese in Aqueous Solutions of FeCeOx Nanocomposites Doped with Nb2O5. Sensors 2020, 20, 4851. https://doi.org/10.3390/s20174851
Kozlovskiy A, Egizbek K, Zdorovets MV, Ibragimova M, Shumskaya A, Rogachev AA, Ignatovich ZV, Kadyrzhanov K. Evaluation of the Efficiency of Detection and Capture of Manganese in Aqueous Solutions of FeCeOx Nanocomposites Doped with Nb2O5. Sensors. 2020; 20(17):4851. https://doi.org/10.3390/s20174851
Chicago/Turabian StyleKozlovskiy, Artem, Kamila Egizbek, Maxim V. Zdorovets, Milana Ibragimova, Alena Shumskaya, Alexandr A. Rogachev, Zhanna V. Ignatovich, and Kayrat Kadyrzhanov. 2020. "Evaluation of the Efficiency of Detection and Capture of Manganese in Aqueous Solutions of FeCeOx Nanocomposites Doped with Nb2O5" Sensors 20, no. 17: 4851. https://doi.org/10.3390/s20174851