Article

Detection of Triacetone Triperoxide (TATP) Precursors with an Array of Sensors Based on MoS2/RGO Composites

1
School of Physics Science and Technology, Xinjiang University, Urumqi 830046, China
2
Key Laboratory of Energy Materials Chemistry, Ministry of Education, Key Laboratory of Advanced Functional Materials, Xinjiang University, Urumqi 830046, China
*
Authors to whom correspondence should be addressed.
Sensors 2019, 19(6), 1281; https://doi.org/10.3390/s19061281
Submission received: 27 January 2019 / Revised: 6 March 2019 / Accepted: 8 March 2019 / Published: 13 March 2019
(This article belongs to the Collection Gas Sensors)

Abstract

:
Triacetone triperoxide (TATP) is a self-made explosive synthesized from the commonly used chemical acetone (C3H6O) and hydrogen peroxide (H2O2). As C3H6O and H2O2 are the precursors of TATP, their detection is very important due to the high risk of the presence of TATP. In order to detect the precursors of TATP effectively, hierarchical molybdenum disulfide/reduced graphene oxide (MoS2/RGO) composites were synthesized by a hydrothermal method, using two-dimensional reduced graphene oxide (RGO) as template. The effects of the ratio of RGO to raw materials for the synthesis of MoS2 on the morphology, structure, and gas sensing properties of the MoS2/RGO composites were studied. It was found that after optimization, the response to 50 ppm of H2O2 vapor was increased from 29.0% to 373.1%, achieving an increase of about 12 times. Meanwhile, all three sensors based on MoS2/RGO composites exhibited excellent anti-interference performance to ozone with strong oxidation. Furthermore, three sensors based on MoS2/RGO composites were fabricated into a simple sensor array, realizing discriminative detection of three target analytes in 14.5 s at room temperature. This work shows that the synergistic effect between two-dimensional RGO and MoS2 provides new possibilities for the development of high performance sensors.

1. Introduction

The detection of explosives remains a challenge to the rapid development of modern life [1]. The detection technology of explosives requires not only simple and inexpensive constituents, but also the ability to detect specific explosives quickly and accurately. In 1895, Wolffenstein found and synthesized triacetone triperoxide (TATP) [2], which is a self-made explosive synthesized from the common chemicals acetone (C3H6O) and hydrogen peroxide (H2O2) found in daily life [3,4]. Because it is difficult to detect [5,6], it is more popular for terrorist activities [4,7,8,9,10]. Therefore, it is very important to carry out the continuous monitoring of TATP precursors (C3H6O and H2O2) in public places [11,12]. In the past, researchers have also reported many TATP detection methods. For example, infrared (IR) [13], Raman spectroscopy [14,15], and mass spectrometry (MS) [16,17] detection methods; these detection methods have some defects of low sensitivity, slow response, high production cost, and a certain risk of detection [18,19]. In recent years, many articles on the detection of H2O2 have been reported, and their applications include environmental, biological, food, and industrial fields, using such as the non-enzymatic chemi-resistive H2O2 sensor [20,21], and reports of a C3H6O sensor [22,23,24], which achieve the advantages of low cost detection. In fact, simultaneous detection of H2O2 and C3H6O would provide a viable basis for the detection of explosive TATP. Of course using electrochemical detection of TATP precursors is not a new concept [8,25,26]. The Vladimir [27] team introduced a good response with nano-spring-based sensors for gases such as TATP precursors, as well as determining conditions for In2O3 [28] and WO3 [29] but still did not achieve operation at room temperature. The application of graphene in chemical gas sensors is receiving more and more attention [30,31]. Some important factors affecting the sensing properties of graphene were found in the process of continuous optimization of graphene sensing performances, for example, structural defects [32] and doped metal oxides [33]. Experiments [34] have shown that the defects at the edges of graphene nanoribbons interact more strongly with gas molecules, and the reduced graphene oxide (RGO) has a high defect density for fabricating gas sensors [35]. The composite materials based on RGO and metal oxides have been widely used for gas sensing, RGO/Fe2O3 nanocomposites achieve high selectivity to NO2 at room temperature and RGO/SnO2 etc. achieve detection of ambient gases at room temperature. Based on these experiments, it is necessary to achieve high sensitivity, rapid response, and accurate identification detection of TATP precursor gas at room temperature. It can be seen that RGO-based composite materials provide hope for the sensitive detection of TATP precursors at room temperature. More recently, composite materials of RGO/MoS2 have been fabricated and proved to be effective in gas sensing performance. The Bon-Cheol Ku team reported that the MoS2/RGO composite film can be used as a highly sensitive gas sensor that can detect concentrations of harmful gases such as NO2 as low as 0.15 ppm [35]. It is reported that the RGO/MoS2 hybrid film not only shows improved sensitivity to CH2O at room temperature, but also exhibits fast response characteristics and good reproducibility [36].
Both RGO and MoS2 are typical two-dimensional nanomaterials, which are generally p-type and n-type semiconductors, respectively [37,38]. As far as we know, RGO/MoS2 composites have not been used to detect TATP precursors sensitively at room temperature. The synergistic effect of RGO and MoS2 in gas sensing detection of TATP precursors is worth studying. Inspired by the above researches, in order to detect precursors of TATP effectively, the hierarchical MoS2/RGO composites were synthesized by a hydrothermal method, using two-dimensional RGO as template. The effects of the ratio of RGO to raw materials for the synthesis of MoS2 on the morphology, structure, and gas sensing properties of the MoS2/RGO composites were studied.

2. Materials and Methods

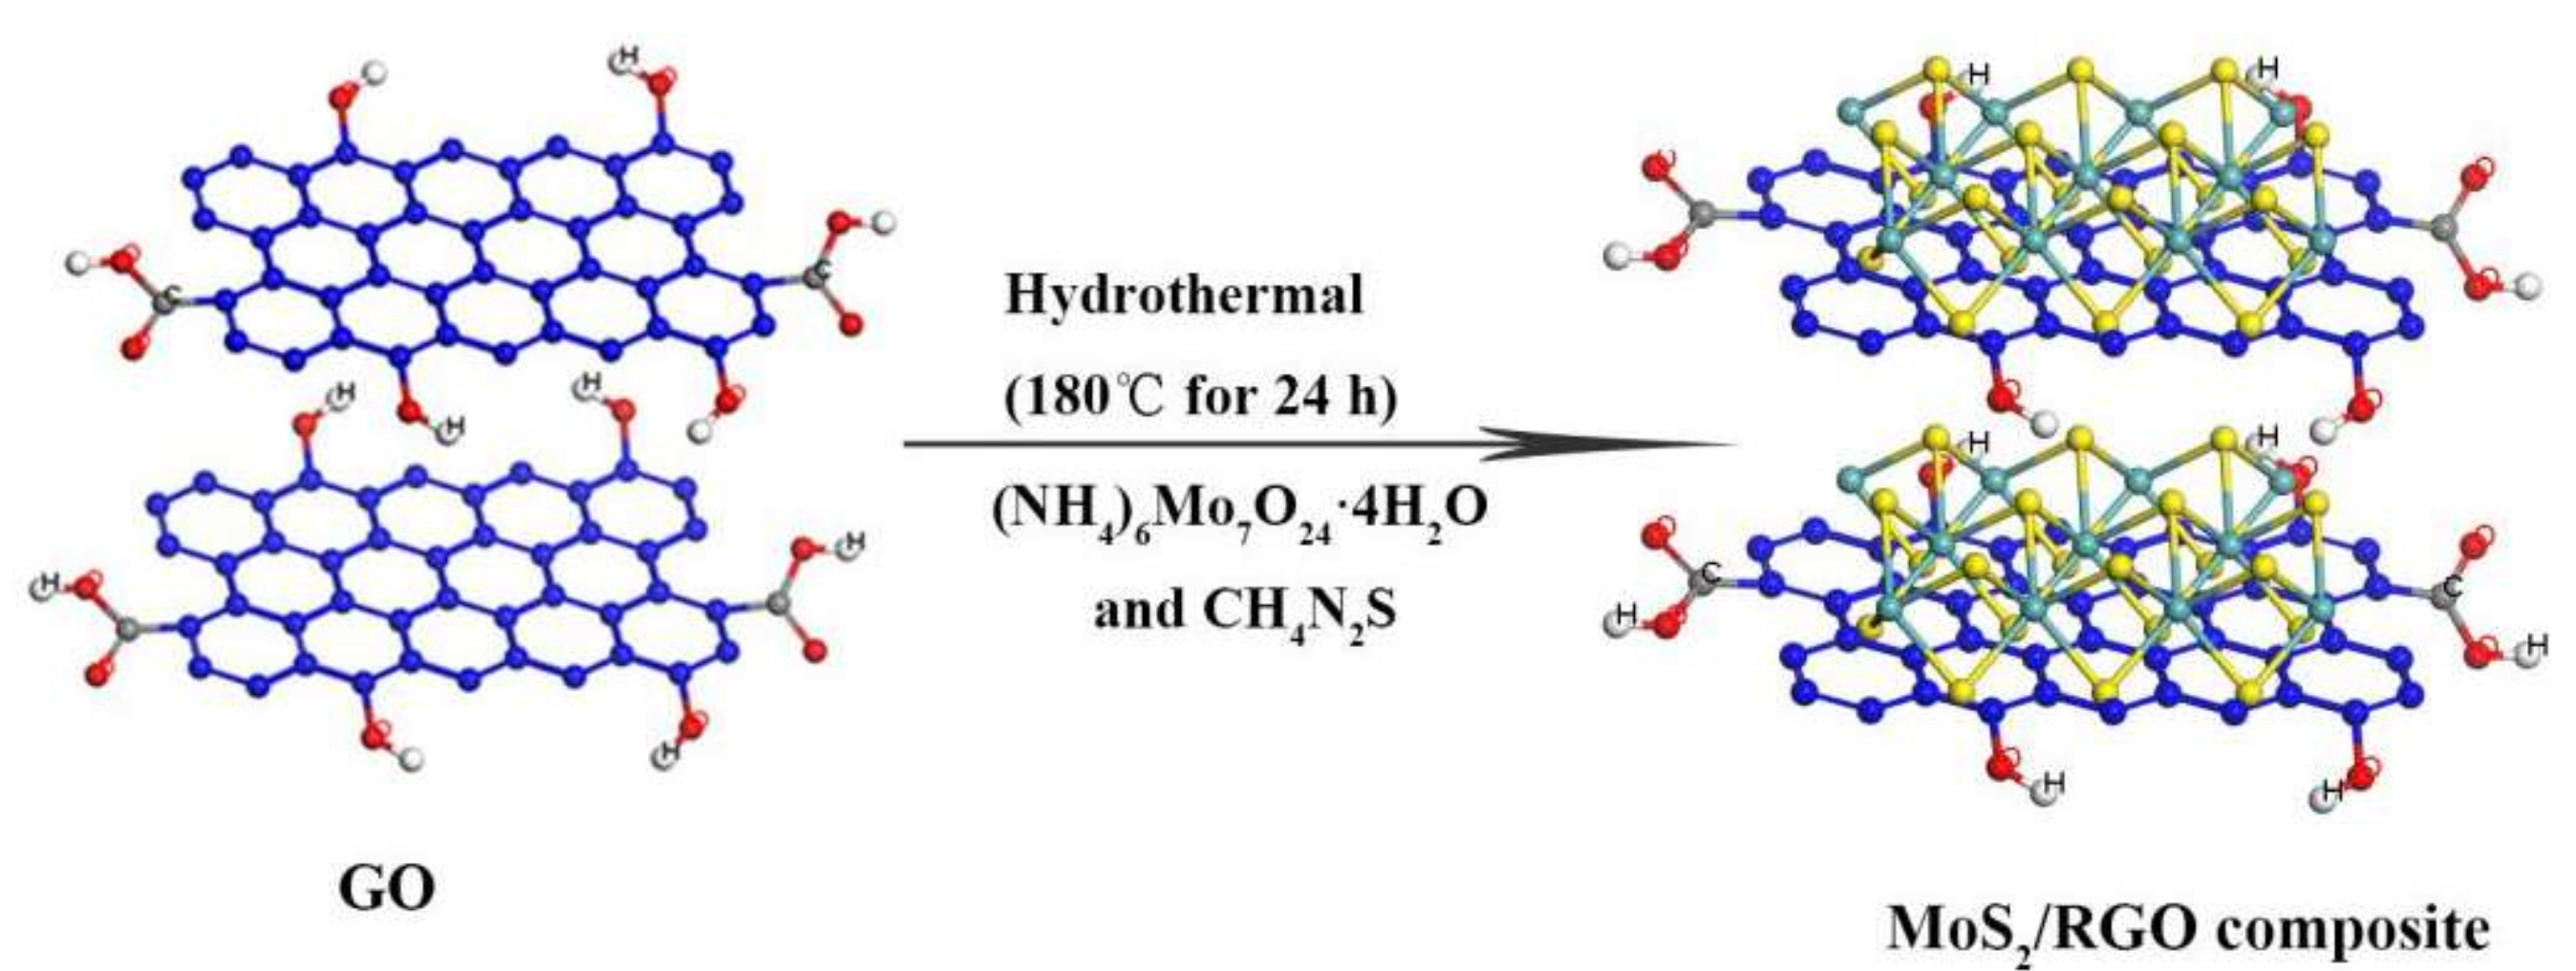
2.1. Preparation of MoS2/RGO Composites

Ammonium molybdate [(NH4)6Mo7O24·4H2O], thiourea (CH4N2S), and ethanol (C2H6O), analytical reagents, were purchased from Sinopharm Chemical Reagent Co., Ltd. H2O2 (30%) was purchased from Aladdin Reagent Co., Ltd. Graphene Oxide (GO) was synthesized from natural flake graphite (100 mesh) by Hummers method [39,40]. The preparation process of the MoS2/RGO composites can be summarized as follows. Amounts of, 1, 0.5, 0.33 mmol (NH4)6Mo7O24·4H2O and 30, 15, 10 mmol CH4N2S were dissolved in 35 mL diluted graphene solution, respectively, and stirred for 30 min to make them homogeneous. The three solutions were then transferred into three 45 mL polytetrafluoroethylene (PTFE) stainless steel autoclaves and maintained at 180 °C for 24 h. As shown in Figure 1, the raw materials for synthesis of MoS2 adsorbed on RGO first nucleate at high temperature to form MoS2 nanocrystals, and then form MoS2/RGO composites. Finally, the reaction system was cooled to room temperature naturally, the product was collected by centrifugation, washed with deionized water, and the sample preparation was concluded after drying for 20 h at 70 °C. For the convenience of description, the MoS2/RGO composites from 1, 0.5, 0.33 mmol (NH4)6Mo7O24·4H2O and 30, 15, 10 mmol CH4N2S were designated as MoS2/RGO-1, MoS2/RGO-2 and MoS2/RGO-3.

2.2. Characterization

The crystal structure of MoS2/RGO was characterized by X-ray diffraction (XRD) (Bruker D8 Advance, with Cu-Kα radiation). The morphology of MoS2/RGO was observed by transmission electron microscopy (TEM, JEM-2100F, Japan) and field emission scanning electron microscopy (FE-SEM, S-4800, Hitachi, Japan). The surface properties of MoS2/RGO were recorded using a Fourier Transform Infrared (FT-IR) spectrometer (Bruker-V Vertex 70, Karlsruhe, Germany). Raman Detection of samples was with a Raman Spectrometer (Raman spectrometer, Horiba Company, iHR550, Shanghai, China). The chemical composition of the main elements was studied by X-ray photoelectron spectroscopy (XPS K-Alpha+, Thermo Fisher Scientific, Waltham, MA, USA). The I–V curves of the sensors were tested by an electrochemical workstation (CIMPS-2, ZAHER ENNIUM) at room temperature.

2.3. Manufacture and Testing of Sensor Parts

The blank sensor chip was purchased from Beijing Elite Co., Ltd., Beijing, China. Platinum interdigitated electrodes with both finger-width and interfinger spacing of about 200 μM were printed on a ceramic substrate, forming a blank sensor chip. First, the sample was mixed with a quantity of deionized water to form a uniform slurry, and then the platinum finger fork electrode used to apply the uniform slurry to the ceramic substrate while the sensing film was formed by drying at room temperature (25 °C) for 24 h. The sensors based on MoS2/RGO-1, MoS2/RGO-2, and MoS2/RGO-3 were designated as sensor 1, sensor 2, and sensor 3, respectively. Finally, the sensor was aged in air for about 24 h with a 0.5 V voltage to ensure good stability. The gas sensing tests, including the definition of response, response time, and recovery time in this work are similar to the previous report [41]. The specific sensing tests of H2O2, C3H6O, C2H6O vapors, and Ozone (O3) are shown in the Supplementary Figure S1, and the sensitivity data was recorded by an electrochemical workstation (CIMPS-2, ZAHER ENNIUM) in a 25 °C air-conditioned room.

3. Results and Discussion

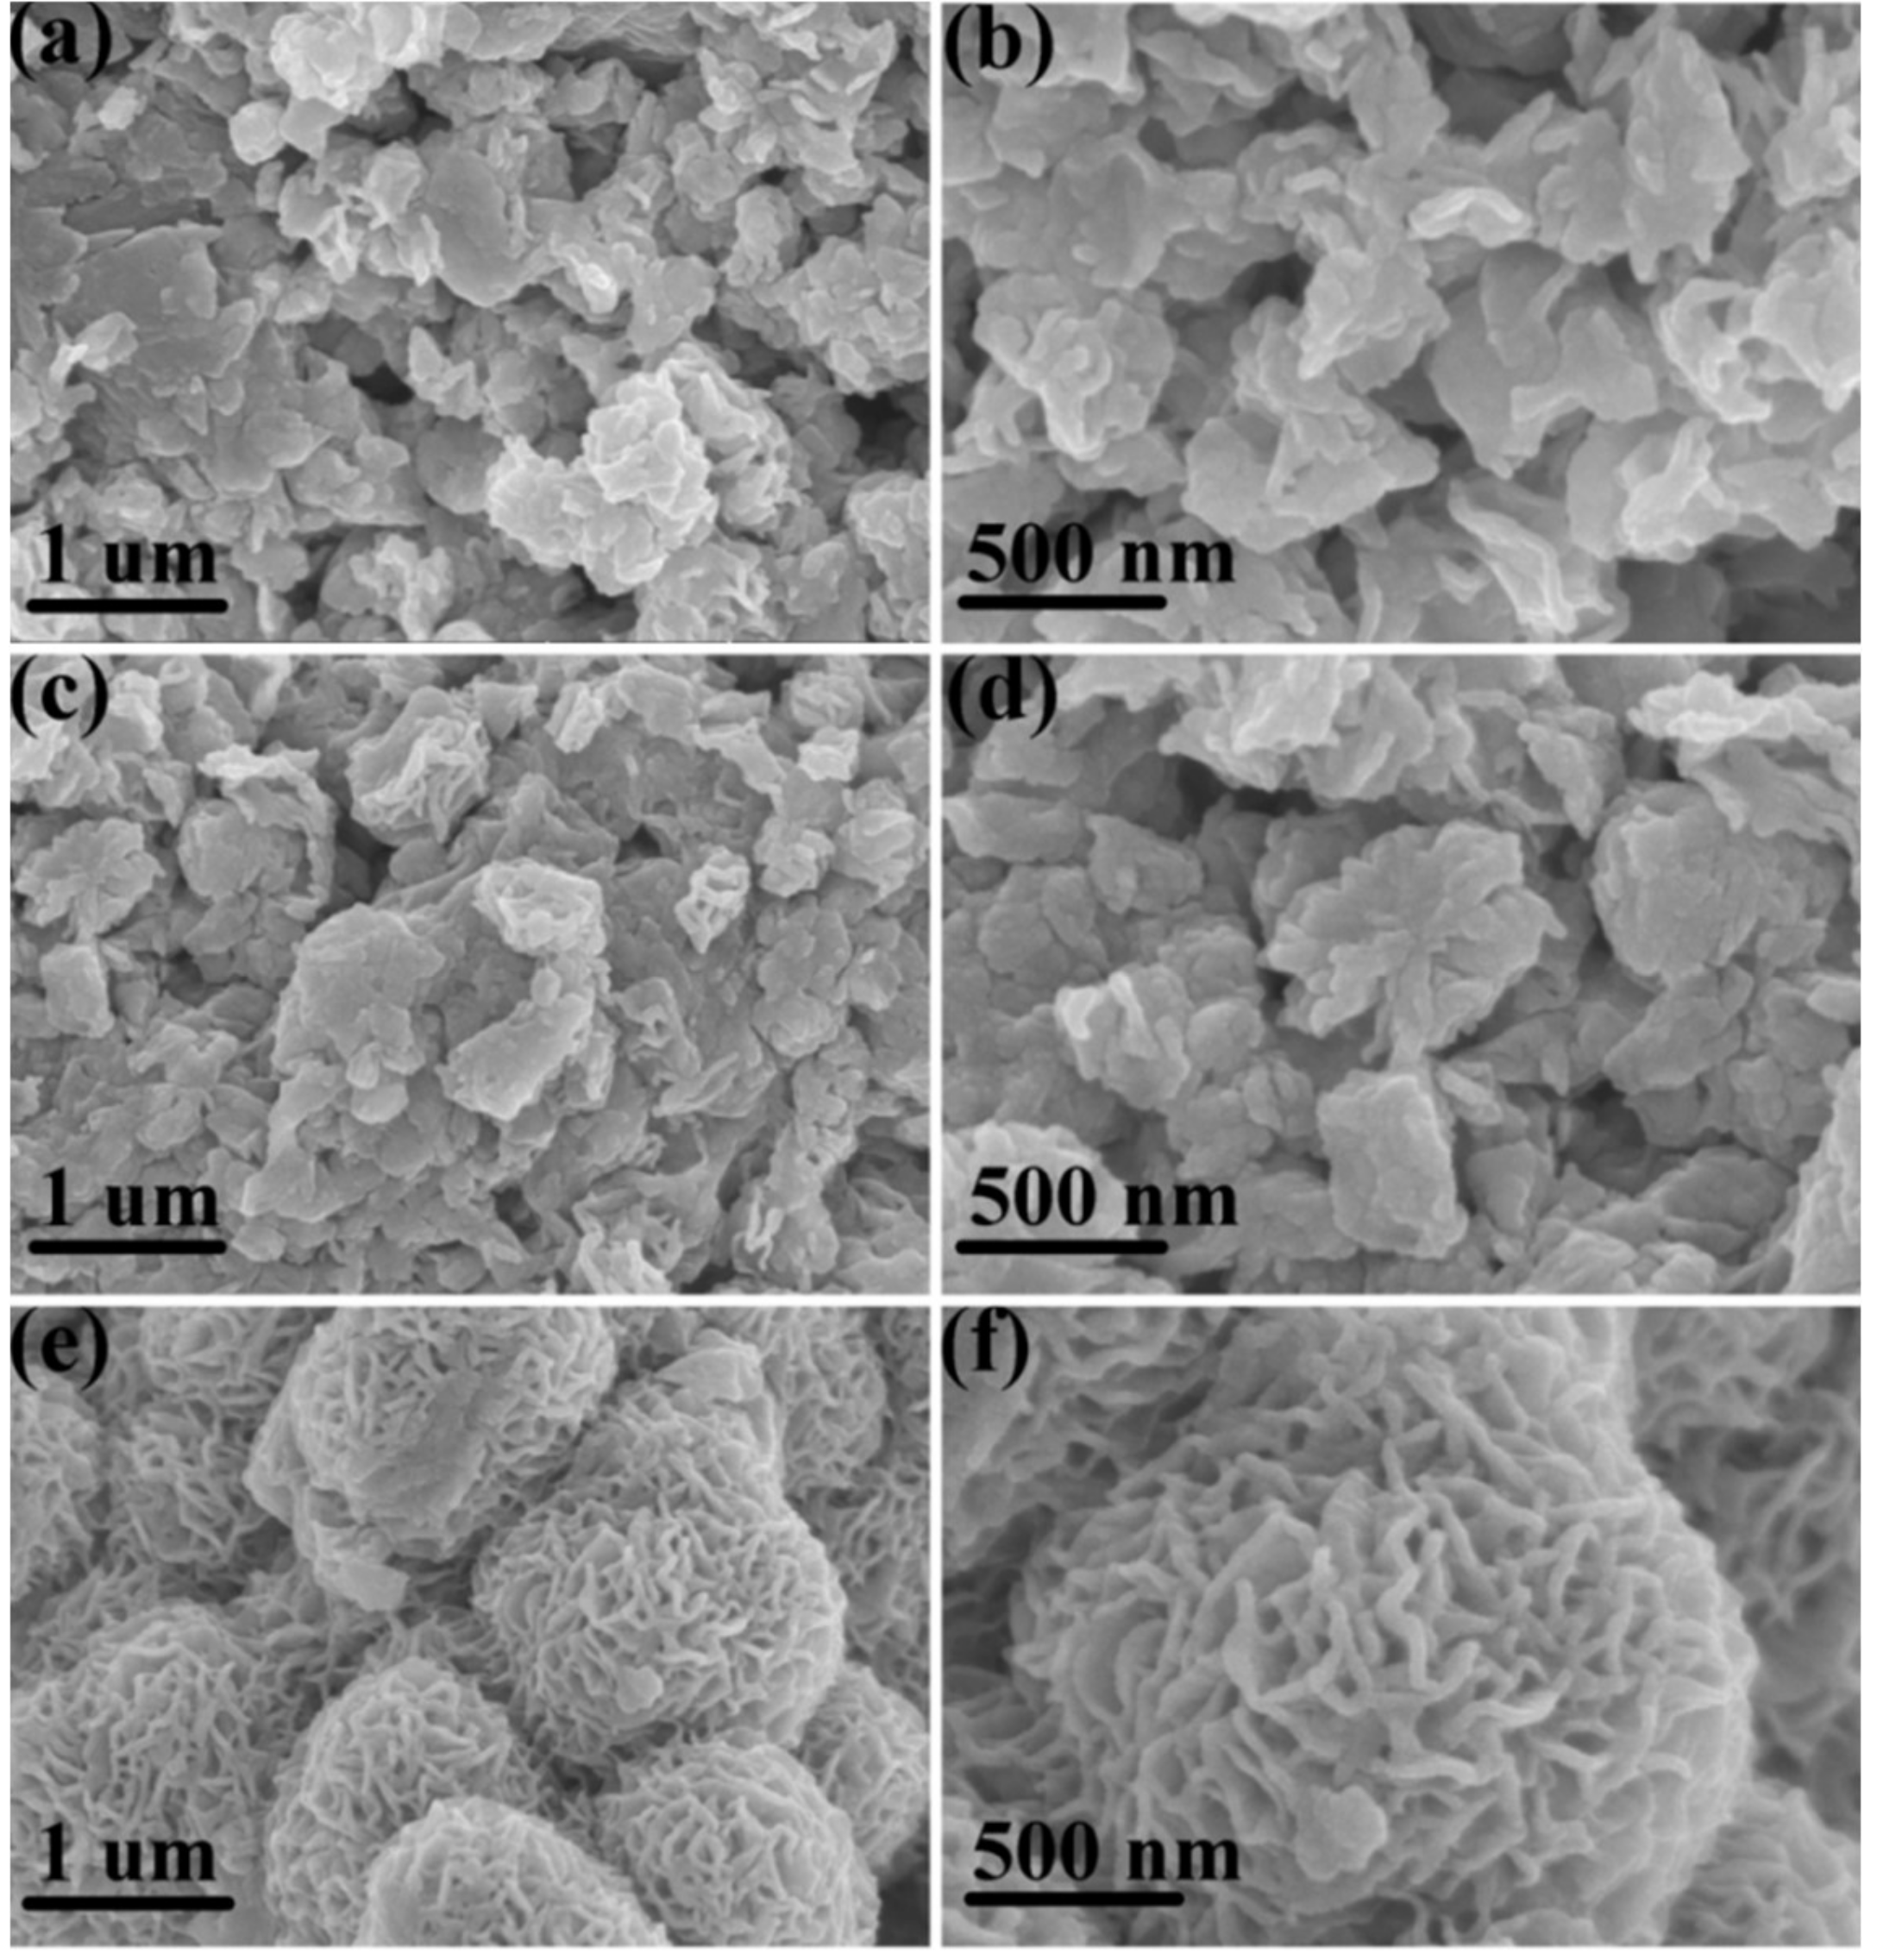
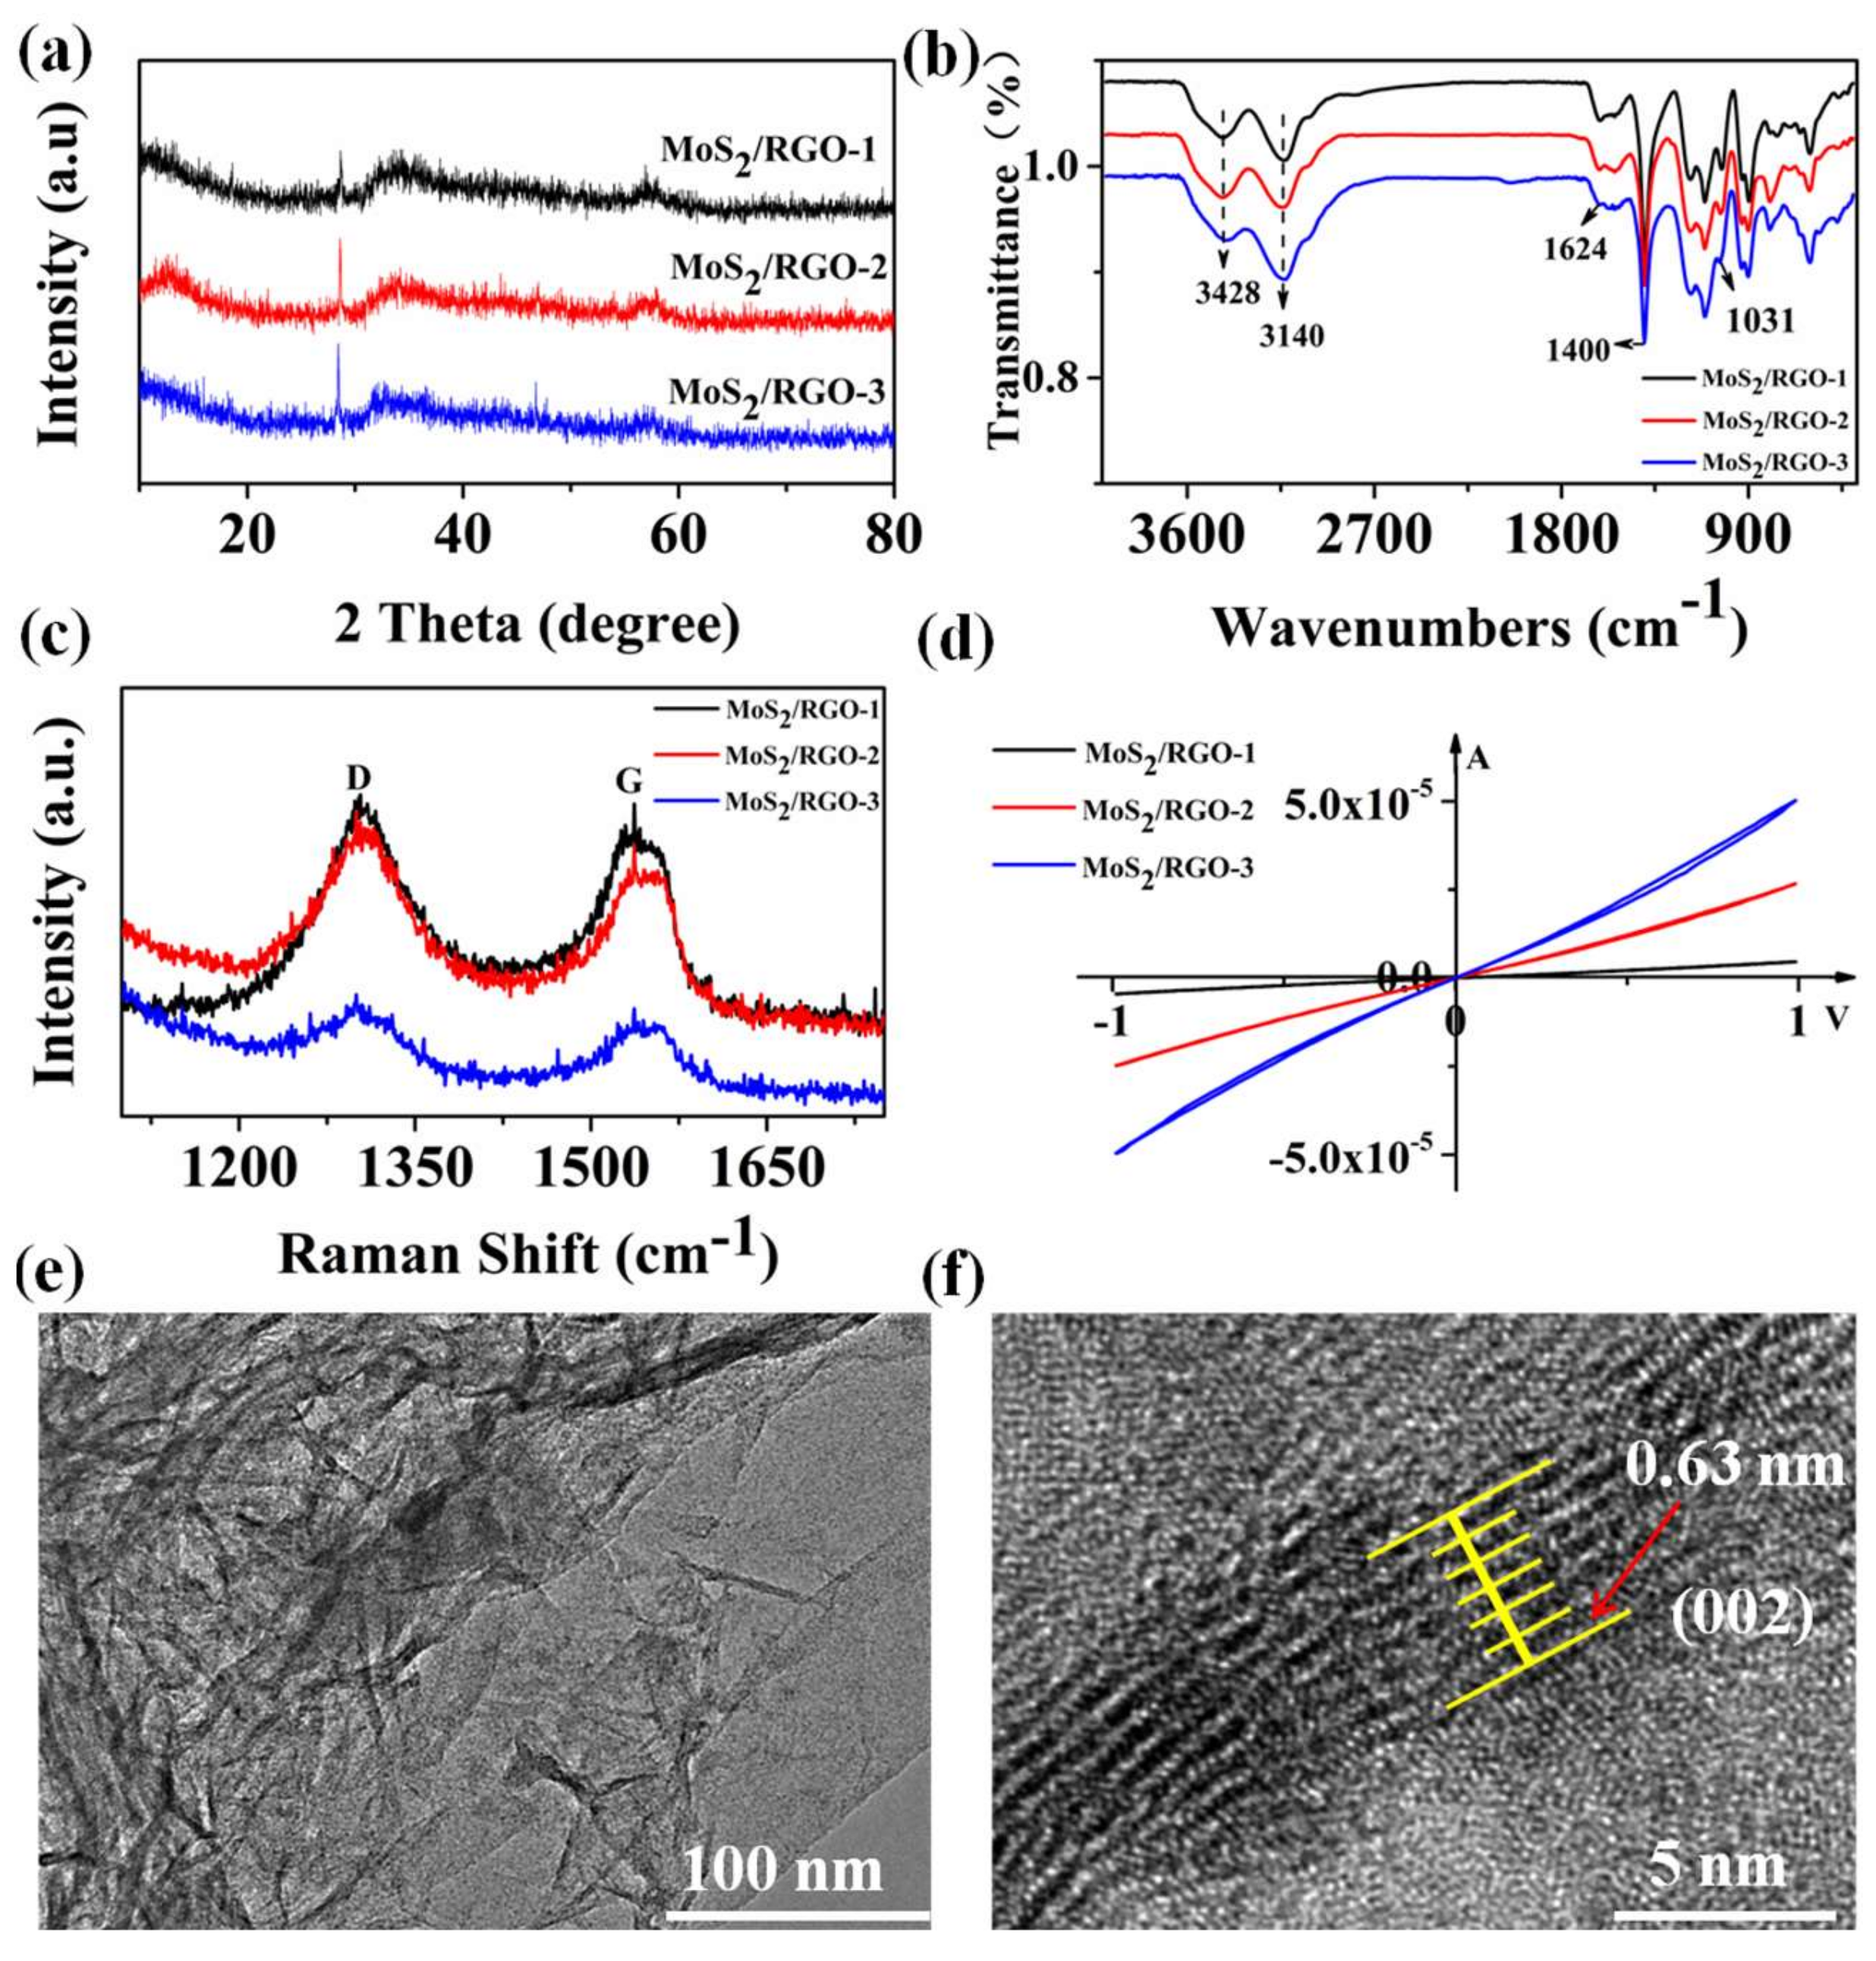
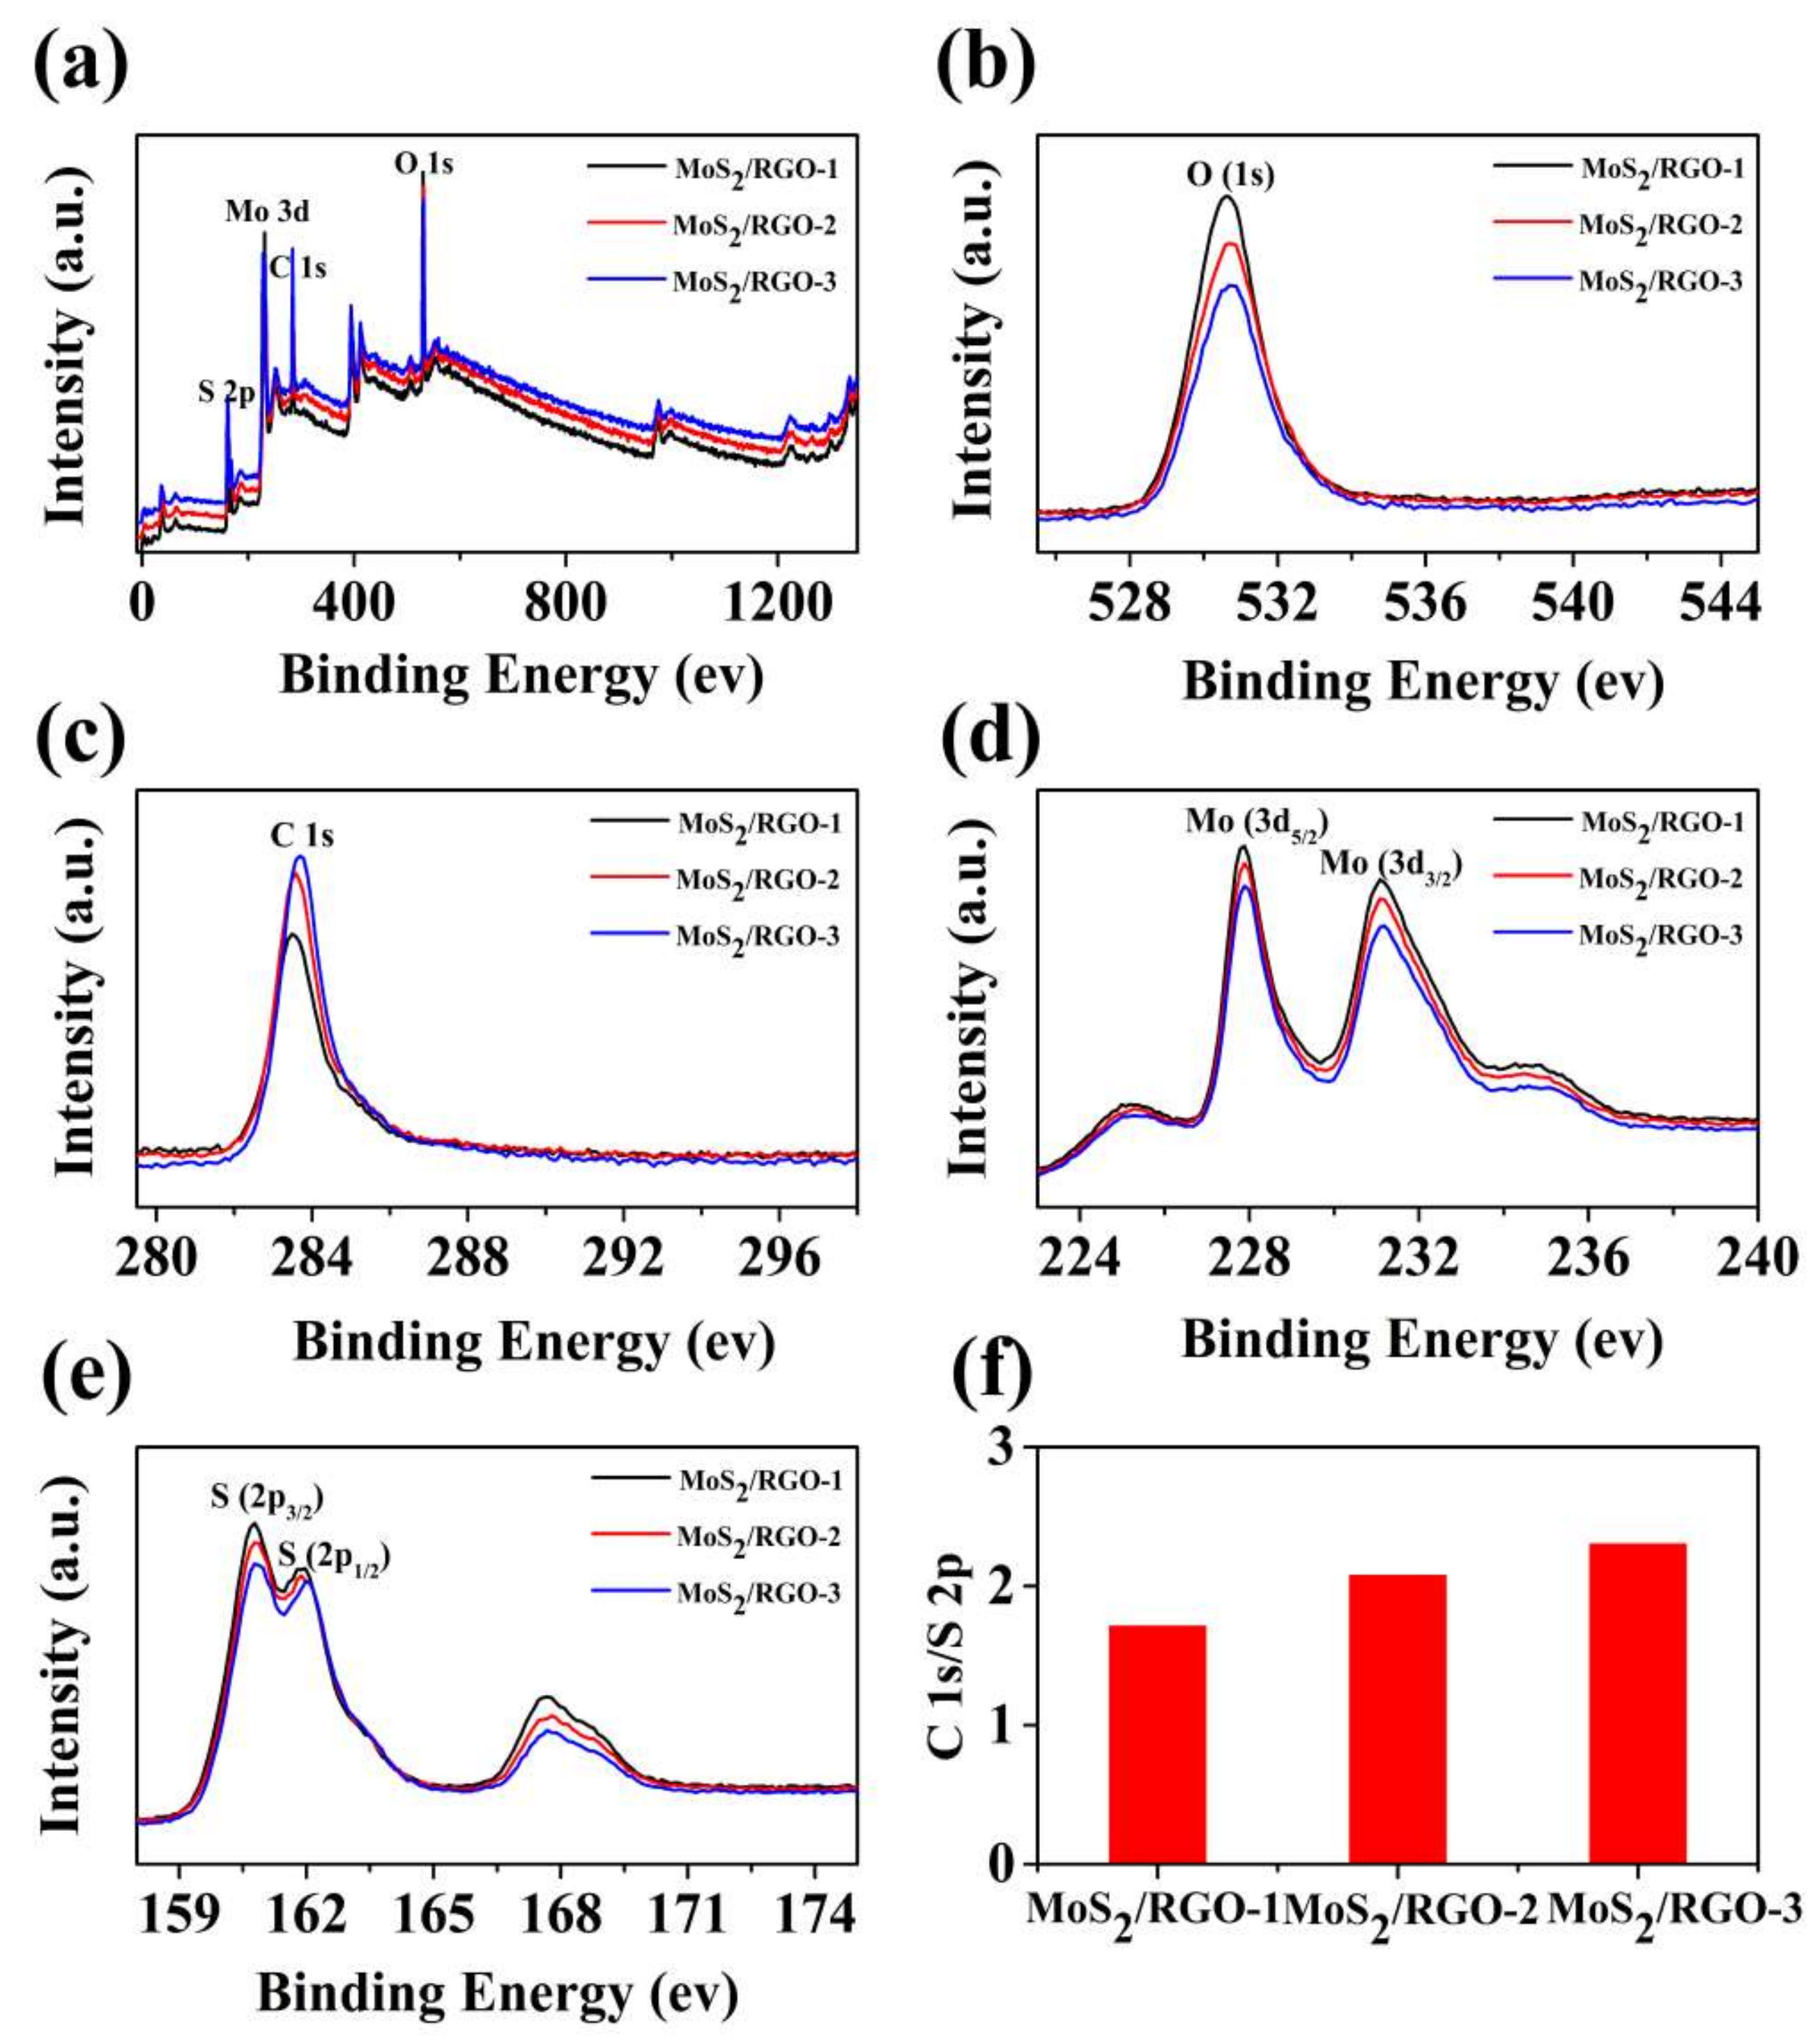
3.1. Characterization Results of MoS2/RGO

Figure 2a–f shows the scanning electron microscope (SEM) images of the obtained MoS2/RGO composites. It can be seen from the graph that the evolution of the morphology structure of the composites varies with the ratio of RGO to raw materials for the synthesis of MoS2. The raw materials for synthesis of MoS2 adsorbed on RGO first nucleate at high temperature to form MoS2 nanocrystals, and then form MoS2/RGO composites. Evidently, for the MoS2/RGO-1 and MoS2/RGO-2 composites, RGO was relatively small relative to MoS2, which was almost completely coated by the excess of MoS2 (Figure 2a–d). In the precursor mixed solution of MoS2/RGO-1 of MoS2/RGO-3, the content of RGO remained unchanged, while the ratio of ammonium molybdate and thiourea decreased gradually. For the MoS2/RGO-3 composites, the amount of raw materials ((NH4)6Mo7O24·4H2O and CH4N2S) for the synthesis of MoS2 is only one third of that for MoS2/RGO-1 composites. For the MoS2/RGO-1 and MoS2/RGO-2, the concentrations of (NH4)6Mo7O24·4H2O and CH4N2S are higher, so the nucleation rate and growth rate are faster than that of MoS2/RGO-3. As a result, MoS2/RGO-1 and MoS2/RGO-2 grow rapidly into small grains (Figure 2a–d). In contrast, the nucleation rates and growth rate of MoS2/RGO-3 are slower because of its lower concentration, and it grows into a finer pattern structure (Figure 2e,f). Therefore, MoS2 can grow well with RGO as template, and finally form the hierarchical MoS2/RGO-3 composites (Figure 2e,f). As shown in Figure 2e,f, the MoS2/RGO-3 composites eventually form interconnected, patterned spheres and the thickness of the curved pattern MoS2 sheet is only about 20 nm. The hierarchical structure, ultra-thin thickness provides sufficient channels and sites for the adsorption and desorption of the target gas, which is helpful to improve the sensitivity of the sensor and the speed of adsorption and desorption.
X-ray diffraction (XRD) analysis was performed on MoS2/RGO-1, MoS2/RGO-2, and MoS2/RGO-3 composites to examine the crystal structure. As shown in Figure 3a, the diffraction peak at 2θ = 28.5° is sharp, and the sharpness becomes larger as the ratio changes, indicating that the crystallinity of the sample is constantly improving [42]. In addition, the position of the peak is also shifted to the left, indicating that the lattice size has changed, this result is consistent with the measured results of the SEM. It is noteworthy that the absence of high-indexed diffraction peaks indicates short-range disordering nature in the products, which may offer more active sites for gas sensing [41]. To determine the functional groups contained in the samples, FT-IR analysis was performed and is shown in Figure 3b. Due to the presence of hydroxyl groups (–OH), the MoS2/RGO samples showed 3140 cm−1 and 3428 cm−1 peaks in the range of 3000–3800 cm−1, respectively [43]. The absorption peak at 1624 cm−1 is related to the in-plane vibration of the H–O–H bending band of the adsorbed H2O molecule or the C–C bonding of the sp2 hybrid, 1400 cm−1 (carboxy O–H stretching) [44], and 1031 cm−1 (C–O) [43]. Because RGO was not observed in the SEM images, Raman spectroscopy was performed to determine the composition of the composites (Figure 3c). The Raman spectra of the composites shown at 1305 cm−1 and 1542 cm−1 correspond to the D, G bands of RGO, respectively. The G band is produced by the surface vibration of the sp2 carbon atom, which is consistent with the results of the FT-IR test while the D band is usually considered to be the disordered vibration peak of graphene [45,46]. These results prove the existence of RGO in the composites. I–V characteristic curves of the sensors based on MoS2/RGO composites also were performed to prove the existence and function of RGO in the MoS2/RGO composites (Figure 3d). The linear I–V relations showed a perfect ohmic contact between MoS2/RGO composites and the metal electrode [47,48]. Compared with MoS2, RGO has the better conductivity. Therefore, with the increase of RGO proportion in the composites, the conductivity increases from MoS2/RGO-1 to MoS2/RGO-3, which also proves the existence and function of RGO in the composites. The existence of RGO was also demonstrated by direct TEM observations. As shown in Figure 3e,f, TEM images of the MoS2/RGO composite shows the wrinkled RGO and the MoS2 anchored on RGO. The MoS2/RGO composite provides nanoscale MoS2 flakes in the form of loose agglomerates on RGO, which can also be distinguished by their brightness. As shown by the yellow lines in the Figure 3f, one can directly observe the crystalline interplanar spacing attributed to MoS2, and the average interplanar spacing from the six spacing was calculated to be 0.63 nm. The 0.63 nm of interplanar spacing was attributed to the (002) planes of MoS2 [45], proving the existence of the MoS2 anchored on RGO. These observations are consistent with the Raman results, indicating the successful preparation of MoS2/RGO composites.
In order to further confirm the distribution of the elements contained in the composites, the chemical states of the MoS2/RGO composite were investigated by XPS. Figure 4a shows that the main constituent elements in the MoS2/RGO composites are S, Mo, C, and O. The high-resolution Mo3d spectrum shows two distinct peaks at 227.86 and 231.12 eV, corresponding to Mo3d5/2 and Mo3d3/2, respectively (Figure 4d). The binding energies of 160.81 and 161.9 eV correspond to S2p3/2 and S2p1/2, respectively [49] (Figure 4e). One can see intuitively from the Figure 4b–e that except for C, the corresponding peaks of S, Mo, and O are reduced from the MoS2/RGO-1 to MoS2/RGO-3, which is consistent with the increasing proportion of RGO in the composites. It is worth noting that with the increasing proportion of RGO in the composites, the intensity ratio of C1s to S2p increases gradually (Figure 4f). This normalized result is consistent with the previous characterization analysis, demonstrating that the ratio of RGO to raw materials for synthesis of MoS2 effectively influences the components, morphology, and structures of the MoS2/RGO composites. One can expect that these changes will also have a significant impact on the gas sensitivity of MoS2/RGO composites [50].

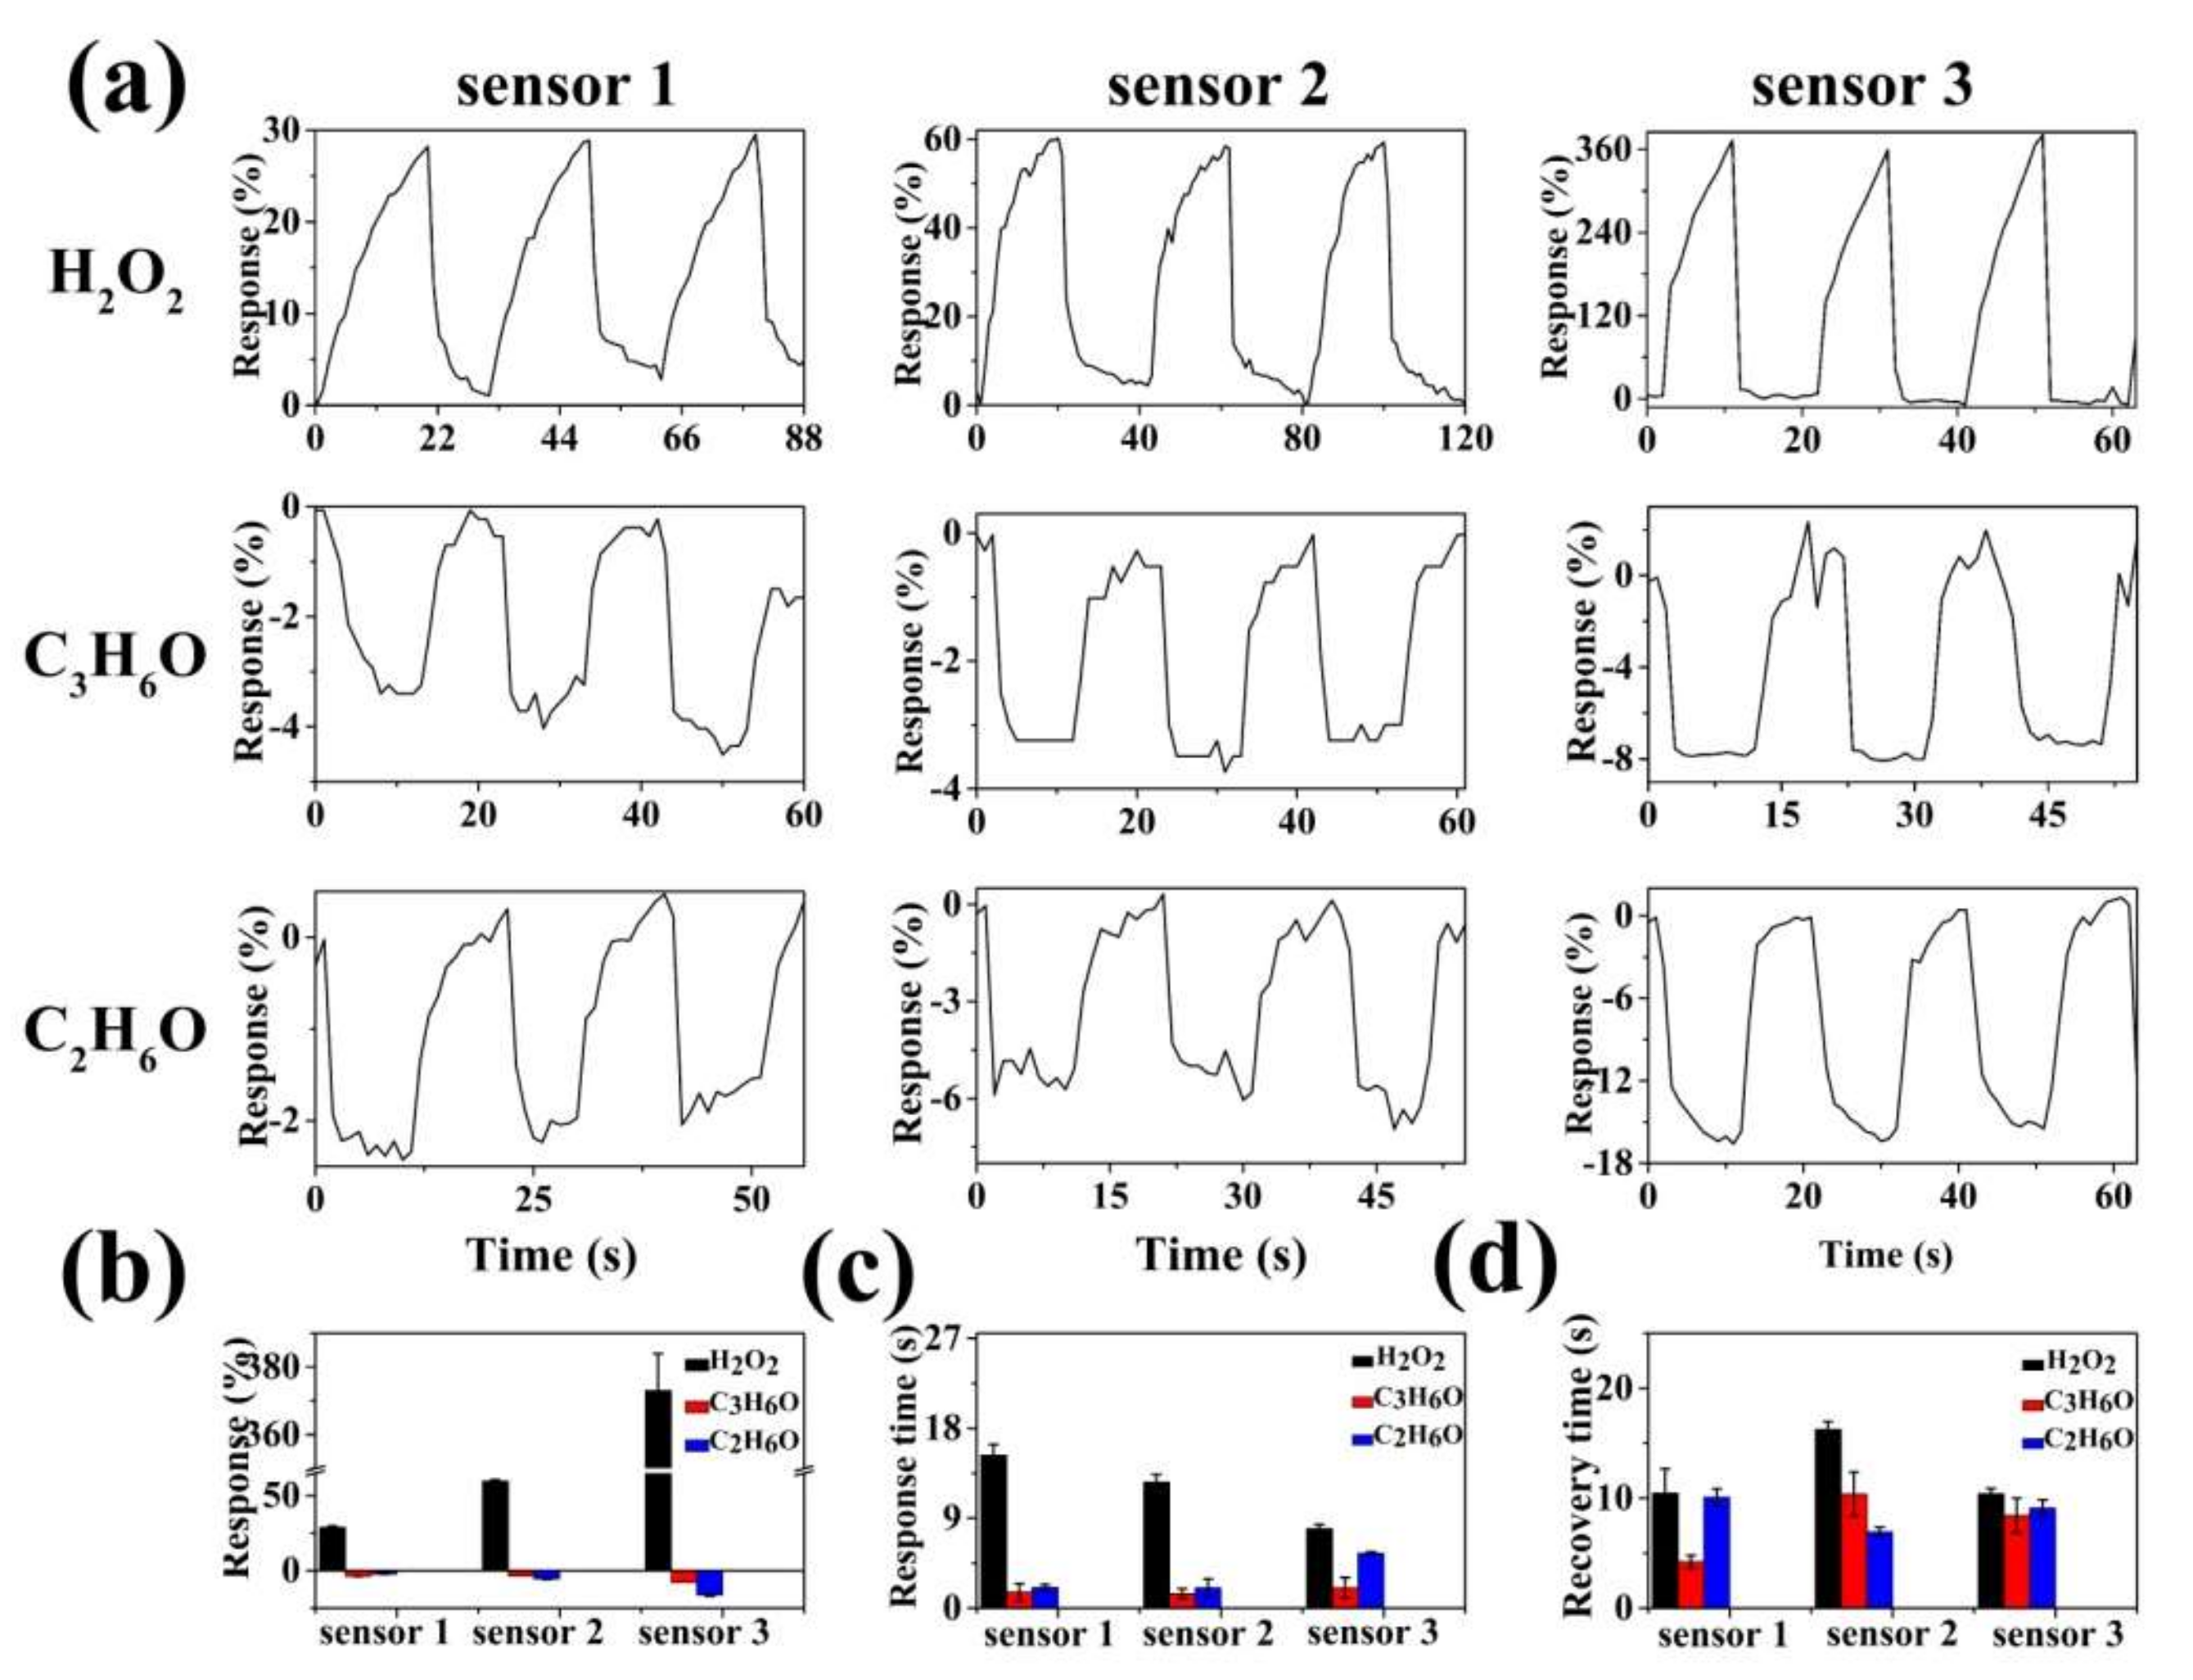
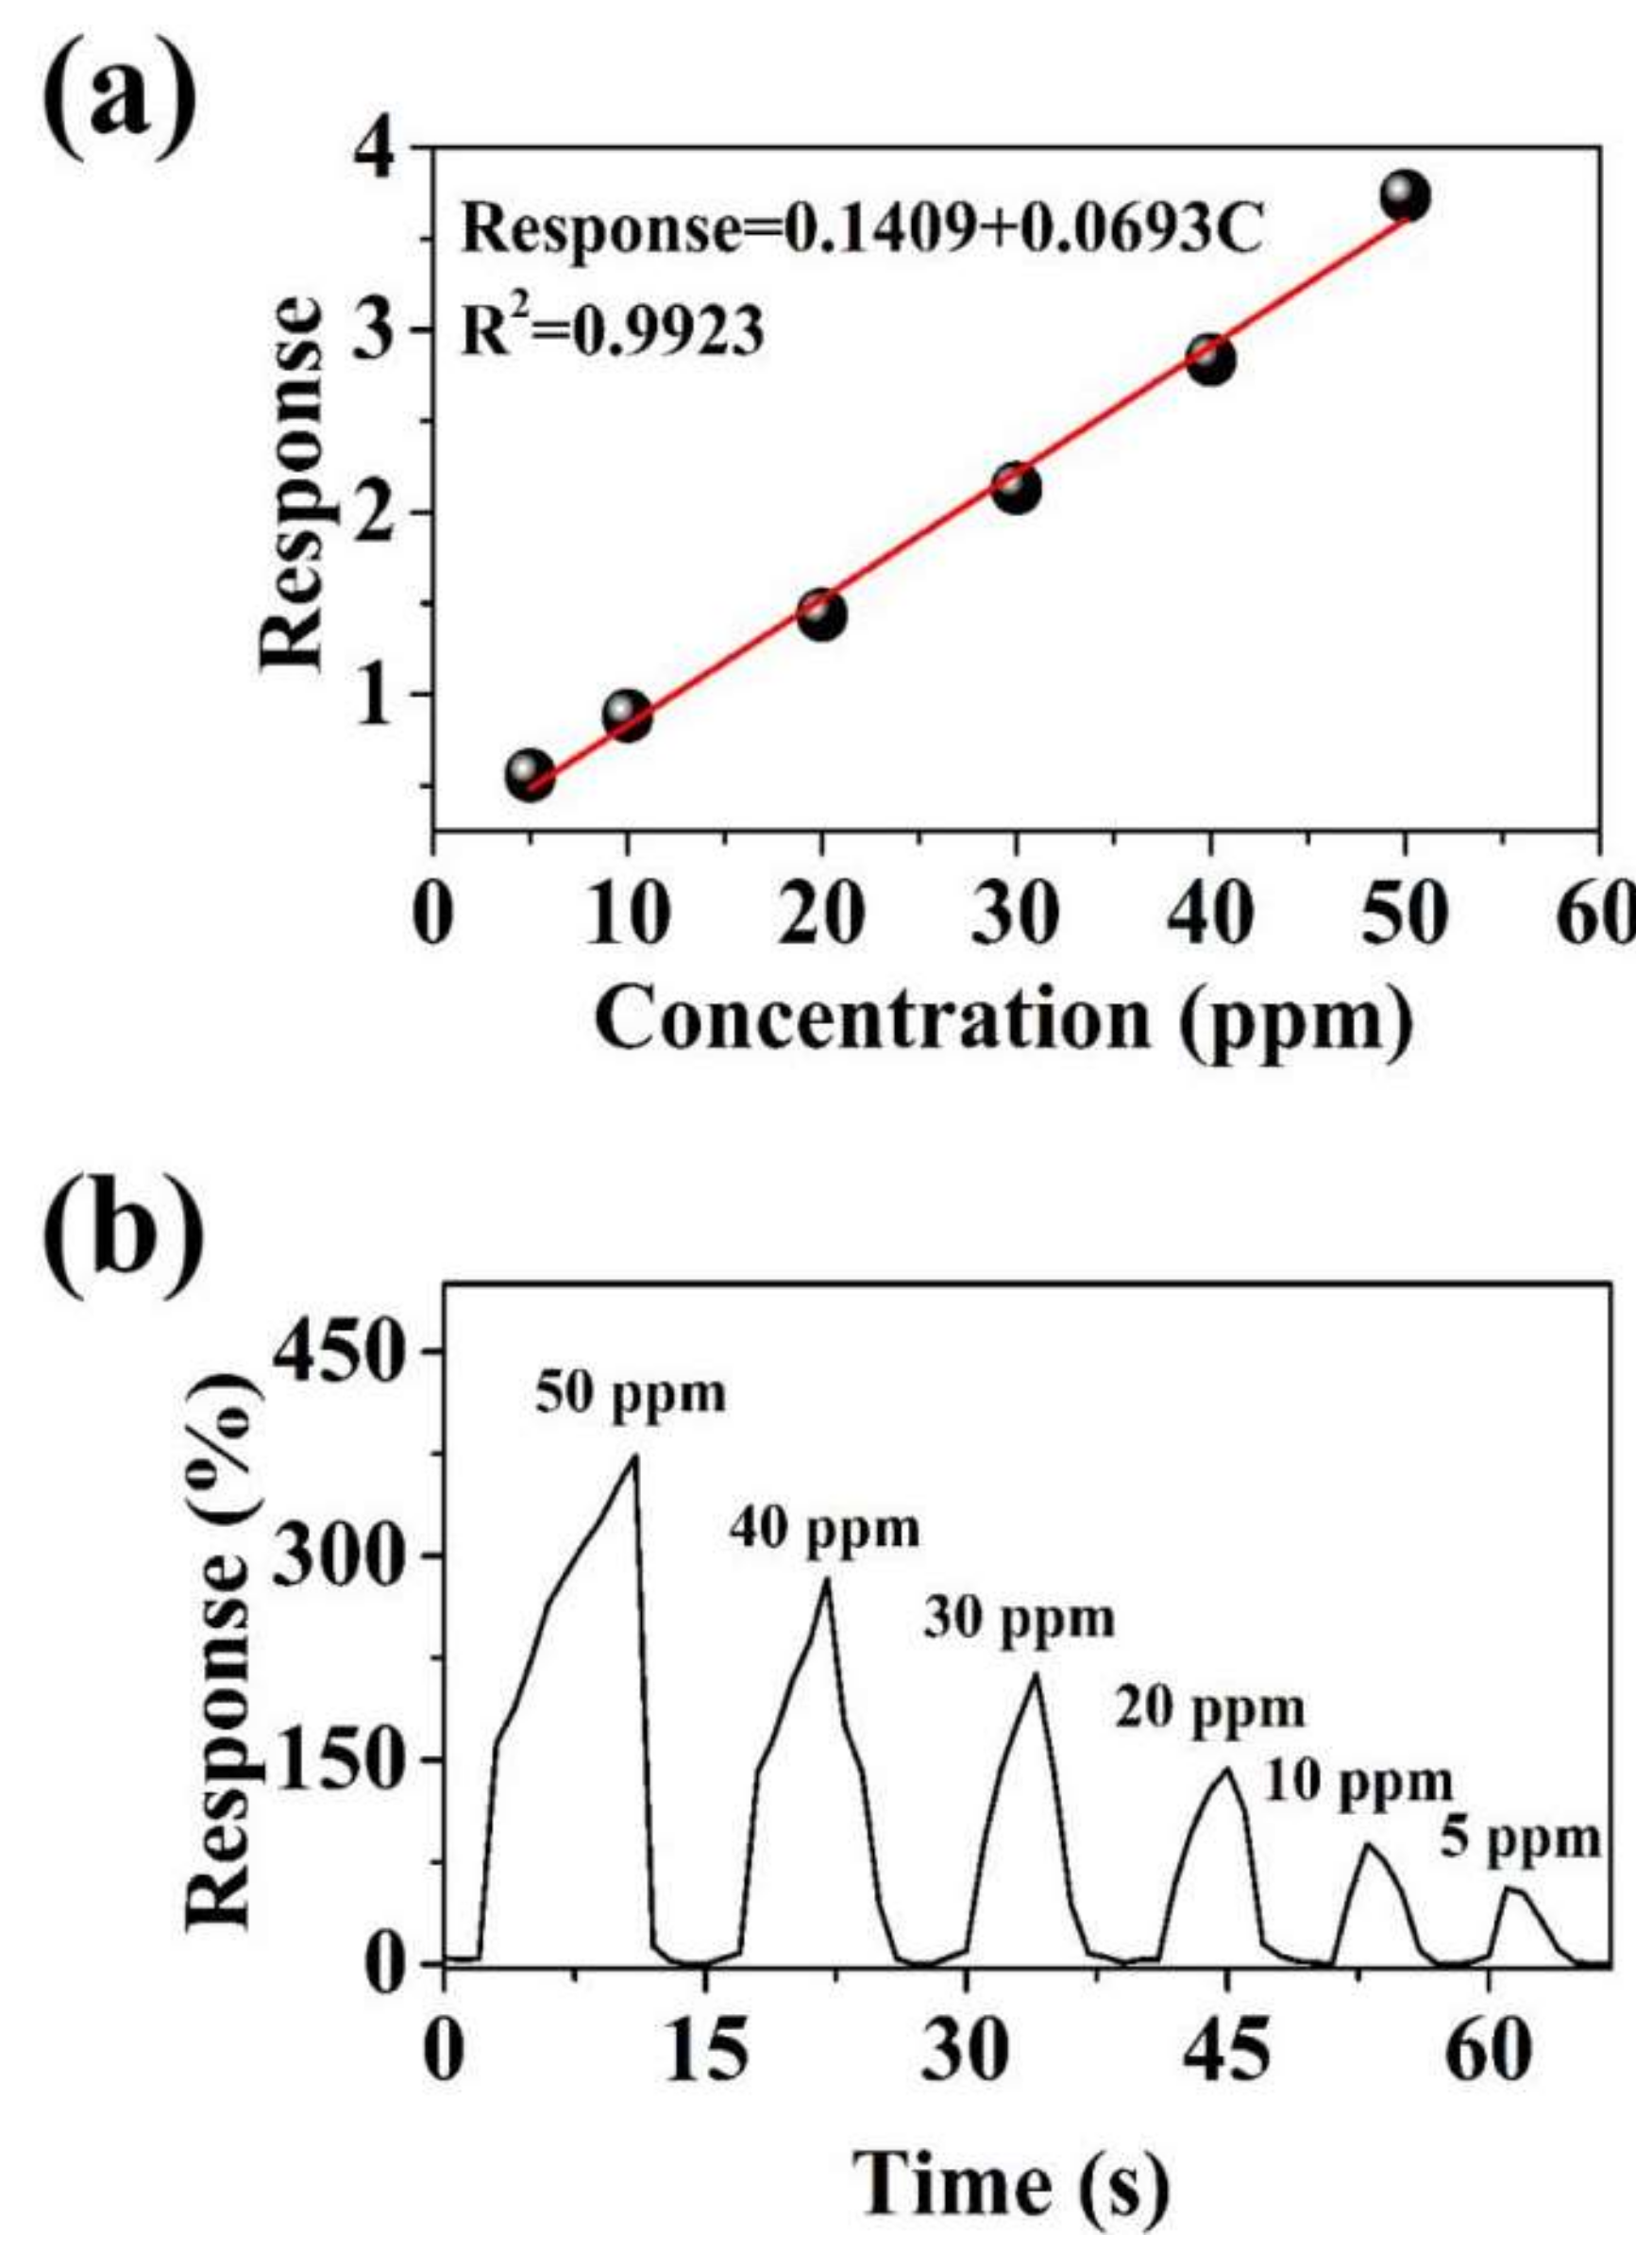
3.2. Fabrication and Testing of Sensor Array

Figure 5a shows the dynamic sensing curves of the sensors based on different samples at room temperature to 50 ppm of H2O2, C3H6O, and C2H6O vapors. As can be clearly seen from the sensing curves, the three sensors based on MoS2/RGO composites respond upward to oxidizing H2O2 vapor and downward to reducing C3H6O and C2H6O vapors, reflecting the sensing characteristics of p-type semiconductors. Generally, RGO and MoS2 are p-type and n-type semiconductors, respectively. The p-type sensing characteristics prove that RGO plays an important role in gas sensing of MoS2/RGO composites. It is worth noting that the responses of the three sensors based on MoS2/RGO composites to 50 ppm of H2O2, C3H6O, and C2H6O vapors increases with the increase of RGO content (Figure 5b). The responses to 50 ppm of H2O2 vapor increased from 29.0% to 59.6%, and then to 373.1% for the sensors 1, 2, and 3, respectively. This trend of responses also applies to 50 ppm of C2H6O vapor, but not C3H6O vapor. This phenomenon can be attributed to the charge depletion layer and hierarchical structures. It is well known that both the charge depletion layer and the particle size of the semiconductor materials determine the sensing performance of the chemi-resitive sensor. The higher the proportion of the electron depletion layer in the semiconductor particle, the better the gas sensitivity of the sensing materials. The MoS2/RGO-3 composite has a pattern-like hierarchical structure with a thickness of about 20 nm, and target gas molecules can be adsorbed on both sides of the sheet structures to form a deeper charge depletion layer. In addition, the hierarchical structure of MoS2/RGO-3 composite provides a larger specific surface area and more active sites. As a result, the deeper charge depletion layer, larger specific surface area, and more active sites of the MoS2/RGO-3 composite contributed to the higher sensitivity, which is consistent with the results of the gas sensitivity test. In contrast, pure MoS2 was also prepared, and their two-dimensional sheet morphologies are shown in Figure S2a–f. The sensing curves of sensors based on pure MoS2 and RGO to 1000 ppm of H2O2, C3H6O, and C2H6O vapors were also tested (Figure S3a). It can be seen from the Figure S3b–d that although the concentration of H2O2, C3H6O, and C2H6O vapors increased 20 times (1000 ppm), the corresponding responses of the sensors based on pure MoS2 and RGO hardly increased significantly compared with the responses of the sensors based on MoS2/RGO composites to 50 ppm of H2O2, C3H6O, and C2H6O vapors. This fully illustrates the important role of the synergistic effect of MoS2 and RGO in gas sensing. In addition, for the three target gases, all three sensors based on MoS2/RGO composites show very short response time and recovery time, reflecting the fast adsorption and desorption of target gases on the surface of MoS2/RGO composites. As shown in Figure 5c, the maximum response time and recovery time are no more than 14.5 s and 16.3 s, respectively, proving the real-time sensing performance of the sensors. For an excellent gas sensor, not only is high response required in practical applications, but also good selectivity to the target gas. C2H6O is a common volatile organic compound that interferes greatly with the detection of TATP precursors, it is very necessary to use C2H6O vapor as an interference factor in the detection of TATP precursors. Unfortunately, the MoS2/RGO-3 composite has a higher response to C2H6O vapor than that of C3H6O vapor (Figure 5a,b), showing the poor anti-interference characteristics to C2H6O vapor. Moreover, O3 is a strong oxidizing gas in the air and O3 often interferes with the sensing detection of oxidizing gases. Therefore, we also tested the sensors based on MoS2/RGO composites to 50 ppm of O3 gas (Supplementary Figure S4). It can be seen from Figure S4 that the sensors based on MoS2/RGO composites hardly respond to 50 ppm of O3, showing good anti-interference ability of O3.
The sensing performances of sensors based on MoS2/RGO-3 and other reported chemi-resistive sensors for detection of H2O2 vapor can be found in Table 1. As can be seen clearly from the Table 1, our sensors also work at room temperature like the reported sensors, but the sensor in our work has the highest sensitivity to H2O2 vapor at room temperature, achieving a response of 373.1% to 50 ppm H2O2 vapor. The response time for 50 ppm H2O2 vapor is approximately 9 s. This comparison shows that our sensor of MoS2/RGO-3 has better comprehensive sensing performance for H2O2 vapor.
In addition, the response of the MoS2/RGO-3 sensor to different concentrations of H2O2 vapor was tested (Figure 6a). Based on the results, the estimated detection limit (defined as the detection limit = 3SD/m, where m is the slope of the linear portion of the calibration curve, SD is the standard deviation of the noise in the response curve) [41], and the H2O2 vapor is determined to be 0.65 ppm (Figure 6b). The results show that MoS2/RGO-3 composites have potential applications of gas detection of TATP precursors.

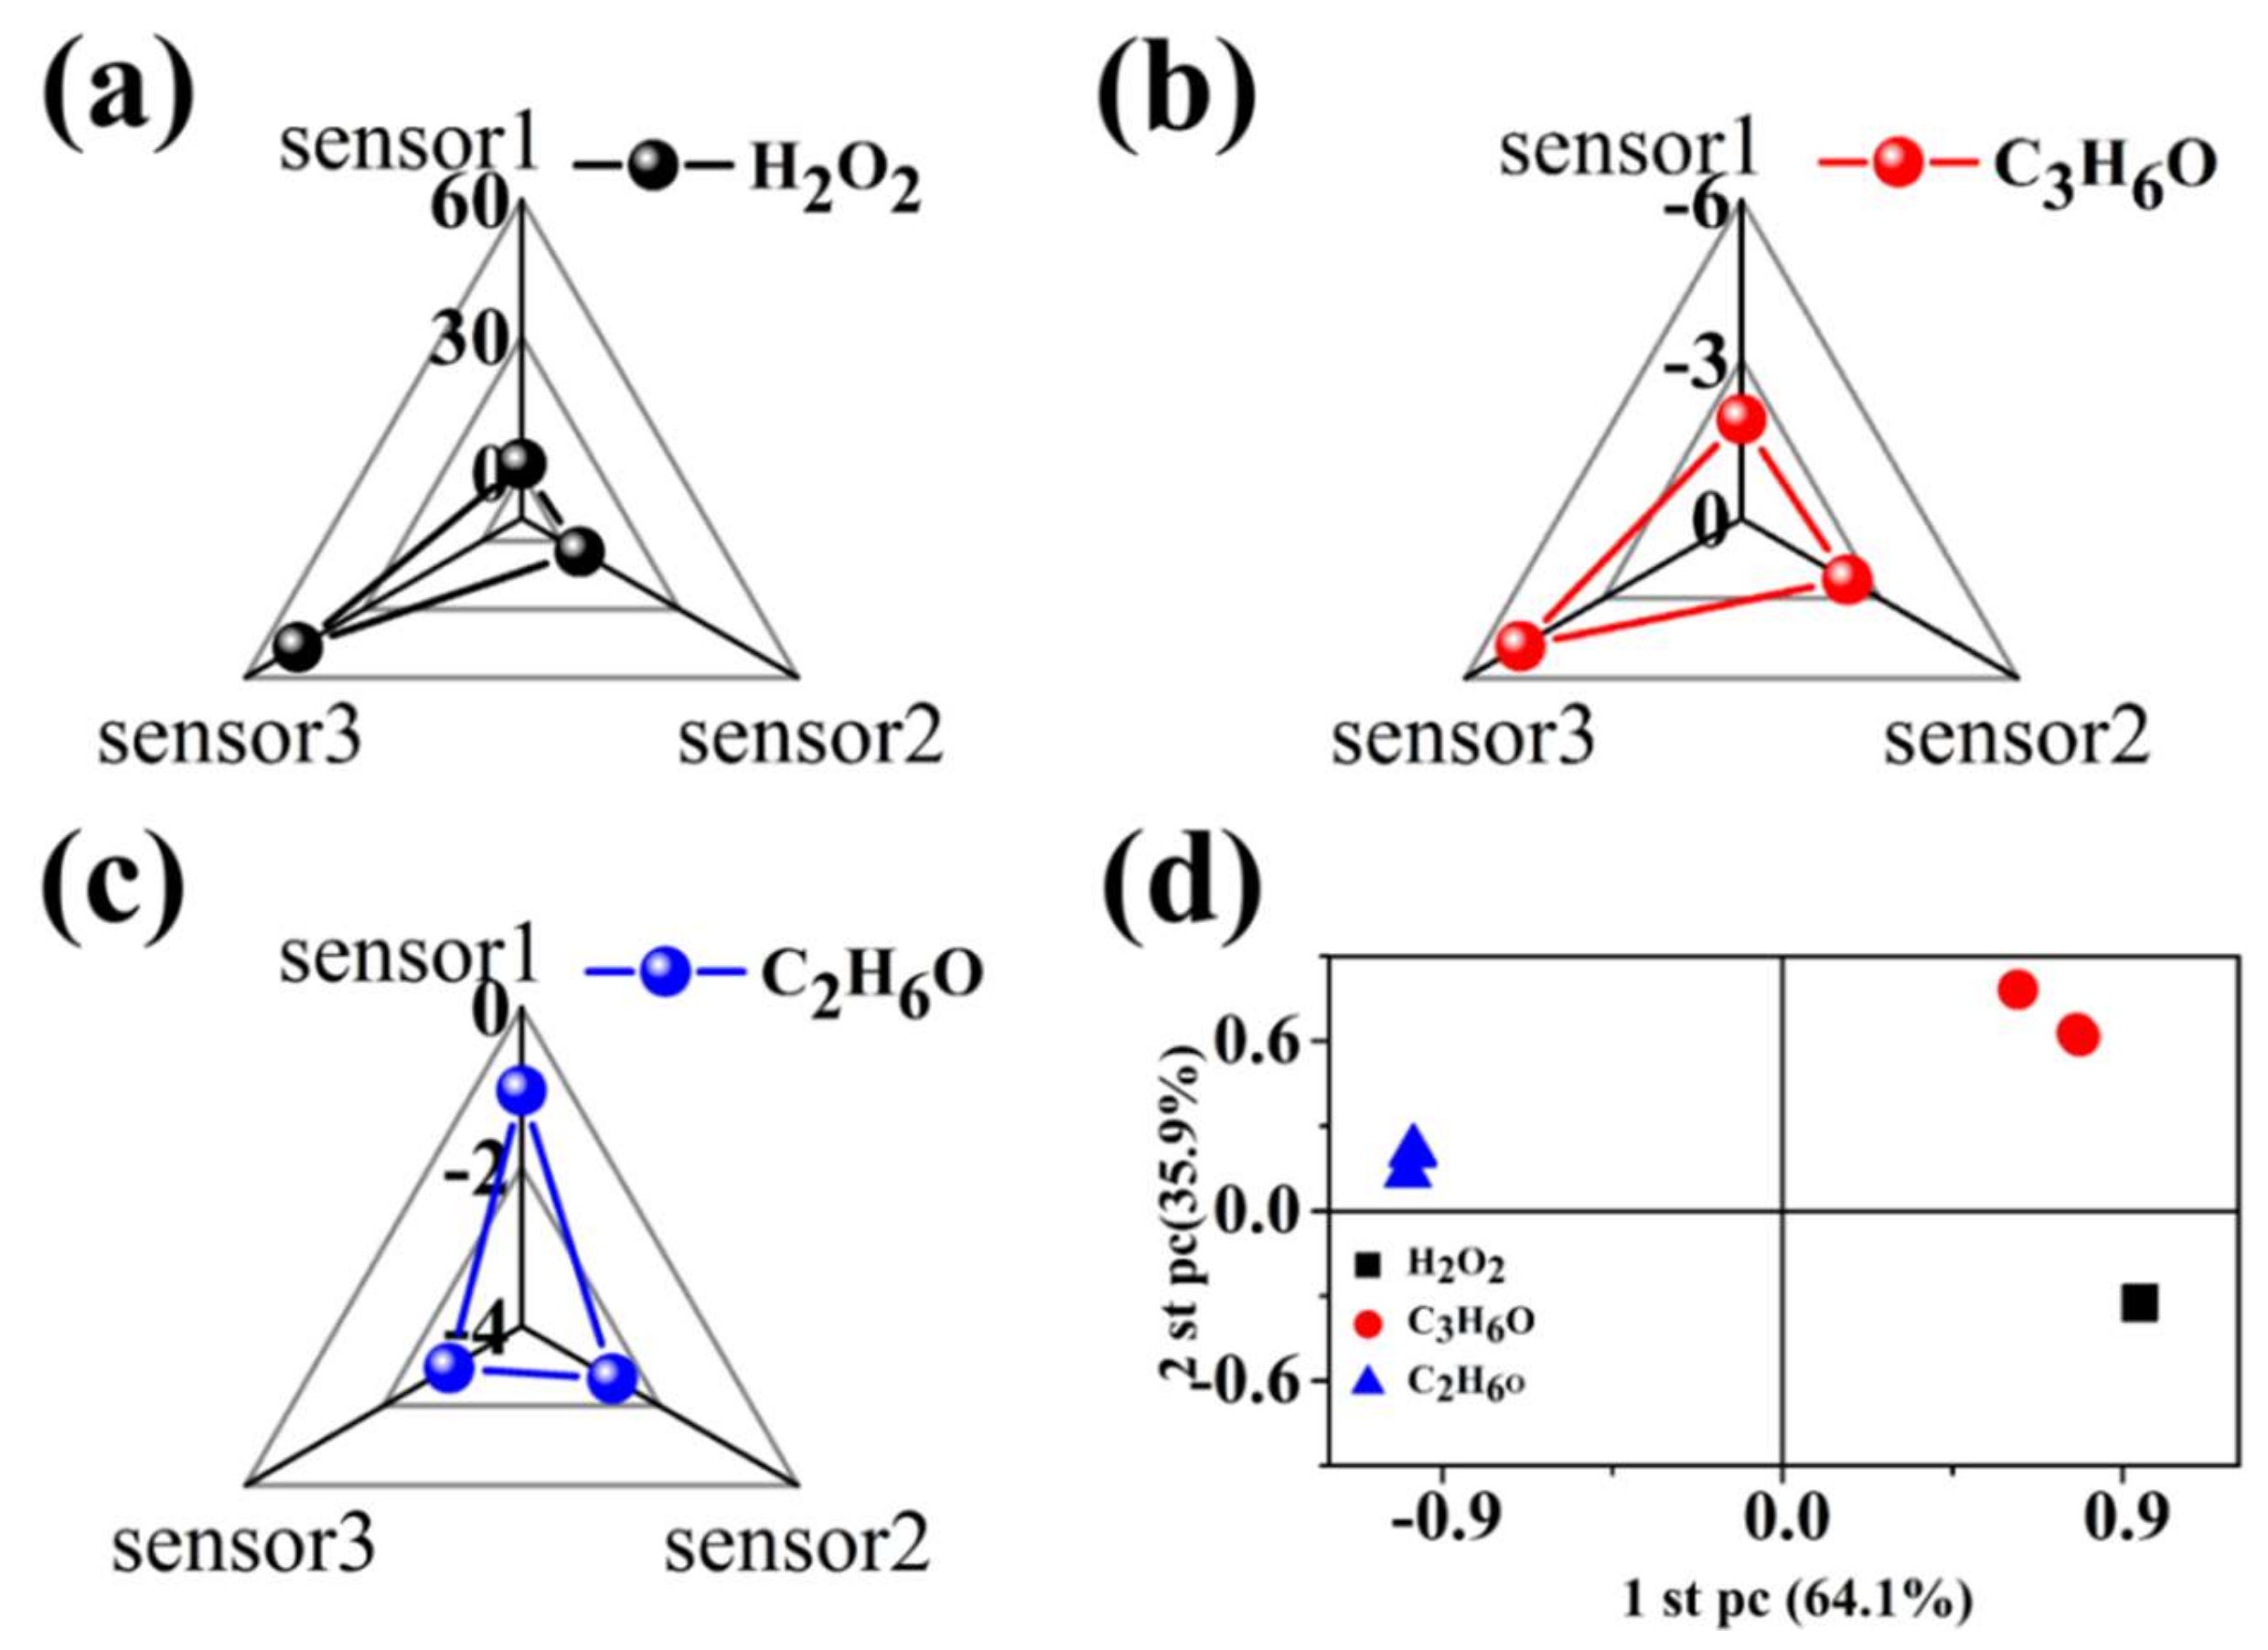
3.3. Discriminative Capability of the Sensor Array

To evaluate the discriminative capability of a simple array consisting of three sensors, all the responses were further analyzed using a principal component analysis (PCA) method and radar method combining kinetic and thermodynamic parameters. The kinetic and thermodynamic parameters of the interaction of the analytes and the sensor array are utilized to assess the discriminative capability of the sensor array. The radar method refers to fingerprint recognition, which creates a unique database of explosive fingerprints, enabling the separation of similar chemical entities and providing a fast and reliable method for identifying individual chemical reagents [54,55]. The responses and response time inherent in the interaction between each analyte and the three sensors were chosen as kinematic and thermodynamic parameters, respectively. Therefore, its three pairs of sensing responses and response times from the sensor array were used to calculate the ratio of responses to response times, and the three parameters obtained for each analyte represent the fingerprint. From the fingerprints obtained (Figure 7a–c), one can see that the triangular fingerprints corresponding to H2O2, C3H6O, and C2H6O vapors are not well differentiated because the number of sensors is too small. Therefore, the PCA method is used to evaluate the discriminative ability of the sensor array. PCA is a popular multivariate statistical technique used to simplify data sets. The purpose of this method is to reduce the dimension of multivariate data while retaining as much relevant information as possible [56,57]. Data sets of principal component analysis applied to pattern recognition and/or gas recognition have been reported [58]. As shown in Figure 7d, it can be clearly seen that the simple sensor array is very effective in distinguishing three target analytes, showing the discriminative capability. It also proves that the design of gas sensing properties of MoS2/RGO composites by changing the ratio of RGO to MoS2 is effective and feasible. Considering that the maximum response time of the sensor array is just 14.5 s, means that the simple sensor array can detect three analytes in 14.5 s.

3.4. Analysis of the Possible Sensing Mechanism

The conductivity of the sensing material depends on the adsorbed gas molecules (oxidizing or reducing) [59]. Generally, MoS2 acts as an n-type semiconductor [37,38], while RGO is considered to be a p-type semiconductor with a defect site and a functionalized group on its surface, which acts as an active site for the gas, facilitating the adsorption of gas molecules [60]. The gas sensing results show that the MoS2/RGO composite exhibits the characteristics of p-type semiconductors. When the sensors based on MoS2/RGO composites were exposed to the reducing C3H6O vapor, the following reactions occurred.
C3H6O (g) + 4O2 (s) → 3CO2 + 3H2O + 4e
According to Equation (1), MoS2/RGO composites captured the electrons from the reducing C3H6O vapor, while the conductivity of composites decreases, exhibiting characteristics of p-type semiconductors. It is reported that H2O2 will react in the following two ways depending on the concentration of hydrogen peroxide. At high H2O2 (of about 10 vol%) concentrations the mechanism is as follows [61]:
2H2O2 → 2H2O + O2
At lower concentrations (2.1 vol%) the net reaction is:
2H2O2 → 2H2O + 0.87O2 + 0.08O3
In our work, H2O2 with a mass fraction of 30% was used. According to Equation (2), the main product of H2O2 decomposition is O2. Therefore, the produced O2 and H2O2 vapor will capture electrons from the MoS2/RGO composites, and the conductivity of the composites increases, also exhibiting characteristics of p-type semiconductors. This indicated that RGO played an important role in the gas sensing properties of MoS2/RGO composites. Because RGO/MoS2 conjugates can form excellent charge transfer pathways [45], the charge can favorably travel from MoS2 to RGO quickly, resulting in a very large and fast variation of the conductivity. This synergy of MoS2 and RGO contributes to a quick and sensitive response to target analytes. With the decrease of MoS2 (or the increase of RGO) in the RGO/MoS2 composite, the contact between RGO and MoS2 is more sufficient, which is more conducive to giving a good gas sensing performance. Therefore, the sensitivity of the sensor based on MoS2/RGO composites was significantly improved with the increase of RGO within an appropriate range. Without doubt, the formation of hierarchical structure of the MoS2/RGO composites is also conducive to improving sensitivity, which is consistent with the very good sensitivity of sensor-3 of MoS2/RGO composites.

4. Conclusions

p-type RGO and n-type MoS2, typical two-dimensional nanomaterials, were used successfully to design hierarchical MoS2/RGO composites using RGO as templates. The effects of the ratio of RGO to raw materials for the synthesis of MoS2 on the morphology, structure, and gas sensing properties of the MoS2/RGO composites were studied in order to detect the precursors of TATP effectively. It was found that after optimization, the response to 50 ppm of H2O2 vapor was increased from 29.0% to 373.1%, achieving an increase of about 12 times. Meanwhile, all three sensors based on MoS2/RGO composites exhibited excellent anti-interference performance to ozone with strong oxidation. Furthermore, the simple sensor array based on MoS2/RGO composites achieved discriminative detection of three target analytes in 14.5 s at room temperature. This proves that the design of gas sensing properties of MoS2/RGO composites by changing the ratio of RGO to MoS2 is effective and feasible. The synergistic effect between two-dimensional RGO and MoS2 provide new possibilities for the development of high performance sensors.

Supplementary Materials

The following are available online at https://www.mdpi.com/1424-8220/19/6/1281/s1, Figure S1. Schematic diagram of gas sensitivity test; Figure S2a–d TEM images and (e,f) SEM images of pure MoS2; Figure S3. (a) Dynamic response curves of the sensors based on pure MoS2 and pure RGO to 1000 ppm of H2O2, C3H6O, C2H6O vapors at room temperature, statistical graph of (b) average response, (c) response time, and (d) recovery time. Figure S4. Dynamic sensing curves of the sensor 1, 2 and 3 to 50 ppm of O3 at room temperature.

Author Contributions

Z.W., D.J. and H.D. conceived and designed the experiments; Q.S. and Z.W. performed the experiments; Q.S., Z.W., D.J., and H.D. analyzed the data and wrote the paper.

Funding

This research received no external funding.

Acknowledgments

The authors thank the financial support from National Natural Science Foundation of China (51502336, 11664038, 21771157), China Postdoctoral Science Foundation (2017M613255), Tianshan Cedar Project of Xinjiang Uygur Autonomous Region (2017XS15) and Joint Funds of NSFC-Xinjiang of China (U1703251).

Conflicts of Interest

The authors declare no conflict of interest

References

  1. Suman, P.; Wujian, M. Sensitive determination of triacetone triperoxide explosives using electrogenerated chemiluminescence. Anal. Chem. 2013, 85, 8008–8015. [Google Scholar]
  2. Beveridge, A. Forensic Investigation of Explosions; CRC Press: Boca Raton, FL, USA, 1998. [Google Scholar]
  3. Capua, E.; Cao, R.; Sukenik, C.N.; Naaman, R. Detection of triacetone triperoxide (TATP) with an array of sensors based on non-specific interactions. Sens. Actuators B Chem. 2009, 140, 122–127. [Google Scholar] [CrossRef]
  4. Dubnikova, F.; Kosloff, R.; Zeiri, Y.; Karpas, Z. Novel Approach to the Detection of Triacetone Triperoxide (TATP):  Its Structure and Its Complexes with Ions. Phys. Chem. A 2002, 106, 4951–4956. [Google Scholar] [CrossRef]
  5. Muller, D.; Levy, A.; Shelef, R.; Abramovich-Bar, S.; Sonenfeld, D.; Tamiri, T. Improved method for the detection of TATP after explosion. J. Forensic Sci. 2004, 49, 935–938. [Google Scholar] [CrossRef]
  6. Oxley, J.C.; Smith, J.L.; Shinde, K.; Moran, J. Determination of the Vapor Density of Triacetone Triperoxide (TATP) Using a Gas Chromatography Headspace Technique. Propellants Explos. Pyrotech. 2010, 30, 127–130. [Google Scholar] [CrossRef]
  7. Mamo, S.K.; Gonzalez-Rodriguez, J. Development of a molecularly imprinted polymer-based sensor for the electrochemical determination of triacetone triperoxide (TATP). Sensors 2014, 14, 23269–23282. [Google Scholar] [CrossRef]
  8. Hengwei, L.; Suslick, K.S. A colorimetric sensor array for detection of triacetone triperoxide vapor. J. Am. Chem. Soc. 2010, 132, 15519–15521. [Google Scholar]
  9. Fan, W.; Young, M.; Canino, J.; Smith, J.; Oxley, J.; Almirall, J.R. Fast detection of triacetone triperoxide (TATP) from headspace using planar solid-phase microextraction (PSPME) coupled to an IMS detector. Anal. Bioanal. Chem. 2012, 403, 401–408. [Google Scholar] [CrossRef] [PubMed]
  10. Jiang, D.; Peng, L.; Wen, M.; Zhou, Q.; Chen, C.; Wang, X.; Chen, W.; Li, H. Dopant-Assisted Positive Photoionization Ion Mobility Spectrometry Coupled with Time-Resolved Thermal Desorption for on-site Detection of TATP and HMTD in Complex Matrices. Anal. Chem. 2016, 88, 4391–4399. [Google Scholar] [CrossRef]
  11. Lubczyk, D.; Siering, C.; Lörgen, J.; Shifrina, Z.B.; Müllen, K.; Waldvogel, S.R. Simple and sensitive online detection of triacetone triperoxide explosive. Sens. Actuators B Chem. 2010, 143, 561–566. [Google Scholar] [CrossRef]
  12. Burks, R.M.; Hage, D.S. Current trends in the detection of peroxide-based explosives. Anal. Bioanal. Chem. 2009, 395, 301–313. [Google Scholar] [CrossRef] [PubMed]
  13. Buttigieg, G.A.; Knight, A.K.; Denson, S.; Pommier, C.; Denton, M.B. Characterization of the explosive tricetone triperoxide and detection by ion mobility spectrometry. Forensic Sci. Int. 2003, 135, 53–59. [Google Scholar] [CrossRef]
  14. Salb, C.; Wackerbarth, H.; Christou, K.; Gundrum, L.; Niederkrüger, M.; Beushausen, V.; Viöl, W. Detection of explosives based on surface-enhanced Raman spectroscopy. Appl. Opt. 2010, 49, 4362–4366. [Google Scholar]
  15. Leo, W.; Stuart, W.; Konrad, S.; Andrew, C. Development of an LC/MS method for the trace analysis of triacetone triperoxide (TATP). Analyst 2002, 127, 1627–1632. [Google Scholar]
  16. Zitrin, S. Decomposition products of petn in post explosion analysis. J. Energ. Mater. 1986, 4, 77–91. [Google Scholar]
  17. Fang, X.; Ahmad, S.R. Detection of explosive vapour using surface-enhanced Raman spectroscopy. Appl. Phys. B 2009, 97, 723–726. [Google Scholar] [CrossRef]
  18. Cotte-Rodríguez, I.; Chen, H.; Cooks, R.G. Rapid trace detection of triacetone triperoxide (TATP) by complexation reactions during desorption electrospray ionization. Chem. Commun. 2006, 9, 953–955. [Google Scholar] [CrossRef]
  19. Li, X.; Zhang, Z.; Tao, L. A novel array of chemiluminescence sensors for sensitive, rapid and high-throughput detection of explosive triacetone triperoxide at the scene. Biosens. Bioelectron. 2013, 47, 356–360. [Google Scholar] [CrossRef] [PubMed]
  20. Song, M.J.; Hwang, S.W.; Whang, D. Non-enzymatic electrochemical CuO nanoflowers sensor for hydrogen peroxide detection. Talanta 2010, 80, 1648–1652. [Google Scholar] [CrossRef]
  21. Luo, L.; Li, F.; Zhu, L.; Zhang, Z.; Ding, Y.; Deng, D. Non-enzymatic hydrogen peroxide sensor based on MnO2-ordered mesoporous carbon composite modified electrode. Electrochim. Acta 2012, 77, 179–183. [Google Scholar] [CrossRef]
  22. Shen, J.-Y.; Wang, M.-D.; Wang, Y.-F.; Hu, J.-Y.; Zhu, Y.; Zhang, Y.X.; Li, Z.-J.; Yao, H.-C. Iron and carbon codoped WO3 with hierarchical walnut-like microstructure for highly sensitive and selective acetone sensor. Sens. Actuators B Chem. 2018, 256, 27–37. [Google Scholar] [CrossRef]
  23. Osica, I.; Imamura, G.; Shiba, K.; Ji, Q.; Shrestha, L.K.; Hill, J.P.; Kurzydlowski, K.J.; Yoshikawa, G.; Ariga, K. Highly Networked Capsular Silica-Porphyrin Hybrid Nanostructures as Efficient Materials for Acetone Vapor Sensing. ACS Appl. Mater. Interfaces 2017, 9, 9945–9954. [Google Scholar] [CrossRef]
  24. Jeong, Y.J.; Koo, W.T.; Jang, J.S.; Kim, D.H.; Kim, M.H.; Kim, I.D. Nanoscale PtO2 Catalysts-Loaded SnO2 Multichannel Nanofibers toward Highly Sensitive Acetone Sensor. ACS Appl. Mater. Interfaces 2018, 10, 2016–2025. [Google Scholar] [CrossRef]
  25. Donglai, L.; Avi, C.; Munoz, R.A.A.; Tanin, T.; Joseph, W. Highly sensitive electrochemical detection of trace liquid peroxide explosives at a Prussian-blue ‘artificial-peroxidase’ modified electrode. Analyst 2006, 131, 1279–1281. [Google Scholar]
  26. Xie, Y.; Cheng, I.F. Selective and rapid detection of triacetone triperoxide by double-step chronoamperometry. Microchem. J. 2010, 94, 166–170. [Google Scholar] [CrossRef]
  27. Dobrokhotov, V.; Oakes, L.; Sowell, D.; Larin, A.; Hall, J.; Kengne, A.; Bakharev, P.; Corti, G.; Cantrell, T.; Prakash, T. Toward the nanospring-based artificial olfactory system for trace-detection of flammable and explosive vapors. Sens. Actuators B Chem. 2012, 168, 138–148. [Google Scholar] [CrossRef]
  28. Zhang, W.H.; Zhang, W.D.; Chen, L.Y. Highly sensitive detection of explosive triacetone triperoxide by an In2O3 sensor. Nanotechnology 2010, 21, 315502. [Google Scholar] [CrossRef]
  29. Warmer, J.; Wagner, P.; Schöning, M.J.; Kaul, P. Detection of triacetone triperoxide using temperature cycled metal-oxide semiconductor gas sensors: Detection of triacetone triperoxide. Phys. Status Solidi A Appl. Mater. Sci. 2015, 212, 1289–1298. [Google Scholar] [CrossRef]
  30. Fowler, J.D.; Allen, M.J.; Tung, V.C.; Yang, Y.; Kaner, R.B.; Weiller, B.H. Practical Chemical Sensors from Chemically Derived Graphene. ACS Nano 2009, 3, 301–306. [Google Scholar] [CrossRef] [Green Version]
  31. Yuan, W.; Shi, G. Graphene-based gas sensors. J. Mater. Chem. A 2013, 1, 10078–10091. [Google Scholar] [CrossRef]
  32. Huang, B.; Li, Z.; Liu, Z.; Zhou, G.; Hao, S.; Wu, J.; Gu, B.L.; Duan, W. Adsorption of Gas Molecules on Graphene Nanoribbons and Its Implication for Nanoscale Molecule Sensor. J. Phys. Chem. C 2008, 112, 13442–13446. [Google Scholar] [CrossRef] [Green Version]
  33. Mao, S.; Cui, S.; Lu, G.; Yu, K.; Wen, Z.; Chen, J. Tuning gas-sensing properties of reduced graphene oxide using tin oxide nanocrystals. J. Mater. Chem. 2012, 22, 11009–11013. [Google Scholar] [CrossRef]
  34. Vedala, H.; Sorescu, D.C.; Kotchey, G.P.; Star, A. Chemical sensitivity of graphene edges decorated with metal nanoparticles. Nano Lett. 2011, 11, 2342–2347. [Google Scholar] [CrossRef]
  35. Jung, M.W.; Kang, S.M.; Nam, K.-H.; An, K.-S.; Ku, B.-C. Highly transparent and flexible NO2 gas sensor film based on MoS2/rGO composites using soft lithographic patterning. Appl. Surf. Sci. 2018, 456, 7–12. [Google Scholar] [CrossRef]
  36. Xian, L.; Jing, W.; Dan, X.; Xu, J.; Yi, X.; Lan, X.; Komarneni, S. Reduced graphene oxide/MoS2 hybrid films for room-temperature formaldehyde detection. Mater. Lett. 2016, 189, 42–45. [Google Scholar]
  37. Radisavljevic, B.; Radenovic, A.; Brivio, J.; Giacometti, V.; Kis, A. Single-layer MoS2 transistors. Nat. Nanotechnol. 2011, 6, 147–150. [Google Scholar] [CrossRef]
  38. Ganatra, R.; Zhang, Q. Few-Layer MoS2: A Promising Layered Semiconductor. ACS Nano 2014, 8, 4074–4099. [Google Scholar] [CrossRef]
  39. Zhu, X.; Zhu, Y.; Murali, S.; Stoller, M.D.; Ruoff, R.S. Nanostructured Reduced Graphene Oxide/Fe2O3 Composite as a High-Performance Anode Material for Lithium Ion Batteries. ACS Nano 2011, 5, 3333–3338. [Google Scholar] [CrossRef]
  40. Zu, S.Z.; Han, B.H. Aqueous Dispersion of Graphene Sheets Stabilized by Pluronic Copolymers: Formation of Supramolecular Hydrogel. J. Phys. Chem. C 2009, 113, 13651–13657. [Google Scholar] [CrossRef]
  41. Shao, L.; Wu, Z.; Duan, H.; Shaymurat, T. Discriminative and rapid detection of ozone realized by sensor array of Zn2+ doping tailored MoS2 ultrathin nanosheets. Sens. Actuators B Chem. 2018, 258, 937–946. [Google Scholar] [CrossRef]
  42. Chen, X.; Meng, D.; Wang, B.; Li, B.W.; Li, W.; Bielawski, C.W.; Ruoff, R.S. Rapid thermal decomposition of confined graphene oxide films in air. Carbon 2016, 101, 71–76. [Google Scholar] [CrossRef]
  43. Zhang, J.; Lu, H.; Yan, C.; Yang, Z.; Zhu, G.; Gao, J.; Yin, F.; Wang, C. Fabrication of conductive graphene oxide-WO3 composite nanofibers by electrospinning and their enhanced acetone gas sensing properties. Sens. Actuators B Chem. 2018, 264, 128–138. [Google Scholar] [CrossRef]
  44. Li, Q.; Guo, B.; Yu, J.; Ran, J.; Zhang, B.; Yan, H.; Gong, J.R. Highly efficient visible-light-driven photocatalytic hydrogen production of CdS-cluster-decorated graphene nanosheets. Am. Chem. Soc. 2011, 133, 10878–10884. [Google Scholar] [CrossRef]
  45. Niu, Y.; Wang, R.; Jiao, W.; Ding, G.; Hao, L.; Yang, F.; He, X. MoS2 graphene fiber based gas sensing devices. Carbon 2015, 95, 34–41. [Google Scholar] [CrossRef]
  46. Ghasemi, F.; Jalali, M.; Abdollahi, A.; Mohammadi, S.; Sanaee, Z.; Mohajerzadeh, S. A high performance supercapacitor based on decoration of MoS2/reduced graphene oxide with NiO nanoparticles. RSC Adv. 2017, 7, 52772–52781. [Google Scholar] [CrossRef]
  47. Lipatov, A.; Varezhnikov, A.; Wilson, P.; Sysoev, V.; Kolmakov, A.; Sinitskii, A. Highly selective gas sensor arrays based on thermally reduced graphene oxide. Nanoscale 2013, 5, 5426–5434. [Google Scholar] [CrossRef]
  48. Kumar, R.; Goel, N.; Kumar, M. High performance NO2 sensor using MoS2 nanowires network. Appl. Phys. Lett. 2018, 112, 053502. [Google Scholar] [CrossRef]
  49. Saraf, M.; Natarajan, K.; Saini, A.K.; Mobin, S.M. Small biomolecule sensors based on an innovative MoS2-rGO heterostructure modified electrode platform: A binder-free approach. Dalton Trans. 2017, 46, 15848–15858. [Google Scholar] [CrossRef]
  50. Li, H.; Yu, K.; Li, C.; Tang, Z.; Guo, B.; Lei, X.; Fu, H.; Zhu, Z. Charge-Transfer Induced High Efficient Hydrogen Evolution of MoS2/graphene Cocatalyst. Sci. Rep. 2015, 5, 18730. [Google Scholar] [CrossRef]
  51. Lu, Y.; Meyyappan, M.; Li, J. Trace detection of hydrogen peroxide vapor using a carbon-nanotube-based chemical sensor. Small 2011, 7, 1714–1718. [Google Scholar] [CrossRef]
  52. Lee, D.J.; Choi, S.W.; Byun, Y.T. Room temperature monitoring of hydrogen peroxide vapor using platinum nanoparticles-decorated single-walled carbon nanotube networks. Sens. Actuators B Chem. 2017, 256, 744–750. [Google Scholar] [CrossRef]
  53. Verma, A.L.; Saxena, S.; Saini, G.S.S.; Gaur, V.; Jain, V.K. Hydrogen peroxide vapor sensor using metal-phthalocyanine functionalized carbon nanotubes. Thin Solid Films 2011, 519, 8144–8148. [Google Scholar] [CrossRef]
  54. Lichtenstein, A.; Havivi, E.; Shacham, R.; Hahamy, E.; Leibovich, R.; Pevzner, A.; Krivitsky, V.; Davivi, G.; Presman, I.; Elnathan, R. Supersensitive fingerprinting of explosives by chemically modified nanosensors arrays. Nat. Commun. 2014, 5, 4195. [Google Scholar] [CrossRef] [Green Version]
  55. Wu, Z.; Zhou, C.; Zu, B.; Li, Y.; Dou, X. Contactless and Rapid Discrimination of Improvised Explosives Realized by Mn2+ Doping Tailored ZnS Nanocrystals. Adv. Funct. Mater. 2016, 26, 4578–4586. [Google Scholar] [CrossRef]
  56. Abdi, H.; Williams, L.J. Principal component analysis. Wiley Interdiscip. Rev. Comput. Stat. 2010, 2, 433–459. [Google Scholar] [CrossRef] [Green Version]
  57. Jolliffe, I.T. Principal component analysis. J. Mark. Res. 2002, 87, 513. [Google Scholar]
  58. Lu, Y.; Partridge, C.; Meyyappan, M.; Jing, L. A carbon nanotube sensor array for sensitive gas discrimination using principal component analysis. J. Electroanal. Chem. 2006, 593, 105–110. [Google Scholar] [CrossRef]
  59. Li, J.; Liu, Y.; Zhang, J.; Liang, X.; Duan, H. Density functional theory study of the adsorption of hydrogen atoms on Cu2X (X = 3d) clusters. Chem. Phys. Lett. 2016, 651, 137–143. [Google Scholar] [CrossRef]
  60. Bhati, V.S.; Ranwa, S.; Rajamani, S.; Kumari, K.; Raliya, R.; Biswas, P.; Kumar, M. Improved sensitivity with low limit of detection of hydrogen gas sensor based on rGO loaded Ni doped ZnO nanostructures. ACS Appl. Mater. Interfaces 2018, 10, 11116–11124. [Google Scholar] [CrossRef]
  61. Näther, N.; Henkel, H.; Schneider, A.; Schöning, M.J. Investigation of different catalytically active and passive materials for realising a hydrogen peroxide gas sensor. Phys. Status Solidi 2010, 206, 449–454. [Google Scholar] [CrossRef]
Figure 1. Schematic diagram of MoS2/RGO composite with reduced graphene oxide (RGO) as template.
Sensors 19 01281 g001
Figure 2. SEM images of (a,b) MoS2/RGO-1, (c,d) MoS2/RGO-2, and (e,f) MoS2/RGO-3 composites.
Sensors 19 01281 g002
Figure 3. (a) XRD patterns, (b) FT-IR spectrum, (c) Raman spectrum of MoS2/RGO-1, MoS2/RGO-2, and MoS2/RGO-3 composites; (d) I–V curves of sensors 1, 2, 3 and (e,f) TEM images of MoS2/RGO-3 composites.
Sensors 19 01281 g003
Figure 4. XPS spectra of MoS2/RGO composites (a) high-resolution spectra, (b) O1s (c) C1s, (d) Mo3d, (e) S2p, and (f) ratio of the intensity of C1s to S2p.
Sensors 19 01281 g004
Figure 5. (a) Dynamic sensing curves of the devices based on sensor 1, 2, and 3 to 50 ppm of H2O2, C3H6O, C2H6O vapors at room temperature; statistical graph of (b) average response, (c) response time and (d) recovery time corresponding to the sensing curves.
Sensors 19 01281 g005
Figure 6. (a) Response curves of MoS2/RGO-3 sensor to different concentrations of H2O2 vapor and (b) plots of the fitting of response vs concentration.
Sensors 19 01281 g006
Figure 7. Fingerprints combining kinetic and thermodynamic parameters of (a) H2O2, (b) C3H6O, (c) C2H6O; (d) Two-dimensional principal component analysis (PCA) plots according to the responses to H2O2, C3H6O, and C2H6O of sensor array.
Sensors 19 01281 g007
Table 1. Comparison of the reported H2O2 sensors and our sensors of MoS2/RGO-3.
Sensing MaterialsAnalyte ConcentrationTemperature (°C)Response (%)Response TimeRef.
SWCNTs100 ppm H2O225~1.97~20 s[51]
Pt-SWCNTs60.6 ppm H2O223 ± 1~50~240 s[52]
CuPc-f-MWNTs
CoPc-f-MWNTs
VPc-f-MWNTs
34% H2O2 (aq) vaporsAmbient temperature(−) 24.2
(+) 3.8
(−) 4.4
2 s
2 s
4 s
[53]
MoS2/RGO-350 ppm H2O225~373.1~9 sThis work

