A Hybrid Kinematic-Acoustic System for Automated Activity Detection of Construction Equipment


Abstract
:1. Introduction
2. Literature Review
2.1. Audio Recognition and Activity Detection Using Audio Signals
2.2. Activity Detection Using Kinematic Signals
2.3. Audio and Kinematic Data Comparison
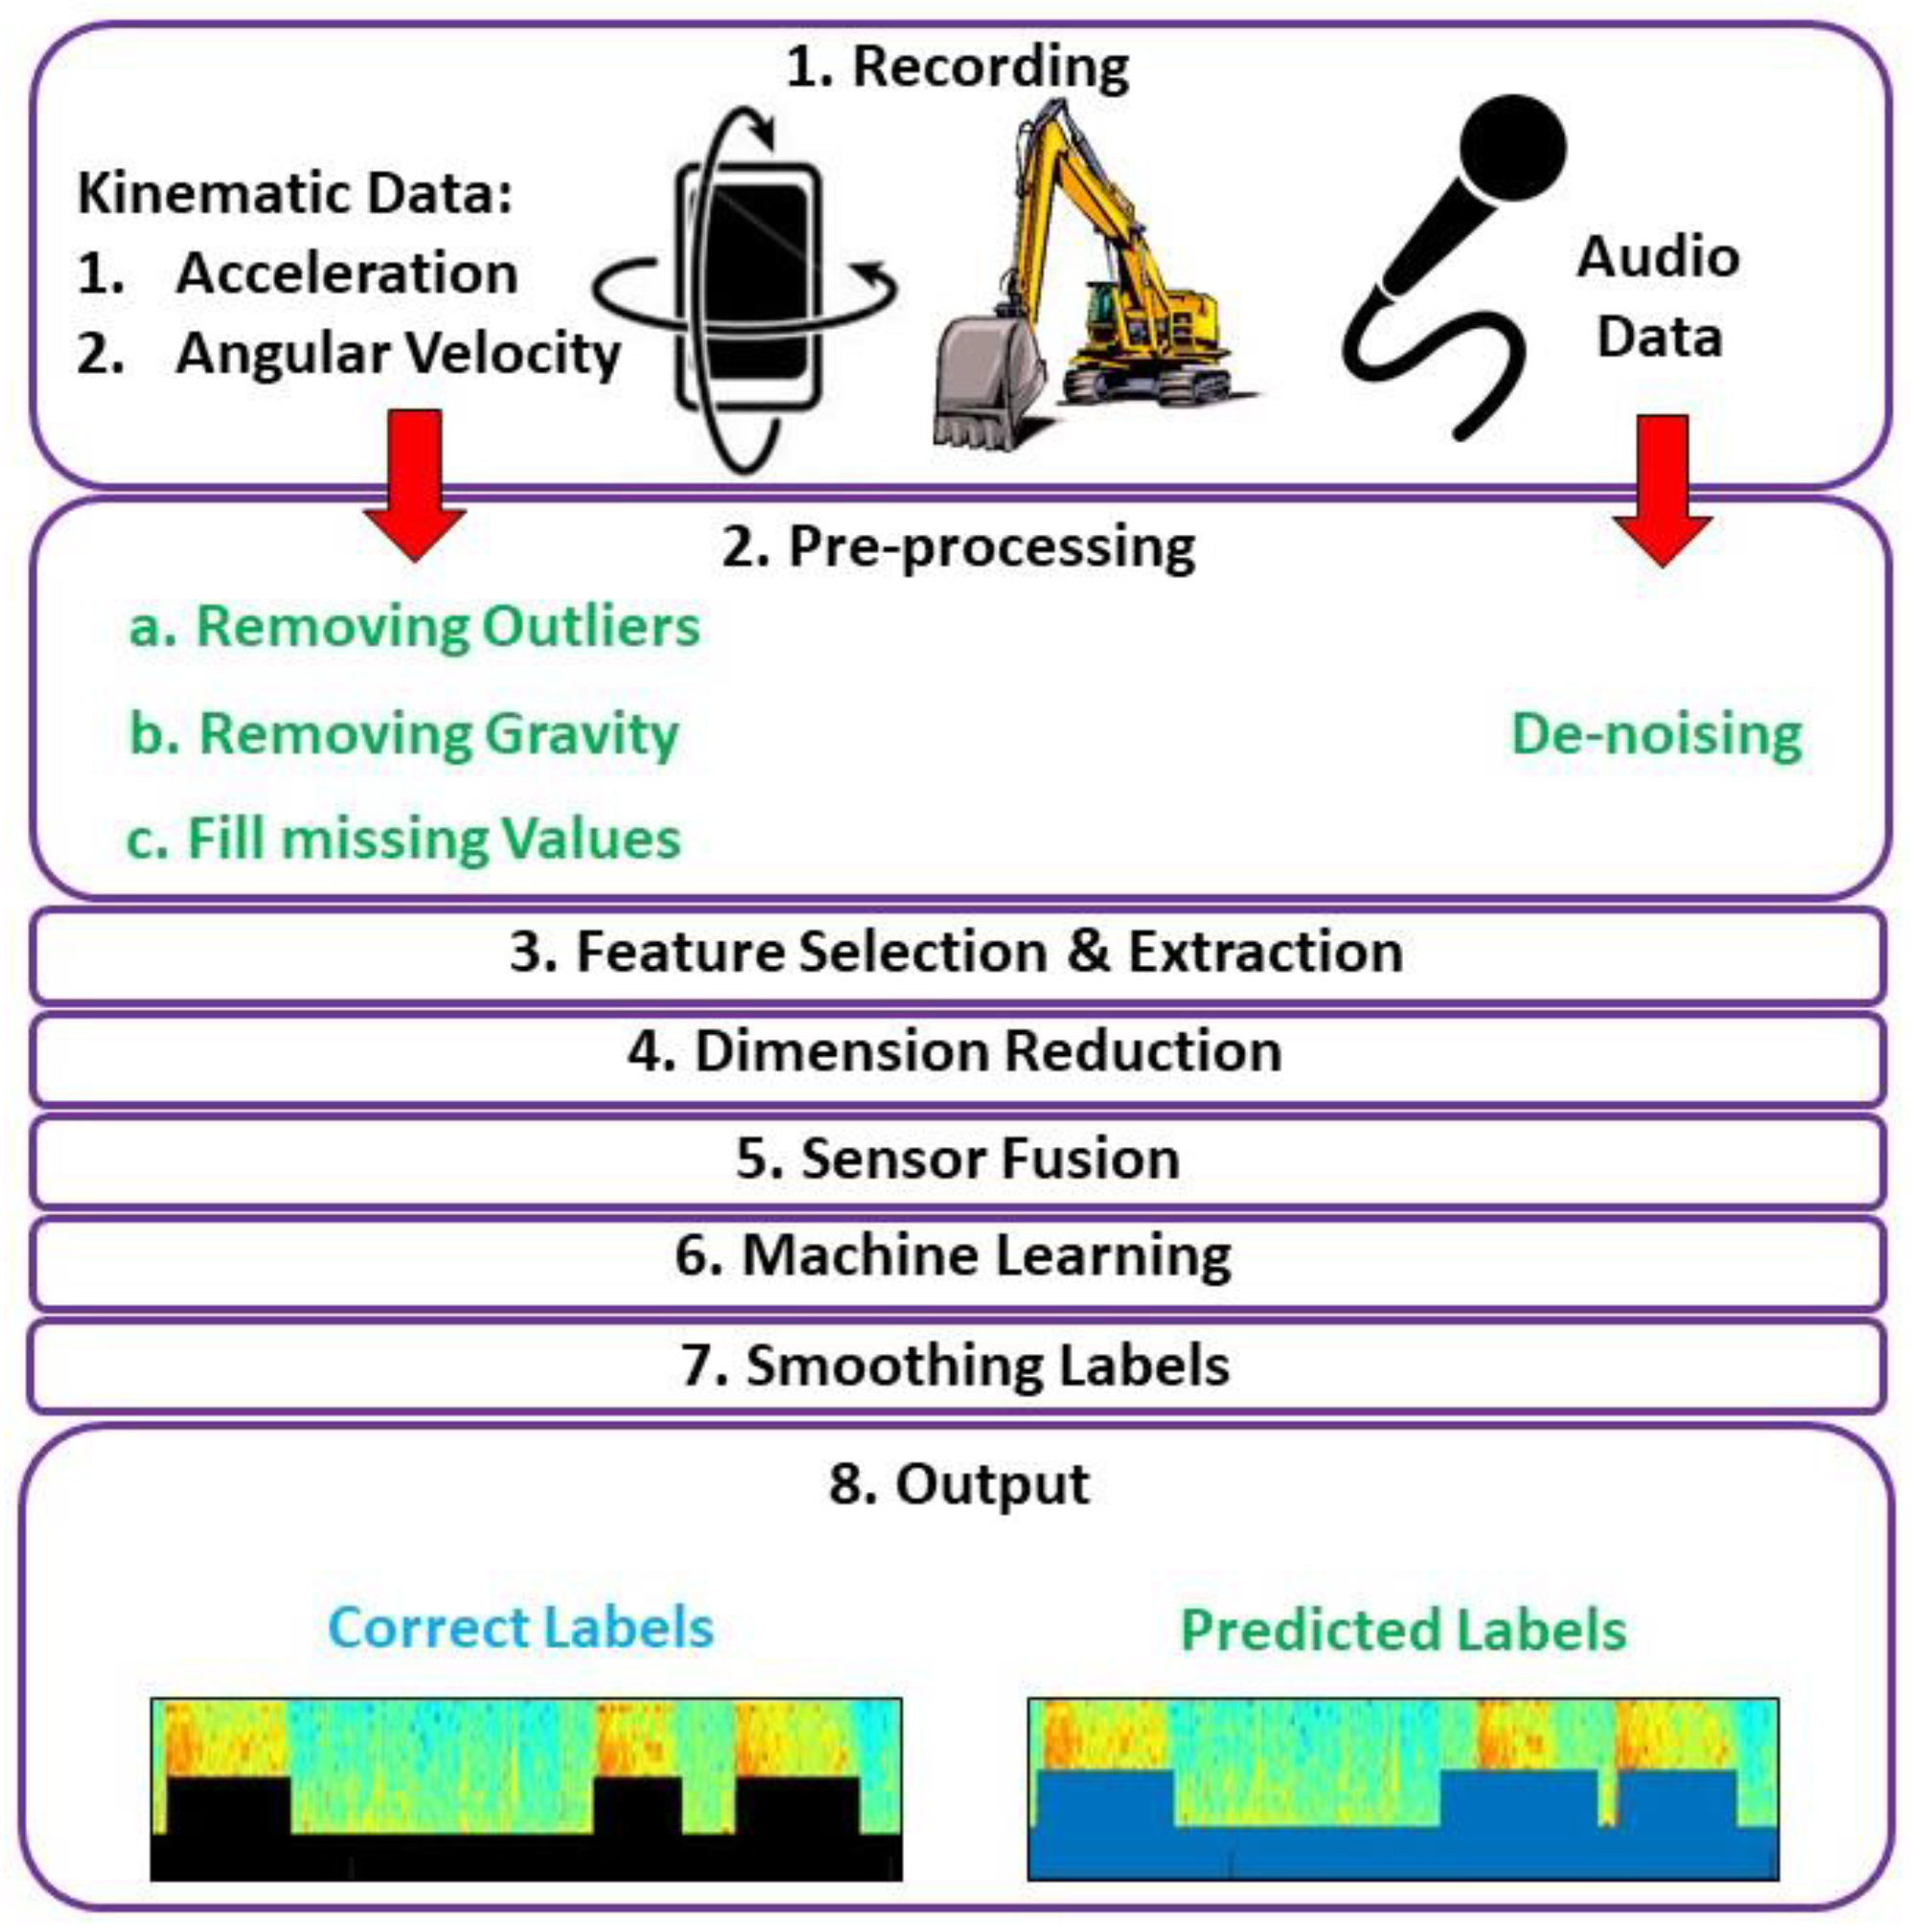
3. Materials and Methods
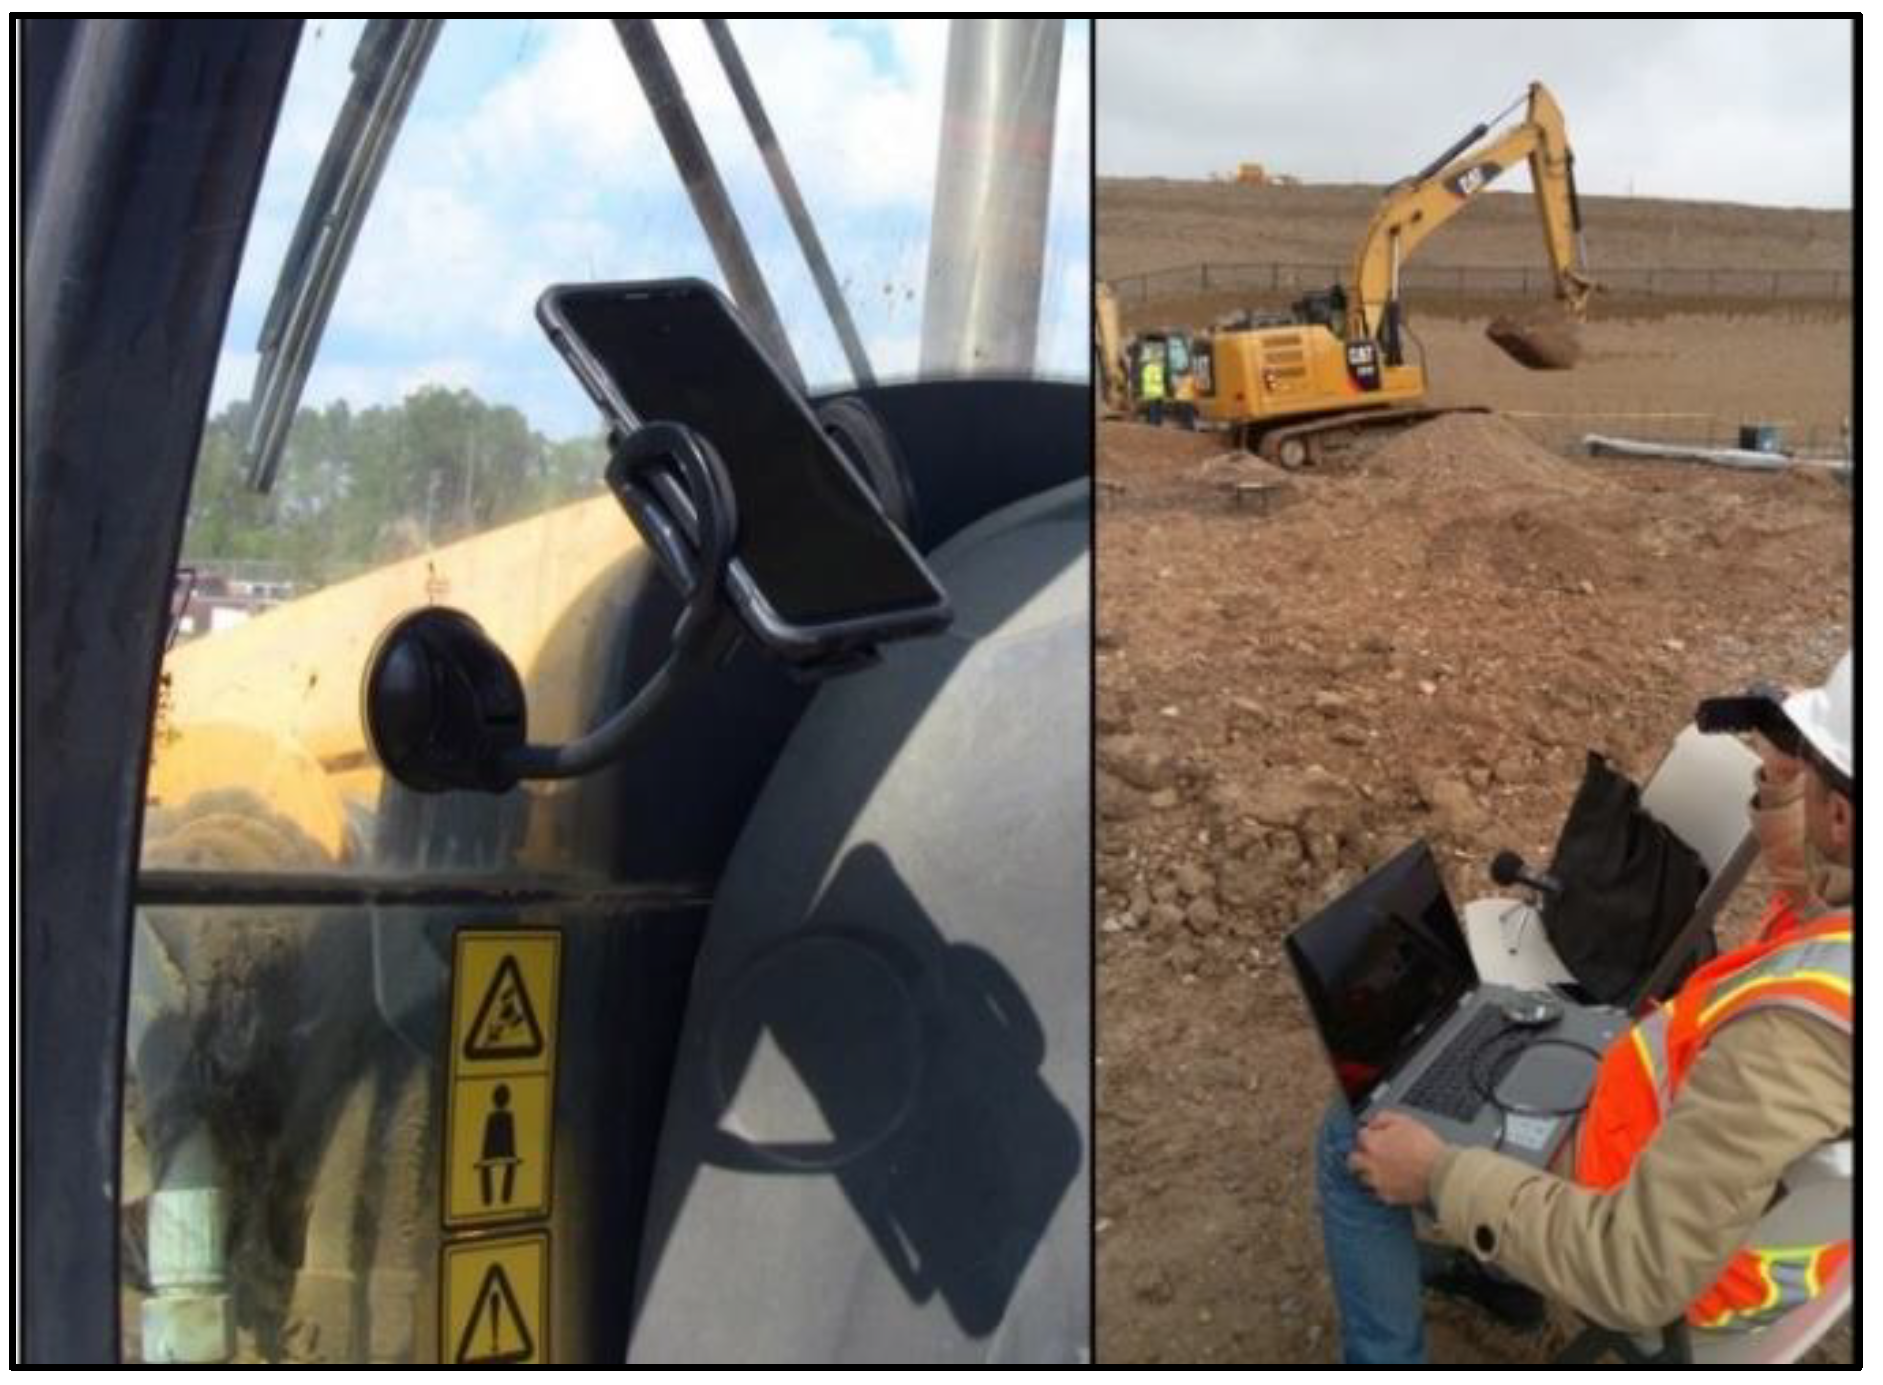
3.1. Recording Audio and Kinematic Signals
3.2. Pre-Processing Data
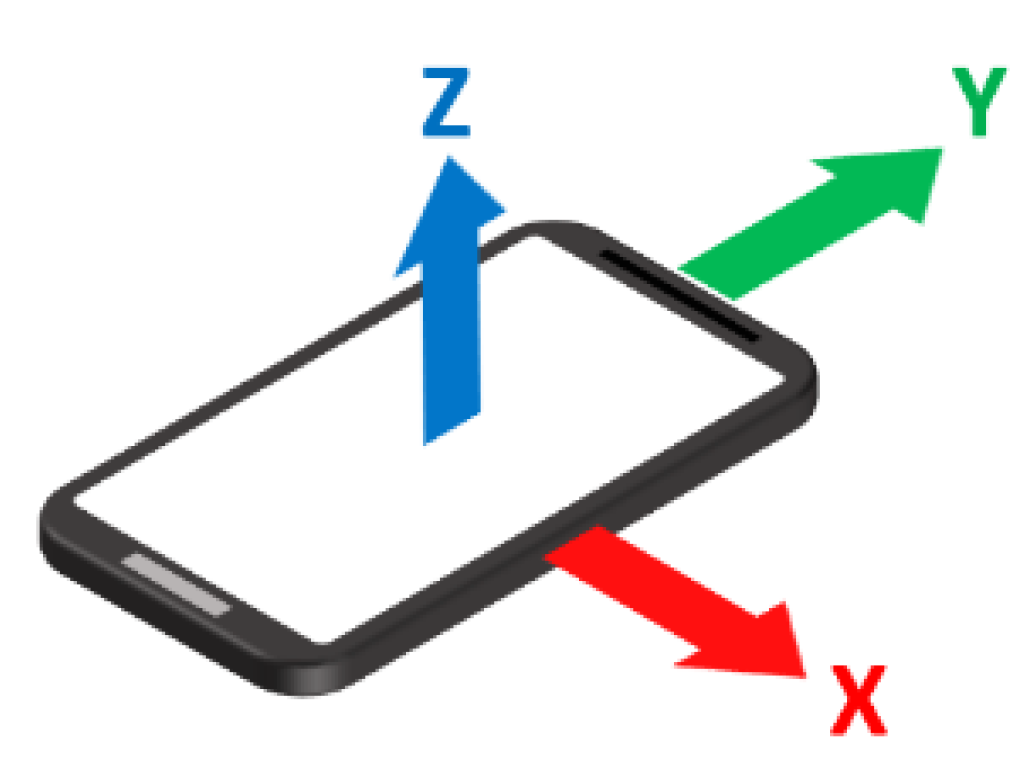
- Removing gravity: This step is only applied on an accelerometer sensor because its values are subject to both dynamic (or external) and static (or gravity) accelerations. Thus, gravity components need to be eliminated from the signal. Equation (1) shows a low-pass filter for accelerometer sensor values. The cut-off frequency of 0.1 to 0.5 Hz is recommended to remove the gravity component from the data [53,54]. This equation calculates g-values for the sensor (g is initially set to zero) and then in Equation (2), g-values are subtracted from the sensor values. More details about these equations can be found in Bayat et al. [55].g(t) = (1 − a) × g(t − 1) + a × s(t) and g(0) = 0,where, g(t) is the gravity value, which is initially set to zero and is updated accordingly, the parameter s is accelerometer sensor amplitude, the parameter t is time, and the parameter a is a variable between 0 and 1 that controls the cutoff of the filter. In similar applications for removing gravity, the value of a is set to 0.1. By implementing these equations, the effect of gravity is removed and the actual kinematic values representing relative movements with respect to the equipment’s cabin can be derived.s(t) = s(t) − g(t),
- Removing outliers: Outliers are unwanted noise or behaviors significantly different from the rest of the data. They decrease the accuracy of the system, so they should be eliminated. Data smoothing consists of techniques for removing these data points. Moving window methods are utilized to analyze data in smaller groups at a time. In this paper, the authors tested the moving window medians of length 3, 6, 12, and 24 using cross-validation. It is found that the window size of 3 is more effective to detect outliers.
- Filling missing values: During recording data, and due to connection issues, some data points might be missed or not be recorded. These missing values affect the accuracy of the system. Thus, it is crucial to find a way to fill these values. The method for filling missing values is the same as detecting and removing outliers. Similar to the chosen window size for removing outliers, the authors tested different window sizes and found that window size 24 has less impact on the data.
3.3. Selecting and Extracting Features
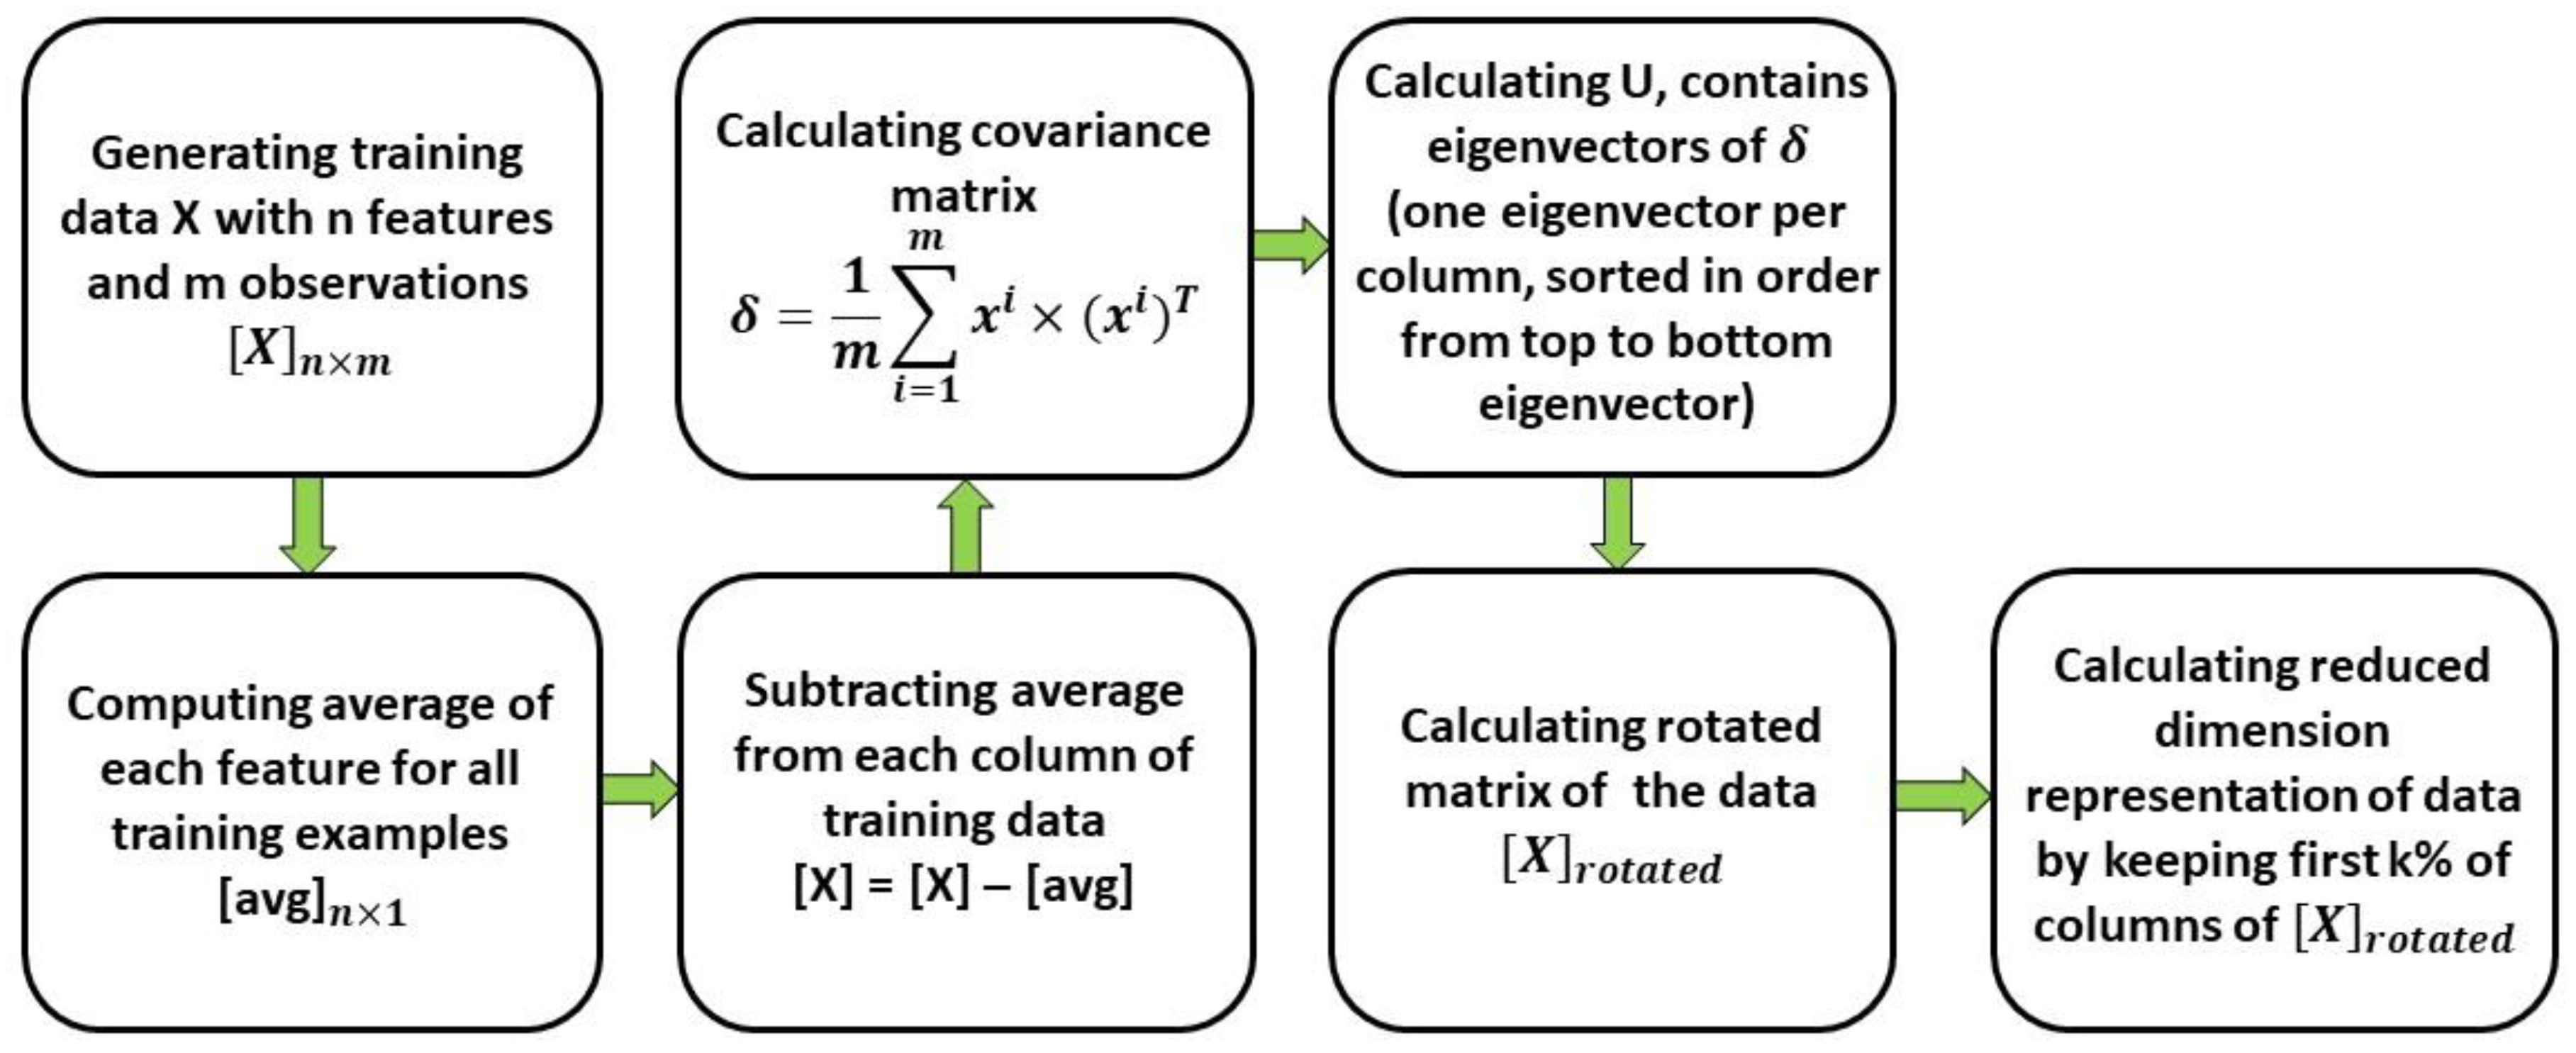
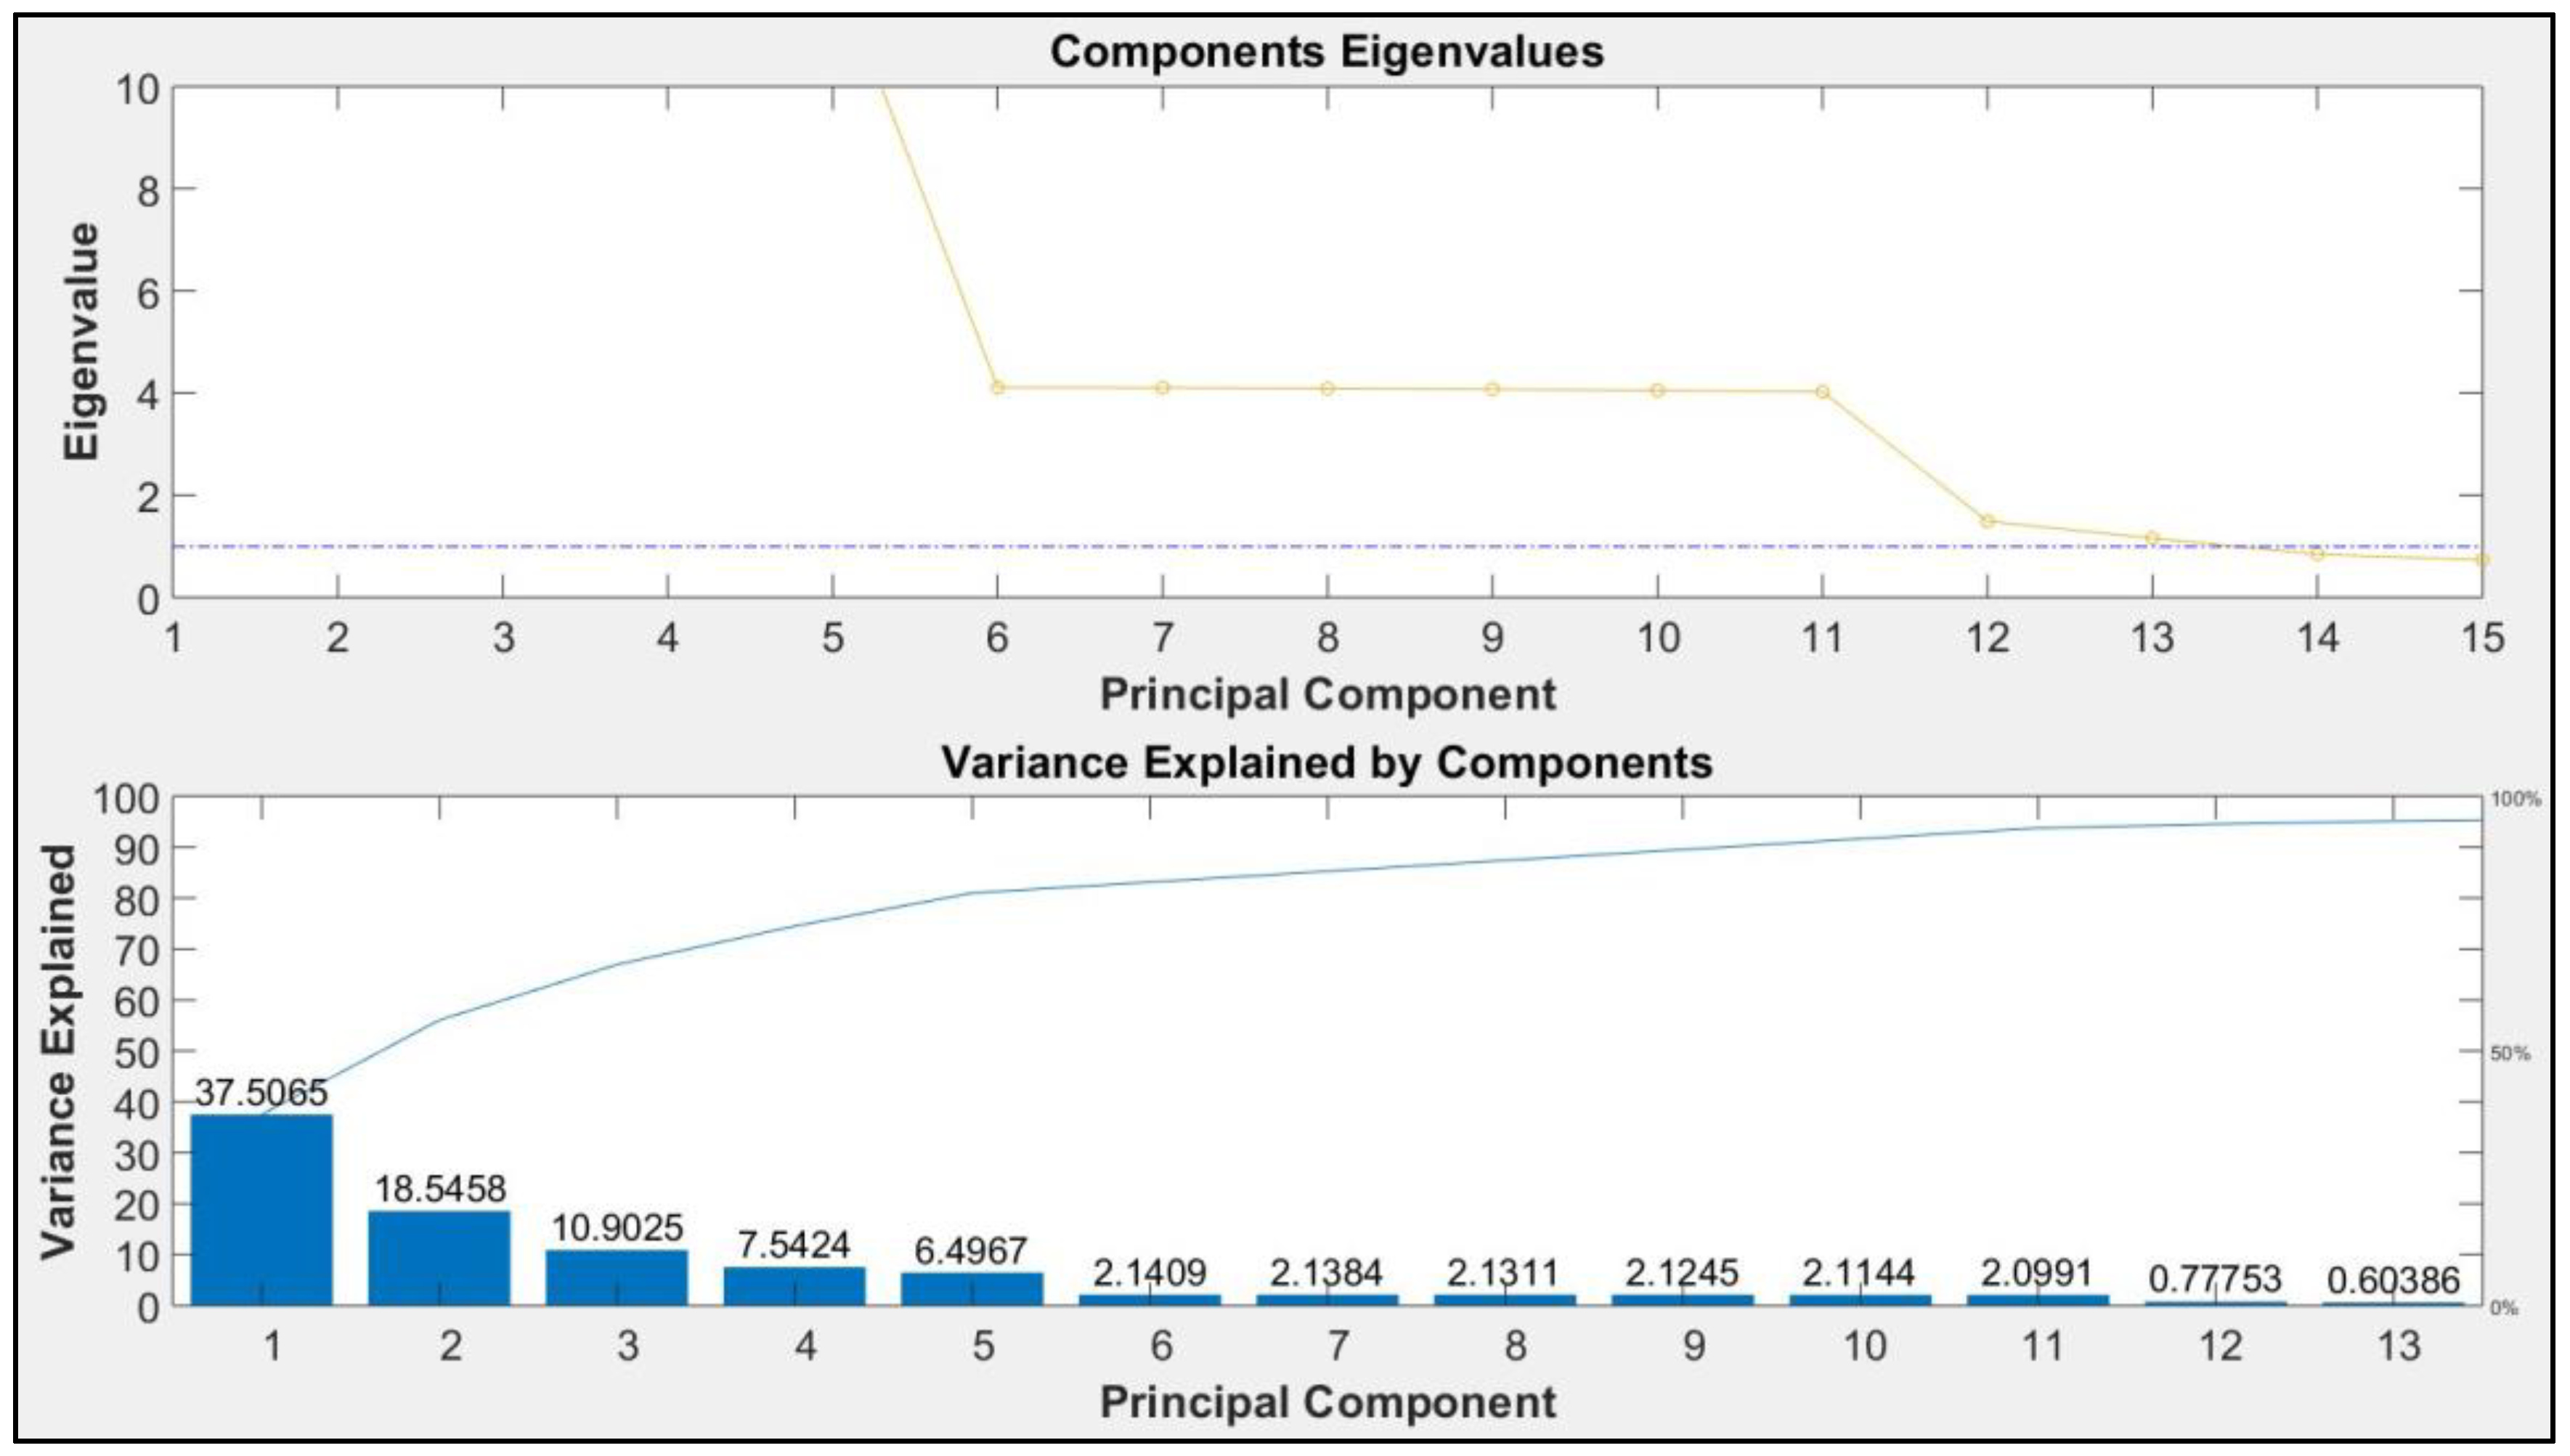
3.4. Dimension Reduction
3.5. Sensor Fusion
3.6. Support Vector Machines (SVM) Model
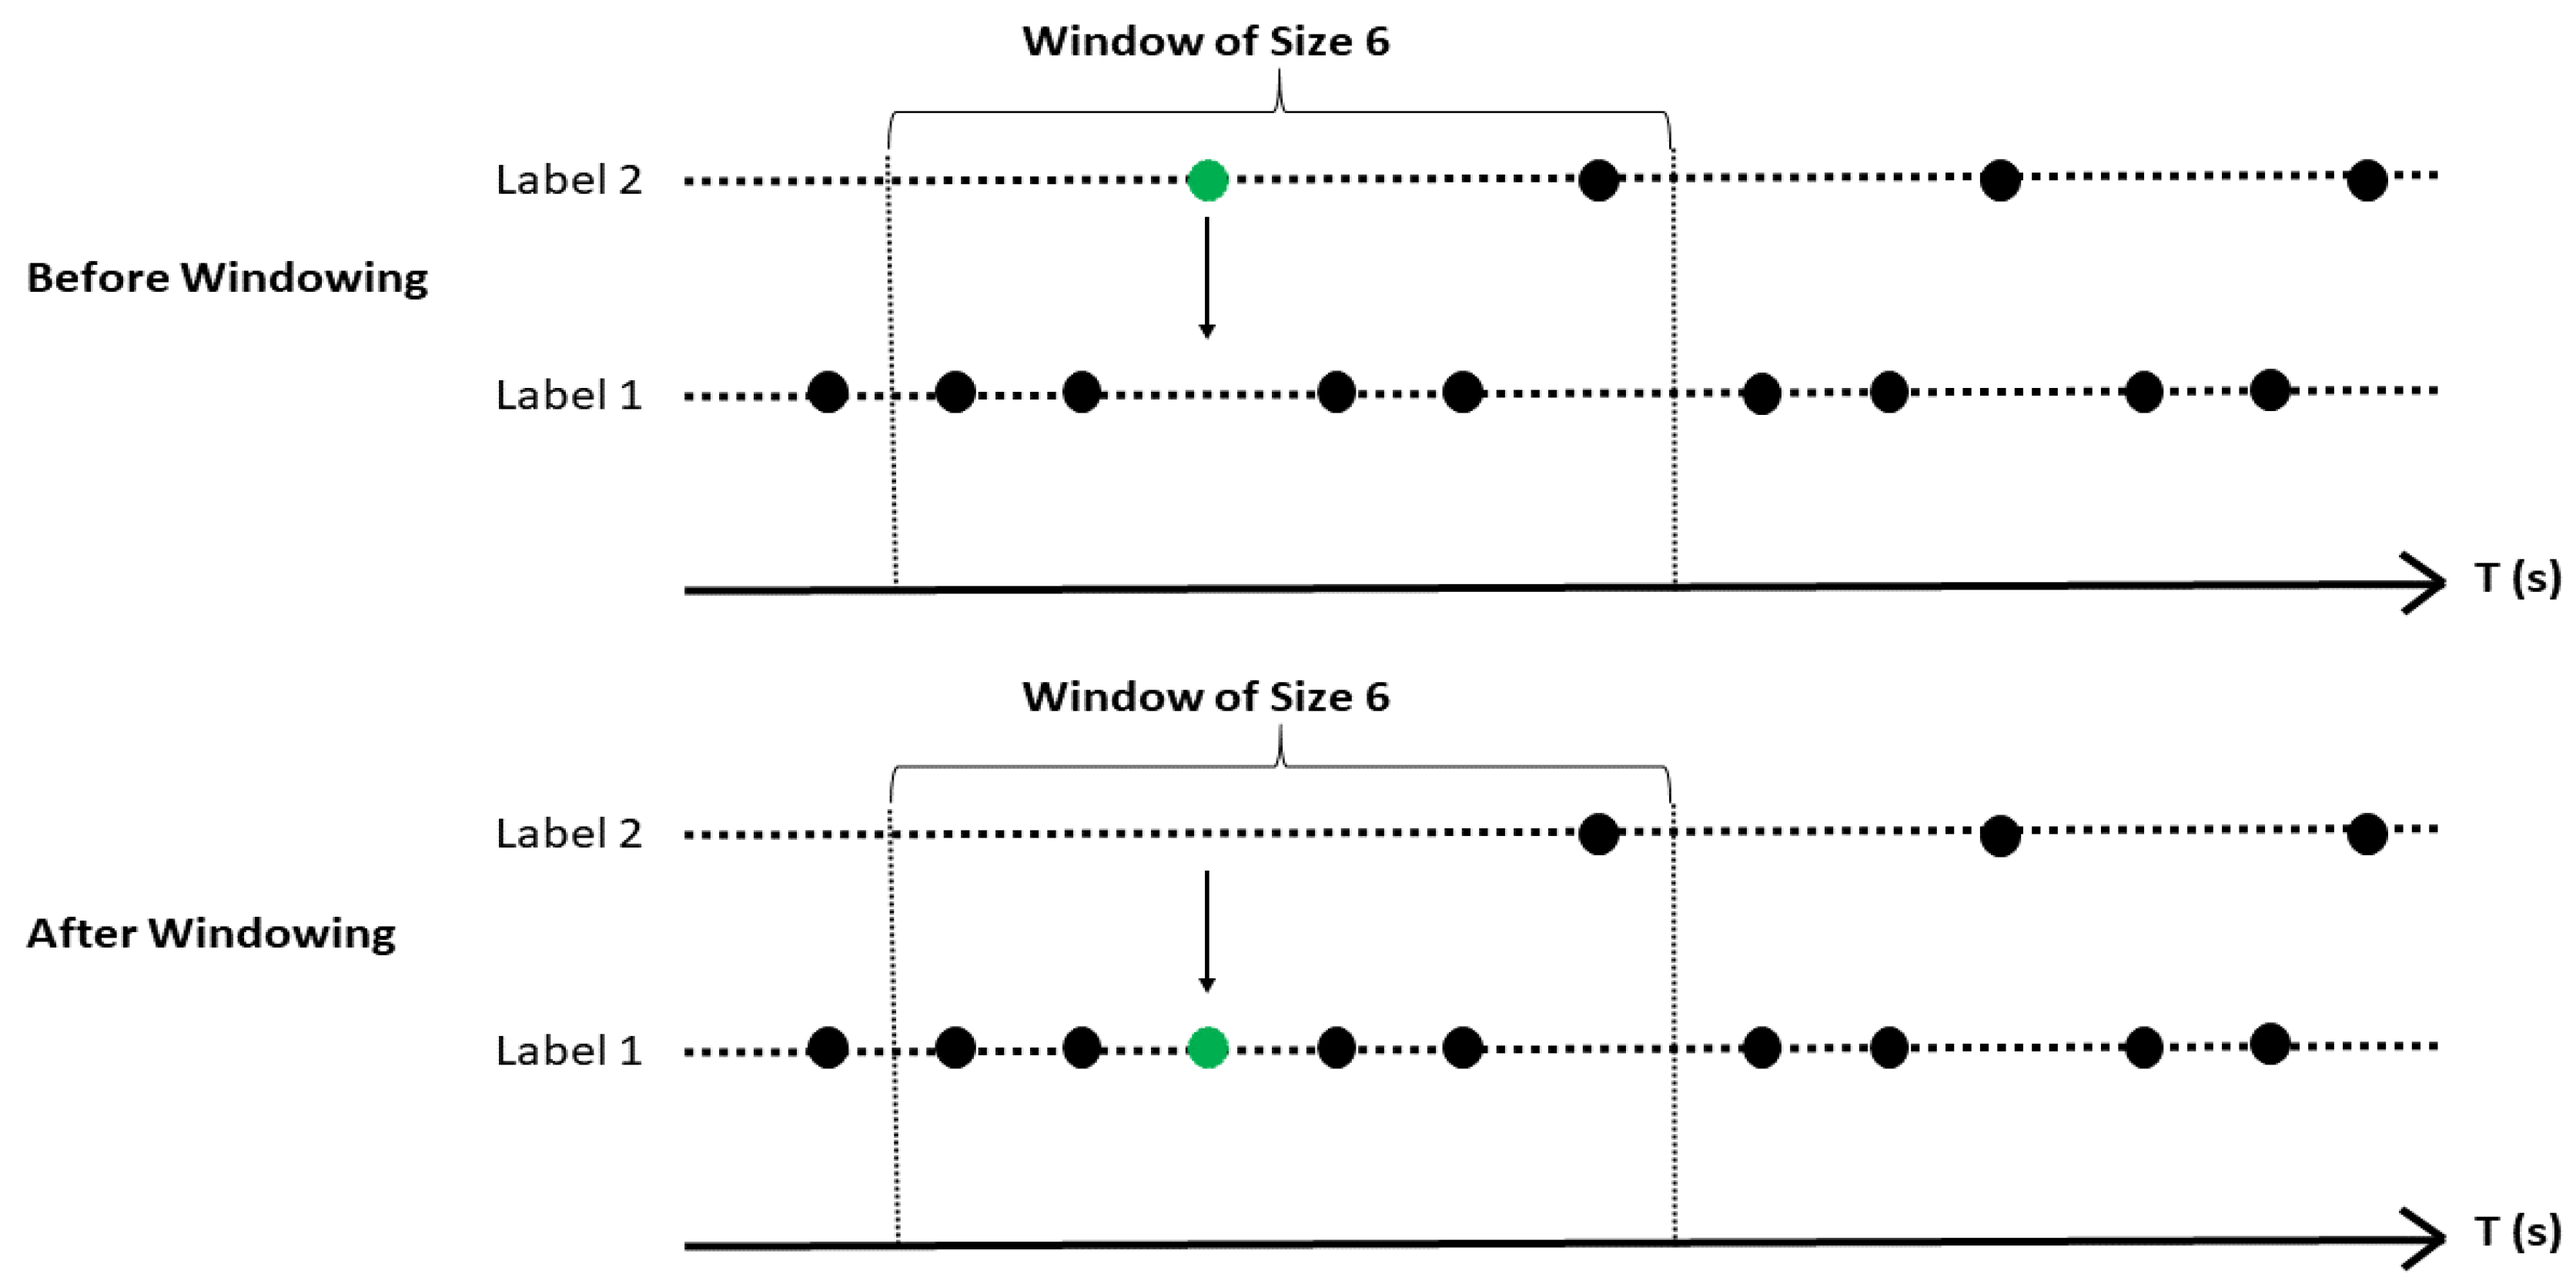
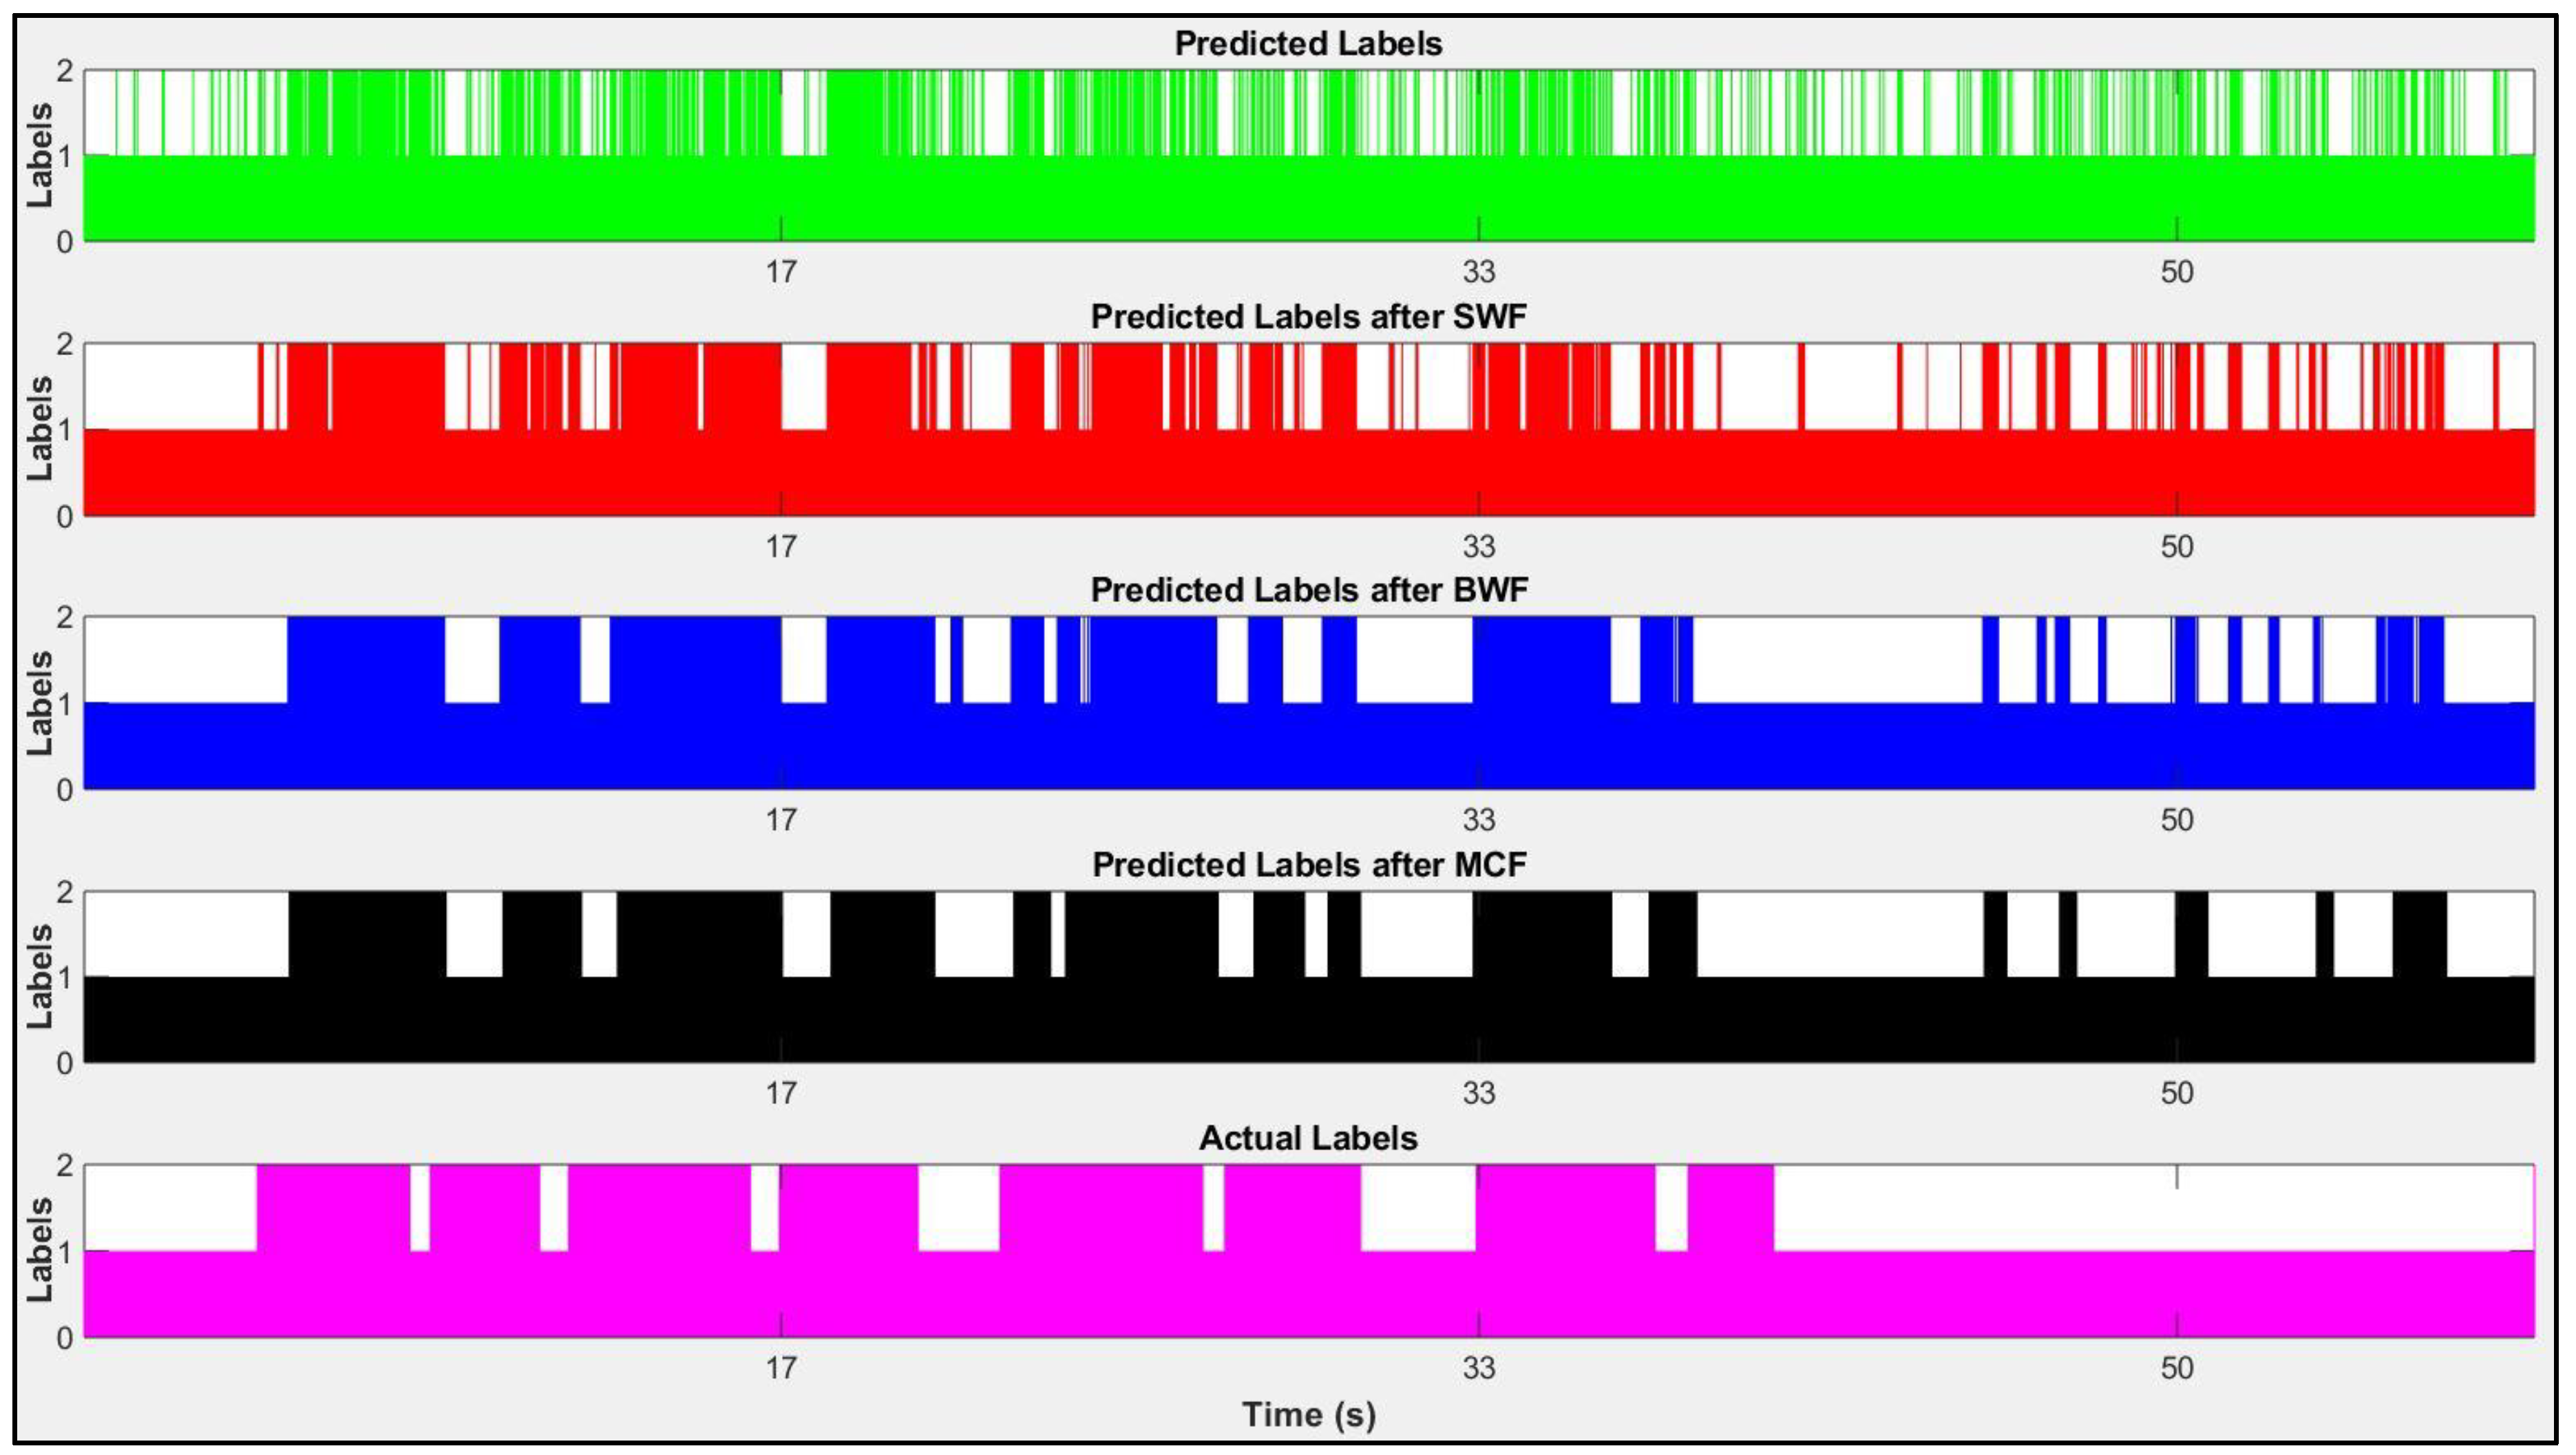
3.7. Smoothing Labels
4. Experimental Setup and Results
5. Discussion
5.1. Audio or Kinematic Data?
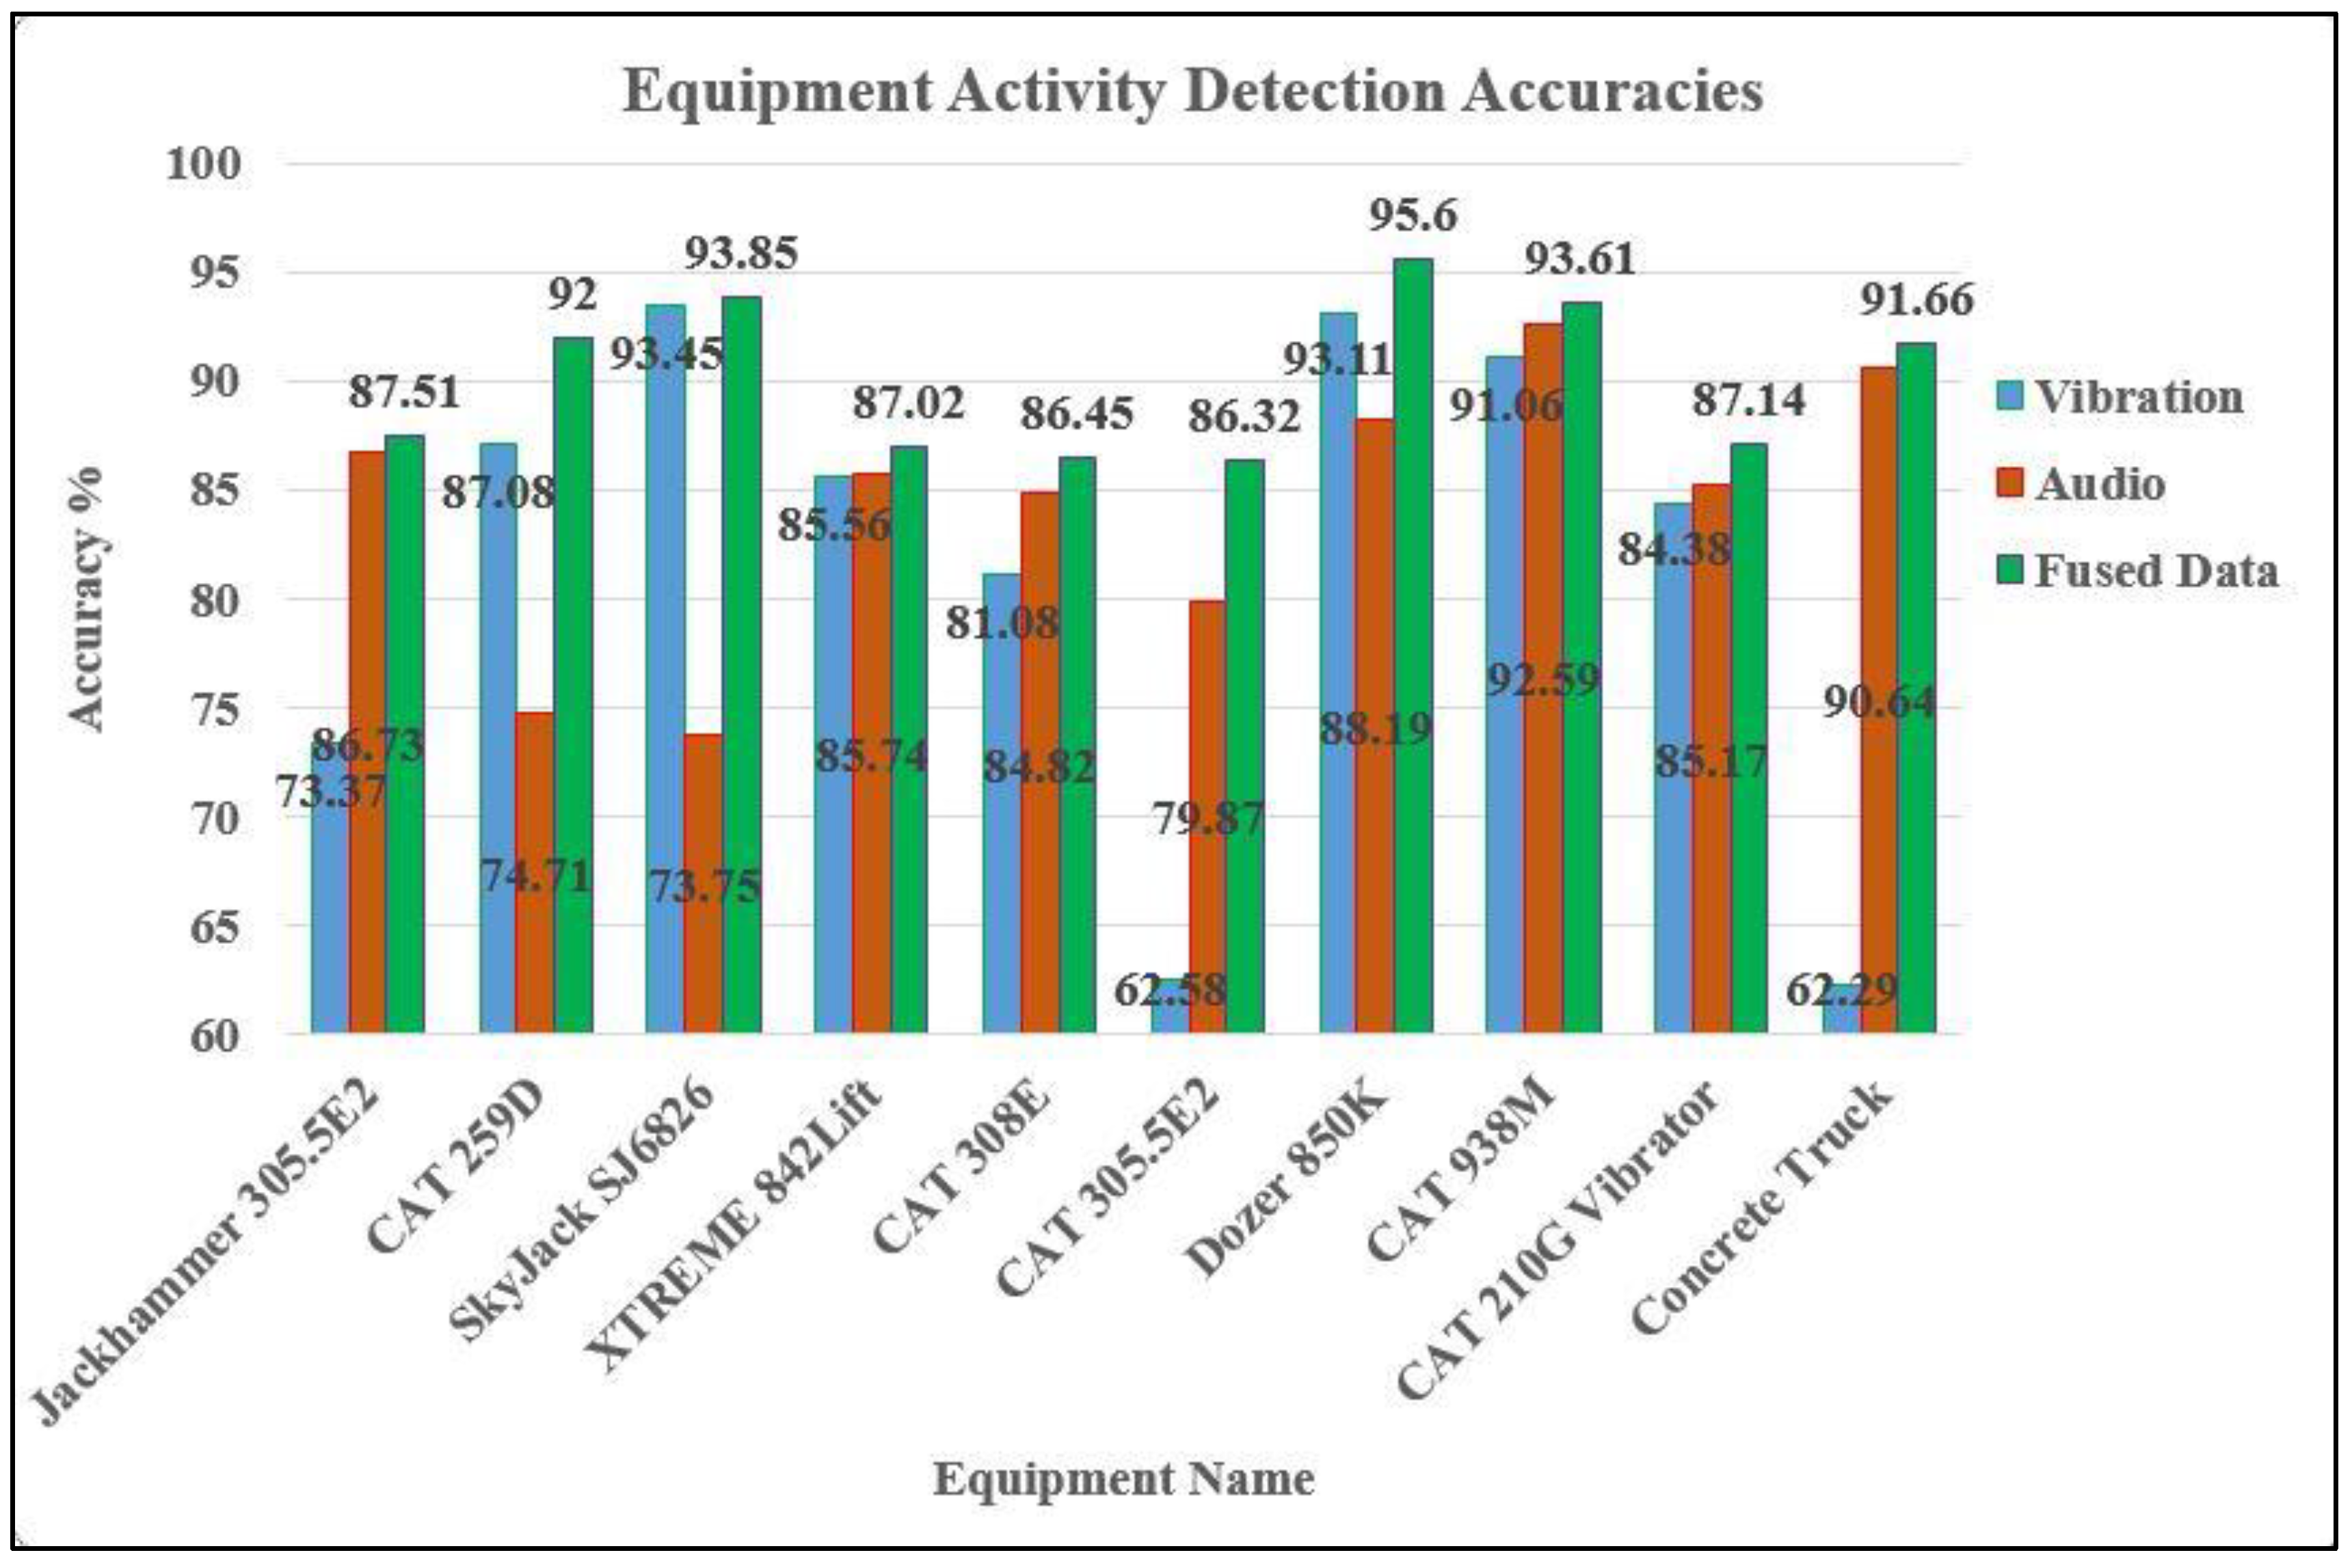
5.2. Role of Data Fusion
5.3. Applications of Equipment Activity
- Maintenance Assessment: Collecting data from different sensors and recognizing equipment activities can further be used as a platform for monitoring its abnormality or well-being, fuel consumption evaluation, and utilization time and cycle time estimation. Using an automated real-time framework, construction managers are able to continuously monitor activities of equipment using a standalone device or a mobile app. They can be provided with productivity rates and make proper decisions based on the performance of the equipment. For example, they can be notified if an equipment productivity rate is low and make proper decisions such as repairing the equipment, changing the equipment, or even changing the equipment operator.
- Environmental Performance Monitoring: Construction equipment usually releases detrimental smoke, which makes the construction job site unhealthy and unsafe for personnel. Also, it has harmful impacts on the environment. Thus, continuous monitoring of equipment can help construction managers track the emissions of the equipment during its operations and find its potential deficiencies. In other words, engine audio and kinematic data of equipment can be compared with the new models’ data and identify any abnormality to prevent more pollution.
6. Conclusions
- Construction job sites may vary in types of existing equipment, weather, complexity, etc. Some types of equipment, especially new models, might not generate kinematic signals and this would make it almost impossible to detect activities. Also, distance and inaccessibility of equipment or the presence of sound barriers may hinder the process of recording audios. Rainy, big and crowded job sites might affect the accuracy of each data type and decrease the precision of the detection. In this paper, both audio and kinematic signals have been fused to overcome and cover these limitations.
- Most of the aforementioned papers utilized a few features to train the machine learning model. In this paper, different types of time-domain and frequency-domain features were selected and evaluated before using in a training model. Also, a dimension reduction method has been implemented on the feature set to decrease the correlation between features and increase the class separability of features’ values. Moreover, it decreases computational time of the process which can further be used in real-time.
- Different types of pre-processing algorithms were implemented in this paper on audio and kinematic signals which refine the data before being used in subsequent steps.
Author Contributions
Funding
Acknowledgments
Conflicts of Interest
References
- Cheng, C.-F.; Rashidi, A.; Davenport, M.A.; Anderson, D.V. Activity analysis of construction equipment using audio signals and support vector machines. Autom. Constr. 2017, 81, 240–253. [Google Scholar] [CrossRef]
- Cheng, C.-F.; Rashidi, A.; Davenport, M.A.; Anderson, D.V. Evaluation of Software and Hardware Settings for Audio-Based Analysis of Construction Operations. Int. J. Civ. Eng. 2019, 17, 1469–1480. [Google Scholar] [CrossRef]
- Rezazadeh Azar, E.; McCabe, B. Automated. Visual recognition of dump trucks in construction videos. J. Comput. Civ. Eng. 2011, 26, 769–781. [Google Scholar] [CrossRef]
- Teizer, J.; Allread, B.S.; Fullerton, C.E.; Hinze, J. Autonomous pro-active real-time construction worker and equipment operator proximity safety alert system. Autom. Constr. 2010, 19, 630–640. [Google Scholar] [CrossRef]
- Yang, J.; Shi, Z.; Wu, Z. Vision-based action recognition of construction workers using dense trajectories. Adv. Eng. Inform. 2016, 30, 327–336. [Google Scholar] [CrossRef]
- Wang, J.; Chen, Y.; Hao, S.; Peng, X.; Hu, L. Deep learning for sensor-based activity recognition: A survey. Pattern Recognit. Lett. 2019, 119, 3–11. [Google Scholar] [CrossRef] [Green Version]
- Noghabaei, M.; Asadi, K.; Han, K. Virtual Manipulation in an Immersive Virtual Environment: Simulation of Virtual Assembly. In Proceedings of the Computing in Civil Engineering 2019: Visualization, Information Modeling and Simulation, Atlanta, GA, USA, 17–19 June 2019. [Google Scholar]
- Asadi, K.; Ramshankar, H.; Noghabaei, M.; Han, K. Real-time Image Localization and Registration with BIM Using Perspective Alignment for Indoor Monitoring of Construction. J. Comput. Civ. Eng. 2019, 33, 04019031. [Google Scholar] [CrossRef]
- Taghaddos, H.; Mashayekhi, A.; Sherafat, B. Automation of Construction Quantity Take-Off: Using Building Information Modeling (BIM). In Proceedings of the Construction Research Congress 2016, San Juan, PR, USA, 31 May–2 June 2016. [Google Scholar]
- Golparvar-Fard, M.; Heydarian, A.; Niebles, J.C. Vision-based action recognition of earthmoving equipment using spatio-temporal features and support vector machine classifiers. Adv. Eng. Inform. 2013, 27, 652–663. [Google Scholar] [CrossRef]
- Gong, J.; Caldas, C.H. Computer vision-based video interpretation model for automated productivity analysis of construction operations. J. Comput. Civ. Eng. 2009, 24, 252–263. [Google Scholar] [CrossRef]
- Gong, J.; Caldas, C.H.; Gordon, C. Learning and classifying actions of construction workers and equipment using Bag-of-Video-Feature-Words and Bayesian network models. Adv. Eng. Inform. 2011, 25, 771–782. [Google Scholar] [CrossRef]
- Akhavian, R.; Behzadan, A.H. Construction equipment activity recognition for simulation input modeling using mobile sensors and machine learning classifiers. Adv. Eng. Inform. 2015, 29, 867–877. [Google Scholar] [CrossRef]
- Ahn, C.R.; Lee, S.; Pena-Mora, F. Application of low-cost accelerometers for measuring the operational efficiency of a construction equipment fleet. J. Comput. Civ. Eng. 2013, 29, 04014042. [Google Scholar] [CrossRef]
- Sabillon, C.A.; Rashidi, A.; Samanta, B.; Cheng, C.F.; Davenport, M.A.; Anderson, D.V. A Productivity Forecasting System for Construction Cyclic Operations Using Audio Signals and a Bayesian Approach. In Proceedings of the Construction Research Congress 2018, New Orleans, LA, USA, 2–4 April 2018. [Google Scholar]
- Sherafat, B.; Rashidi, A.; Lee, Y.C.; Ahn, C.R. Automated Activity Recognition of Construction Equipment Using a Data Fusion Approach. In Proceedings of the Computing in Civil Engineering 2019: Data, Sensing, and Analytics, Atlanta, GA, USA, 17–19 June 2019. [Google Scholar]
- Pires, I.M.; Santos, R.; Pombo, N.; Garcia, N.M.; Florez-Revuelta, F.; Spinsante, S.; Goleva, R.; Zdravevski, E. Recognition of Activities of Daily Living Based on Environmental Analyses Using Audio Fingerprinting Techniques: A Systematic Review. Sensors 2018, 18, 160. [Google Scholar] [CrossRef] [PubMed]
- Guo, G.; Li, S.Z. Content-based audio classification and retrieval by support vector machines. IEEE Trans. Neural Netw. 2003, 14, 209–215. [Google Scholar] [PubMed]
- Rossi, M.; Feese, S.; Amft, O.; Braune, N.; Martis, S.; Tröster, G. AmbientSense: A real-time ambient sound recognition system for smartphones. In Proceedings of the 2013 IEEE International Conference on Pervasive Computing and Communications Workshops (PERCOM Workshops), San Diego, CA, USA, 18–22 March 2013. [Google Scholar]
- Jayalakshmi, S.L.; Chandrakala, S.; Nedunchelian, R. Global statistical features-based approach for Acoustic Event Detection. Appl. Acoust. 2018, 139, 113–118. [Google Scholar] [CrossRef]
- Saki, F.; Sehgal, A.; Panahi, I.; Kehtarnavaz, N. Smartphone-based real-time classification of noise signals using subband features and random forest classifier. In Proceedings of the 2016 IEEE International Conference on Acoustics, Speech and Signal Processing (ICASSP), Shanghai, China, 20–25 March 2016. [Google Scholar]
- Saki, F.; Kehtarnavaz, N. Real-time hierarchical classification of sound signals for hearing improvement devices. Appl. Acoust. 2018, 132, 26–32. [Google Scholar] [CrossRef]
- Lu, L.; Zhang, H.J.; Jiang, H. Content analysis for audio classification and segmentation. IEEE Trans. Speech Audio Process. 2002, 10, 504–516. [Google Scholar] [CrossRef] [Green Version]
- Chathuranga, Y.M.D.; Jayaratne, K.L. Automatic music genre classification of audio signals with machine learning approaches. GSTF J. Comput. (JoC) 2018, 3, 13. [Google Scholar]
- Gerhard, D. Audio Signal Classification: History and Current Techniques; Technical Report TR-CS 2003–07; Department of Computer Science, University of Regina: Regina, SK, Canada, 2003; ISBN 0 7731 0456 9. [Google Scholar]
- Virtanen, T.; Plumbley, M.D.; Ellis, D. Introduction to sound scene and event analysis. In Computational Analysis of Sound Scenes and Events; Springer International Publishing: New York City, NY, USA, 2018; pp. 3–12. [Google Scholar]
- Leonardo, R.; Barandas, M.; Gamboa, H. A framework for infrastructure-free indoor localization based on pervasive sound analysis. IEEE Sens. J. 2018, 18, 4136–4144. [Google Scholar] [CrossRef]
- Hinton, G.; Mohamed, A.-R.; Jaitly, N.; Vanhoucke, V.; Kingsbury, B.; Deng, L.; Yu, D.; Dahl, G.; Senior, A.V.; Nguyen, P.; et al. Deep neural networks for acoustic modeling in speech recognition: The shared views of four research groups. IEEE Signal. Process. Mag. 2012, 29, 82–97. [Google Scholar] [CrossRef]
- McLoughlin, I.V.; Zhang, H.; Xie, Z.; Song, Y.; Xiao, W. Robust sound event classification using deep neural networks. IEEE/ACM Trans. Audio Speech Lang. Process. 2015, 23, 540–552. [Google Scholar] [CrossRef]
- Graves, A.; Mohamed, A.R.; Hinton, G. Speech recognition with deep recurrent neural networks. In Proceedings of the 2013 IEEE International Conference on Acoustics, Speech and Signal Processing, Vancouver, BC, Canada, 26–31 May 2013. [Google Scholar]
- Hwang, K.; Lee, S.Y. Environmental audio scene and activity recognition through mobile-based crowdsourcing. IEEE Trans. Consum. Electronics 2012, 58, 700–705. [Google Scholar] [CrossRef]
- Zhang, T.; Lee, Y.C.; Scarpiniti, M.; Uncini, A. A Supervised Machine Learning-Based Sound Identification for Construction Activity Monitoring and Performance Evaluation. In Proceedings of the Construction Research Congress, New Orleans, LA, USA, 2–4 April 2018. [Google Scholar]
- Sherafat, B.; Rashidi, A.; Song, S. A Software-Based Approach for Acoustical Modeling of Construction Job Sites with Multiple Operational Machines. In Proceedings of the Construction Research Congress, Tempe, AZ, USA, 8–10 March 2020. (Accepted). [Google Scholar]
- Cheng, C.F.; Anderson, D.V.; Davenport, M.A.; Rashidi, A. Audio Classification Based on Weakly Labeled Data. In Proceedings of the IEEE Statistical Signal Processing Workshop (SSP), Freiburg, Germany, 10–13 June 2018. [Google Scholar]
- Bao, L.; Intille, S.S. April. Activity recognition from user-annotated acceleration data. In Proceedings of the International Conference on Pervasive Computing, Linz/Vienna, Austria, 21–23 April 2004. [Google Scholar]
- Wang, N.; Ambikairajah, E.; Lovell, N.H.; Celler, B.G. Accelerometry based classification of walking patterns using time-frequency analysis. In Proceedings of the 29th Annual International Conference of the IEEE Engineering in Medicine and Biology Society, Lyon, France, 22–26 August 2007. [Google Scholar]
- Cho, Y.; Nam, Y.; Choi, Y.J.; Cho, W.D. Smart Buckle: Human activity recognition using a 3-axis accelerometer and a wearable camera. In Proceedings of the 2nd International Workshop on Systems and Networking Support for Health Care and Assisted Living Environments, Breckenridge, CO, USA, 17 June 2008. [Google Scholar]
- Altun, K.; Barshan, B.; Tunçel, O. Comparative study on classifying human activities with miniature inertial and magnetic sensors. Pattern Recognit. 2010, 43, 3605–3620. [Google Scholar] [CrossRef]
- Kwapisz, J.R.; Weiss, G.M.; Moore, S.A. Activity recognition using cell phone accelerometers. ACM SigKDD Explor. Newsl. 2011, 12, 74. [Google Scholar] [CrossRef]
- Weng, S.; Xiang, L.; Tang, W.; Yang, H.; Zheng, L.; Lu, H.; Zheng, H. A low power and high accuracy MEMS sensor based activity recognition algorithm. In Proceedings of the 2014 IEEE International Conference on Bioinformatics and Biomedicine (BIBM), Belfast, UK, 2–5 November 2014. [Google Scholar]
- Gao, L.; Bourke, A.K.; Nelson, J. Evaluation of accelerometer based multi-sensor versus single-sensor activity recognition systems. Med. Eng. Phys. 2014, 36, 779–785. [Google Scholar] [CrossRef] [PubMed]
- Bersch, S.D.; Azzi, D.; Khusainov, R.; Achumba, I.E.; Ries, J. Sensor data acquisition and processing parameters for human activity classification. Sensors 2014, 14, 4239–4270. [Google Scholar] [CrossRef]
- Ignatov, A.D.; Strijov, V.V. Human activity recognition using quasiperiodic time series collected from a single tri-axial accelerometer. Multimed. Tools Appl. 2016, 75, 7257–7270. [Google Scholar] [CrossRef]
- Anwary, A.R.; Yu, H.; Vassallo, M. Optimal foot location for placing wearable IMU sensors and automatic feature extraction for gait analysis. IEEE Sens. J. 2017, 18, 2555–2567. [Google Scholar] [CrossRef]
- Lee, K.; Kwan, M.P. Physical activity classification in free-living conditions using smartphone accelerometer data and exploration of predicted results. Comput. Environ. Urban. Syst. 2018, 67, 124–131. [Google Scholar] [CrossRef]
- Ahn, C.R.; Lee, S.; Peña-Mora, F. Monitoring system for operational efficiency and environmental performance of construction operations using vibration signal analysis. In Proceedings of the Construction Research Congress, West Lafayette, IN, USA, 21–23 May 2012. [Google Scholar]
- Akhavian, R.; Behzadan, A.H. Remote monitoring of dynamic construction processes using automated equipment tracking. In Proceedings of the Construction Research Congress, West Lafayette, IN, USA, 21–23 May 2012. [Google Scholar]
- Akhavian, R.; Behzadan, A.H. Knowledge-based simulation modeling of construction fleet operations using multimodal-process data mining. J. Constr. Eng. Manag. 2013, 139, 4013021. [Google Scholar] [CrossRef]
- Akhavian, R.; Behzadan, A.H. Client-server interaction knowledge discovery for operations-level construction simulation using process data. In Proceedings of the Construction Research Congress 2014, Atlanta, GA, USA, 19–21 May 2014. [Google Scholar]
- Kim, H.; Ahn, C.R.; Engelhaupt, D.; Lee, S. Application of dynamic time warping to the recognition of mixed equipment activities in cycle time measurement. Autom. Constr. 2018, 87, 225–234. [Google Scholar] [CrossRef]
- Garcia-Ceja, E.; Galván-Tejada, C.E.; Brena, R. Multi-view stacking for activity recognition with sound and accelerometer data. Inf. Fusion 2018, 40, 45–56. [Google Scholar] [CrossRef]
- Rangachari, S.; Loizou, P.C. A noise-estimation algorithm for highly non-stationary environments. Speech Commun. 2006, 48, 220–231. [Google Scholar] [CrossRef]
- Lau, H.Y.; Tong, K.Y.; Zhu, H. Support vector machine for classification of walking conditions using miniature kinematic sensors. Med. Boil. Eng. Comput. 2008, 46, 563–573. [Google Scholar] [CrossRef] [PubMed]
- Fujiki, Y. iPhone as a physical activity measurement platform. In Proceedings of the CHI’10 Extended Abstracts on Human Factors in Computing Systems 2010, Atlanta, GA, USA, 10–15 April 2010; pp. 4315–4320. [Google Scholar]
- Bayat, A.; Pomplun, M.; Tran, D.A. A study on human activity recognition using accelerometer data from smartphones. Procedia Comput. Sci. 2014, 34, 450–457. [Google Scholar] [CrossRef]
- Gerami, A. Introduction to Digital Communications, 1st ed.; Academic Press: Cambridge, MA, USA, 2015; pp. 217–264. [Google Scholar]
- Zhang, M.; Cao, T.; Zhao, X. Applying Sensor-Based Technology to Improve Construction Safety Management. Sensors 2017, 17, 1841. [Google Scholar] [CrossRef] [PubMed]
- Park, M.W.; Koch, C.; Brilakis, I. Three-dimensional tracking of construction resources using an on-site camera system. J. Comput. Civ. Eng. 2011, 26, 541–549. [Google Scholar] [CrossRef]
- Kozhisseri, S.; Bikdash, M. Spectral features for the classification of civilian vehicles using acoustic sensors. In Proceedings of the 2009 IEEE Workshop on Computational Intelligence in Vehicles and Vehicular Systems, Nashville, TN, USA, 30 March–2 April 2009. [Google Scholar]
- Wieczorkowska, A.; Kubera, E.; Słowik, T.; Skrzypiec, K. Spectral features for audio-based vehicle and engine classification. J. Intell. Inf. Syst. 2018, 50, 265–290. [Google Scholar] [CrossRef]
- Wei, J.; Vongsy, K.; Mendoza-Schrock, O.; Liu, C.H. Vehicle Engine Classification Using Spectral Tone-Pitch Vibration Indexing and Neural Network. Int. J. Monit. Surveill. Technol. Res. (IJMSTR) 2014, 2, 31–49. [Google Scholar] [CrossRef] [Green Version]
- Padmavathi, G.; Shanmugapriya, D.; Kalaivani, M. Neural network approaches and MSPCA in vehicle acoustic signal classification using wireless sensor networks. In Proceedings of the 2010 International Conference on Communication Control and Computing Technologies, Ramanathapuram, India, 7–9 October 2010. [Google Scholar]
- Walse, K.H.; Dharaskar, R.V.; Thakare, V.M. Pca based optimal ann classifiers for human activity recognition using mobile sensors data. In Proceedings of First International Conference on Information and Communication Technology for Intelligent Systems; Springer International Publishing: New York City, NY, USA, 2016; pp. 429–436. [Google Scholar]
- Mishra, D.; Dash, R.; Rath, A.K.; Acharya, M. Feature Selection in Gene Expression Data Using Principal Component Analysis and Rough Set Theory. In Software Tools and Algorithms for Biological Systems. Advances in Experimental Medicine and Biology; Arabnia, H., Tran, Q.N., Eds.; Springer: New York City, NY, USA, 2011; Volume 696. [Google Scholar]
- Jain, A.; Nandakumar, K.; Ross, A. Score normalization in multimodal biometric systems. Pattern Recognit. 2005, 38, 2270–2285. [Google Scholar] [CrossRef]
- Guilloux, J.P.; Seney, M.; Edgar, N.; Sibille, E. Integrated behavioral z-scoring increases the sensitivity and reliability of behavioral phenotyping in mice: Relevance to emotionality and sex. J. Neurosci. Methods 2011, 197, 21–31. [Google Scholar] [CrossRef] [PubMed] [Green Version]
- Kaiser, H.F. The application of electronic computers to factor analysis. Educ. Psychol. Meas. 1960, 20, 141–151. [Google Scholar] [CrossRef]


| Audio and Kinematic | Only Kinematic |
|---|---|
| 25 Short Time Fourier Transform (STFT) Coefficients | Zero Crossing Rate (ZCR) |
| Root Mean Square (RMS) | |
| Short Time Energy (STE) | |
| Spectral Flux (SF) | |
| Spectral Entropy (SE) | |
| Spectral Centroid (SC) | |
| Spectral Roll-Off (SRO) |
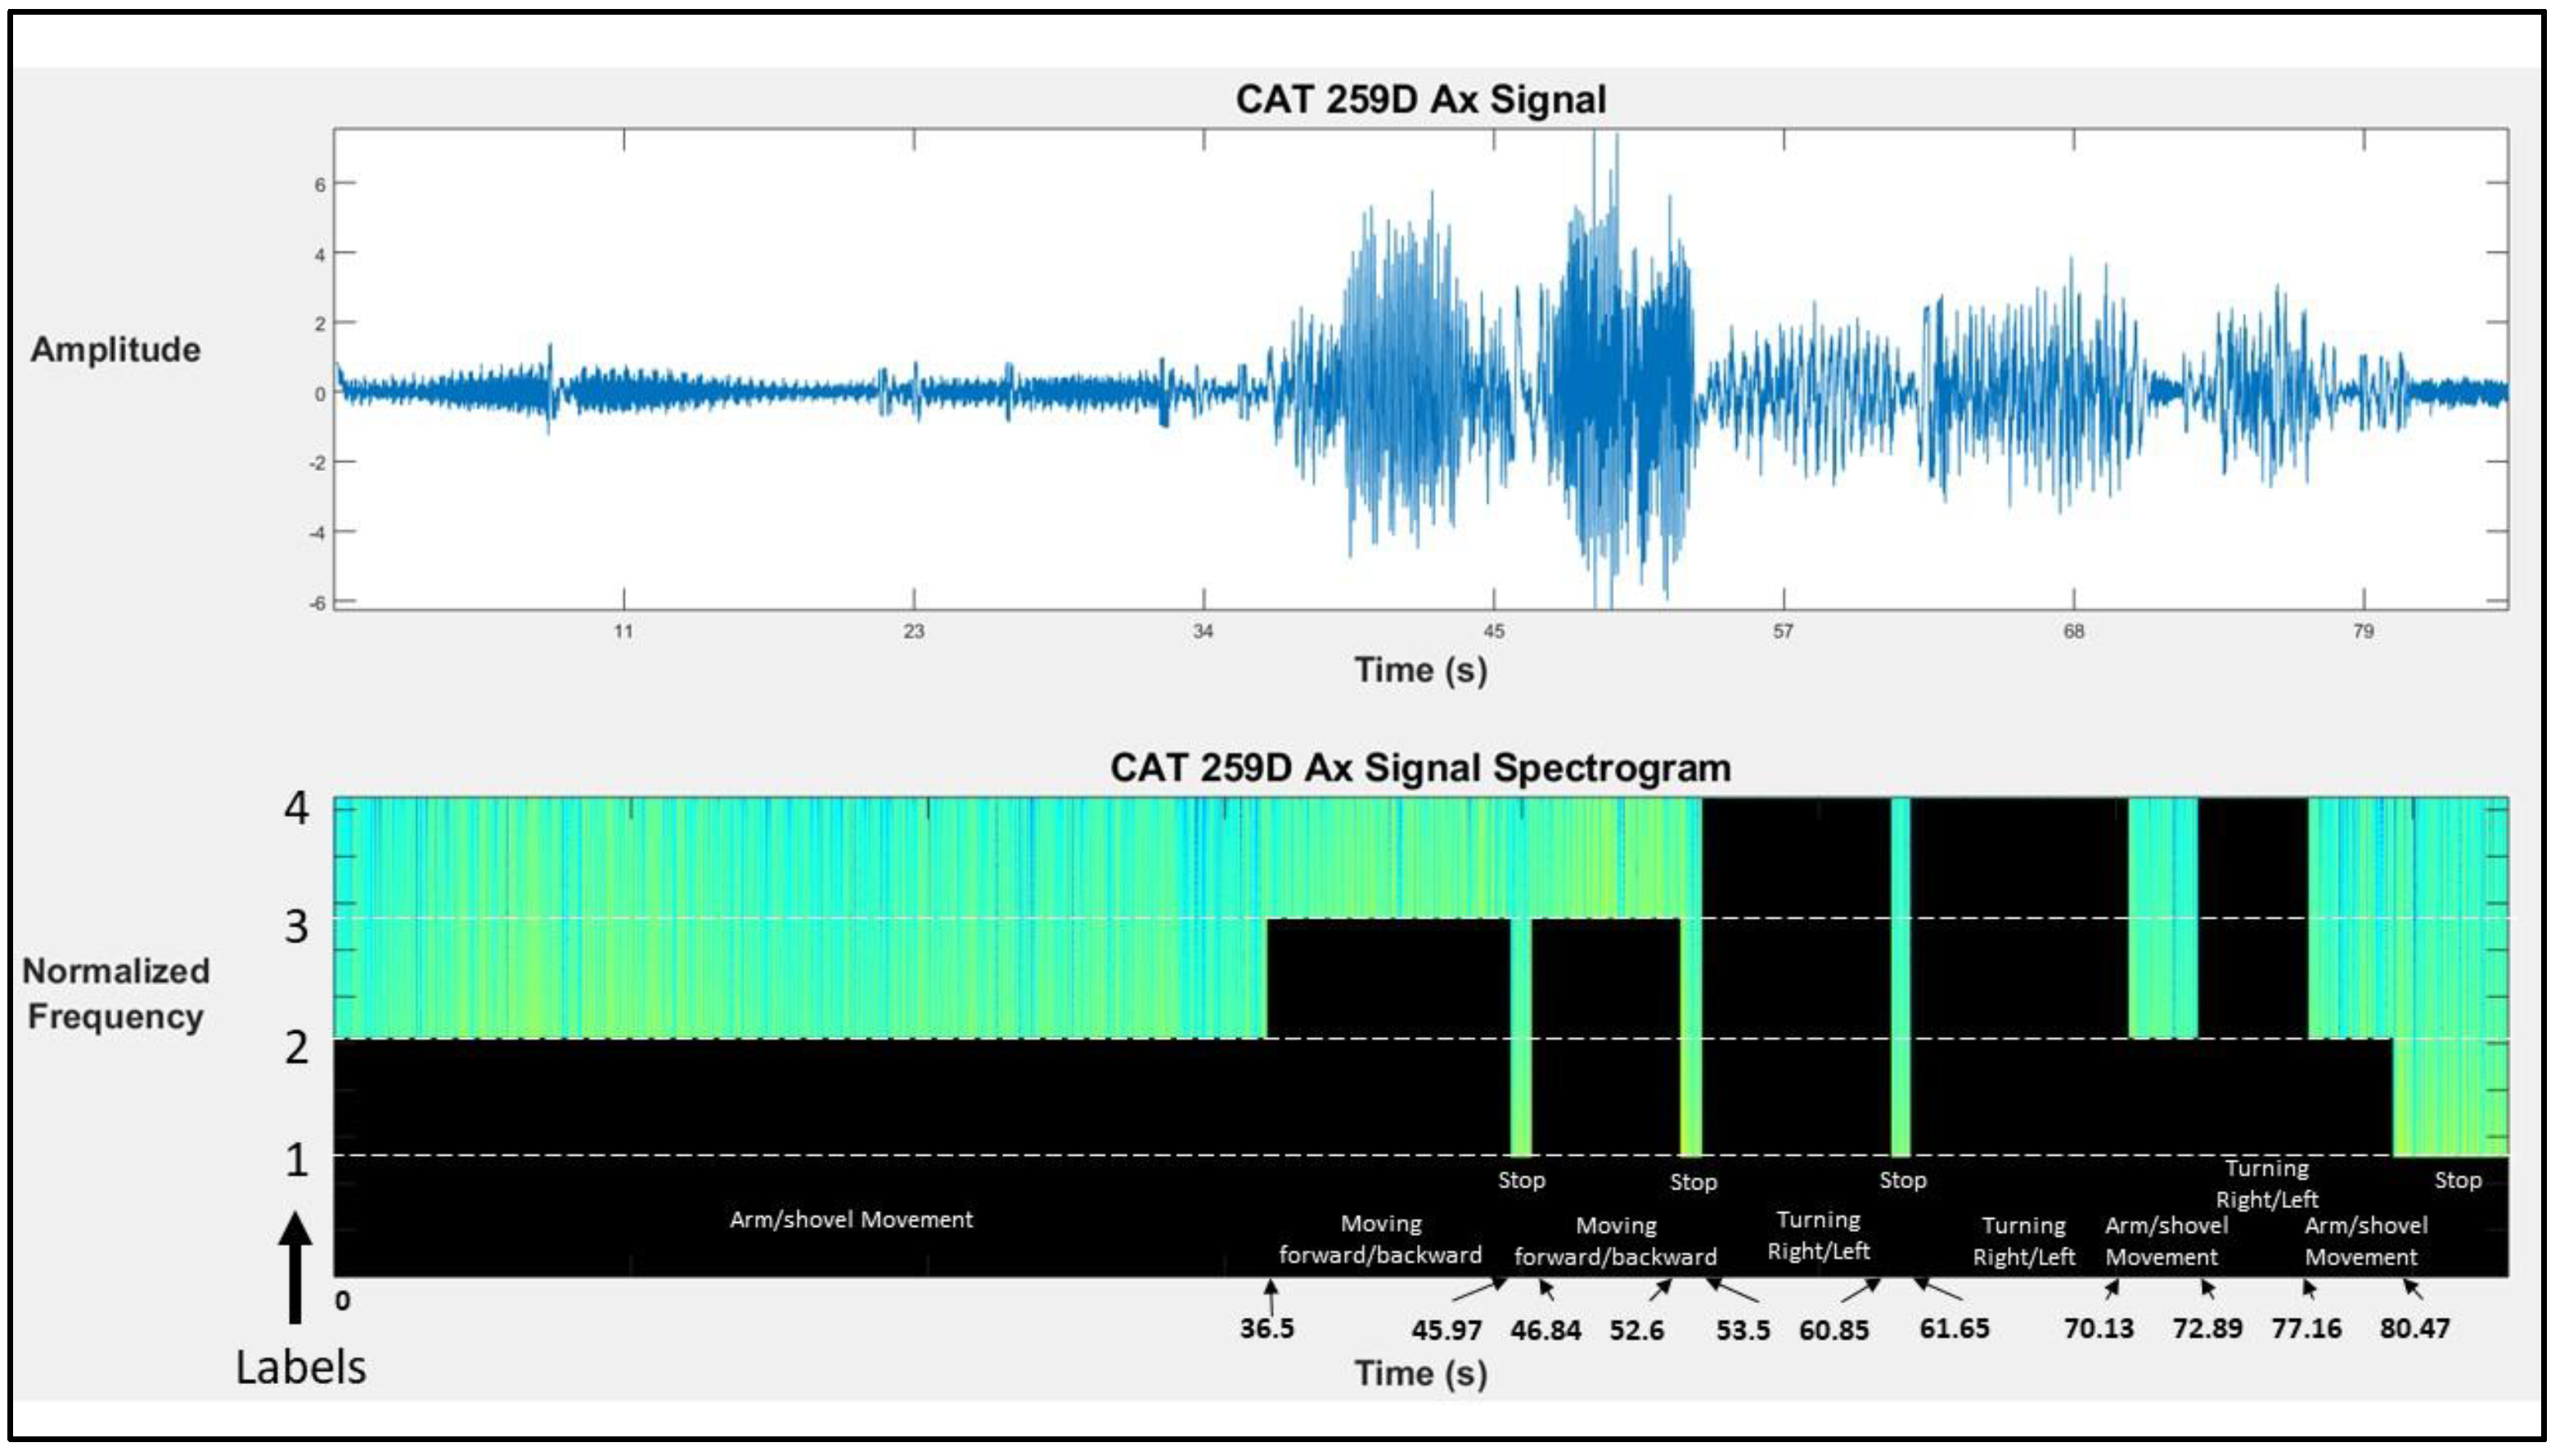
| Activity | Start (s) | End (s) | Duration (s) | Activity Label |
|---|---|---|---|---|
| Arm Raising | 0 | 13.4 | 13.4 | 2 |
| Arm Lowering | 13.4 | 24.4 | 11 | 2 |
| Shovel Lowering | 24.4 | 30.4 | 6 | 2 |
| Shovel Raising | 30.4 | 35.4 | 5 | 2 |
| Arm Lowering | 35.4 | 36.5 | 1.1 | 2 |
| Moving Forward | 36.5 | 45.97 | 9.47 | 3 |
| Minor Stop | 45.97 | 46.84 | 0.87 | 1 |
| Moving Backward | 46.84 | 52.6 | 5.76 | 3 |
| Minor Stop | 52.6 | 53.5 | 0.9 | 1 |
| Turning Right | 53.5 | 60.85 | 7.35 | 4 |
| Minor Stop | 60.85 | 61.65 | 0.8 | 1 |
| Turning Left | 61.65 | 70.13 | 8.48 | 4 |
| Arm Raising | 70.13 | 72.89 | 2.76 | 2 |
| Turning Right | 72.89 | 77.16 | 4.27 | 4 |
| Arm Lowering | 77.16 | 78.84 | 1.68 | 2 |
| Shovel Lowering | 78.84 | 80.47 | 1.63 | 2 |
| Stop | 80.47 | 87 | 6.53 | 1 |
| End | 87 |
| Actual Label | Accuracy % | ||||||
|---|---|---|---|---|---|---|---|
| Stop | Arm/shovel Movement | Moving Forward/Backward | Turning Right/Left | ||||
| Predicted Label | Vibration | Stop | 41 | 58 | 21 | 2 | 87.08 |
| Arm/shovel movement | 19 | 692 | 6 | 16 | |||
| Moving forward/backward | 19 | 15 | 227 | 1 | |||
| Turning right/left | 9 | 22 | 1 | 314 | |||
| Audio | Stop | 11 | 94 | 10 | 7 | 74.71 | |
| Arm/shovel movement | 3 | 690 | 19 | 21 | |||
| Moving forward/backward | 5 | 34 | 164 | 59 | |||
| Turning right/left | 1 | 73 | 44 | 228 | |||
| Fused Data | Stop | 66 | 41 | 10 | 5 | 92.00 | |
| Arm/shovel movement | 17 | 697 | 1 | 18 | |||
| Moving forward/backward | 6 | 4 | 252 | 0 | |||
| Turning right/left | 2 | 11 | 2 | 331 | |||
| Vibration Accuracy | Audio Accuracy | Fused Data Accuracy | |||||||
|---|---|---|---|---|---|---|---|---|---|
| Low | Moderate | High | Low | Moderate | High | Low | Moderate | High | |
| Jackhammer 305.5E2 | ✔ | ✔ | ✔ | ||||||
| CAT 259D | ✔ | ✔ | ✔ | ||||||
| Skyjack SJ6826 | ✔ | ✔ | ✔ | ||||||
| XTREME 842Lift | ✔ | ✔ | ✔ | ||||||
| CAT 308E | ✔ | ✔ | ✔ | ||||||
| CAT 305.5E2 | ✔ | ✔ | ✔ | ||||||
| Dozer 850K | ✔ | ✔ | ✔ | ||||||
| CAT 938M | ✔ | ✔ | ✔ | ||||||
| CAT 210G Vibrator | ✔ | ✔ | ✔ | ||||||
| Concrete Truck | ✔ | ✔ | ✔ | ||||||
| Testing Time (s) | ||||||||
|---|---|---|---|---|---|---|---|---|
| Predicting Time | Total Time | |||||||
| (1) Equipment | (2) Number of Activities | (3) Capturing and Pre-processing Data | (4) Vibration Data | (5) Audio Data | (6) Fused Data | (3) + (4) Vibration Data | (3) + (5) Audio Data | (3) + (6) Fused Data |
| Concrete Truck | 2 | 0.918 | 0.043 | 0.008 | 0.046 | 0.961 | 0.926 | 0.964 |
| XTREME 842Lift | 3 | 0.963 | 0.030 | 0.020 | 0.015 | 0.993 | 0.983 | 0.978 |
| CAT 259D | 4 | 0.664 | 0.191 | 0.035 | 0.083 | 0.855 | 0.699 | 0.747 |
© 2019 by the authors. Licensee MDPI, Basel, Switzerland. This article is an open access article distributed under the terms and conditions of the Creative Commons Attribution (CC BY) license (http://creativecommons.org/licenses/by/4.0/).
Share and Cite
Sherafat, B.; Rashidi, A.; Lee, Y.-C.; Ahn, C.R. A Hybrid Kinematic-Acoustic System for Automated Activity Detection of Construction Equipment. Sensors 2019, 19, 4286. https://doi.org/10.3390/s19194286
Sherafat B, Rashidi A, Lee Y-C, Ahn CR. A Hybrid Kinematic-Acoustic System for Automated Activity Detection of Construction Equipment. Sensors. 2019; 19(19):4286. https://doi.org/10.3390/s19194286
Chicago/Turabian StyleSherafat, Behnam, Abbas Rashidi, Yong-Cheol Lee, and Changbum R. Ahn. 2019. "A Hybrid Kinematic-Acoustic System for Automated Activity Detection of Construction Equipment" Sensors 19, no. 19: 4286. https://doi.org/10.3390/s19194286