
Genomic Diversity Analyses of Some Indigenous Montenegrin Sheep Populations
by
 ,
,
Milena Djokic
1,*,
Ivana Drzaic
2,
Mario Shihabi
2,
Bozidarka Markovic
1 and
Vlatka Cubric-Curik
2 1
Department of Animal Science, Biotechnical Faculty, University of Montenegro, 81100 Podgorica, Montenegro
2
Department of Animal Science, Faculty of Agriculture, University of Zagreb, 10000 Zagreb, Croatia
*
Author to whom correspondence should be addressed.
Diversity 2023, 15(5), 640; https://doi.org/10.3390/d15050640
Submission received: 31 March 2023
/
Revised: 29 April 2023
/
Accepted: 5 May 2023
/
Published: 9 May 2023
(This article belongs to the Topic Challenges of Animal Science Diversity in Times of Climate and Technological Change)
Abstract
:Montenegro has a great diversity of indigenous and locally developed sheep breeds, adapted to different regions and climates. However, the current trend of the steady decline in sheep populations means that some of them are threatened with extinction. The aim of this study was the investigation of the genetic diversity and population structure of five Montenegrin sheep populations, using the OvineSNP50K BeadChip. Data from the studied sheep were supplemented with publicly available genotypes of worldwide breeds to determine admixture contributions and genetic relationships. Higher genetic diversity and low inbreeding were observed in Pivska Pramenka and Sjenicka sheep, with Ho = 0.411, He = 0.423, and FROH>2Mb = 0.056 and Ho = 0.421, He = 0.421, and FROH>2Mb = 0.041, respectively. Zetska Zuja had much lower FIS (0.001) and high FROH inbreeding (0.090), indicating a small population size and genetic drift. An analysis of the genetic population structure showed that Montenegrin sheep populations are genetically distinct populations. This analysis revealed the presence of admixture in most sheep populations (high heterogeneity), while genetic purity was observed in Zetska Zuja. The obtained results will help in the conservation management of endangered Montenegrin sheep populations.
1. Introduction
Sheep breeding is an important component of livestock production, especially in countries and regions with large grazing areas and special geographic and climatic conditions. Today’s worldwide sheep populations have great breed diversity, due to adaptation to different environments and different breeding objectives [1].
Montenegro is a relatively small country, located in the southeast of Europe. The state is characterized by a diversity of geomorphological forms and expressions. The agricultural land structure consists of 94.3% permanent grassland (meadows and pastures) [2,3], so sheep farming has a long tradition in Montenegro as an important sector of livestock production [4]. Sheep production is mainly semi-extensive, and its importance is particularly pronounced in the northern region of the country [4,5]. The richness of genetic resources in sheep is by far the largest in the entire livestock sector of Montenegro [5]. Several indigenous breeds, Pivska or Jezeropisvska Pramenka, Zetska Zuja, Piperska Zuja, Ljaba, and Sora, and two local breeds, Sjenicka Sheep and Bardoka sheep, have been identified in Montenegro [5,6,7,8,9,10,11], all of which belong to the large group of Pramenka (Zackel) sheep characterized by combined production traits—milk, meat, and wool [5,9,12]. All of these breeds have specific characteristics and are very well adapted to different climatic and geographical conditions of rearing. Traditional meat and dairy products are also closely related to them. These are good reasons why the indigenous and local sheep breeds in Montenegro are considered a valuable genetic resource [1,4]. The gene pool of Montenegrin sheep breeds has changed significantly under the influence of a number of historical and natural factors. According to official data, in 1960, there were 640,000 sheep in Montenegro. Since then, the number of sheep has steadily decreased due to the intensive migration of the people from the countryside, especially in the late 1980s and 1990s [13]. Many of the Montenegrin sheep breeds have dwindled in numbers and some are threatened with extinction due to the continued decline and uncontrolled crossbreeding with other breeds [4,5]. Sporadic crosses with Merino sheep, Merinolandschaf, East Friesian sheep, the Romanov breed, and other breeds have been made with the aim of improving production characteristics [13]. In the past (50s, 60s, and 70s), actions were carried out to cross Pivska Pramenka with French Merino sheep and Merinolanschaf. The effects of these crossings were not of a great scale due to the technological solutions of that time, but they were noticeable 13]. The breed of Sjenicka sheep bred in the territory of Montenegro was improved. In the period after the Second World War, the Sjenicka sheep breed was crossed with Merino, Île-de-France, and Merinolandschaf breeds in order to improve their productive characteristics [13]. In accordance with the Global Action Plan for Animal Genetic Resources [14], an “in situ” program for the conservation of endangered domestic breeds has been established in Montenegro since 2008 [2,4]. The program for the “in situ” conservation of genetic resources of sheep also includes indigenous sheep breeds [15].
The first step in establishing an appropriate program for the conservation and sustainable use of genetic resources is the genetic characterization of populations [16]. The rapid advances in techniques in the field of molecular genetics in the last decade have led to the introduction of next generation sequencing—NGS, also known as high-throughput sequencing—which entails the use of highly informative markers and the improvement of the IT approach in this field [17,18,19,20]. The application of this technology has significantly increased the availability of genetic information on single nucleotide polymorphisms—SNPs [18,21]. Nowadays, the OvineSNP50 BeadChip (54,241 SNPs) and the high-density Ovine SNP600 BeadChip (606,006 SNPs) are predominantly used for the genetic analysis of sheep populations in different parts of the world. In the last decade, large amounts of SNP genotyping data have been obtained from worldwide sheep breeds: American sheep breeds [22,23]; Australian [24]; Chinese [25]; Ethiopian [26]; Russian [27]; Kyrgyz [28]; French [29]; Swedish [30]; Spanish [31]; Italian [32]; Welsh sheep breeds [33]; or regional studies including the Pramenka sheep group [1,34,35]. SNP BeadChips are an important tool for exploring genetic diversity and genetic relatedness, assessing population structure and admixture, detecting selection signatures, and in GWAS studies [22,23,24,26,28,36,37,38,39]. Genetic characterization based on SNP markers is important to establish genomic selection and improve breeding strategies for sheep, including conservation programs [20,23].
Therefore, the objective of this study was to genomically characterize five indigenous and local sheep populations using the OvineSNP50K BeadChip. More specifically, we determined the genetic diversity (heterozygosity, allelic richness, genomic inbreeding, and effective population size) and population structure of Montenegrin indigenous/local sheep breeds and investigated the genetic relatedness of the studied breeds with some neighboring and other breeds worldwide.
2. Materials and Methods
2.1. Animal Resources, SNP Genotyping, and Datasets
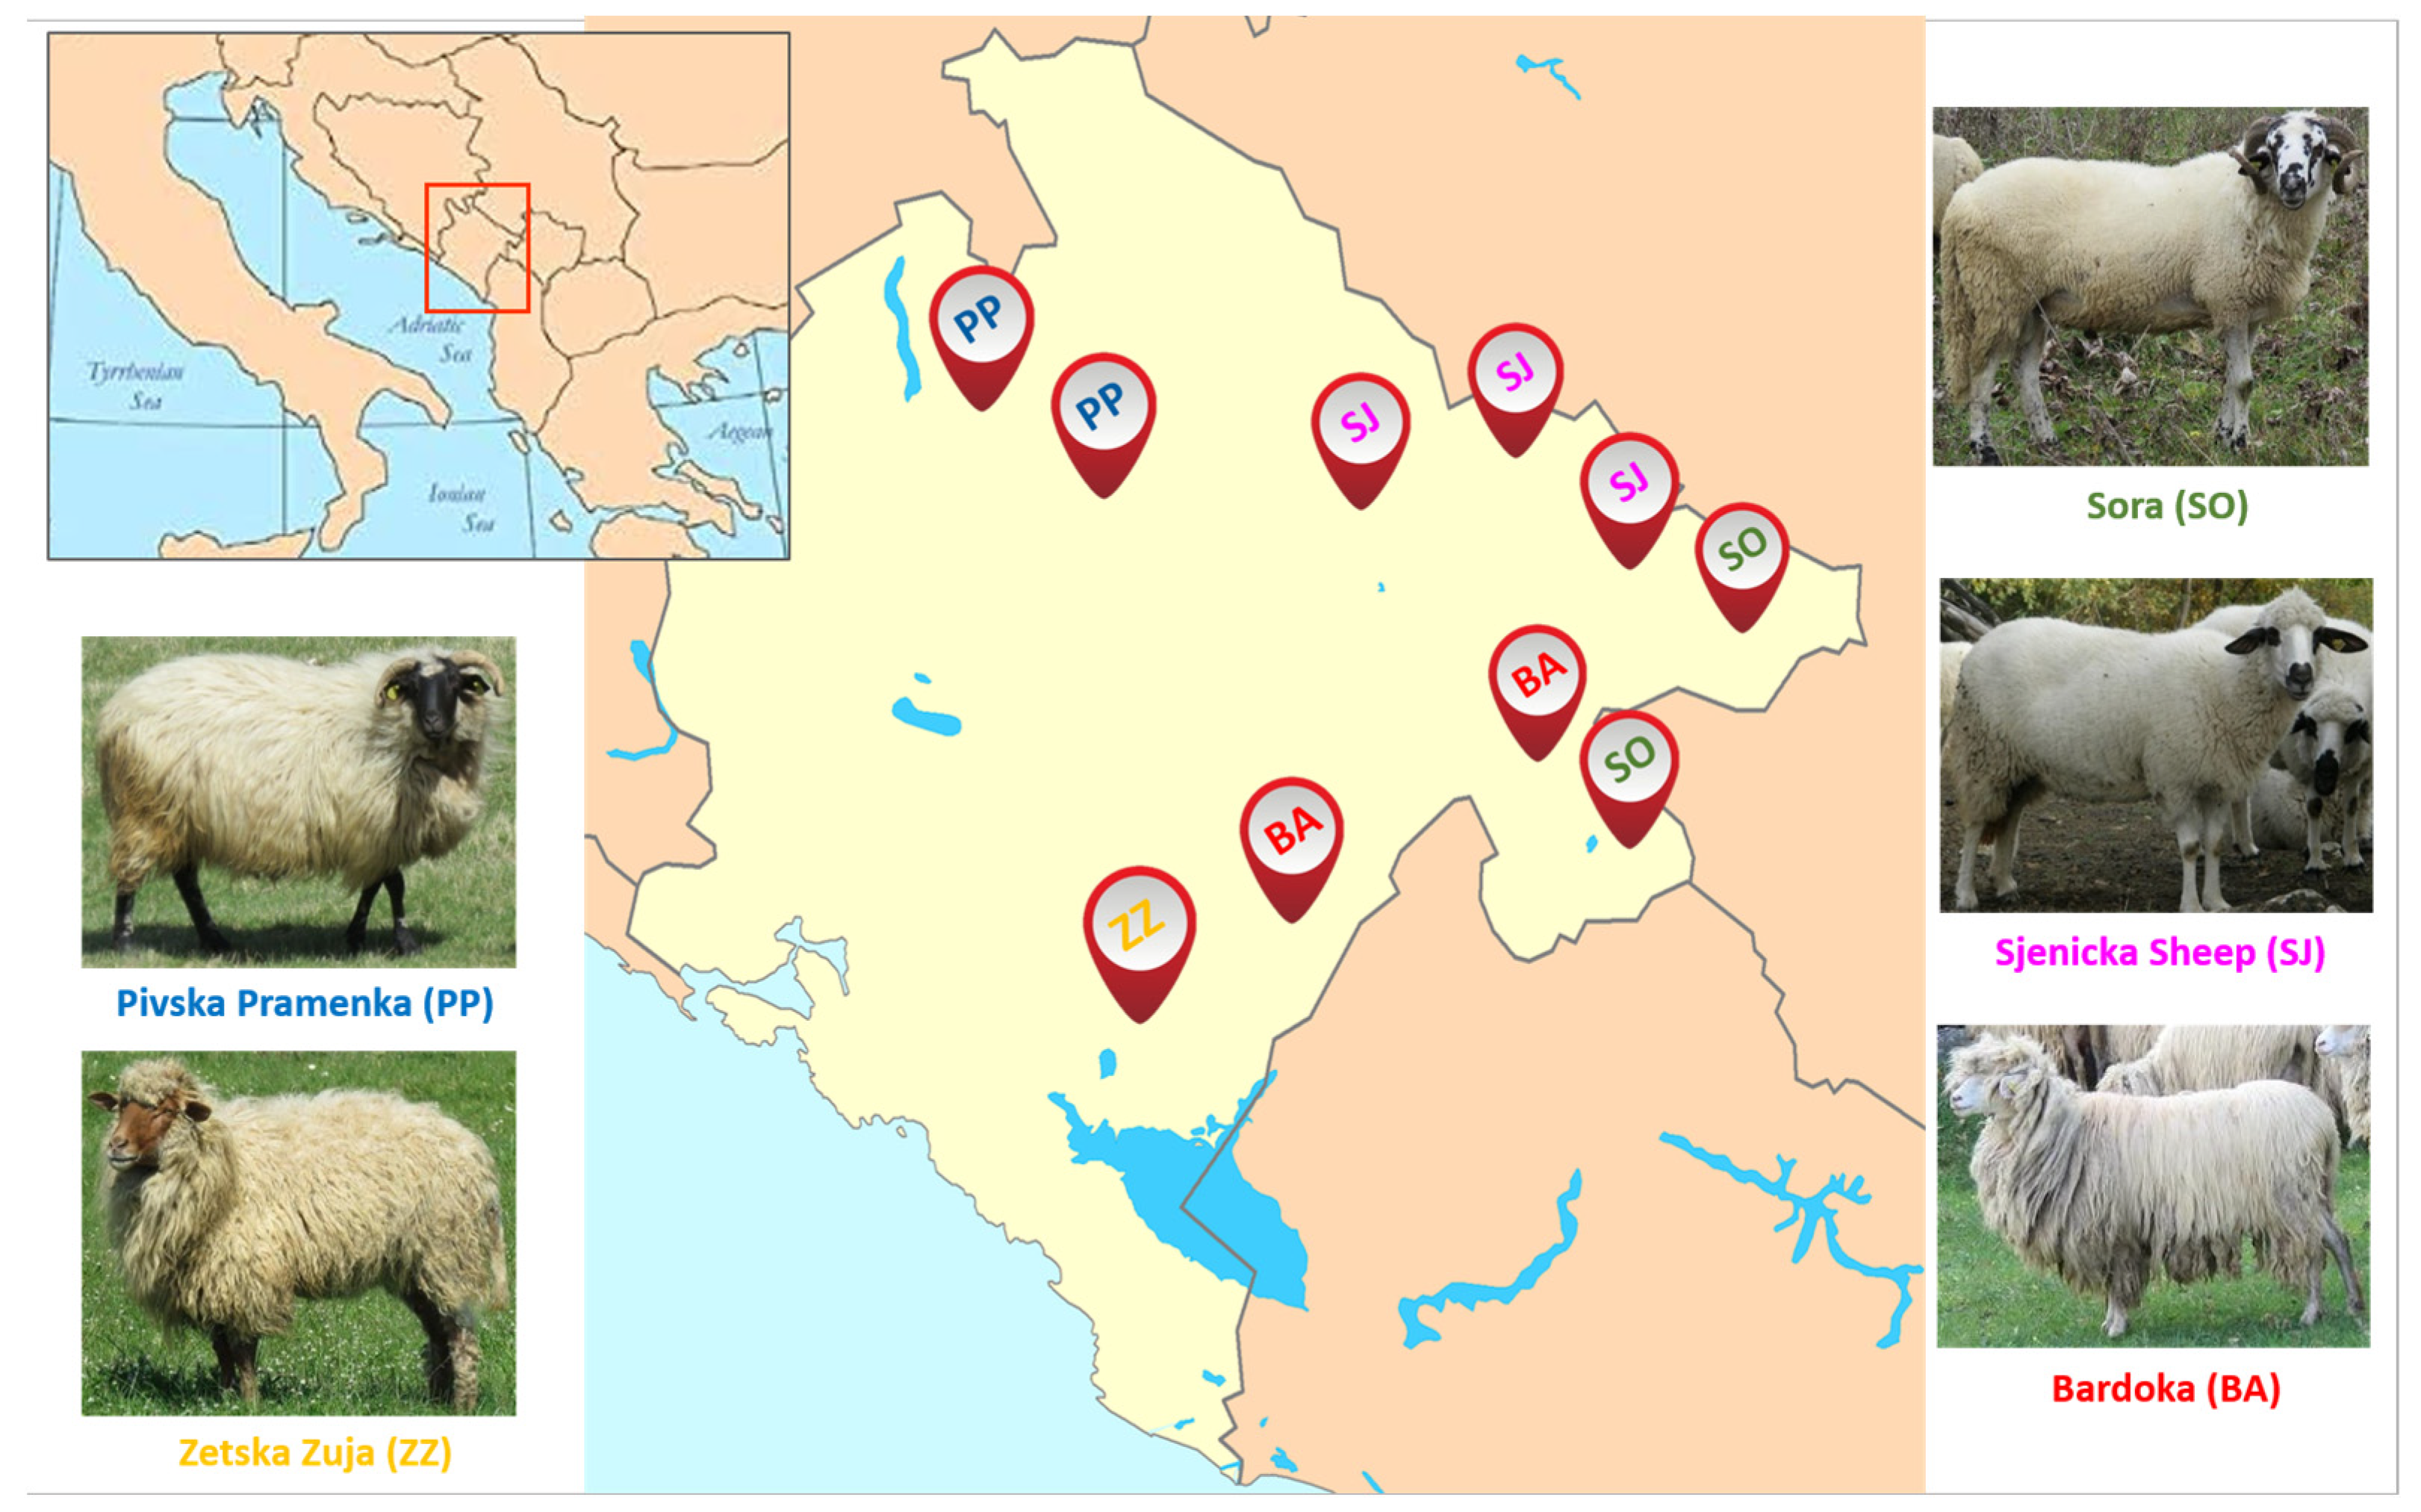
A total of 139 animals representing five indigenous and locally derived sheep breeds from Montenegro were selected for our study: Pivska Pramenka (PP; n = 30), Zetska Zuja (ZZ; n = 29), Sora (SO; n = 23), Sjenicka Sheep (SJ; n = 28), Bardoka (BA; n = 29). The study consisted of sheep flocks included in the National program of conservation and sustainable use of genetic resources in agriculture (2008–2013) with an Action Plan [15]. Sheep selection and blood sampling were based on FAO recommendations (2011) for the molecular genetic characterization of animal genetic resources [40]. These five sheep breeds are bred in different areas. Sampling locations were the breeds‘ places of origin and are presented in Figure 1. The description of the five Montenegrin sheep breeds can be found in Supplementary Materials, Table S1.
Blood was collected by taking 3 mL of blood from the jugular vein in Vacutainer blood collection tubes with EDTA anticoagulant and stored at −30 °C until use. Genomic DNA was extracted from blood using the standard DNeasy Blood & Tissue kit reagent protocol (Qiagen GmbH, Hilden, Germany). DNA quality was checked via 1% agarose gel electrophoresis and quantity was assessed using a NanoPhotometer P330 spectrophotometer (IMPLEN GmbH, Munich, Germany).
Samples from Montenegrin sheep were genotyped using two types of chips, the Illumina Ovine SNP50K BeadChip and the GGP Ovine SNP50K BeadChip from Gene Seek Neogen Genomics (Neogene Europe Ltd., Scotland, UK) consisting of 54,241 and 52,260 SNPs, respectively. Quality control of genotypes was performed using PLINK v1.9 software (Purcell et al., 2007) [41]. SNPs without a position (location) on sex chromosomes or the mitochondrial genome were excluded, leaving only autosomal SNPs. In addition, all SNPs with questionable quality (GenTrain score < 0.4, GenCall score < 0.7, and call rate < 90%) and questionable individuals (call rate < 95%) were excluded from the analysis.
To determine the genetic relationships, population structure, and admixture patterns of Montenegrin sheep breeds in the context of the global gene pool (especially Balkan countries), we supplemented our dataset with publicly available SNP genotypes. After quality control of all SNP genotypes, two datasets were created: (I) dataset—Montenegrin dataset with 139 animals representing five breeds—and (II) dataset—Montenegrin dataset (139) with 364 animals representing additional samples from three Montenegrin breeds [42], four Croatian sheep breeds [34], 14 sheep breeds from other countries of the Balkan region (two from Northern Macedonia, one Serbian breed, three Albanian breeds, two Bosnian breeds, two Slovenian breeds, one breed each from Hungary, Romania, and Greece [42]), four sheep breeds from Italy [32,42], two breeds from Germany (HapMap dataset/ www.sheephapmap.org, accessed on 15 April 2021), and one from Russia [29], and one Asian mouflon [42]. Genotypic data from all these samples were mapped to the Oar4.0 map and merged by SNP name and location in PLINK v1.90. We used different panels of datasets for the genetic analyses; therefore, the number of SNP markers included also varied. For information on breeds, sample sizes, and geographic origins, see Supplementary Materials, Table S2.
2.2. Genetic Diversity Analysis
After quality control, a different number of SNPs (47,447 when Illumina BeadChip was used and 35,469 SNPs when GGP was used) was obtained for further genetic diversity analyses, depending on the Montenegrin sheep breed studied and the SNP chip used. To estimate genetic diversity within the Montenegrin population, observed heterozygosity (Ho), expected heterozygosity (He), rarified allelic richness (Ar), and genomic individual inbreeding coefficient (FIS) were calculated using the R software package “diveRsity” [43]. The effective population size (Ne) for five sheep breeds was estimated using the software GONE from Santiago et al. 2020 [44].
ROHs were used to calculate genomic inbreeding as they represent the proportion of autozygosity in the whole genome. Runs Of Homozygous segments (ROHs) were determined using SNP & Variation Suite v8.7.0 (Golden Helix, Inc., Bozeman, MT, USA, www.goldenhelix.com, accessed on 14 May 2021), with parameters (number of heterozygotes and missing genotypes) set according to Ferenčaković et al. (2013) [45]. Only segments with a minimum length of 2 Mb, with 15 or more consecutive homozygous SNPs, a maximum distance of 1000 Kb between two SNPs, and a density of at least one SNP per 100 Kb were considered ROHs. Because long ROH segments represent recent inbreeding and short ROH segments represent old inbreeding, FROH2-8Mb and FROH>8Mb were estimated for each individual (breed), in addition to total inbreeding (FROH>2Mb). Violin plot and stacked bar plots were generated in R software using “ggplot2” package [46].
2.3. Genetic Structure Analysis
Three methods were used to analyze the population structure in both datasets separately. The analysis was based on 16,966 SNPs in 139 Montenegrin sheep (dataset I) and 13,923 SNPs in all 503 Montenegrin and other European sheep breed (dataset IIs) obtained after merging and filtering the genotypes.
Principal component analysis (PCA) was performed to determine the covariance between animals and to show the relationship between sheep populations. All calculations and visualizations required for PCA were performed in R software using the ”SNPRelate“ [47] and “ggplot2” packages [46].
Nei’s genetic distances (Nei, 1978) [48] were calculated in R software using the package “stAMPP” [49] and used to generate phylogenetic relationships, which were visualized in Neighbor-Net graphs using the software SplitsTree4 by Huson and Bryant (2006) [50].
The genetic structure of the populations was examined with Admixture 1.3 software [51] using 15,736 SNPs in the I dataset and 13,327 SNPs in the II dataset after pruning based on LD. Pruning of the genotyped data was performed in a sliding window of 50 SNPs, moving in increments of five SNPs along each chromosome and removing one SNP pair at a time with a pairwise r2 > 0.3 using the software PLINK 1.9 [51]. Admixture 1.3 results were visualized using the server Clustering Markov Packager Across K (CLUMPAK, http://clumpak.tau.ac.il/, accessed on 10 June 2022). The most likely number of clusters was determined using the ΔK method from Evanno et al. (2005) implemented in CLUMPAK [52].
3. Results
3.1. Analysis of Genetic Diversity
High-throughput genomic information (50K SNP BeadChip) was used to determine the level of genetic variability of the sheep breed. Genetic diversity parameters for five Montenegrin sheep breeds are presented in Table 1. The observed and expected heterozygosity ranged from 0.385 in Zetska Zuja (ZZ) to 0.414 in Sjenicka Sheep (SJ) and from 0.386 in Zetska Zuja (ZZ) to 0.423 in Pivska Pramenka (PP). Rarified allelic richness ranged from 2.062 to 2.145 in Pivska Pramenka and Sjenicka Sheep breeds, respectively.
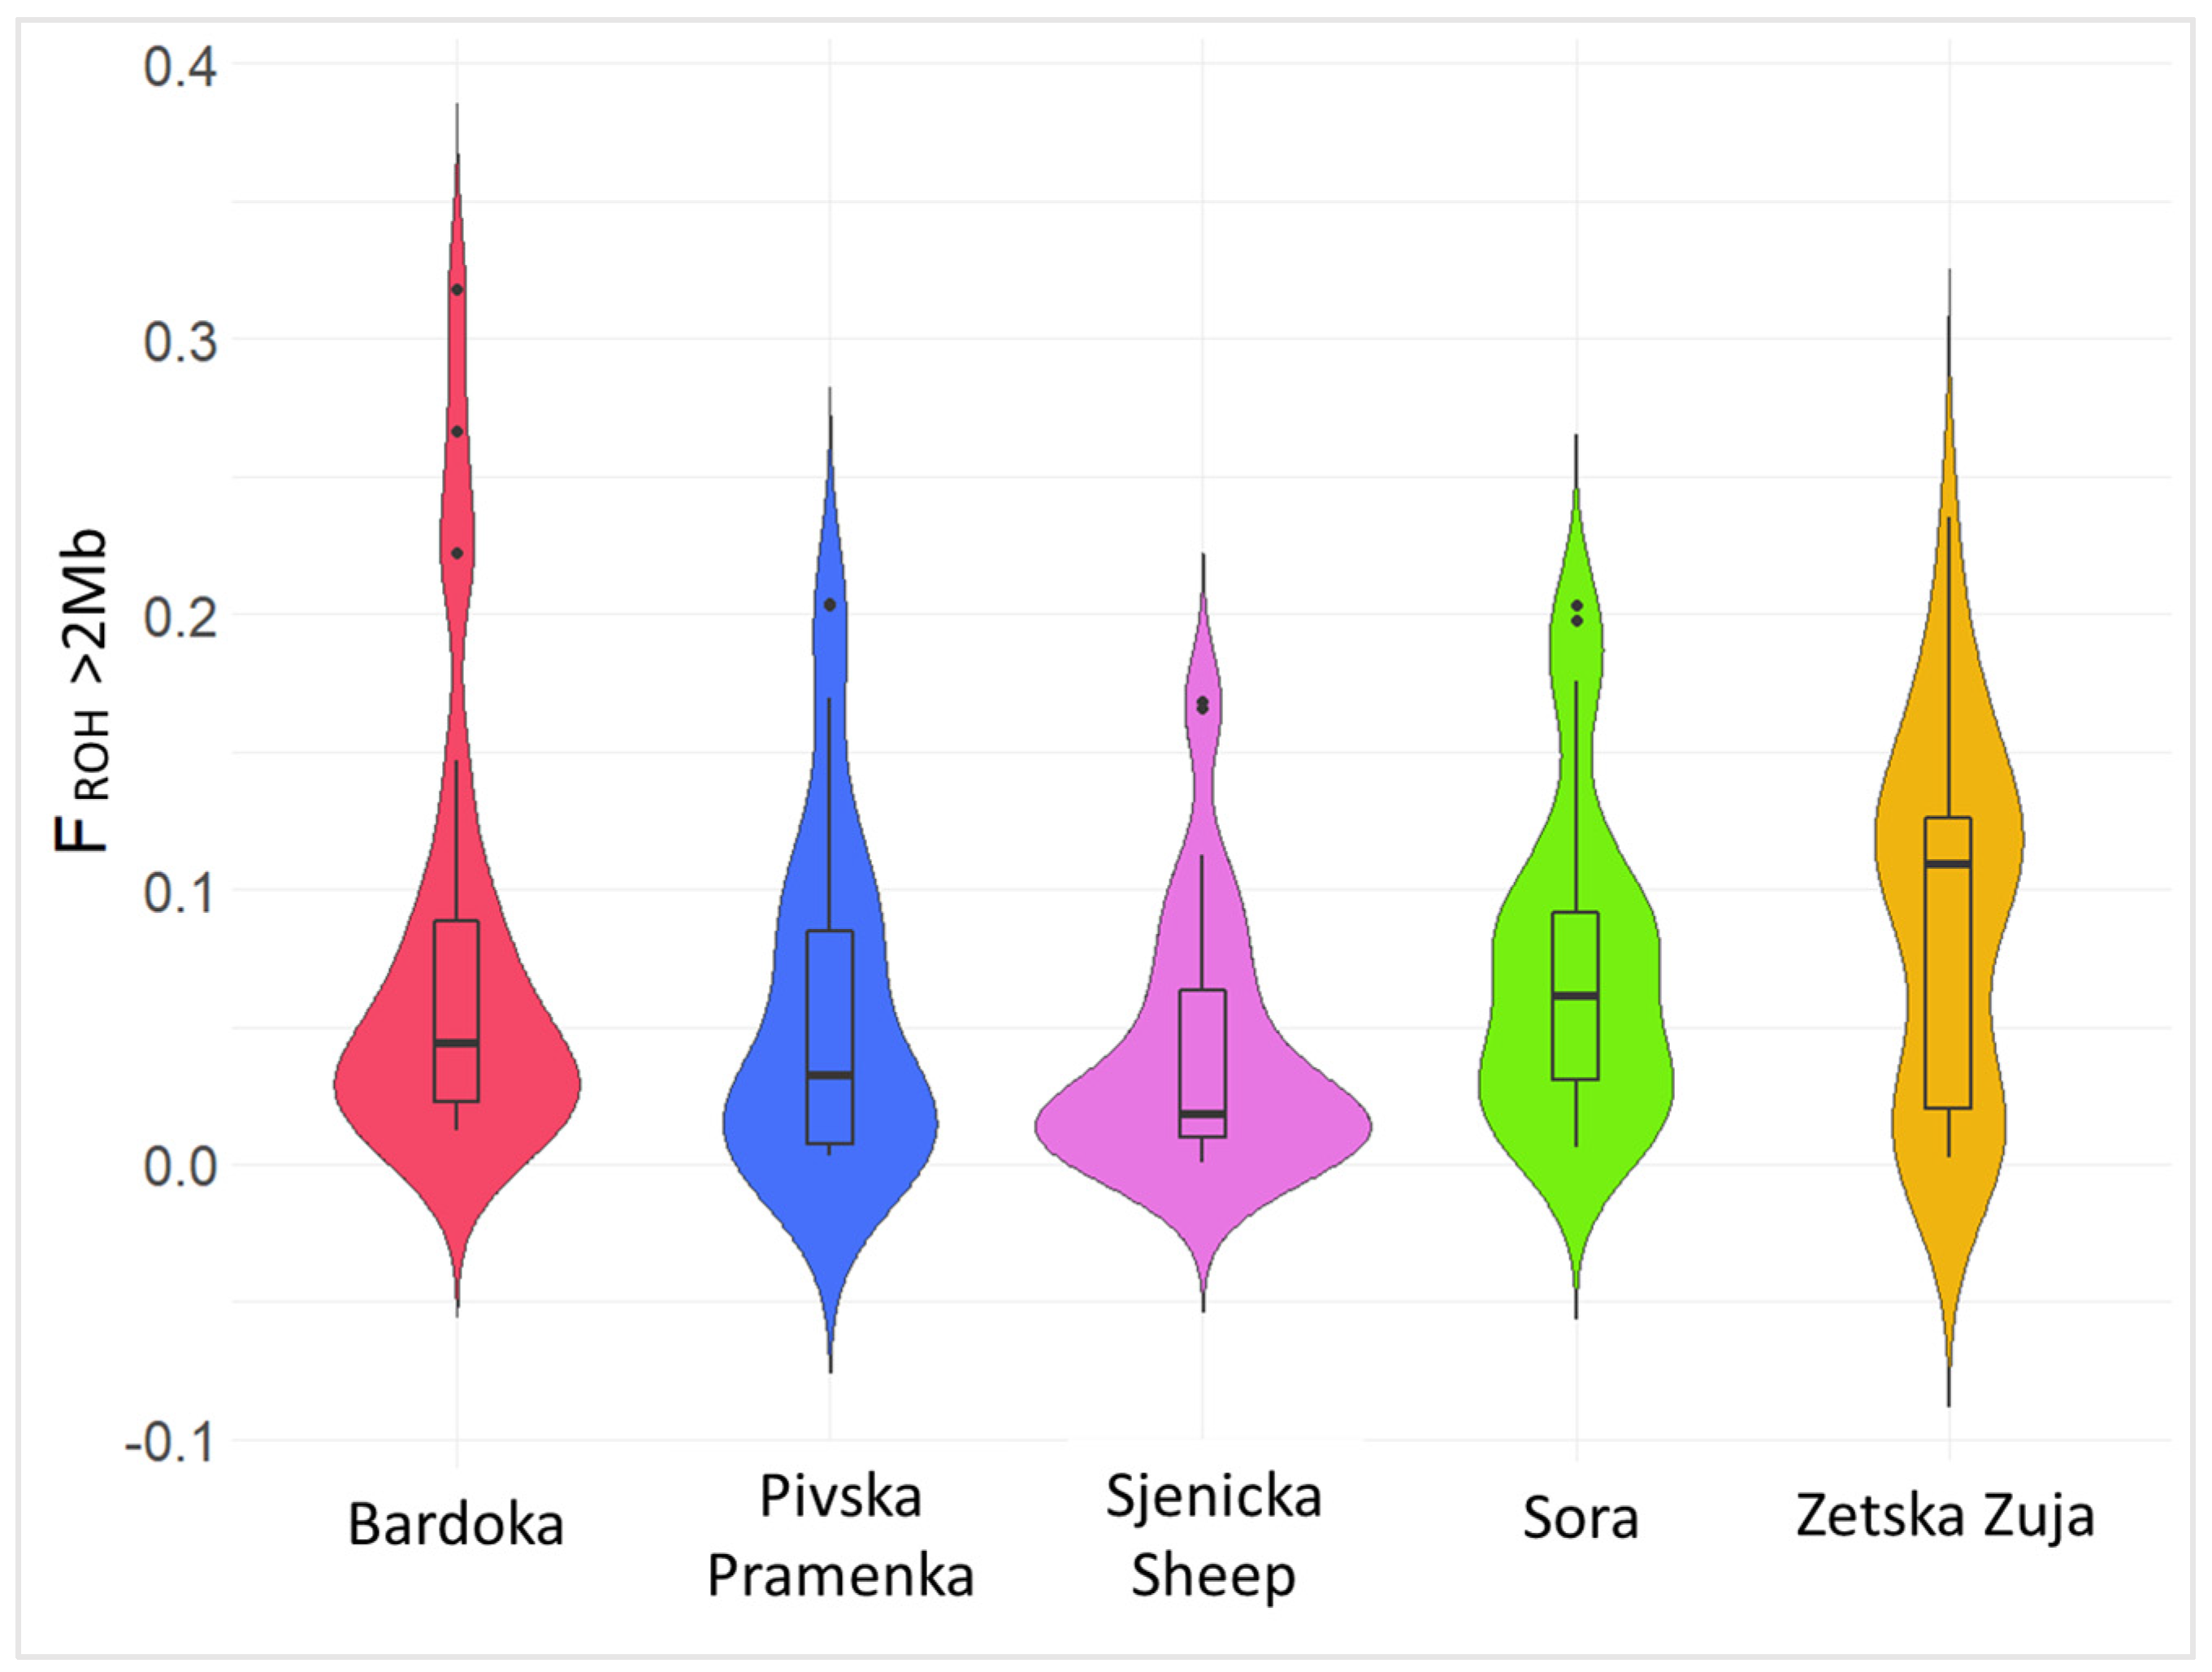
The lowest FIS value (0.001) was observed in ZZ, whereas the highest value was observed for BA (0.054). Significantly lower heterozygosity (Ho and He) and higher ROH inbreeding (FROH>2Mb) were observed in ZZ, BA, and SO breeds. Significance for genetic diversity identified high heterozygosity and low FROH>2Mb in SJ (0.041) and PP (0.056), as shown in Figure 2.
The effective population size (Ne0) ranged from 25 in SO to 81 in BA. Lower Ne0 values were also observed in ZZ (32) and SJ (47). The breed SO had a high effective population size 5 generations ago (Ne5 ≈ 5003), while PP had the lowest Ne5 (72) within the studied populations.
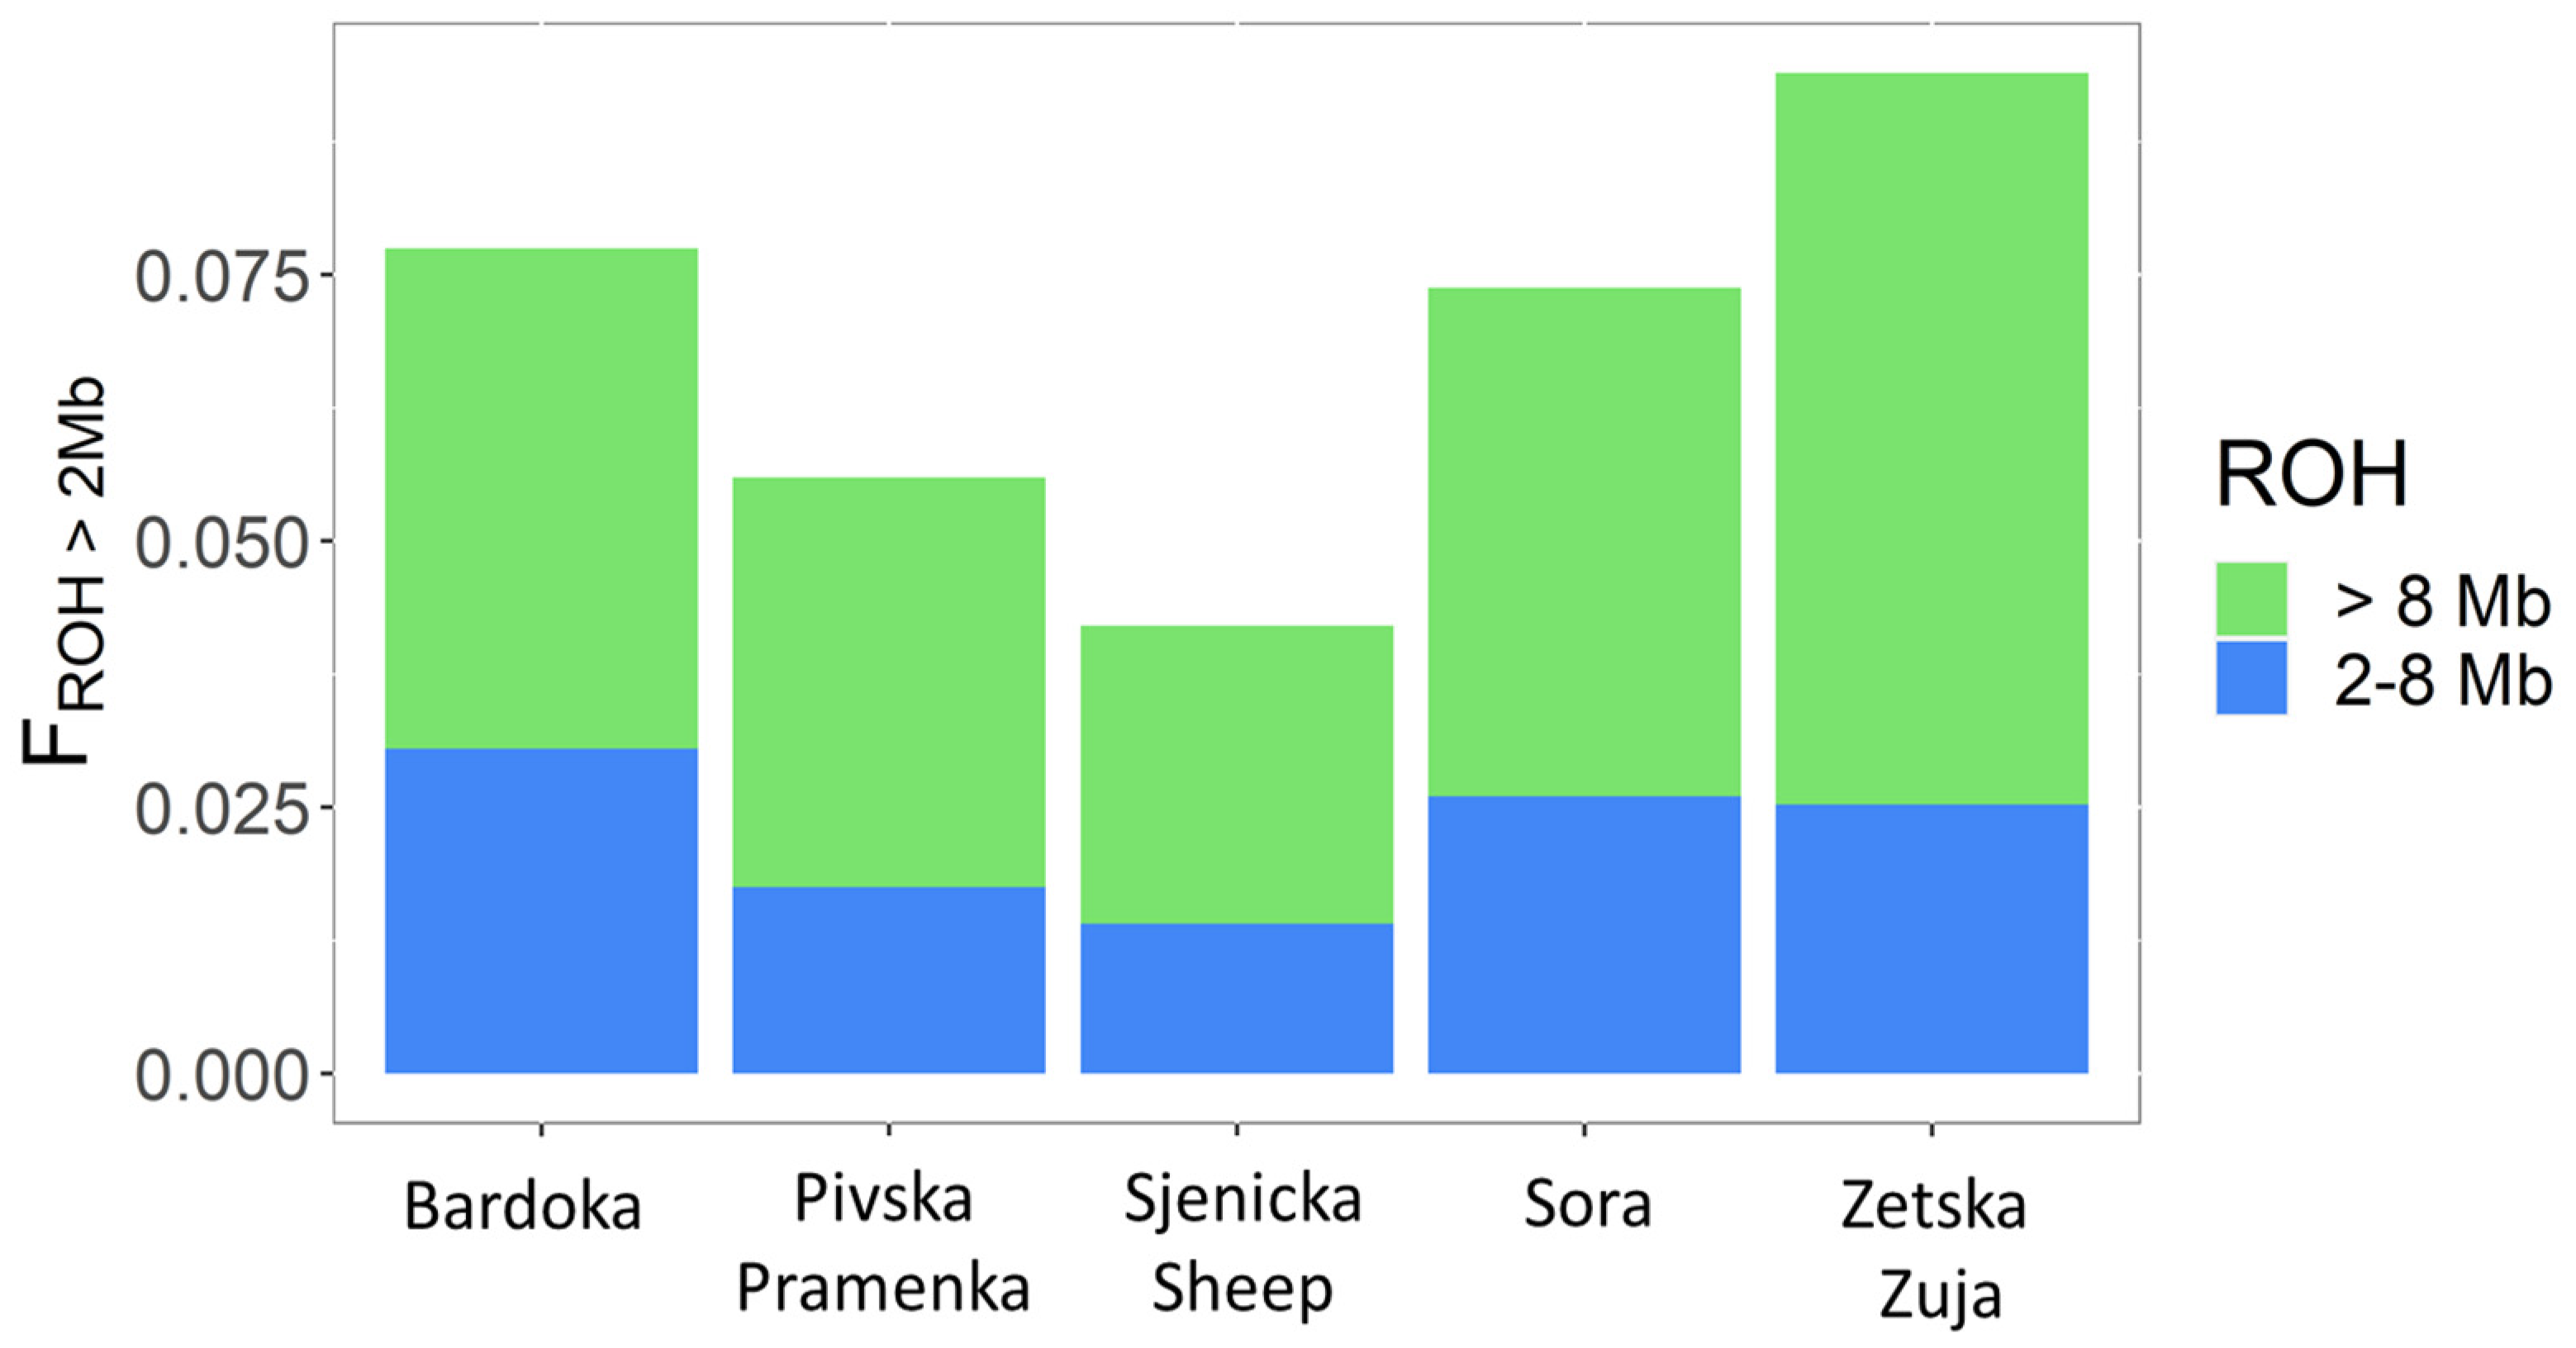
The partitioning of FROH>2Mb with respect to the origin of autozygosity (FROH2-8Mb and FROH>8Mb) is shown in Figure 3. FROH values for the different classes varied between breeds, with a higher value in long ROH segments in all breeds. The highest FROH2-8Mb values were observed in BA (FROH2-8Mb = 0.031), indicating more ancient relatedness. The lower FROH2-8Mb values of 0.014 and 0.018 were observed for SJ and PP, respectively. In contrast, for FROH>8Mb, the highest inbreeding values were observed in ZZ (FROH>8Mb = 0.068), indicating that recent inbreeding is prevalent in ZZ. The lowest inbreeding values for FROH>8Mb were observed in SJ (FROH>8Mb = 0.028).
3.2. Population Genetic Differentiation
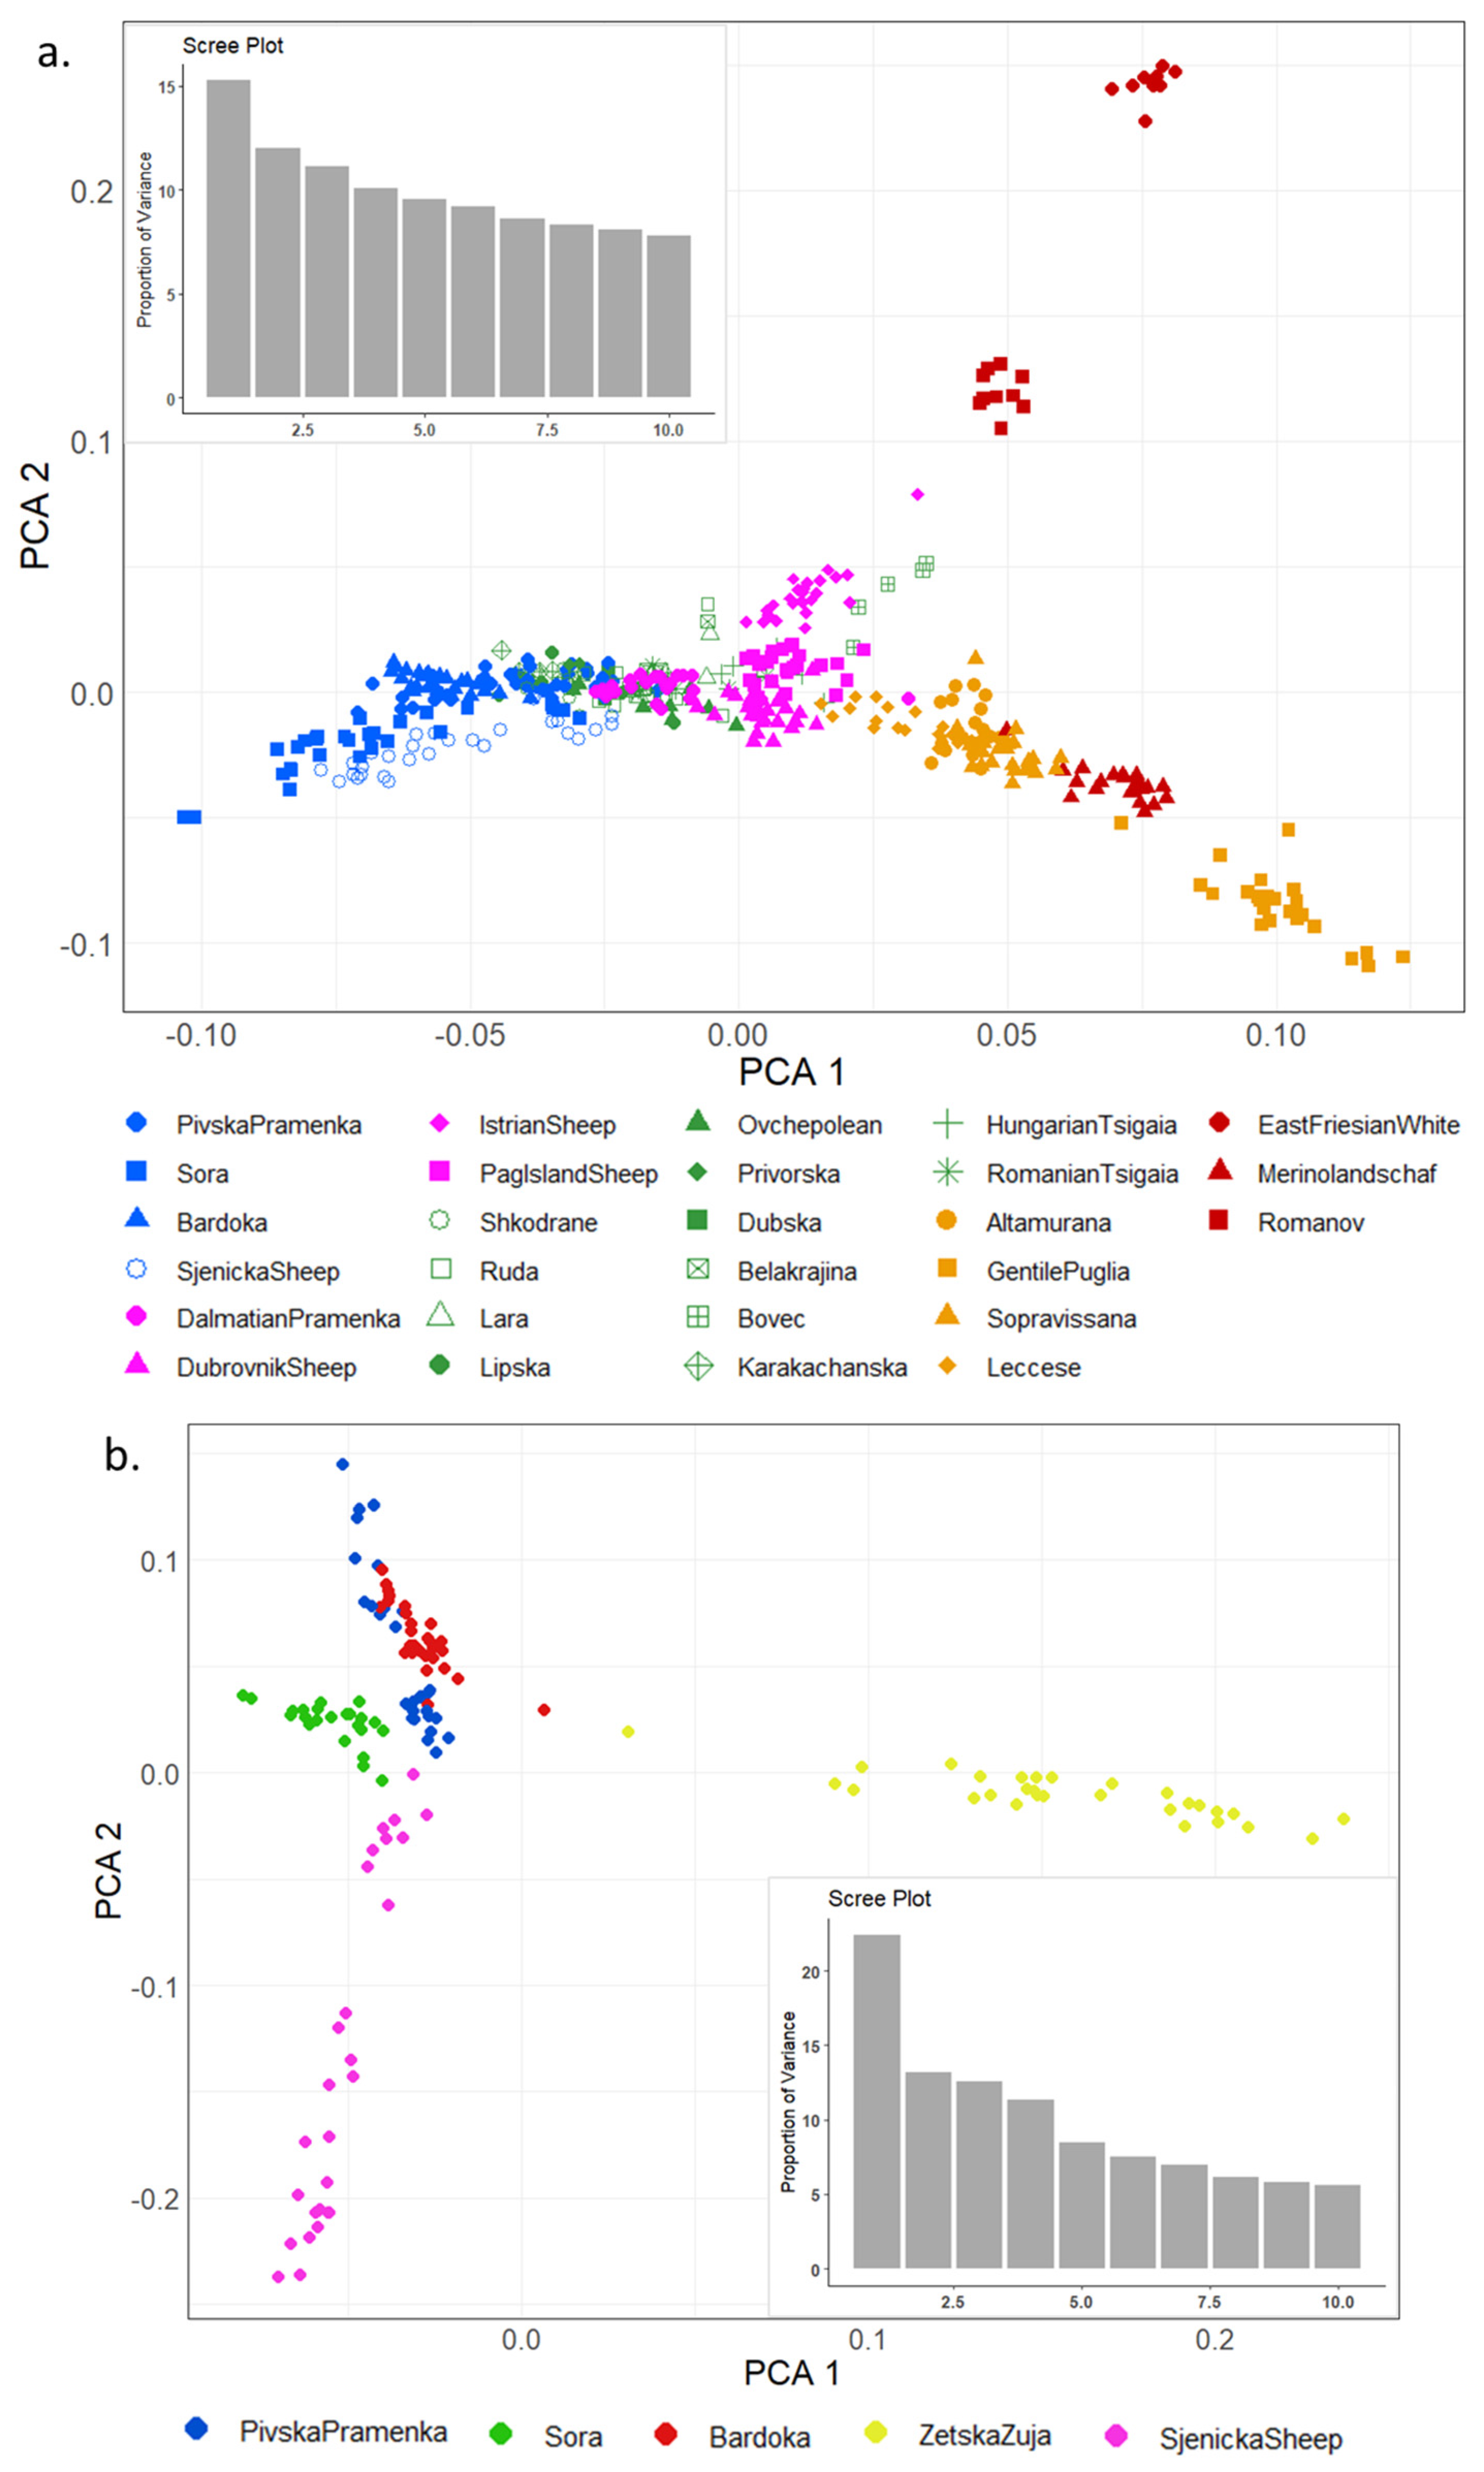
Principal component analysis (PCA) shows genetic relationships between individuals of several sheep breeds (Figure 4a) and between Montenegrin sheep breeds (Figure 4b). In Figure 4a, breeds were generally grouped according to their geographical origin. The largest principal component—PC1 (15.25% of the total variation)—showed an east–west distribution of Montenegrin sheep, Balkan Zackel sheep, other Mediterranean, and some Western European sheep breeds. The second PC2 (11.98% of the total variation) clearly separated cosmopolitan breeds (East Frisian White, Merinolandschaft, and Romanov sheep) and Italian Gentile di Puglia sheep. The Croatian island breed—Istrian sheep—and the Slovenian Bovec sheep were separated from the Balkan Zackel (Pramenka) sheep cluster. The Montenegrin sheep breeds were generally grouped with the Balkan (Pramenka) sheep breeds, but there was a decrease in Sora, Sjenicka, and Badroka individuals, indicating greater differentiation between breeds.
The PCA plot of Montenegrin sheep breeds (Figure 4b) shows clear breed separation. The first component explained 22.38% of the genetic variability between breeds and clearly distinguished ZZ from the other Montenegrin sheep breeds. The second principal component accounted for 13.16% of variability and separated the other breeds (SJ, PP, and BA). Greater genetic variability was observed in ZZ and SJ breeds as their individuals are more widely distributed. BA and PP were genetically closer breeds where some individuals clustered together. The SO breed was completely clustered separately without individual interference with other Montenegrin sheep breeds.
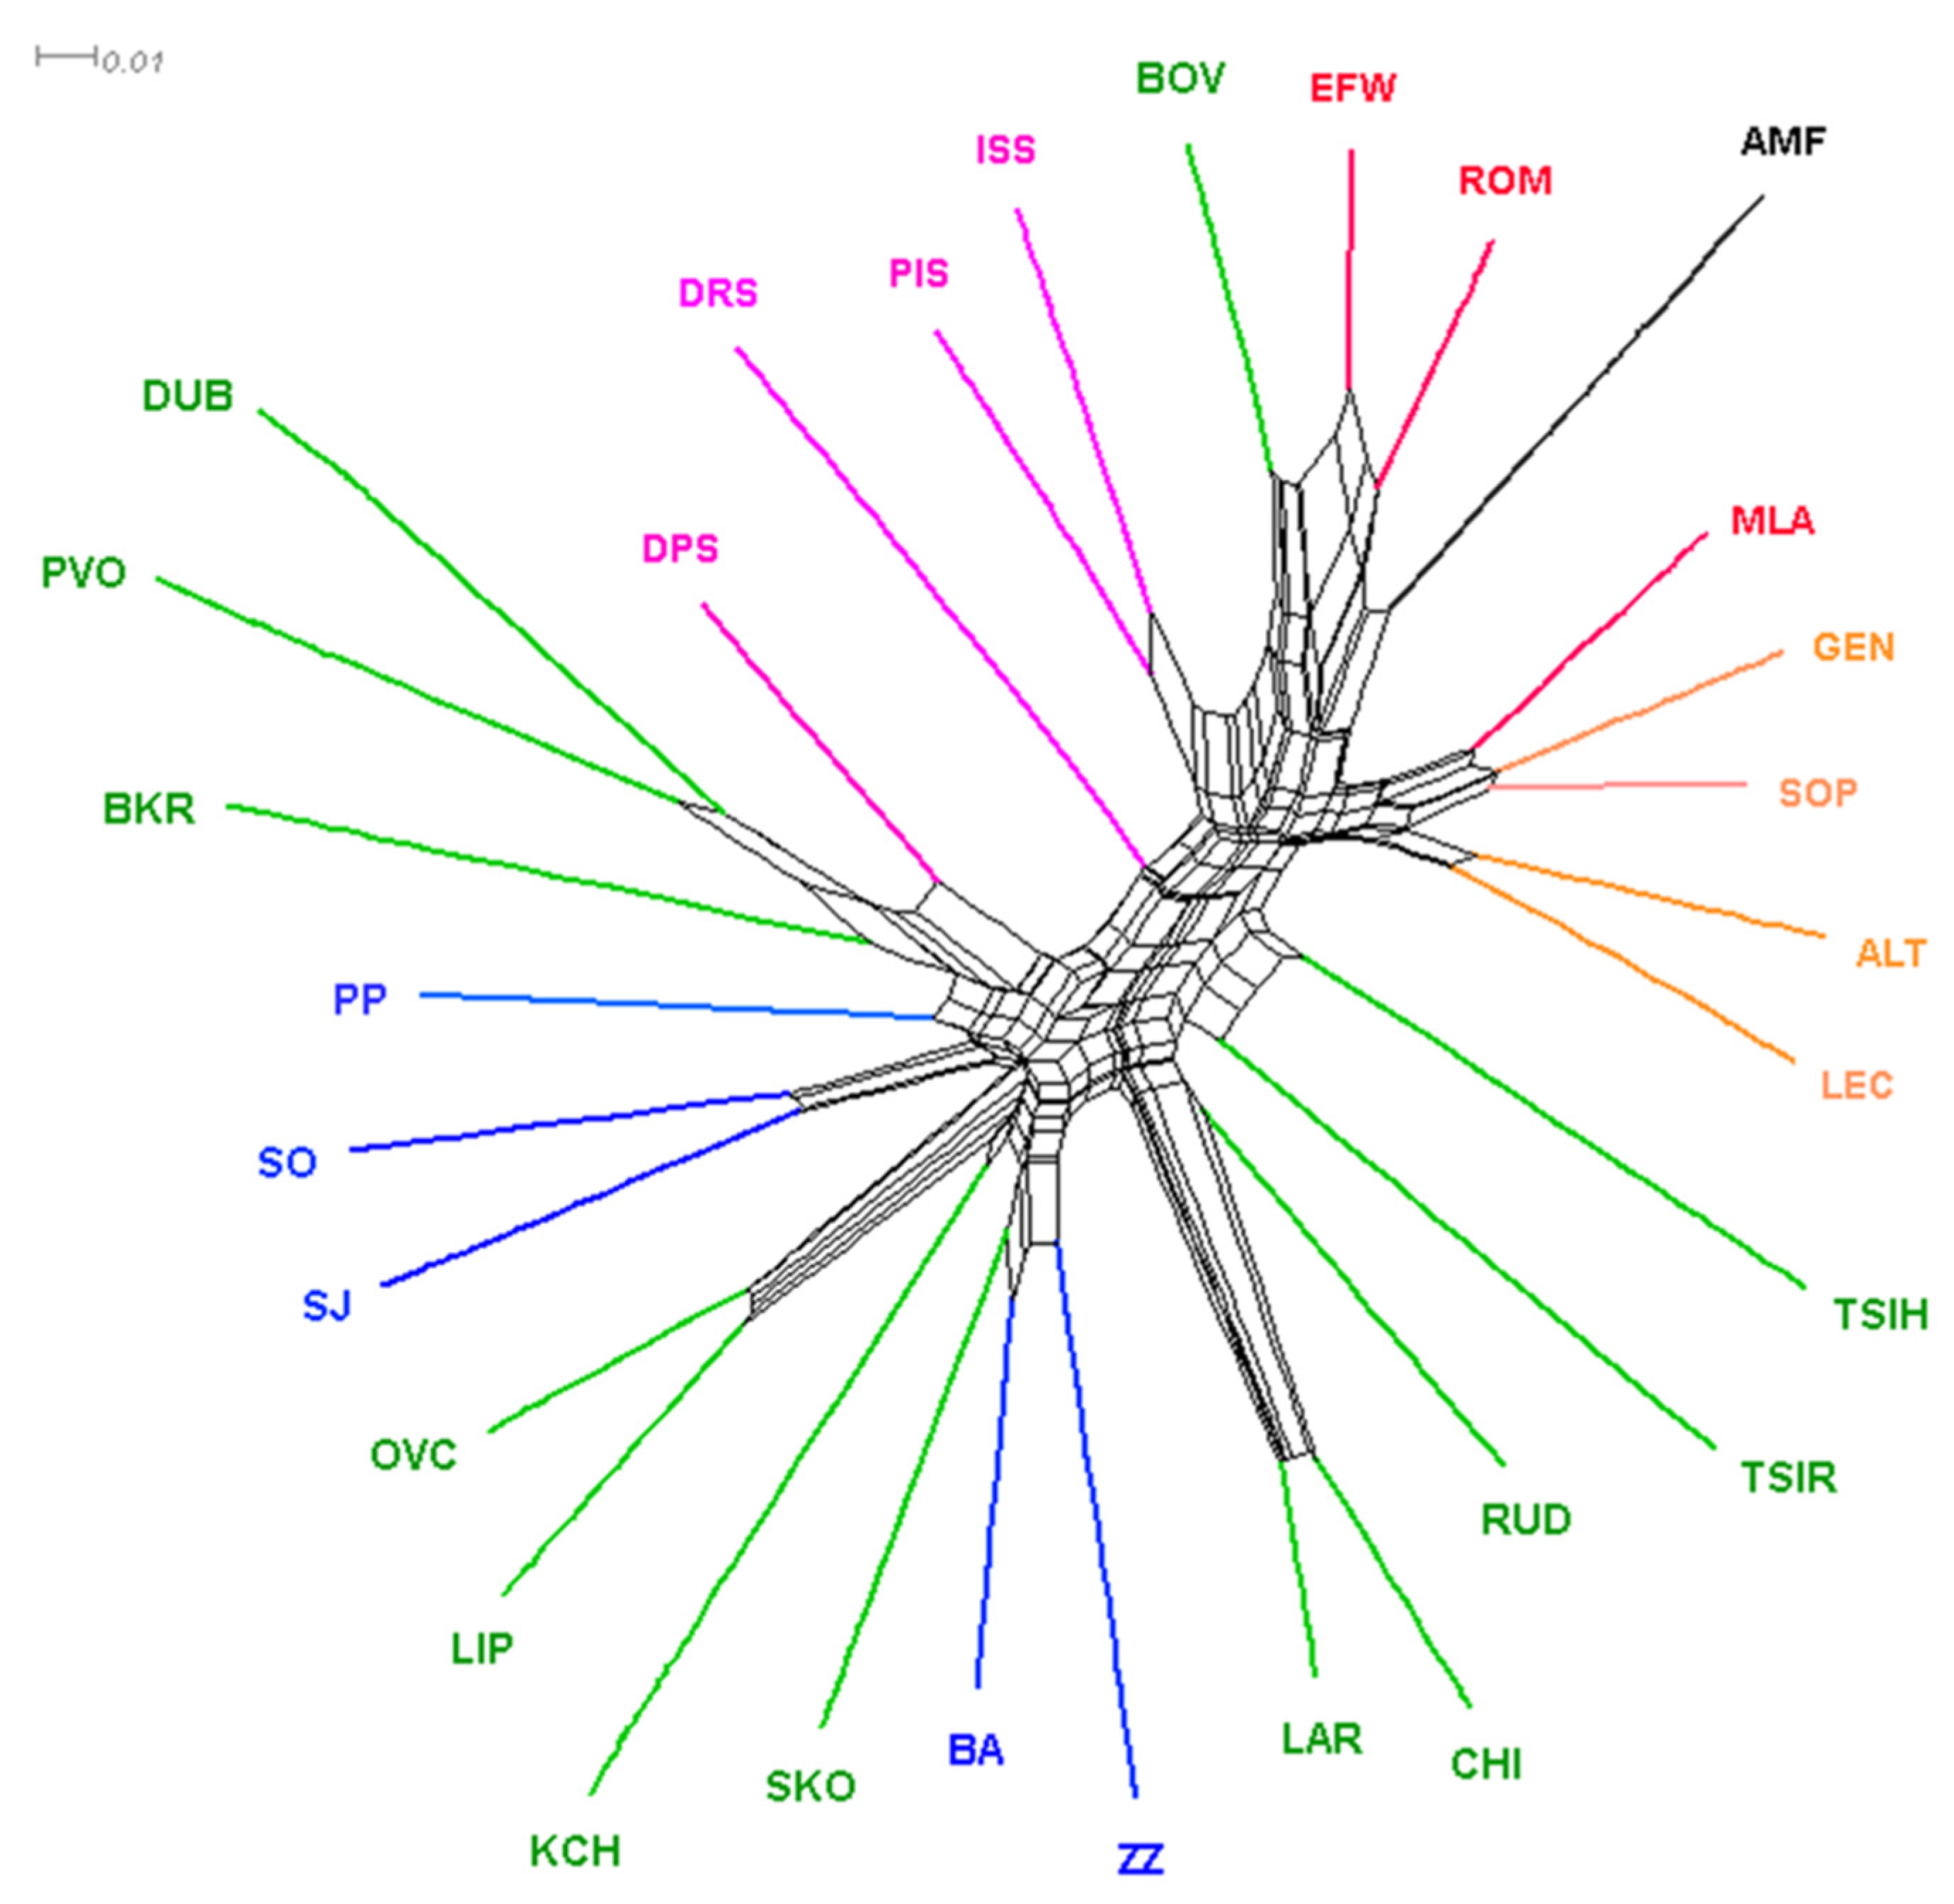
In addition, the relationship between the sheep breeds included in the study was determined using Nei genetic distances and are represented with the Neighbor network (Figure 5). Consistent with the PCA Neighbor-Net, analysis confirmed the separation of the continental Pramenka sheep group from the rest of the European sheep population. The Croatian island Pramenka type breeds were more closely intertwined with the European sheep breed. Dubrovnik Sheep, Hungarian Tshigaia, and Romanian Tsigaia were in the middle and formed a bridge between the Pramenka and the European sheep groups. All Montenegrin breeds were included in the Balkan cluster that comprised Pramenka sheep breeds. BA and ZZ were clustered together with Shkodrane on a separate reticulation. SO and SJ, confirming previous results, showed close genetic similarity as they shared a branch. PP joined the cluster of SJ and SO, far from BA and ZZ. Among the Montenegrin sheep breeds, ZZ had the longest branch, indicating a greater genetic distance from other breeds. Among the other Balkan Pramenka type sheep, greater genetic relatedness was shown between the Bosnian (Dubska and Privorska) sheep, which clustered close to Slovenian Belakrajna breed, and also between the Macedonian Ovchepolean and Serbian Lipska sheep, which clustered near the Macedonian Karakachanska breed. The global clustering pattern can be explained by the geographical origin.
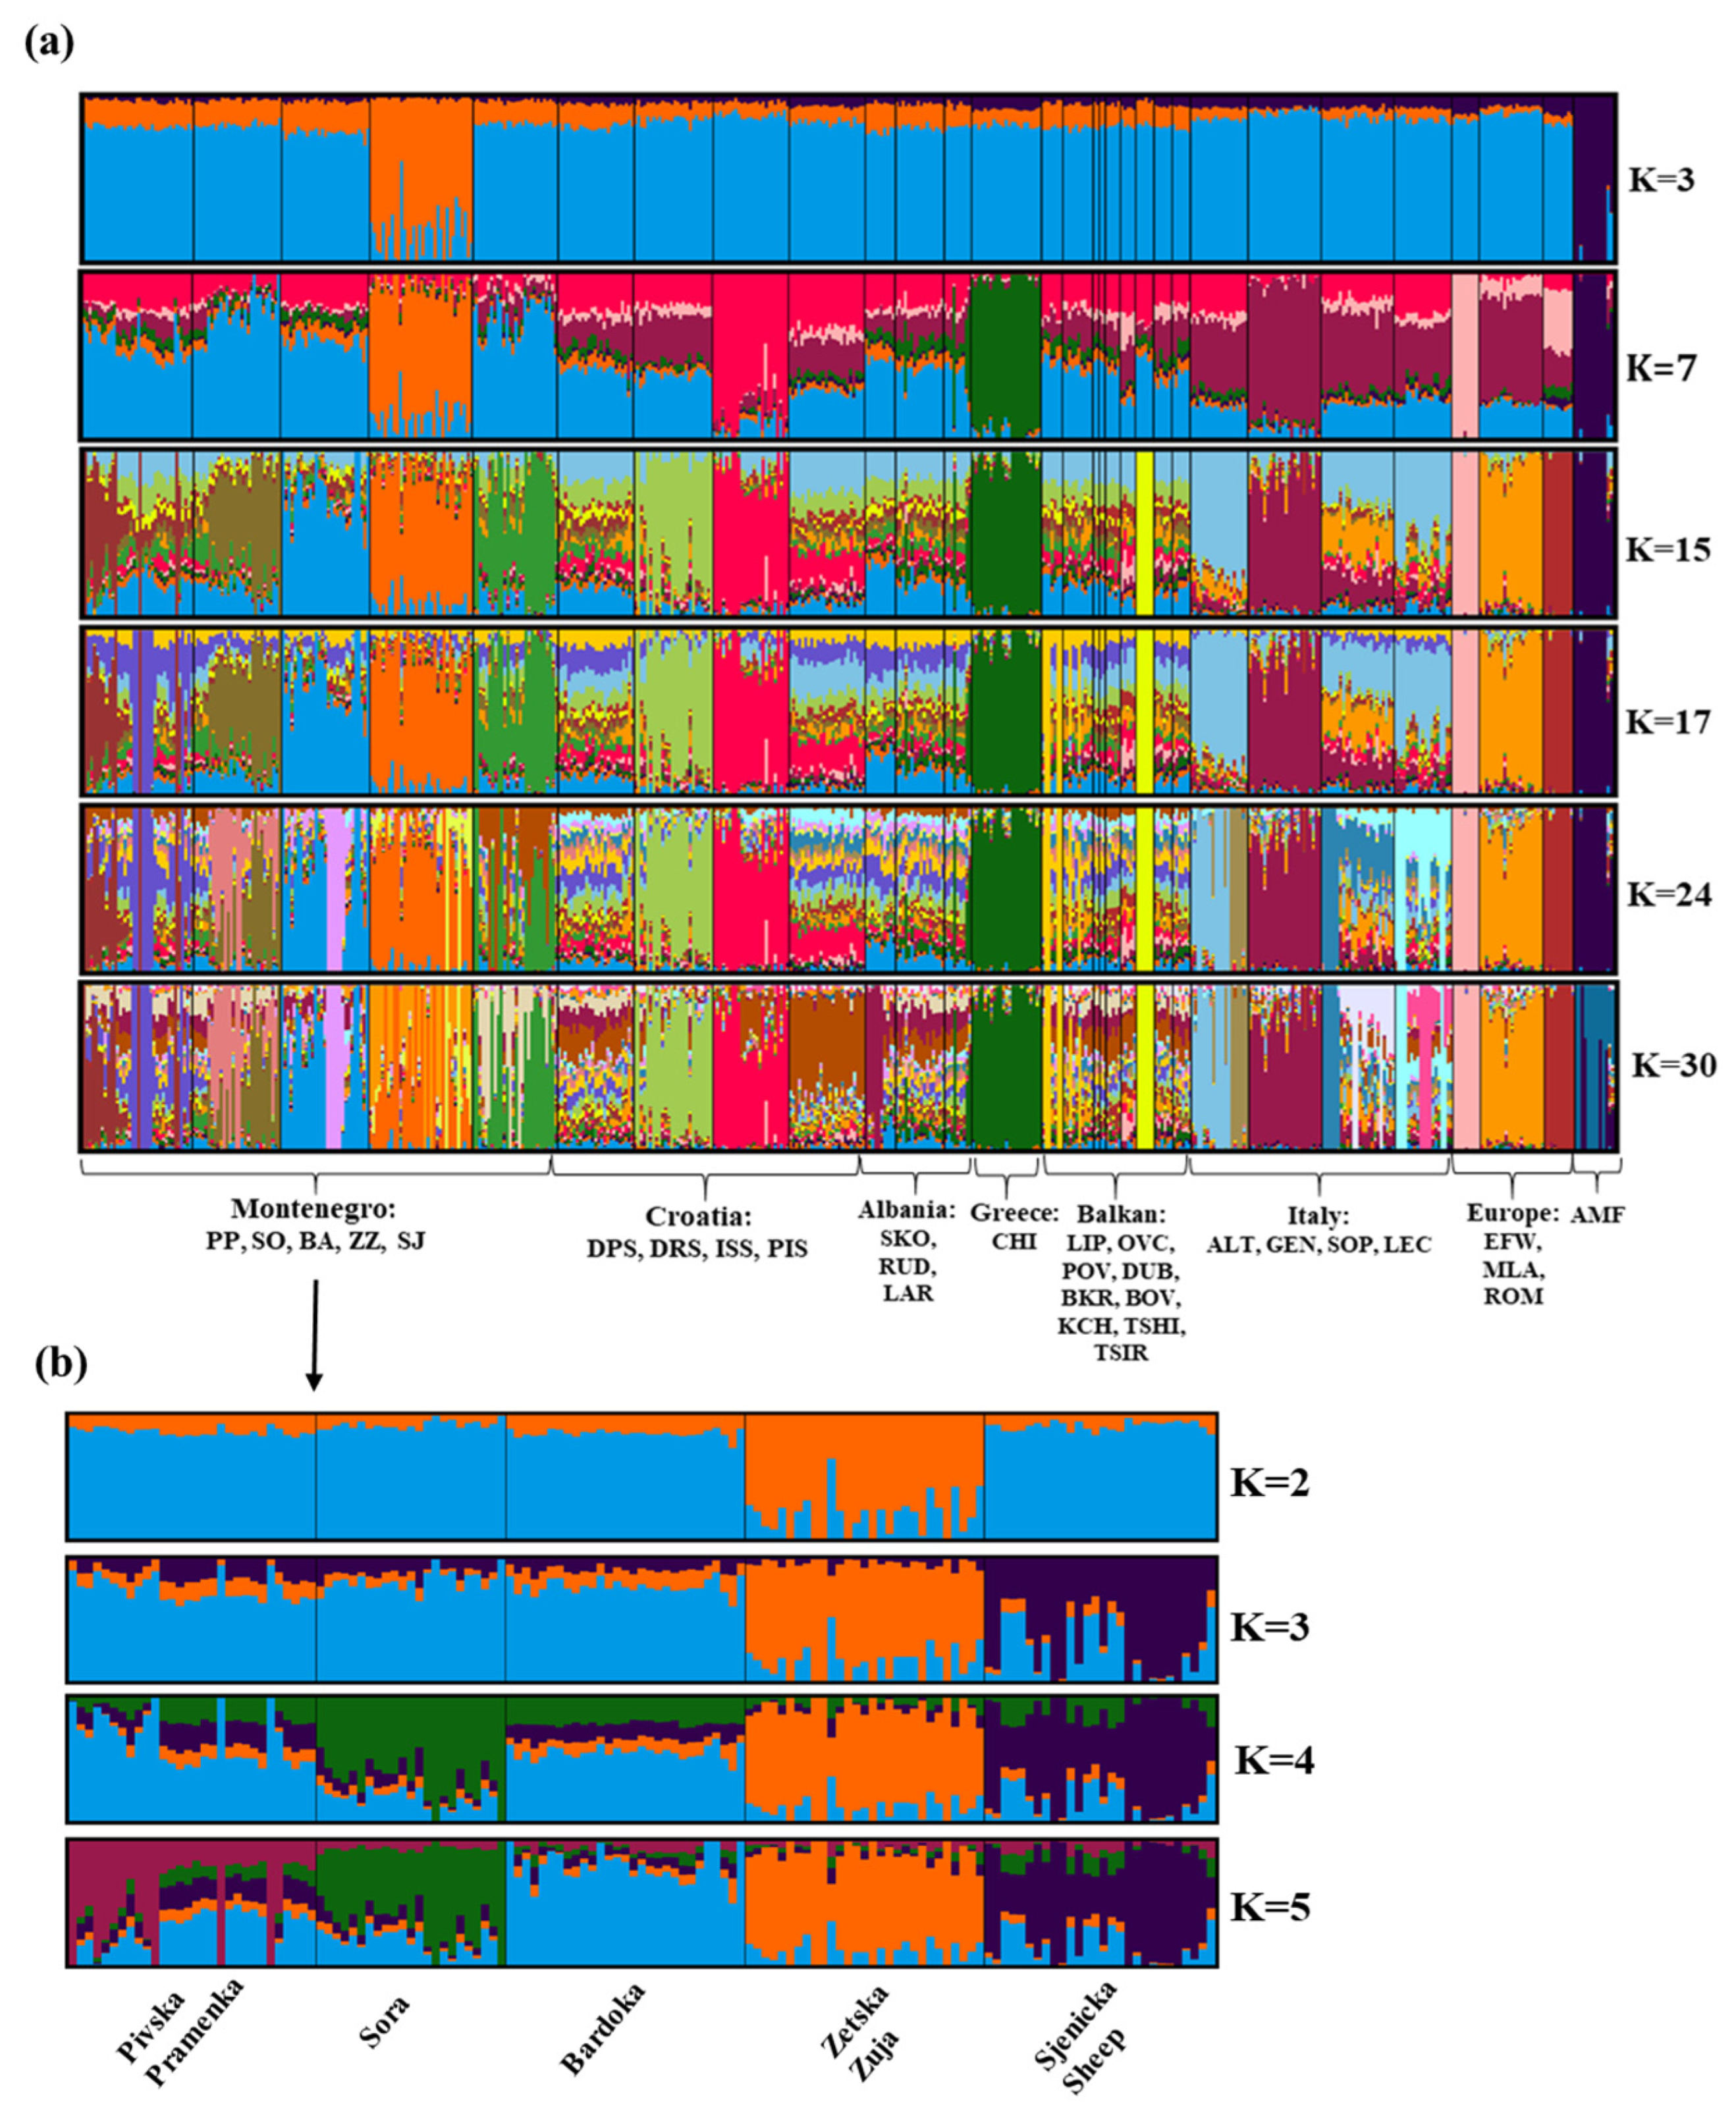
The population structure of Montenegrin and other Balkan and European breeds was identified using the Admixture analysis with the assumed number of populations set to K = 32. The Evanno ΔK method did not reveal a clear number of genetic clusters, with peaks at K = 3, 7, 15, 17, and 24 (Supplementary Materials, Figure S1). Multiple peaks suggest the presence of a complex hierarchical structure, but K = 15 was suggested as the most likely number of clusters. The Admixture plots show the results for K = 3, K = 7, K = 15, K = 17, K = 24, and K = 30 (Figure 6). At K = 3, an independent cluster was observed for Zetska Zuja and Asian Muflon. At K = 7, we observed the separation of five sheep breeds—Zetska Zuja, Istrian Sheep, Chios, Gentlie di Puglia, East Friesian White, and Asian Muflon. The patterns obtained at K = 15 indicate different genetic backgrounds for Sora, Bardoka, Zetska Zuja, Sjenicka Sheep, Dubrovnik Sheep, Istrian Sheep, Chios, Karakachanska, Altamurana, Gentlie di Puglia, East Friesian White, Merinolandschaf, Romanov, and Asian Muflon. Sheep breeds belonging to the Zackel (Pramenka) type, PP, DPS, PIS, SKO, RUD, LAR, LIP, OVC, PVO, DUB, BKR, KCH, TSIH, showed a similar and very complex population structure (K = 15, 17). At K = 15–30 (Figure 6a), divergence of Montenegrin sheep (especially ZZ, BA, SJ, and partially PP and SO) with lower proportions of the genome of Balkan Zackel type sheep breeds was observed.
In order to identify the population structure within the Montenegrin sheep breeds on a finer scale, we performed Admixture analysis only for the Montenegrin dataset with an assumed number of populations (K) between one and seven (Figure 6b). The most informative number of ancestral populations was three (K = 3), see Supplementary Materials, Figure S2. At K = 3 ZZ and SJ are completely separated, while PP, SO and BA form separate group suggesting common ancestry. At K = 4 SO separated, and at K = 5 the separation of PP occurred forming two subpopulations. BA showed a different genetic background than other Montenegrin sheep breeds preserving a large part of the ancestral genome.
4. Discussion
4.1. Genetic Diversity, Effective Population Size, and Genome Inbreeding
The aim of this study was to determine genetic variability and population structure on a genome-wide scale within five sheep breeds in Montenegro. Including other populations from the European continent allowed us to evaluate diversity in a broader context. An analysis of genetic diversity within Montenegrin sheep populations (Table 1) showed that PP and SJ have higher levels of diversity than the other three breeds, with expected heterozygosity (He) of 0.423 and 0.421, respectively. This fits well with the known history of the two breeds and their crossing to improve the production traits of the breed. In addition, producers nowadays perform unplanned cross-breeding of these breeds with other breeds. In contrast to PP and SJ, the other three sheep breeds showed lower genetic diversity.
The observed and expected heterozygosity in Montenegrin sheep breeds were higher than those in sheep breeds all over the world. Our results show that the level of genomic variability in Montenegrin sheep is higher than that in Corriedale, Merino, and Creole sheep [31], some Welsh sheep breeds [33], native Swedish [30], and native Ethiopian sheep breeds [26]. In ZZ and SO, the observed and expected heterozygosity were similar to those reported for the native Russian sheep breeds [27], Kyrgyz breeds [28], and Barbaresca sheep from Sicily [53]. Montenegrin sheep populations have slightly higher genetic diversity than other Balkan Peninsula breeds: Croatian sheep breeds [34], Kosovar sheep breeds [35], and other Balkan breeds described in Ciani et al. 2020 [42]. In addition, the BA sheep breed on the territory of Montenegro had higher observed and expected heterozygosity than Barloka (the same sheep population from Kosovo) [35].
The results for Montenegrin sheep for rarified allelic richness were higher than those reported by Deniskova et al. (2018) [27] for Russian sheep breeds, Deniskova et al. (2019) [28] for Kyrgyz sheep breeds, and Adeniyi et al. (2022) [35] for Kosovar sheep breeds.
The effective population size (Ne) is a useful parameter for monitoring genetic diversity, quantifying the extent of genetic drift, and explaining population trends. The recent demographic history of a given contemporary population can be determined using the program GONE. Ne estimation in GONE is based on an optimization method that implements a genetic algorithm (Mitchell 1998) [54], and this method was compared with previous leading methods. The current effective population size and effective population size for five generations ago, were estimated. Higher Ne5 values were observed for SO (5003) and BA (684). These breeds have higher Ne5 values, similar to Australian breeds (Ne from 140 to 348) [24], Russian breeds (Ne5 from 65 to 543) [27], and some breeds in Kyrgyzstan (Gissar Ne5 = 660 and Aykol Ne5 = 563) [28]. The Ne5 reported in our study for BA in Montenegro are significantly higher than those reported for Bardhoka (Bardoka) in Kosovo [35]. This may depend on the structure of the sampling flocks, related individuals, breed mixing, or migration, but also on the software used [55]. Estimates of effective population size five generation ago (Ne5) for PP (72), SJ (79), and ZZ (92) were lower than for the other worldwide sheep breeds [27,28]. We found a significant decrease in the effective population size from five generations ago for the sheep breeds studied. The greatest decrease in effective population size was observed in SO and then in BA, which means that populations have gone through bottlenecks. Low effective population sizes were observed for all breeds analyzed. Low values are to be expected, because the number of sheep has decreased in recent years, especially in the last 30 years. The lowest effective population size was observed in SO (Ne0 = 25), followed by ZZ (Ne0 = 32). This implies that these breeds should be closely monitored as relevant candidates for conservation programs.
Recently, the leading method for calculating genomic inbreeding has been based on Runs of Homozygosity (ROH) by Lencz et al. (2007) [56]. Runs of Homozygosity are long homozygous regions in a genome, and since they represent autozygous segments, the sum of all ROHs of given genomic information can be considered as the proportion of autozygosity, i.e., inbreeding (FROH; McQuillan et al., (2008) [57]; Curik et al., (2014) [58]). Inbreeding coefficients varied among breeds, with the highest found in ZZ (FROH>2Mb = 0.090) and the lowest in SJ (FROH>2Mb = 0.041). Lower inbreeding coefficients than those in Montenegrin sheep breeds were generally reported for Croatian sheep breeds identified with the 600K SNP chip [34]. Higher inbreeding values were also observed in Balusha by Adeniyi et al. (2022) [35] and Barbaresca sheep by Mastrangelo et al. (2017) [53]. The mean values of genomic inbreeding coefficients were higher in Romanov (FROH = 0.106) [29] and Russian longhaired sheep (FROH = 0.097) [27] than in the studied Montenegrin breeds. The contrast between high FROH>2Mb (Figure 2) and low FIS (0.001) in ZZ is due to different definitions. For example, FROH>2Mb measures the increase in inbreeding that has occurred in the last 50 generations, whereas FIS reflects the divergence of homozygosity from HWE and may even be negative if the mating of very close relatives is avoided. The observed higher degree of inbreeding is a consequence of the small number of animals available for revitalization. During the last 3–4 decades, the number of ZZ sheep has declined sharply, so that today there are only about 150 sheep and sporadically a few more animals in herds of other breeds [13]. This breed of sheep is therefore threatened with extinction, suggesting that improved conservation management is needed to maintain genetic diversity. The low Ho and He values observed in ZZ are consistent with the lack of gene flow between ZZ and other breeds in Montenegro and Europe, i.e., genetically isolated populations. Moreover, the highest inbreeding values for long ROH segments were observed in ZZ (FROH>8Mb = 0.068), indicating recent inbreeding (Figure 3). The higher values in SO (FROH>8Mb = 0.048) and BA (FROH>8Mb = 0.047) were also observed in the longer length class. The recent increase in the inbreeding coefficient could be due to the extensive use of few rams within herds. Livestock breeders use natural mating where rams are used for several years in herds with closely related individuals or one ram is used in several herds, resulting in increased inbreeding and consequently lower variability. High heterozygosity and low FROH were observed in PP and SJ, indicating the importance of genetic diversity. Higher diversity indicates high gene flow and genetic admixture between populations, which was confirmed by admixture analysis (Figure 6). However, lower inbreeding values for FROH>8Mb were observed in SJ (0.028) and PP (0.038), indicating that there is less crossbreeding of relatives compared to that of other breeds in Montenegro. Lower mean FROH values for longer lengths (ROH = 10 Mb) were observed in Kyrgyz sheep breeds [28] and in Kosovar sheep breeds [35].
4.2. Population Genetic Structure Analyses
To illustrate the relationships within individuals and between sheep populations, PCA was performed for both datasets. Cluster patterns corresponded to their east–west geographic distribution (Figure 4a). Croatian breeds were in an intermediate position between Montenegrin and other European breeds. Other authors also note that breeds in PCA are generally grouped with other breeds from the same geographical area of origin [30,38,42]. From the first two principal components, it was clear that Balkan (Pramenka) sheep form a separate group of sheep. In this group of sheep, a slight separation was observed for a part of individual Montenegrin sheep (Sjenicka Sheep, Bardoka, Sora), while a Croatian Istiran sheep was quite distinct (according to PC2). This is to be expected, because according to Drzaic et al. (2022) [34], this breed of sheep is geographically isolated on the peninsula and genetically unique. The clear clustering of these breeds is due to the geographical distribution, i.e., the separation of Pramenka breeds based on geographical forms and climatic conditions in the rearing area. The Italian and European sheep breeds were separated from the Balkan sheep cluster by PC1 and PC2. There were two exceptions, the East Friesian White (EFW) and Romanov (ROM) breeds, which were not closely grouped with the Balkan sheep breeds. According to Kijas et al. (2012) [38], East Friesian White is located between the Swiss, Slovakian, and Finnish breeds, which were not included in our dataset. The Romanov breed is a northern European short-tailed sheep breed originally from Russia, but in our dataset, Romanov was sampled in France as reported in Rochus et al. (2018) [29]. In Figure 4a, Montenegrin sheep breeds are grouped with other Balkan (Pramenka) sheep breeds included in this analysis, but part of the sheep populations (Sora, Sjenicka, and Badroka) is clearly separated and individuals have clear cluster assignments, indicating greater differentiation between breeds. PCA has separated the Montenegrin breed Zetska Zuja and the Asian Muflon (see Supplementary Materials, Figure S3) from other populations, indicating greater genetic differences between them and other individuals in the dataset. This is fully consistent with the research findings of Ciani et al. (2020) [42]. The relationship between the first two principal components was studied for the native Montenegrin sheep breeds to show the relationship among the five populations. The PCA representation of the Montenegrin sheep breeds shows clear breed separation. In particular, the first and second components of genetic variability between breeds clearly distinguished the Zetska Zuja and Sjenicka Sheep from the other Montenegrin sheep breeds (Figure 4b). These breeds showed a large dispersion of eigenvalues. The separation of Montenegrin breeds is consistent with the geographical position. The differentiation of ZZ was expected. Zetska Zuja is the most phenotypically diverse indigenous sheep population in Montenegro. It is geographically located in one region of the country. According to other results, ZZ is a closed population with a specific genetic structure, different from other Pramenka breeds. These results are similar to the results of PCA in Montenegrin sheep based on microsatellites [59], as ZZ was separated from the other breeds. Sjenicka Sheep is a local breed in Montenegro, originally from Serbia, and therefore different from other sheep populations in Montenegro. SJ has an impact on the whole sheep population in the country. The PP and BA form a tight cluster, indicating the presence of crossbreeding.
In the Neighbor-net (Figure 5), the position of the Montenegrin sheep breeds is between the Albanian and Bosnian breeds, indicating the geographic distribution of breeds and past gene flow and mixing of populations that most likely occurred between the Balkan Pramenka populations. Gene flow between Pramenka types decreased and new breeds were formed, but it is still visible in the genetic structure of Montenegrin breeds and confirms the relationships identified by Ciani et al. (2020) [42]. Geographical barriers have the main influence on the current structure of native Montenegrin sheep breeds. It was expected that ZZ and BA would be in the same cluster, since their breeding areas are close to each other. They are located in the central and southeastern part of Montenegro, i.e., in parts of the country close the Albanian border. Therefore, they are closest to the Albanian breed Skodrane within their cluster. Macedonian and Serbian sheep breeds were incorporated between the two Montenegrin clusters, which proves their genetic similarity. The spread of Sjenicka Sheep from Serbia to the central part of Montenegro went through the northern part where the Sora breed is reared. For this reason, SO and SJ formed a separate group. Today, Sjenicka sheep have an influence on many sheep populations in Montenegro. In the phylogenetic tree, PP was almost at the edge of the network, occupying an intermediate position between the Montenegrin and Bosnian and Slovenian clusters. This is to be expected, since there is an influence of breeds from the surrounding states. The same arrangement of Montenegrin sheep breeds is shown in a separate Neighbor-net graph (Supplementary Materials, Figure S4).
The Admixture algorithm showed that ZZ and Asian Muflon formed an independent cluster at K = 3, which was confirmed by the PCA results (Supplementary Materials, Figure S3). This may indicate that the ZZ has a completely different genotype from European sheep breeds. Figure 6a shows the incomplete differentiation of Balkan Pramenka sheep and a common ancestral genome. The complex genetic structure is the result of an exchange of genetic material between these populations. In this dataset, the admixture algorithm has differentiated five Montenegrin breeds. Nevertheless, the results show that the native Montenegrin breeds have high genetic similarity to other Pramenka breeds. The admixture analysis confirms that breeds in the north of Montenegro (PP, SO) have more common genome with other breeds and higher variability. The reason for this could be the production system, as nomadic migration is predominant compared to breeds from more southern regions of Montenegro. The presence of admixture patterns in PP is consistent with the explanations for the estimated higher heterozygosity and lower FROH values. Notable admixture patterns were observed in the majority of Balkan sheep breeds. They show a very complex ancestral structure. ZZ is a closed population with little influence of other genomes. The genotype of Bardoka consists mostly of the common Pramenka genotype (blue color of the field), which may mean that it is an older breed of Pramenka or that it has preserved a more primitive genotype of the Pramenka group. The analysis shows that the genotype of European sheep breeds (Merinolandschaf, East Frisian, Romanov breed) was not retained in the Montenegrin sheep breeds. The most probable populations in Montenegrin data were three (Figure 6). The three sheep populations formed a single group, while ZZ and SJ formed an independent cluster with some admixture from the other populations. This is confirmed by the PCA (Figure 4b), which clearly distinguishes these three sheep breeds. Bardoka shows the dominance of a single ancestral genome. The unique genetic background of the ZZ sheep was confirmed. Genetic differentiation among the ZZ, SO, and SJ breeds was observed at K = 4, and PP and BA form a clearly separate group (indicating common ancestry). PCA analysis also shows a certain degree of population matching (Figure 4b). At K = 5, the PP is divided into two subpopulations. One is specific, while the second population is genetically related to SO.
5. Conclusions
The study presented the first detailed analysis of genomic diversity and population structure of five indigenous and local Montenegrin sheep breeds using 50K SNP markers. The sheep population in Montenegro showed moderate-to-high inbreeding coefficients estimated from runs of homozygosity. The Zetska Zuja sheep breed had the lowest heterozygosity and higher inbreeding coefficients, while Sjenicka Sheep and Pivska Pramenka had higher genetic diversity. The current effective population size was below 100 for most breeds, indicating a higher degree of genetic vulnerability of the studied breeds. Analysis of the population genetic structure analysis (PCA, phylogenetic) showed that Zetska Zuja, Sjenicka Sheep, and Sora are a slightly genetically divergent population. The admixture analysis revealed the presence of multiple breed genomes in Pivska Pramenka, and Sora, which seems to be a characteristic of most Pramenka breeds, while genetic purity was found in Zetska Zuja. We compared Montenegrin sheep breeds with Croatian, other Zackel sheep breeds, Mediterranean, and some European breeds. In the global context, Montenegrin sheep are clearly different from the other analyzed breeds based on PCA, Neighbor-net, and Admixture analysis, but they also belong to the Pramenka sheep group and are far from other European breeds. The results should provide a good basis for the development of an appropriate strategy for the conservation and sustainable use of the native Montenegrin sheep breeds. The conservation of the breeds is an important contribution to the preservation of traditional Montenegrin products and contributes to the sustainable development of whole sheep production in Montenegro.
Supplementary Materials
The following supporting information can be downloaded at: https://www.mdpi.com/article/10.3390/d15050640/s1, Table S1. Short description of the five studied sheep breeds of Montenegro; Table S2. Information on the joint dataset, which includes the Montenegrin sheep breeds and publicly available data of sheep breeds used in this study; Figure S1. Plots generated in Clumpak that show the Evanno’s delta K statistic; Figure S2. Plots generated in Clumpak show the mean log likelihood of the data [L(K)] and Evanno’s delta K statistic for the Montenegrian dataset; Figure S3. Principal component analysis (PCA) of the Montenegrin and other European sheep populations and Asian Muflon. Bar plot visualisation of the contribution of discriminant functions explaning sample variation; Figure S4. Neighbor-Net network inferred from pairwise Nei’s genetic distances among in five Montenegrin sheep population.
Author Contributions
Conceptualization, B.M. and V.C.-C.; methodology, M.D., I.D. and M.S.; software, M.D., I.D. and M.S.; validation, V.C.-C. and B.M.; formal analysis, V.C-C. and I.D.; investigation, M.D.; resources, B.M. and V.C.-C.; data curation, I.D.; writing—original draft preparation, M.D.; writing—review and editing, I.D.; visualization, M.D. and M.S.; supervision, B.M.; project administration, V.C.-C.; funding acquisition, B.M. All authors have read and agreed to the published version of the manuscript.
Funding
This research received no external funding.
Institutional Review Board Statement
The animal tissue samples were collected by trained persons (veterinarians) according to strict veterinarian rules during the implementation of the regular veterinarian control and testing. All samples were collected according to national and European ethical protocols and directives.
Data Availability Statement
Data is available on request, after the defense of the PhD, data will be publicly available.
Acknowledgments
This study was supported by the Croatian Science Foundation project IP-2018-01-8708 Application of NGS methods in the assessment of genomic variability in ruminants—ANAGRAMS and KK.01.1.1.06.0002 Lazag.
Conflicts of Interest
The authors declare no conflict of interest.
References
- Ciani, E.; Cubric-Curik, V.; Simčič, M.; Marković, B.; Esmerov, I.; Ružić-Muslić, D.; Štěpánek, O.; Pieragostini, E.; Sallustio, F.; Arjen Lenstra, J. Genetic structure and admixture in Western Balkans and Central European sheep: Preliminary results from 50K SNP genotypic data. Ital. J. Anim. Sci. 2015, 14, 104–105. [Google Scholar]
- Marković, B.; Knežević, M.; Dubljević, R. Agri-Environmental Policy in Montenegro. In AGRI-Environmental Policy in South-East Europe; Regional Rural Development Standing Working Group in SEE (SWG): Pogradec, Albania, 2018; ISBN 978-608-4760-26-9. [Google Scholar]
- Dubljević, R. Country Pasture/Forage Resource Profiles, Montenegro; Food and Agriculture Organization of the United Nations (FAO): Rome, Italy, 2009; Available online: http://www.fao.org/ag/agp/agpc/doc/counprof/montenegro/montenegro.htm (accessed on 12 October 2022).
- Marković, B.; Marković, M.; Radonjić, D.; Veljić, M. Sustainable sheep and goat production based on local breeds in Montenegro. In Proceedings of the 8th Global Conference on the Conservation of Animal Genetic Resources, Tekirdag, Turkye, 4–8 October 2011; pp. 414–420, ISBN 978-605-87679-4-2. [Google Scholar]
- Marković, B.; Marković, M.; Adzić, N. The farm animal genetic resources of Montenegro. Biotechnol. Anim. Husb. 2007, 23, 1–9. [Google Scholar] [CrossRef]
- Marković, B.; Ivanković, A.; Mirecki, S.; Marković, M. Genetic polymorphism of beta—Lactoglobulin in the three sheep breeds in Montenegro. In Proceedings of the International Symposium on Animal Science, Novi Sad, Serbia, 24–25 October 2015; ISBN 978-86-7520-346-9. [Google Scholar]
- Marković, B.; Marković, M.; Radonjić, D. The morphometric characteristics of indigenous sheep population named Sora. In Proceedings of the 1st International Symposium on Animal Science, Belgrade, Serbia, 8–10 November 2012; pp. 57–64, ISBN 978-86-7834-164-9. [Google Scholar]
- Đokić, M.; Marković, B.; Marković, M.; Mirecki, S.; Veljić, M. Relationship between β-Lactoglobulin Gene Polymorphism and Milk Traits and Milk Composition of Sora Sheep Breed; International Symposium on Animal Science (ISAS): Herceg Novi, Montenegro, 2019; pp. 100–105. [Google Scholar]
- Marković, B.; Dovč, P.; Marković, M.; Radonjić, D.; Adakalić, M.; Simčič, M. Differentiation of some Pramenka sheep breedsbased on morphometric characteristics. Arch. Anim. Breed. 2019, 62, 393–402. [Google Scholar] [CrossRef] [PubMed]
- Bytyqi, H.; Mehmeti, H. Bardhoka Strain. In Catalogue of West Balkan Pramenka Sheep Breed Types: Identification and Conservation of Animal Genetic Resources in South Eastern Europe; Faculty of Agricultural Sciences and Food, University of Skopje: Skopje, Macedonia, 2006. [Google Scholar]
- Đokić, M.; Marković, B.; Gantner, V.; Marković, M. Association of genetic variants of β-lactoglobulin gene with milk traits of Jezeropivska sheep breed. Agric. For. 2020, 66, 15–23. [Google Scholar] [CrossRef]
- Cinkulov, M.; Popovski, Z.; Tanaskovska, B.; Hodžić, A.; Bytyqi, H.; Mehmeti, H.; Margeta, V.; Djedović, R.; Hoda, A.; Trailović, R.; et al. Genetic diversity and structure of the West Balkan Pramenka sheep types as revealed by microsatellite and mitochondrial DNA analysis. J. Anim. Breed. Genet. 2008, 125, 417–426. [Google Scholar] [CrossRef]
- Marković, B.; Marković, M.; Adžić, N. Genetic Resources in Livestock of Montenegro; Montenegrin Academy of Science and Art: Podgorica, Montenegro, 2020; p. 300. ISBN 978-86-7215-470-2. [Google Scholar]
- FAO. Global Plan of Action for Animal Genetic Resources and the Interlaken Declaration; Commission on Genetic Resources for Food and Agriculture; Food and Agriculture Organization of the United Nations: Rome, Italy, 2007; Available online: https://www.fao.org/3/a1404e/a1404e.pdf (accessed on 20 September 2022).
- Ministry of Agriculture and Rural Development. National Program for Conservation and Sustainable Use of Genetic Resources in Agriculture (2008–2013) with Action Plan; Ministry of Agriculture and Rural Development: Podgorica, Montenegro, 2007. [Google Scholar]
- FAO. FAO Animal Production and Health Guidelines; Molecular Genetic Characterization of Animal Genetic Resources. No. 9; FAO: Rome, Italy, 2011; Available online: http://www.fao.org/dad-is (accessed on 9 October 2022).
- Toro, M.A.; Fernández, J.; Caballero, A. Molecular characterization of breeds and its use in conservation. Livestig. Sci. 2009, 120, 174–195. [Google Scholar] [CrossRef]
- Dunisławska, A.; Łachmańska, J.; Sławińska, A.; Siwek, M. Next generation sequencing in animal science—A review. Anim. Sci. Pap. Rep. 2017, 35, 205–224. [Google Scholar]
- Lenstra, J.A.; Groeneveld, L.F.; Eding, H.; Kantanen, J.; Williams, J.L.; Taberlet, P.; Nicolazzi, E.L.; Sölkner, J.; Simianer, H.; Ciani, E.; et al. Molecular tools and analytical approaches for the characterization of farm animal genetic diversity. Anim. Genet. 2012, 43, 483–502. [Google Scholar] [CrossRef]
- Eusebi, P.G.; Martinez, A.; Cortes, O. Genomic Tools for Eective Conservation of Livestock Breed Diversity. Diversity 2020, 12, 2–16. [Google Scholar]
- Kawęcka, A.; Gurgul, A.; Miksza-Cybulska, A. The use of SNP microarrays for biodiversity studies of sheep—A review. Ann. Anim. Sci. 2016, 16, 975–987. [Google Scholar] [CrossRef]
- Davenport, K.M.; Hiemke, C.; McKay, S.D.; Thorne, J.W.; Lewis, R.M.; Taylor, T.M. Genetic structure and admixture in sheep from terminal breeds in the United States. Anim. Genet. 2020, 51, 284–291. [Google Scholar] [CrossRef] [PubMed]
- Zhang, L.; Mousel, M.R.; Wu, X.; Michal, J.J.; Zhou, X.; Ding, B.; Dodson, M.V.; El-Halawany, N.K.; Lewis, G.S.; Jiang, Z. Genome-Wide Genetic Diversity and Differentially Selected Regions among Suffolk, Rambouillet, Columbia, Polypay, and Targhee Sheep. PLoS ONE 2013, 8, e65942. [Google Scholar] [CrossRef]
- Al-Mamun, H.A.; Clark, S.; Kwan, P.; Gondro, C. Genome-wide linkage disequilibrium and genetic diversity in five populations of Australian domestic sheep. Genet. Sel. Evol. 2015, 47, 2–14. [Google Scholar] [CrossRef]
- Zhao, Y.X.; Yang, J.; Lv, F.H.; Hu, X.J.; Xie, X.L.; Zhang, M.; Li, W.R.; Liu, M.J.; Wang, Y.T.; Li, J.Q.; et al. Genomic reconstruction of the history of native sheep reveals the peopling patterns of nomads and the expansion of early pastoralism in East Asia. Mol. Biol. Evol. 2017, 34, 2380–2395. [Google Scholar] [CrossRef]
- Edea, Z.; Dessie, T.; Dadi, H.; Do, K.-T.; Kim, K.-S. Genetic Diversity and Population Structure of Ethiopian Sheep Populations Revealed by High-Density SNP Markers. Front. Genet. 2017, 8, 218. [Google Scholar] [CrossRef]
- Deniskova, T.E.; Dotsev, A.V.; Selionova, M.I.; Kunz, E.; Medugorac, I.; Reyer, H.; Wimmers, K.; Barbato, M.; Traspov, A.A.; Brem, G.; et al. Population structure and genetic diversity of 25 Russian sheep breeds based on whole-genome genotyping. Genet. Sel. Evol. 2018, 50, 29. [Google Scholar] [CrossRef]
- Deniskova, T.; Dotsev, A.; Lushihina, E.; Shakhin, A.; Kunz, E.; Međugorac, I.; Reyer, H.; Wimmers, K.; Khayatzadeh, N.; Sölkner, J.; et al. Population Structure and Genetic Diversity of Sheep Breeds in the Kyrgyzstan. Front. Genet. 2019, 10, 1311. [Google Scholar] [CrossRef] [PubMed]
- Rochus, C.M.; Tortereau, F.; Plisson-Petit, F.; Restoux, G.; Moreno-Romieux, C.; Tosser-Klopp, G.; Servin, B. Revealing the selection history of adaptive loci using genome-wide scans for selection: An example from domestic sheep. BMC Genom. 2018, 19, 71. [Google Scholar] [CrossRef]
- Rochus, C.M.; Jonas, E.; Johansson, A.M. Population structure of five native sheep breeds of Sweden estimated with high density SNP genotypes. BMC Genet. 2020, 21, 27. [Google Scholar] [CrossRef]
- Grasso, A.N.; Goldberg, V.; Navajas, E.A.; Iriarte, W.; Gimeno, D.; Aguilar, I.; Medrano, J.F.; Rincón, G.; Ciappesoni, G. Genomic variation and population structure detected by single nucleotide polymorphism arrays in Corriedale, Merino and Creole sheep. Genet. Mol. Biol. 2014, 37, 389–395. [Google Scholar] [CrossRef] [PubMed]
- Ciani, E.; Crepaldi, P.; Nicoloso, L.; Lasagna, E.; Sarti, F.M.; Moioli, B.; Napolitano, F.; Carta, A.; Usai, G.; D’Andrea, M.; et al. Genome-wide analysis of Italian sheep diversity reveals a strong geographic pattern and cryptic relationships between breeds. Anim. Genet. 2014, 45, 256–266. [Google Scholar] [CrossRef] [PubMed]
- Beynon, S.E.; Slavov, G.T.; Farré, M.; Sunduimijid, B.; Waddams, K.; Davies, B.; Haresign, W.; Kijas, J.; MacLeod, I.M.; Newbold, C.J.; et al. Population structure and history of the Welsh sheep breeds determined by whole genome genotyping. BMC Genet. 2015, 20, 65. [Google Scholar] [CrossRef] [PubMed]
- Drzaic, I.; Curik, I.; Lukic, B.; Shihabi, M.; Li, M.-H.; Kantanen, J.; Mastrangelo, S.; Ciani, E.; Lenstra, J.A.; Cubric-Curik, V. High-Density Genomic Characterization of Native Croatian Sheep Breeds. Front. Genet. 2022, 13, 940736. [Google Scholar] [CrossRef]
- Adeniyi, O.O.; Simon, R.; Bytyqi, H.; Kugler, W.; Mehmeti, H.; Berisha, K.; Simčić, M.; Magdy, M.; Lühken, G. Capturing Genetic, Diversity and Selection Signatures of the Endangered Kosovar Balusha Sheep Breed. Genes 2022, 13, 866. [Google Scholar] [CrossRef] [PubMed]
- Ahbara, A.; Bahbahani, H.; Almathen, F.; Al Abri, M.; Agoub, M.O.; Abeba, A.; Kebede, A.; Musa, H.H.; Mastrangelo, S.; Pilla, F.; et al. Genome-Wide Variation, Candidate Regions and Genes Associated With Fat Deposition and Tail Morphology in Ethiopian Indigenous Sheep. Front. Genet. 2019, 9, 699. [Google Scholar] [CrossRef] [PubMed]
- Ciani, E.; Lasagna, E.; D’andrea, M.; Alloggio, I.; Marroni, F.; Ceccobelli, S.; Delgado Bermejo, J.V.; Sarti, F.M.; Kijas, J.; Lenstra, J.A.; et al. Merino and Merino-derived sheep breeds: A genome-wide intercontinental study. Genet. Sel. Evol. 2015, 47, 64. [Google Scholar] [CrossRef]
- Kijas, J.W.; Lenstra, J.A.; Hayes, B.; Boitard, S.; Porto Neto, L.R.; San Cristobal, M.; Servin, B.; McCulloch, R.; Whan, V.; Gietzen, K.; et al. Genome-Wide Analysis of the World’s Sheep Breeds Reveals High Levels of Historic Mixture and Strong Recent Selection. PLoS Biol. 2012, 10, e1001258. [Google Scholar] [CrossRef]
- Moradi, M.H.; Nejati-Javaremi, A.; Moradi-Shahrbabak, M.; Dodds, K.G.; McEwan, J.C. Genomic scan of selective sweeps in thin and fat tail sheep breeds for identifying of candidate regions associated with fat deposition. BMC Genet. 2012, 13, 10. [Google Scholar] [CrossRef]
- FAO. The Second Report on the State of the World’s Animal Genetic Resources for Food and Agriculture; Scherf, B.D., Pilling, D., Eds.; FAO Commission on Genetic Resources for Food and Agriculture Assessments: Rome, Italy, 2015; Available online: http://www.fao.org/3/a-i4787e/index.html (accessed on 25 October 2022).
- Purcell, S.; Neale, B.; Todd-Brown, K.; Thomas, L.; Ferreira, M.A.; Bender, D.; Maller, J.; Sklar, P.; De Bakker, P.I.; Daly, M.J.; et al. PLINK: A tool set for whole-genome association and population-based linkage analyses. Am. J. Hum. Genet. 2007, 81, 559–575. [Google Scholar] [CrossRef]
- Ciani, E.; Mastrangelo, S.; Da Silva, A.; Marroni, F.; Ferenčaković, M.; Ajmone-Marsan, P.; Baird, H.; Barbato, M.; Colli, L.; Delvento, C.; et al. On the Origin of European Sheep as Revealed by the Diversity of the Balkan Breeds and by Optimizing Population-Genetic Analysis Tools. Genet. Sel. Evol. 2020, 52, 25. [Google Scholar] [CrossRef]
- Keenan, K.; McGinnity, P.; Cross, T.F.; Crozier, W.W.; Prodohl, P.A. DiveRsity: An R package for the estimation of population genetics parameters and their associated errors. Methods Ecol. Evol. 2013, 4, 782–788. [Google Scholar] [CrossRef]
- Santiago, E.; Novo, I.; Pardiñas, A.F.; Saura, M.; Wang, J.; Caballero, A. Recent Demographic History Inferred by High-Resolution Analysis of Linkage Disequilibrium. Mol. Biol. Evol. 2020, 37, 3642–3653. [Google Scholar] [CrossRef] [PubMed]
- Ferenčaković, M.; Sölkner, J.; Curik, I. Estimating autozygosity from high-throughput information: Effects of SNP density and genotyping errors. Genet. Sel. Evol. 2013, 45, 42. [Google Scholar] [CrossRef] [PubMed]
- Wickham, H. Ggplot2: Elegant Graphics for Data Analysis; Springer: Berlin/Heidelberg, Germany, 2016; ISBN 3319242776. [Google Scholar]
- Zheng, X.; Levine, D.; Shen, J.; Gogarten, S.; Laurie, C.; Weir, B. A High-performance Computing Toolset for Relatedness and Principal Component Analysis of SNP Data. Bioinformatics 2012, 28, 3326–3328. [Google Scholar] [CrossRef]
- Nei, M. Genetic distance between populations. Am. Nat. 1972, 106, 283–292. [Google Scholar] [CrossRef]
- Pembleton, L.W.; Cogan, N.O.I.; Forster, J.W. St AMPP: An R Package for Calculation of Genetic Differentiation and Structure of Mixed ploidy Level Populations. Mol. Ecol. Resour. 2013, 13, 946–952. [Google Scholar] [CrossRef]
- Huson, D.H.; Bryant, D. Application of phylogenetic networks in evolutionary studies. Mol. Biol. Evol. 2006, 23, 254–267. [Google Scholar] [CrossRef]
- Alexander David, H.; Novembre, J.; Lange, K. Fast model-based estimation of ancestry in unrelated individuals. Genome Res. 2009, 19, 1655–1664. [Google Scholar] [CrossRef]
- Evanno, G.; Regnaut, S.; Goudet, J. Detecting the number of clusters of individuals using the software STRUCTURE: A simulation study. Mol. Ecol. 2005, 14, 2611–2620. [Google Scholar] [CrossRef]
- Mastrangelo, S.; Portolano, B.; Di Gerlando, R.; Ciampolini, R.; Tolone, M.; Sardina, M.T. Genome-wide analysis in endangered populations: A case study in Barbaresca sheep. Animal 2017, 11, 1107–1116. [Google Scholar] [CrossRef]
- Mitchell, M. An Introduction to Genetic Algorithms; A Bradford Book; The MIT Press: Cambridge, UK; London, UK, 1998. [Google Scholar]
- Novo, I.; Santiago, E.; Caballero, A. The estimates of effective population size based on linkage disequilibrium are virtually unaffected by natural selection. PLoS Genet. 2022, 8, e1009764. [Google Scholar] [CrossRef] [PubMed]
- Lencz, T.; Lambert, C.; DeRosse, P.; Burdick, K.E.; Morgan, T.V.; Kane, J.M.; Kucherlapati, R.; Malhotra, A.K. Runs of homozygosity reveal highly penetrant recessive loci in schizophrenia. Proc. Natl. Acad. Sci. USA 2007, 104, 19942–19947. [Google Scholar] [CrossRef] [PubMed]
- McQuillan, R.; Leutenegger, A.L.; Abdel-Rahman, R.; Franklin, C.S.; Pericic, M.; Barac-Lauc, L.; Smolej-Narancic, N.; Janicijevic, B.; Polasek, O.; Tenesa, A.; et al. Runs of Homozygosity in European Populations. Am. J. Hum. Genet. 2008, 83, 359–372. [Google Scholar] [CrossRef] [PubMed]
- Curik, I.; Ferenčaković, M.; Sölkner, J. Inbreeding and runs of homozygosity: A possible solution to an old problem. Livestig. Sci. 2014, 166, 26–34. [Google Scholar] [CrossRef]
- Marković, M.; Radonjić, D.; Zorc, M.; Đokić, M.; Marković, B. Genetic Diversity of Montenegrin Local Sheep Breeds Based on Microsatellite Markers. Animals 2022, 12, 3029. [Google Scholar] [CrossRef]
Figure 1.
Geographical distribution of five Montenegrin sheep breeds analyzed in this study. The breeds represented are as follows: Pivska Pramenka (PP), Zetska Zuja (ZZ), Sora (SO), Sjenicka Sheep (SJ), Bardoka (BA).
Figure 1.
Geographical distribution of five Montenegrin sheep breeds analyzed in this study. The breeds represented are as follows: Pivska Pramenka (PP), Zetska Zuja (ZZ), Sora (SO), Sjenicka Sheep (SJ), Bardoka (BA).

Figure 2.
Violin plot representation of runs of homozygosity inbreeding coefficients (FROH) in Montenegrin sheep populations.
Figure 2.
Violin plot representation of runs of homozygosity inbreeding coefficients (FROH) in Montenegrin sheep populations.

Figure 3.
Distribution of genomic inbreeding coefficients (FROH) in different ROH length classes (FROH2-8Mb and FROH>8Mb) for studied Montenegrin sheep breeds.
Figure 3.
Distribution of genomic inbreeding coefficients (FROH) in different ROH length classes (FROH2-8Mb and FROH>8Mb) for studied Montenegrin sheep breeds.

Figure 4.
Principal component analysis (PCA) showing the first two components (PCA1 and PCA2). Each point represents one individual. The bar plot presents the proportion of variance explained by the first ten components. (a). PCA plot for the II dataset with the exception of Zetska Zuja, Chios, and Asian Muflon, as they changed the pattern of the other individuals. Each point represents one breed, while the colors represent the country of origin or sheep characteristics: blue—Montenegro; purple—Croatia; green—Zackel sheep from Albania, Macedonia, Serbia, Bosnia, Slovenia, Hungary, Romania; orange—Italy; red—other European sheep breeds. (b). PCA plot of five Montenegrin sheep breeds.

Figure 5.
NeighborNet network inferred from pairwise Nei’s genetic distances among five Montenegrin sheep populations, 24 other sheep breeds, and one muflon (II dataset). The breeds shown are as follows: Montenegro—Pivska Pramenka (PP), Sora (SO), Bardoka (BA), Zetska Zuja (ZZ), Sjenicka Sheep (SJ); Croatia—Dalmatian Pramenka (DPS), Dubrovnik Sheep (DRS), Istrian Sheep (ISS), Pag Island Sheep (PIS); Albania—Lara (LAR), Ruda (RUD), Shkodrane (SKO); Macedonia—Karakachanska (KCH), Ovchepolean (OVC), Serbia—Lipska (LIP); Bosnia—Dubska (DUB), Privorska (PVO); Slovenia—Belakrajina (BKR), Bovec (BOV); Hungari—Hungarian Tshigaia (TSIH); Romania—Romanian Tsigaia (TSIR); Greece—Chios (CHI); Italy—Altamurana (ALT), Leccese (LEC), Gentlie di Puglia (GEN), Sopravissana (SOP); France—Merinolandschaf (MLA), Romanov (ROM), East Friesian White (EFW); and Asian Muflon (AMF).

Figure 6.
Admixture plot for all breeds analyzed in this study: (a) in a global context (II dataset) and (b) in particular, in Montenegrin sheep breeds. The breeds shown in the graph (a) are as follows: Pivska Pramenka (PP), Sora (SO), Bardoka (BA), Zetska Zuja (ZZ), Sjenicka sheep (SJ), Dalmatian Pramenka (DPS), Dubrovnik Sheep (DRS), Istrian Sheep (ISS), Pag Island Sheep (PIS), Shkodrane (SKO), Ruda (RUD), Lara (LAR), Chios (CHI), Lipska (LIP), Ovchepolean (OVC), Privorska (PVO), Dubska (DUB), Belakrajina (BKR), Bovec (BOV), Karakachanska (KCH), Hungarian Tshigaia (TSIH), Romanian Tsigaia (TSIR), Altamurana (ALT), Gentlie di Puglia (GEN), Sopravissana (SOP), Leccese (LEC), East Friesian White (EFW), Merinolandschaf (MLA), Romanov (ROM), and Asian Muflon (AMF).


Table 1.
Genetic diversity and effective population sizes within the Montenegrin sheep breeds.
| Breed | N | Ho ± SE | He ± SE | Ar | FIS (CI95%) | Ne0 | Ne5 |
|---|---|---|---|---|---|---|---|
| Bardoka (BA) | 29 | 0.397 ± 0.001 | 0.417 ± 0.001 | 2.074 | 0.049 (0.046 to 0.051) | 81 | 684 |
| Pivska Pramenka (PP) | 30 | 0.411 ± 0.001 | 0.423 ± 0.001 | 2.062 | 0.029 (0.025 to 0.032) | 72 | 72 |
| Sjenicka Sheep (SJ) | 28 | 0.414 ± 0.001 | 0.421 ± 0.001 | 2.145 | 0.016 (0.012 to 0.019) | 47 | 79 |
| Sora (SO) | 23 | 0.392 ± 0.001 | 0.409 ± 0.001 | 2.101 | 0.042 (0.038 to 0.045) | 25 | 5003 |
| Zetska Zuja (ZZ) | 29 | 0.385 ± 0.001 | 0.386 ± 0.001 | 2.136 | 0.001 (−0.002 to 0.0047) | 32 | 92 |
N, number of individuals; Ho, observed heterozygosity; He, expected heterozygosity; Ar, rarified allelic richness; FIS, Wright’s inbreeding coefficient; CI95%, lower and upper 95% confidence interval for inbreeding coefficient; Ne0, current effective population size; Ne5, effective population size estimated for five generations ago.
Disclaimer/Publisher’s Note: The statements, opinions and data contained in all publications are solely those of the individual author(s) and contributor(s) and not of MDPI and/or the editor(s). MDPI and/or the editor(s) disclaim responsibility for any injury to people or property resulting from any ideas, methods, instructions or products referred to in the content. |
© 2023 by the authors. Licensee MDPI, Basel, Switzerland. This article is an open access article distributed under the terms and conditions of the Creative Commons Attribution (CC BY) license (https://creativecommons.org/licenses/by/4.0/).
Share and Cite
MDPI and ACS Style
Djokic, M.; Drzaic, I.; Shihabi, M.; Markovic, B.; Cubric-Curik, V. Genomic Diversity Analyses of Some Indigenous Montenegrin Sheep Populations. Diversity 2023, 15, 640. https://doi.org/10.3390/d15050640
AMA Style
Djokic M, Drzaic I, Shihabi M, Markovic B, Cubric-Curik V. Genomic Diversity Analyses of Some Indigenous Montenegrin Sheep Populations. Diversity. 2023; 15(5):640. https://doi.org/10.3390/d15050640
Chicago/Turabian StyleDjokic, Milena, Ivana Drzaic, Mario Shihabi, Bozidarka Markovic, and Vlatka Cubric-Curik. 2023. "Genomic Diversity Analyses of Some Indigenous Montenegrin Sheep Populations" Diversity 15, no. 5: 640. https://doi.org/10.3390/d15050640
Note that from the first issue of 2016, this journal uses article numbers instead of page numbers. See further details here.