Article

Free-Living and Particle-Associated Microbial Communities of Lake Baikal Differ by Season and Nutrient Intake

Limnological Institute, Siberian Branch of the Russian Academy of Sciences, Ulan-Batorskaya Str., 3, 664033 Irkutsk, Russia
*
Author to whom correspondence should be addressed.
Diversity 2023, 15(4), 572; https://doi.org/10.3390/d15040572
Submission received: 27 January 2023 / Revised: 14 April 2023 / Accepted: 15 April 2023 / Published: 18 April 2023
(This article belongs to the Special Issue Diversity and Ecology of Freshwater Lake Microbial Communities)

Abstract

:
In an aquatic ecosystem, the supply of nutrients is essential for the biogeochemical cycle, and it affects the taxonomic composition of the microbial communities. Here, by using high-throughput sequencing (HTS) of the 16S and 18S rRNA gene fragments, we compared free-living (FL) and particle-associated (PA) bacterial communities and microeukaryotic communities in the areas with different nutrient intakes in freshwater Lake Baikal during the ice-covered and summer periods. Samples were taken at the inflow of the Selenga River, which is the main tributary of the lake, and at several established coastal research stations. The metabolic potential of the bacterial communities was predicted using PICRUSt. Differences were found in both FL and PA communities of the river mouth compared to the photic zone of the lake. The composition of FL communities was significantly different between the sampling sites in the ice-covered period, which is most likely influenced by different hydrochemical conditions. In contrast, the PA communities were more similar during the ice-covered period, but they changed considerably from spring to summer and their diversity increased. The diversity of the microeukaryotic communities also increased in summer, which may have contributed to the increase in bacterial diversity. In co-occurrence networks analysis, the number of interconnected bacterial OTUs in FL exceeded those for PA. The FL communities were dominated by Actinobacteriota, while the major PA OTUs belonged to a mixed cluster, which were mainly assigned to the phyla Bacteroidota and Verrucomicrobiota. As a result, PA communities were enriched in pathways responsible for the metabolism of sulfur, fucose, cellulose and urea. Our results confirm the difference between the FL and PA bacterial communities in Lake Baikal. These results also highlight the complex pattern of interactions between bacteria and microeukaryotes in a natural freshwater ecosystem across spatial and temporal scales.

1. Introduction

In aquatic ecosystems, bacteria play an essential role in the cycling of matter; in particular, they are capable of consuming organic matter synthesized by primary producers and passing this matter on to the next trophic levels [1,2]. According to their lifestyle, aquatic bacteria can be divided into particle-associated (PA) and free-living (FL) forms [3,4,5]. PA communities settle on algal cells and non-living particulate matter (either organic or inorganic), thus forming aggregates [5], while FL bacteria inhabit the surrounding water [4]. The composition of FL and PA bacterial communities of different habitats has been thoroughly investigated using HTS, including lakes [6,7,8], rivers [9,10,11], estuaries and ocean coasts [12,13,14,15,16,17] and sea [18]. In marine ecosystems, PA communities are dominated by Bacteroidota, Cyanobacteria and Gammaproteobacteria, while FL communities are mostly dominated by Alphaproteobacteria [14,19,20]. A study of PA and FL bacterial communities during a massive bloom of cyanobacteria showed changes in the composition of both communities during the development of cyanobacteria [21]. It was shown that both FL and PA communities undergo seasonal succession [18,22,23,24], due to the changes in both abiotic (temperature, water mixing, hydrochemistry, etc.) and biotic (phytoplankton, protozoa, zooplankton and virioplankton) environmental factors.
The oligotrophic freshwater Lake Baikal mostly contains nutrients in dissolved form, rather than as suspended particles [25]. Their concentrations depend mostly on the growth of micro- and macro-organisms, which are in turn affected by seasonal hydrological changes, such as temperature stratification, mixing and water dynamics [26,27,28,29]. Most of the particulate organic matter is allocthonously delivered by the lake tributaries; the largest one is the Selenga River, located on the Eastern coast of the middle basin of Lake Baikal. Water of the Selenga River is distinct from the lake water in hydrological parameters [30] and chemical composition [31,32,33], as well as in the composition of phytoplankton [34] and bacterioplankton [35]. The Selenga River is characterized by a high concentration of biogenic elements, such as silicon and phosphorus [32,33], as well as organic matter [31].
For the last decade, microbial communities of Lake Baikal have been actively studied using 16S rRNA gene metabarcoding. Research studies aimed to explore different habitats: photic layer [36,37], sediments [38,39,40,41], sub-ice [42,43], rivers and estuarial waters [44]. One of the latest works was focused on the seasonal succession of bacterial and microeukaryotic pelagic communities of the photic layer [45], and showed the dynamics of the community structure from March to September. Correlations between some bacterial taxa and microalgae species were revealed for communities of the photic layer in spring [46]. In addition, it was shown that heterotrophic bacteria were positively correlated with diatoms Aulacoseira baicalensis (Wisłouch) Simonsen and Nitzschia graciliformis Lange-Bertalot & Simonsen, and negatively correlated with green alga Koliela longiseta (Vischer) Hindák. Our previous work [47] has shown the difference between the FL and PA bacterial communities in different ecotopes: on the bottom surface of the ice and in the water column. Additionally, the influence of the concentration of the organic matter on the composition of FL and PA communities was revealed. A separate study of the FL and PA bacteria can produce a deeper insight into the functioning of the community and the ways in which it changes, since these two sub-communities differ in their metabolic activities [48,49].
In this work, we aimed to study the effect of the Selenga River, the main tributary of Lake Baikal, on the structure of FL and PA communities in the lake. Further, here we will discuss how (and whether) FL and PA communities change between seasons, along with the changing composition of microeukaryotic plankton. We hypothesize that the free-living component of the bacterial community should be more stable, or change slowly, while PA communities will be more sensitive to the environmental changes in an oligotrophic freshwater lake, such as Lake Baikal.

2. Materials and Methods

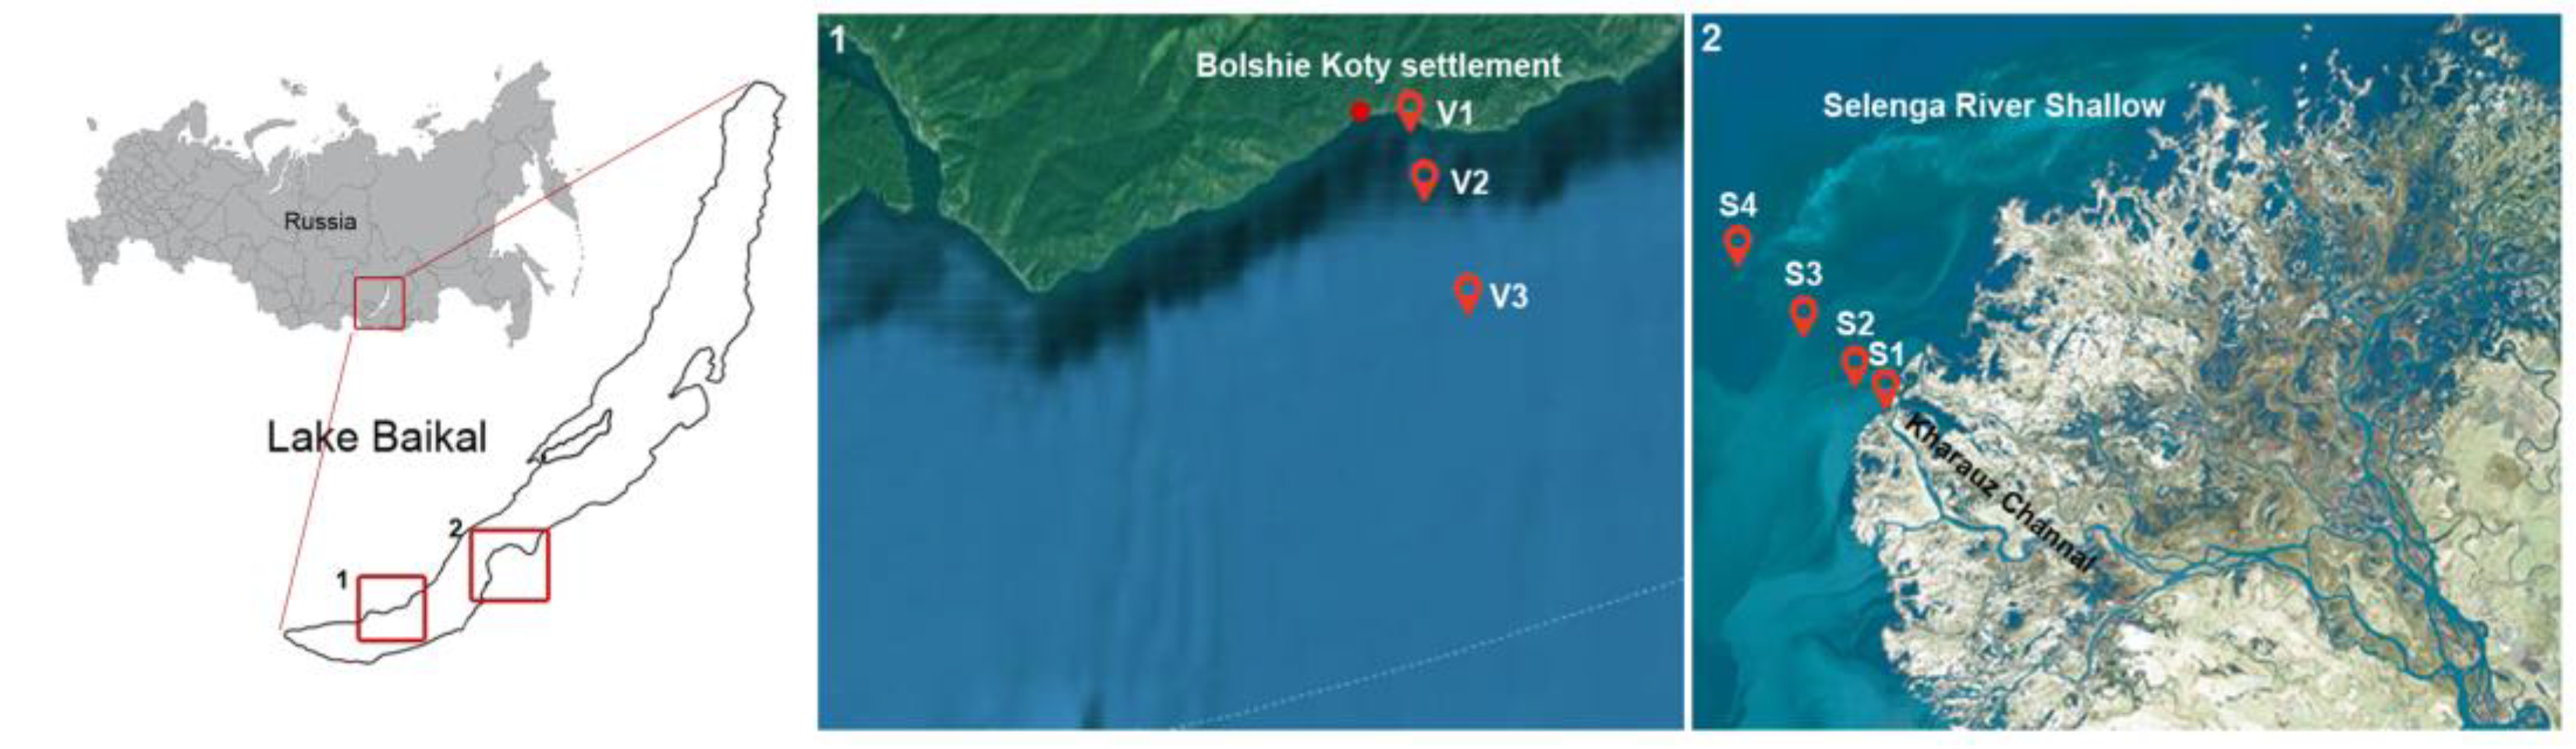
2.1. Site Description, Sampling and Environmental Parameters

Water samples were taken during the ice cover and summer periods in the southern and middle basins of Lake Baikal. The sampling was carried out at three stations of 50, 200, and 1000 m away from the shore near Bolshie Koty settlement (Varnachka area) in April and July 2018, and at the Selenga Shallow Waters at four stations of 0, 1, 3, and 5 km away from the Selenga River mouth (Kharauz channel) in March 2019 (Figure 1). Samples were taken from the 0, 3, 5, 7, 10, and 30 m layers (Varnachka area), and from the 0, 4, 10, 15, 20, and 30 m layers (Selenga River Shallow) using Niskin bottles (Table S1). The ice thickness and water temperature were measured during sampling. The chemical composition was examined according to routine procedures used in freshwater chemistry [50,51]; pH was measured using a pH-meter Expert-001 (Russia); and the electrical conductivity of water (Ec) was measured with a conductometer Expert-002 (Russia). Dissolved oxygen concentration was measured by the Winkler method. Nutrients were measured in filtered and unfiltered samples. To determine the dissolved fraction, the measurements were carried out in water filtered through 0.45-μm pore-size membrane filters (Advantec, Tokyo, Japan). The difference between the content in unfiltered and filtered water was taken as the content in suspension. The concentration of biogenic elements was determined by a spectrophotometer UNICO-2100 (UNICO, Dayton, NJ, USA): nitrites with Griess reagent, nitrates with sodium salicylate, ammonia nitrogen by the indophenol method and phosphates by the Deniges-Atkins method, using stannous chloride as the reducing agent. Silicic acid content was analyzed by a spectrophotometric method based on measuring the color intensity of the yellow silicomolybdic heteropolyacid. Total phosphorus and nitrogen were measured after high-temperature persulfate oxidation with spectrophotometer UNICO-2100; total organic matter (TOM) was analyzed by methods of bichromate oxidation.
For identification and quantification of phytoplankton, 500 mL of each sample were fixed by Lugol solution. Microalgae were counted using the Axiostar Plus optical microscope (Zeiss, Oberkochen, Germany). Total phytoplankton abundance (TPA) and total phytoplankton biomass (TPB) were calculated as described in previous work [47]. For identification of microalgae composition, water samples were filtered through 0.8-μm filters (Whatman Part of GE HealthCare, Chicago, IL, USA), then placed on stubs for scanning electron microscopy (SEM), and coated with colloidal gold in an SDC 004 vacuum evaporator (BALZERS UNION, Balzers, Liechtenstein). Identification of the microalgal species was performed using SEM FEI Quanta 200 (FEI, Hillsboro, OR, USA).

2.2. DNA Extraction and High-Throughput Sequencing

We used 5 L of water from each sample for DNA extraction. Free-living and particle-associated bacterial fractions were separated by filtration [52]. The 5-μm pore-size filter (“REATREK-Filter”, Obninsk-3, Russia) was firstly used to collect the fraction of particles with a size above >5 μm, which included the PA bacterial community component. Then, the filtrate was passed through the 0.22-μm pore-size filter (“REATREK-Filter”, Obninsk-3, Russia) to collect the fraction, with a size range between 0.22 and 5 μm, which included the FL bacterial community component. Collected biological material was washed away from the filters with TE buffer (10 mM Tris–HCl, pH 7.5, 1 mM EDTA) into sterile bottles and preserved at –80 °C until DNA extraction. A piece of filter from each sample was also preserved for a SEM study (Figure S1).
Total DNA was extracted from the size-fractionated samples with lysozyme (1 mg/mL), proteinase K, 10% SDS and phenol:chloroform:isoamyl alcohol mixture (25:24:1), as previously described [53]. DNA extracts from 32 FL and 32 PA samples (Supporting Information Table S1) were analyzed by HTS for bacterial diversity (V3–V4 region of 16S rRNA gene) using the primer pair U341F (CCTACGGGRSGCAGCAG) and U785R (GGACTACCVGGGTATCTAAKCC) [54]; and, for eukaryotic diversity, (V8–V9 region of 18S rRNA gene) of 32 PA samples were analyzed using the primer pair V8f (ATAACAGGTCTGTGATGCCCT) and 1510R (CCTTCYGCAGGTTCACCTA) [55]. Sequencing was done by the Core Centrum “Genomic Technologies, Proteomics and Cell Biology” of ARRIAM (Saint-Petersburg, Russia), using the MiSeq Illumina Genome Sequencer system with the Reagent Kit v3 to obtain 300 bp paired-end reads.

2.3. HTS Data Analysis and Quality Control (QC)

Analysis of sequencing data was performed with usearch v.10 [56], vsearch v.2.9.1 [57] and mothur v.1.43.0 [58]. Raw reads were merged, primer sequences were truncated, and contigs were filtered by expected error threshold 1.0 with usearch (option -fastq_maxee 1.0). Next, sequences were clustered with vsearch command “–cluster_size” at the 0.97 identity threshold, and OTUs with less than two reads were discarded. OTU centroids were subjected to chimera filtering by UCHIME-denovo, followed by UCHIME-reference of vsearch. Finally, a community composition matrix was generated by remapping of merged and quality-filtered reads to the chimera-free set of OTUs with an identity threshold of 0.97 (vsearch command “-usearch_global”). OTU sequences were taxonomically classified using SILVA v.138 (Bremen, Germany) in Mothur v.1.43.0, with the probability cutoff set to 80 and further filtered by taxonomy to drop chloroplast-specific, mitochondria-specific and multicellular eukaryotic OTUs, as well as OTUs with Kingdom = “unknown”. To clarify the taxonomic affiliation of eukaryotic OTUs, an analysis of nucleotide sequences was carried out using BLASTN software and the GenBank database.

2.4. Statistical Analyses and Data Visualization

Further statistical analyses were performed in R. The rarefaction curves, ACE index (non-parametric species richness estimators), and Shannon, Simpson, and inverse Simpson indices were calculated to measure the alpha diversity. OTUs with a total abundance below 0.01% were excluded from the community composition matrix prior to these calculations.
One-way ANOVA and Kruskal-Wallis statistical tests were used to examine the impact of independent factor variables on the discrete/continuous environmental variables and alpha-diversity metrics associated with the microeukaryotic community profiles. The Tukey HSD post-hoc test was used to check the difference between the distribution of a variable if more than two categories were tested by ANOVA. The pairwise Tukey HSD test p-value was reported is this case. Two-way ANOVA was used to estimate the main effect of two factor models, as well as the effect of their interaction. We calculated two-way ANOVA statistics with R function “Anova” from package “car”, using the “type-III” test for experiments with unbalanced design. The p-values, which were obtained by testing the independent factor variable (or two of them) versus a set of dependent variables (fifteen environmental variables and five alpha-diversity metrics), were adjusted using the false discovery rate (FDR) procedure. Both raw and adjusted p-values were reported.
Exploratory analyses of community composition were performed using vegan v.2.5-6 [59], phyloseq [60], pvclust [61], pheatmap [62] and ggh4x [63]. For exploratory analyses, such as PCoA, RDA, and heatmaps, OTUs having relative abundance above 0.1% were plotted (unless another relative abundance threshold specified in figure). OTU counts were transformed with log(x + 1) and subjected to the transformation-based principal coordinate analysis (tb-PCoA). The pairwise distance matrix computed with the Bray-Curtis dissimilarity index was used for clustering community profiles by UPGMA in heatmaps. The transformation-based redundancy analysis (tb-RDA) was used to evaluate the impact of environmental factors on species composition. OTUs having relative abundance above 0.1% were selected to produce a count matrix. OTU counts were transformed with log(x + 1) and subjected to tb-RDA. PERMANOVA was used to compare the groups of profiles by independent factor variables. The R-functions vegan:adonis2 and pairwiseAdonis:pairwise.adonis2 called for one-factor or two-factor combinations with the number of permutations being 9999.
Explanatory variables were chosen by a “forward selection” approach, followed by further filtering on the p-value and the impact of the model ability to explain the total variance. The backward elimination strategy was also employed, and its results generally agreed with the forward selection approach. The DESeq2 package [64] was used to evaluate the significance of OTU abundance differences between the groups of samples. The raw community composition matrix of non-transformed OTU counts, which was generated by the QC/clustering pipeline described above (usearch-vsearch-taxonomic filtering), was used as DESeq2 input with lifestyle (FL/PA levels) as a factor variable to group communities. The phyloseq object was transformed to a DESeq2 object, followed by estimation of size factors with geometric means of OTU counts, “local” dispersion estimate, and computation of Wald test statistics. For testing of OTU differential abundance, the FDR-adjusted p-value and log-fold change (LFC) thresholds were set to 0.01 and log2 (1.5), respectively.
To analyze OTU co-occurrence, the compositional matrices of 16S- and 18S-rRNA gene amplicons were filtered to contain OTUs with the sample-wise presence above 25% (i.e., at least one-fourth of profiles to have non-zero counts) and minimum taxon abundance of 50/100 reads for 16S/18S-rRNA gene datasets, respectively. Next, a set of co-occurrence graphs was computed with four methods: SpiecEasi [65], MAGMA [66], Zi-LN [67] and SparcCC [68]. The target edge number for a graph was set to 1200/500 for 16S/18S-rRNA gene datasets, respectively. Graphs were compared to each other to share a maximum number of edges between three out of five methods. In both cases, graphs generated by MAGMA, SpiecEasi and Zi-LN methods shared maximum numbers: 494 for 16S rRNA, and 291 for 18S rRNA gene datasets. These subsets of the shared edges were used to construct the final 16S/18S rRNA gene co-occurrence graphs, and to overlay the results of differential abundance analysis. The R-code to perform co-occurrence analysis is available on GitHub: https://github.com/yuragal/FL-PA-co-occurence-networks (accessed on 10 March 2023).
The functional prediction analysis of the bacterial communities was performed for the 16S rRNA gene profiles using PICRUSt2 [69]. To investigate the potential functional differences between predicted KEGG KO, EC and MetaCyc pathway annotations, the abundance matrices were generated in PICRUSt2 and subjected to statistical analysis with ALDEx v.1.18.0 [70], with the number of Monte-Carlo simulations set to 500, and grouping the abundance profiles into FL and PA categories.

3. Results

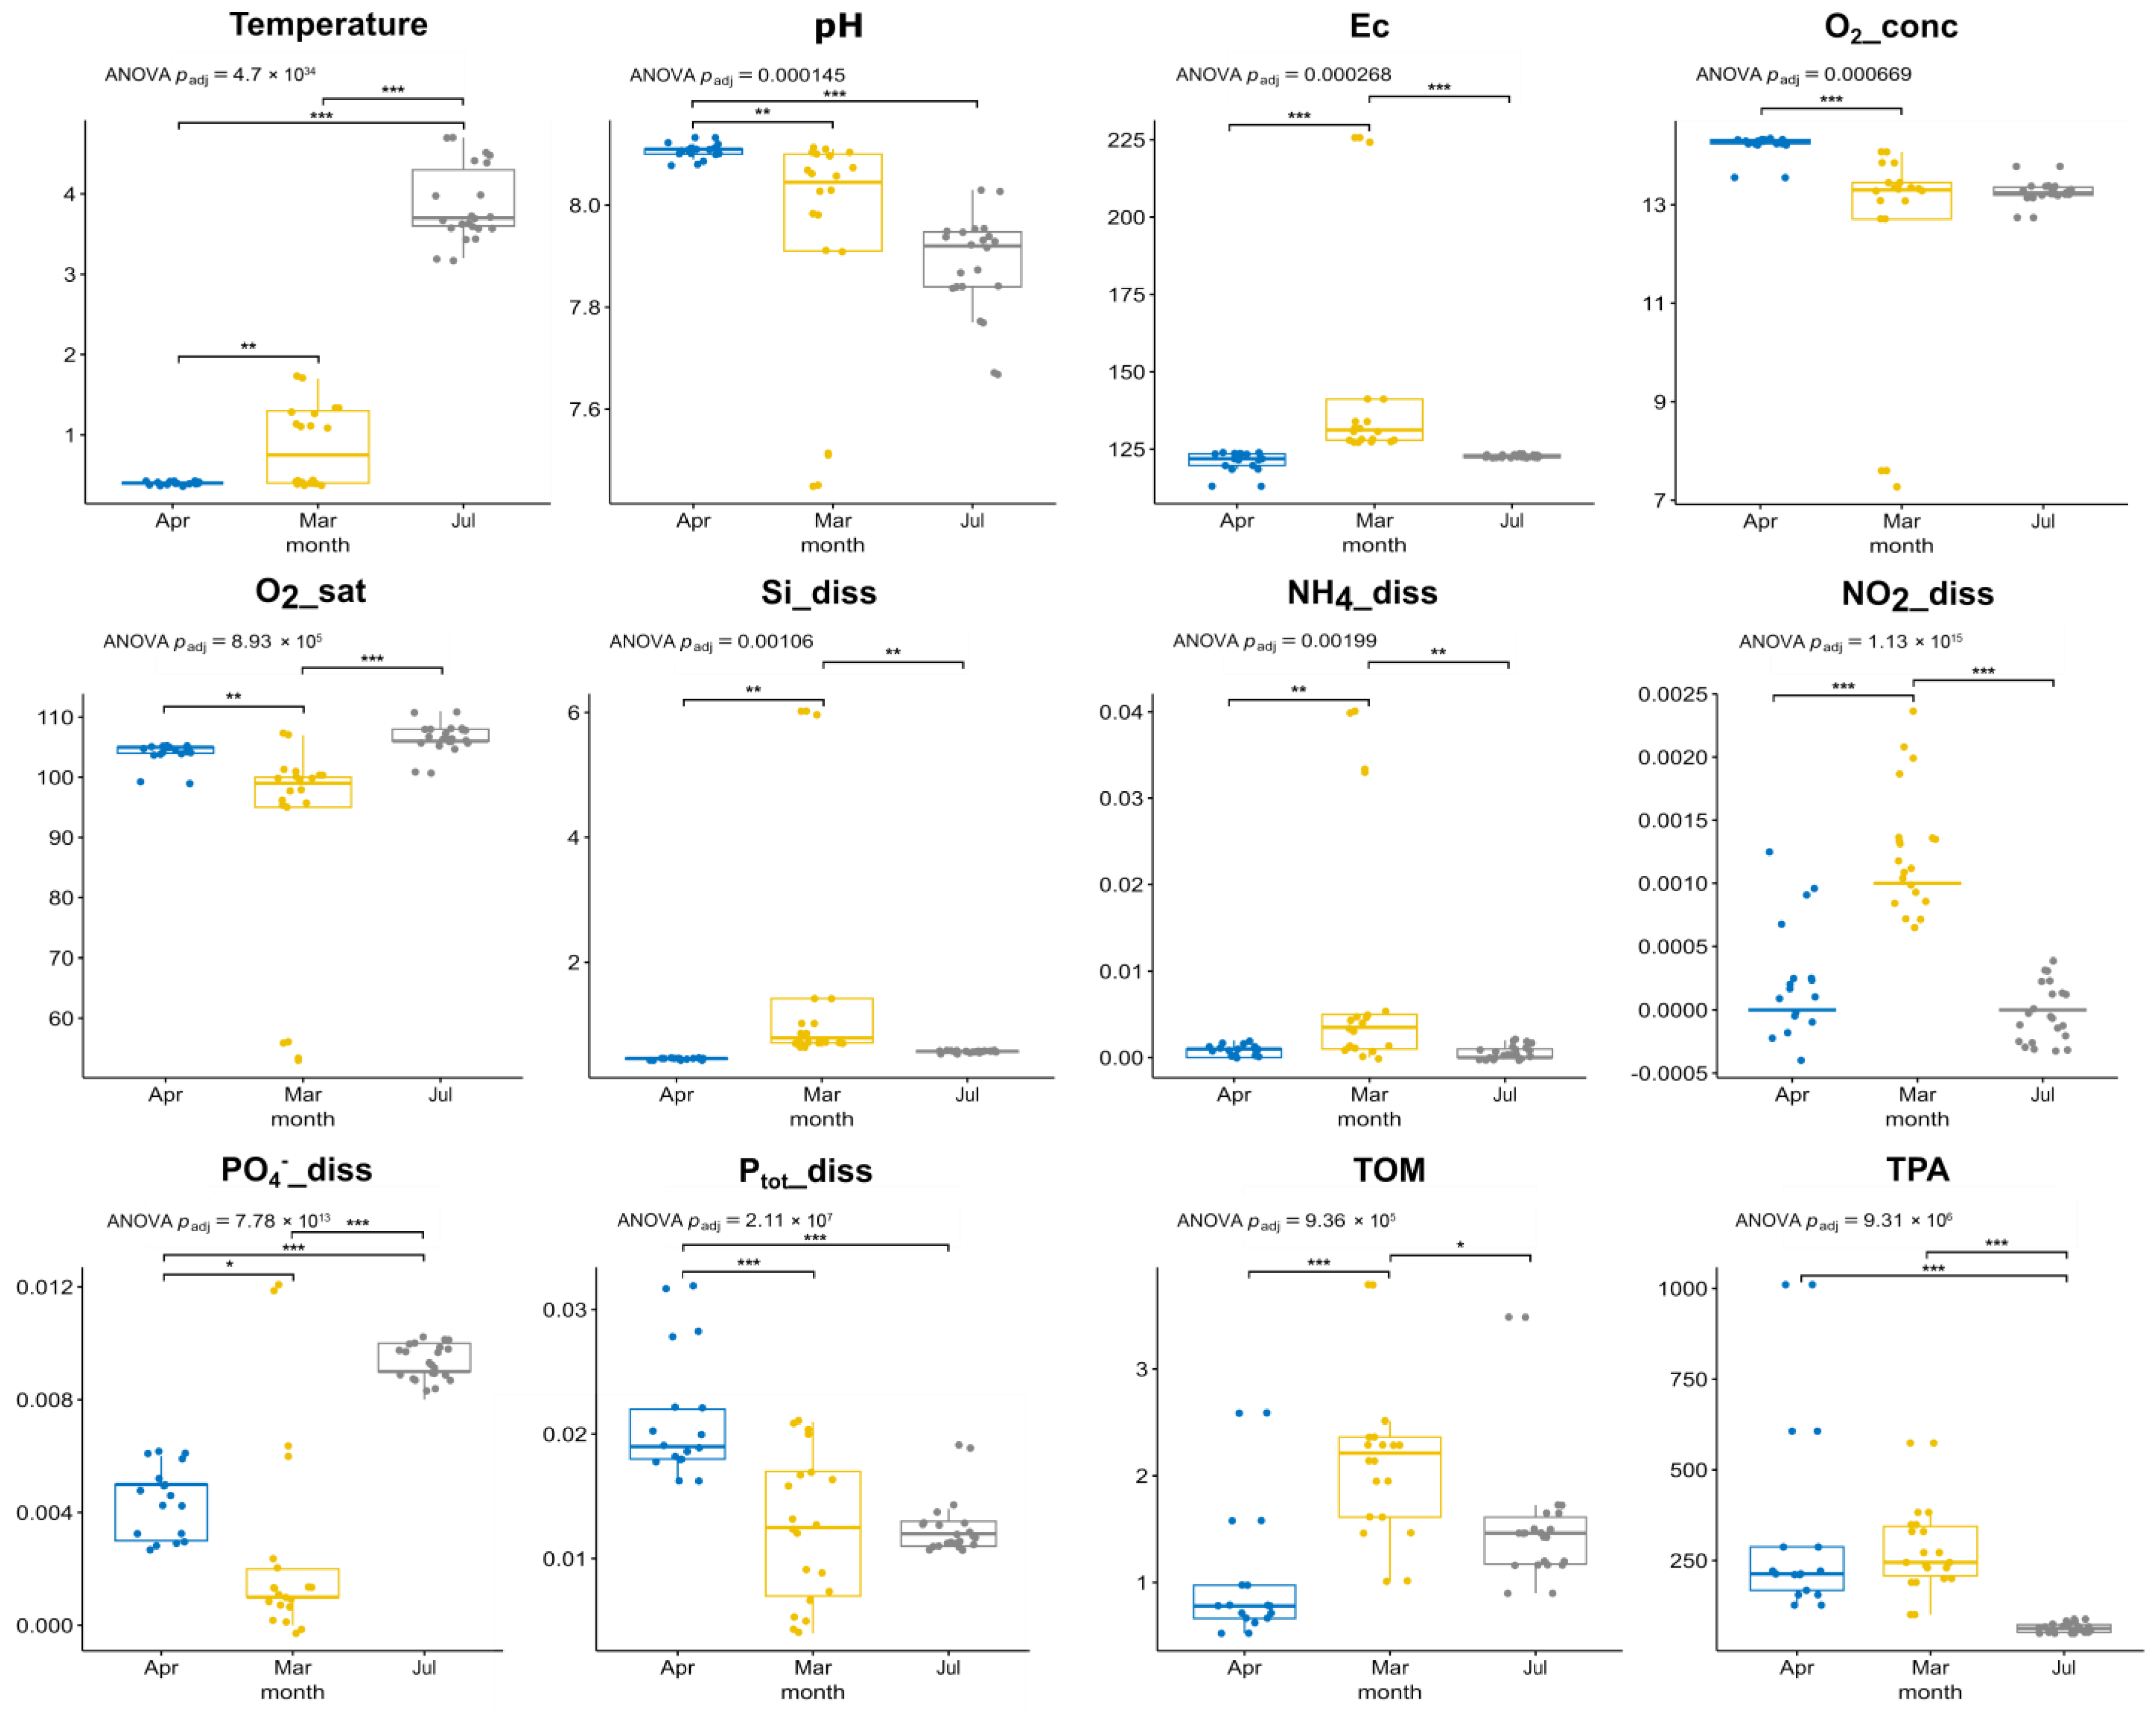
3.1. Environmental Parameters, Phytoplankton Abundance and Diversity, According to Microscopy

We observed significant differences in the physicochemical parameters of water, depending on the sampling area and season (Figure 2; Table 1). Water temperature was one of the significant seasonal factors. During the ice period, near the Bolshie Koty settlement, the largest values of pH and a high oxygen concentration (from 13.55 mg/L to 14.35 mg/L) were noted. Concentrations of dissolved Si, NH4+, NO2, TOM and Ec were higher at the Selenga Shallow compared to Varnachka in both seasons (Figure 2). The highest concentration of the dissolved Si was at the river mouth (6.02 mg/L) (Table S1); this parameter was only between 0.64 and 1.02 mg/L in the water column of Lake Baikal. Concentrations of biogenic elements in Baikal water at the Selenga Shallow were mostly lower than in the river. In July 2018, the spread of mixed cold water was shown. At that time, the hydrochemical parameters were similar between all stations (Figure S2; Table S1). The low temperature (3.2–4.7 °C) and elevated concentrations of nitrate nitrogen and phosphates indicated the influx of deep pelagic water into the coastal area. Ammonium and nitrites were not observed in summer.
TPA was higher in the ice cover period compared to the summer (Figure 2). The highest TPA was observed at the station V1UI at a depth of 0 m during the under-ice period, accounting for 1.01 × 10⁶ cells/L (Figure S1, Table S1). According to microscopy, during the ice period, the dinoflagellate Gymnodinium baicalense N.L. Antipova dominated at the surface, while the diatom alga Ulnaria acus (Kützing) Aboal became more common in deeper layers in the Varnachka area (Figure S1). In summer, the dominant taxa were the green alga Monoraphidium griffithii (Berkeley) Komárková-Legnerová and the chrysophyte Dinobryon cylindricum O.E. Imhof. Diatoms were also a part of these communities, but in a smaller proportion than during the ice period. There was a change in the dominant groups of microalgae in the ice-covered period and in summer. During the ice period, one could see a difference in the composition of phytoplankton of surface and deep waters, which was not observed in summer. In contrast, Nitzschia graciliformis and benthic diatom algae dominated at the Selenga mouth. Further away from the mouth, abundance of dinoflagellates G. baicalense and Peridinium euryceps Rengefors & Barbara Meyer increased in the communities; M. griffithii and the cryptophyte Rhodomonas pusilla (Bachmann) Javornický were observed in deep sampling layers.

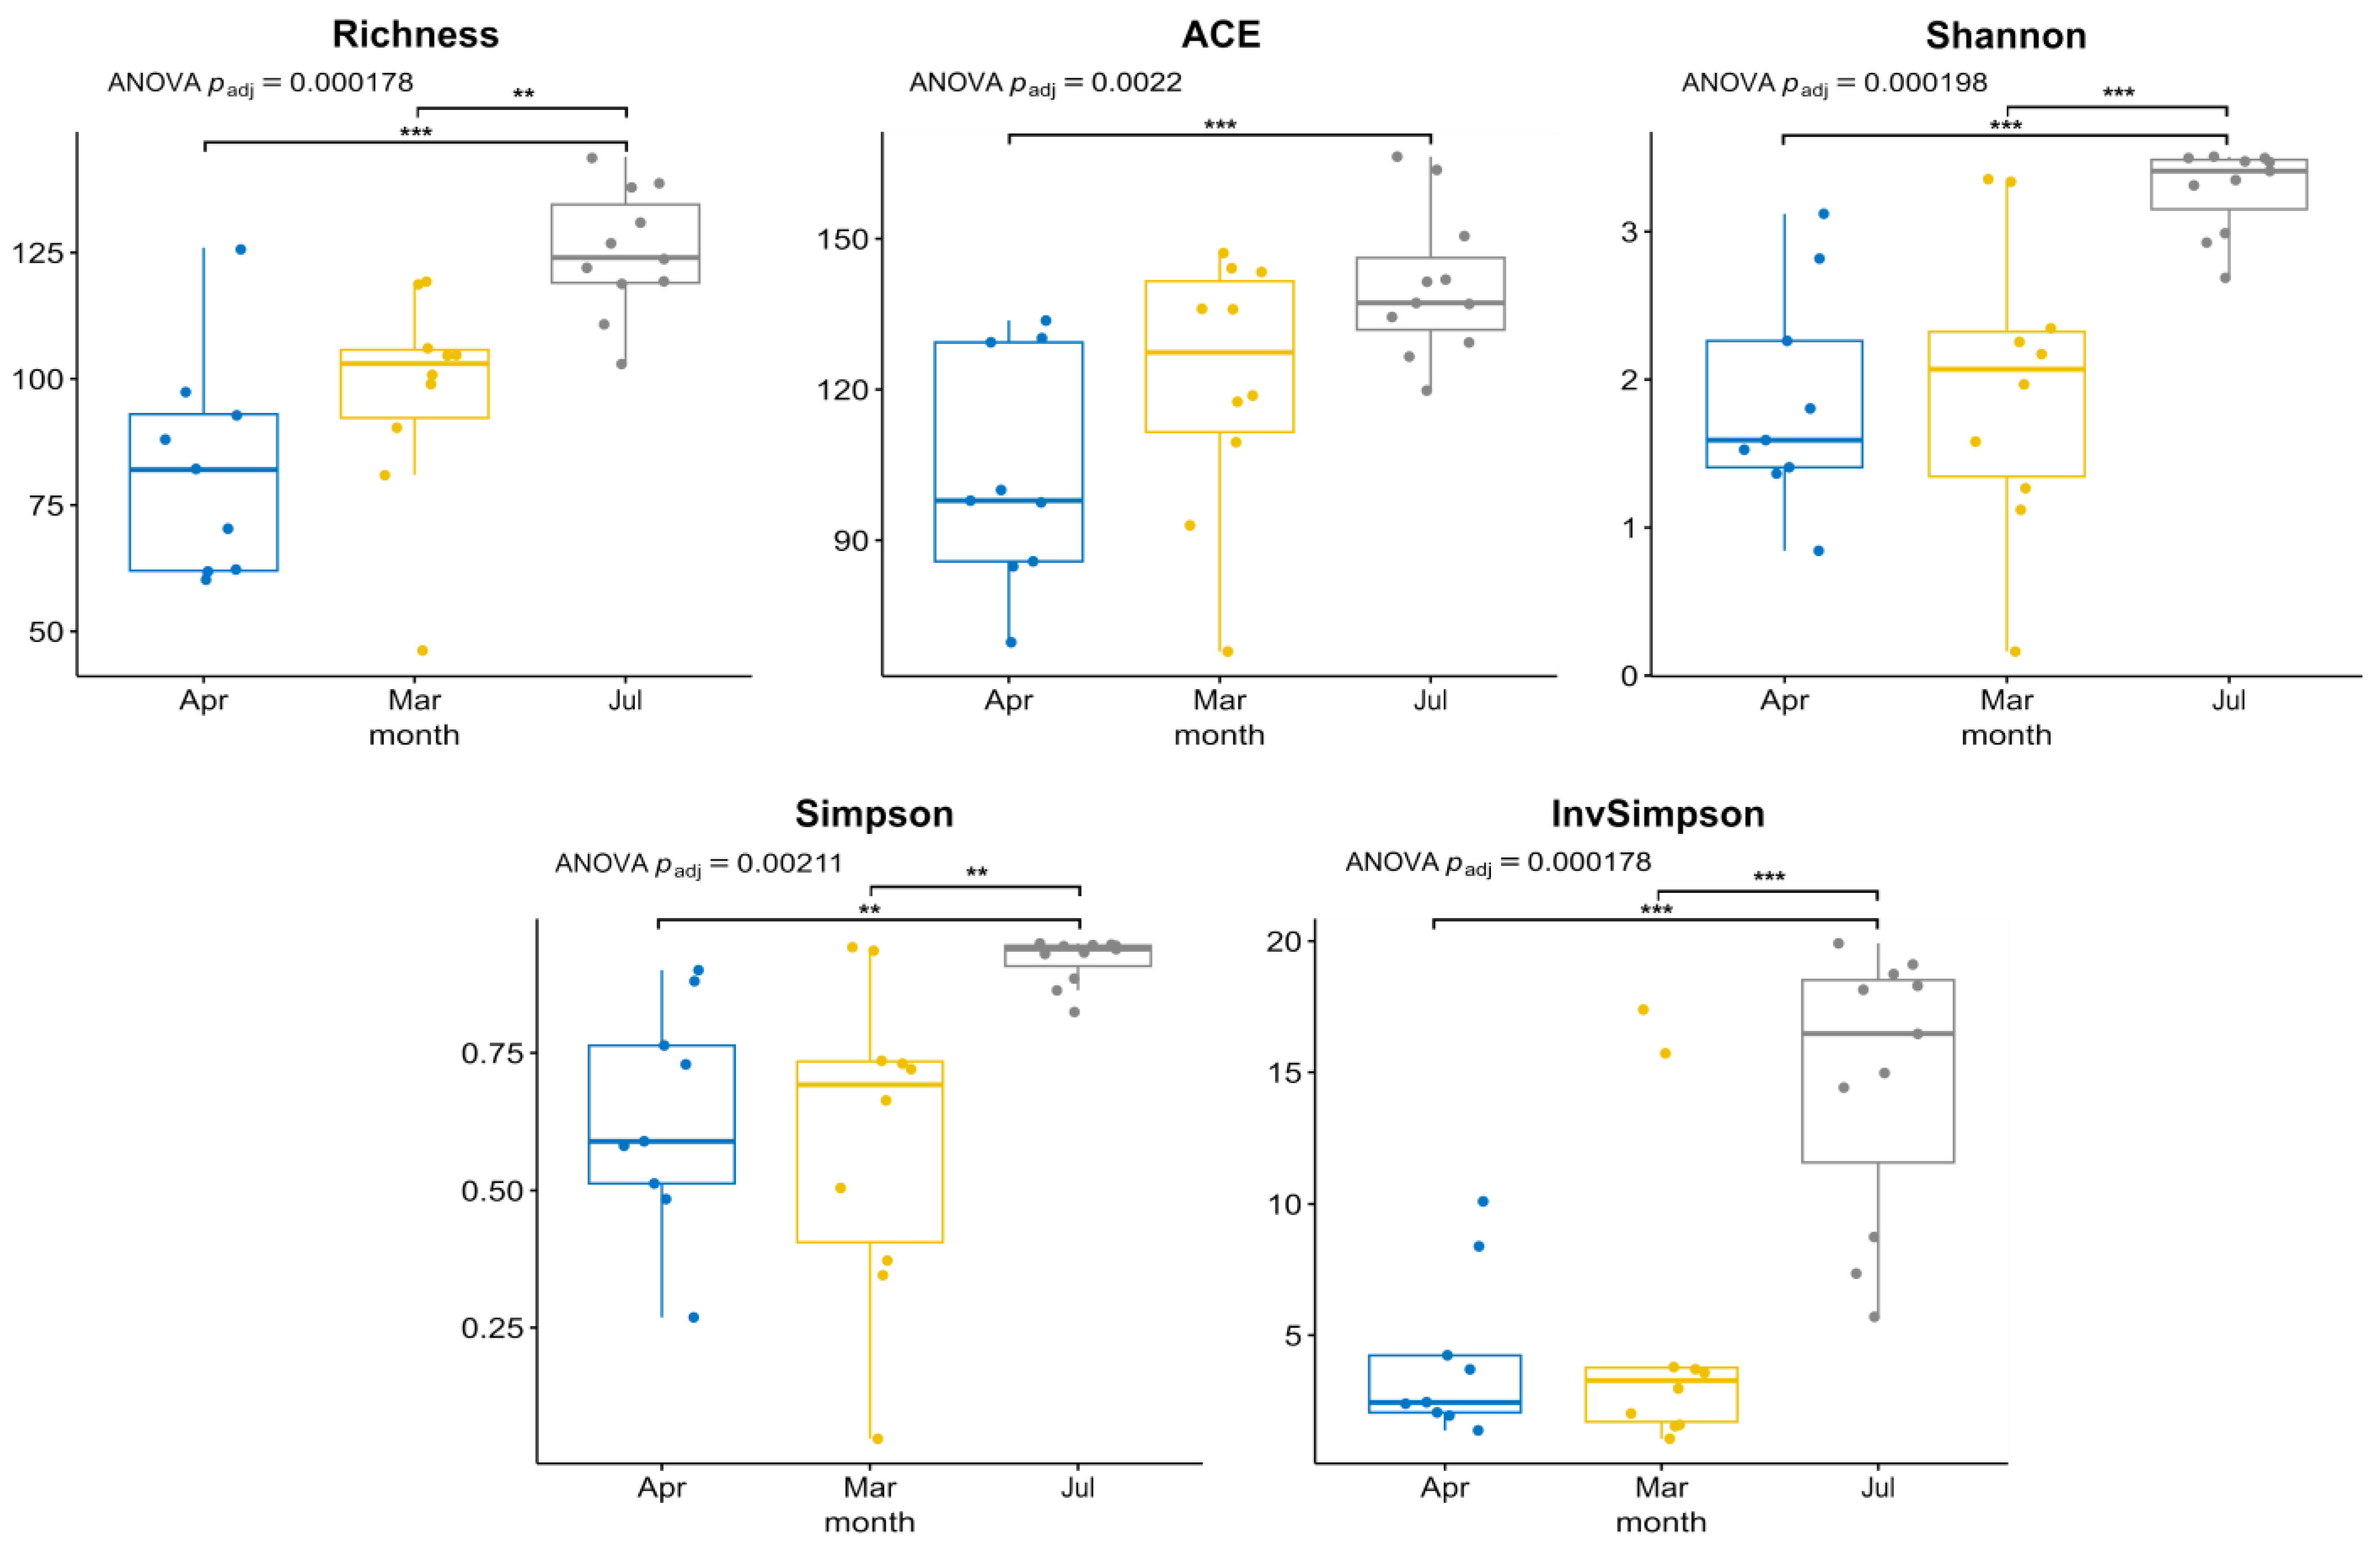
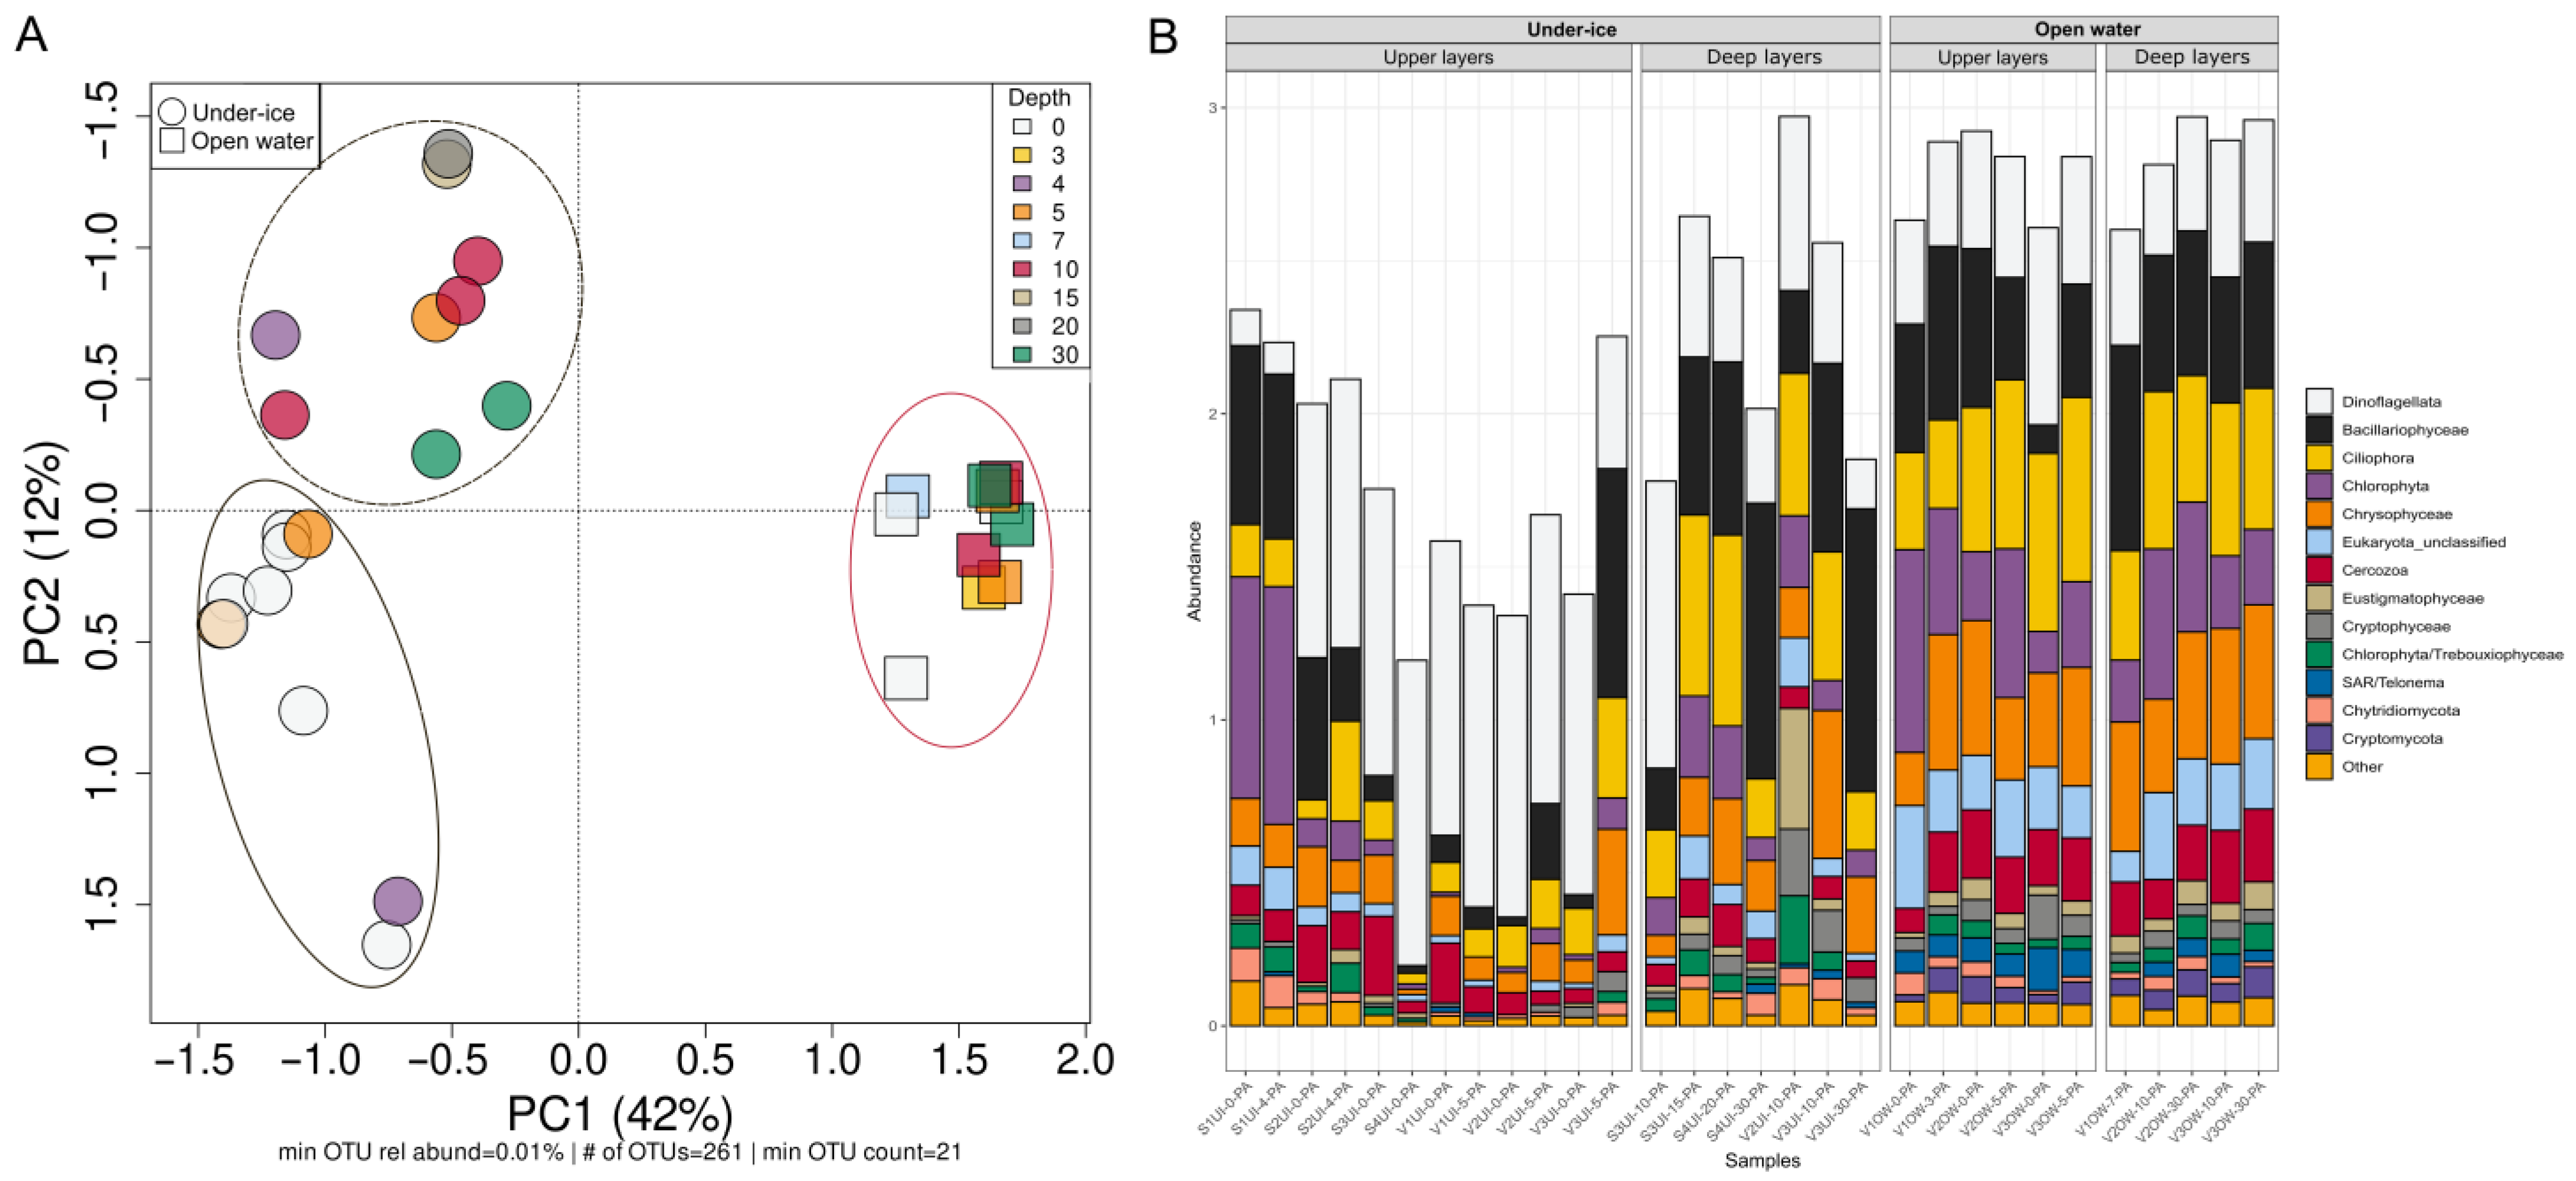
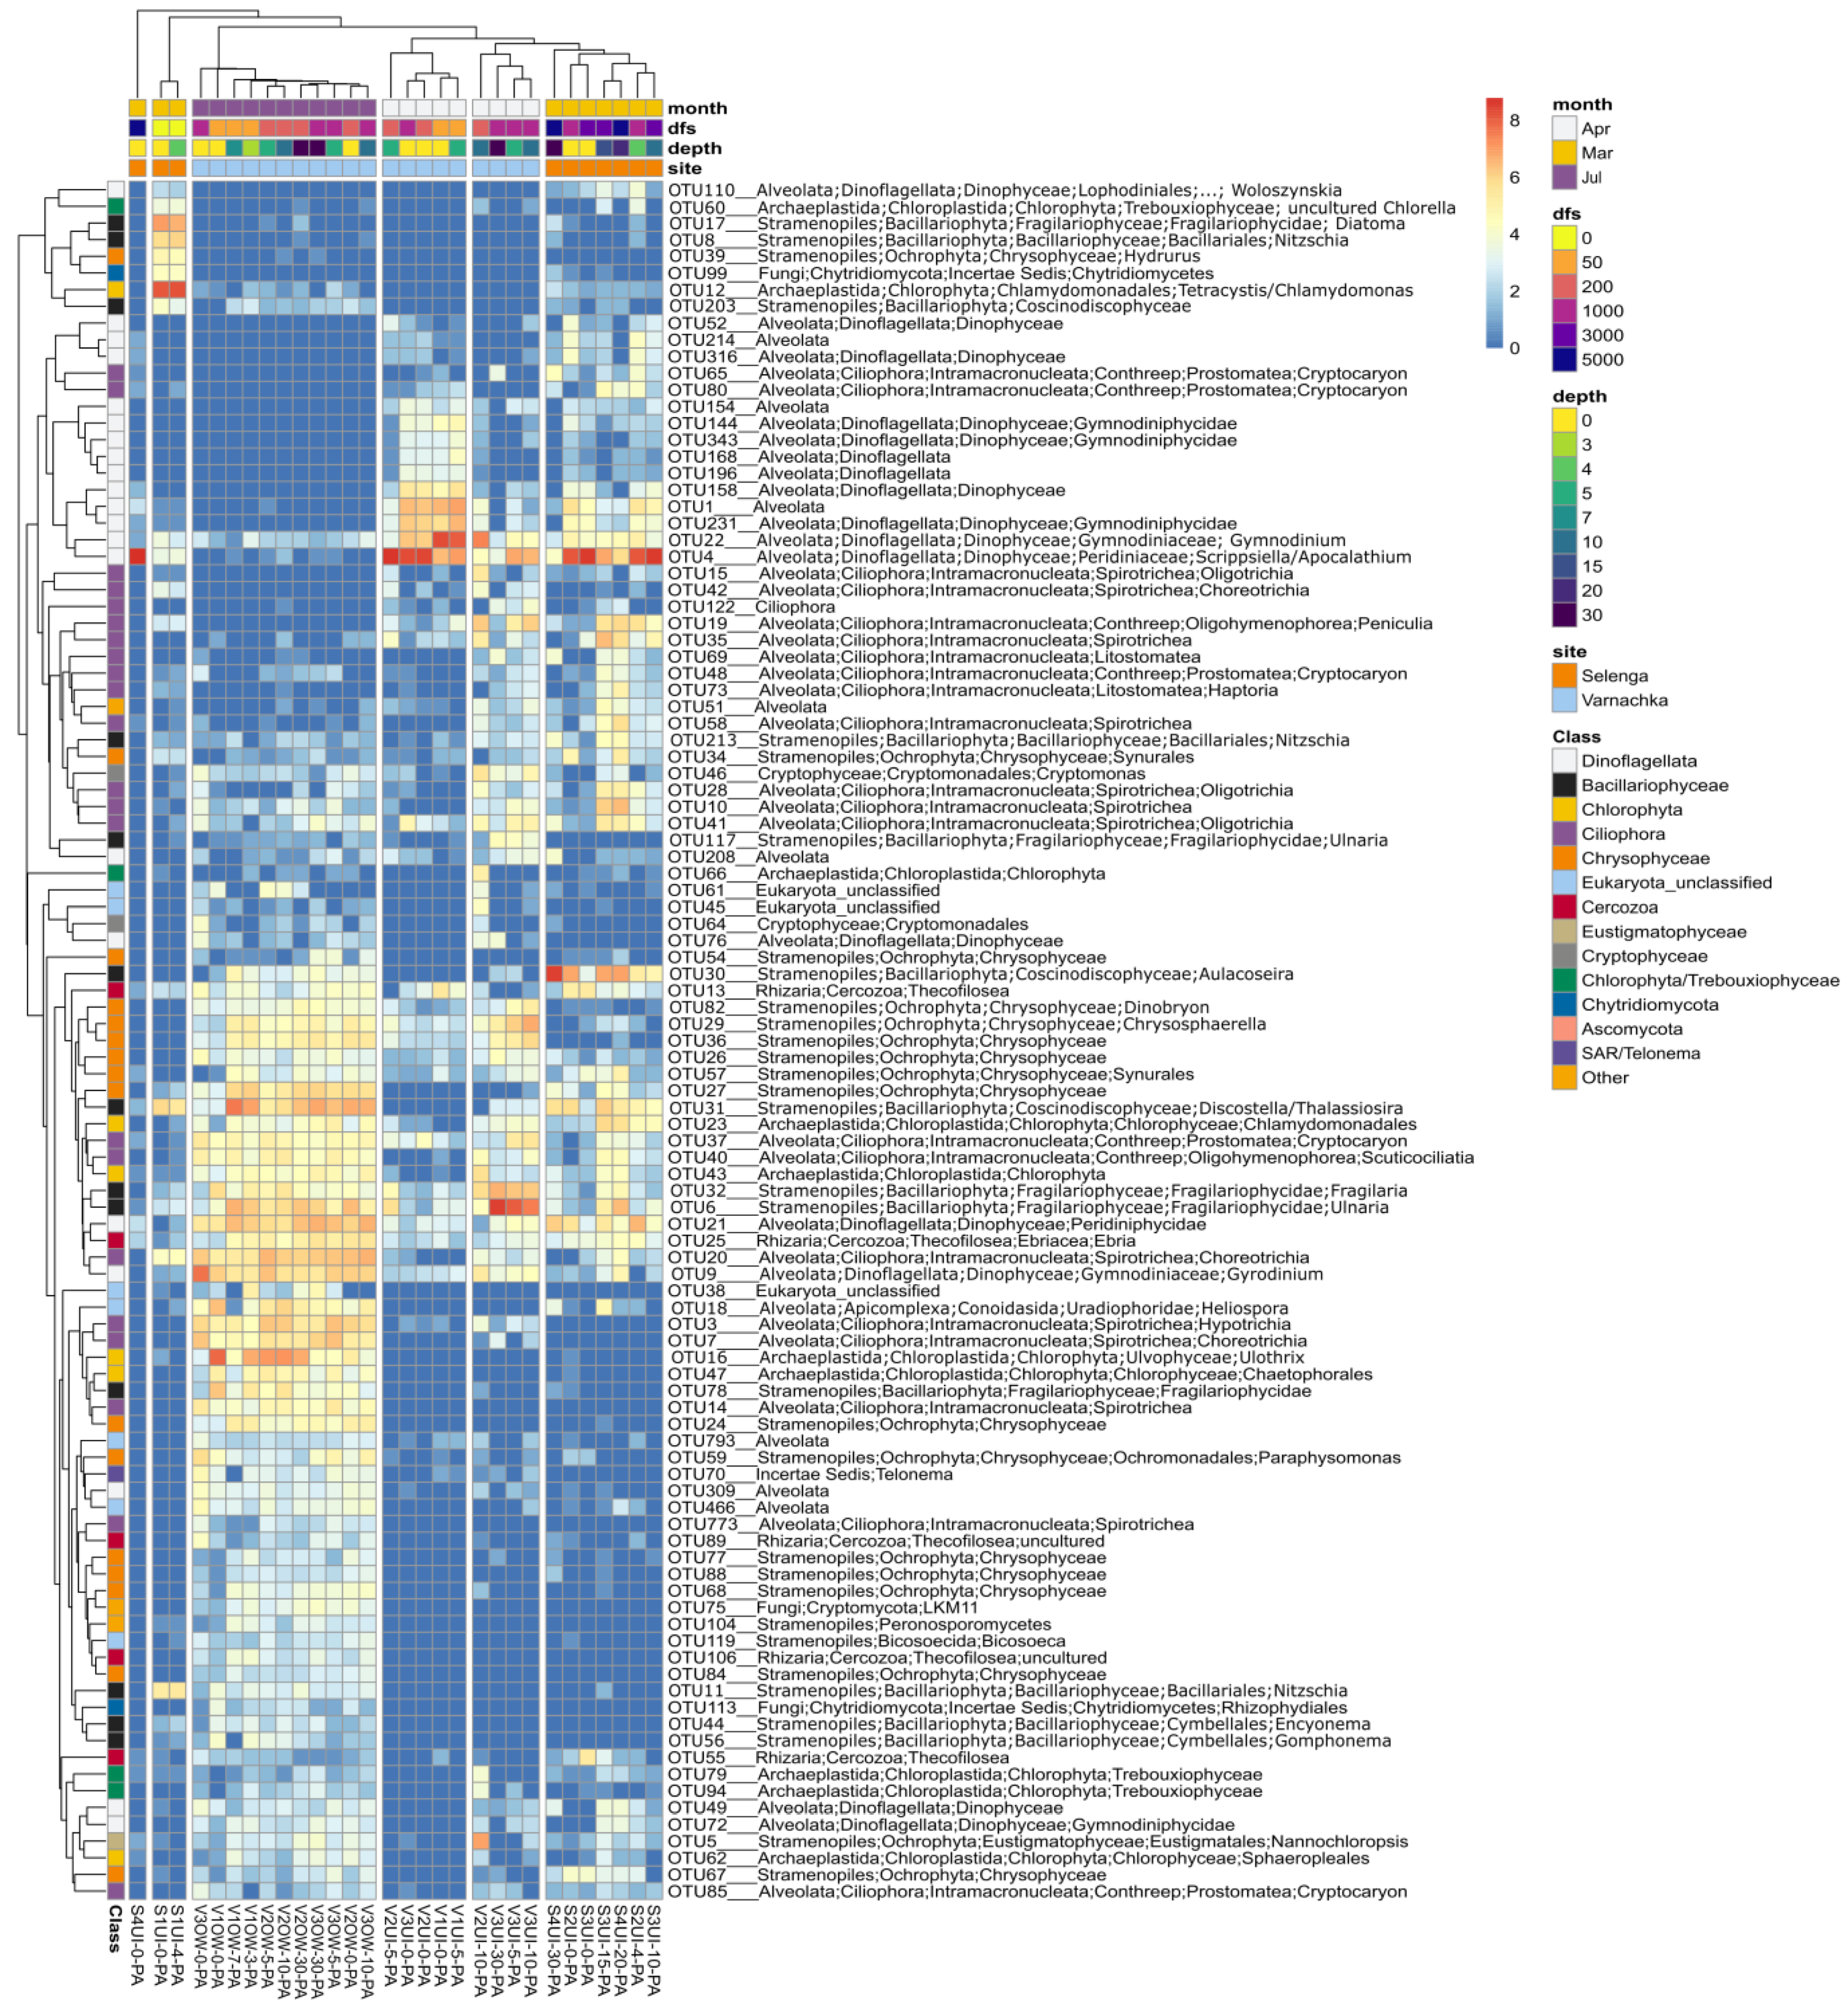
3.2. Diversity and Composition of Microeukaryotic Communities, According to Metabarcoding Data

Since our size-fractionation strategy naturally selected the microeukaryotic communities, 18S rRNA gene amplicons were analyzed only for PA samples. Thirty analyzed samples have produced a total of 250,226 reads; two samples (V2UI-30-PA and S4UI-10-PA) have been removed from further analyses because of low coverage. The OTU number varied between 46 and 143 OTUs per community profile (Table S2). Rarefaction curves suggested that the sequencing effort was sufficient to estimate the community diversity (Figure S3). The community richness and diversity were higher in summer than in the ice cover period (Figure 3; Table S2).
The taxonomic composition of microeukaryotes varied with season (Figure 4A). It was dominated by Dinoflagellata, Ciliophora and Diatomea during the ice cover period (Figure 4B). Moreover, depth-dependent changes in under-ice community composition could be observed (Figure 4B). The surface water communities formed a separate group, consisting of all 0-m depth profiles, with a couple of 4- and 5-m communities, which were dominated by Dinoflagellata, except the river mouth communities (Figure 4B). Indeed, PERMANOVA revealed significant differences for groups of microeukaryotic profiles using the two-factor “season”/“depth category” model (season: R2 = 0.42, p = 0.0024; conditional depth category: R2 = 0.12, p = 0.0024). Obviously, the similar composition of the microeukaryotic profiles in summer and clear separation of the sub-ice communities by the depth of sampling layer resulted in this effect. Heatmap analysis showed that the surface water communities (both at Selenga and the Varnachka area) were dominated by OTUs, whose sequences had the best match with sequences of Scrippsiella/Apocalathium (OTU4), Gymnodinium (OTU22) and OTU231, and OTU1 related to Dinophyceae (Figure 5; Table S3). Deeper waters (S3UI-10, S3UI-15, S4UI-20, V2UI-10, V3UI-5, V3UI-10 and V3UI-30) were mostly inhabited by a diverse group, with the best match with sequences of diatoms Ulnaria (OTU6), Fragilaria (OTU32), Discostella/Thalassiosira (OTU31), Nitzschia (OTU213); and dinoflagellates Gyrodinium (OTU9), group of OTU related to Ciliophora (Figure 4B and Figure 5). S4UI-30 was dominated by diatom Aulacoseira islandica (OTU30). The river mouth samples (S1UI-0, S1UI-4) were exceptions to this trend. The green alga Tetracystis/Chlamydomonas (OTU12), diatoms Diatoma (OTU17), Nitzschia (OTU8, OTU11) and Discostella/Thalassiosira (OTU31); Chytridiomycetes (OTU99) and Chrysophyceae (OTU39) prevailed in these samples. In contrast, no depth-dependent change was observed in summer (Figure 4). All summer communities were dominated by Chlorophyta, Dinoflagellata, Diatomea, Ciliophora and Chrysophyceae (Figure 4B). The most abundant OTUs belonged to Gyrodinium (OTU9), Discostella/Thalassiosira (OTU31), Peridiniphycidae (OTU21), Choreotrichia (OTU20) and Ulnaria (OTU6). Littoral communities (V1, V2) were dominated by Ulotrix zonata (OTU16). Microscopy data confirmed the relationship between the microalgae composition and depth (Figure S2).

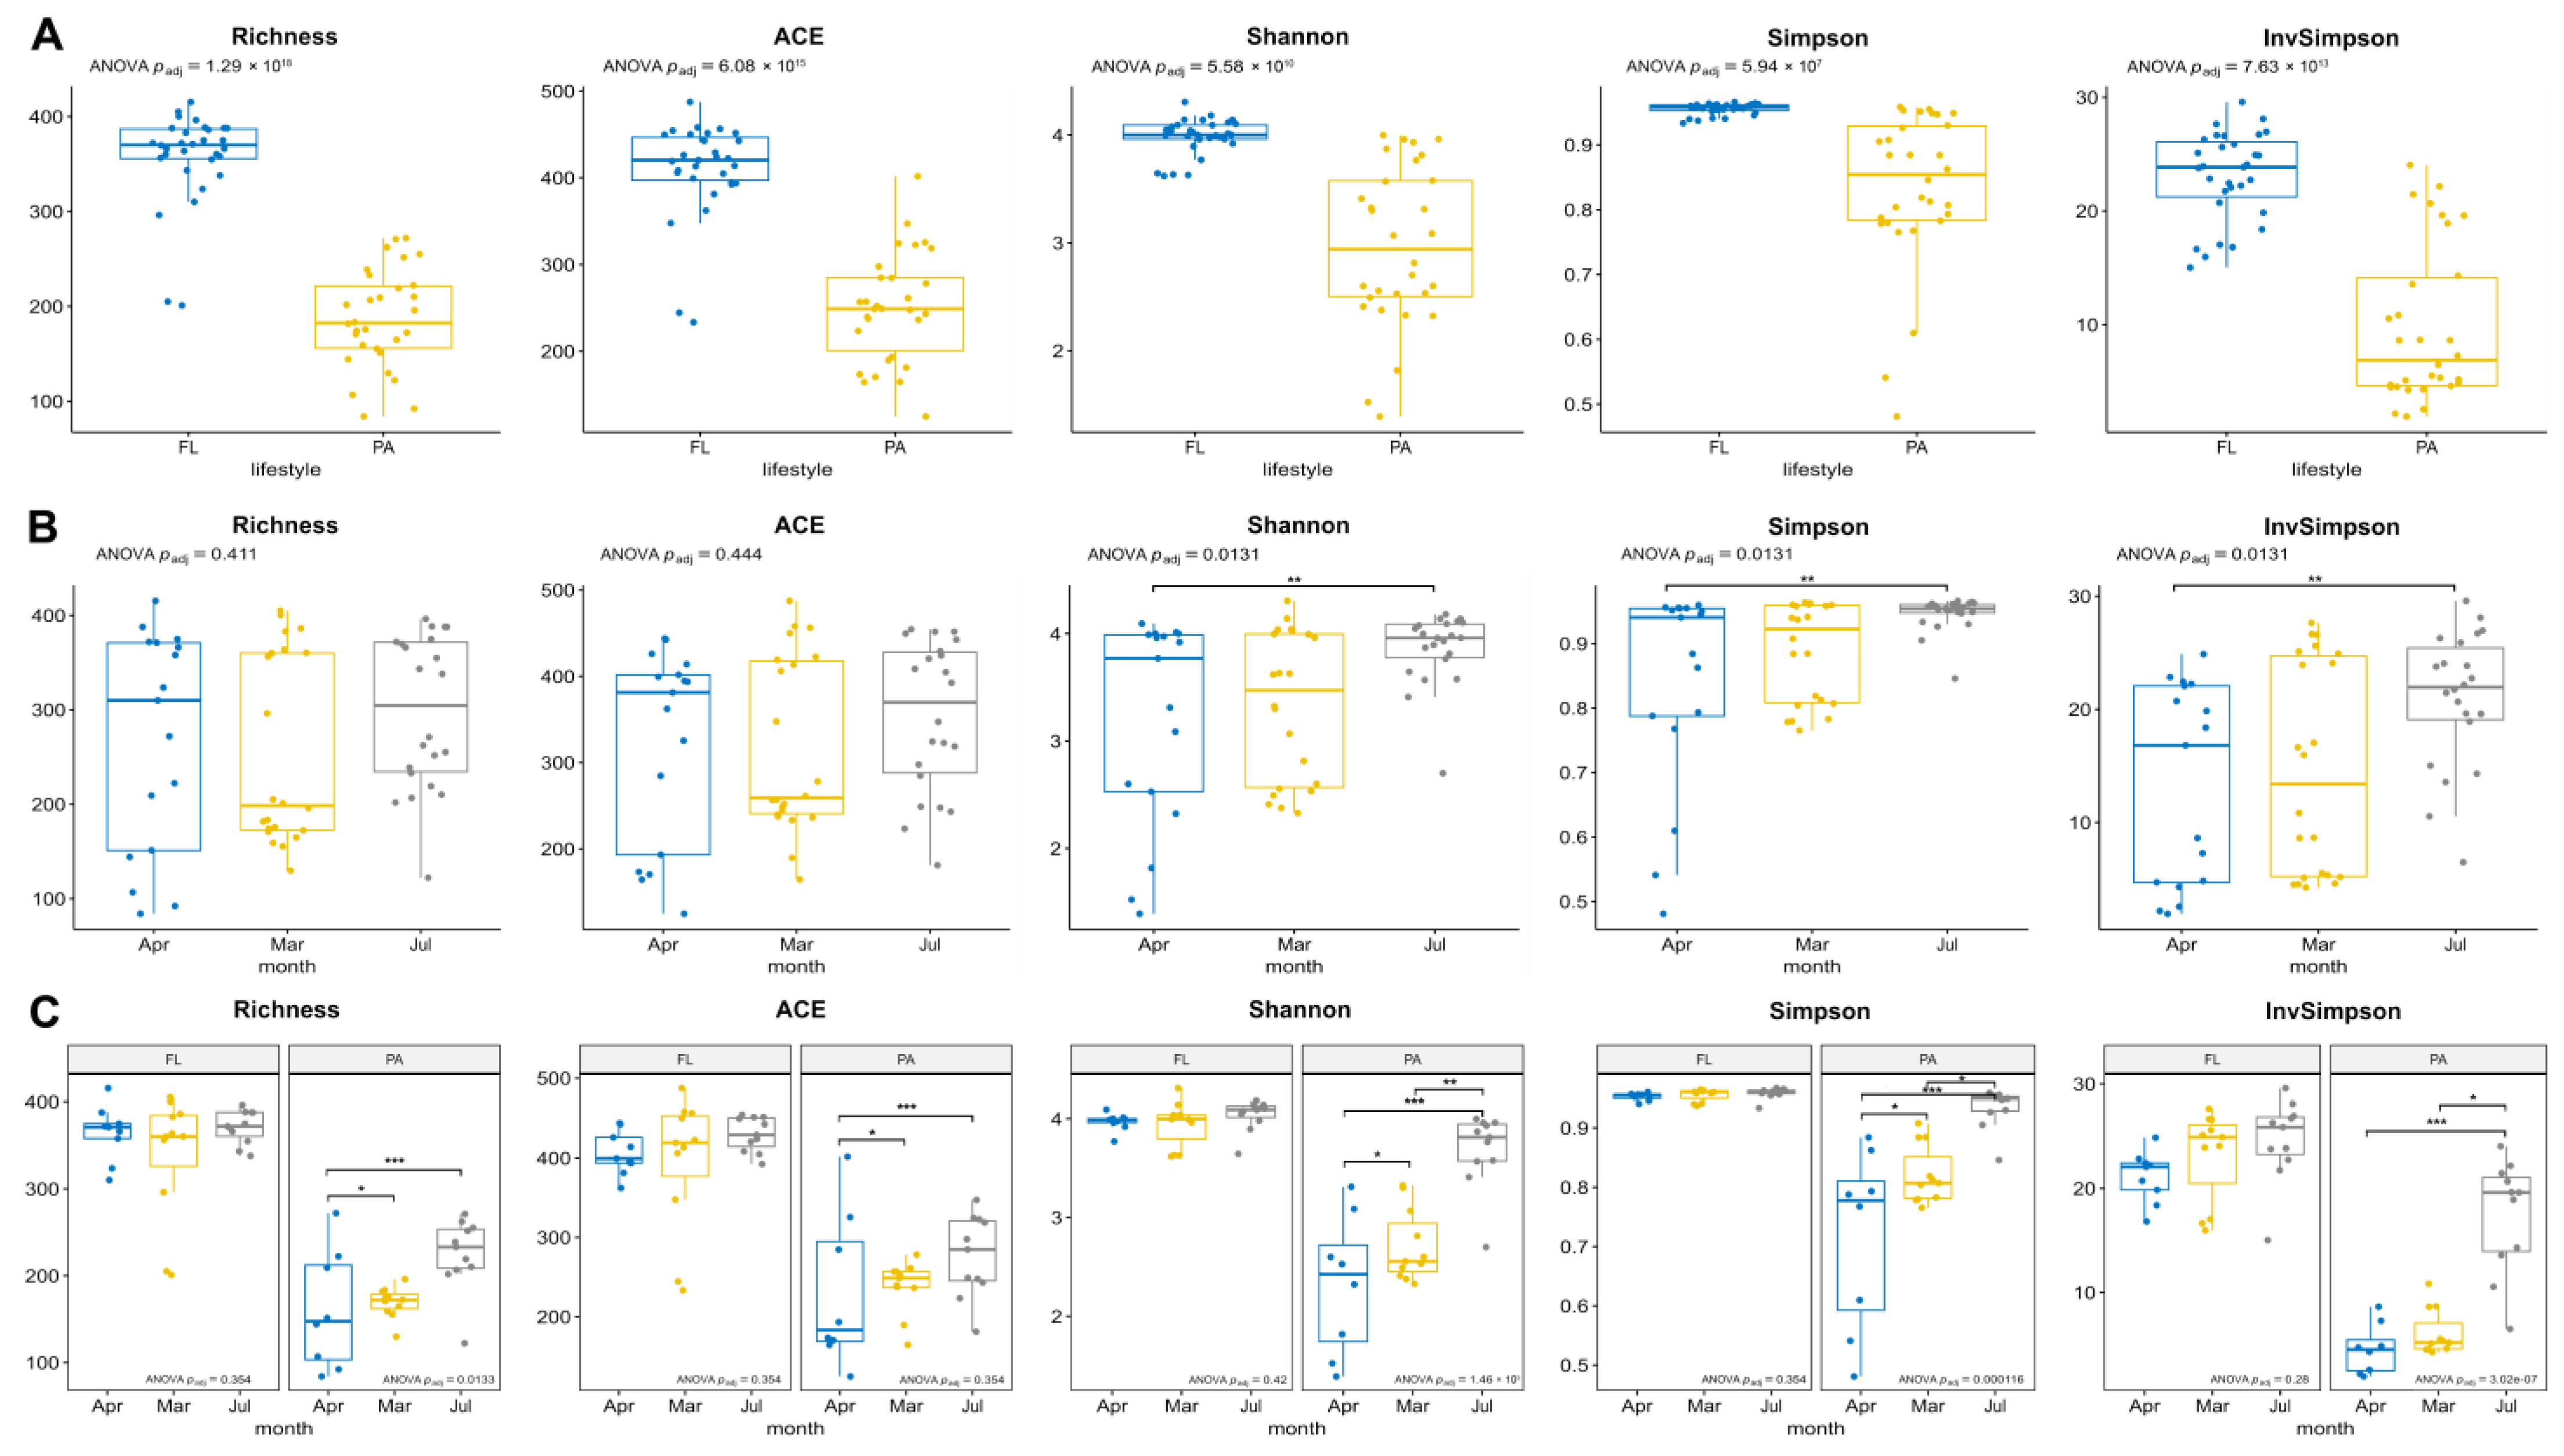
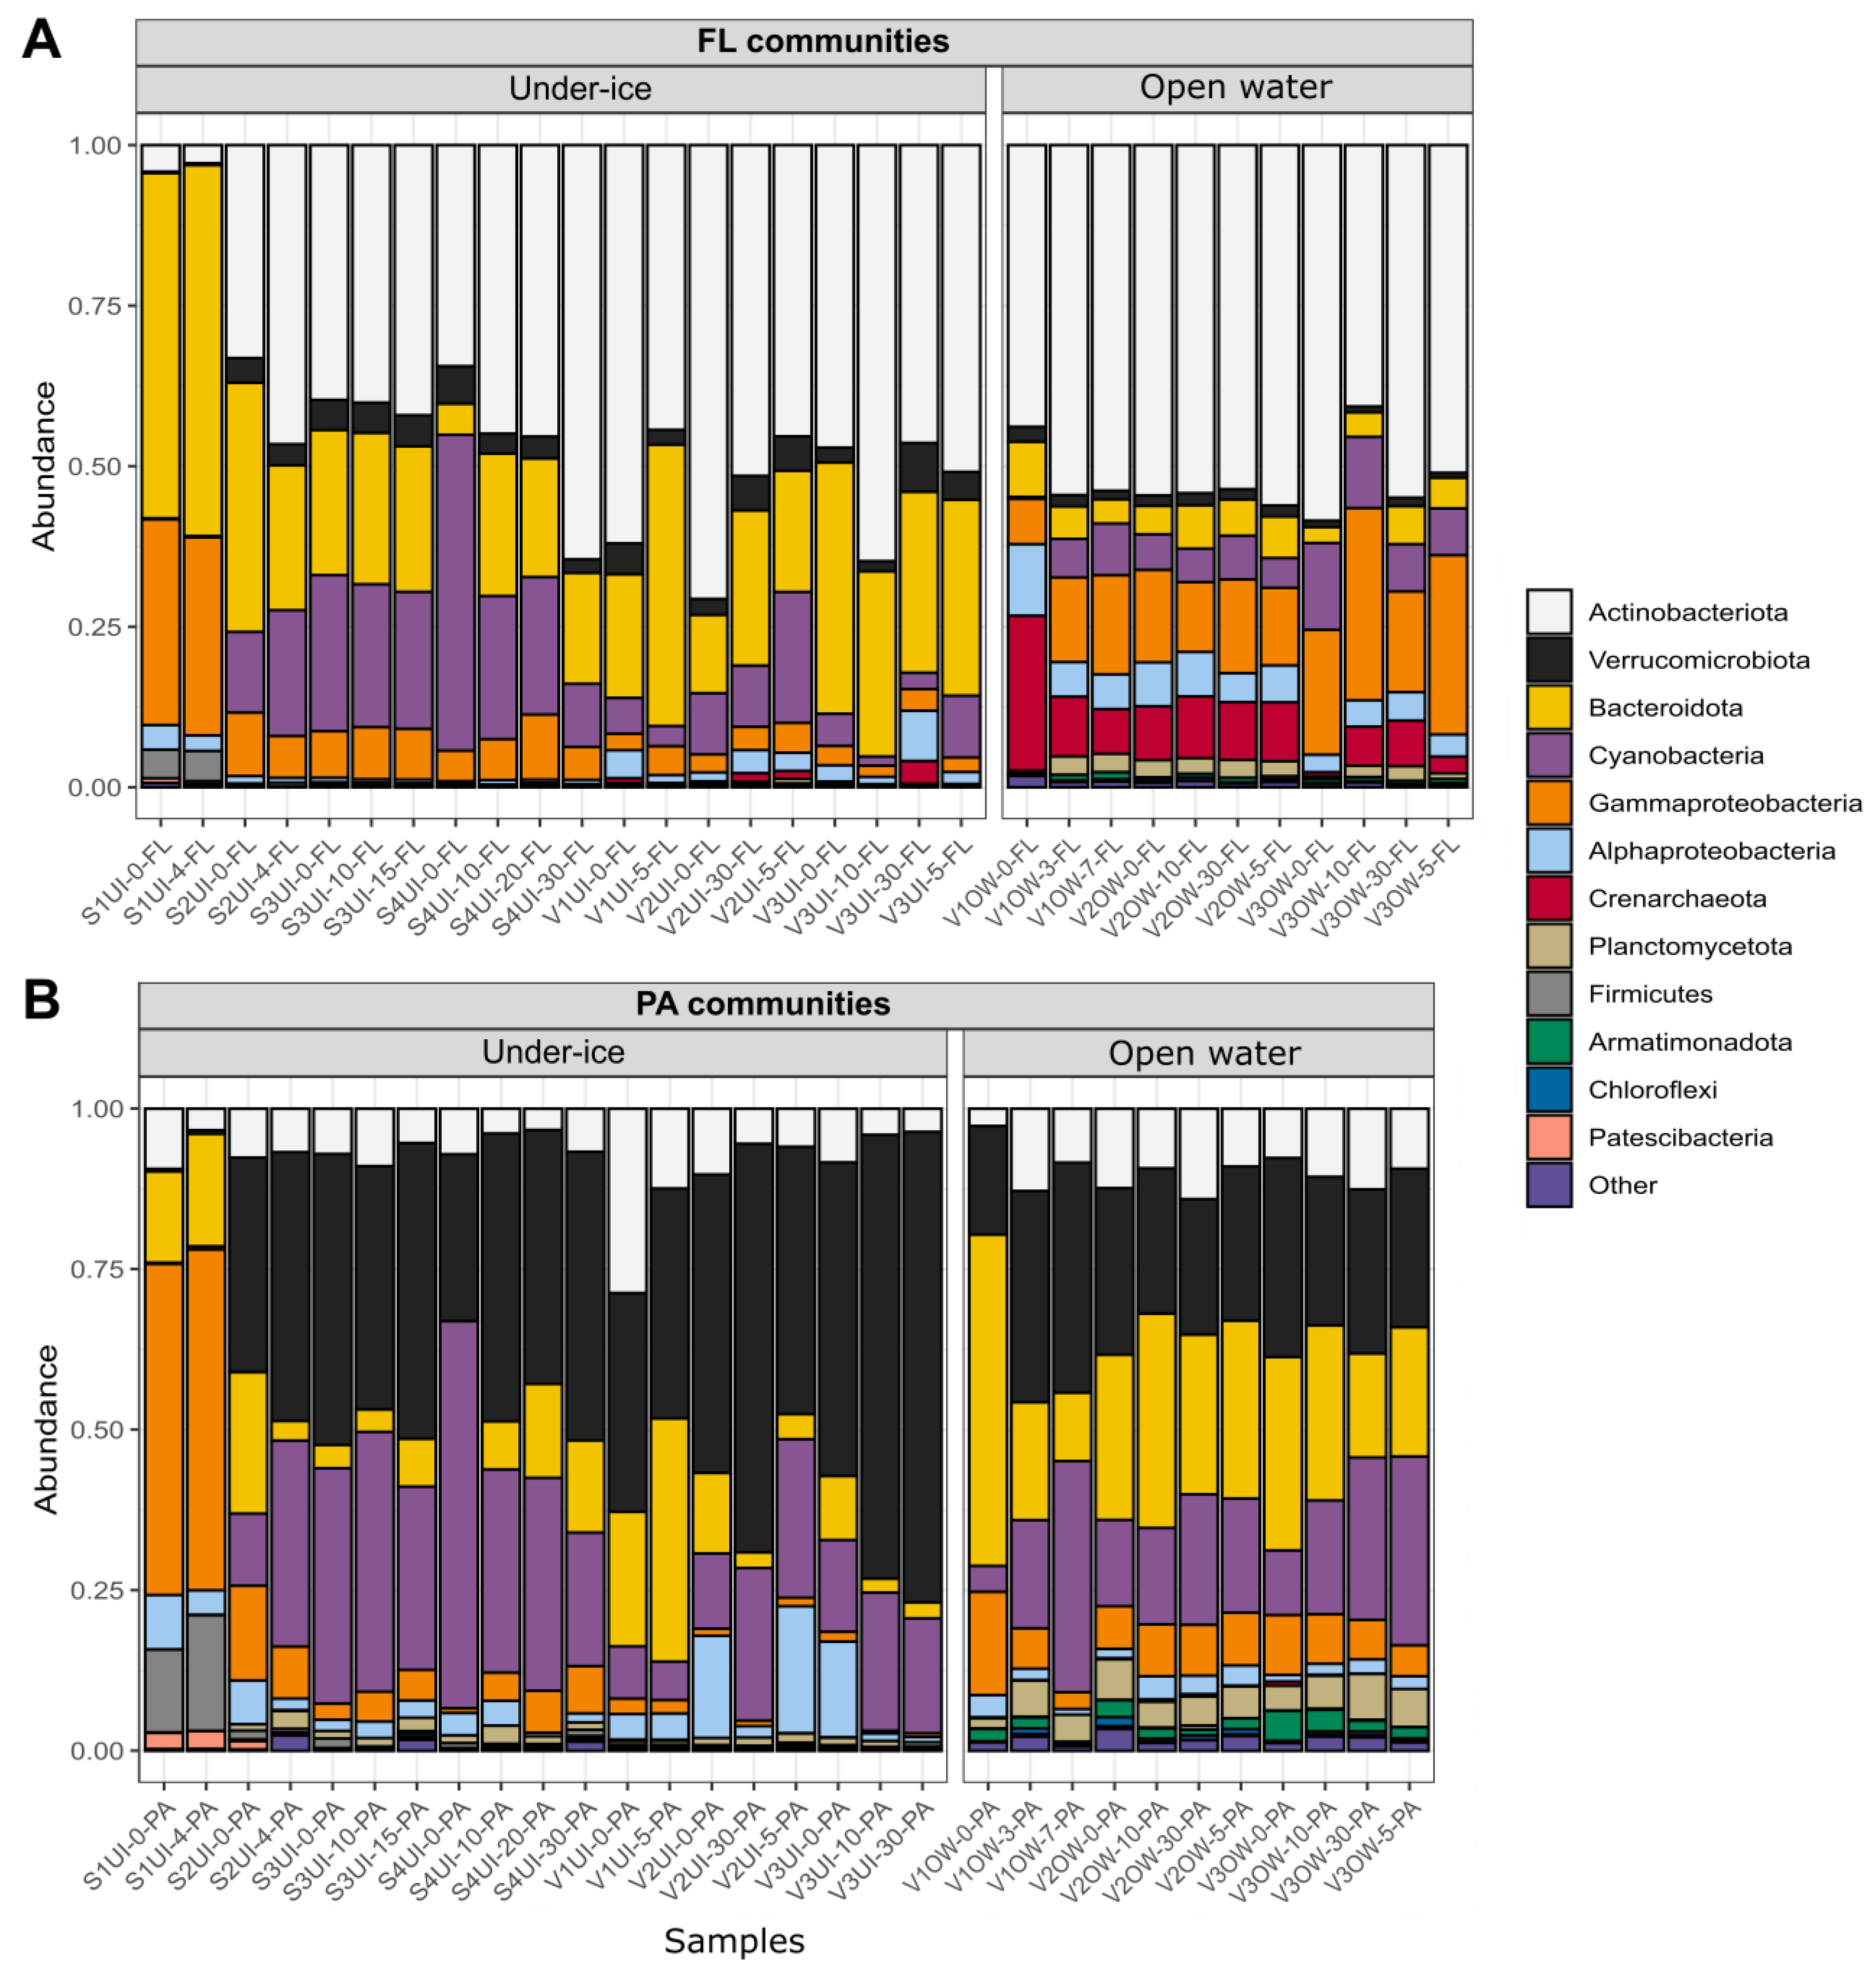
3.3. Diversity of FL and PA Bacterial Communities

We have sampled FL and PA bacteria from the photic layer of Lake Baikal at two basins with different nutrient intakes. The samples were taken from various depths, distances from the shore, and seasons, thus significantly extending our previous comparative study [47]. For 61 bacterial community samples, a total of 463,700 reads were produced (310653 for FL and 153,137 for PA). Three samples (V2UI-10-FL, V2UI-10-PA and V3UI-5-PA) were excluded from further analysis, due to a low coverage. The number of OTUs varied between 201 and 415 in FL, and between 84 and 272 in PA samples (Table S2). Rarefaction curves suggested that the sequencing effort was enough to estimate the community diversity (Figure S4), although the analysis of PA bacterial communities could benefit from further sequencing. According to the alpha-diversity indices (ACE, Shannon, Simpson and InvSimpson), FL communities were more diverse than PA ones (Figure 6A). The merged FL+PA bacterial profiles differed significantly in richness and diversity between seasons (Figure 6B). Furthermore, if one is to account the lifestyle factor, the diversity of FL communities stayed roughly constant, while the diversity of PA communities increased in summer (Figure 6C).

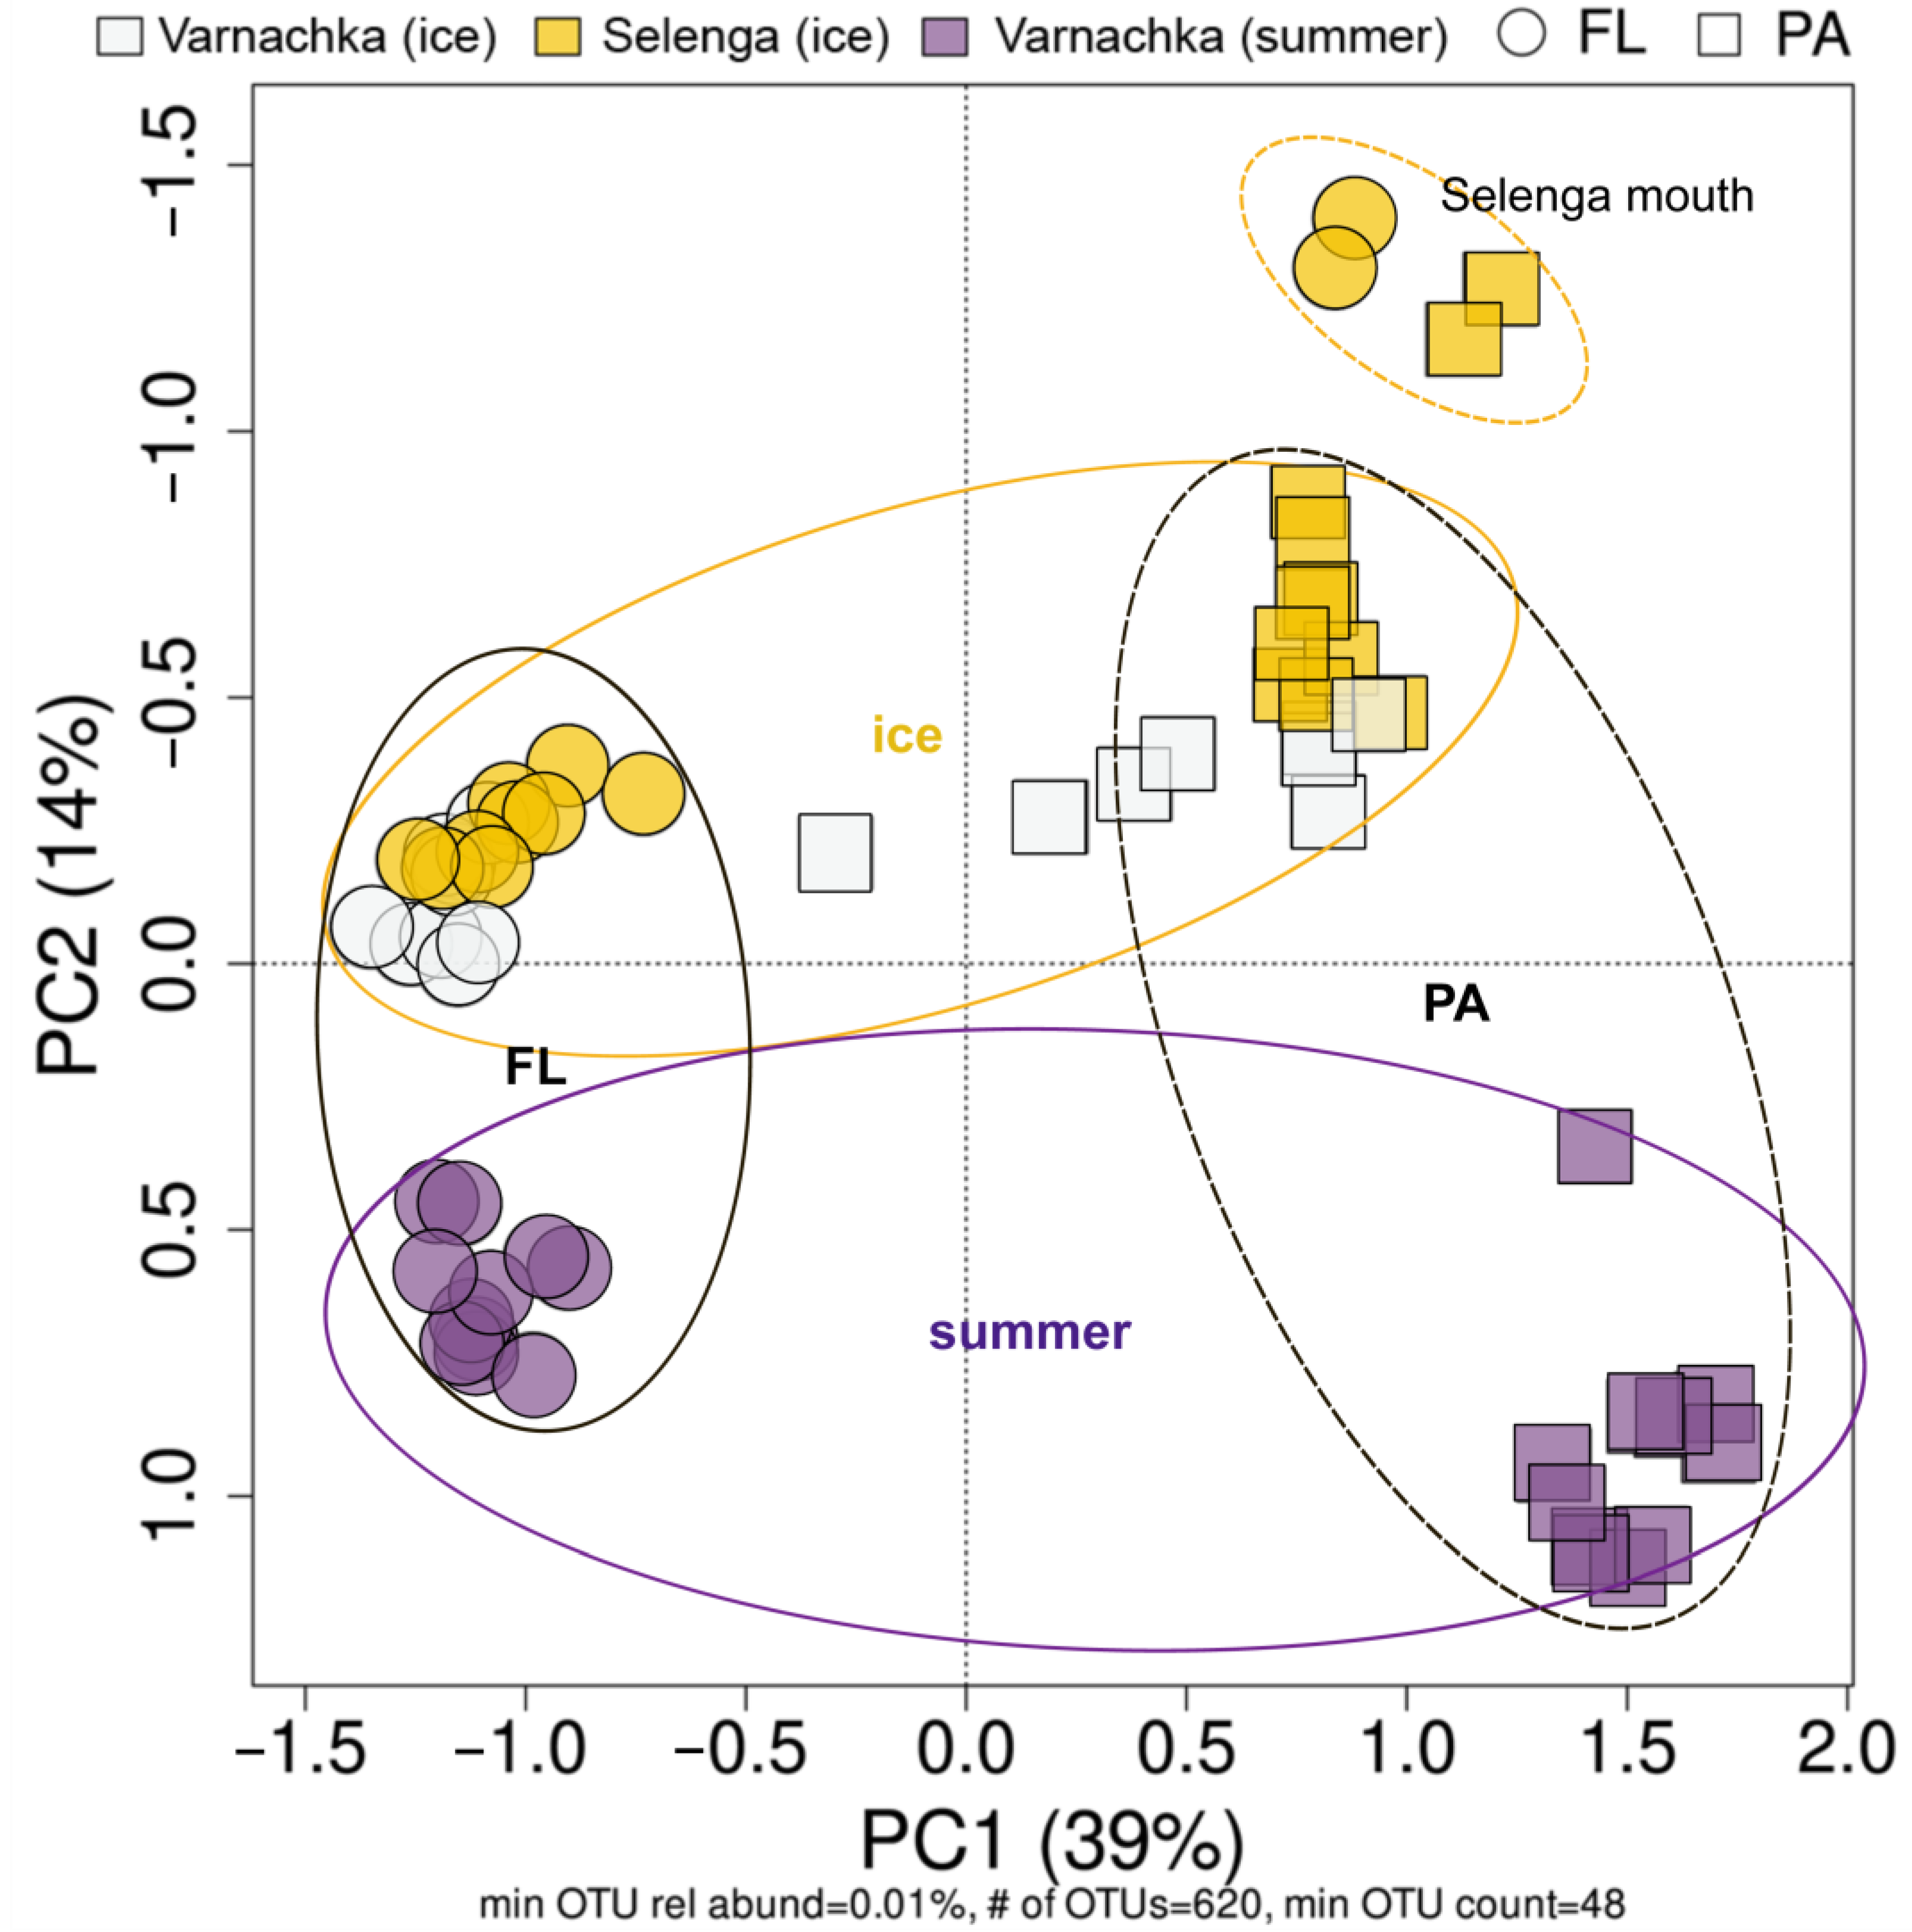
3.4. Beta-Diversity and Microbial Taxa Differing by Size Fractions and Seasons

PCoA showed that the FL communities clustered separately from PA ones (Figure 7). Generally, the lifestyle factor variable produced the highest explained variance in PERMANOVA test (R2 = 0.38, p = 1 × 10⁴). The season factor (the ice cover versus the open-water periods) also had a considerable impact on similarity of profiles, explaining ~11% of variance (p = 1 × 10⁴), and these two independent variables together explained almost half of the total variation (R2 = 0.43, p = 1 × 10⁴). By using the product of two-factor variables, “site“ and “season“, as well as the lifestyle variable, one may assess the similarity of sub-ice and open-water microbial communities. Indeed, the under-ice microbial profiles of Selenga and Varnachka were different: the effect of the site, season and lifestyle factors explained about a half of the total variation between these groups, with the conditional effect being more than one-third (R2 = 0.38, p = 1 × 10⁴). However, the variation explained between the under-ice and open-water microbial communities was even higher: the conditional effect of the site, season and lifestyle was above a half of total variation for the Varnachka under-ice versus open-water comparison (R2 = 0.58, p = 1 × 10⁴), and 45% when comparing the Selenga under-ice and Varnachka open-water bacterial profiles (p = 1 × 10⁴).
The FL communities were dominated by Actinobacteriota, Bacteroidota, Cyanobacteria and Gammaproteobacteria (Figure 8A), while PA were mostly composed of Verrucomicrobiota, Cyanobacteria and Bacteroidota (Figure 8B). The largest number of OTUs in the FL communities, irrespective of season, belonged to the CL500-29 marine group (Figure 9). Among other FL bacteria constantly presented throughout all time points were SAR11_clade III, Polynucleobacter, Limnohabitans and others. In FL/PA differential abundance analysis, the majority of significantly different OTUs were more abundant in FL, with only a few being predominantly in PA (Table S5). The most abundant OTUs shared by all PA samples were Luteolibacter and Cyanobium PCC-6307 (Figure 9). OTUs of Planctomycetota (OTU133_Pirelulla, OTU74_Rubinisphaeraceae and OTU214_Phycisphaeraceae) also had an increased abundance in summer PA communities’ profiles. The season had a stronger effect on the composition of PA communities; it could be seen that, in summer, a separate subcluster was formed from OTUs that were not encountered during the ice cover period. The FL profiles from different seasons were more similar to each other, suggesting a less season-dependent community composition (Figure 7), as revealed by tb-PCoA total variation (Figure S5), and a slightly less conditional effect for the site and season factors (FL: R2 = 0.28, p = 1 × 10⁴; PA: R2 = 0.30, p = 1 × 10⁴). However, when comparing FL and PA communities separately, the under-ice FL communities were more different between the Varnachka and Selenga sites than the same PA communities (Figure S5). This was evidenced by a twice-smaller variation, which was explained by the second tb-PCoA axis for a subset of PA versus FL bacterial profiles (Figure S5). The heatmap showed that there are two groups of OTUs in the under-ice FL communities of the Selenga, the first group—Methylomonadaceae (OTU32), Acinetobacter (OTU58), Methylobacter (OTU90); and the second one—Kapabacteriales (OTU50), Fluviicola (OTU62), Ferruginibacter (OTU87), Cyanobium (OTU135, OTU372). OTUs of these groups were not found, or were found in minimal abundance, in the Varnachka communities, and contributed to the difference between Selenga and Varnachka in the ice cover period.
Bacterial OTUs of Crenothrix, Methylomonadaceae and archaeal OTUs of Nitrosarchaeum and Nitrosopumilaceae were more abundant in summer FL samples, but represented by only a few reads in under-ice samples (Figure 9). It is also interesting that Flavobacterium were more abundant in FL during the ice cover period, while in summer they were most abundant in the PA communities, but it is important to note that there were different OTUs (Table S4). OTU11, OTU20, OTU101, OTU174 and OTU372 all belonged to the genus-level group Cyanobium_PCC-6307, but OTU11 was more abundant in PA, and others were more abundant in FL. During summer, the diversity of significantly different proteobacterial OTUs increased both in FL and in PA (Table S4). Verrucomicrobiota OTUs, predominantly from genus Luteolibacter, were mostly present in PA communities; their diversity also increased in summer (Figure 9, Table S4).
Depth had no observable effect on either the composition of FL communities, or on summer PA bacteria (Figure S5). There was a small correspondence between depth and community composition in under-ice PA samples, where the uppermost samples (0 and 5 m) were grouped together, away from deeper ones, but it was not statistically significant. At that time, the upper layers contained a large amount of Alphaproteobacteria, dominated by OTU52_Candidatus_Finniella (Figure 9, Table S4).
The PCoA plot showed that bacterial communities of the Selenga mouth were remarkably different from other profiles (Figure 7). While FL communities of the mouth were dominated by Bacteroidota (mostly Flavobacterium OTUs, see Table S4), other communities were dominated by Actinobacteriota. PA communities differed as well, with a significant amount of Gammaproteobacteria in the mouth of the Selenga. There were Thiothrix (OTU115, OTU148), Polaromonas (OTU94), Sphaerotilus (OTU271) and Zoogloea (OTU403) (Table S4) among the significantly different taxa. We also noted a high abundance of Firmicutes (10%), and the most common OTU was Trichococcus (OTU80). The major shared OTUs between FL and PA communities were Rhodoferax (OTU21, OTU66), Polaromonas (OTU109) and Trichococcus (OTU80). A few OTUs were only found in the Selenga PA community: Thiothrix (OTU115, OTU148) and Arcicella (OTU75).

3.5. Co-Occurrence Networks

Bacterial co-occurrence networks were constructed for 494 OTUs (Figure 10). The resulting graphs showed that bacteria were clustering in accordance with their taxonomy. In other words, highly interconnected large subgraphs were likely to consist of taxonomically related bacteria (Figure 10 left). There was also a good mapping between interconnected subgraphs and FL/PA differential abundance contrast. The FL subgraphs were larger, including more OTUs than the PA subgraphs (Figure 10 right). Taxonomically, they mostly consisted of Actinobacteriota. The PA communities also had a mixed-taxonomy subgraph that included mostly members of the phyla Bacteroidota and Verrucomicrobiota. Further, there were FL-specific subgraphs of Bacteroidota OTUs. Further yet, some Actinobacteriota OTUs were more common in the PA communities. Abundant OTUs related to Cyanobium, and a group of OTUs related to Phycisphaeraceae (phylum Planctomycetota), belonged to the PA samples, as well.
Comparison of these graphs between seasons showed that FL component OTUs were similar in the open water and in the ice cover season (March and April) (Figure 11A), regardless of the sampling site. However, the FL-specific Bacteroidota OTU subgraphs described above were only present in the under-ice communities. During summer, there was an increased abundance of Archaea (Nitrosarchaeum, Nitrosopumilaceae) and SAR11 Clade III proteobacteria; new dense subgraphs appeared in PA communities, including major OTUs of Flavobacteria, Arcicella and Luteolibacter (Figure 11B).
A microeukaryotic co-occurrence network was constructed for 291 OTUs (Figure 12). This network had a higher degree of connectivity, potentially suggesting more complex interactions between organisms. It consisted of a large group of OTUs present in both seasons and two somewhat isolated subgraphs. One of them consisted of dinoflagellate OTUs (Gymnodinium sp. and Apocalathium aciculiferum), which were more abundant in under-ice communities, and the other one contained microeukaryotes such as diatoms (Fragilaria, Encyonema, Nitzschia and Gomphonema), green algae (Ulotrix zonata, Draparnaldia and Chlamydomonas), chrysophytes (Chrysosphaerella, Ochromonas and Spumella), Peronosporomycetes and Chytridiomycota, which dominated in summer.

3.6. Environmental Factors Affecting FL and PA Bacterial Communities

Redundancy analysis showed that, for the FL bacterial profiles, temperature was the only significant variable (p = 0.001); for the PA bacterial communities, the model included temperature and dissolved PO43− concentration (p = 0.001) (Figure 13). These factors were directly linked to seasonality: summer brought both the temperature increment and the increased phosphate availability (as dissolved and particulate organic matter started to mineralize). The backward elimination strategy yielded similar results, with the temperature as the only significant variable for FL (R2 = 0.30, p = 0.002), and temperature (R2 = 0.33, p = 0.002), PO43− concentration (R2 = 0.39, p = 0.002) and TMA (R2 = 0.41, p = 0.026) for FL communities.

3.7. Predicting the Metabolic Functions that Might Underlie Changes between the FL and PA Heterotrophic Community Structure

We have compared the predicted genes and metabolic pathways in FL/PA contrast to detect potential functional differences. This resulted in 351 EC-identifiers, 1219 KO-identifiers and 70 MetaCyc pathways that were different between these two lifestyle groups, and had the absolute value of effect size above 1. As shown in Table S5, many pathways and predicted genes were enriched in the FL communities compared to the PA one. Among the predicted genes related to the FL communities, the genes responsible for the synthesis of fatty acids were noted, which may be associated with adaptation to low temperature conditions. Protective genes responsible for the production of toxins and antitoxins have also been found. The genes for the transport of the antibiotic microcin C have been noted in the PA community. In addition, genes responsible for cellulase and urease synthesis and degradation of biopolymers, as well as sulfur metabolism and fucose degradation, were more abundant in the PA community component.

4. Discussion

Seasonally changing environmental factors (temperature, pH, mixing) affect the composition of bacterial communities in aquatic ecosystems [71,72]. In addition, various organic, mineral particles and phytoplankton development are nutrient-rich hotspots for bacteria, and they also influence their composition [2]. In order to find out whether there were any changes in the FL and PA communities of Lake Baikal, and what influenced them, we took samples in different seasons from Baikalian waters near the Bolshie Koty settlement, and near the mouth of the Selenga River, the major source of dissolved minerals in Lake Baikal.

4.1. Influence of the River Water Inflow on the Composition of FL and PA Communities

River mouth water was different from other samples in terms of mineralization, with high concentrations of silica and nitrogen, which is typical for the Selenga water in winter [32,73,74]. Accordingly, microeukaryotic communities of the river mouth were distinct from those of the lake, both in microscopy and 18S rRNA gene sequencing data. They were dominated by diatoms Nitzschia, Diatoma and green algae, which are typical for this area [32].
Bacterial community profiles of the Selenga mouth were also different from those in Lake Baikal. Our data showed that, starting from 1 km from the mouth and beyond, the taxonomic composition was approximately constant throughout the entire water column (Figure 8). These results are similar to the data obtained by in situ hybridization, indicating that the structure of the bacterial community of the Selenga Shallow water changes as river waters mix with lake waters [35]. A similar result was found in recent work on a high-mountain alpine lake, where it was assumed that the composition of the microbial community was significantly influenced by microbes coming from terrestrial and aquatic habitats upstream [75]. However, studies of 18S and 16S rDNA have shown that the community of the estuary is very similar to the communities of the river, but differs significantly from the lake. Also, this is similar to the result for the McKenzie River (Canada), where the river community was different from both estuary and open sea [20]. Moreover, the differences between mouth FL and PA communities were observed in our work. Recently, it has been shown that organotrophic bacteria such as Flavobacterium and Gammaproteobacteria have predominated in the Selenga mouth, and they have been replaced by psychrophilic and oligotrophic bacteria in the Baikal water [35]. We have shown that these taxa were dominant in the river mouth; however, Flavobacterium dominated in FL communities, and Gammaproteobacteria in PA. Taxonomically, bacteria dominating PA communities of the Selenga mouth (Thiothrix, Zoogloea and Sphaerotilus) are widespread in sulfide springs, activated sludge and wastewater treatment facilities [76,77,78,79], suggesting an active role in the destruction of organic matter including nitrogen, phosphorus and sulfur compounds. In addition, analysis of predicted metabolic pathways in PA communities has shown the presence of sulfatase genes, which play an important role in the sulfur cycle [80]. Genera Polaromonas and Rhodoferax shared between FL and PA communities of the Selenga mouth are psychrophiles, capable of breaking down a range of organic compounds [81,82,83]. In addition, Polaromonas was predominant in PA communities; a Polaromonas-like bacterium was previously found in a consortium with a phototrophic partner, suggesting a strong capacity for symbiotic interactions within this genus [84]. Our results are more similar to those of Garneau et al. (2009) [85], who have shown differences between FL and PA communities from the Mackenzie River estuary.

4.2. Seasonal Changes in the Structure of FL and PA Microbial Communities

Seasonal studies of FL/PA microbial communities are uncommon in the studies of marine and freshwater ecosystems [18,22,23,24,86]. Seasonal dynamics of the freshwater bacterioplankton of Lake Baikal have been analyzed [45], but this work was focused on the bacterial community as a whole, and did not take FL/PA segregation into account. To get a more detailed understanding of bacterial community changes in Lake Baikal, we have analyzed these two components separately. Samples were taken both in summer and in the ice cover period to study the seasonal changes. Hydrochemically, under-ice water in studied areas was similar to what is commonly observed in this period [87].
FL bacterial communities were relatively stable for the entire period of study, with a major contribution of an actinobacterial CL500-29 marine group. Actinobacteriota can comprise up to 50% of the bacterial community in upper layers of freshwater bodies [88,89]. The majority of known freshwater actinobacteria have been found in free-living bacterioplankton [19]. During the ice cover period, a large amount of Bacteroidota (mostly genus Flavobacterium) can be observed. It is a typical member of winter bacterioplankton [42,90,91].
In summer, Lake Baikal typically has direct temperature stratification [26] and uneven distribution of phytoplankton, with high values in the uppermost layers (0–5 m), quickly decreasing with depth [92]. Our data of hydrochemical parameters of summer water were similar between all depths and stations, possibly as a result of a storm or upwelling event. Influence of admixture can be seen both in the even vertical distribution of phytoplankton (Figure 1B, Table S1) and in the structure of the FL bacterial communities. The significant amount of Crenarchaeota in photic layer waters (1–20%) may suggest an influx of water from deeper layers, as this phylum is known to be dominant in upper sediment layers [40] and other bottom habitats in Lake Baikal [93,94]. In addition, a remarkable part of the FL communities consisted of methane-oxidizing Methylomonadaceae and genus Crenothrix [95,96], which implies either a nearby methane seep or allochtonous bacteria from deeper layers. There are several known methane seeps, and methanotrophic bacteria may be detected in minor quantities at different depths in Lake Baikal [97].
The PA bacterial communities exhibited seasonal changes. In both seasons, the predominant phylum was Verrucomicrobiota, mostly represented by OTUs of genus Luteolibacter. Members of this phylum develop actively during phytoplankton blooms in various seasons [98,99,100,101,102]. These bacteria are active polysaccharide degraders [103], recently shown to specialize in breaking down fucose, rhamnose and other sulfated polysaccharides [104] that are produced by diatom algae during their bloom in the North Sea [105]. Besides diatoms, L-fucose is produced as a component of extracellular polysaccharides by a range of bacteria, fungi and microalgae [106]. According to our results, a significant number of fucose-degrading genes were detected in Verrucomicrobiota-dominated PA communities.
During the ice cover period, the near-surface PA communities contained a large amount of Flavobacterium. Microeukaryotic communities were dominated by dinoflagellate Gymnodinium baicalense at these time points. Flavobacterium is known to have an algicidal effect through either direct or indirect attack of target algal cells, including Dinophyceae [107]. During summer, Flavobacterium was dominant at all depths; curiously, OTUs responsible for this dominance were either rare or completely absent in ice cover period PA and all FL communities, suggesting a narrow specialization.
Besides Flavobacteria, near-surface water in PA communities during the ice cover period hosted numerous AlphaproteobacteriaCandidatus_Finniella. This taxon contains obligate intracellular parasites of a broad range of eukaryotes, including Metazoa and protists [108]. When comparing our sequence with the GenBank database, a homology of 98.76% was revealed. So, considering that this taxon was found only in PA communities where representatives of Cercozoa developed, these might be their endosymbionts. During summer, the amount of Alphaproteobacteria in the PA communities was negligible. Phylum Cyanobacteria was abundant in the PA communities in both seasons, and in the FL communities near the Selenga mouth. Such a distribution is likely caused by the fact that cyanobacteria tend to have large cells (above 5 μm), and often form colonies, which causes them to be enriched in the PA. However, some small-celled cyanobacteria may be found in FL communities as well [23]. In marine and lacustrine “snow” (detritus that falls to the lake bottom), cyanobacteria are mostly responsible for nitrogen fixation [109,110].
One of the phyla most commonly found in association with other eukaryotic organisms is Planctomycetota. It has been shown that Planctomycetota are often a part of bacterial communities associated with algae [111,112,113,114,115,116]. With respect to our results, OTUs belonging to Planctomycetota (OTU133_Pirelulla, OTU74_Rubinisphaeraceae and OTU214_Phycisphaeraceae) were among the most significant ones in PA community profiles. In addition, it was shown that Planctomycetota were subjected to seasonal variability [117]. They had a high abundance in summer compared to winter, which was influenced by the development of microalgae. The bloom of diatoms and cyanobacteria has a positive effect on the abundance of Planctomycetota, as they serve as a nutrient source for them. Planctomycetota has been shown to contain a high number of sulfatase genes [118], which are involved in the degradation of the sulphated polymers produced by the algae. Similarly, we observed the enrichment of sulfatase genes in PA communities.
The under-ice FL bacterial community profiles of Varnachka and Selenga are less similar to each other than the corresponding PA profiles (Figure S5). This difference of the FL profiles can be likely explained by the distinct hydrochemical parameters of the sampling sites (Figure 2). On the other hand, the higher similarity of the under-ice PA bacterial communities (as compared with the FL counterpart) can be explained by similar structure of the microeukaryotic communities of the Selenga and Varnachka sites in the ice cover period (Figure 3 and Figure 5). A distinctive feature of the under-ice FL Selenga bacterial community profiles is the presence of methanotrophic phylotypes Methylomonadaceae and Methylobacter. The reason for this is the release of methane from bottom sediments into the water column in the area of the Selenga Shallow water [119,120]. In addition, influence of river flow on methane concentrations was observed for long distances [119]. Interestingly, phylotype, which was abundant in the under-ice FL bacterial communities of the Selenga sampling site, is Kapabacteriales. Genome of bacteria belonging to Kapabacteriales was recently shown to contain a cluster of genes for assimilation and metabolism of sulfur, as well as transporters of cobalt, copper, Fe2+, Fe-Mn, phosphate, phosphonates and ammonium [121].

4.3. Relation of FL and PA Bacterial Communities to the Development of Microeukaryotes

The seasonal dynamics of bacterial and microeukaryotic communities in Lake Baikal have been previously described by Mikhailov et al. (2021) [45]. They have revealed the coherent dynamics of bacterial OTUs from the same phylum and, sometimes, from different phyla. Our data are consistent with those obtained earlier, as can be seen from the co-occurrence networks of a group of taxonomically related bacteria, but there are also groups of bacteria that are combined into various groups with different taxonomic affiliations. In addition, this variable group belongs to the PA component, which develops during the summer period, with an increasing period of microeukaryotic diversity. It has been shown that the concentration of organic matter significantly affects the PA of the community [47,85]; the higher its concentration, the greater the diversity in PA communities. In our study, despite the fact that organics were higher during the ice cover period, an increase of diversity occurred in the summer. Previously, Ortega-Retuerta et al. (2013) [20] suggested that the quality of the particles, rather than their quantity, would play a major role in the structuring of bacterial communities. They meant the organic or mineral nature of the particles, and, in our case, the qualitative (diversity) of microeukaryotes, which led to an increase in the diversity of PA communities.
The study of bacterial and microeukaryotic communities during a spring phytoplankton bloom have shown both positive and negative correlations between some bacterial and microeukaryotic OTUs [37]. Moreover, a correlation analysis for the biomass of phytoplankton species and relative abundance of 16S rRNA reads has shown that bacterial OTUs belonging to Rhodoferax, Methylophilaceae, Phycisphaeraceae and Flavobacteria formed a cluster that was positively correlated with the biomass of diatoms, dinoflagellates and chrysophyceae [46]. In our work, Rhodoferax, Phycisphaeraceae and Flavobacteria were among the dominant communities in the composition of PA, which also indicated their close relationship with microalgae.
Seasonal changes were also observed in diversity indices. As shown before, the PA communities are typically more diverse than the FL [13,14,15,20,122]. However, these results were mostly produced in eutrophic water bodies with a large amount of particulate organics. In our case, alpha-diversity was higher in FL communities, similar to a community of ultraoligotrophic sea, where the free-living community was more diverse [18]. In that work, the authors suggest that trophic status determines whether the FL or PA community is more diverse. Phytoplankton development is directly linked to primary production, and our results are in line with this statement: summer samples contain a more diverse microeukaryotic community (including phytoplankton), leading to a more diverse PA bacterial communities. Similar results were found in German Lake Tiefwaren, where PA bacteria were more diverse in summer in response to phytoplankton development [23]. Previously, PA bacterial communities were shown to have high fermentative activity, dissolving polysaccharides in phytoplankton cell walls [5,123,124,125,126]. Microbial communities degrading polysaccharides in the water column include Gammaproteobacteria, capable of quickly adapting to changing substrates [127], and Bacteroidota, a common satellite taxon for blooming phytoplankton [90,128,129]. For instance, dominant bacteria in marine and lake snow belong to the phylum Bacteroidota, genera Cytophaga and Flavobacterium, which are mostly involved in the degradation of organic matter [130,131]. In accordance with this expectation, the predicted metabolic pathways in PA communities were shown to include the cascade of complex polysaccharide breakdowns. Curiously, the FL communities hosted a wider diversity of metabolic activities. This result may be explained by the fact that free-living bacteria cannot afford narrow substrate specificity in oligotrophic freshwater Lake Baikal.

5. Conclusions

Our results showed that the influence of the Selenga River (the main Baikal tributary) on the composition of FL and PA bacterial communities and microeukaryotes was noted in the mouth area, as well as for FL communities of the ice cover period. Farther from the mouth, the more bacterial and microeukaryotic compositions were similar to the background Baikal communities of the photic layer. This confirms how huge the water mass of the lake is. The composition of the communities was mostly affected by the bacterial lifestyle—FL or PA. FL bacterial communities were more similar to each other than PA communities. However, if we compare the under-ice period, then the FL differ more strongly. FL communities also react to different hydrochemical conditions of the Selenga Shallow water and Varnachka, while PA communities are more similar under the ice, since there was a similar composition of microeukaryotes during this period. The increasing diversity of the PA communities during summer was likely linked to the increasing diversity of microeukaryotes, although verification of this hypothesis would require further comparative investigation of microbial communities with different compositions of microeukaryotes. It is necessary to analyze communities by fractions to monitor the state of the lake ecosystem. If the PA fraction is the most dynamic and has a sensitive effect on the dynamics of eukaryotes, then the FL communities are the foundation of the lake ecosystem. A sharp change in the FL structure may be a consequence of global changes.

Supplementary Materials

The following supporting information can be downloaded at: https://www.mdpi.com/article/10.3390/d15040572/s1, Figure S1. SEM microphotography. Sample of FL fraction deposited on a 0.22-μm pore-size filter (A, B); sample of PA bacteria (C); PA bacteria on the cell of: diatom Aulacoseira islandica (D); diatom Nitzschia graciliformis (E); diatom Ulnaria (F); diatom Stephanodiscus (G); dinoflagellate Peridinium baicalense (H) and chrysophyta Chrysosphaerella. Figure S2. Nutrient concentrations, total abundance and species composition of microalgae using light microscopy of samples. UI—under ice samples; OW—open water samples; the last number in the sample name indicates the sampling depth; tot—concentration of total biogenic elements; dis—concentration of dissolved biogenic elements. Figure S3. Microeukaryotic diversity in April, March and July communities, as characterized by rarefaction curves of OTUs defined at genetic distance levels of 0.03. Figure S4. Bacterial diversity in FL and PA communities, as characterized by rarefaction curves of OTUs defined at genetic distance levels of 0.03. Figure S5. The tb-PCoA ordination of the FL and PA bacterial profiles. Points (profiles) are grouped by independent factor variables “site” and “season” (blue ovals). The profiles of the Selenga mouth were excluded from this analysis. Figure S6. PCoA of FL and PA communities. Glyph shape denotes the community lifestyle: FL—circle, PA—square. Glyphs are colored according to depth of sampling. Table S1. Physical, chemical and biological characteristics of samples. Table S2. Non-parametric alpha-diversity metrics calculated for the bacterial (FL and PA) and microeukaryotic samples. Table S3. Sequence similarity of microeukaryotic OTUs, with the known sequences of 18S rRNA gene from GenBank database. Table S4. Abundance of OTUs having significant differences between FL and PA bacterial communities at different time points (April, March and July), and at the Selenga mouth stations. Group and contrasts—a set of samples to be statistically tested for differential abundance; is_major—whether the OTU total relative abundance exceeds 0.1%; is_shared—whether OTU is differentially abundant between FL and PA across all three months; is_major_shared—both conditions are met; group1_mean/group2_mean—mean normalized count of OTU for reference (first/second) contrast (same factor variable in pairwise comparison); log2FoldChange −log2(reference abundance/target abundance); padj—FDR-adjusted p-value for abs(LFC) ≥ log2(1.5); slv_* and fw_*—OTU taxonomic assignment for Silva and Freshwater taxonomies. Table S5. Metabolic functions of FL and PA communities based on KEGG KO gene, EC and MetaCyc pathway annotations.

Author Contributions

Conceptualization, M.B.; methodology, M.B., I.T. and Y.G.; software, Y.G.; validation, M.B. and Y.G.; formal analysis, M.B., A.M., I.T., Y.Y., L.T. and Y.G.; investigation, M.B., A.M., I.T., Y.Y., L.T. and Y.G.; writing—original draft preparation, M.B.; writing—review and editing, M.B., A.M., I.T., L.T. and Y.G.; visualization, Y.G. and M.B.; supervision, M.B.; funding acquisition, M.B. All authors have read and agreed to the published version of the manuscript.

Funding

The work was supported by the Russian Science Foundation № 21-74-00147, https://rscf.ru/project/21-74-00147 (accessed on 14 April 2023).

Institutional Review Board Statement

Not applicable.

Data Availability Statement

The raw sequencing data were submitted to the Sequence Read Archive database (https://www.ncbi.nlm.nih.gov/sra, 19 December 2022) of the National Center for Biotechnology Information under the BioProject number PRJNA913685.

Acknowledgments

Authors are grateful to K.Yu. Arsentyev, I.A. Nebesnykh, V.I. Chernykh, Yu.R. Zakharova for the assistance in sampling, to A.A. Morozov and N. Shvedova for the translation of the article into English, to Ye.V. Likhoshway for comments and constructive editing. The work was done using equipment of the Core Centrum ”Genomic Technologies, Proteomics and Cell Biology” in ARRIAM. We also gratefully acknowledge the Irkutsk Supercomputer Center of Siberian Branch of the Russian Academy of Sciences for providing the access to HPC-cluster “Akademik V.M. Matrosov” and Shared Equipment Center for Integrated information and computing network of Irkutsk Research and Educational Complex for the data storage infrastructure. Microscopy was performed on the basis of the Instrumental Centre “Electron Microscopy” (http://www.lin.irk.ru/copp, 16 March 2023) of the Shared Research Facilities for Research “Ultramicroanalysis”. We would like to thank Reviewers for taking the time and effort necessary to review the manuscript.

Conflicts of Interest

The authors declare no conflict of interest.

References

  1. Azam, F.; Fenchel, T.; Field, J.G.; Gray, J.S.; Meyer-Reil, L.A.; Thingstad, F. The ecological role of water-column microbes in the sea. Mar. Ecol. Prog. Ser. 1983, 10, 257–263. Available online: http://www.jstor.org/stable/24814647 (accessed on 10 March 2023). [CrossRef]
  2. Azam, F.; Malfatti, F. Microbial structuring of marine ecosystems. Nat. Rev. Microbiol. 2007, 5, 782–791. [Google Scholar] [CrossRef]
  3. DeLong, E.; Franks, D.; Alldredge, A. Phylogenetic diversity of aggregate-attached vs. free-living marine bacterial assemblages. Limnol. Oceanogr. 1993, 38, 924–934. [Google Scholar] [CrossRef]
  4. Kellogg, C.T.; Deming, J.W. Comparison of free-living, suspended particle, and aggregate-associated bacterial and archaeal communities in the Laptev Sea. Aquat. Microb. Ecol. 2009, 57, 1–18. [Google Scholar] [CrossRef]
  5. Dang, H.; Lovell, C.R. Microbial surface colonization and biofilm development in marine environments. Microbiol. Mol. Biol. Rev. 2016, 80, 91–138. [Google Scholar] [CrossRef]
  6. Mou, X.; Jacob, J.; Lu, X.; Robbins, S.; Sun, S.; Ortiz, J.D. Diversity and distribution of free-living and particle-associated bacterioplankton in Sandusky Bay and adjacent waters of Lake Erie Western Basin. J. Great Lakes Res. 2013, 39, 352–357. [Google Scholar] [CrossRef]
  7. Tang, X.; Chao, J.; Gong, Y.; Wang, Y.; Wilhelm, S.W.; Gao, G. Spatiotemporal dynamics of bacterial community composition in large shallow eutrophic Lake Taihu: High overlap between free-living and particle-attached assemblages. Limnol. Oceanogr. 2017, 62, 1366–1382. [Google Scholar] [CrossRef]
  8. Xu, H.; Zhao, D.; Huang, R.; Cao, X.; Zeng, J.; Yu, Z.; Hooker, K.V.; Hambright, K.D.; Wu, Q.L. Contrasting network features between free-living and particle-attached bacterial communities in Taihu Lake. Microb. Ecol. 2018, 76, 303–313. [Google Scholar] [CrossRef]
  9. Savio, D.; Sinclair, L.; Ijaz, U.Z.; Parajka, J.; Reischer, G.H.; Stadler, P.; Blaschke, A.P.; Blöschl, G.; Mach, R.L.; Kirschner, A.K.T.; et al. Bacterial diversity along a 2600 km river continuum. Environ. Microbiol. 2015, 17, 4994–5007. [Google Scholar] [CrossRef]
  10. Satinsky, B.M.; Smith, C.B.; Sharma, S.; Landa, M.; Medeiros, P.M.; Coles, V.J.; Yager, P.L.; Crump, B.C.; Moran, M.A. Expression patterns of elemental cycling genes in the Amazon River Plume. ISME J. 2017, 11, 1852–1864. [Google Scholar] [CrossRef]
  11. Yoshimura, K.M.; York, J.; Biddle, J.F. Impacts of salinity and oxygen on particle-associated microbial communities in the Broadkill River, Lewes DE. Front. Mar. Sci. 2018, 5, 100. [Google Scholar] [CrossRef]
  12. Smith, M.W.; Zeigler Allen, L.; Allen, A.E.; Herfort, L.; Simon, H.M. Contrasting genomic properties of free-living and particle-attached microbial assemblages within a coastal ecosystem. Front. Microbiol. 2013, 4, 120. [Google Scholar] [CrossRef] [PubMed]
  13. Bižić-Ionescu, M.; Zeder, M.; Ionescu, D.; Orlić, S.; Fuchs, B.M.; Grossart, H.P.; Amann, R. Comparison of bacterial communities on limnic versus coastal marine particles reveals profound differences in colonization. Environ. Microbiol. 2015, 17, 3500–3514. [Google Scholar] [CrossRef] [PubMed]
  14. Rieck, A.; Herlemann, D.P.; Jürgens, K.; Grossart, H.P. Particle-associated differ from free-living bacteria in surface waters of the Baltic Sea. Front. Microbiol. 2015, 6, 1297. [Google Scholar] [CrossRef]
  15. Mestre, M.; Borrull, E.; Sala, M.M.; Gasol, J.M. Patterns of bacterial diversity in the marine planktonic particulate matter continuum. ISME J. 2017, 11, 999–1010. [Google Scholar] [CrossRef]
  16. Kieft, B.; Li, Z.; Bryson, S.; Crump, B.C.; Hettich, R.; Pan, C.; Mayali, X.; Mueller, R.S. Microbial community structure–function relationships in yaquina bay estuary reveal spatially distinct carbon and nitrogen cycling capacities. Front. Microbiol. 2018, 9, 1282. [Google Scholar] [CrossRef]
  17. Liu, Y.; Lin, Q.; Feng, J.; Yang, F.; Du, H.; Hu, Z.; Wang, H. Differences in metabolic potential between particle-associated and free-living bacteria along Pearl River Estuary. Sci. Total Environ. 2020, 728, 138856. [Google Scholar] [CrossRef]
  18. Roth Rosenberg, D.; Haber, M.; Goldford, J.; Lalzar, M.; Aharonovich, D.; Al-Ashhab, A.; Lehahn, Y.; Segrè, D.; Steindler, L.; Sher, D. Particle-associated and free-living bacterial communities in an oligotrophic sea are affected by different environmental factors. Environ. Microbiol. 2021, 23, 4295–4308. [Google Scholar] [CrossRef]
  19. Rink, B.; Martens, T.; Fischer, D.; Lemke, A.; Grossart, H.P.; Simon, M.; Brinkhoff, T. Short-term dynamics of bacterial communities in a tidally affected coastal ecosystem. FEMS Microb. Ecol. 2008, 66, 306–319. [Google Scholar] [CrossRef]
  20. Ortega-Retuerta, E.; Joux, F.; Jeffrey, W.H.; Ghiglione, J.F. Spatial variability of particle-attached and free-living bacterial diversity in surface waters from the Mackenzie River to the Beaufort Sea (Canadian Arctic). Biogeosciences 2013, 10, 2747–2759. [Google Scholar] [CrossRef]
  21. Bižić-Ionescu, M.; Amann, R.; Grossart, H.P. Massive regime shifts and high activity of heterotrophic bacteria in an ice-covered lake. PLoS ONE 2014, 9, e113611. [Google Scholar] [CrossRef]
  22. Allgaier, M.; Grossart, H.P. Seasonal dynamics and phylogenetic diversity of free-living and particle-associated bacterial communities in four lakes in northeastern Germany. Aquat. Microb. Ecol. 2006, 45, 115–128. [Google Scholar] [CrossRef]
  23. Rösel, S.; Allgaier, M.; Grossart, H.P. Long-term characterization of free-living and particle-associated bacterial communities in Lake Tiefwaren reveals distinct seasonal patterns. Microb. Ecol. 2012, 64, 571–583. [Google Scholar] [CrossRef]
  24. Teeling, H.; Fuchs, B.M.; Becher, D.; Klockow, C.; Gardebrecht, A.; Bennke, C.M.; Kassabgy, M.; Huang, S.; Mann, A.J.; Waldmann, J.; et al. Substrate-controlled succession of marine bacterioplankton populations induced by a phytoplankton bloom. Science 2012, 336, 608–611. [Google Scholar] [CrossRef]
  25. Galazy, G.I. Atlas of Lake Baikal; Ruscartography: Moscow, Russia, 1993. [Google Scholar]
  26. Shimaraev, M.N.; Verbolov, V.I.; Granin, N.G.; Sherstayankin, P.P. Physical Limnology of Lake Baikal: A Review; Baikal International Center for Ecological Research: Irkutsk, Russia, 1994. [Google Scholar]
  27. Hampton, S.E.; Izmest’eva, L.R.; Moore, M.V.; Katz, S.L.; Dennis, B.; Silow, E.A. Sixty years of environmental change in the world’s largest freshwater lake–Lake Baikal, Siberia. Global Change Biol. 2008, 14, 1947–1958. [Google Scholar] [CrossRef]
  28. Moore, M.V.; Hampton, S.E.; Izmest’Eva, L.R.; Silow, E.A.; Peshkova, E.V.; Pavlov, B.K. Climate change and the world’s ‘‘sacred sea”—Lake Baikal, Siberia. Bioscience 2009, 59, 405–417. [Google Scholar] [CrossRef]
  29. Shimaraev, M.N.; Sizova, L.N.; Troitskaya, E.S.; Kuimova, L.N.; Yakimova, N.I. Ice-thermal regime of lake baikal under conditions of modern warming (1950–2017). Russ. Meteorol. Hydrol. 2019, 44, 679–686. [Google Scholar] [CrossRef]
  30. Sherstyankin, P.P. Dynamics of the Selenga shallow waters in early summer according to the distribution of optical characteristics and water temperature. In Hydrometeorological Regime of Lake Baikal; Nauka: Moscow, Russia, 1964; p. 2937. [Google Scholar]
  31. Bashenkhaeva, N.V.; Sinyukovich, V.N.; Sorokovikova, L.M.; Khodzher, T.V. Organic matter in the water of the Selenga river. Geogr. Nat. Resour. 2006, 1, 47–54. [Google Scholar]
  32. Tomberg, I.V.; Sorokovikova, L.M.; Popovskaya, G.I.; Bashenkhaeva, N.V.; Sinyukovich, V.N.; Ivanov, V.G. Concentration dynamics of biogenic elements and phytoplankton at Selenga R. Mouth and in Selenga shallows (Lake Baikal). Water Resour. 2014, 41, 687–695. [Google Scholar] [CrossRef]
  33. Chebykin, E.P.; Sorokovikova, L.M.; Tomberg, I.V.; Rasskazov, S.V.; Khodzher, T.V.; Grachev, M.A. Current State of the Selenga River Waters in the RussianTerritory Concerning Major Components and Trace Elements. Chem. Sustain. Dev. 2012, 20, 561–580. [Google Scholar]
  34. Popovskaya, G.I.; Tashlykova, N.A. Phytoplankton of the Selenga River. In The Selenga River Delta: A Natural Biofilter and Indicator of the State of Lake Baikal; Izd-vo. SO RAN: Novosibirsk, Russia, 2008; pp. 167–182. [Google Scholar]
  35. Maksimenko, S.Y.; Zemskaya, T.I.; Pavlova, O.N.; Ivanov, V.G.; Buryukhaev, S.P. Microbial community of the water column of the Selenga River-Lake Baikal biogeochemical barrier. Microbiology 2008, 77, 587–594. [Google Scholar] [CrossRef]
  36. Mikhailov, I.S.; Zakharova, Y.R.; Galachyants, Y.P.; Usoltseva, M.V.; Petrova, D.P.; Sakirko, M.V.; Likhoshway, Y.V.; Grachev, M.A. Similarity of structure of taxonomic bacterial communities in the photic layer of Lake Baikal’s three basins differing in spring phytoplankton composition and abundance. Dokl. Biochem. Biophys. 2015, 465, 413–419. [Google Scholar] [CrossRef] [PubMed]
  37. Mikhailov, I.S.; Zakharova, Y.R.; Bukin, Y.S.; Galachyants, Y.P.; Petrova, D.P.; Sakirko, M.V.; Likhoshway, Y.V. Co-occurrence networks among bacteria and microbial eukaryotes of Lake Baikal during a spring phytoplankton bloom. Microb. Ecol. 2019, 77, 96–109. [Google Scholar] [CrossRef] [PubMed]
  38. Zakharova, Y.R.; Galachyants, Y.P.; Kurilkina, M.I.; Likhoshvay, A.V.; Petrova, D.P.; Shishlyannikov, S.M.; Ravin, N.V.; Mardanov, A.V.; Beletsky, A.V.; Likhoshway, Y.V. The structure of microbial community and degradation of diatoms in the deep near-bottom layer of Lake Baikal. PLoS ONE 2013, 8, e59977. [Google Scholar] [CrossRef]
  39. Zemskaya, T.I.; Lomakina, A.V.; Mamaeva, E.V.; Zakharenko, A.S.; Pogodaeva, T.V.; Petrova, D.P.; Galachyants, Y.P. Bacterial communities in sediments of Lake Baikal from areas with oil and gas discharge. Aquat. Microb. Ecol. 2015, 76, 95–109. [Google Scholar] [CrossRef]
  40. Zakharova, Y.R.; Petrova, D.P.; Galachyants, Y.P.; Bashenkhaeva, M.V.; Kurilkina, M.I.; Likhoshway, Y.V. Bacterial and archaeal community structure in the surface diatom sediments of deep freshwater Lake Baikal (eastern Siberia). Geomicrobiol. J. 2018, 35, 635–647. [Google Scholar] [CrossRef]
  41. Zemskaya, T.I.; Bukin, S.V.; Lomakina, A.V.; Pavlova, O.N. Microorganisms in the Sediments of Lake Baikal, the Deepest and Oldest Lake in the World. Microbiology 2021, 90, 298–313. [Google Scholar] [CrossRef]
  42. Bashenkhaeva, M.V.; Zakharova, Y.R.; Petrova, D.P.; Khanaev, I.V.; Galachyants, Y.P.; Likhoshway, Y.V. Sub-ice microalgal and bacterial communities in freshwater Lake Baikal. Russia. Microb. Ecol. 2015, 70, 751–765. [Google Scholar] [CrossRef]
  43. Bashenkhaeva, M.V.; Zakharova, Y.R.; Galachyants, Y.P.; Khanaev, I.V.; Likhoshway, Y.V. Bacterial communities during the period of massive under-ice dinoflagellate development in Lake Baikal. Microbiology 2017, 86, 524–532. [Google Scholar] [CrossRef]
  44. Zemskaya, T.I.; Bukin, S.V.; Bukin, Y.S.; Chernitsina, S.M.; Pogodaeva, T.V.; Rusanov, I.I.; Shubenkova, O.V.; Zakharenko, A.S.; Pimenov, N.V. Taxonomic diversity and metabolic activity of microbial communities in rivers and estuarine waters of Southern Baikal in summer. J. Great Lakes Res. 2022, 48, 125–142. [Google Scholar] [CrossRef]
  45. Mikhailov, I.S.; Galachyants, Y.P.; Bukin, Y.S.; Petrova, D.P.; Bashenkhaeva, M.V.; Sakirko, M.V.; Blinov, V.V.; Titova, L.A.; Zakharova, Y.R.; Likhoshway, Y.V. Seasonal Succession and Coherence Among Bacteria and Microeukaryotes in Lake Baikal. Microb. Ecol. 2022, 84, 404–422. [Google Scholar] [CrossRef]
  46. Mikhailov, I.S.; Bukin, Y.S.; Zakharova, Y.R.; Usoltseva, M.V.; Galachyants, Y.P.; Sakirko, M.V.; Blinov, V.V.; Likhoshway, Y.V. Co-occurrence patterns between phytoplankton and bacterioplankton across the pelagic zone of Lake Baikal during spring. J. Microbiol. 2019, 57, 252–262. [Google Scholar] [CrossRef]
  47. Bashenkhaeva, M.V.; Galachyants, Y.P.; Khanaev, I.V.; Sakirko, M.V.; Petrova, D.P.; Likhoshway, Y.V.; Zakharova, Y.R. Comparative analysis of free-living and particle-associated bacterial communities of Lake Baikal during the ice-covered period. J. Great Lakes Res. 2020, 46, 508–518. [Google Scholar] [CrossRef]
  48. Grossart, H.P.; Kiørboe, T.; Tang, K.; Ploug, H. Bacterial colonization of particles: Growth and interactions. Appl. Environ. Microbiol. 2003, 69, 3500–3509. [Google Scholar] [CrossRef]
  49. Lyons, M.M.; Dobbs, F.C. Differential utilization of carbon substrates by aggregate-associated and water-associated heterotrophic bacterial communities. Hydrobiologia 2012, 686, 181–193. [Google Scholar] [CrossRef]
  50. Wetzel, R.G.; Likens, G.E. Composition and biomass of phytoplankton. In Limnological Analyses; Springer: New York, NY, USA, 2000; pp. 147–174. [Google Scholar] [CrossRef]
  51. Boeva, L. Manual for the Chemical Analysis of Surface Waters; RosHydromet: Rostov-on-Don, Russia, 2009; p. 1044. (In Russian) [Google Scholar]
  52. Acinas, S.G.; Rodríguez-Valera, F.; Pedrós-Alió, C. Spatial and temporal variation in marine bacterioplankton diversity as shown by RFLP fingerprinting of PCR amplified 16S rDNA. FEMS Microbiol. Ecol. 1997, 24, 27–40. [Google Scholar] [CrossRef]
  53. Rusch, D.B.; Halpern, A.L.; Sutton, G.; Heidelberg, K.B.; Williamson, S.; Yooseph, S.; Wu, D.; Eisen, J.A.; Hoffman, J.M.; Remington, K.; et al. The Sorcerer II Global Ocean Sampling Expedition: Northwest Atlantic through Eastern Tropical Pacific. PLoS Biol. 2007, 5, e77. [Google Scholar] [CrossRef]
  54. Baker, G.C.; Smith, J.J.; Cowan, D.A. Review and re-analysis of domain-specific 16S primers. J. Microbiol. Methods 2003, 55, 541–555. [Google Scholar] [CrossRef]
  55. Bradley, I.M.; Pinto, A.J.; Guest, J.S. Design and evaluation of Illumina MiSeq-compatible, 18S rRNA gene-specific primers for improved characterization of mixed phototrophic communities. Appl. Environ. Microbiol. 2016, 82, 5878–5891. [Google Scholar] [CrossRef]
  56. Edgar, R.C. Search and clustering orders of magnitude faster than BLAST. Bioinformatics 2010, 26, 2460–2461. [Google Scholar] [CrossRef]
  57. Rognes, T.; Flouri, T.; Nichols, B.; Quince, C.; Mahe, F. VSEARCH: A versatile open source tool for metagenomics. Peer J. 2016, 4, e2584. [Google Scholar] [CrossRef] [PubMed]
  58. Schloss, P.D.; Westcott, S.L.; Ryabin, T.; Hall, J.R.; Hartmann, M.; Hollister, E.B.; Lesniewski, R.A.; Oakley, B.B.; Parks, D.H.; Robinson, C.J. Introducing mothur: Open-source, platform-independent, community-supported software for describing and comparing microbial communities. Appl. Environ. Microbiol. 2009, 75, 7537–7541. [Google Scholar] [CrossRef] [PubMed]
  59. Oksanen, J.; Blanchet, F.G.; Friendly, M.; Kindt, R.; Legendre, P.; McGlinn, D.; Minchin, P.R.; O’Hara, R.B.; Simpson, G.L.; Solymos, P.; et al. Vegan: Community Ecology Package. R Package Version 2.5-6. 2019. Available online: https://CRAN.R-project.org/package=vegan (accessed on 10 March 2023).
  60. McMurdie, P.J.; Holmes, S. phyloseq: An R package for reproducible interactive analysis and graphics of microbiome census data. PLoS ONE 2013, 8, e61217. [Google Scholar] [CrossRef] [PubMed]
  61. Suzuki, R.; Terada, Y.; Shimodaira, H. Pvclust: Hierarchical Clustering with p-Values Via Multiscale Bootstrap Resampling. R Package Version 2.2-0. 2019. Available online: https://CRAN.R-project.org/package=pvclust (accessed on 10 March 2023).
  62. Kolde, R. Pheatmap: Pretty Heatmaps. R Package Version 1.0.12. 2019. Available online: https://CRAN.R-project.org/package=pheatmap (accessed on 10 March 2023).
  63. Van den Brand, T. ggh4x: Hacks for ‘ggplot2’. R Package Version 0.2.3. 2022. Available online: https://CRAN.R-project.org/package=ggh4x (accessed on 10 March 2023).
  64. Love, M.I.; Huber, W.; Anders, S. Moderated estimation of fold change and dispersion for RNA-seq data with DESeq2. Genome Biol. 2014, 15, 550. [Google Scholar] [CrossRef]
  65. Kurtz, Z.D.; Müller, C.L.; Miraldi, E.R.; Littman, D.R.; Blaser, M.J.; Bonneau, R.A. Sparse and Compositionally Robust Inference of Microbial Ecological Networks. PLoS Comput. Biol. 2015, 11, e1004226. [Google Scholar] [CrossRef]
  66. Cougoul, A.; Bailly, X.; Wit, E.C. MAGMA: Inference of sparse microbial association networks. BioRxiv 2019, 538579. [Google Scholar] [CrossRef]
  67. Prost, V.; Gazut, S.; Brüls, T. A zero inflated log-normal model for inference of sparse microbial association networks. PLoS Comput. Biol. 2021, 17, e1009089. [Google Scholar] [CrossRef]
  68. Friedman, J.; Alm, E.J. Inferring correlation networks from genomic survey data. PLoS Comput. Biol. 2012, 8, e1002687. [Google Scholar] [CrossRef]
  69. Douglas, G.M.; Maffei, V.J.; Zaneveld, J.R.; Yurgel, S.N.; Brown, J.R.; Taylor, C.M.; Huttenhower, C.; Langille, M.G.I. PICRUSt2 for prediction of metagenome functions. Nat. Biotechnol. 2020, 38, 685–688. [Google Scholar] [CrossRef]
  70. Fernandes, A.D.; Macklaim, J.M.; Linn, T.G.; Reid, G.; Gloor, G.B. ANOVA-Like Differential Expression (ALDEx) Analysis for Mixed Population RNA-Seq. PLoS ONE 2013, 8, e67019. [Google Scholar] [CrossRef]
  71. Gilbert, J.A.; Steele, J.A.; Caporaso, J.; Steinbrück, L.; Reeder, J.; Temperton, B.; Huse, S.; McHardy, A.C.; Knight, R.; Joint, I.; et al. Defning seasonal marine microbial community dynamics. ISME J. 2012, 6, 298–308. [Google Scholar] [CrossRef]
  72. Bunse, C.; Pinhassi, J. Marine bacterioplankton seasonal succession dynamics. Trends Microbiol. 2017, 25, 494–505. [Google Scholar] [CrossRef]
  73. Sorokovikova, L.M.; Popovskaya, G.I.; Sinyukovich, V.N.; Tomberg, I.V.; Bashenkhaeva, N.V.; Tashlykova, N.A. Water chemistry and phytoplankton in water bodies in the Selenga River’s delta under ice cover. Water Resour. 2006, 33, 321–328. [Google Scholar] [CrossRef]
  74. Sorokovikova, L.M.; Popovskaya, G.I.; Tomberg, I.V.; Bashenkhaeva, N.V. Space and time variations in concentrations of biogenic and organic matter and phytoplankton in the water of the Selenga River and its delta branches. Water Resour. 2009, 36, 443–452. [Google Scholar] [CrossRef]
  75. Gendron, E.M.S.; Darcy, J.L.; Hell, K.; Schmidt, S.K. Structure of bacterial and eukaryote communities reflect in situ controls on community assembly in a high-alpine lake. J Microbiol. 2019, 57, 852–864. [Google Scholar] [CrossRef]
  76. Williams, T.M.; Unz, R.F. Filamentous sulfur bacteria of activated sludge: Characterization of Thiothrix, Beggiatoa, and Eikelboom type 021N strains. Appl. Environ. Microbiol. 1985, 49, 887–898. [Google Scholar] [CrossRef]
  77. Kämpfer, P. Some chemotaxonomic and physiological properties of the genus Sphaerotilus. Syst. Appl. Microbiol. 1998, 21, 245–250. [Google Scholar] [CrossRef]
  78. Rubio-Rincón, F.J.; Welles, L.; Lopez-Vazquez, C.M.; Nierychlo, M.; Abbas, B.; Geleijnse, M.; Nielsen, P.H.; van Loosdrecht, M.C.M.; Brdjanovic, D. Long-term effects of sulphide on the enhanced biological removal of phosphorus: The symbiotic role of Thiothrix Caldifontis. Water Res. 2017, 116, 53–64. [Google Scholar] [CrossRef]
  79. Meng, Q.; Zeng, W.; Wang, B.; Fan, Z.; Peng, Y. New insights in the competition of polyphosphate-accumulating organisms and glycogen-accumulating organisms under glycogen accumulating metabolism with trace Poly-P using flow cytometry. Chem. Eng. J. 2020, 385, 123915. [Google Scholar] [CrossRef]
  80. Ngo, D.H.; Kim, S.K. Sulfated polysaccharides as bioactive agents from marine algae. Int. J. Biol. Macromol. 2013, 62, 70–75. [Google Scholar] [CrossRef]
  81. Darcy, J.L.; Lynch, R.C.; King, A.J.; Robeson, M.S.; Schmidt, S.K. Global Distribution of Polaromonas Phylotypes-Evidence for a Highly Successful Dispersal Capacity. PLoS ONE 2011, 6, e23742. [Google Scholar] [CrossRef] [PubMed]
  82. Hiraishi, A.; Imhoff, J.F. Rhodoferax. In Bergey’s Manual of Systematics of Archaea and Bacteria; Wiley: Hoboken, NJ, USA, 2015; pp. 1–11. [Google Scholar] [CrossRef]
  83. Gawor, J.; Grzesiak, J.; Sasin-Kurowska, J.; Borsuk, P.; Gromadka, R.; Górniak, D.; Świątecki, A.; Aleksandrzak-Piekarczyk, T.; Zdanowski, M.K. Evidence of adaptation, niche separation and microevolution within the genus Polaromonas on Arctic and Antarctic glacial surfaces. Extremophiles 2016, 20, 403–413. [Google Scholar] [CrossRef] [PubMed]
  84. Kanzler, B.E.; Pfannes, K.R.; Vogl, K.; Overmann, J. Molecular characterization of the nonphotosynthetic partner bacterium in the consortium “Chlorochromatium aggregatum”. Appl. Environ. Microbiol. 2005, 71, 7434–7441. [Google Scholar] [CrossRef] [PubMed]
  85. Garneau, M.È.; Vincent, W.F.; Terrado, R.; Lovejoy, C. Importance of particle-associated bacterial heterotrophy in a coastal Arctic ecosystem. J. Mar. Syst. 2009, 75, 185–197. [Google Scholar] [CrossRef]
  86. Parveen, B.; Reveilliez, J.P.; Mary, I.; Ravet, V.; Bronner, G.; J-Fo, M.; Domaizon, I.; Debroas, D. Diversity and dynamics of free-living and particle-associated Betaproteobacteria and Actinobacteria in relation to phytoplankton and zooplankton communities. FEMS Microbiol. Ecol. 2011, 77, 461–476. [Google Scholar] [CrossRef]
  87. Votintsev, K.K. Hydrochemistry of Lake Baikal. Proc. Baikal Limnol. St. 1961, 20, 1–312. [Google Scholar]
  88. Glockner, F.O.; Zaichikov, E.; Belkova, N.; Denissova, L.; Pernthaler, J.; Pernthaler, A.; Amann, R. Comparative 16S rRNA analysis of lake bacterioplankton reveals globally distributed phylogenetic clusters including an abundant group of Actinobacteria. Appl. Environ. Microbiol. 2000, 66, 5053–5065. [Google Scholar] [CrossRef]
  89. Salcher, M.M.; Pernthaler, J.; Posch, T. Spatiotemporal distribution and activity patterns of bacteria from three phylogenetic groups in an oligomesotrophic lake. Limnol. Oceanogr. 2010, 55, 846–856. [Google Scholar] [CrossRef]
  90. McKay, R.M.; Prášil, O.; Pechar, L.; Lawrenz, E.; Rozmarynowycz, M.J.; Bullerjahn, G.S. Freshwater ice as habitat: Partitioning of phytoplankton and bacteria between ice and water in central European reservoirs. Environ. Microbiol. Rep. 2015, 7, 887–898. [Google Scholar] [CrossRef]
  91. Bullerjahn, G.S.; McKay, R.M.L.; Bernát, G.; Prášil, O.; Vörös, L.; Pálffy, K.; Tugyi, N.; Somogyi, B. Community dynamics and function of algae and bacteria during winter in central European great lakes. J. Great Lakes Res. 2019, 46, 732–740. [Google Scholar] [CrossRef]
  92. Bondarenko, N.A.; Rusanov, I.I.; Chernitsyna, S.M.; Shubenkova, O.V.; Zaharenko, A.S.; Pogodaeva, T.V.; Pimenov, N.V.; Zemskaya, T.I. Structure and Production Potential of Summer Phytoplankton of Lake Baikal in the Present Period. Water Resour. 2022, 49, 98–108. [Google Scholar] [CrossRef]
  93. Zemskaya, T.I.; Pogodaeva, T.V.; Shubenkova, O.V.; Chernitsina, S.M.; Dagurova, O.P.; Buryukhaev, S.P.; Namsaraev, B.B.; Khlystov, O.M.; Egorov, A.V.; Krylov, A.A.; et al. Geochemical and microbiological characteristics of sediments near the Malenky mud volcano (Lake Baikal, Russia), with evidence of Archaea intermediate between the marine anaerobic methanotrophs ANME-2 and ANME-3. Geo-Mar. Lett. 2010, 30, 411–425. [Google Scholar] [CrossRef]
  94. Pavlova, O.N.; Bukin, S.V.; Lomakina, A.V.; Kalmychkov, G.V.; Ivanov, V.G.; Morozov, I.V.; Pogodaeva, T.V.; Pimenov, N.V.; Zemskaya, T.I. Production of gaseous hydrocarbons by microbial communities of Lake Baikal bottom sediments. Microbiology 2014, 83, 798–804. [Google Scholar] [CrossRef]
  95. Oswald, K.; Graf, J.S.; Littmann, S.; Tienken, D.; Brand, A.; Wehrli, B.; Albertsen, M.; Daims, H.; Wagner, M.; Kuypers, M.M.M. Crenothrix are major methane consumers in stratified lakes. ISME J. 2017, 11, 2124–2140. [Google Scholar] [CrossRef]
  96. Cabrol, L.; Thalasso, F.; Gandois, L.; Sepulveda-Jauregui, A.; Martinez-Cruz, K.; Teisserenc, R.; Tananaev, N.; Tveit, A.; Svenningg, M.M.; Barret, M. Anaerobic oxidation of methane and associated microbiome in anoxic water of Northwestern Siberian lakes. Sci. Total Environ. 2020, 736, 139588. [Google Scholar] [CrossRef]
  97. Zakharenko, A.S.; Galachyants, Y.P.; Morozov, I.V.; Shubenkova, O.V.; Morozov, A.A.; Ivanov, V.G.; Pimenov, N.V.; Krasnopeev, A.Y.; Zemskaya, T.I. Bacterial Communities in Areas of Oil and Methane Seeps in Pelagic of Lake Baikal. Microb. Ecol. 2019, 78, 269–285. [Google Scholar] [CrossRef]
  98. Parveen, B.; Mary, I.; Vellet, A.; Ravet, V.; Debroas, D. Temporal dynamics and phylogenetic diversity of free-living and particle-associated Verrucomicrobia communities in relation to environmental variables in a mesotrophic lake. FEMS Microbiol. Ecol. 2013, 83, 189–201. [Google Scholar] [CrossRef]
  99. Cardman, Z.; Arnosti, C.; Durbin, A.; Ziervogel, K.; Cox, C.; Steen, A.D.; Teske, A. Verrucomicrobia: Candidates for polysaccharide-degrading bacterioplankton in an Arctic fjord of Svalbard. Appl. Environ. Microbiol. 2014, 80, 3749–3756. [Google Scholar] [CrossRef]
  100. Beall, B.F.N.; Twiss, M.R.; Smith, D.E.; Oyserman, B.O.; Rozmarynowycz, M.J.; Binding, C.E.; Bourbonniere, R.A.; Bullerjahn, G.S.; Palmer, M.E.; Reavie, E.D.; et al. Ice cover extent drives phytoplankton and bacterial community structure in a large north-temperate lake: Implications for a warming climate. Environ. Microbiol. 2016, 18, 1704–1719. [Google Scholar] [CrossRef]
  101. Landa, M.; Blain, S.; Harmand, J.; Monchy, S.; Rapaport, A.; Obernosterer, I. Major changes in the composition of a Southern Ocean bacterial community in response to diatom-derived dissolved organic matter. FEMS Microbiol. Ecol. 2018, 94, fiy034. [Google Scholar] [CrossRef]
  102. Tran, P.; Ramachandran, A.; Khawasik, O.; Beisner, B.E.; Rautio, M.; Huot, Y.; Walsh, D.A. Microbial life under ice: Metagenome diversity and in situ activity of Verrucomicrobia in seasonally ice-covered Lakes. Environ. Microbiol. 2018, 20, 2568–2584. [Google Scholar] [CrossRef] [PubMed]
  103. Martinez-Garcia, M.; Brazel, D.M.; Swan, B.K.; Arnosti, C.; Chain, P.S.; Reitenga, K.G.; Xie, G.; Poulton, N.J.; Gomez, M.L.; Masland, D.E.D.; et al. Capturing single cell genomes of active polysaccharide degraders: An unexpected contribution of Verrucomicrobia. PLoS ONE 2012, 7, e35314. [Google Scholar] [CrossRef]
  104. Orellana, L.H.; Francis, T.B.; Ferraro, M.; Hehemann, J.H.; Fuchs, B.M.; Amann, R.I. Verrucomicrobiota are specialist consumers of sulfated methyl pentoses during diatom blooms. ISME J. 2022, 16, 630–641. [Google Scholar] [CrossRef] [PubMed]
  105. Vidal-Melgosa, S.; Sichert, A.; Francis, T.B.; Bartosik, D.; Niggemann, J.; Wichels, A.; Willats, W.G.T.; Fuchs, B.M.; Teeling, H.; Becher, D.; et al. Diatom fucan polysaccharide precipitates carbon during algal blooms. Nat. Commun. 2021, 12, 1150. [Google Scholar] [CrossRef] [PubMed]
  106. Vanhooren, P.T.; Vandamme, E.J. L-Fucose: Occurrence, physiological role, chemical, enzymatic and microbial synthesis. J. Chem. Technol. Biotechnol. 1999, 74, 479–497. [Google Scholar] [CrossRef]
  107. Mayali, X.; Azam, F. Algicidal bacteria in the sea and their impact on algal blooms. J. Eukaryot. Microbiol. 2004, 51, 139–144. [Google Scholar] [CrossRef]
  108. Hess, S.; Suthaus, A.; Melkonian, M. “Candidatus Finniella” (Rickettsiales, Alphaproteobacteria), novel endosymbionts of viridiraptorid amoeboflagellates (Cercozoa, Rhizaria). Appl. Environ. Microbiol. 2016, 82, 659–670. [Google Scholar] [CrossRef]
  109. Olson, J.B.; Steppe, T.F.; Litaker, R.W.; Paer, H.W. N2-Fixing Microbial Consortia Associated with the Ice Cover of Lake Bonney, Antarctica. Microb. Ecol. 1998, 36, 231–238. [Google Scholar] [CrossRef]
  110. Klawonn, I.; Bonaglia, S.; Brüchert, V.; Ploug, H. Aerobic and anaerobic nitrogen transformation processes in N2-fixing cyanobacterial aggregates. ISME J. 2015, 9, 1456–1466. [Google Scholar] [CrossRef]
  111. Bengtsson, M.M.; Øvreås, L. Planctomycetes dominate biofilms on surfaces of the kelp Laminaria hyperborea. BMC Microbiol. 2010, 10, 261. [Google Scholar] [CrossRef]
  112. Burke, C.; Thomas, T.; Lewis, M.; Steinberg, P.; Kjelleberg, S. Composition, uniqueness and variability of the epiphytic bacterial community of the green alga Ulva australis. ISME J. 2011, 5, 590–600. [Google Scholar] [CrossRef]
  113. Lachnit, T.; Meske, D.; Wahl, M.; Harder, T.; Schmitz, R. Epibacterial community patterns on marine macroalgae are host-specific but temporally variable. Environ. Microbiol. 2011, 13, 655–665. [Google Scholar] [CrossRef]
  114. Lage, O.M.; Bondoso, J. Planctomycetes diversity associated with macroalgae: Planctomycetes-macroalgae diversity. FEMS Microbiol. Ecol. 2011, 78, 366–375. [Google Scholar] [CrossRef] [PubMed]
  115. Lage, O.M.; Bondoso, J. Planctomycetes and macroalgae, a striking association. Front. Microbiol. 2014, 5, 267. [Google Scholar] [CrossRef]
  116. Kaboré, O.D.; Godreuil, S.; Drancourt, M. Planctomycetes as host-associated bacteria: A perspective that holds promise for their future isolations, by mimicking their native environmental niches in clinical microbiology laboratories. Front. Cell. Infect. Microbiol. 2020, 10, 519301. [Google Scholar] [CrossRef]
  117. Dedysh, S.N.; Henke, P.; Ivanova, A.A.; Kulichevskaya, I.S.; Philippov, D.A.; Meier-Kolthoff, J.P.; Göker, M.; Huang, S.; Overmann, J. 100-year-old enigma solved: Identification, genomic characterization and biogeography of the yet uncultured Planctomyces bekefii. Environ. Microbiol. 2020, 22, 198–211. [Google Scholar] [CrossRef]
  118. Wegner, C.-E.; Richter-Heitmann, T.; Klindworth, A.; Klockow, C.; Richter, M.; Achstetter, T.; Glöckner, F.O.; Harder, J. Expression of sulfatases in Rhodopirellula baltica and the diversity of sulfatases in the genus Rhodopirellula. Mar. Genom. 2013, 9, 51–61. [Google Scholar] [CrossRef]
  119. Zemskaya, T.; Egorov, A.; Khlystov, O.; Shubenkova, O.; Namsaraev, B.; Chernitsina, S.; Dagurova, O.; Kalmychkov, G.; Grachev, M. Biogeochemical cycles of methane in Lake Baikal. Geoph. Res. Abstr. 2005, 7, 03994. [Google Scholar]
  120. Gar’kusha, D.N.; Fedorov, Y.A.; Tambieva, N.S.; Andreev, Y.A.; Mikhailenko, O.A. Methane in water and bottom sediments of Lake Baikal. Water Resour. 2019, 46, 726–737. [Google Scholar] [CrossRef]
  121. Al-Saud, S.; Florea, K.M.; Webb, E.A.; Thrash, J.C. Metagenome-Assembled Genome Sequence of Kapabacteriales Bacterium Strain Clear-D13, Assembled from a Harmful Algal Bloom Enrichment Culture. Microbiol. Resour. Announc. 2020, 9, e01118–e01120. [Google Scholar] [CrossRef] [PubMed]
  122. Crespo, B.G.; Pommier, T.; Fernández-Gómez, B.; Pedrós-Alió, C. Taxonomic composition of the particle-attached and free-living bacterial assemblages in the Northwest Mediterranean Sea analyzed by pyrosequencing of the 16S rRNA. Microbiologyopen 2013, 2, 541–552. [Google Scholar] [CrossRef] [PubMed]
  123. Murrell, M.C.; Hollibaugh, J.T.; Silver, M.W.; Wong, P.S. Bacterioplankton dynamics in northern San Francisco Bay: Role of particle association and seasonal freshwater flow. Limnol. Oceanogr. 1999, 44, 295–308. [Google Scholar] [CrossRef]
  124. Richardot, M.; Debroas, D.; Thouvenot, A.; Romagoux, J.C.; Berthon, J.L.; Devaux, J. Proteolytic and glycolytic activities in size-fractionated surface water samples from an oligotrophic reservoir in relation to plankton communities. Aquat. Sci. Res. Across Bound. 1999, 61, 279–292. [Google Scholar] [CrossRef]
  125. Mével, G.; Vernet, M.; Goutx, M.; Ghiglione, J.F. Seasonal to hour variation scales in abundance and production of total and particle-attached bacteria in the open NW Mediterranean Sea (0–1000 m). Biogeosciences 2008, 5, 1573–1586. [Google Scholar] [CrossRef]
  126. Stocker, R. Marine microbes see a sea of gradients. Science 2012, 338, 628–633. [Google Scholar] [CrossRef]
  127. Pernthaler, A.; Amann, R. Fate of heterotrophic microbes in pelagic habitats: Focus on populations. Microbiol. Mol. Biol. Rev. 2005, 69, 440–461. [Google Scholar] [CrossRef]
  128. Kirchman, D. The ecology of Cytophaga-Flavobacteria in aquatic environments. FEMS Microbiol. Ecol. 2002, 39, 91–100. [Google Scholar] [CrossRef]
  129. Bauer, M.; Kube, M.; Telling, H.; Richter, M.; Lombardot, T.; Allers, E.; Wurdemann, C.A.; Quast, C.; Kuhl, H.; Knaust, F.; et al. Whole genome analysis of the marine BacteroidetesGramella forsetii’ reveals adaptations to degradation of polymeric organic matter. Environ. Microbiol. 2006, 8, 2201–2213. [Google Scholar] [CrossRef]
  130. Grossart, H.-P.; Berman, T.; Simon, M.; Pohlmann, K. Occurrence and microbial dynamics of macroscopic organic aggregates (lake snow) in Lake Kinneret, Israel, in fall. Aquat. Microb. Ecol. 1998, 14, 59–67. [Google Scholar] [CrossRef]
  131. Schweitzer, B.; Huber, I.; Amann, R.; Ludwig, W.; Simon, M. α- and β-Proteobacteria Control the Consumption and Release of Amino Acids on Lake Snow Aggregates. Appl. Environ. Microbiol. 2001, 67, 632–645. [Google Scholar] [CrossRef]
Figure 1. Sampling sites near the village of Bolshiye Koty, Varnachka area (V1, V2 and V3), and in the area where the Selenga River flows into the lake (Kharauz Channel) (S1, S2, S3 and S4).
Diversity 15 00572 g001
Figure 2. One-way ANOVA computed for environmental variables. Significance code of Tukey’s post hoc tests: *** ≤ 0.001; 0.001 ≤ ** ≤ 0.01; 0.01 ≤ * ≤ 0.05.
Diversity 15 00572 g002
Figure 3. Alpha diversity indices in microeukaryotic communities. Significance code of Tukey’s post hoc tests: *** ≤ 0.001; 0.001 ≤ ** ≤ 0.01.
Diversity 15 00572 g003
Figure 4. Microeukaryotic community composition of PA samples. PCoA of microeukaryotic communities. Glyph shape denotes under-ice (circle) and open-water (square) periods of community sampling. Glyphs are colored according to the depth at the sampling point. The under-ice samples of the upper layers circles are colored by the black oval, the under-ice samples of the deep layers are colored by the black dotted oval, and the summer samples circles are colored by the red oval (A). Hellinger-transformed relative abundances of the top-13 microeukaryotic phylotypes in PA communities. The bar stacks are arranged into four facets by two factor variables: “Layers“ and “Period”. The profiles are horizontally sorted by sampling site, month and sampling layer. Taxa presented in the color legend are sorted by total abundance in the decreasing order, except the last category, “Other”. The order of phylotypes in each bar is the same as in the color legend (B).
Diversity 15 00572 g004
Figure 5. Hierarchical clustering of log2(x + 1)-transformed microeukaryotic OTU counts. Rows—OTUs; columns—samples. Clustering was performed on a matrix of Bray-Curtis dissimilarity distances. The color-coded annotation of samples is drawn in the upper part of the heatmap; dfs—distance from the shore.
Diversity 15 00572 g005
Figure 6. Alpha richness and diversity indices in bacterial communities. Comparison of FL and PA communities (A); communities of different seasons (B); FL and PA communities in different seasons (C). Significance code of Tukey’s post hoc tests: *** ≤ 0.001; 0.001 ≤ ** ≤ 0.01; 0.01 ≤ * ≤ 0.05.
Diversity 15 00572 g006
Figure 7. PCoA of FL and PA communities. The yellow oval circles present the communities of the ice-covered period, the yellow dotted oval shows the communities of the Selenga mouth; summer communities are circled in purple oval; community FL is in black oval; community PA is in black dotted oval.
Diversity 15 00572 g007
Figure 8. Relative abundances of the top-12 bacterial phylotypes in FL (A) and PA communities (B). Phylotypes are shown at the phylum level, except for Proteobacteria, which are shown at the class level. The bar stacks are arranged into four facets by two factor variables: “Lifestyle“ and “Period”. The profiles are horizontally sorted by sampling site, month and sampling depth. Taxa presented in the color legend are sorted by total abundance in the decreasing order, except the last category “Other”. The order of phylotypes in each bar is the same as in the color legend.
Diversity 15 00572 g008
Figure 9. Hierarchical clustering of log2(x + 1)-transformed bacterial OTU counts. Rows—OTUs; columns—samples. Clustering was performed on a matrix of Bray-Curtis dissimilarity distances. The color-coded annotation of samples is drawn in the upper part of the heatmap.
Diversity 15 00572 g009
Figure 10. Co-occurrence networks of FL and PA communities. Graph layout colored by taxonomic assignment of OTUs (vertices) at the phylum level (in the left panel), and overall lifestyle differential abundance (DA) Log2FC (in the right panel). The size of vertex in DA-graphs is proportional to mean OTU abundance.
Diversity 15 00572 g010
Figure 11. Co-occurrence networks of FL and PA communities. Differential abundance (DA) of community profiles colored by month log2FC in FL in March and April; in March and July; in April and July (A); and in PA in March and April; in March and July; in April and July (B). The graph layout is preserved. The size of vertex in DA-graphs is proportional to mean OTU abundance.
Diversity 15 00572 g011
Figure 12. Co-occurrence networks of microeukaryotic communities. Graph layout colored by taxonomic assignment of OTUs at the phylum level (A); pairwise differential abundance of community profiles by month of sampling: March vs. April (B); March vs. July (C); April vs. July (D). The graph layout is preserved. The size of vertex in DA-graphs is proportional to mean OTU abundance.
Diversity 15 00572 g012
Figure 13. Constrained ordination of FL and PA communities’ profiles by redundancy analysis. Blue vectors are environmental factors incorporated into the tb-RDA model by forward selection.
Diversity 15 00572 g013
Table 1. One-way ANOVA computed for environmental variables.
IndepVar1 *DepVarANOVAKruskal-Wallis
ppadjpadj Signppadjpadj Sign
monthpH9.04 × 1051.45 × 104***6.03 × 1088.78 × 108***
monthTemp5.87 × 10354.70 × 1034***3.65 × 10111.95 × 1010***
monthEc1.84 × 1042.68 × 104***2.58 × 1096.87 × 109***
monthO2_conc5.02 × 1046.69 × 104***5.61 × 1088.78 × 108***
monthO2_sat4.46 × 1058.93 × 105***2.62 × 1084.66 × 108***
monthSi_diss8.62 × 1041.06 × 103**5.95 × 10124.76 × 1011***
monthNH4+_diss1.75 × 1031.99 × 103**1.69 × 1041.69 × 104***
monthNO2_diss2.12 × 10161.13 × 1015***1.32 × 10105.27 × 1010***
monthNO3_diss2.86 × 1022.86 × 102*5.03 × 1076.19 × 107***
monthPO4_diss1.95 × 10137.78 × 1013***1.76 × 1084.01 × 108***
monthPtot_diss6.59 × 1082.11 × 107***4.60 × 1065.25 × 106***
monthTOM5.27 × 1059.36 × 105***1.78 × 1051.90 × 105***
monthTMA4.07 × 1069.31 × 106***8.57 × 10102.74 × 109***
monthTMB6.24 × 1036.66 × 103**2.60 × 1073.47 × 107***
Column legend: Indep Var1—independent variables used to divide the dataset into subgroups | Dep Var—tested dependent variable | ANOVA/Kruskal-Wallis p-values | pp-value | padj—FDR-adjusted p-value | padj sign—the adjusted p-value significance code: *** ≤ 0.001; 0.001 ≤ ** ≤ 0.01; 0.01 ≤ * ≤ 0.05; *—only rows with ANOVA padj ≤ 0.1 are shown, i.e., cases where the factor-wise distributions of dependent variable differ significantly.
Disclaimer/Publisher’s Note: The statements, opinions and data contained in all publications are solely those of the individual author(s) and contributor(s) and not of MDPI and/or the editor(s). MDPI and/or the editor(s) disclaim responsibility for any injury to people or property resulting from any ideas, methods, instructions or products referred to in the content.

