Article

Turnover and Natal Dispersal in the Finnish Golden Eagle (Aquila chrysaetos) Population

1
Ecology and Genetics Research Unit, University of Oulu, 90014 Oulu, Finland
2
Metsähallitus, Natural Heritage Services, 96101 Rovaniemi, Finland
*
Author to whom correspondence should be addressed.
Diversity 2023, 15(4), 567; https://doi.org/10.3390/d15040567
Submission received: 31 March 2023 / Revised: 12 April 2023 / Accepted: 14 April 2023 / Published: 18 April 2023
(This article belongs to the Special Issue Conservation and Ecology of Raptors)

Abstract

:
Estimating turnover in a population provides information on population dynamics, such as dispersal and mortality. Dispersal increases genetic diversity and affects the genetic structure. Golden eagles are monogamous, tend to mate for life, and have strong nest site fidelity, which suggests low turnover rates. Here, we first studied genetic diversity and population structure in the Finnish golden eagle population using 11 microsatellite loci and a fragment of a mitochondrial DNA control region. We found no notable changes in genetic diversity during the 15-year study period and did not discover any population structure. Then, we examined the turnover rate using chick genotypes (N = 935) by estimating relatedness between chicks born in the same territory in different years. The results showed a turnover rate of 23%, which correlated with the breeding success of the previous year. Similarly, in the absence of turnover, the pair changed nest sites within a territory after an unsuccessful breeding. In addition, our dataset also revealed natal dispersal of ten individuals. Natal dispersal distance was 110 km on average (median 98 km); however, the distance seemed to vary depending on geographical location, being greater in Northern Finland than in Southern Finland.

Graphical Abstract

1. Introduction

Dispersal has significant implications for genetic diversity and structure of populations, as it acts as a mechanism for gene flow [1]. Dispersal increases genetic diversity and decreases inbreeding in populations, which makes it imperative for species of conservation concern. Dispersal also allows for colonization of new habitats and expansion of the current range [1]. Despite its importance, dispersal can be challenging to study, especially in long-lived and highly mobile species, which prefer to live remotely from humans [2]. In addition, it is difficult to distinguish between mortality and dispersal, because the individuals may not be found once dead, or will not be observed once they have left the study area [3].
Breeding dispersal refers to movement of individuals between breeding sites, whereas natal dispersal refers to movement between the place of birth and the first breeding site [4]. Natal dispersal tends to be more extensive than breeding dispersal, possibly because juveniles leave natal nest sites to avoid breeding or competing with relatives [4,5]. Thus, the two primary hypotheses that describe the potential factors affecting natal dispersal are intraspecific competition over resources and inbreeding avoidance [1]. Especially, species with high survival rates and philopatry to breeding sites might disperse further to find areas with lower population density and, therefore, less competition [1]. However, if the natal site has high primary productivity, the dispersal distance may be shorter [6]. Often, natal dispersal distances between sexes are different, which helps to avoid inbreeding [7,8]. For example, in golden eagles (Aquila chrysaetos), females have been observed to have longer natal dispersal distances than males [9].
Despite the costs of dispersal in terms of time, energy, and predation risk, it must be beneficial to the individual. The main suggested benefits of dispersal include improved breeding conditions, inbreeding avoidance, and reduction in variance in breeding success through the bet-hedging strategy, where individuals increase their chances of successful breeding by alternating mates or nest sites in an unstable environment [10,11]. Especially, breeding success in a previous year has been suggested as a determinant of breeding dispersal [4,12]. In raptors, unsuccessful breeding has led to breeding dispersal, for example in burrowing owls (Athene cunicularia) [13]. However, this has not been observed for golden eagles or peregrine falcons (Falco peregrinus) [14,15]. Habitat quality variation is another important factor in determining breeding dispersal [1], and it has been found that individuals breeding in suboptimal territories are more prone to disperse than individuals breeding in good territories [16]. This type of behavior has been observed in, for example, Finnish female goshawks (Accipiter gentilis), which were dispersing to habitats less barren than their initial breeding site [17]. However, the role of habitat quality for breeding dispersal has been questioned, and other factors, such as mate or habitat loss, have been proposed [17]. Lastly, breeding dispersal may depend on individual characteristics, such as sex, age, and body condition [4], and interact with a high population density via increased competition over resources in habitats with low carrying capacity [18]. For example, in common kestrels (Falco tinnunculus), breeding dispersal distance varied between sexes, and was affected by prey abundance [19].
Turnover (i.e., change) of one or both breeding adults in a territory may be explained by breeding dispersal, but also by mortality or divorce [20,21]. Divorce is rare in raptors, but some cases have been observed in golden eagles where the female has found a new mate on another territory after an unsuccessful breeding [22]. Alternatively, the turnover event may be caused by death of one of the breeding individuals, which forces the other individual to find a new mate, and possibly a new territory.
Turnover is challenging to study, as it requires consistent data from multiple years. The data can be collected from observations of identifiable individuals or by using genetic tools. Genetic identification for turnover studies in raptors has been used for gyrfalcons [20], eastern imperial eagles (Aquila heliaca) [21], peregrine falcons [15], and goshawks [23]. Genotyping has been performed, mainly using shed adult feathers [20,21,23], but also using chick feathers or blood [15,20], which provide a more reliable source of DNA, as invasively collected samples from chicks have lower error rates than shed adult feathers [24].
In this study, we estimated the genetic diversity and population structure of golden eagles in Finland, using both nuclear microsatellites and mitochondrial control region sequences, to understand genetic parameters of the population. Then, for the first time in golden eagles, we calculated the annual and overall turnover rates for the Finnish population by genotyping chick feathers collected during a 15-year period. With the addition of breeding data, we looked for a relationship between breeding success and turnover, and between breeding success and nest site change within a territory, thereby testing the hypothesis that an unsuccessful breeding leads to turnover or nest site change. Finally, we studied natal dispersal for the individuals that were sampled first as chicks and later as adults.

2. Materials and Methods

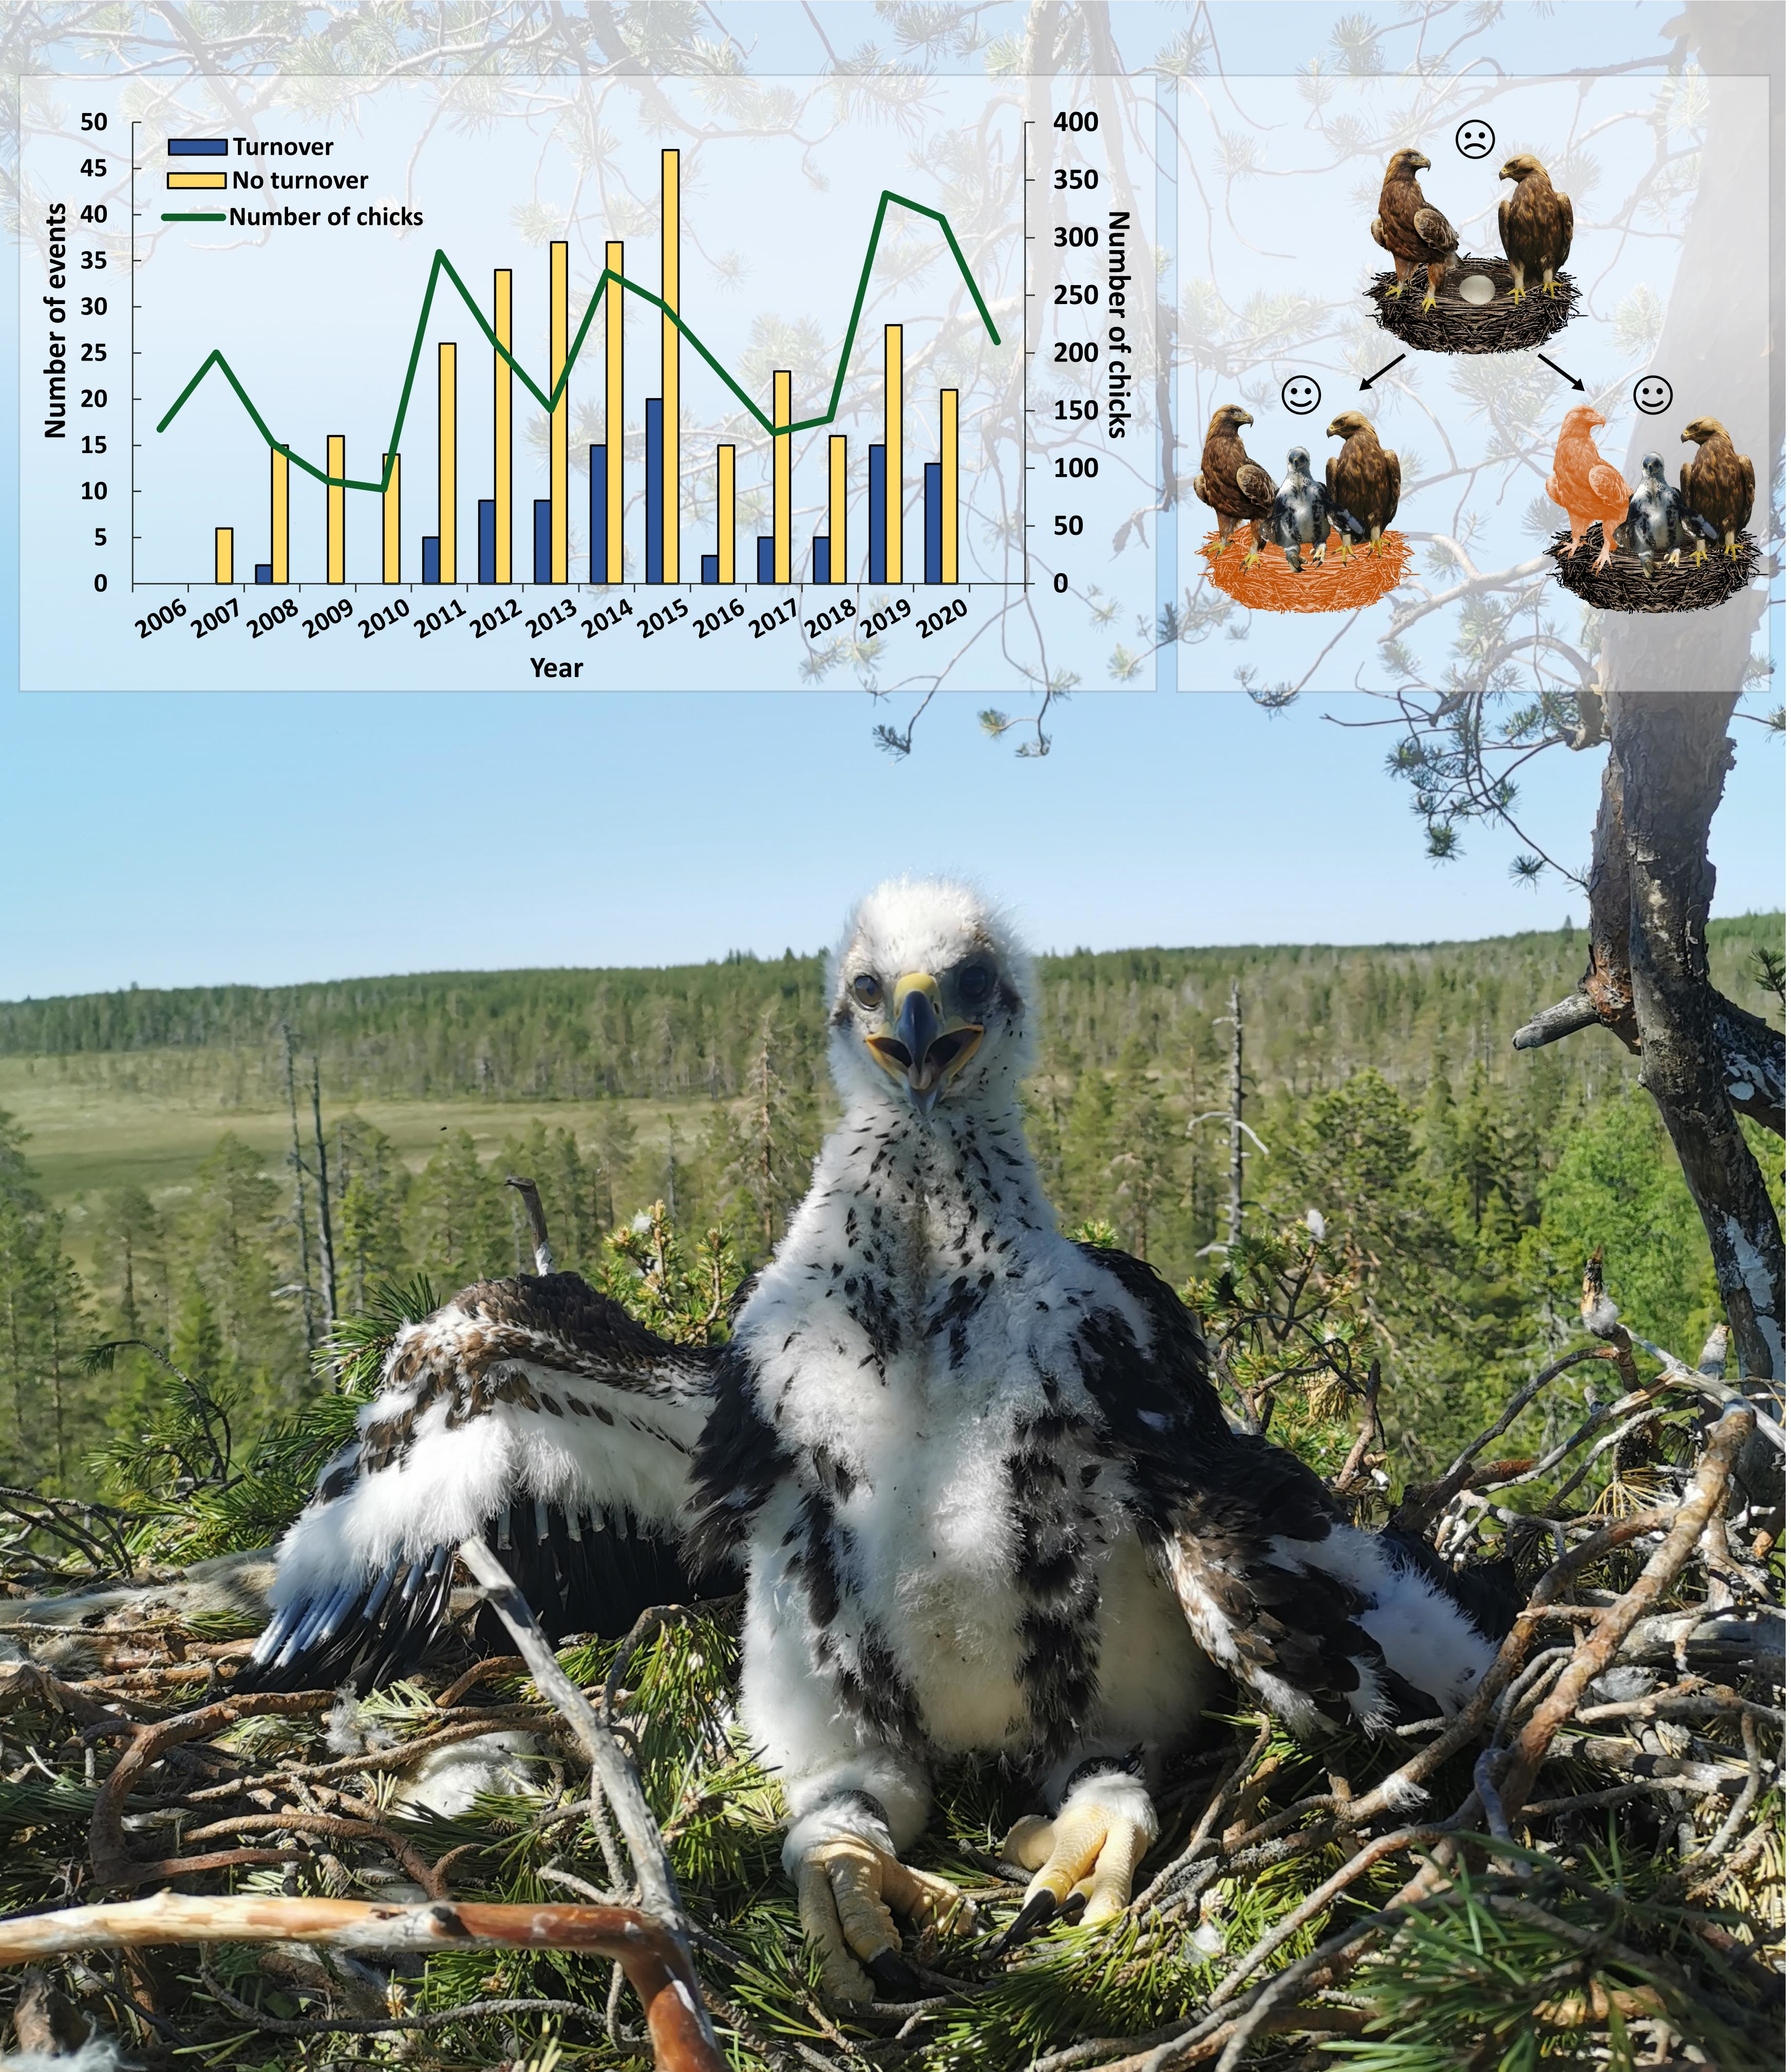
2.1. The Study Species

Golden eagles are listed as vulnerable in Finland [25], but globally the species is classified as Least Concern by the IUCN [26]. The species was distributed throughout Finland excluding the Åland Islands up until the 1800s. However, golden eagles were hunted extensively during the 19th and 20th centuries, which severely decreased the population size across the whole country and led to the disappearance of the species in Southern Finland. In 1969, the species was fully protected, and the population began to recover in the 1970s [27]. At present, the distribution centralizes in the northern part of the country, with 90% of the pairs breeding in the north of the Oulujoki river, in the reindeer herding area [28]. Currently, there are 351–482 estimated breeding pairs in Finland [29]. The monitoring of golden eagles began in 1958 and continues to the present day by the Parks & Forests Finland (Metsähallitus) [27]. Many, but not all, of the known nest sites are visited yearly (92% on average during 1971–2021), and the chicks are ringed, when possible. The adult birds are generally non-migratory in Finland, and their average territory size is around 150 km2 with one to three nests per territory [30]. The nests are typically built on old pine or spruce trees [29]. During the last decade, the breeding success throughout Finland was the lowest in 2018, with only 92 successful nests and 108 chicks, while 2019 had the highest breeding success in the history of the monitoring program, with 175 successful nests and 211 chicks [31]. Factors that seemed to contribute to breeding success included prey abundance and weather conditions [31,32]. Main threats to golden eagles in Finland are illegal killings, habitat destruction, collisions with vehicles, powerlines, and wind turbines, as well as accumulation of toxins such as lead [33].
Golden eagles can live up to 34 years in the wild [34]. Mortality is low in adults (survival rate estimates range from 0.91 to 0.97), but very high in pre-adults (survival rates range from 0.23 to 0.50) [22,35]. Golden eagles start breeding at four to five years old and tend to mate for life. However, if one partner gets severely injured or dies, the other will find a new mate [22]. The species has a strong nest-site fidelity, and during the non-breeding years the pair maintain their bond by repairing nests or building new ones [36]. Territories often have several alternative nests, and, while some pairs may use a single nest throughout their breeding, others may alternate between nests more frequently [14,37]. Nest site changes may result from disturbance, persecution, or parasites, or the pair may use a different nest to maintain ownership of their territory [22]. In territories where good nest sites are rare, the pair will reuse nests more often, while in territories with multiple suitable alternative nests the pair may alternate between them more often [22,38].

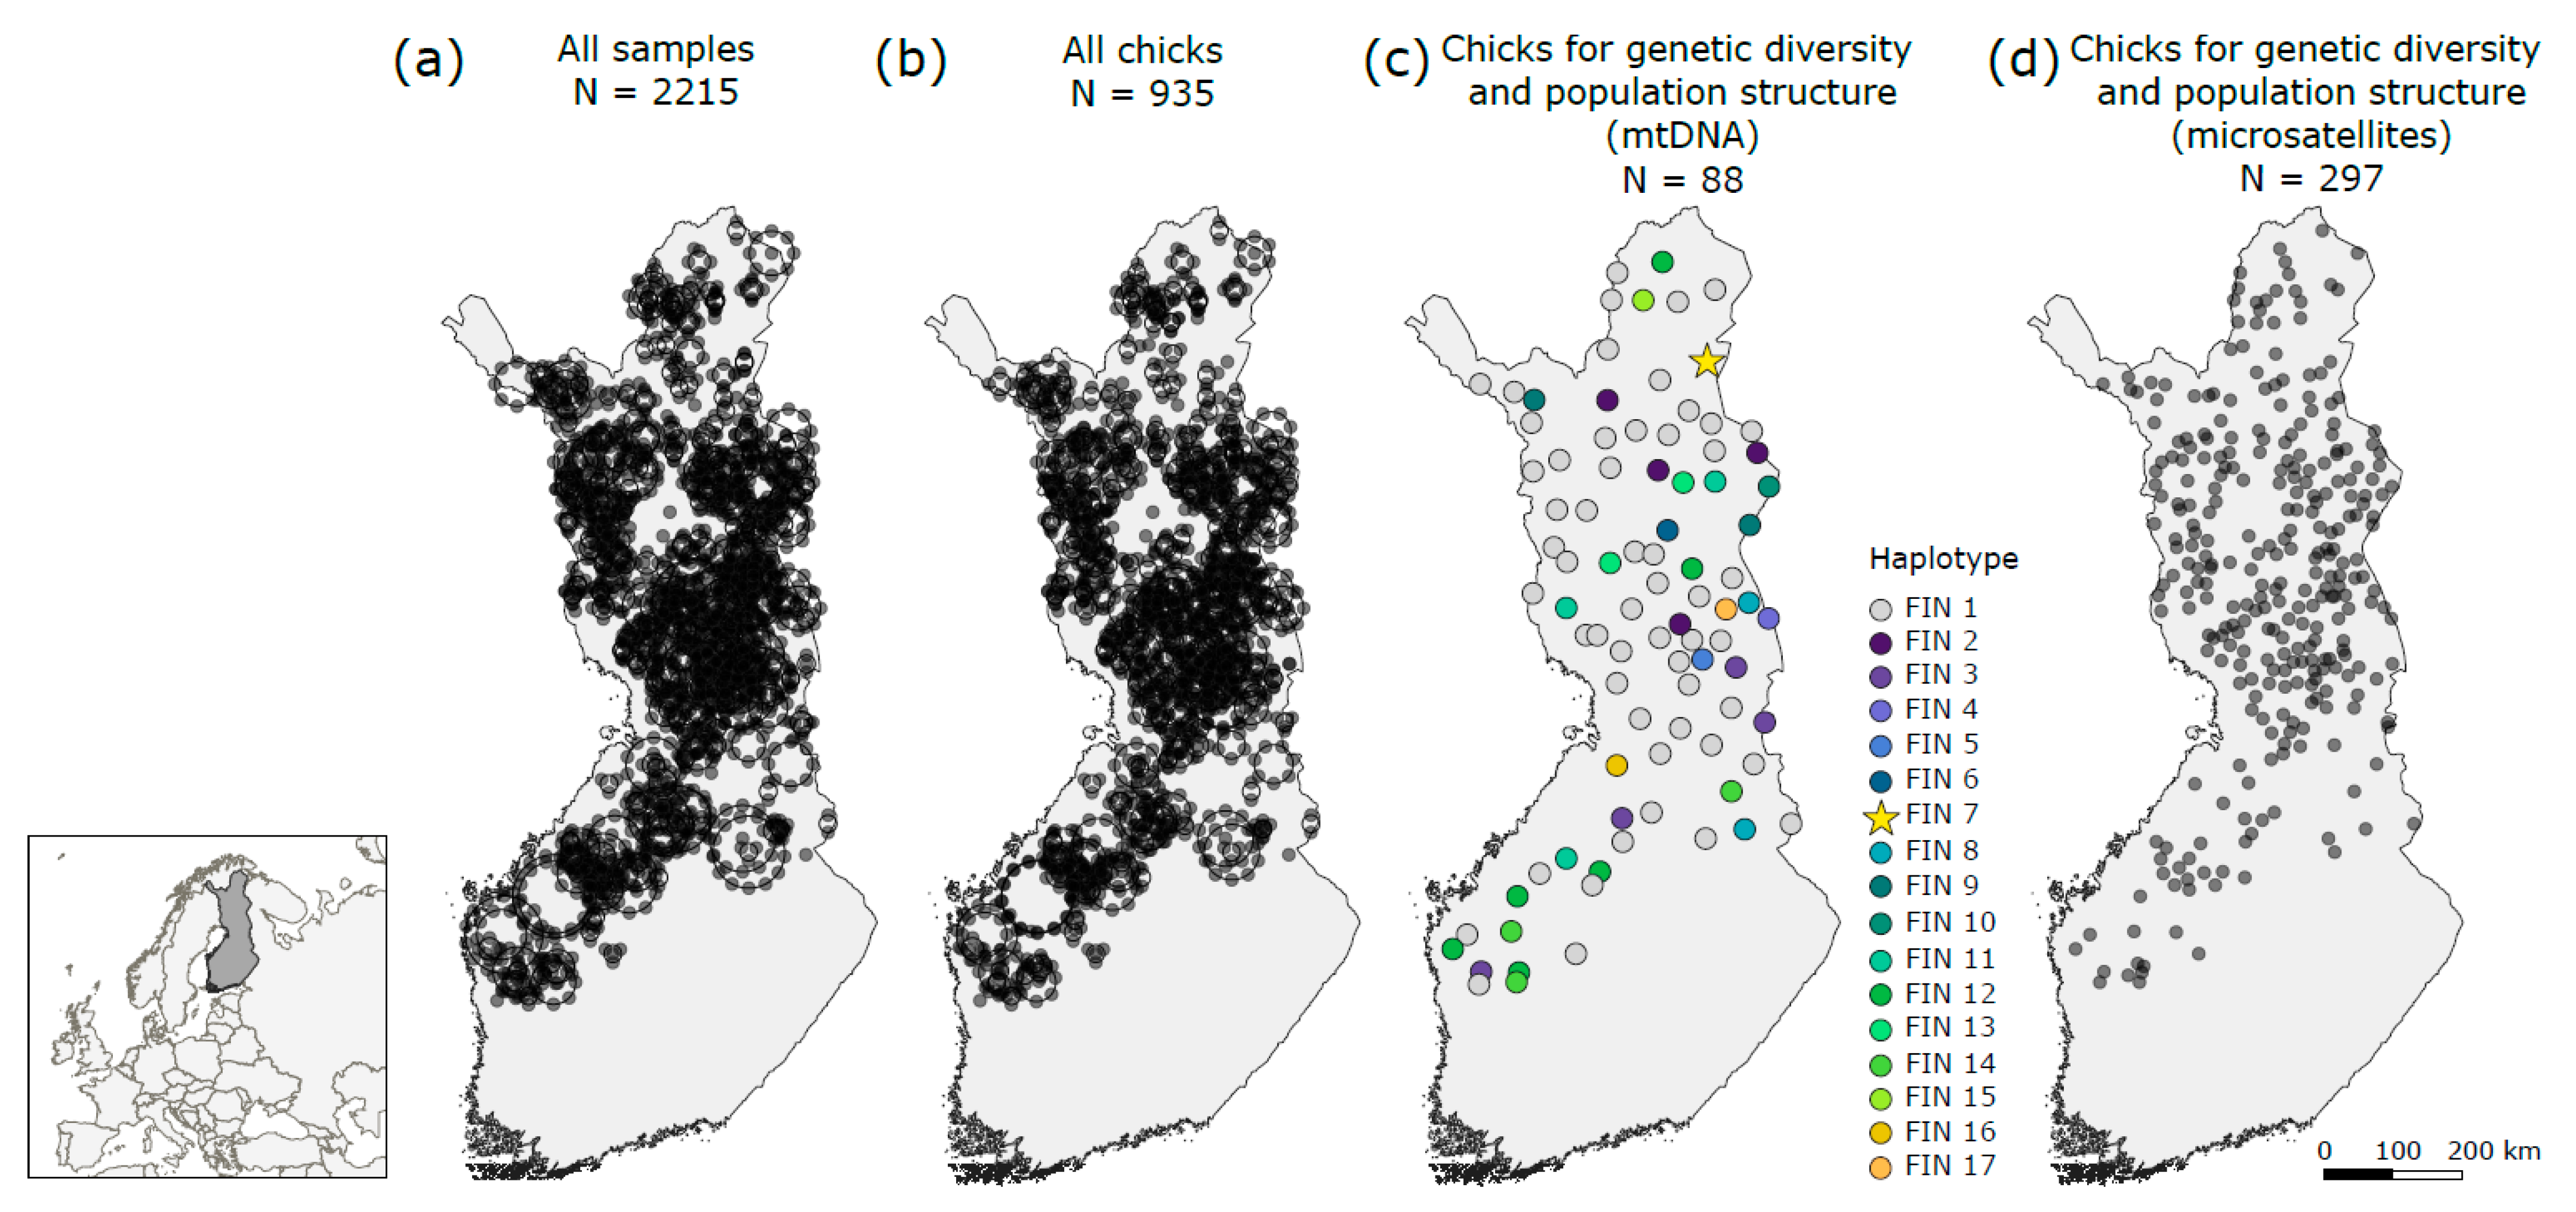
2.2. Sampling and Laboratory Analyses

Feather samples were collected by volunteers of Metsähallitus during the ringing of chicks in 2006–2020 (Figure 1). Adults’ shed feathers were collected from the nest and the surrounding area, while feathers from chicks were sampled from the birds. In total, 2215 samples were collected for DNA analyses (chicks N = 935 and adults N = 1280; Figure 1a,b). For each sample, information of the nest ID, location, territory, date, and chick ring number (when ringed) were recorded. Metsähallitus also provided data on breeding success within all territories including those where no feathers were collected.
Genomic DNA was extracted from the quill end of the feathers using QuickExtract™ solution (Epicentre) following the manufacturer’s protocol. DNA concentration was measured with NanoDrop (Thermo Scientific, Waltham, MA, USA). Twelve polymorphic microsatellite loci were chosen for genotyping [39] (Table S1). The PCR reactions were prepared in a total volume of 6 µL using Qiagen Multiplex PCR kit (Qiagen, Hilden, Germany), and contained 3 µL of multiplex master mix, 0.6 µL of primer mix (Table S1), and 2.4 µL of genomic DNA. The concentration of the DNA varied a lot, depending on the quality of the sample, from ~10 to 1800 ng/µL. PCR profile started with initial denaturation at 95 °C for 15 min, followed by 35 cycles at 94 °C for 30 s, 60 °C for 90 s, and 72 °C for 60 s, with a final elongation at 60 °C for 30 min. The amplified 1–2 µL of PCR products were genotyped using GeneScan 500™ LIZ (Thermo Scientific) and formamide with ABI Prism 3730 Genetic Analyser (Applied Biosystems, Waltham, MA, USA).
A fragment of a mitochondrial DNA (mtDNA) control region of 88 golden eagle chicks was amplified and sequenced using primers modGOEA_CR1L (5′-CCC CCG TAT GTA TTA TTG TA-3′) [40] and GOEA_CR595H (5′-GCA AGG TCG TAG GAC TAA CC-3′) [41]. The chicks were selected to cover the whole sampling area, with one chick sampled per territory (Figure 1c). PCR reactions were carried out in a total volume of 10 µL. The final concentrations were as follows: 1X BIOTOOLS buffer, 4 mM MgCl2, 0.2 mM of each dNTP, 0.7 µM of each primer, 1 mg of bovine serum albumin (BSA), and 0.1 units of BIOTOOLS polymerase (BIOTOOLS, Spain), and 1 µL (c. 100–1700 ng) of genomic DNA was used as a template. The PCR profile was 94 °C for 5 min followed by 45 cycles at 94 °C for 30 s, 57 °C for 60 s, and 72 °C for 60 s, and a final elongation at 72 °C for 5 min. Amplified PCR products were purified using the ExoI/FastAP (Thermo Scientific) method. Sequencing reactions were prepared with BigDye™ Terminator v3.1 kit (Thermo Scientific) in a total volume of 10 µL, which contained 1.5 µL of sequencing buffer (5X), 1 µL of ready reaction mix, 2 mM of a primer, and 5 µL of the purified PCR product. The PCR profile was 96 °C for 1 min, followed by 28 cycles at 96 °C for 10 s, 53 °C for 5 s, and 60 °C for 4 min. Sequencing reactions were purified using Sephadex filtration (Sigma-Aldrich, Germany) and sequenced with an ABI Prism 3730 Genetic Analyzer.
Sexes of ten chicks that were used for studying natal dispersal were determined using the amplification refractory mutation system (ARMS) using three primers: P2 (5′-TCT GCA TCG CTA AAT CCT TT-3′) [42], NP (5′-GAG AAA CTG TGC AAA ACA G-3′) [43], and MP (5-AGT CAC TAT CAG ATC CGG AA-3′) [43]. The PCR reactions were carried out in a total volume of 10 µL. The final concentrations were as follows: 1X BIOTOOLS buffer, 2.5 mM MgCl2, 0.2 mM of each dNTP, 0.8 µM of P2 primer, 0.4 µM of NP primer, 0.4 µM of MP primer, and 0.2 units of BIOTOOLS polymerase, and 1 µL (c. 100–1700 ng) of genomic DNA as a template. The PCR profile started with initial denaturation at 94 °C for 3 min, followed by 32 cycles of a PCR touchdown at 56–45 °C (94 °C for 30 s, 56–45 °C for 45 s, and 72 °C for 45 s, with two degrees intervals at 56–46 °C, each 2 cycles, and 20 cycles at 45 °C), with final elongation at 72 °C for 5 min. The PCR products were checked by 1.5% agarose gel electrophoresis at 145 V for 30 min and visualized under UV light. A single band was amplified in males, and two bands in females.

2.3. Genotyping and Sequencing Quality

The alleles were scored with GeneMapper v.5.0 software (Applied Biosystems). To assess genotyping errors, 372 samples (corresponding to 17% of the data) were duplicated, and, of those samples, 155 (corresponding to 7% of the data) were triplicated (see Table S2 for datasets of the analyses). The error rate was calculated per loci using Microsat_errcalc [44]. The program also estimated rates of allele dropouts, false alleles, and other errors such as mistypings. Allele dropouts and false alleles were estimated only for samples that had been triplicated as they had more reliable consensus genotypes.
Consensus genotypes were formed from the replicated samples. When it was not possible to determine the consensus, the genotype was called missing. Cervus [45] was used to estimate the observed and expected heterozygosities, polymorphic information content (PIC), and the average non-exclusion probabilities for identity and sibling identity for each locus. PIC is a measure of the degree of genetic diversity of a population with a selected set of loci, and it is used to identify markers that are particularly informative for studying the genetic structure and diversity of a population. Non-exclusion probability for identity refers to the likelihood that the genotypes of two unrelated individuals do not differ by chance. Similarly, non-exclusion probability for sibling identity is the likelihood that the genotypes of two siblings do not differ by chance. Thus, the lower the non-exclusion probability values are, the better the chosen set of loci can distinguish between individuals. Presence of null alleles was checked using Micro-Checker v.2.2.3 [46].
The primer for mtDNA sequencing was chosen by sequencing nine individuals with both forward (modGOEA_CR1L) and reverse (GOEA_CR595H) primers and visually comparing the quality of the obtained sequences in BioEdit v. 7.2.5 [47]. Based on this, the primer GOEA_CR595H was used for sequencing the rest of the samples.

2.4. Data Analysis

2.4.1. Genetic Diversity and Population Genetic Structure

Adult samples and individuals with over 25% missing data were removed from the analyses of genetic diversity and population structure. The data were resampled to only include one chick per territory to avoid sampling of relatives. The final dataset for estimating genetic diversity and population structure analyses included 297 golden eagle chicks (Figure 1d and Table S2). The analyses were carried out separately for each year and the sample sizes for each year were as follows: year 2006 (N = 9), 2007 (N = 30), 2008 (N = 16), 2009 (N = 13), 2010 (N = 8), 2011 (N = 21), 2012 (N = 28), 2013 (N = 30), 2014 (N = 34), 2015 (N = 30), 2016 (N = 17), 2017 (N = 13), 2018 (N = 12), 2019 (N = 25), and 2020 (N = 11).
Number of alleles (A), allelic richness (AR), and inbreeding coefficient (FIS) were estimated using Fstat v. 2.9.4 [48]. The observed (HO) and expected heterozygosity (HE) were estimated using Arlequin v. 3.5 [49]. Linkage disequilibrium was evaluated on Genepop v. 4.7 [50].
Population structure was estimated using the Bayesian model-based clustering program Structure v. 2.3.4 [51]. Structure uses Markov chain Monte Carlo (MCMC) simulations to estimate the number of genetically distinct clusters (K). Using the admixture model, the program was run for 100,000 MCMC replicates with a burn-in of 10 000 for ten iterations, with K set to one to five, and without the location information (i.e., no locprior). The optimal K value was chosen based on the standard log probability test (LnP(K)) using Structure Selector [52]. LnP(K) was used because it allows for K = 1, unlike Delta (K) [53], and because it does not require pre-defined groups, like the Puechmaille’s Optimal K [54]. The results were visualized on Pophelper v. 1.0.10 [55].
The mtDNA sequences were manually edited and aligned following ClustalW Multiple Alignment [56] with 1000 bootstrap replications in BioEdit. The number of haplotypes (H), haplotype (ĥ), and nucleotide (π) diversities, and the mutation parameter theta (𝜃) from the number of segregating sites (S), were calculated using the program DnaSP v. 6.12 [57] for the total dataset. A median joining haplotype network [58] was built in PopArt [59] and finalized in Inkscape v. 1.1 [60] to inspect visually for possible geographic clustering of haplotypes. For this, the individuals were divided into northern and southern groups, based on location either within the reindeer herding area or outside of it. The haplotype and trait files were created in RStudio v. 1.4 [61] with packages “pegas” [62] and “ape” [63].

2.4.2. Turnover

Relatedness (r) between all chicks (N = 935, Table 1), was estimated with the program ML-relate, which calculates maximum likelihood estimates of relatedness and relationship considering null alleles [64]. Relatedness values were estimated between chicks from different years within the same territories. The data included 120 known pairs of siblings. When there was a 40% drop in relatedness between years within a territory, it was interpreted as a change in one of the parents, and if there was more than 85% drop it was interpreted as a change of both parents. Drops of 40% instead of 50% and 85% instead of 100% were chosen to consider possible genotyping errors and missing data [15]. The turnover rates were calculated by dividing the number of turnover events (i.e., change of one or both parents within a territory) by the number of all comparisons between years within territories (i.e., all possible turnover events). The statistical difference between ‘known brood relatedness’ and ‘within territory relatedness’ was assessed using the Wilcoxon signed-rank test in RStudio. Similarly, the difference between ‘within territory relatedness’ and ‘relatedness in territories where turnover occurred’ was tested.
To test whether breeding success of a previous year affected turnover, a chi-squared test was performed in RStudio. Similarly, the dependency between breeding success and nest site change was tested using the chi-squared test. The null hypotheses for the tests were “turnover is independent of breeding success” and “change in a nest site is independent of breeding success”.

2.4.3. Natal Dispersal

To estimate natal dispersal, identity analysis was performed in Cervus, with a minimum of ten matching loci allowing for one mismatch and using the total dataset of chicks and adults. Two matching genotypes were classified as cases of natal dispersal when one genotype was from a chick and another one was from an adult of four and more years apart, which is the age that golden eagles reach sexual maturity. The distance between the two nests was then measured using QGIS 3.10 [65]. When a chick genotype matched to an adult from several different years, only the distance to the first detected adult was measured.

3. Results

3.1. Genotyping Quality

In total, 935 chick and 1278 adult samples were genotyped. The genotyping error rate for the total dataset was 0.0621, and varied from 0.011 in locus NVHfr206 to 0.089 in locus Aa04 (Table S3). The overall amplification success was 84%. However, since genetic diversity, population structure, and turnover were studied with the chick dataset, removal of poorly amplified adult genotypes reduced the error rate and increased the amplification success. Thus, the error rate for all loci in the chick dataset was 0.024, ranging from 0.000 to 0.089 with 41 samples replicated (Table S4). The amplification success of chick genotypes was 95%, ranging from 68% to 100% among loci. Locus Aa39 produced scorable alleles in only c.30% of cases, and, therefore, it was removed from further analyses.
In the chick dataset, null alleles were found in loci Aa35, Aa36, and NVHfr124. When dividing the data into yearly datasets, no consistent pattern was observed, suggesting that in some years null alleles could have resulted from an undetected subpopulation structure. Therefore, all loci were kept for the downstream analyses. The combined non-exclusion probability of identity was 2.185 × 10⁻⁹, and the combined non-exclusion probability of sibling identity was 0.0002 for the whole dataset. In the chick dataset, the combined non-exclusion probability of identity was 1 × 10⁻⁸, and the combined non-exclusion probability of sibling identity was 0.0005.

3.2. Genetic Diversity and Population Genetic Structure
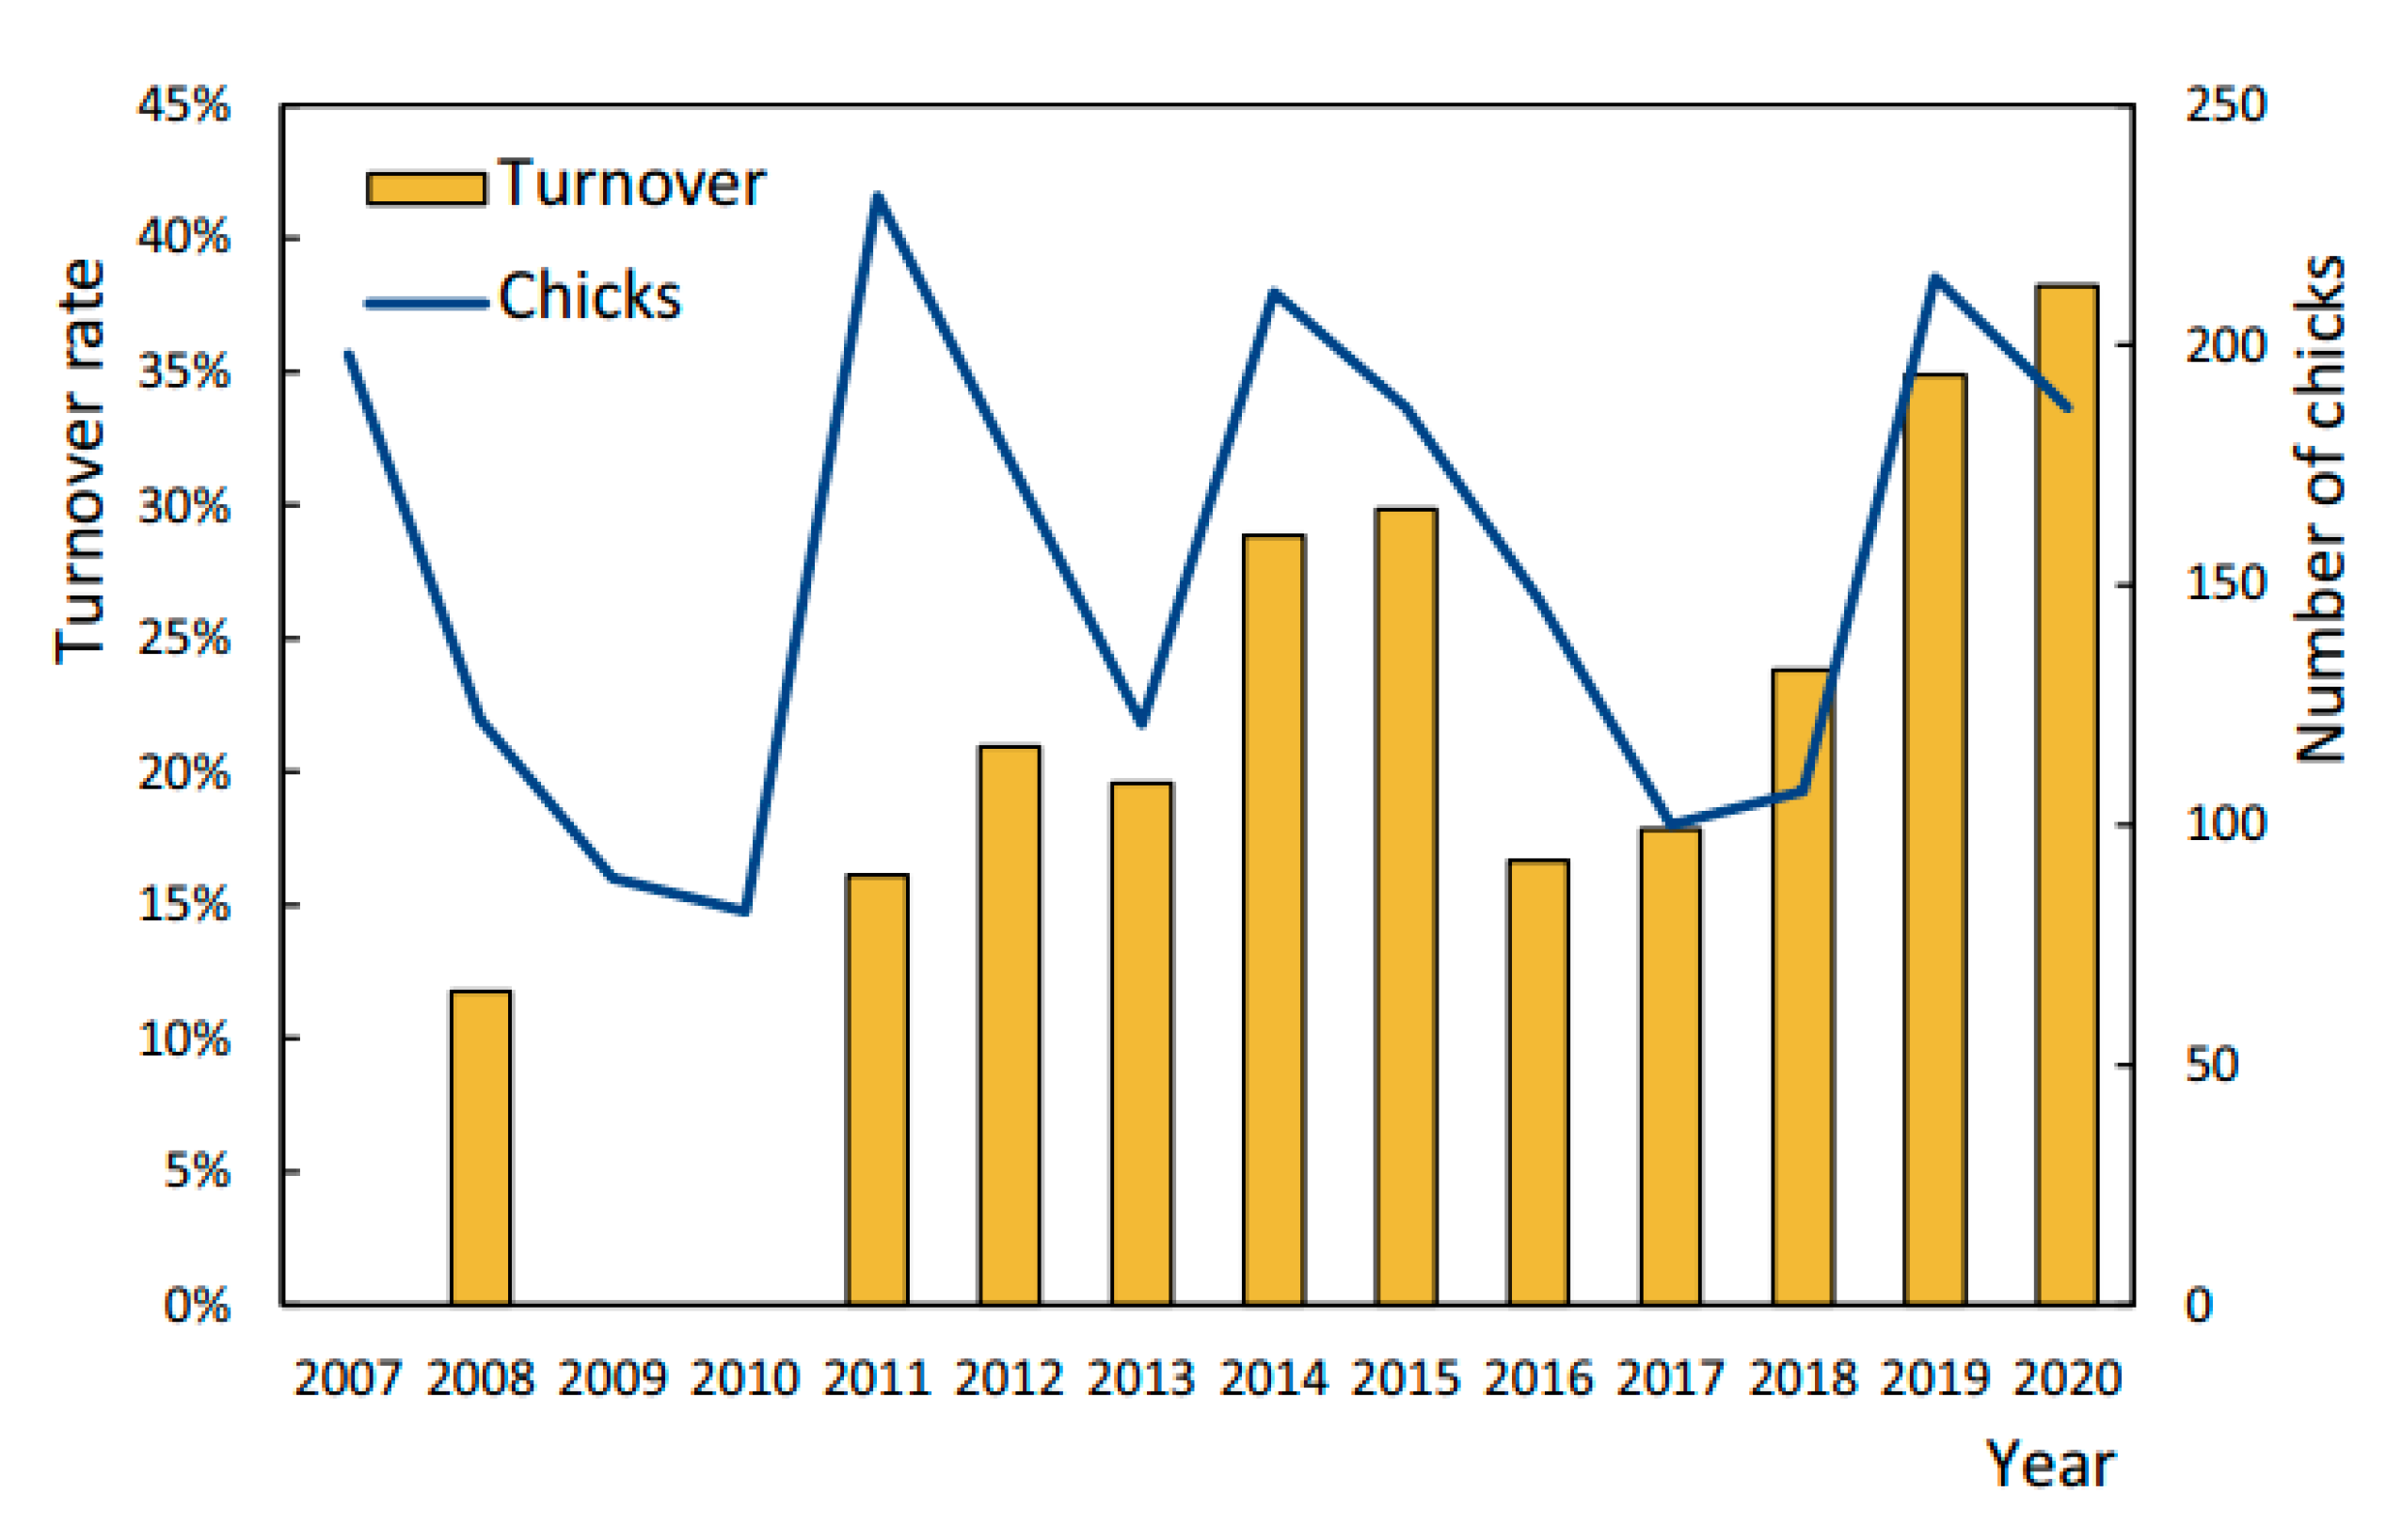
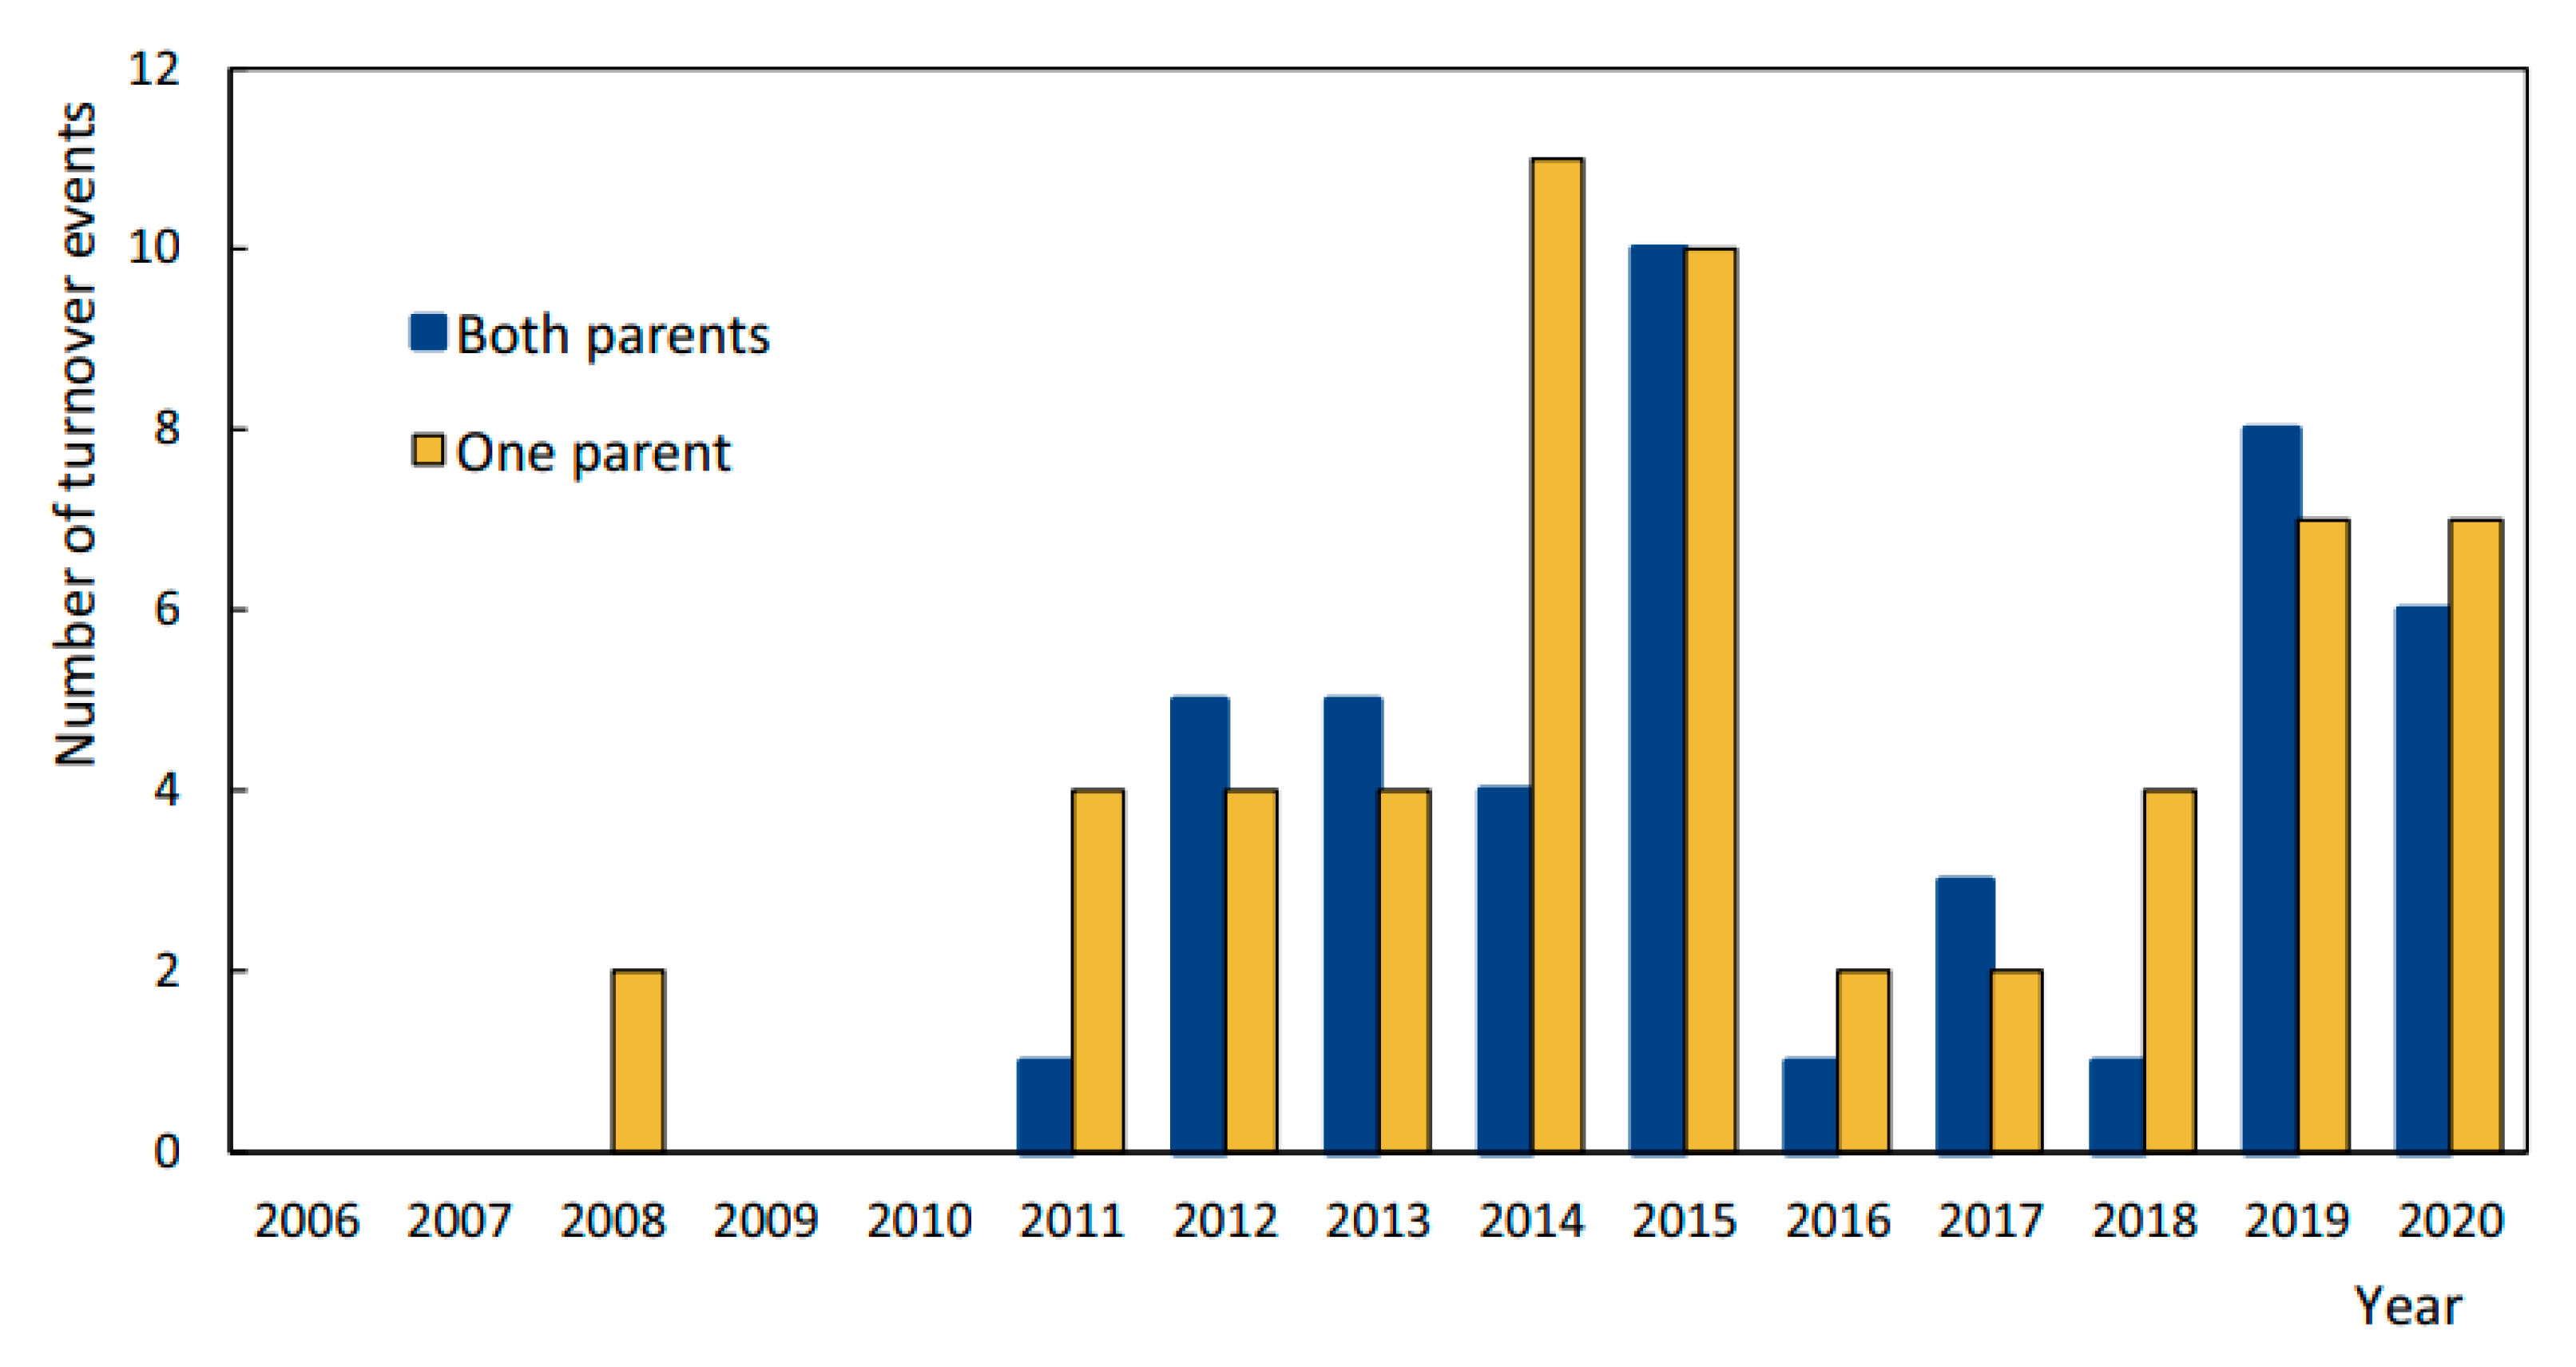
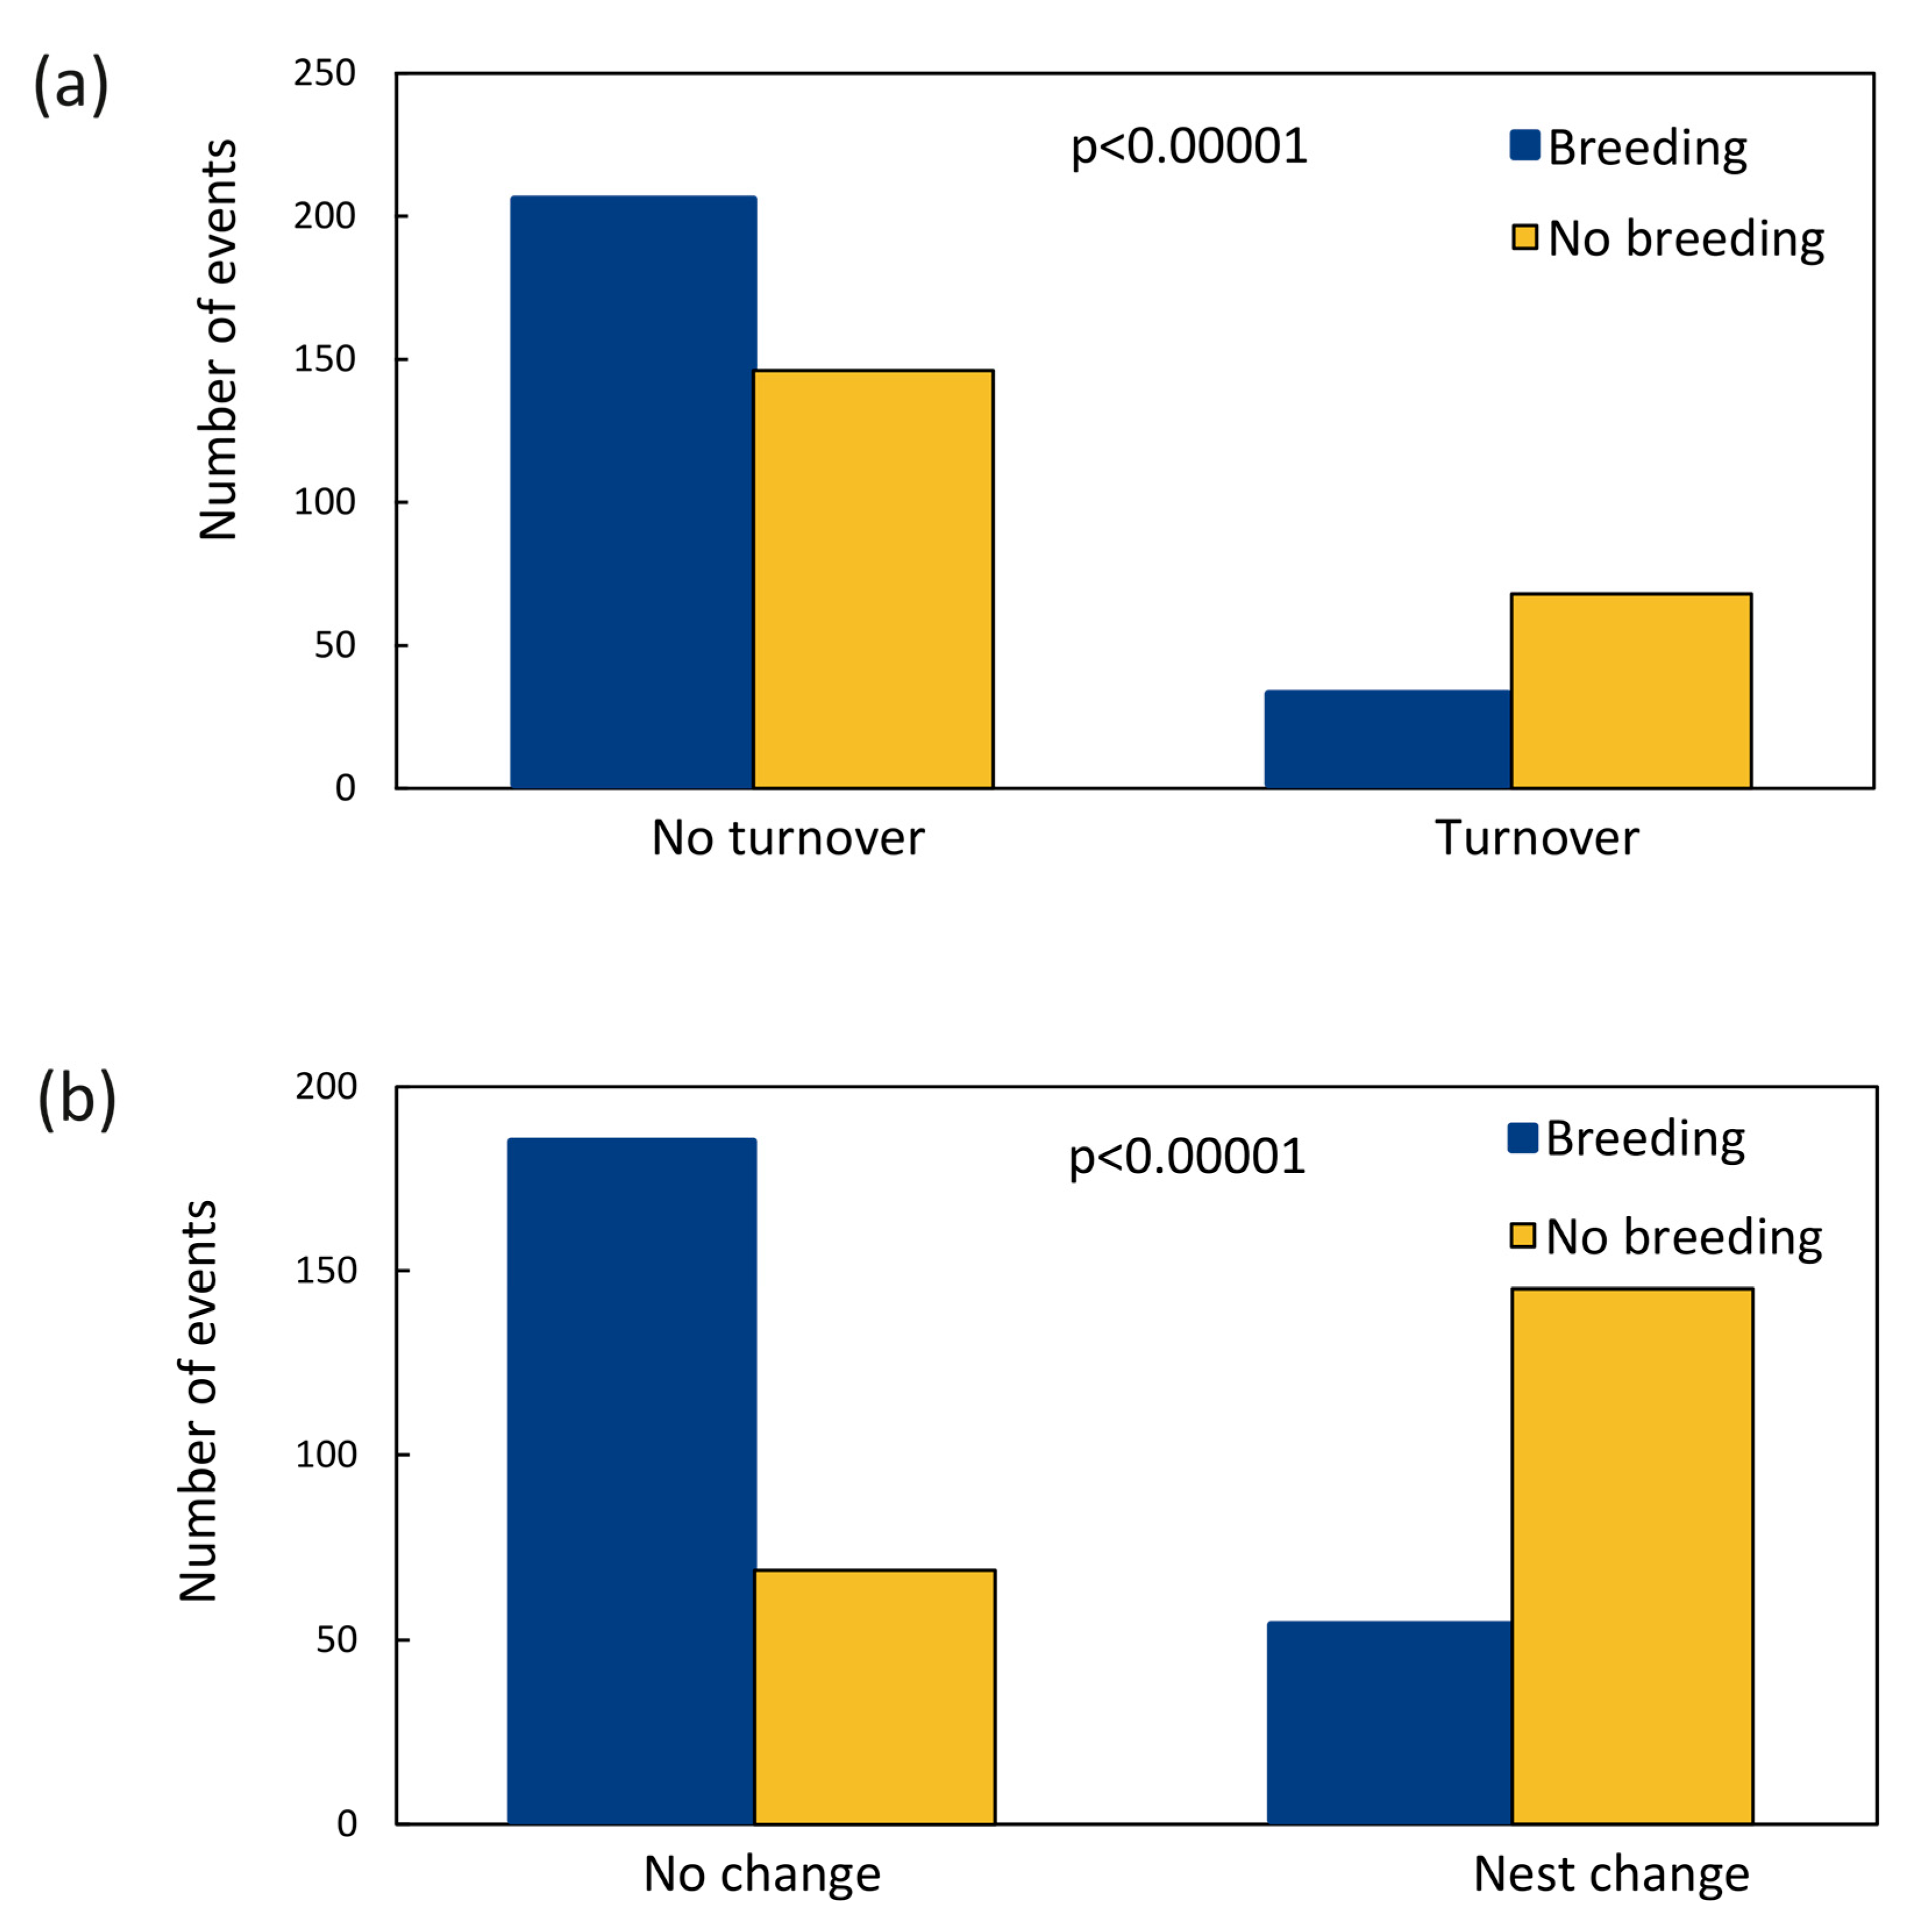
Genetic diversity estimates for the chick dataset (N = 297) are presented in Table S4. The mean observed heterozygosity was 0.567, ranging from 0.035 to 0.752 per locus. The expected heterozygosity varied from 0.034 to 0.813 per locus, with an average of 0.585. The mean number of alleles was 7.9 and varied from 3 to 16 among loci. The allelic richness varied from 1.34 to 5.88 per locus, with an average of 3.87. The inbreeding coefficient varied from −0.058 to 0.109 between loci, with an average of 0.033.
Genetic diversity estimates measured yearly over all loci for the chick dataset are presented in Table 2. The observed heterozygosity was the highest in 2020 (0.633) and lowest in 2014 (0.551). The expected heterozygosity was the lowest in 2008 and 2014 (0.551), and the highest in 2020 (0.631). The highest number of alleles was in 2007 (5.82) and the lowest in 2010 (3.73); allelic richness on the other hand was the lowest in 2008 (3.57) and the highest in 2020 (4.16). No significant deviations from the Hardy–Weinberg equilibrium were observed in the yearly datasets.
The most likely number of clusters (K) for the Finnish golden eagle population was one (mean LnP (K = 1) = −7805.87, and mean LnP (K = 2) = −8182.81). The likelihood decreased further with a higher K (Figure S1).
For the mtDNA, a 393 bp alignment from the 88 sequenced individuals was obtained. This alignment had 18 segregating sites, forming 17 haplotypes (GenBank accession numbers: OQ679875-OQ679891; Table S5). Of these haplotypes, 16 belonged to the Holarctic lineage and one to the Mediterranean lineage, as defined by [40]. The haplotype network showed no clustering according to geographic locations; however, only five haplotypes were shared between the northern and the southern groups (Figure S2). The total haplotype diversity was 0.617, nucleotide diversity 0.0034, and theta 0.0091.

3.3. Turnover

The mean sibling relatedness was 0.496 for 120 pairs of known full siblings. To give an understanding of how the relatedness values were distributed, there were 22 cases where relatedness was lower than 0.3, and 22 cases where it was over 0.7. Chicks from the nests with one parent turnover (cut-off of 40%) had a mean relatedness of 0.298, and from the nests where both parents had changed (cut-off of 85%) had a mean relatedness of 0.074. The mean relatedness within territories was 0.326, ranging from 0 to 0.721, while the mean relatedness for all territories where turnover occurred was 0.170. There was a significant difference between the ‘known brood relatedness’ and ‘within territory relatedness’ (V = 2814, p = 0.0327), and between the ‘within territory relatedness’ and ‘relatedness in territories where turnover had occurred’ (i.e., ‘territories with below the 40% cut-off’, V = 2775, p = 7.893 × 10⁻¹⁴).
In total, 201 territories had more than one year of breeding during the sampling period, and, therefore, were included in the turnover calculations. The mean number of chicks per territory across years was four, and the mean number of years when samples were collected was 3.5. The highest number of sampled chicks per territory was 15, and the highest number of sampled years in a territory was 11. Nine territories were excluded due to uncertainties in individual and territory IDs.
The overall population turnover rate was 23% in all the years combined. The yearly rates varied from 0% in 2007, 2009, and 2010 to 38% in 2020 (Figure 2). The total number of turnover events in the 15-year dataset was 101, with the highest number in 2015 when 20 turnover events were observed. In 2015, half of the events were with a change in both parents and half with one parent only (Figure 3). The lowest numbers of turnover events were in the years 2007–2011 and in 2016–2018. Since 2006 was the starting year of this study, it could not be compared with a previous year to detect any turnover events. In total, there were 57 changes of one parent and 44 changes of both parents. In most years, the frequency of turnover events involving one parent and both parents were similar, except for 2014, which had 4 turnover events of both parents and 11 of one parent.
The turnover was dependent on the previous year’s breeding success (χ2 = 21.04, df = 1, and p = 0.000004). The number of turnover events after a successful breeding was 33, and 68 after an unsuccessful breeding. No turnover occurred after a successful breeding in 206 cases and after an unsuccessful breeding 146 times (Figure 4a). The nest site change within a territory was dependent on the previous year’s breeding success as well (χ2 = 91.67, df = 1, and p = 0.000000). The nest change occurred 145 times after an unsuccessful breeding and 54 times after a successful breeding. The breeding pair remained in the same nest after a successful breeding year 185 times and 69 times after an unsuccessful breeding (Figure 4b).

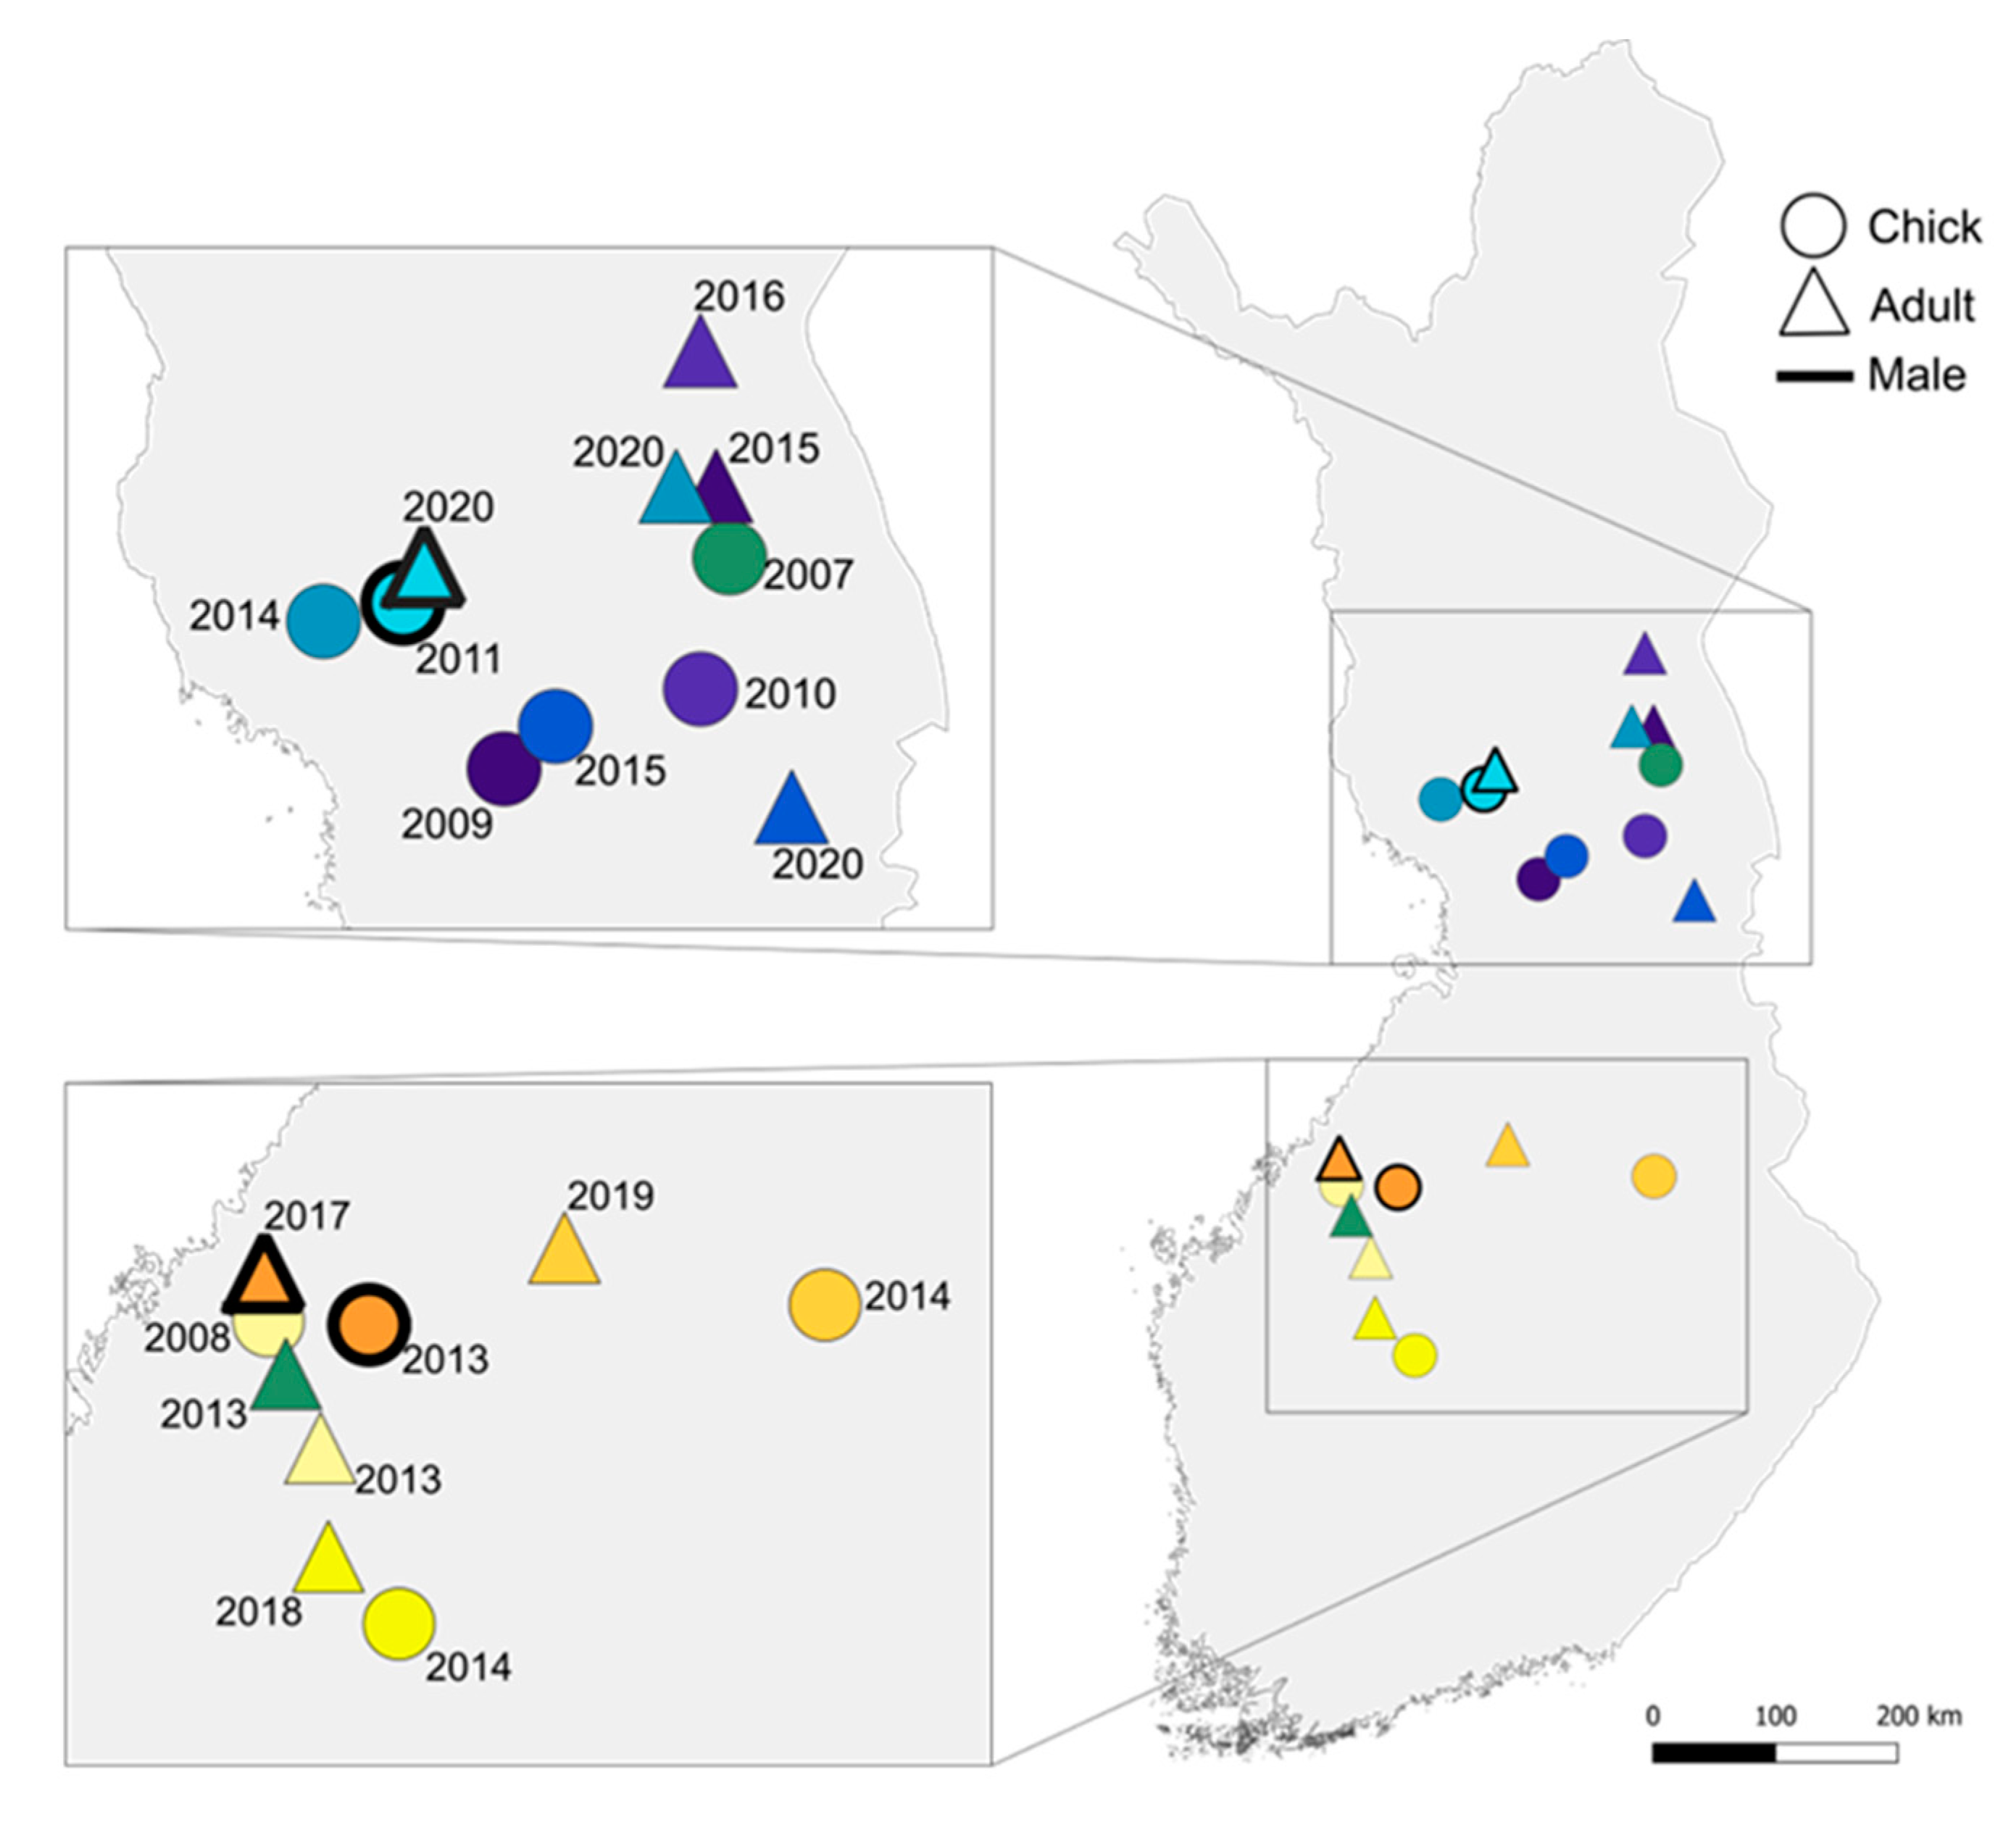
3.4. Natal Dispersal

There were ten cases where an individual had been sampled as a chick and four to nine years later as an adult (Figure 5). Eight of the ten birds were females and two were males. The distances between natal and first detected breeding nest sites varied from 15.0 to 372.2 km, with a mean of 110.2 km and a median of 98.1 km. Nine of the re-sampled individuals stayed in the region where they were born, forming two geographical clusters: Northern Finland (N = 5; of which four were females and one was a male) and Southern Finland (N = 4; of which three were females and one was a male). Only one individual changed regions, which was a female born in the north moving to the south for breeding. When comparing the distances between these two clusters, the mean dispersal in the northern region was 96.2 km, with a median of 118.1 km, ranging from 15 km to 133 km, while in the southern region it was 62.2 km on average, with a median of 51.1 km, ranging from 40 km to 106 km. The natal dispersal distance in females (N = 8) was 130 km on average, with a median of 112.2 km, ranging from 40.5 km to 372.2 km, and the distances in males (N = 2) ranged from 15.0 km to 46.8 km. The sample sizes were too small to test statistically whether there was a significant difference in the distances between the two regions or sexes.

4. Discussion

4.1. Genetic Diversity and Population Genetic Structure

The level of genetic diversity of Finnish golden eagles estimated from the nuclear loci remained quite stable throughout the study years. When compared with previously reported estimates for the Estonian–Finnish population [66], the Finnish population in this study had similar, yet slightly lower, observed and expected heterozygosities (HO = 0.57 and 0.60, and HE = 0.59 and 0.60 for Finland and Estonia–Finland, respectively). However, the Estonian–Finnish population in the previous study [66] had a substantially smaller sample size (N = 24) and consisted mostly of individuals from Estonia (N = 20), while here the estimates were from 297 Finnish golden eagles. The nuclear genetic diversity of golden eagles from Finland is at the same level as those reported for golden eagles from North America (HO = 0.52–0.62, and HE = 0.48–0.55) [41,67], British Isles (HO = 0.43–0.51, and HE = 0.48–0.51) [68,69], and Japan (HO = 0.52–0.59, and HE = 0.55–0.56) [70].
Meanwhile, mitochondrial genetic diversity was higher in Finland (ĥ = 0.62, and π = 0.0034) than previously reported for Fennoscandia (ĥ = 0.41, and π = 0.0010) [40]. In the previous study [40], the sample size was much smaller compared with this study (N = 38 and 88), which could have affected the estimates, so comparison of results should be made with caution. In addition, the Fennoscandian population in the previous study was mostly represented by individuals from Norway (N = 34), suggesting that the Finnish population has a higher genetic diversity than the Norwegian population, which may be because the latter is at the Eurasian northwesternmost edge of the eagle’s distribution. However, on a wider geographical scale, diversity values for mitochondrial control region sequences vary a lot (for example, in North America: ĥ = 0.49–0.81 and π = 0.0013–0.0030 [41,67,71]; and in Eurasia: ĥ = 0.41–0.93 and π = 0.0010–0.0090 [40,70]), likely depending much on the sample size and sequence length.
No population genetic structure in Finland was found with the used markers, in accordance with previous studies of the Holarctic region [40,66]; however, only 5 of 17 mitochondrial haplotypes were shared between northern and southern parts of the country. Surprisingly, one individual carrying mitochondrial DNA of the Mediterranean lineage was found in northern Finland, indicating that long-distance dispersal of golden eagles from south to north can occur.

4.2. Turnover Rate

While golden eagles are considered to be monogamous and mate for life, and to be highly territorial, the turnover rate of 23% suggests that this idea may not be that straightforward. The cost of turnover could have been expected to be high for such a species. Finding new territories can be challenging and lead to intraspecific aggression in crowded regions, while maintaining a territory is less costly [16]. However, the benefits of leaving a territory may outweigh these costs. For example, if a habitat change leads to increased breeding success, the pair may leave the territory to increase their chances of breeding [1]. Similarly, monogamy has several advantages, such as paternity assurance and reduced mate competition, which may at the same time decrease divorce rates [72]. However, if the breeding mate shows a lack of investment, or if the breeding fails, divorces may occur [22,72]. Turnover may also be a forced behavior, for instance due to habitat loss caused by urban and agricultural land expansion, or due to the death of a mate [73,74]. Especially, older individuals with settled territories, successful breeders, and individuals inhabiting high-quality territories are more likely to remain within a territory [1] but might be forced to change territories due to external factors.
In golden eagles, the number of turnover events of one parent was slightly higher than that of both parents. It is not known whether the other member of the pair had died or if the birds changed partners. However, as mortality for adult birds is low [33], it is unlikely that mortality alone would have caused all the one parent turnover events. When both parents were changed in a territory, it was possibly a result of breeding dispersal, or, if the male died, the female might have left the territory. While mortality is low for adult golden eagles, there are some factors that may contribute to higher-than-expected mortality in certain territories. Probable mortality causes for Finnish golden eagles include intraspecific aggression, persecution, lead poisoning, and collisions with cars, trains, powerlines, and wind turbines [33]. In particular, collisions may prove to be a higher risk in territories near powerlines or windfarms. On the other hand, persecution that used to be higher in specific areas, such as in the reindeer herding area (Northern Finland), where golden eagles prey on reindeer calves, has diminished and should not be concentrated to any specific area anymore due to the incentives paid by the government [75].
Divorces in golden eagles have been observed using radiotracking methods, when females changed a mate and a territory after an unsuccessful breeding with previous mates. The males remained in the territory and attempted to breed with a new female but the breeding failed again [22]. Genetic data has not previously been used to detect divorce in golden eagles, but, based on the high number of turnover events of one parent found in this study, it is likely that some divorces do occur. Moreover, for many bird species that have been considered monogamous, genetic studies have proven this to not always be the case [76,77].
In addition to mortality and divorce, extra-pair copulation may have resulted in the apparent one parent turnover events. Extra-pair copulation, specifically extra-pair paternity, is common in birds [78,79,80]. There have been no observations of extra-pair paternity in golden eagles, although observations of three eagles in one territory have been made in Scotland, Sweden, and Norway ([81,82,83] cited in 22). These records have been made based on visual observations, and it was not certain in all cases whether the third eagle was a male or a female. The three eagles participated in the incubation and prey provision for the chick. In Scotland, an additional male was observed displaying with the resident female while the resident male was present ([82] cited in 22). Based on the relatedness values between suggested full siblings in our dataset, it is possible that extra-pair paternity may have occurred. Further parentage analysis using the adult samples might provide more information on the issue.
Another contributing factor to turnover could be unclear territory boundaries. In Scotland, golden eagles were found to take over nests of neighboring territories when they were unoccupied, or absorb parts of other territories [84]. Whether this occurs in Finland is unknown. The breeding adult eagles in Finland are resident and highly territorial, so the territories might be more rigid and less dynamic. Still, it is possible that some territories are more complex. Moreover, the individual identity of the nest or territory determined by the data collector may not correspond to reality, especially when nests are close together. Clarification of the boundaries will require very intensive and continuous monitoring of all territories.
The observed turnover rates varied yearly, with the highest rates found in the later years. It might seem that the turnover rate increases over time (Figure 2), but, more likely, it is merely a result of the data structure and sampling. In many cases, the samples were from a few years apart, either because there was no breeding, no samples collected, or the sample had been excluded from the analyses. Therefore, it is possible that the later years showed a higher turnover rate since there was a higher chance of observing it. Thus, the yearly variation in turnover is most likely an artifact of the data structure and sampling and should not be used to describe the population in those years.
Turnover rate has not been estimated for golden eagles previously, which makes these results valuable, but also prevents the evaluation of results in relation to previous research. Fortunately, turnover has been estimated for some other raptor species, such as the gyrfalcon, with a 20% turnover rate [20], the eastern imperial eagle, with a 28–36% turnover rate [21], and the peregrine falcon, with a 21.7% turnover rate [15]. It appears that the estimated turnover rate for golden eagles in Finland conforms with the estimates in the other raptors. All these species have similar breeding behavior: they are known to be monogamous and to return to the same territory with alternative nests to breed, which allows for some comparisons. Moreover, the estimated turnover rate in peregrine falcons was performed using a similar method as in this study, allowing for a more robust comparison of results.

4.3. Turnover and Nest Change as a Result of Unsuccessful Breeding

Another significant finding of this study was that turnover and change of nest site within a territory seemed to occur more often after an unsuccessful breeding. This has been previously hypothesized [14,85], but has never received statistical support in golden eagles [22,86]. In the case of one parent turnover after an unsuccessful breeding, divorce may have occurred. Because of the differences in costs of breeding dispersal between sexes, it is likely that the female will leave the territory to find a new mate, while the male remains in the territory [72]. However, it is not possible to determine which parent left the territory with our data. One parent turnover after a successful breeding could be caused by mortality, as there is no obvious advantage in switching mates after a successful breeding because the benefits of monogamy are high [72], or by extra-pair copulations.
In cases of no turnover, the pairs appeared to remain together and within the same territory more often after successful breeding. Lack of turnover suggests that the territory is highly suitable for breeding, which could result from high prey abundance, no disturbances, or/and low competition. One of the main factors affecting breeding success is prey availability [87]. Some prey species of golden eagles fluctuate yearly, leading to poorer breeding years when prey is scarce, which might cause the pair to leave their territory to find better breeding and hunting grounds. The most successful breeding year during the study period was 2019, and it was thought to result from increased grouse populations and high number of hares [31]. In the United States, breeding success of golden eagles has been found to correlate with jackrabbit (Lepus californicus) abundance [88]. In contrast, an earlier Finnish study found no effect of prey availability on territory occupancy in golden eagles [89], but there were no significant fluctuations in prey abundance during the study period. Similarly, no relationship between breeding success and food supply was found in Scotland, possibly also due to a short study period [90]. Studying correlations between prey abundance and breeding success requires detailed data of both the prey abundance and breeding success. In Finland, the sizes of grouse populations are estimated yearly [91], providing an opportunity for future research to study the relationship between grouse species abundance and the breeding success of golden eagles.
Weather conditions during the breeding season can also affect breeding success. Golden eagles are especially sensitive to poor weather conditions during incubation, which may lead to failed nesting [22,90]. In Finland, long cold and rainy springs have possibly reduced breeding success in some years and areas [32]. However, the relationship between weather and breeding success is complicated. Poor weather conditions may also affect prey abundance, which leads to lower breeding success, rather than directly affecting golden eagle breeding performance. Still, extreme weather conditions may directly lead to breeding failure, as observed in the United States, where a three-day blizzard resulted in 71% of nests containing chicks to fail [22].
In addition to turnover, unsuccessful breeding appeared to lead to a nest site change in the following year. Similar factors may contribute to the change in a nest site as to turnover. Since golden eagle territories are quite large, 151 km2 on average [30], it is possible that different hunting grounds are available within the territory. Golden eagles may change nests to be closer to better hunting areas rather than completely abandoning their territory. In addition, there might be other factors within the territory that may affect choice of the nest site, such as destruction of the previous nest site or disturbance. However, a habitat assessment needs to be carried out to have a better understanding of this subject. Based on results from this study, it seems that the pairs favor a nest where they previously had a successful breeding.

4.4. Natal Dispersal

The natal dispersal of Finnish golden eagles was estimated for ten individuals. Despite the sample size being small, it provides new valuable information on golden eagle dispersal in Finland, because natal dispersal distances have not been estimated here previously.
The mean natal dispersal distance of Finnish golden eagles was 110.2 km, which was higher than the observed distance in southwestern United States (55.3 km) [9]. Individuals seemed to disperse further from their natal territories in Northern Finland, where population density is higher, than in Southern Finland. Similarly, estimates within the United States have also varied depending on geographical location, from a median of 46.6 km in arid southwestern to 64.5 km in less arid western United States [9]. Thus, in addition to density, differences in dispersal distances between regions could arise from differences in habitat quality [9]. Even though comparing the results should be carried out with caution due to small sample sizes (N = 16 in the USA, and N = 10 in Finland), in both studies the majority of samples was from females, making the results somewhat comparable. Previous studies have found that there might be a difference in natal dispersal distances between sexes, which could be a behavioral mechanism to avoid inbreeding [1]. In golden eagles, females seem to travel further than males [9], but in this study the sample sizes were too small (two males and eight females) to perform a statistical comparison between sexes.

5. Conclusions

This study provides novel information on the population dynamics of golden eagles in general, and on population genetics of golden eagles in Finland. We found no notable changes in genetic diversity during the 15-year study period and did not discover any population structure, which may be due to effective dispersal of the species. The turnover rate of 23% is high for a species who mates for life and has a strong nest-site fidelity. These results suggest that there are multiple factors affecting breeding pairs, or golden eagles might not exhibit such extreme monogamy as believed. Based on the findings, golden eagles are prone to change territories, mates, or nests after an unsuccessful breeding. Further implications of this study might arise by performing more detailed analyses on the causes of turnover.

Supplementary Materials

The following supporting information can be downloaded at: https://www.mdpi.com/article/10.3390/d15040567/s1, Table S1: Microsatellite primers [92,93]; Table S2: Datasets used for different analyses with the number of samples used; Table S3: Characteristics of used microsatellite loci.in the total dataset; Table S4: Characteristics of used microsatellite loci in the chick dataset; Table S5: Mitochondrial haplotype information; Figure S1: Results from the structure analysis of Finnish golden eagles; Figure S2: Median-joining haplotype network of Finnish golden eagles.

Author Contributions

Conceptualization, S.P. and L.K.; methodology, A.K., E.K., S.P. and L.K.; software, A.K. and E.K.; validation, A.K., E.K., S.P. and L.K.; formal analysis, A.K. and E.K.; investigation, A.K., E.K., T.O., S.P. and L.K.; resources, T.O., S.P. and L.K.; data curation, T.O., E.K. and A.K.; writing—original draft preparation, A.K. and E.K.; writing—review & editing, A.K., E.K., T.O., S.P. and L.K.; visualization, A.K., E.K. and L.K.; supervision, E.K., S.P. and L.K.; project administration, S.P. and L.K.; funding acquisition, A.K. and L.K.; A.K. and E.K. equal contribution. All authors have read and agreed to the published version of the manuscript.

Funding

This research was funded by Oulun luonnonystäväin yhdistys and the University of Oulu.

Data Availability Statement

DNA sequences are available from GenBank under accession numbers OQ679875-OQ679891 and microsatellite data from the corresponding author on reasonable request. Since the golden eagle is a protected and still persecuted species, sensitive data on location of individuals and territories will not be released.

Acknowledgments

We thank Soile Alatalo, Hannele Parkkinen, Ian Russell-Jones, Ville Sannikka and Sujeet Singh for their assistance in the lab, and all the volunteer ringers of Metsähallitus for collecting samples.

Conflicts of Interest

The authors declare no conflict of interest.

References

  1. Greenwood, P.J. Mating systems, philopatry and dispersal in birds and mammals. Anim. Behav. 1980, 28, 1140–1162. [Google Scholar] [CrossRef]
  2. Linkhart, B.D.; Reynolds, R.T. Return rate, fidelity, and dispersal in a breeding population of Flammulated Owls (Otus flammeolus). Auk 2007, 124, 264–275. [Google Scholar] [CrossRef]
  3. Cilimburg, A.B.; Lindberg, M.S.; Tewksburry, J.J.; Hejl, S.J. Effects of dispersal on survival probability of adult Yellow Warblers (Dendroica petechia). Auk 2002, 119, 778–789. [Google Scholar] [CrossRef]
  4. Greenwood, P.J.; Harvey, P.H. The natal and breeding dispersal of birds. Annu. Rev. Ecol. Syst. 1982, 13, 1–21. [Google Scholar] [CrossRef]
  5. Paradis, E.; Baillie, S.R.; Sutherland, W.J.; Gregory, R.D. Patterns of natal and breeding dispersal in birds. J. Anim. Ecol. 1998, 67, 518–536. [Google Scholar] [CrossRef]
  6. Briggs, C.W.; Collopy, M.W.; Woodbridge, B. Correlates and fitness consequences of natal dispersal in Swainson’s Hawks. Condor 2012, 114, 764–770. [Google Scholar] [CrossRef]
  7. Clarke, A.L.; Sæther, B.-E.; Røskaft, E. Sex Biases in Avian Dispersal: A Reappraisal. Oikos 1997, 79, 429–438. [Google Scholar] [CrossRef]
  8. Pasinelli, G.; Schiegg, K.; Walters, J.R. Genetic and environmental influences on natal dispersal distance in a resident bird species. Am. Nat. 2004, 164, 660–669. [Google Scholar] [CrossRef]
  9. Murphy, R.K.; Stahlecker, D.W.; Millsap, B.A.; Jacobson, K.V.; Johnson, A.; Smith, C.S.; Tator, K.J.; Kruse, K.L. Natal dispersal distance of golden eagles in the southwestern United States. J. Fish Wildl. Manag. 2019, 10, 213–218. [Google Scholar] [CrossRef]
  10. Doligez, B.; Pärt, T. Estimating fitness consequences of dispersal: A road to “know-where”? Non-random dispersal and the underestimation of dispersers’ fitness. J. Anim. Ecol. 2008, 77, 1199–1211. [Google Scholar] [CrossRef]
  11. Scheiner, S.M. Bet-hedging as a complex interaction among developmental instability, environmental heterogeneity, dispersal, and life-history strategy. Ecol. Evol. 2014, 4, 505–515. [Google Scholar] [CrossRef] [PubMed]
  12. Dong, R.; Ye, X.; Zhong, L.; Li, X.; Li, M.; Wang, H.; Yu, X. Effects of breeding success, age and sex on breeding dispersal of a reintroduced population of the Crested Ibis (Nipponia nippon) in Ningshan County, China. Avian Res. 2018, 9, 1–7. [Google Scholar] [CrossRef]
  13. Riding, C.S.; Belthoff, J.R. Breeding Dispersal by Burrowing Owls (Athene cunicularia) in Idaho. J. Raptor Res. 2018, 52, 143–157. [Google Scholar] [CrossRef]
  14. Kochert, M.N.; Steenhof, K. Frequency of nest use by Golden Eagles in southwestern Idaho. J. Raptor Res. 2012, 46, 239–247. [Google Scholar] [CrossRef]
  15. Ponnikas, S.; Ollila, T.; Kvist, L. Turnover and post-bottleneck genetic structure in a recovering population of Peregrine Falcons Falco peregrinus. Ibis 2017, 159, 311–323. [Google Scholar] [CrossRef]
  16. Harts, A.M.F.; Jaatinen, K.; Kokko, H. Evolution of natal and breeding dispersal: When is a territory an asset worth protecting? Behav. Ecol. 2016, 27, 287–294. [Google Scholar] [CrossRef]
  17. Otterbeck, A.; Lindén, A.; Gunko, R.; Ylinen, E.; Byholm, P. Female breeding dispersal to higher quality habitats in a philopatric top predator. J. Ornithol. 2022, 163, 3–92. [Google Scholar] [CrossRef]
  18. Enfjäll, K.; Leimar, O. The evolution of dispersal—The importance of information about population density and habitat characteristics. Oikos 2009, 118, 291–299. [Google Scholar] [CrossRef]
  19. Vasko, V.; Laaksonen, T.; Valkama, J.; Korpimäki, E. Breeding dispersal of Eurasian kestrels Falco tinnunculus under temporally fluctuating food abundance. J. Avian Biol. 2011, 42, 552–563. [Google Scholar] [CrossRef]
  20. Booms, T.L.; Talbot, S.L.; Sage, G.K.; McCaffery, B.J.; McCracken, K.G.; Schempf, P.F. Nest-site fidelity and dispersal of Gyrfalcons estimated by noninvasive genetic sampling. Condor 2011, 113, 768–778. [Google Scholar] [CrossRef]
  21. Vili, N.; Szabó, K.; Kovács, S.; Kabai, P.; Kalmár, L.; Horváth, M. High turnover rate revealed by non-invasive genetic analyses in an expanding Eastern Imperial Eagle population. Acta Zool. Acad. Sci. Hung. 2013, 59, 279–295. [Google Scholar]
  22. Watson, J. The Golden Eagle, 2nd ed.; T & AD Poyser: London, UK, 2010. [Google Scholar]
  23. Selås, V.; Kleven, O.; Steen, O.F. Female turnover rate differs between two Northern Goshawk Accipiter gentilis nesting areas, as revealed by DNA analysis of moulted feathers. Ibis 2017, 159, 554–566. [Google Scholar] [CrossRef]
  24. Bush, K.L.; Vinsky, M.D.; Aldridge, C.L.; Paszkowski, C.A. A comparison of sample types varying in invasiveness for use in DNA sex determination in an endangered population of Greater Sage-Grouse (Centrocercus uropihasianus). Conserv. Genet. 2005, 6, 867–870. [Google Scholar] [CrossRef]
  25. Hyvärinen, E.; Juslén, A.K.; Kemppainen, E.; Uddström, A.; Liukko, U.-M. Suomen Lajien Uhanalaisuus 2019—Punainen Kirja: The 2019 Red List of Finnish Species; Ympäristöministeriö & Suomen Ympäristökeskus: Helsinki, Finland, 2019. [Google Scholar]
  26. BirdLife International Species Factsheet: Aquila chrysaetos. Available online: http://datazone.birdlife.org/species/factsheet/golden-eagle-aquila-chrysaetos (accessed on 6 March 2023).
  27. Below, A. Suojelualueverkoston merkitys eräille nisäkäs-ja lintulajeille. In Metsähallituksen Luonnonsuojelujulkaisuja, Sarja A, Nro 121; Metsähallitus: Vantaa, Finland, 2000. (In Finnish) [Google Scholar]
  28. Ollila, T.; Koskimies, P. Maakotkan ja muuttohaukan suojelutaso Suomessa. Linnut Vuosik. 2008, 2007, 8–17, (In Finnish with English Summary). [Google Scholar]
  29. Ollila, T. Raportti Maakotkan, Muuttohaukan, Tunturihaukan Sekä Oulun Ja Lapin Läänien Merikotkien Pesinnöistä Vuonna 2021; Metsähallitus: Vantaa, Finland, 2021. (In Finnish) [Google Scholar]
  30. Ollila, T. The monitoring project of the Golden Eagle Aquila chrysaetos in Finland. In Status of Raptor Populations in Eastern Fennoscandia, Proceedings of the Workshop, Kostomuksha, Karelia, Russia, 8–10 November 2005; Karelian Research Centre of the Russian Academy of Science Finnish-Russian Working Group on Nature Conservation: Petrozavodosk, Russia, 2005; pp. 114–116. [Google Scholar]
  31. Ollila, T. Raportti Maakotkan, Muuttohaukan, Tunturihaukan Sekä Oulun ja Lapin Läänien Merikotkien Pesinnöistä Vuonna 2019; Metsähallitus: Vantaa, Finland, 2019. (In Finnish) [Google Scholar]
  32. Ollila, T. Raportti Maakotkan, Muuttohaukan, Tunturihaukan Sekä Oulun ja Lapin Läänien Merikotkien Pesinnöistä Vuonna 2020; Metsähallitus: Vantaa, Finland, 2020. (In Finnish) [Google Scholar]
  33. Ollila, T. Suomen maakotkat vuonna 2018—Onko pesintämenestys huonontumassa? Linnut Vuosik. 2019, 2018, 104–109, (In Finnish with English Summary). [Google Scholar]
  34. Honkala, J.; Viikki, C. Europe’s Oldest Golden Eagle is Finnish; Life Science News. University of Helsinki. 2019. Available online: https://www.helsinki.fi/en/news/life-science-news/europes-oldest-golden-eagle-is-finnish (accessed on 14 March 2023).
  35. Tjernberg, M. Kungsörnens status och ekologi i Sverige 2006 samt tänkbara prognoser för artens urveckling. In Rapport till Rovdjursutredningen—ArtDatabanken; Swedish Agricultural University: Uppsala, Sweden, 2006. (In Swedish) [Google Scholar]
  36. Brown, L.; Amadon, D. Eagles, Hawks, and Falcons of the World; Country Life Books: London, UK, 1968; Volume 2. [Google Scholar]
  37. Slater, S.; Keller, K.; Knight, R. Interannual Golden Eagle (Aquila chrysaetos) Nest-Use Patterns in Central Utah: Implications for Long-Term Nest Protection. J. Raptor Res. 2017, 51, 129–135. [Google Scholar] [CrossRef]
  38. Millsap, B.A.; Grubb, T.G.; Murphy, R.K.; Swem, T.; Watson, J.W. Conservation significance of alternative nests of Golden Eagles. Glob. Ecol. Conserv. 2015, 3, 234–241. [Google Scholar] [CrossRef]
  39. Bielikova, M.; Ficek, A.; Valkova, D.; Turna, J. Multiplex PCR amplification of 13 microsatellite loci for Aquila chrysaetos in forensic applications. Biologia 2010, 65, 1081–1088. [Google Scholar] [CrossRef]
  40. Nebel, C.; Gamauf, A.; Haring, E.; Segelbacher, G.; Villers, A.; Zachos, F.E. Mitochondrial DNA analysis reveals Holarctic homogeneity and a distinct Mediterranean lineage in the Golden Eagle (Aquila chrysaetos). Biol. J. Linn. Soc. 2015, 116, 328–340. [Google Scholar] [CrossRef]
  41. Sonsthagen, S.A.; Coonan, T.J.; Latta, B.C.; Sage, G.K.; Talbot, S.L. Genetic diversity of a newly established population of Golden Eagles on the Channel Islands, California. Biol. Conserv. 2012, 146, 116–122. [Google Scholar] [CrossRef]
  42. Griffiths, R.; Double, M.C.; Orr, K.; Dawson, R.J. A DNA test to sex most birds. Mol. Ecol. 1998, 7, 1071–1075. [Google Scholar] [CrossRef] [PubMed]
  43. Ito, H.; Sudo-Yamaji, A.; Abe, M.; Murase, T.; Tsubota, T. Sex identification by alternative polymerase chain reaction methods in Falconiformes. Zool. Sci. 2003, 20, 339–344. [Google Scholar] [CrossRef] [PubMed]
  44. Honka, J.; Merikanto, K. Microsat_Errcalc. 2020. Available online: https://github.com/karimerikanto/microsat_errcalc (accessed on 25 April 2022).
  45. Kalinowski, S.T.; Taper, M.L.; Marshall, T.C. Revising how the computer program Cervus accommodates genotyping error increases success in paternity assignment. Mol. Ecol. 2007, 16, 1099–1106. [Google Scholar] [CrossRef]
  46. van Oosterhout, C.; Hutchinson, B.; Wills, D.; Shipley, P. MICRO-CHECKER: Software for identifying and correcting genotyping errors in microsatellite data. Mol. Ecol. Notes 2004, 4, 535–538. [Google Scholar] [CrossRef]
  47. Hall, T.A. BioEdit: A user-friendly biological sequence alignment editor and analysis program for Windows 95/98/NT. Nucleic Acids Symp. Ser. 1999, 41, 95–98. [Google Scholar]
  48. Goudet, J.J. FSTAT (Version 1.2): A Computer Program to Calculate F-Statistics. J. Hered. 1995, 86, 485–486. [Google Scholar] [CrossRef]
  49. Excoffier, L.; Lischer, H.E.L. Arlequin suite ver. 3.5: A new series of programs to perform population genetics analyses under Linux and Windows. Mol. Ecol. Res. 2010, 10, 564–567. [Google Scholar] [CrossRef]
  50. Raymond, M.; Rousset, F. GENEPOP (version 1.2): Population genetics software for exact tests and ecumenicism. Heredity 1995, 86, 248–249. [Google Scholar] [CrossRef]
  51. Pritchard, J.K.; Stephens, M.; Donnelly, P. Inference of population structure using multilocus genotype data. Genetics 2000, 155, 945–959. [Google Scholar] [CrossRef]
  52. Li, Y.L.; Liu, J.X. StructureSelector: A web-based software to select and visualize the optimal number of clusters using multiple methods. Mol. Ecol. Resour. 2018, 18, 176–177. [Google Scholar] [CrossRef]
  53. Evanno, G.; Regnaut, S.; Goudet, J. Detecting the Number of Clusters of Individuals Using the Software Structure: A Simulation Study. Mol. Ecol. 2005, 14, 2611–2620. [Google Scholar] [CrossRef] [PubMed]
  54. Puechmaille, S.J. The Program Structure Does Not Reliably Recover the Correct Population Structure When Sampling Is Uneven: Subsampling and New Estimators Alleviate the Problem. Mol. Ecol. Resour. 2016, 16, 608–627. [Google Scholar] [CrossRef] [PubMed]
  55. Francis, R.M. POPHELPER: An R package and web app to analyse and visualise population structure. Mol. Ecol. Resour. 2016, 17, 27–32. [Google Scholar] [CrossRef] [PubMed]
  56. Thompson, J.D.; Higgins, D.G.; Gibson, T.J. CLUSTAL W: Improving the sensitivity of progressive multiple sequence alignment through sequence weighting, position-specific gap penalties and weight matrix choice. Nucleic Acids Res. 1994, 22, 4673–4680. [Google Scholar] [CrossRef]
  57. Rozas, J.; Ferrer-Mata, A.; Sánchez-DelBarrio, J.C.; Guirao-Rico, S.; Librado, P.; Ramos-Onsins, S.E.; Sánchez-Gracia, A. DnaSP 6: DNA Sequence Polymorphism Analysis of Large Datasets. Mol. Biol. Evol. 2017, 34, 3299–3302. [Google Scholar] [CrossRef]
  58. Bandelt, H.; Forster, P.; Röhl, A. Median-joining networks for inferring intraspecific phylogenies. Mol. Biol. Evol. 1999, 16, 37–48. [Google Scholar] [CrossRef]
  59. Leigh, J.W.; Bryant, D. POPART: Full-feature software for haplotype network construction. Methods Ecol. Evol. 2015, 6, 1110–1116. [Google Scholar] [CrossRef]
  60. Inkscape Project. Inkscape. Available online: https://inkscape.org (accessed on 25 February 2023).
  61. RStudio Team. RStudio: Integrated Development for R. 2022. Available online: http://www.rstudio.com/ (accessed on 10 May 2022).
  62. Paradis, E. Pegas: An R package for population genetics with an integrated–modular approach. Bioinformatics 2010, 26, 419–420. [Google Scholar] [CrossRef]
  63. Paradis, E.; Schliep, K. Ape 5.0: An environment for modern phylogenetics and evolutionary analyses in R. Bioinformatics 2019, 35, 526–528. [Google Scholar] [CrossRef]
  64. Kalinowski, S.T.; Wagner, A.P.; Taper, M.L. ML-Relate: A computer program for maximum likelihood estimation of relatedness and relationship. Mol. Ecol. Notes 2006, 6, 576–579. [Google Scholar] [CrossRef]
  65. QGIS Development Team. QGIS Geographic Information System. Open Source Geospatial Foundation Project. 2023. Available online: http://qgis.osgeo.org (accessed on 14 March 2023).
  66. Nebel, C.; Gamauf, A.; Haring, E.; Segelbacher, G.; Väli, Ü.; Villers, A.; Zachos, F.E. New insights into population structure of the European Golden Eagle (Aquila chrysaetos) revealed by microsatellite analysis. Biol. J. Linn. Soc. 2019, 128, 611–631. [Google Scholar] [CrossRef]
  67. Craig, E.H.; Adams, J.R.; Waits, L.P.; Fuller, M.R.; Whittington, D.M. Nuclear and Mitochondrial DNA Analyses of Golden Eagles (Aquila chrysaetos canadensis) from Three Areas in Western North America; Initial Results and Conservation Implications. PLoS ONE 2016, 11, 164248. [Google Scholar] [CrossRef] [PubMed]
  68. Bourke, B.P.; Frantz, A.C.; Lavers, C.P.; Davison, A.; Dawson, D.A.; Burke, T.A. Genetic Signatures of Population Change in the British Golden Eagle (Aquila chrysaetos). Conserv. Genet. 2010, 11, 1837–1846. [Google Scholar] [CrossRef]
  69. Ogden, R.; Heap, E.; McEwing, R.; Tingay, R.; Whitfield, D.P. Population Structure and Dispersal Patterns in Scottish Golden Eagles Aquila chrysaetos Revealed by Molecular Genetic Analysis of Territorial Birds. Ibis 2015, 157, 837–848. [Google Scholar] [CrossRef]
  70. Sato, Y.; Ogden, R.; Komatsu, M.; Maeda, T.; Inoue-Murayama, M. Integration of Wild and Captive Genetic Management Approaches to Support Conservation of the Endangered Japanese Golden Eagle. Biol. Conserv. 2017, 213, 175–184. [Google Scholar] [CrossRef]
  71. Judkins, M.E.; van den Bussche, R.A. Holarctic Phylogeography of Golden Eagles (Aquila chrysaetos) and Evaluation of Alternative North American Management Approaches. Biol. J. Linn. Soc. 2018, 123, 471–482. [Google Scholar] [CrossRef]
  72. Klug, H. Why monogamy? A review of potential ultimate drivers. Front. Ecol. Evol. 2018, 6, 30. [Google Scholar] [CrossRef]
  73. Harvey, P.H.; Greenwood, P.J.; Campbell, B.; Stenning, M.J. Breeding Dispersal of the Pied Flycatcher (Ficedula hypoleuca). J. Anim. Ecol. 1984, 53, 727–736. [Google Scholar] [CrossRef]
  74. Divoky, G.J.; Horton, M. Breeding and Natal Dispersal, Nest Habitat Loss and Implications for Marbled Murrelet Populations. In Ecology and Conservation of the Marbled Murrelet; USDA Forest Service General Technical Report PSW-GTR-152; Ralph, C.J., Hunt, G.L., Jr., Raphael, M.G.E., Piatt, J.F., Eds.; USDA Forest Service: Albany, CA, USA, 1995; pp. 83–88. [Google Scholar]
  75. Suvantola, L. The Golden Eagle Compensation Scheme in Finland as an Example of Incentive Measures: Potential for Conflict Management? In Human-Wildlife Conflicts in Europe: Fisheries and Fish-Eating Vertebrates as a Model Case; Klenke, R.A., Ring, I., Kranz, A., Jepsen, N., Rauschmayer, F., Henle, K., Eds.; Springer: Berlin/Heidelberg, Germany, 2013; pp. 201–214. [Google Scholar]
  76. Gowaty, P.A.; Karlin, A.A. Multiple maternity and paternity in single broods of apparently monogamous Eastern Bluebirds (Sialia sialis). Behav. Ecol. Sociobiol. 1984, 15, 91–95. [Google Scholar] [CrossRef]
  77. Blakesley, J.A.; Anderson, D.R.; Noon, B.R. Breeding dispersal in the California Spotted Owl. Condor 2006, 108, 71–81. [Google Scholar] [CrossRef]
  78. Blomqvist, D.; Andersson, M.; Küpper, C.; Cuthill, I.C.; Kis, J.; Lanctot, R.B.; Brett, K.; Sandercock, B.K.; Székely, T.; Wallander, J.; et al. Genetic similarity between mates and extra-pair parentage in three species of shorebirds. Nature 2002, 419, 613–615. [Google Scholar] [CrossRef] [PubMed]
  79. Bao, X.; Liu, F.; Fan, Y.; Jia, B.; Li, J. Extra-pair paternity in two passerine species living in an extreme-arid desert region. Wilson J. Ornithol. 2019, 131, 638–644. [Google Scholar] [CrossRef] [PubMed]
  80. Krams, I.A.; Mennerat, A.; Krama, T.; Krams, R.; Joers, P.; Elferts, D.; Luoto, E.; Rantala, M.J.; Eliassen, S. Extra-pair paternity explains cooperation in a bird species. Proc. Natl. Acad. Sci. USA 2022, 119, e2112004119. [Google Scholar] [CrossRef] [PubMed]
  81. Laistal, O. Im Tal der Königsadler: Mit den Zugvögeln zum Polarkreis; Landbuck-Verklag GmbH: Hannover, Germany, 1966. (In German) [Google Scholar]
  82. Dennis, R. Probable polygyny by Golden Eagle. Br. Birds 1983, 76, 310–311. [Google Scholar]
  83. Bergo, G. Trios in the Golden Eagle Aquila chrysaetos (L.). Fauna Norv. Ser. C Cindus 1988, 11, 40–44. [Google Scholar]
  84. Whitfield, D.P.; Fielding, A.H.; McLeod, D.R.A.; Haworth, P.F.; Watson, J. A conservation framework for the Golden Eagle in Scotland: Refining condition targets and assessment of constraint influences. Biol. Conserv. 2006, 130, 465–480. [Google Scholar] [CrossRef]
  85. Culina, A.; Radersma, R.; Sheldon, B.C. Trading up: The fitness consequences of divorce in monogamous birds. Biol. Rev. 2015, 90, 1015–1034. [Google Scholar] [CrossRef]
  86. Boeker, E.L.; Ray, T.D. Golden Eagle population studies in the Southwest. Condor 1971, 73, 463–467. [Google Scholar] [CrossRef]
  87. Millon, A.; Arroyo, B.E.; Bretagnolle, V. Variable but predictable prey availability affects predator breeding success: Natural versus experimental evidence. J. Zool. 2008, 275, 349–358. [Google Scholar] [CrossRef]
  88. Steenhof, K.; Kochert, M.N.; Mcdonald, T.L. Interactive effects of prey and weather on Golden Eagle reproduction. J. Anim. Ecol. 1997, 66, 350. [Google Scholar] [CrossRef]
  89. Kaisanlahti-Jokimäki, M.L.; Jokimäki, J.; Huhta, E.; Ukkola, M.; Helle, P.; Ollila, T. Territory occupancy and breeding success of the Golden Eagle (Aquila chrysaetos) around tourist destinations in northern Finland. Ornis Fenn. 2008, 85, 2–12. [Google Scholar]
  90. Watson, J.; Rae, S.R.; Stillman, R. Nesting density and breeding success of Golden Eagles in relation to food supply in Scotland. J. Anim. Ecol. 1992, 61, 543–550. [Google Scholar] [CrossRef]
  91. Helle, P.; Ikonen, K.; Kantola, A. Wildlife monitoring in Finland: Online information for game administration, hunters, and the wider public. Can. J. For. Res. 2016, 46, 1491–1496. [Google Scholar] [CrossRef]
  92. Martínez-Cruz, B.; David, V.A.; Godoy, J.A.; Negro, J.J.; O’Brien, S.J.; Johnson, W.E. Eighteen polymorphic microsatellite markers for the highly endangered Spanish imperial eagle (Aquila adalberti) and related species. Mol. Ecol. Notes 2002, 2, 323–326. [Google Scholar] [CrossRef]
  93. Nesje, M.; Røed, K.H. Microsatellite DNA markers from the gyrfalcon (Falco rusticolus) and their use in other raptor species. Mol. Ecol. 2000, 9, 1438–1440. [Google Scholar] [CrossRef] [PubMed]
Figure 1. Sampling locations of individuals used in different analyses. (a) All samples. (b) All chick samples. (c) Chick samples used for genetic diversity and population structure analyses using mtDNA, with color codes for the detected haplotypes, indicating lack of population genetic structure. The Mediterranean haplotype (FIN7) is marked with the yellow star. (d) Chick samples used for genetic diversity and population structure analyses using microsatellites. Color intensity in panels (a,b) indicate sampling density, i.e., the darker the color, the more samples there are from the location, and multiple samples from a single location are arranged in rings.
Diversity 15 00567 g001
Figure 2. Turnover rate of parents each year, estimated from 11 microsatellite loci, as bars, and the actual number of chicks per year as a line.
Diversity 15 00567 g002
Figure 3. Number of turnover events estimated from 11 microsatellite loci of both (blue bars) or one parent (yellow bars) each year from 2006 to 2020.
Diversity 15 00567 g003
Figure 4. (a) Number of breeding events with and without turnover following successful (blue bars; breeding) and unsuccessful (yellow bars; no breeding) breeding attempts in the previous year. (b) Number of nest site changes within a territory when there was a successful (blue bars; breeding) or an unsuccessful (yellow bars; no breeding) breeding in the previous year, and the number of occasions when the pair used the same nest after a successful or an unsuccessful breeding year.
Diversity 15 00567 g004
Figure 5. Locations of ten golden eagle chick samples (circles) that were later identified as adults (triangles) using 11 microsatellite loci. Each individual has a unique color code, which is maintained for chick and adult ages. Years of sampling are indicated near the sampling points. The two males are indicated by symbols with a bold outline. Individuals from the northern group are represented by blue color shades, and from the southern group by yellow color shades. One individual that was born in Northern Finland and later was breeding in Southern Finland is colored in green.
Diversity 15 00567 g005
Table 1. Number of sampled chicks, nests, and territories during years 2006–2020 where samples were collected. Same territories were sampled in different years, and different nests from the same territories were sampled in different years, resulting in a different total number of nests and territories.
YearChicksNestsTerritories
2006252424
20071098484
2008585353
2009393535
2010302929
2011756161
2012807070
2013817272
20141038686
20151019191
2016363333
2017423939
2018353030
2019655858
2020564747
Total935455297
Table 2. Nuclear genetic diversity estimates of 11 microsatellite loci for yearly resampled chick datasets. Number of samples, observed (HO) and expected (HE) heterozygosities, number of alleles (A) and allelic richness (AR) based on a minimum of seven diploid individuals, and inbreeding coefficients (FIS).
YearNHOHEAARFIS
200690.5860.5844.273.950.032
2007300.5930.5935.824.040.018
2008160.5520.5514.643.570.061
2009130.6180.6184.733.940.009
201080.5740.5733.733.630.007
2011210.5800.5795.093.790.055
2012280.5810.5805.733.800.034
2013310.5940.5925.183.76−0.045
2014340.5510.5515.453.630.053
2015300.6030.6035.453.920.015
2016170.6150.6135.554.090.096
2017130.6090.7074.643.960.089
2018120.5690.5694.643.880.008
2019250.5830.5825.733.860.046
2020110.6330.6314.734.160.063
Disclaimer/Publisher’s Note: The statements, opinions and data contained in all publications are solely those of the individual author(s) and contributor(s) and not of MDPI and/or the editor(s). MDPI and/or the editor(s) disclaim responsibility for any injury to people or property resulting from any ideas, methods, instructions or products referred to in the content.

