
Length–Weight Relationships and Diversity Status of Fishes in the Midstream of the Jialing River, a Tributary of the Upper Yangtze River, China

Abstract
:1. Introduction
2. Materials and Methods
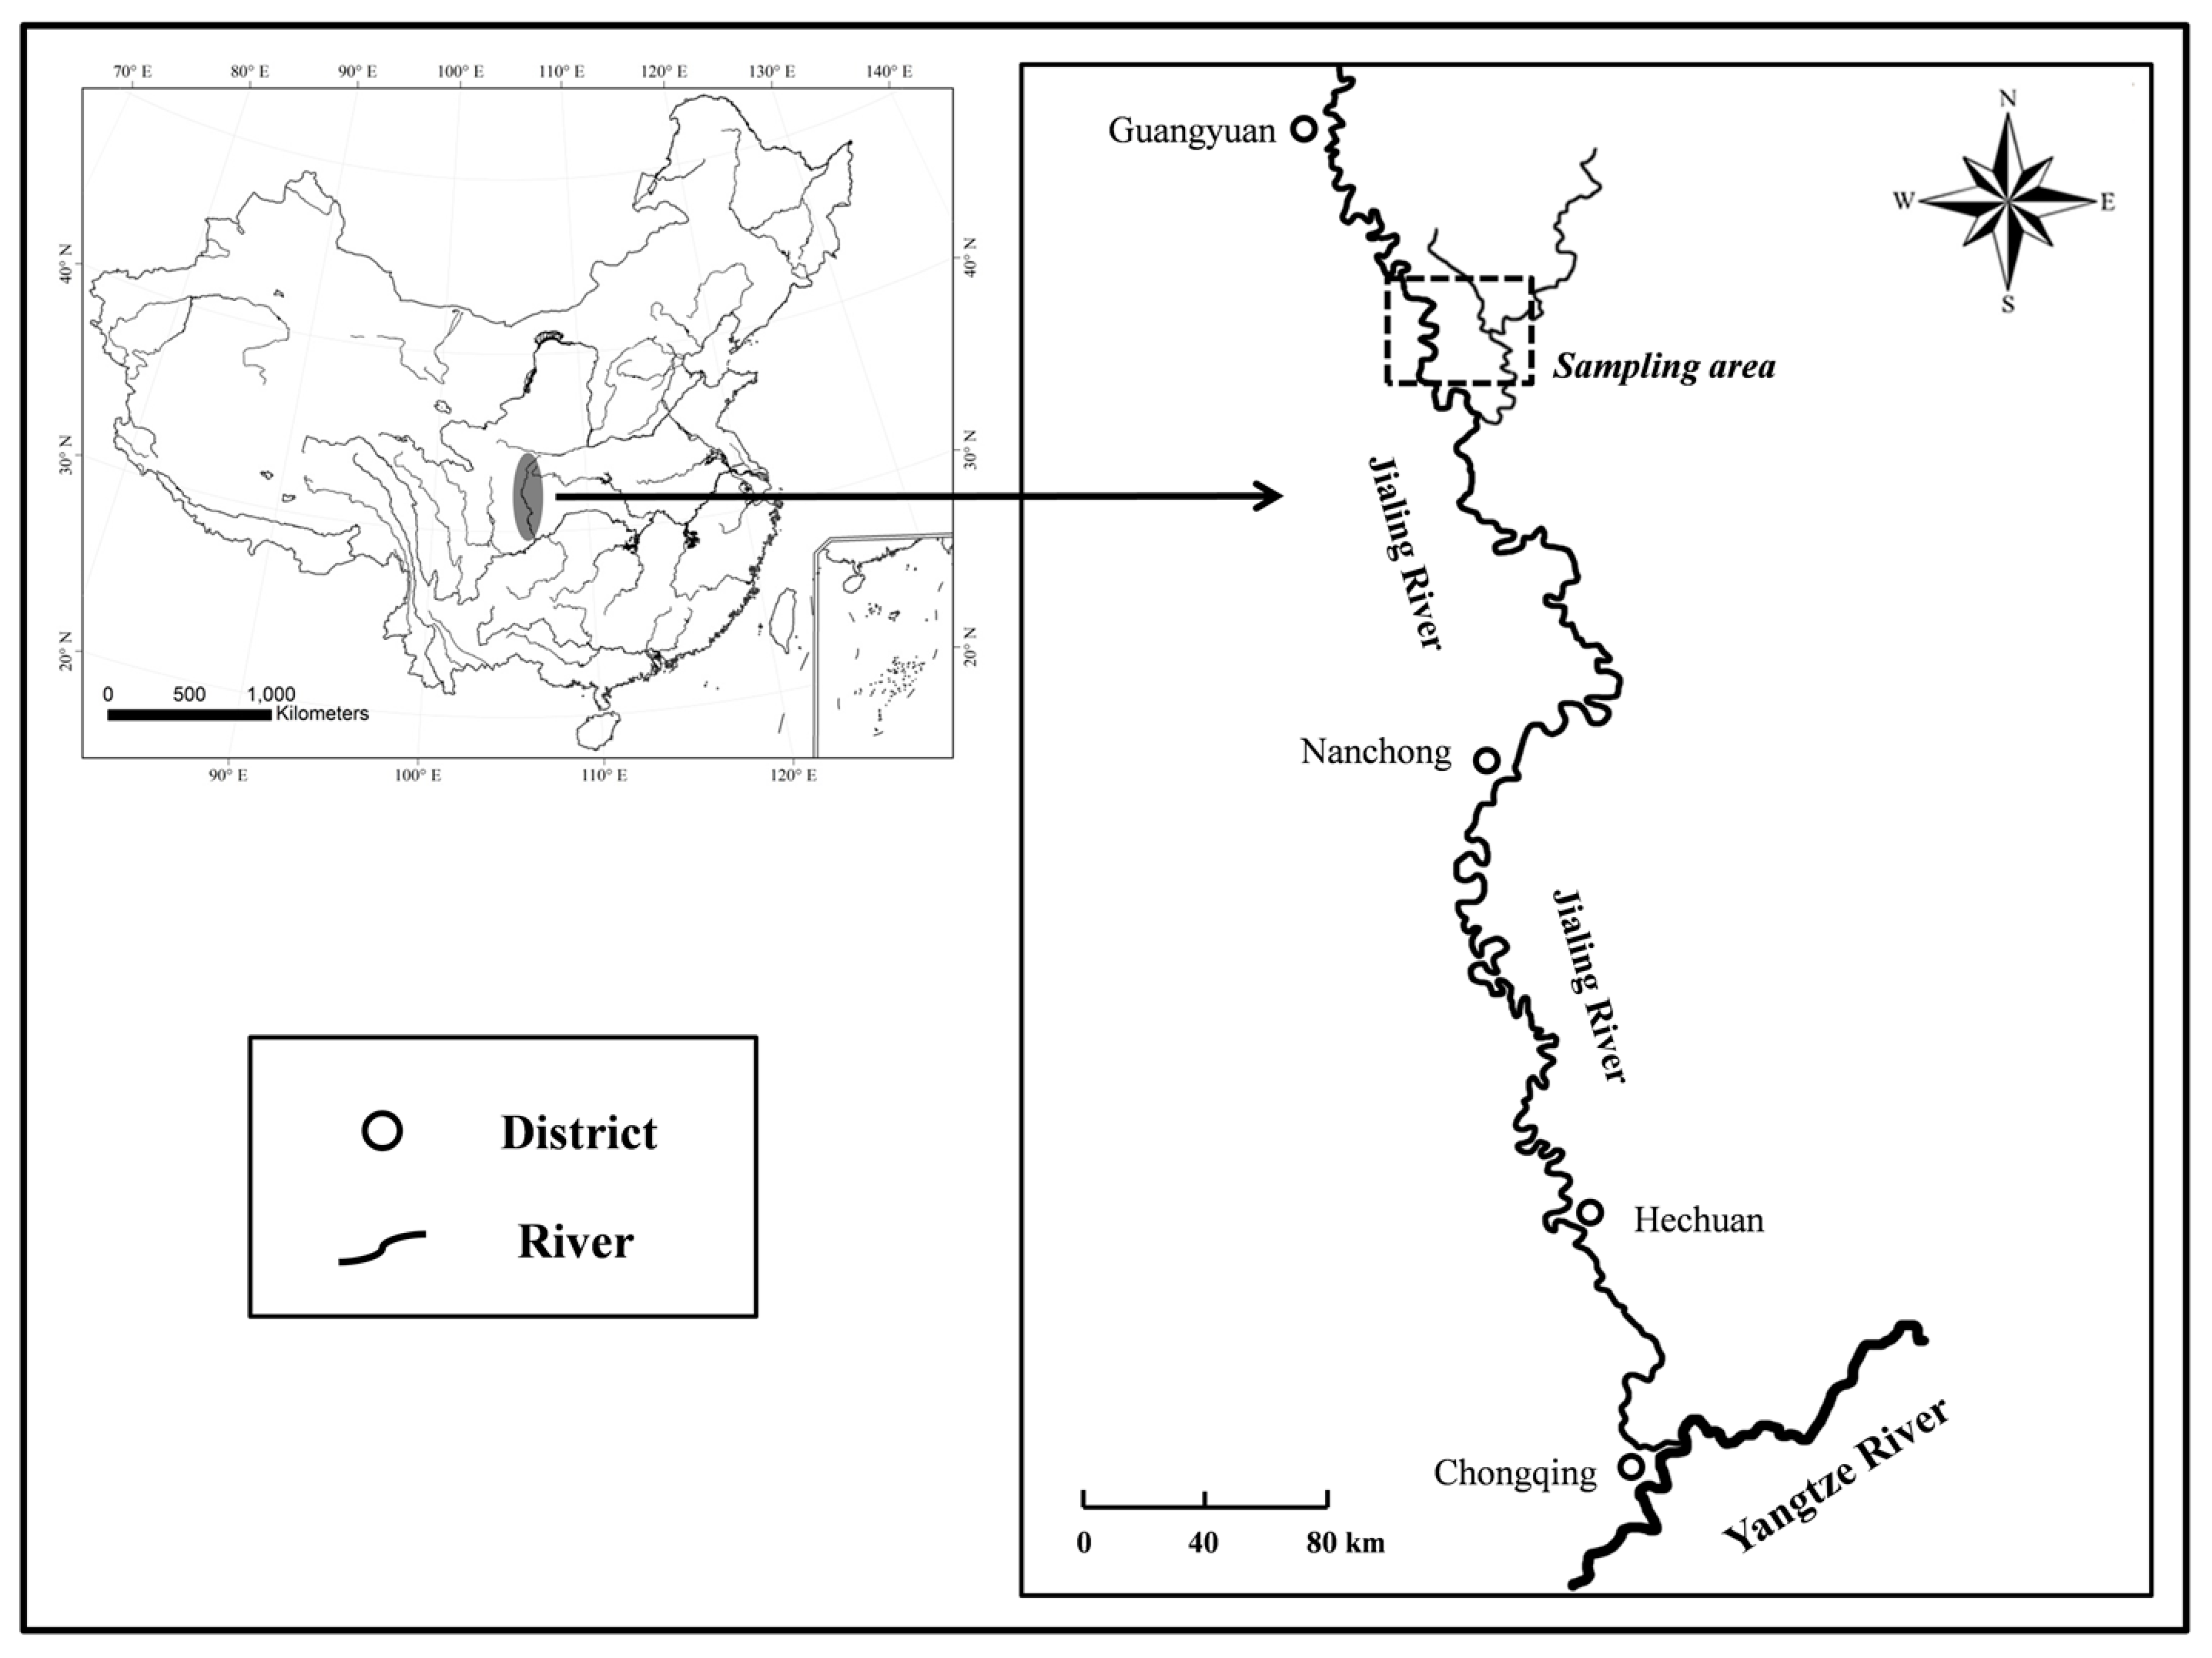
2.1. Study Region
2.2. Sample Collection
2.3. Data Analysis
3. Results
4. Discussion
5. Conclusions
Author Contributions
Funding
Institutional Review Board Statement
Informed Consent Statement
Data Availability Statement
Acknowledgments
Conflicts of Interest
References
- Ding, R.H. The Fishes of Sichuan, China; Sichuan Publishing House of Science and Technology: Chengdu, China, 1994. [Google Scholar]
- Zeng, X.; Zhao, N.; Sun, H.; Ye, L.; Zhai, J. Changes and relationships of climatic and hydrological droughts in the Jialing River basin, China. PLoS ONE 2015, 10, e0141648. [Google Scholar] [CrossRef]
- Zeng, Y. Studies on ecological structure of fish community in Jialing River. Resour. Environ. Yangtze Basin 2012, 21, 850–857. [Google Scholar] [CrossRef]
- Jiang, G.; He, X. Status of fish resources in the lower reaches of the Jialing River. Freshw. Fish. 2008, 38, 3–7. [Google Scholar] [CrossRef]
- Zeng, Y.; Zhou, X. An analysis of ichthyologic fauna of Jialing River. J. Huazhong Agric. Univ. 2012, 5, 390–394. [Google Scholar] [CrossRef]
- Liu, Y. The Fish Resources and Angling Fishery Status in the Middle Reaches of Jialing River. Ph.D. Thesis, Southwest University, Chongqing, China, 2021. [Google Scholar]
- Deng, Q.; Du, P.; Yang, K. The calculation and proposals of the hydraulic structure’s influence on the fish resource in the Jialing River. J. Sichuan Teach Coll. 1989, 10, 337–343. [Google Scholar] [CrossRef]
- Park, Y.S.; Chang, J.; Lek, S.; Cao, W.; Brosse, S. Conservation strategies for endemic fish species threatened by the Three Gorges dam. Conserv. Biol. 2003, 17, 1748–1758. [Google Scholar] [CrossRef]
- Beiningen, K.T.; Ebel, W.J. Effect of John Day dam on dissolved nitrogen concentrations and salmon in the Columbia River, 1968. Trans. Am. Fish. Soc. 1970, 99, 664–671. [Google Scholar] [CrossRef]
- Circular of the Ministry of Agriculture and Rural Affairs on the Scope and Time of the Fishing Ban in Key Waters of the Yangtze River Basin. 2019. Available online: https://www.ecolex.org/details/legislation/circular-of-the-ministry-of-agriculture-and-rural-affairs-on-the-scope-and-time-of-fishing-ban-in-key-waters-of-the-yangtze-river-basin-lex-faoc201994/? (accessed on 3 April 2023).
- Qing, H. Patterns of Fishes Diversity in Jialing River and Resources Vicissitude in the Middle and Lower Basin. Master’s Thesis, Southwest University, Chongqing, China, 2010. [Google Scholar]
- Zhang, H. The Study on Community Structure and Population Biology Research of the Main Economic Fish for the Middle Reaches of Jialing River Pengan. Ph.D. Thesis, China West Normal University, Nanchong, China, 2016. [Google Scholar]
- Froese, R. Cube law, condition factor and weight–length relationships: History, meta-analysis and recommendations. J. Appl. Ichthyol. 2006, 22, 241–253. [Google Scholar] [CrossRef]
- Sonwal, M.C.; Kingston Samuel, D.; Lakshmanan, R.; Paulraj, J. Length-weight relationship of five species of Nemipteridae family along the Gulf of Mannar, Eastern Indian Ocean. J. Appl. Ichthyol. 2022, 38, 265–267. [Google Scholar] [CrossRef]
- Hay, A.; Xian, W.; Bailly, N.; Liang, C.; Pauly, D. The why and how of determining length-weight relationships of fish from preserved museum specimens. J. Appl. Ichthyol. 2020, 36, 373–379. [Google Scholar] [CrossRef]
- Keys, A.B. The weight-length relation in fishes. Proc. Natl. Acad. Sci. USA 1928, 14, 922–925. [Google Scholar] [CrossRef] [PubMed]
- Hercos, A.P.; Prado-Valladares, A.C.; del Favero, J.M.; Zuchi, N.A.; Teixeira, T.F.; Albuquerque, F.E.A.; de Queiroz, H.L. Length-weight relationships of ornamental fish species from Amanã Lake, Amanã Reserve, Amazonas, Brazil. J. Appl. Ichthyol. 2021, 37, 985–988. [Google Scholar] [CrossRef]
- Zhang, F.; Xiong, X.; Wu, N.; Zeng, Y.; Fohrer, N. Length-weight relationships of two fish species from the Jialing River, the largest tributary of the upper Yangtze River, China. J. Appl. Ichthyol. 2018, 34, 1373–1375. [Google Scholar] [CrossRef]
- Zeng, Y.; Huang, Y.-Y.; Chen, Y.-B.; Li, Z.-J. Length-weight relationships of fishes in the Wu Jiao nature reserve and adjacent areas, China. J. Appl. Ichthyol. 2014, 30, 1099–1100. [Google Scholar] [CrossRef]
- Ma, K. On the concept of biodiversity. Biodivers. Sci. 1993, 1, 20–22. [Google Scholar] [CrossRef]
- Wilson, E. The Diversity of Life; Harvard University Press: Cambridge, MA, USA, 1992. [Google Scholar]
- Shannon, C.E.; Weaver, W. The Mathematical Theory of Communication; University of Illinois Press: Urbana, IL, USA, 1963. [Google Scholar]
- Margalef, R. Information theory in ecology. Soc. Gen. Syst. Res. 1957, 31, 36–71. [Google Scholar]
- Pielou, E.C. Species-diversity and pattern-diversity in the study of ecological succession. J. Theor. Biol. 1966, 10, 370–383. [Google Scholar] [CrossRef] [PubMed]
- Warwick, R.M. A new method for detecting pollution effects on marine macrobenthic communities. Mar. Biol. 1986, 92, 557–562. [Google Scholar] [CrossRef]
- Nelson, M.L.; McMahon, T.E.; Thurow, R.F. Decline of the migratory form in Bull Charr, Salvelinus Confluentus, and implications for conservation. Environ. Biol. Fishes 2002, 64, 321–332. [Google Scholar] [CrossRef]
- Bianchi, G.; Gislason, H.; Graham, K.; Hill, L.; Jin, X.; Koranteng, K.; Manickchand-Heileman, S.; Payá, I.; Sainsbury, K.; Sanchez, F.; et al. Impact of fishing on size composition and diversity of demersal fish communities. ICES J. Mar. Sci. 2000, 57, 558–571. [Google Scholar] [CrossRef]
- Liu, J.K.; Cao, W.X. Fish resources of the Yangtze River basin and the tactics for their conservation. Resour. Environ. Yangtze Basin 1992, 1, 17–23. [Google Scholar]
- Ren, L. The Study of Multi-Scale Health Evaluation of the Cascade Hydropower Development on the Jialing River in Sichuan. Ph.D. Thesis, Chongqing University, Chongqing, China, 2012. [Google Scholar]
- Chen, Y.Y. Fauna Sinica-Osteichthyes Cypriniformes II; Science Press: Beijing, China, 1998. [Google Scholar]
- Pinkas, L.; Oliphant, M.S.; Iverson, I.L.K. Food habits of albacore, bluefin tuna and bonito in California waters. Calif. Dep. Fish Game Fish Bull. 1971, 152, 1–105. [Google Scholar]
- Pauly, D. Fish population dynamics in tropical waters: A manual for use with programmable calculators. ICLARM Stud. Rev. 1984, 8, 325. [Google Scholar]
- Clarke, K.R.; Gorley, R.; Somerfield, P.J.; Warwick, R. Change in Marine Communities: An Approach to Statistical Analysis and Interpretation; Primer-E Ltd.: Auckland, New Zealand, 2014. [Google Scholar]
- SPSS. IBM SPSS Statistics for Windows, Version 20.0; SPSS Inc. Ltd.: Chicago, IL, USA, 2013.
- Falsone, F.; Geraci, M.L.; Scannella, D.; Gancitano, V.; Di Maio, F.; Sardo, G.; Quattrocchi, F.; Vitale, S. Length-weight relationships of 52 species from the south of Sicily (Central Mediterranean Sea). Fishes 2022, 7, 92. [Google Scholar] [CrossRef]
- Jisr, N.; Younes, G.; Sukhn, C.; El-Dakdouki, M.H. Length-weight relationships and relative condition factor of fish inhabiting the marine area of the Eastern Mediterranean city, Tripoli-Lebanon. Egypt. J. Aquat. Res. 2018, 44, 299–305. [Google Scholar] [CrossRef]
- Beckman, W.C. The length-weight relationship, factors for conversions between standard and total lengths, and coefficients of condition for seven michigan fishes. Trans. Am. Fish. Soc. 1948, 75, 237–256. [Google Scholar] [CrossRef]
- Tesch, W. “Age and Growth”, in Methods for Assessment of Fish Production in Fresh Waters; Blackwell Publishing: Oxford, UK, 1971. [Google Scholar]
- Salvador, G.N.; Frederico, R.G.; Pessali, T.C.; Vieira, F.; Freitas, T.M.S. Length-weight relationship of 21 fish species from Rio Doce River basin, Minas Gerais, Brazil. J. Appl. Ichthyol. 2018, 34, 1198–1201. [Google Scholar] [CrossRef]
- Froese, R.; Tsikliras, A.; Stergiou, K. Editorial note on weight–length relations of fishes. Acta Ichthyol. Piscat. 2011, 41, 261–263. [Google Scholar] [CrossRef]
- Mehanna, S.; Farouk, A.E. Length-weight relationship of 60 fish species from the Eastern Mediterranean Sea, Egypt (GFCM-GSA 26). Front. Mar. Sci. 2021, 8, 625422. [Google Scholar] [CrossRef]
- Mondol, M.R.; Hossen, M.A.; Nahar, D.A. Length–weight relationships of three fish species from the Bay of Bengal, Bangladesh. J. Appl. Ichthyol. 2017, 33, 604–606. [Google Scholar] [CrossRef]
- Hillman, R.E.; Davis, N.W.; Wennemer, J. Abundance, diversity, and stability in shore-zone fish communities in an area of Long Island Sound affected by the thermal discharge of a nuclear power station. Estuar. Coast. Mar. Sci. 1977, 5, 355–381. [Google Scholar] [CrossRef]
- Yan, T.; He, J.; Yang, D.; Ma, Z.; Chen, H.; Zhang, Q.; Deng, F.; Ye, L.; Pu, Y.; Zhang, M.; et al. Fish community structure and biomass particle-size spectrum in the upper reaches of the Jinsha River (China). Animals 2022, 12, 3412. [Google Scholar] [CrossRef] [PubMed]


| Species | Ni% | Wi% | Fi% | IRI | Dominance |
|---|---|---|---|---|---|
| Cypriniformes | |||||
| Catostomidae | |||||
| Myxocyprinus asiaticus ★ | 0.00 | 0.00 | 0.06 | 0.79 | rare species |
| Cobitidae | |||||
| Parabotia bimaculata ★ | 0.00 | 0.00 | 0.02 | 0.09 | rare species |
| Cyprinidae | |||||
| Ctenopharyngodon idellus | 0.01 | 0.05 | 0.49 | 295.22 | subdominant species |
| Squaliobarbus curriculus | 0.00 | 0.00 | 0.04 | 0.84 | rare species |
| Pseudolaubuca sinensis | 0.00 | 0.00 | 0.02 | 0.05 | rare species |
| Pseudolaubuca engraulis | 0.00 | 0.00 | 0.04 | 0.22 | rare species |
| Hemiculter leucisculus | 0.00 | 0.00 | 0.06 | 2.12 | rare species |
| Hemiculter tchangi ★ | 0.22 | 0.03 | 0.45 | 1099.37 | dominant species |
| Culter oxycephaloides | 0.15 | 0.20 | 0.84 | 2957.42 | dominant species |
| Cultrichthys erythropterus | 0.00 | 0.00 | 0.04 | 0.30 | rare species |
| Culter alburnus | 0.02 | 0.03 | 0.63 | 327.94 | subdominant species |
| Culter mongolicus | 0.02 | 0.02 | 0.45 | 180.86 | subdominant species |
| Megalobrama pellegrini ★ | 0.00 | 0.00 | 0.04 | 0.63 | rare species |
| Megalobrama amblycephala | 0.00 | 0.00 | 0.02 | 0.10 | rare species |
| Xenocypris argentea | 0.00 | 0.00 | 0.04 | 0.33 | rare species |
| Xenocypris davidi | 0.06 | 0.14 | 0.84 | 1721.03 | dominant species |
| Xenocypris microlepis | 0.02 | 0.07 | 0.59 | 536.94 | subdominant species |
| Pseudobrama simony | 0.03 | 0.01 | 0.37 | 143.56 | subdominant species |
| Hypophthalmichthys molitrix | 0.03 | 0.14 | 0.33 | 570.10 | subdominant species |
| Aristichthys nobilis | 0.01 | 0.07 | 0.51 | 425.30 | subdominant species |
| Hemibarbus labeo | 0.12 | 0.07 | 0.75 | 1387.33 | dominant species |
| Hemibarbus maculates | 0.01 | 0.01 | 0.29 | 43.73 | companion species |
| Sarcocheilichthys sinensis | 0.01 | 0.00 | 0.22 | 32.37 | companion species |
| Sarcocheilichthys nigripinnis | 0.01 | 0.00 | 0.16 | 11.66 | companion species |
| Squalidus argentatus | 0.06 | 0.00 | 0.35 | 202.92 | subdominant species |
| Rhinogobio typus | 0.00 | 0.00 | 0.14 | 4.21 | rare species |
| Saurogobio dabryi | 0.03 | 0.00 | 0.37 | 124.34 | subdominant species |
| Saurogobio punctatus sp. nov. | 0.00 | 0.00 | 0.08 | 2.09 | rare species |
| Rhodeus ocellatus | 0.00 | 0.00 | 0.02 | 0.04 | rare species |
| Rhodeus sinensis | 0.00 | 0.00 | 0.02 | 0.09 | rare species |
| Acheilognathus omeiensis ★ | 0.00 | 0.00 | 0.06 | 1.19 | rare species |
| Acheilognathus chankaensis | 0.01 | 0.00 | 0.16 | 19.91 | companion species |
| Spinibarbus sinensis | 0.01 | 0.02 | 0.27 | 59.50 | companion species |
| Acrossocheilus monticolus ★ | 0.00 | 0.00 | 0.08 | 1.40 | rare species |
| Onychostoma sima | 0.00 | 0.00 | 0.16 | 10.07 | companion species |
| Onychostoma macrolepis | 0.00 | 0.00 | 0.02 | 0.06 | rare species |
| Procypris rabaudi ★ | 0.00 | 0.00 | 0.02 | 0.05 | rare species |
| Cyprinus carpio | 0.02 | 0.07 | 0.63 | 543.18 | subdominant species |
| Cyprinu carpio L. mirror | 0.00 | 0.00 | 0.08 | 2.40 | rare species |
| Carassius auratus | 0.04 | 0.02 | 0.78 | 477.21 | subdominant species |
| Siluriformes | |||||
| Bagridae | |||||
| Pelteobagrus fulvidraco | 0.00 | 0.00 | 0.06 | 0.52 | rare species |
| Pelteobagrus vachelli | 0.01 | 0.00 | 0.25 | 20.07 | companion species |
| Pelteobagrus nitidus | 0.01 | 0.00 | 0.16 | 9.50 | rare species |
| Leiocassis crassilabris | 0.02 | 0.00 | 0.37 | 85.83 | companion species |
| Pseudobagrus truncates | 0.00 | 0.00 | 0.02 | 0.05 | rare species |
| Pseudobagrus emarginatus | 0.00 | 0.00 | 0.02 | 0.06 | rare species |
| Mystus macropterus | 0.01 | 0.00 | 0.24 | 30.28 | companion species |
| Siluridae | |||||
| Silurus asotus | 0.00 | 0.00 | 0.14 | 5.06 | rare species |
| Silurus meridionalis | 0.00 | 0.00 | 0.02 | 0.17 | rare species |
| Perciformes | |||||
| Serranidae | |||||
| Siniperca chuatsi | 0.05 | 0.03 | 0.33 | 259.70 | subdominant species |
| Siniperca scherzeri | 0.00 | 0.00 | 0.02 | 0.07 | rare species |
| Gobiidae | |||||
| Rhinogobius giurinus | 0.00 | 0.00 | 0.06 | 0.39 | rare species |
| Channidae | |||||
| Channa argus | 0.00 | 0.00 | 0.08 | 0.97 | rare species |
| Species | n | Standard Length Range (cm) | Body Weight Range (g) | Regression Parameters | Type of Growth | ||||||
|---|---|---|---|---|---|---|---|---|---|---|---|
| Min | Max | Min | Max | a | 95% CI of a | b | 95% CI of b | r2 | |||
| Ctenopharyngodon idellus | 68 | 24.5 | 58.4 | 295 | 3370 | 0.060 | 0.040–0.090 | 2.652 | 2.539–2.766 | 0.971 | A- |
| Hemiculter tchangi | 1002 | 5.4 | 23.9 | 1.4 | 195.3 | 0.010 | 0.009–0.011 | 3.067 | 3.023–3.110 | 0.950 | A+ |
| Culter oxycephaloides | 691 | 16.4 | 46.2 | 53.7 | 1171.1 | 0.012 | 0.011–0.014 | 3.008 | 2.972–3.045 | 0.974 | I |
| Culter alburnus | 95 | 8.2 | 57.2 | 6.3 | 2210 | 0.017 | 0.014–0.023 | 2.851 | 2.777–2.925 | 0.984 | A- |
| Culter mongolicus | 79 | 8.3 | 49.5 | 6.2 | 1785 | 0.011 | 0.009–0.013 | 3.045 | 2.979–3.111 | 0.991 | I |
| Xenocypris davidi | 296 | 9.2 | 46.9 | 11.2 | 1639.5 | 0.009 | 0.007–0.011 | 3.180 | 3.105–3.255 | 0.959 | A+ |
| Xenocypris microlepis | 97 | 22.3 | 51.3 | 164.6 | 1968.2 | 0.041 | 0.019–0.089 | 2.745 | 2.536–2.954 | 0.878 | I |
| Pseudobrama simony | 142 | 13.8 | 18.6 | 40.9 | 179.5 | 0.026 | 0.009–0.075 | 2.842 | 2.469–3.215 | 0.619 | I |
| Hypophthalmichthys molitrix | 120 | 7.3 | 73.5 | 7.2 | 9140 | 0.018 | 0.012–0.027 | 3.038 | 2.929–3.146 | 0.963 | I |
| Aristichthys nobilis | 53 | 24.9 | 85.6 | 205.6 | 15980 | 0.015 | 0.007–0.033 | 3.078 | 2.862–3.293 | 0.941 | I |
| Hemibarbus labeo | 543 | 12.2 | 28.5 | 27.7 | 355.5 | 0.020 | 0.016–0.024 | 2.951 | 2.887–3.016 | 0.937 | I |
| Hemibarbus maculates | 35 | 16.8 | 36 | 80 | 845.3 | 0.011 | 0.006–0.020 | 3.129 | 2.943–3.315 | 0.973 | I |
| Sarcocheilichthys sinensis | 60 | 4.3 | 24.2 | 1.6 | 190.3 | 0.027 | 0.020–0.035 | 2.933 | 2.823–3.043 | 0.980 | A- |
| Sarcocheilichthys nigripinnis | 33 | 4.5 | 12.5 | 1.5 | 38.1 | 0.009 | 0.005–0.016 | 3.325 | 3.052–3.597 | 0.952 | A+ |
| Squalidus argentatus | 254 | 4.7 | 14.3 | 1.5 | 33.9 | 0.026 | 0.020–0.034 | 2.760 | 2.639–2.881 | 0.889 | A- |
| Saurogobio dabryi | 142 | 4.7 | 19.4 | 3.2 | 98.8 | 0.056 | 0.039–0.081 | 2.372 | 2.227–2.516 | 0.883 | A- |
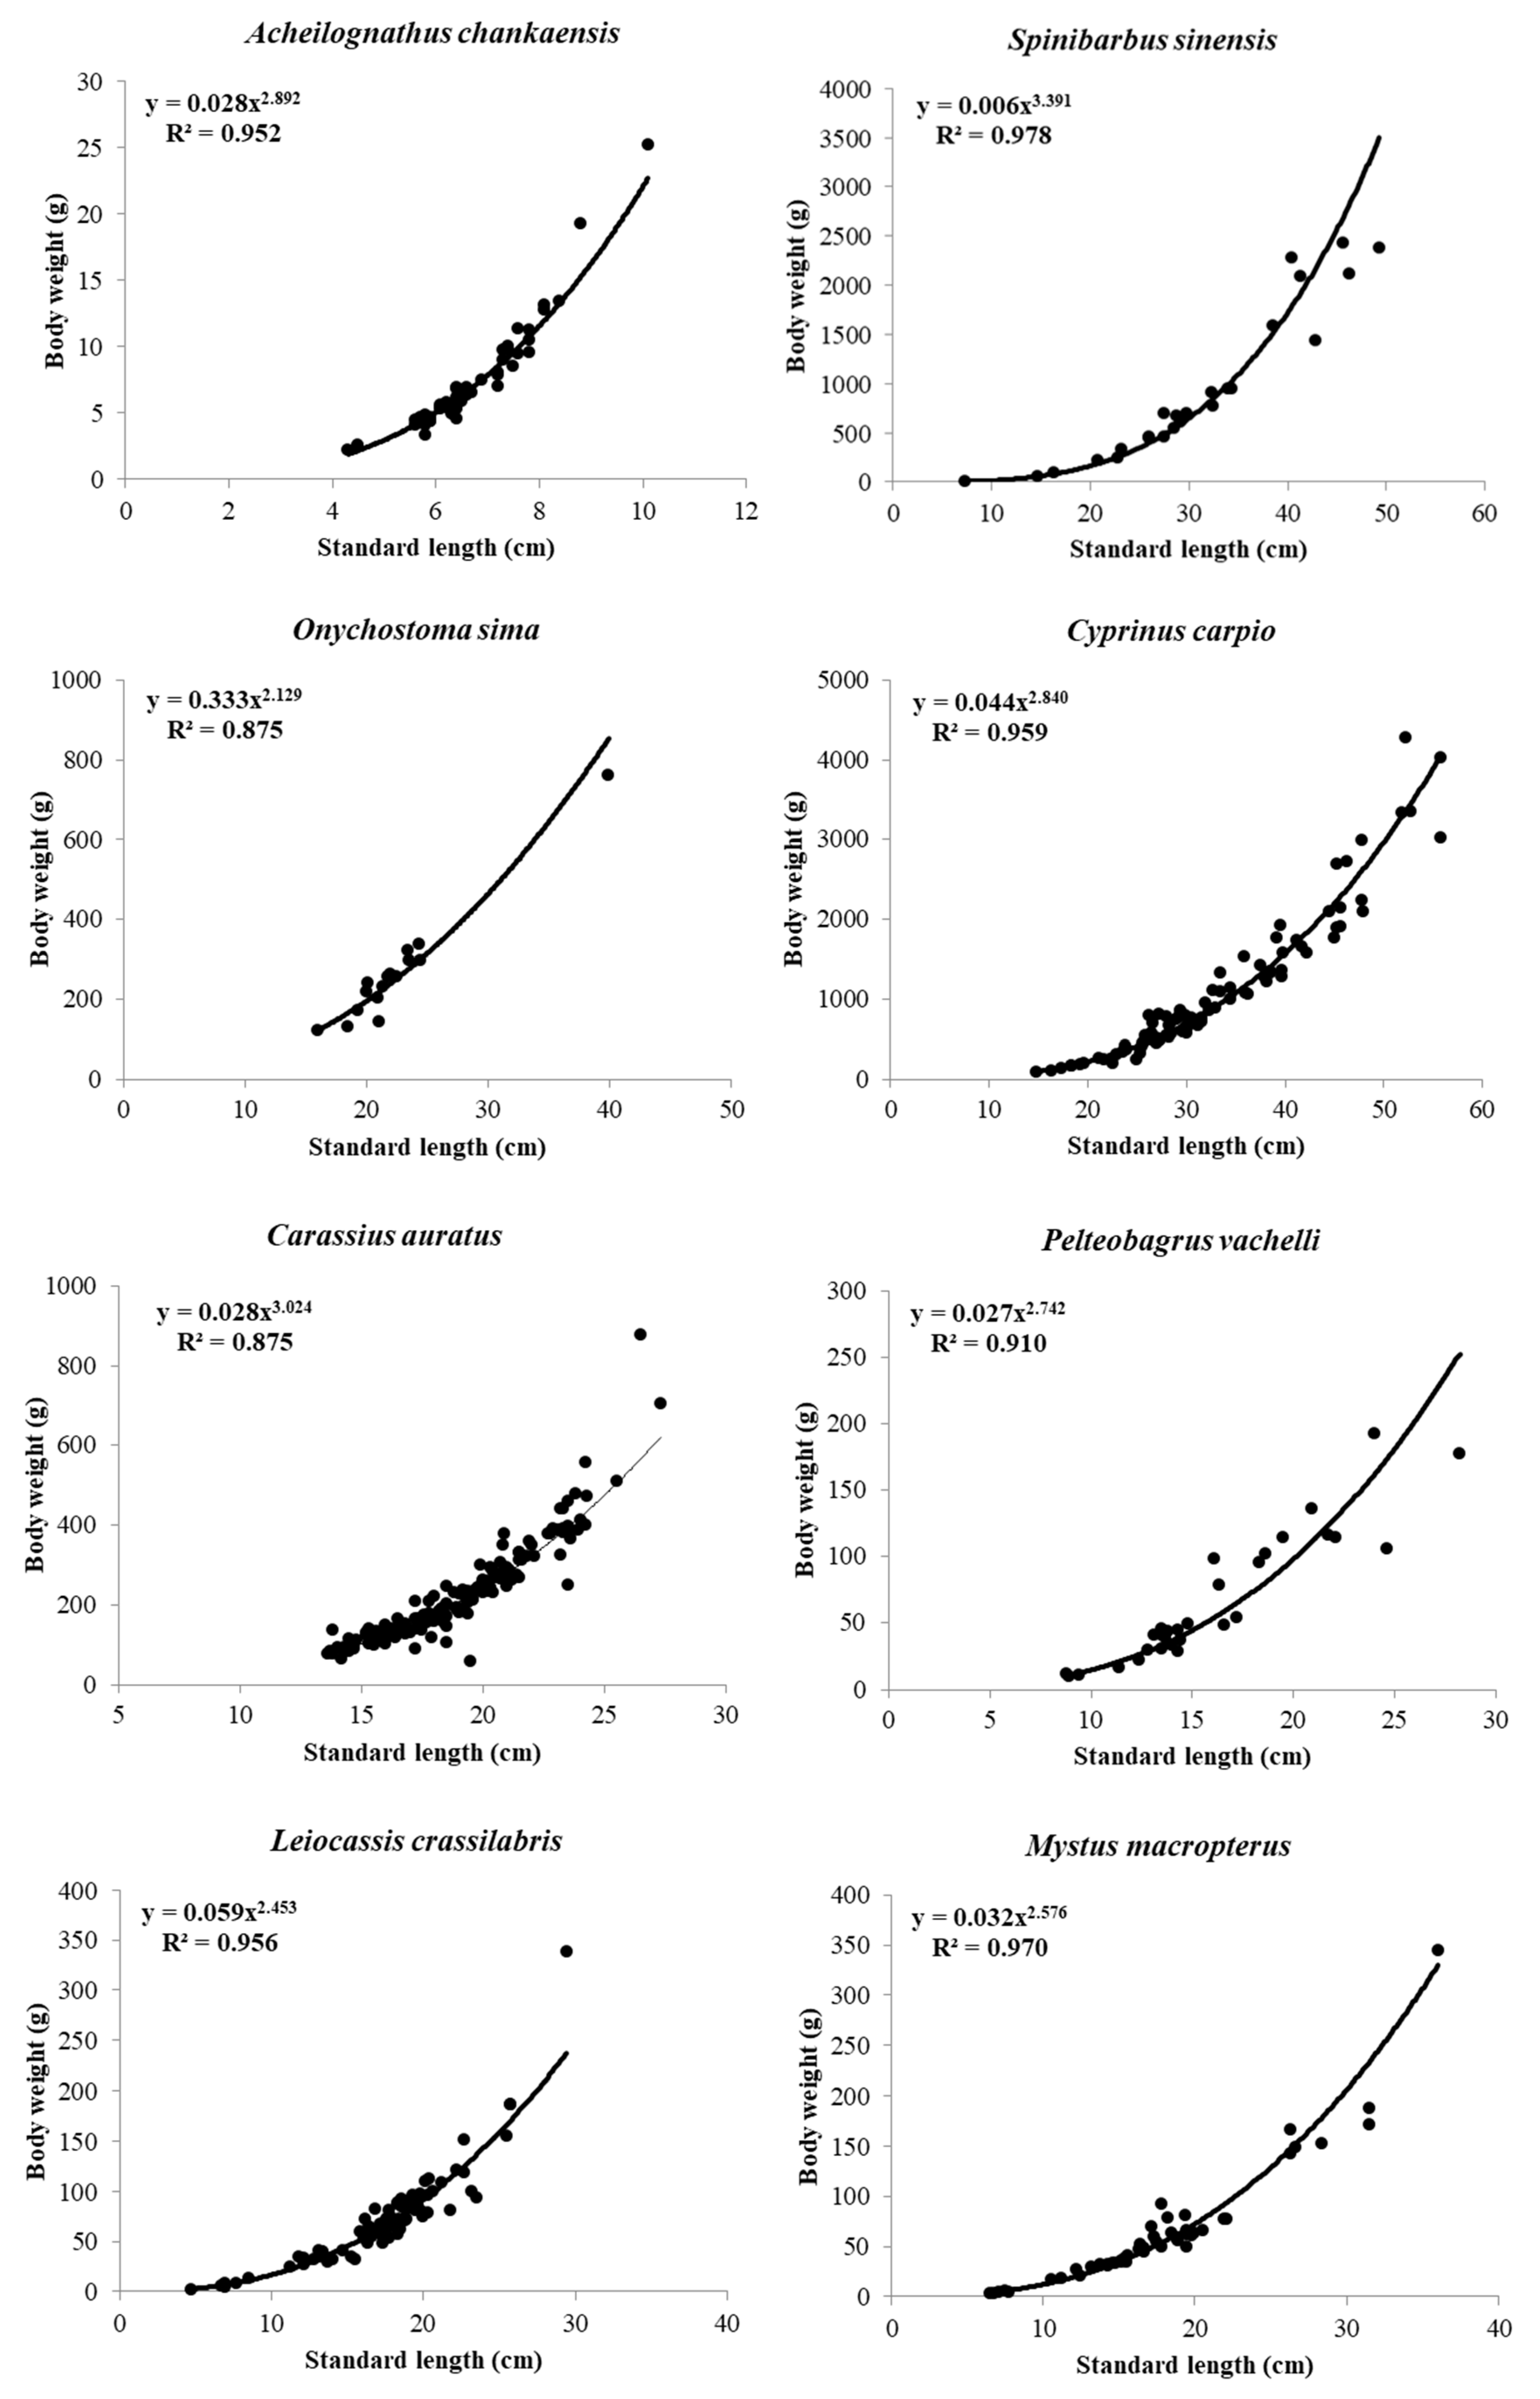
| Acheilognathus chankaensis | 57 | 4.3 | 10.1 | 2.2 | 25.2 | 0.028 | 0.020–0.039 | 2.892 | 2.715–3.068 | 0.952 | A- |
| Spinibarbus sinensis | 25 | 7.3 | 49.3 | 3.2 | 2430 | 0.006 | 0.003–0.013 | 3.391 | 3.172–3.610 | 0.978 | I |
| Onychostoma sima | 16 | 16 | 39.9 | 122.7 | 762.5 | 0.333 | 0.080–1.386 | 2.129 | 1.668–2.590 | 0.875 | A- |
| Cyprinus carpio | 89 | 14.8 | 55.8 | 92.4 | 4285 | 0.044 | 0.029–0.068 | 2.840 | 2.715–2.966 | 0.959 | I |
| Carassius auratus | 165 | 13.6 | 27.3 | 59.8 | 878.6 | 0.028 | 0.017–0.047 | 3.024 | 2.847–3.201 | 0.875 | I |
| Pelteobagrus vachelli | 30 | 8.8 | 28.2 | 9.1 | 192 | 0.027 | 0.011–0.067 | 2.742 | 2.408–3.075 | 0.910 | A- |
| Leiocassis crassilabris | 86 | 4.7 | 29.4 | 2.3 | 338.1 | 0.059 | 0.043–0.082 | 2.453 | 2.339–2.568 | 0.956 | A- |
| Mystus macropterus | 49 | 6.5 | 36 | 3.5 | 344.2 | 0.032 | 0.022–0.047 | 2.576 | 2.442–2.710 | 0.970 | A- |
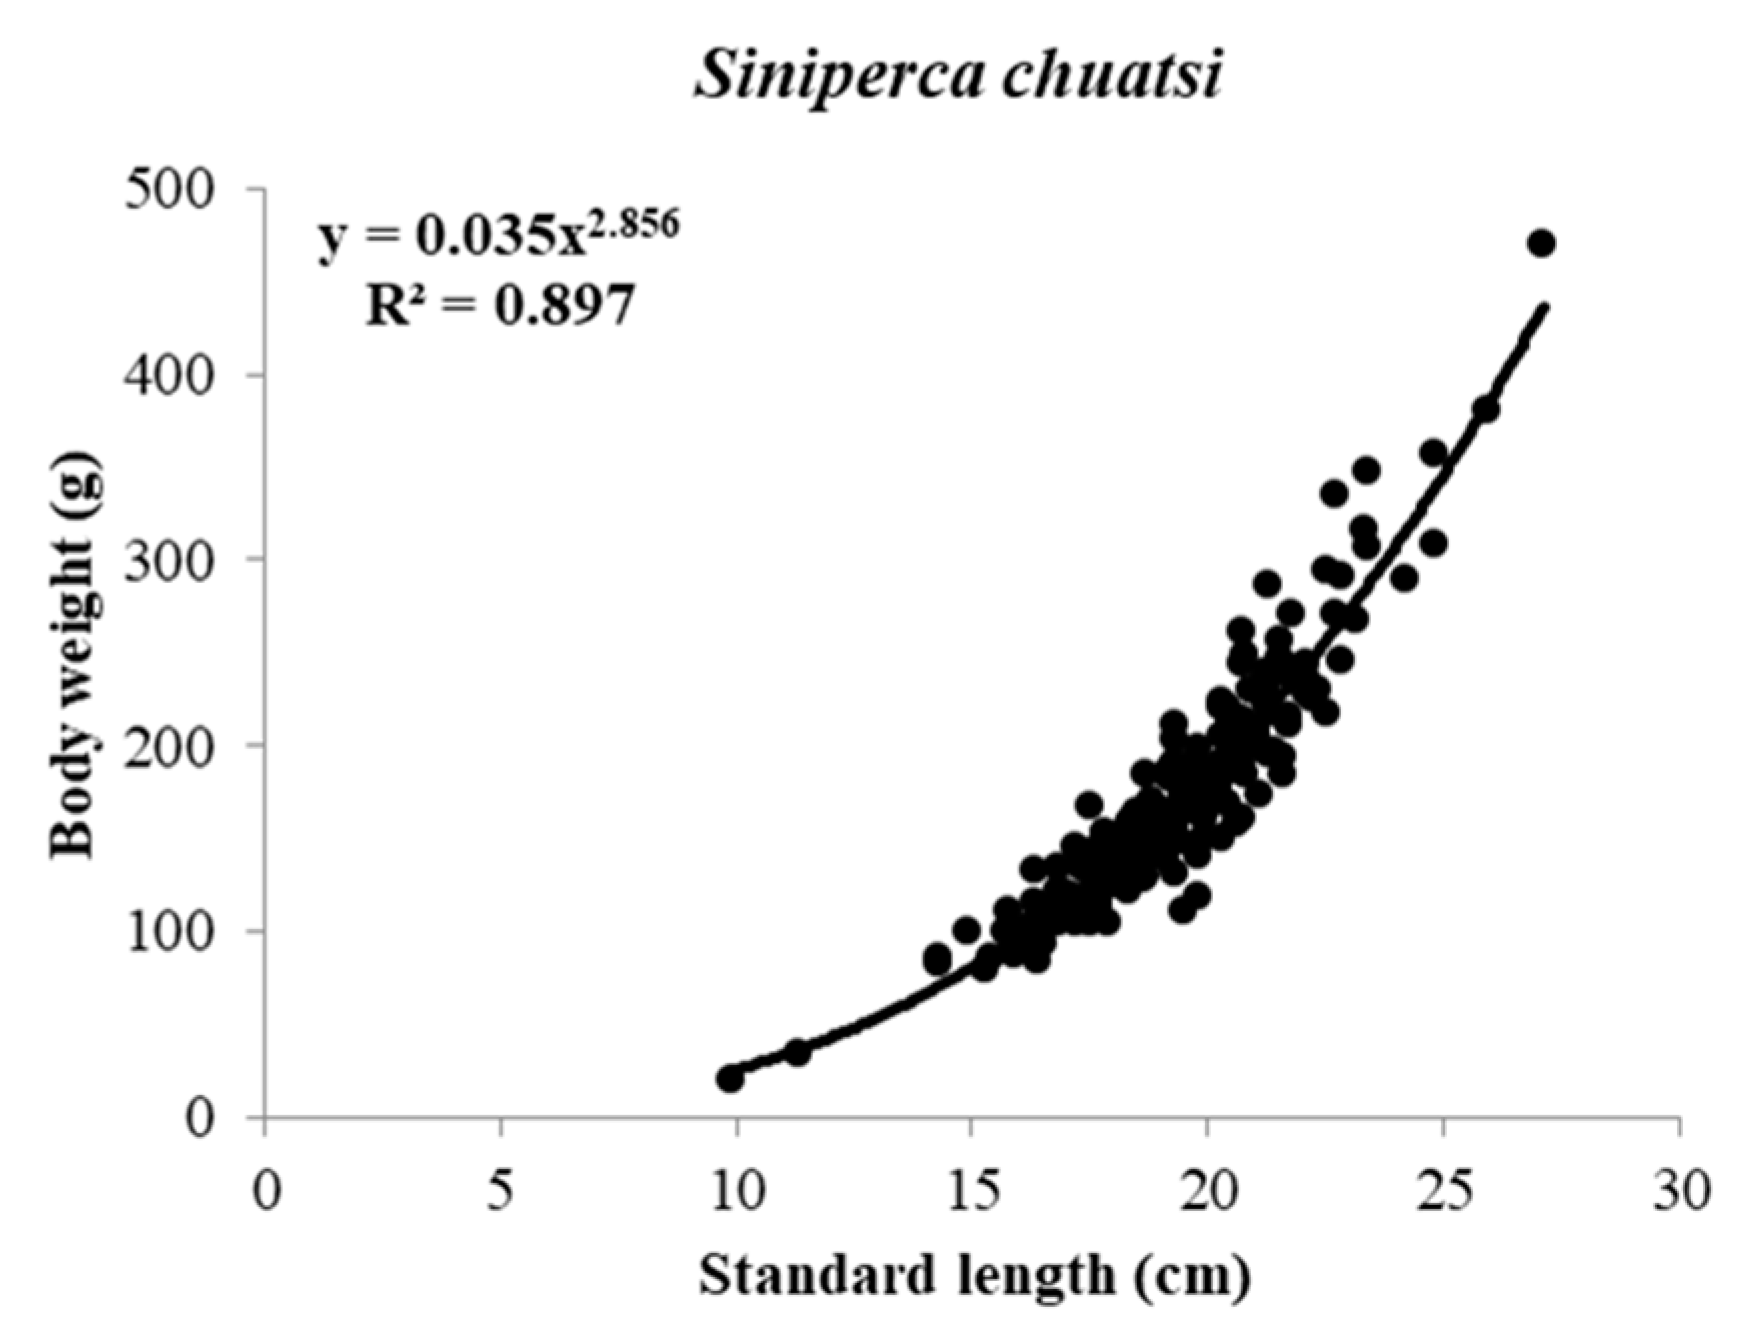
| Siniperca chuatsi | 233 | 9.9 | 27.1 | 20.3 | 469.3 | 0.035 | 0.024–0.051 | 2.856 | 2.730–2.981 | 0.897 | A- |
Disclaimer/Publisher’s Note: The statements, opinions and data contained in all publications are solely those of the individual author(s) and contributor(s) and not of MDPI and/or the editor(s). MDPI and/or the editor(s) disclaim responsibility for any injury to people or property resulting from any ideas, methods, instructions or products referred to in the content. |
© 2023 by the authors. Licensee MDPI, Basel, Switzerland. This article is an open access article distributed under the terms and conditions of the Creative Commons Attribution (CC BY) license (https://creativecommons.org/licenses/by/4.0/).
Share and Cite
Qin, Q.; Xu, J.; Zhang, F.; He, S.; Zhou, T.; Li, S.; Zeng, Y. Length–Weight Relationships and Diversity Status of Fishes in the Midstream of the Jialing River, a Tributary of the Upper Yangtze River, China. Diversity 2023, 15, 561. https://doi.org/10.3390/d15040561
Qin Q, Xu J, Zhang F, He S, Zhou T, Li S, Zeng Y. Length–Weight Relationships and Diversity Status of Fishes in the Midstream of the Jialing River, a Tributary of the Upper Yangtze River, China. Diversity. 2023; 15(4):561. https://doi.org/10.3390/d15040561
Chicago/Turabian StyleQin, Qiang, Jianghaoyue Xu, Fubin Zhang, Shan He, Tong Zhou, Shuyin Li, and Yu Zeng. 2023. "Length–Weight Relationships and Diversity Status of Fishes in the Midstream of the Jialing River, a Tributary of the Upper Yangtze River, China" Diversity 15, no. 4: 561. https://doi.org/10.3390/d15040561