Article

Distribution and Species Richness of Benthic Polychaeta and Sipuncula in the Northwestern Pacific

1
Department of Biological Sciences, Institute for Ecology, Diversity and Evolution, Goethe University Frankfurt, 60438 Frankfurt am Main, Germany
2
Senckenberg Research Institute and Natural History Museum, Department of Marine Zoology, 60325 Frankfurt am Main, Germany
*
Author to whom correspondence should be addressed.
Diversity 2023, 15(4), 557; https://doi.org/10.3390/d15040557
Submission received: 10 February 2023 / Revised: 3 April 2023 / Accepted: 7 April 2023 / Published: 14 April 2023
(This article belongs to the Special Issue Mapping Marine Biodiversity Knowledge Gaps Using Open Data)

Abstract

:
Polychaeta and Sipuncula are abundant inhabitants of benthic marine habitats and have been increasingly sampled in the Northwest Pacific (NWP). However, polychaete and sipunculan species richness, composition, and distribution patterns still require further investigation, despite previous studies due to increasing deep-sea data flow. Using occurrence records for Polychaeta and Sipuncula from the Ocean Biodiversity Information System (OBIS) and the Global Biodiversity Information Facility (GBIF), we analyzed sampling effort (the number of distribution records), alpha (the number of species per 700,000 km2 hexagon cells) and gamma (the number of species per 5° latitudinal band) species diversity, and estimated species richness along latitudinal and bathymetric gradients. The species richness estimations were also correlated with multiple environmental and topographic variables, including depth, temperature, dissolved oxygen, chlorophyll, primary production, phytoplankton, current velocity, light, iron, nitrate, phosphate, silicate, and salinity. The dataset included over 30,000 distribution records belonging to polychaete (31,114 records, 98%) and sipunculan (690 records, 2%) species. Half of the distribution records were reported at a species level. The area around the island of Hainan and South Korea showed the highest alpha species richness (the number of species per 700,000 km2 hexagon cell), yet the estimated species richness (ES50) indicated that there might be many unknown, unsampled, or non-digitized species throughout the whole NWP. Correspondingly, most distribution records (sampling effort) and gamma species richness were found between latitudes 20 and 40° and decreased towards higher latitudes. Sipuncula were reported relatively more frequently from the deep sea than Polychaeta (62.8% vs. 12%). Overall, the number of species and records decreased with increasing depth, with a peak at about 5000 m. The alpha species richness had the strongest positive correlations with temperature, chlorophyll, primary production, and phytoplankton concentration. Here, we provide an overview of the species richness and distribution of Polychaeta in comparison with Sipuncula in the NWP, in both shallow and deep environments. This study demonstrates where further sampling efforts are needed to fill our knowledge gaps on annelids’ distribution and diversity along the NWP. This could improve the analyses of the distribution and diversity of annelids to better understand the current environmental drivers of biodiversity, as well as predicting potential future drivers. The outcome of the environmental correlation provides thus valuable knowledge for predicting the future impacts of global warming on potential distribution shifts of annelids into new environments such as the Arctic Sea, possibly resulting in biological invasions.

1. Introduction

The Northwest Pacific (NWP) is known as a heterogeneous environment due to volcanic and tectonic activities. In the last century, the NWP has been thoroughly investigated and thus belongs to the more extensively sampled regions of our oceans [1,2,3,4,5,6,7,8,9]. This makes it a suitable study region for large-scale diversity and distribution analysis.
Polychaetes have always been among the most abundant taxa [2,4,5,7,10], reflecting that polychaetes have the highest sampling effort and species richness in marine environments of the NWP [10,11,12,13,14,15]. Polychaetes also occur in freshwater, brackish water, as well as rarely on land or as parasites [13]. Polychaete worms are a considerably diverse taxon [16] currently consisting of over 12,000 species [9]. However, new species are found and described regularly, indicating that many species are still unknown [3,10,14,17]. A recent review of the discovery progress in polychaetes predicts 5200 additional unknown species [18]. While some studies found that benthic polychaete species richness had a negative relationship with depth [19,20], others have shown that species richness of polychaetes peaks at depths around 2000 m and decreases thereafter [21,22]. More conclusive analyses are thus needed.
Similar to Polychaeta, the monophyletic order Sipuncula is found from shallow waters to the deep sea, and from the tropics to the poles [10,14,23,24]. Recent studies place the Sipuncula within the Annelida [25,26,27,28,29] which is why they were included in this analysis. In addition, sipunculan species richness seems to decrease towards higher latitudes, although their number of distribution records can stay quite high [14,30,31] especially in the deep sea [32,33,34].
Concerning latitudinal distribution patterns, as early as 1878, A. R. Wallace depicted the great diversity and species richness of the terrestrial tropics [35]. Despite a lower sampling effort in the tropics, which could led to a decrease in species richness at the equator [36], studies confirmed this latitudinal pattern in the terrestrial, as well as the marine realm, especially in the Coral Triangle, which includes seas around Indonesia, Malaysia, Papua New Guinea, the Philippines, Solomon Islands and Timor-Leste [10,37,38,39,40,41]. This was reported due to more stable temperatures, a larger area, higher light intensity and stability over geological timescales, due to less glacial and interglacial disruptions in the tropics compared to the higher latitudes [38,42,43,44]. However, more recent studies indicate a bimodal distribution of marine taxa, with a dip at the equator, questioning the general rule of decreasing species richness with increasing latitude being driven primarily by temperature [39,43]. Fischer [38] also mentioned that infaunal species do not follow this rule as strictly as pelagic and epifaunal species. Thus, depth might be the most important driver of benthic community compositions overall [10,45], as indicated by various observations that species richness decreases with increasing depths [46,47,48].
As for environmental factors shaping these distribution patterns, species richness in shallow waters correlates primarily with sea-surface temperature (SST) [39,49,50] indicating that stable and higher temperatures promote species diversity. Since the deep sea is limited in organic matter and often oxygen, species diversity and distribution are prone to be limited by these factors as well [50,51,52,53]. Various studies indicate dramatic changes due to climate change [54,55]. For instance, the warming of the ocean could lead to a range shift in the distribution of species poleward and into greater depths [55,56]. Elevated SST levels can lead to an increased stratification of water masses and decreased oxygen solubility, ultimately resulting in oxygen depletion. This will especially impact the deep sea since oxygen is already a limiting factor. The decrease in particulate matter flux due to stratification will make the deep sea even more food limited [55,57].
Still, many knowledge gaps regarding the distribution of deep-sea species and their underlying drivers persist, due to a lack of sampling efforts, or limitations in data access and sharing. However, in light of climate change, it is fundamental to analyze the current distribution of species in order to predict and understand latitudinal shifts of biodiversity due to the ongoing changes in the oceans. In addition, deep-sea studies are crucial to assess how anthropogenic activities such as deep-sea mining might impact benthic deep-sea communities in the future. In recent years, there has been an increasing amount of deep-sea occurrence data mobilization from the NWP to open-access portals, such as OBIS (www.obis.org, accessed on 4 November 2021) and GBIF (www.gbif.org, accessed on 4 November 2021). For this reason, it is now possible to investigate the differences in biodiversity patterns and their environmental drivers, both for the shallow-water and the deep-sea fauna. Polychaeta are one of the dominant taxa of benthic invertebrates in marine environments and both Polychaeta and Sipuncula reproduce by means of free-swimming larvae. Therefore, it makes sense to use polychaetes and sipunculans as model taxa to complement the study by Saeedi et al. [10], where some important taxa, such as Sipuncula, were missing and the correlation between environmental variables and species richness was not studied [10].
The aim of the paper was to give an overview of the large-scale distribution and the species richness patterns of selected polychaete and sipunculan taxa based on occurrence records from our own sampling, in addition to online databases; and to investigate potential environmental drivers of those patterns. We hypothesized (I) that there is an increase of species richness from higher latitudes towards the edges of the tropics with the highest overall species richness being near the Philippines; (II) that there is a higher species richness of polychaetes at higher latitudes compared to sipunculans; (III) that there is a decrease in species richness with increasing depth, with another peak around 2000 m; (IV) that there is a significant correlation of sea surface temperature (SST) with shallow-water (0–500 m) species’ richness, and of dissolved oxygen and depth with deep-sea species.
Understanding how these environmental drivers influence and shape the distribution and diversity patterns in annelids is necessary to predict how climate changes and anthropogenic activities such as deep-sea mining could impact the distribution of annelid species [58,59]. Most of the ocean and especially the deep sea has not been sampled nor investigated enough, and remain poorly understood. Investigating both global and local drivers of biodiversity is necessary in order to push conservational efforts and implement marine protected areas (MPA).

2. Material and Methods

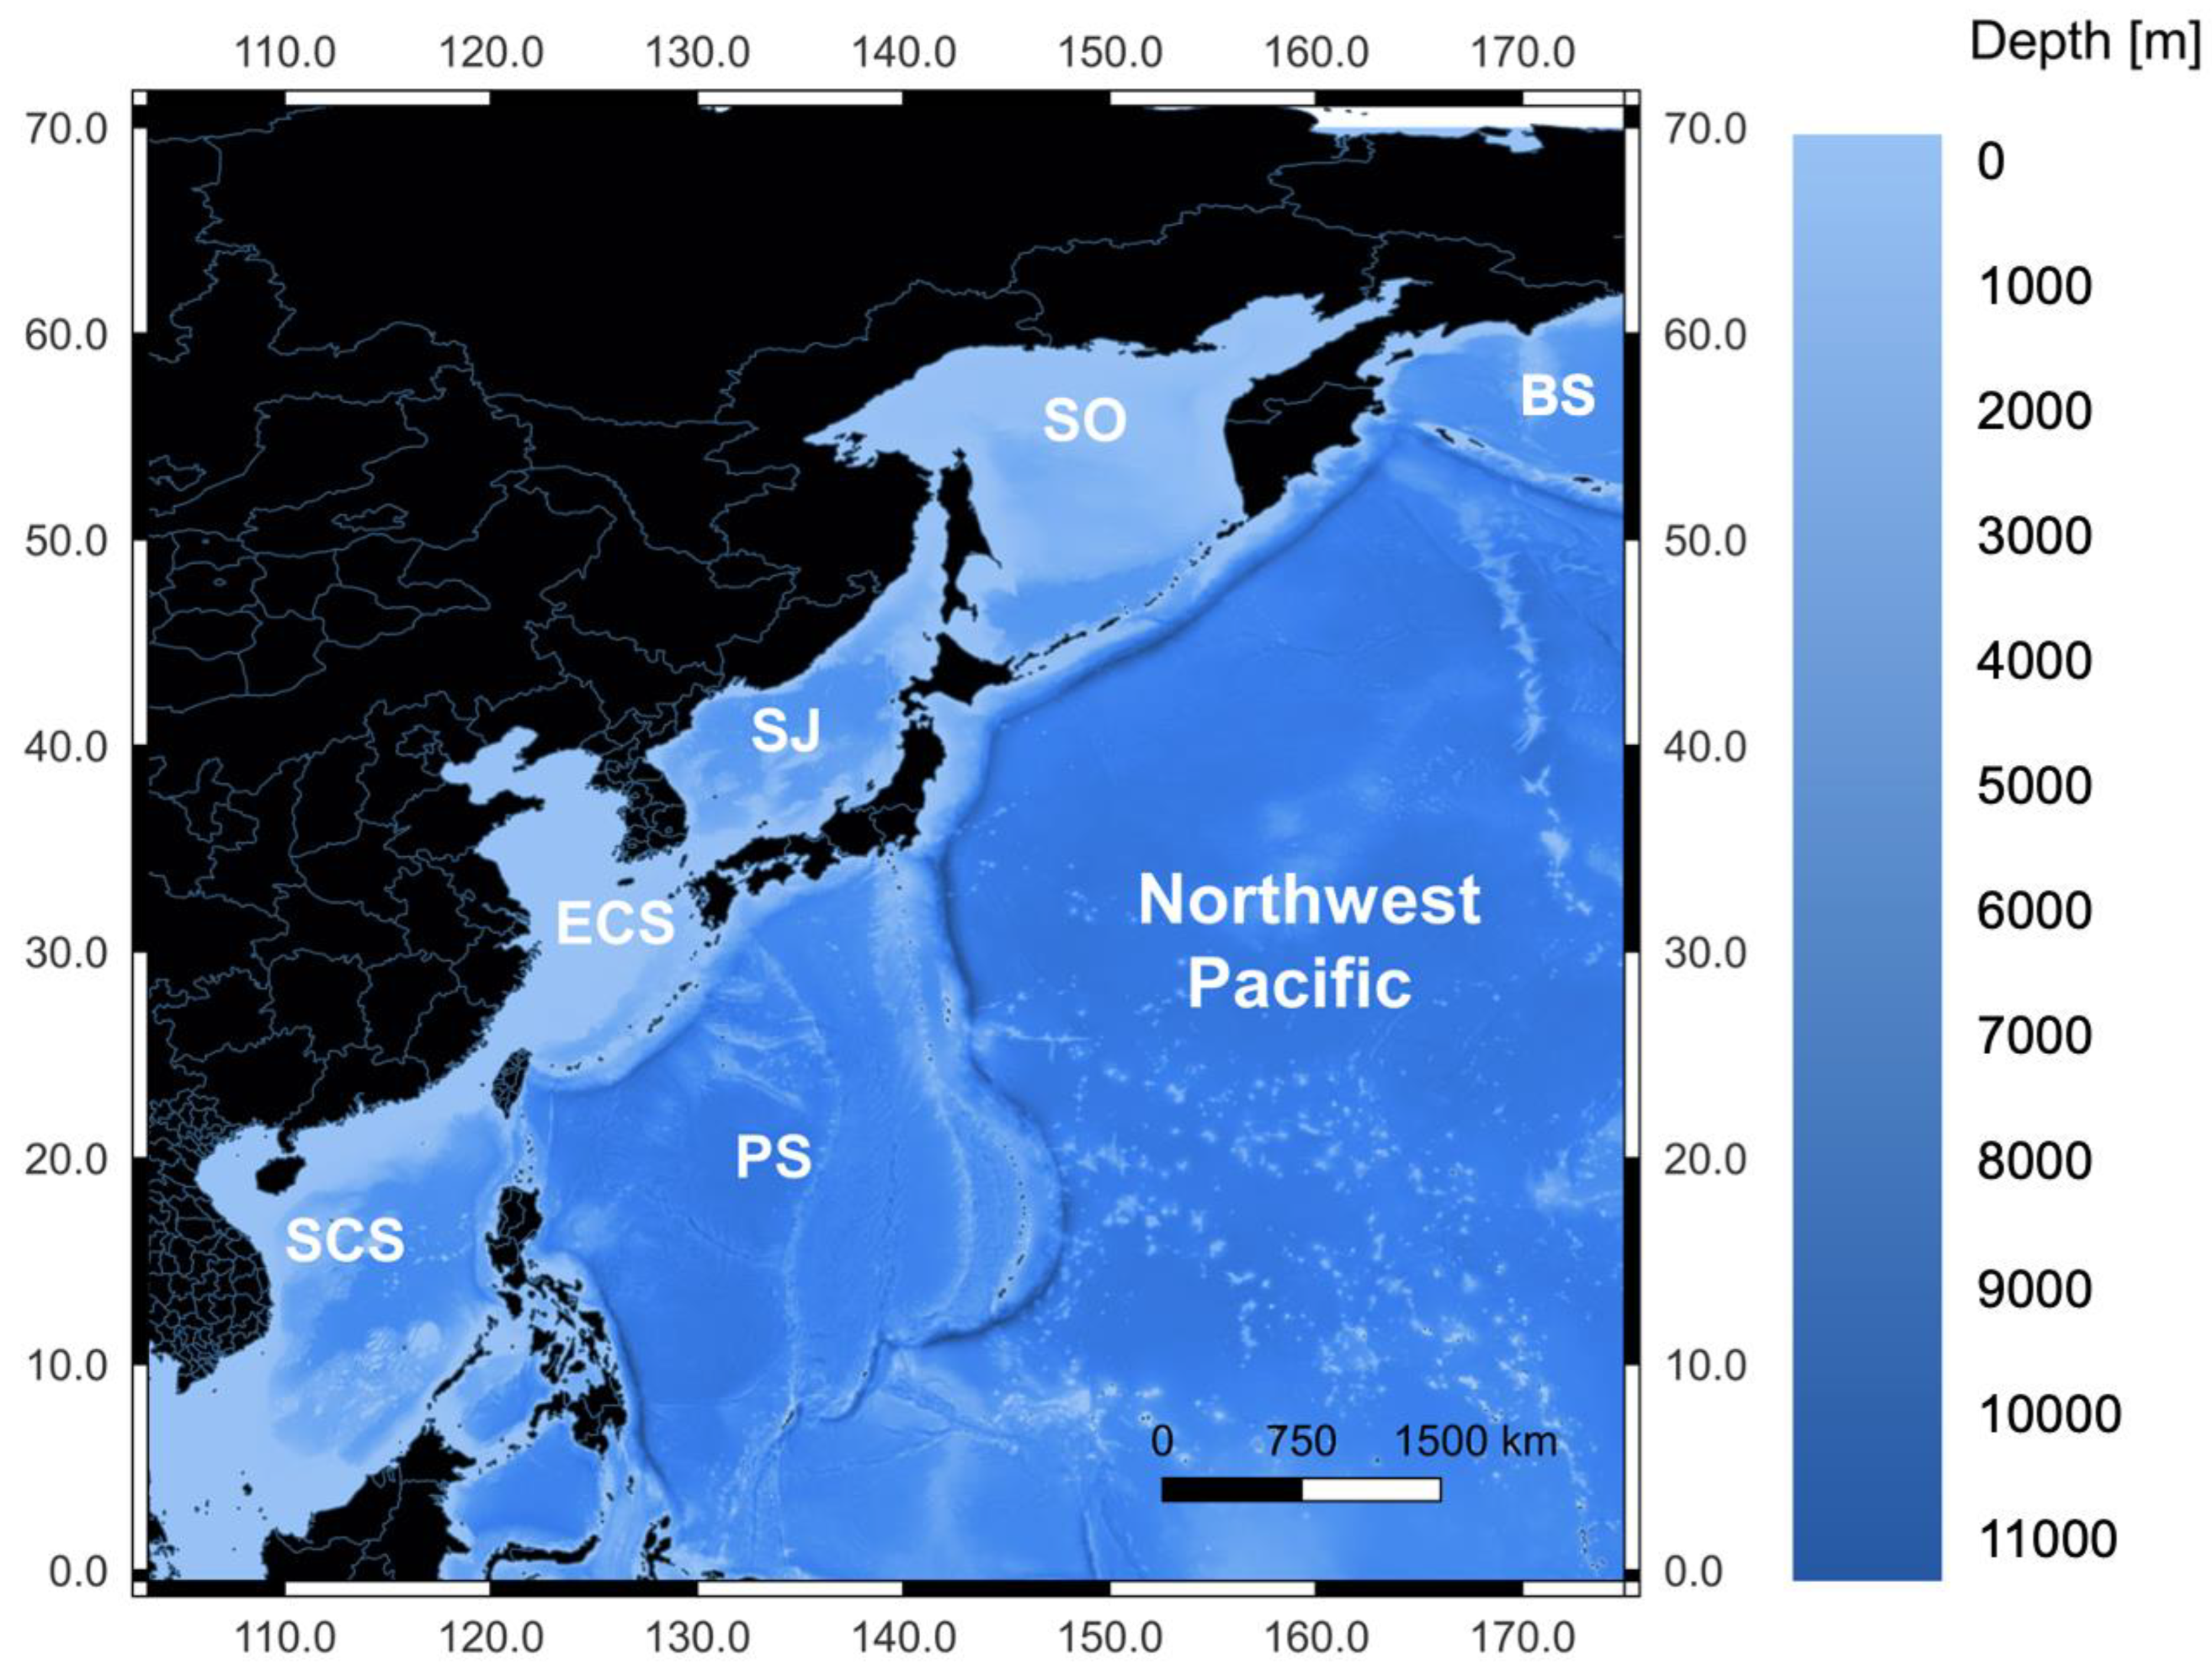
2.1. Study Area and Data Preparation

The study area comprised the NWP, from the equator to latitude 65° in the north and from longitude 100° in Asia to longitude 180° in the west, as depicted in Figure 1. It contains the Kuril-Kamchatka Trench (KKT), which reaches a maximum depth of 9604 m and is thus one of the deepest trenches in the world [60]. Other topographic features include the deep-water marginal Sea of Okhotsk (SO), the younger and largely enclosed Sea of Japan (SJ), and the adjacent abyssal plains [14].
The NWP has been increasingly studied during the last decades. Between 1949 and 1966, the Russian research vessel Vityaz conducted multiple expeditions in the KKT region and in large fractions of the open NWP [1,6]. After that, more expeditions were carried out: SoJaBio (Sea of Japan Biodiversity Study) [5], KuramBio I (Kuril Kamchatka Biodiversity Studies) [4], SokhoBio (Sea of Okhotsk Biodiversity Studies) [7], KuramBio II [2,3] and BERING [8]. Those expeditions aimed to investigate the composition and diversity of the meio-, macro- and megafauna of the benthos.
Multiple polychaete orders including Amphinomida, Echiuroidea, Eunicida, Phyllodocida, Sabellida, Spionida, Terebellida, and the infraclass Scolecida, as well as the order Sipuncula, including five of its six families, Aspidosiphonidae, Golfingiidae, Phascolosomatidae, Sipunculidae, and Siphonosomatidae, were used for this analysis. One of the eight species belonging to Aspidosiphonidae, Aspidosiphon (Aspidosiphon) muelleri muelleri, has a symbiosis relationship with two genera of corals, Heterocyathus and Heteropsammia. There were no records for the sipunculan family Antillesomatidae in the study area. The occurrence data were extracted from open-access databases such as OBIS ([61], www.obis.org, accessed on 4 November 2021) and GBIF ([62], www.gbif.org, accessed on 4 November 2021). In addition, further polychaete and sipunculan specimens were collected in 2016 during the R/V SONNE expedition SO-249 from the Bering Sea [8,14]. Their occurrence data were digitized to OBIS and included in our analyses [14]. We considered species as deep-sea species when they occurred below 500 m, according to the World Register of Deep-Sea Species (WoRDSS [63]) since sunlight has a negligible effect on organisms living below 500 m and other physical parameters have only a small variability.
The merged dataset was then cleaned using different packages in RStudio 2021.09.1 [64] following [51]. We used the R packages “tidyverse” [65], “scrubr” [66], and “obistools” [67] for data cleaning and acquisition. All distribution records that were classified as fossils or terrestrial (with a buffer of 500 m) were excluded, as well as duplicates, records with missing latitude or longitude information, and records with a distance uncertainty higher than 100 km. Furthermore, the occurrence records for the pelagic polychaete family Pontodoridae were excluded, so solely benthic species were present in the dataset. The resulting dataset was taxonmatched against the World Register of Marine Species (WoRMS) using its “Taxonmatch” tool (www.marinespecies.org/aphia.php?p=match, accessed on 12 November 2021) and unaccepted species were excluded from the final dataset.
Since there was rarely any information about the developmental stage of the distribution records, it was assumed that all of them were adult specimens, and hence benthic organisms. To account for the mostly missing depth information, we used a topographic layer for the maximum water depth from the General Bathymetric Chart of the Oceans (GEBCO [68]). All occurrence records above the sea surface layer were deleted, as well as records with a depth that was greater than the maximum depth indicated by GEBCO.
We calculated alpha species richness (species richness per hexagonal cell) and gamma species richness (species richness per 5° latitudinal band) with a present/absent matrix.
We extracted 12 benthic environmental layers from Bio-ORACLE (www.bio-oracle.org, accessed on 4 November 2021) [69,70] including average temperature (°C), dissolved oxygen (mol m−3), current velocity (m−1), salinity (PSS), nitrate (mol m−3), phosphate (mol m−3), primary production (g m−3 day−1), silicate (mol m−3), light at bottom, chlorophyll (mg m−3), iron (µmol m−3) and phytoplankton (µmol m−3) to run a Spearman correlation analysis between environmental variables and alpha species richness estimations.

2.2. Data Analysis

For analyzing the data and plotting the graphs, R packages including “sf” [71], “vegan” [72], “pvclust” [73], and “tidyverse” were used. The polychaete records were grouped into orders, or sub- and infraclasses if taxa were not placed in an order based on their current systematic categorization. The sipunculan records were grouped into their respective families.
The study area was divided into 5° latitudinal bands, 500 m depth intervals, and 700,000 km2 hexagonal cells to study the sampling effort, the gamma species richness and the estimated species richness against latitude and depth, and to correlate them with potential abiotic environmental factors.
With the package “sf”, we created a map with hexagonal cells, which were used for plotting the sampling effort (number of distribution records) and alpha species richness, and with the package “vegan”, we calculated the estimated, or rather the rarified, species richness (ES50). We used the rarefaction method ES50 to account for sampling bias. For this method, 50 randomly selected samples were chosen several times from the available datasets. Then, the average number of species per 50 records is calculated from these random selections [72]. This means, that the ES50 doesn’t give the “real” number of species but it is standardized to a value between 0 and 50 as an estimated number of species. ES50 curves plot the number of species against the number of samples, thus indicating to which degree the biodiversity in a latitudinal band has been inventoried so far. If the curve reaches an asymptote, most of the species have been found and no further sampling is required.
Sampling effort, alpha species richness, and ES50 values were then used to calculate a Spearman correlation analysis against the environmental variables for each hexagon using the R package “corrplot” [74].
To study density distribution ranges and community composition violin plots were created with the R package “ggplot2” [75] using polychaete orders and sipunculan families. However, we were not able to determine 128 sipunculan occurrence records, out of a total of 31,804, at the family level, and, thus, those data were excluded from the analysis.

3. Results

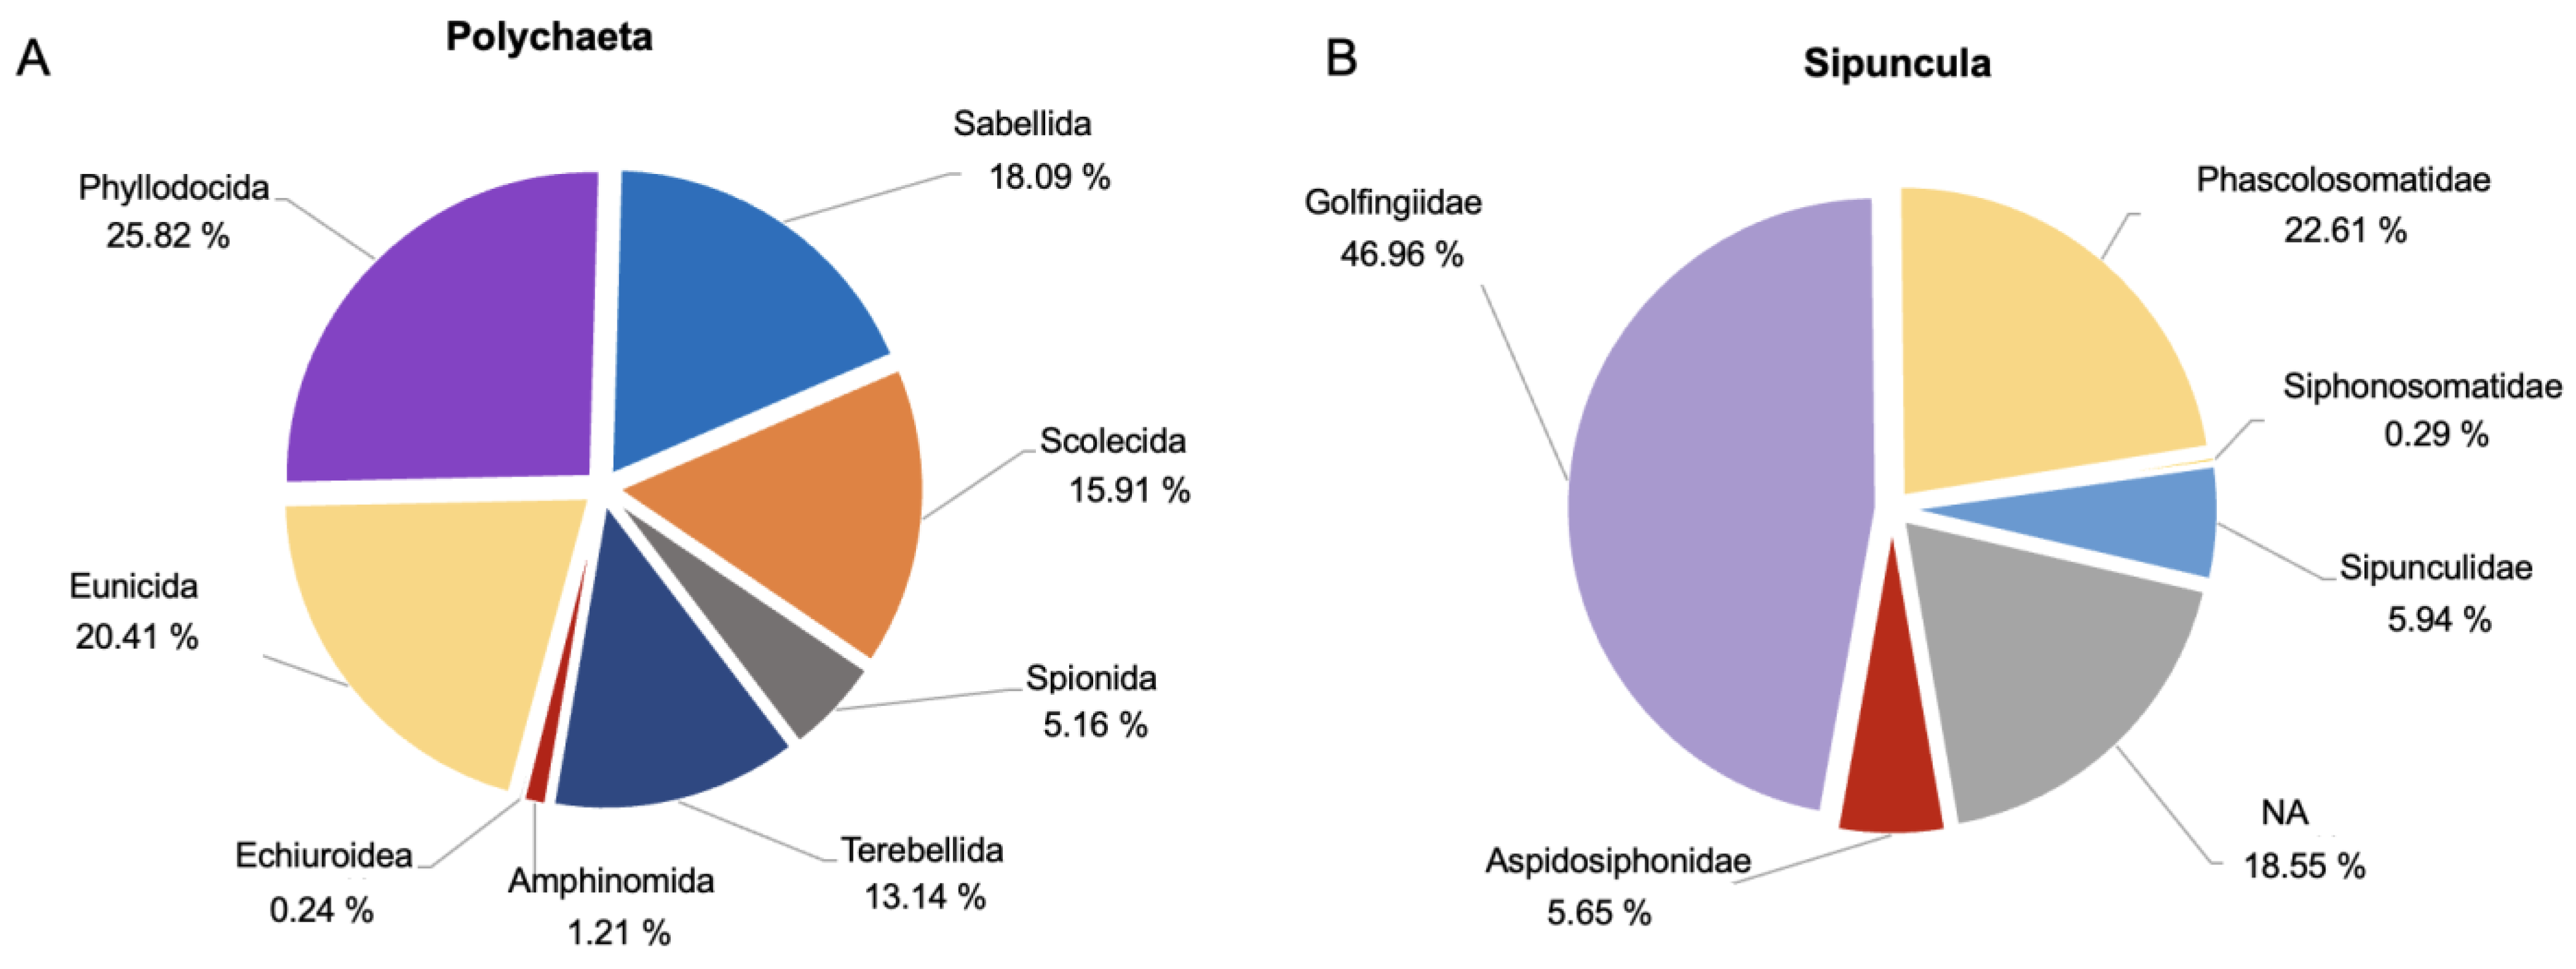
3.1. Dataset Composition

The final dataset included 31,804 occurrence records (Figure S1), of which 98% belonged to Polychaeta (31,114 records) and only 2% (690 records) belonged to Sipuncula. About half of the occurrence records (16,247 records) were at the species level and represented 935 species (887 polychaete and 48 sipunculan species). The most abundant polychaete orders were Phyllodocida (25.82%), followed by Eunicida (20.41%) and Sabellida (18.05%) (Figure 2A). Almost half of the polychaetes’ records (49.2%) were not identified at species level. However, all of them were identified to at least the order level.
The most abundant Sipuncula families were Golfingiidae, comprising almost half of all occurrence records (46.96%), followed by Phascolosomatidae, with 22.61% (Figure 2B). More than one-third of all Sipuncula records (36.23%) were not identified at species level, and most of those were only identified as Sipuncula (NA 18.55 %).

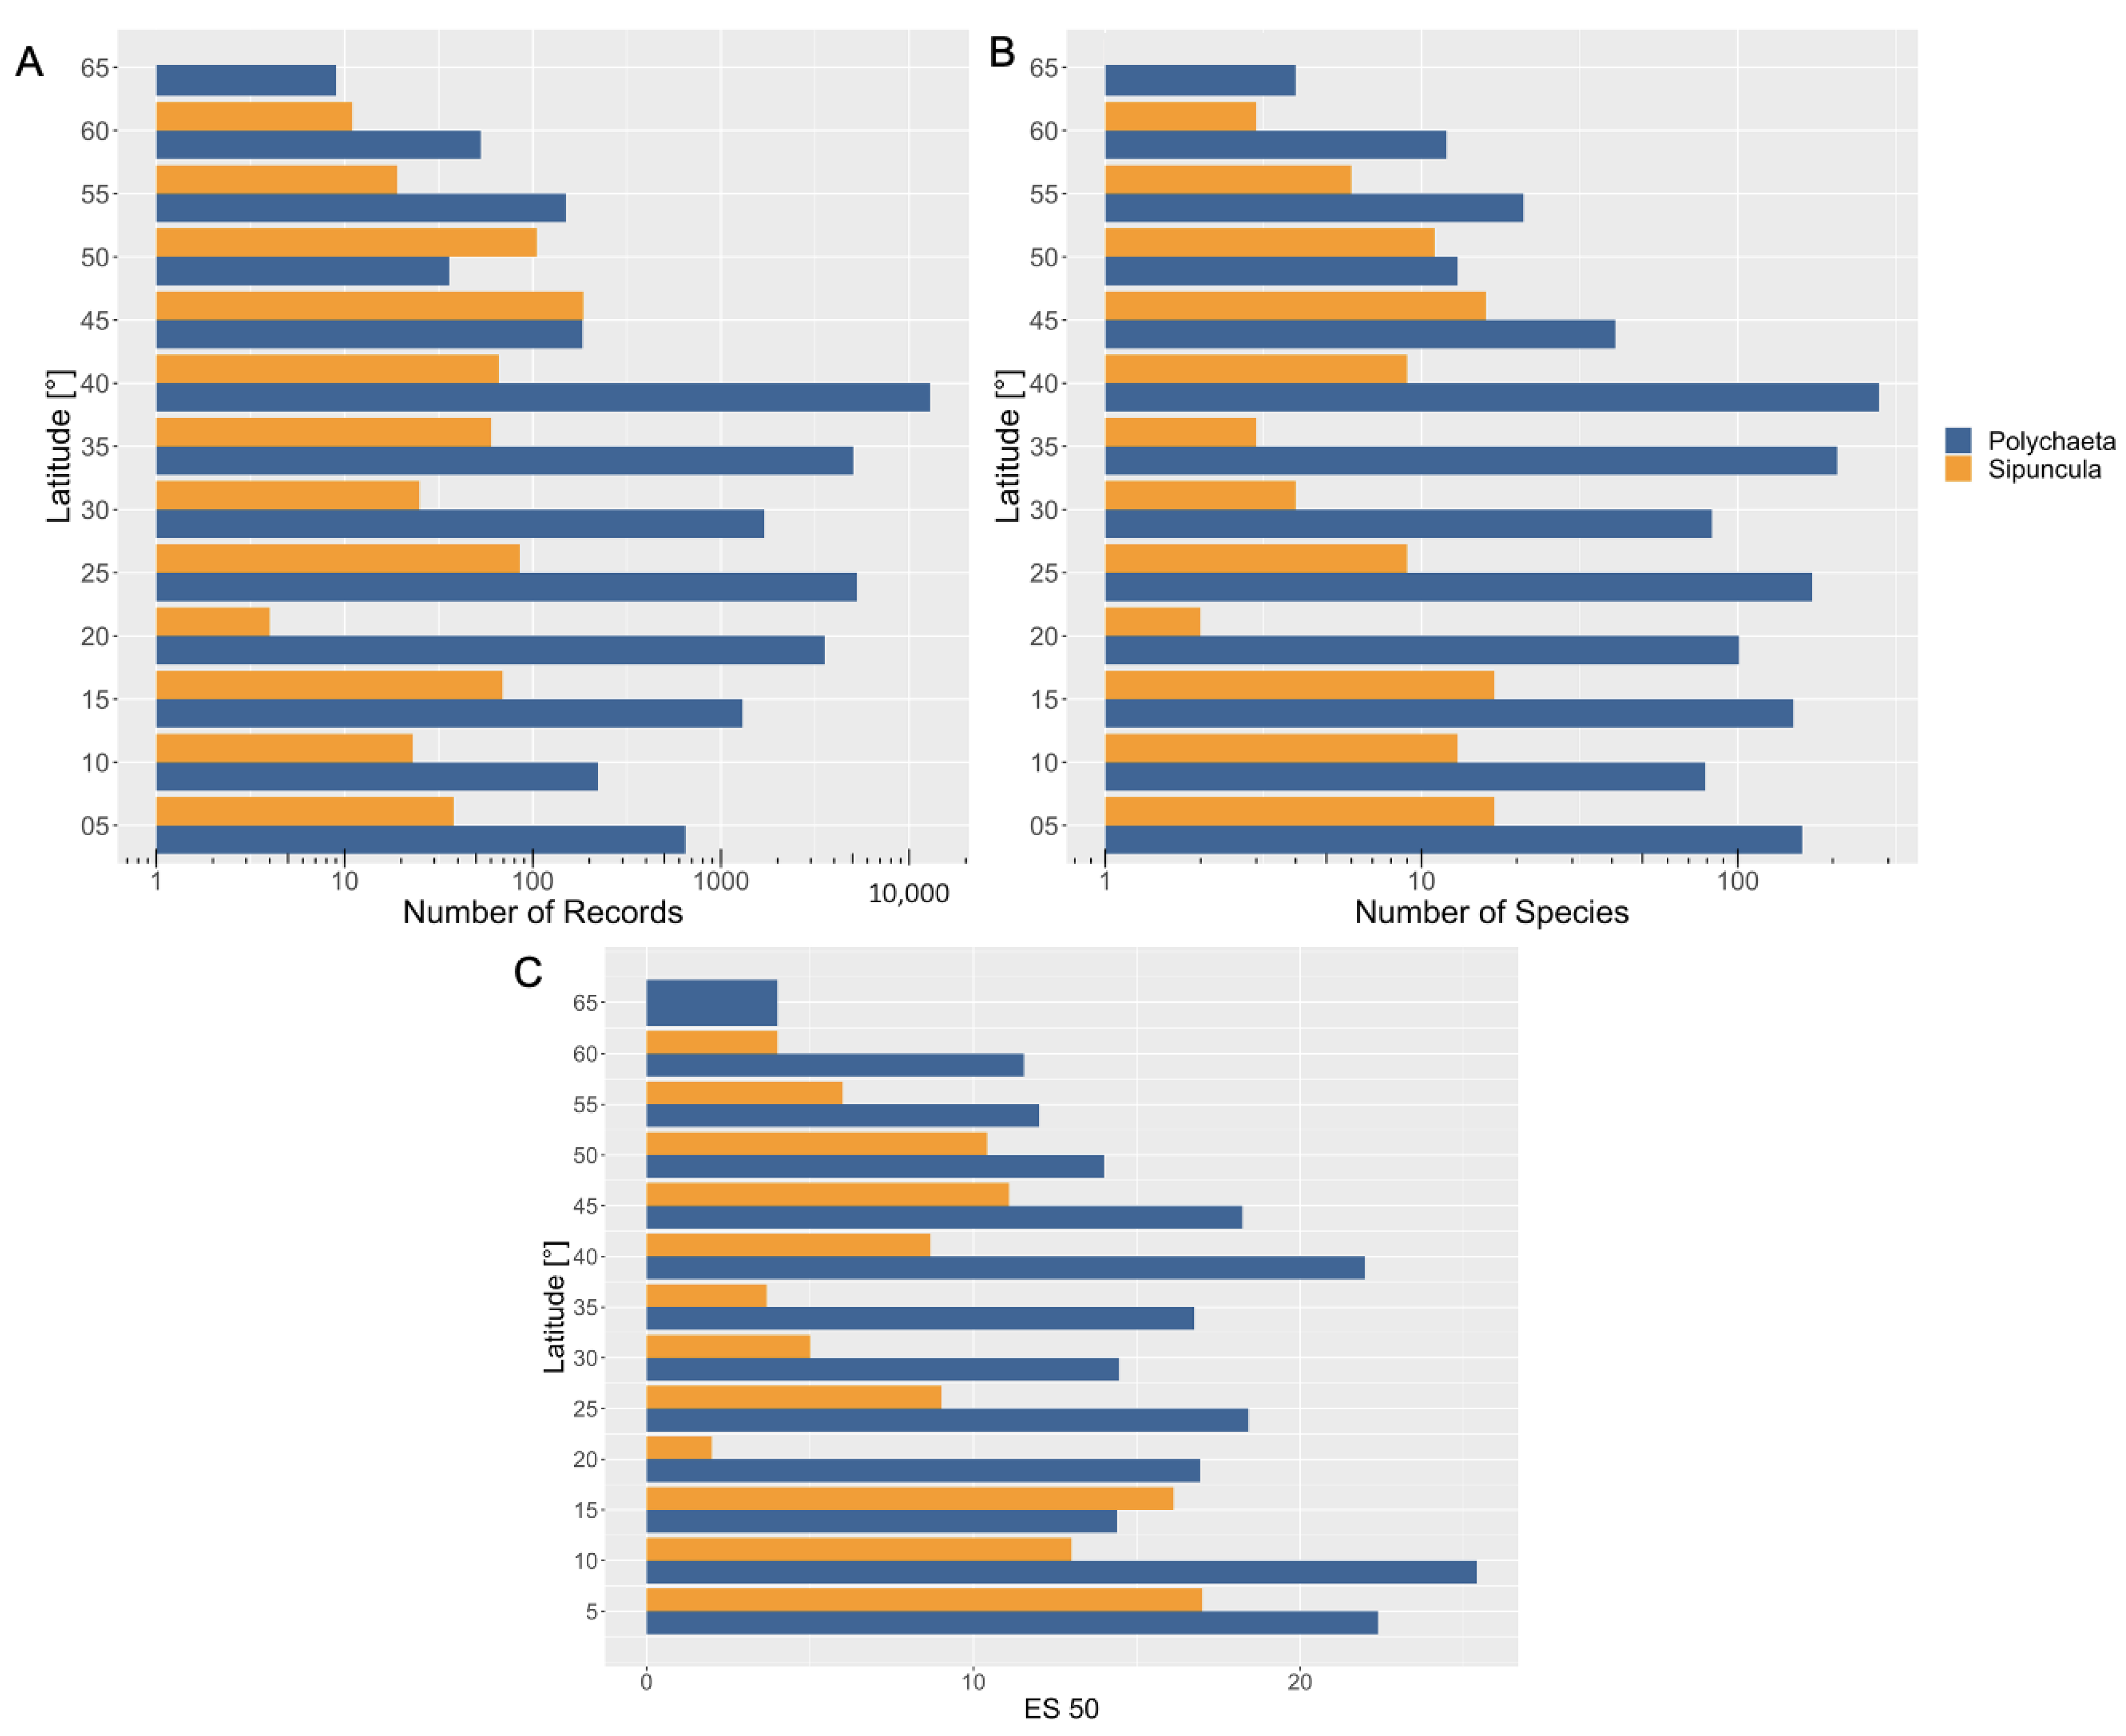
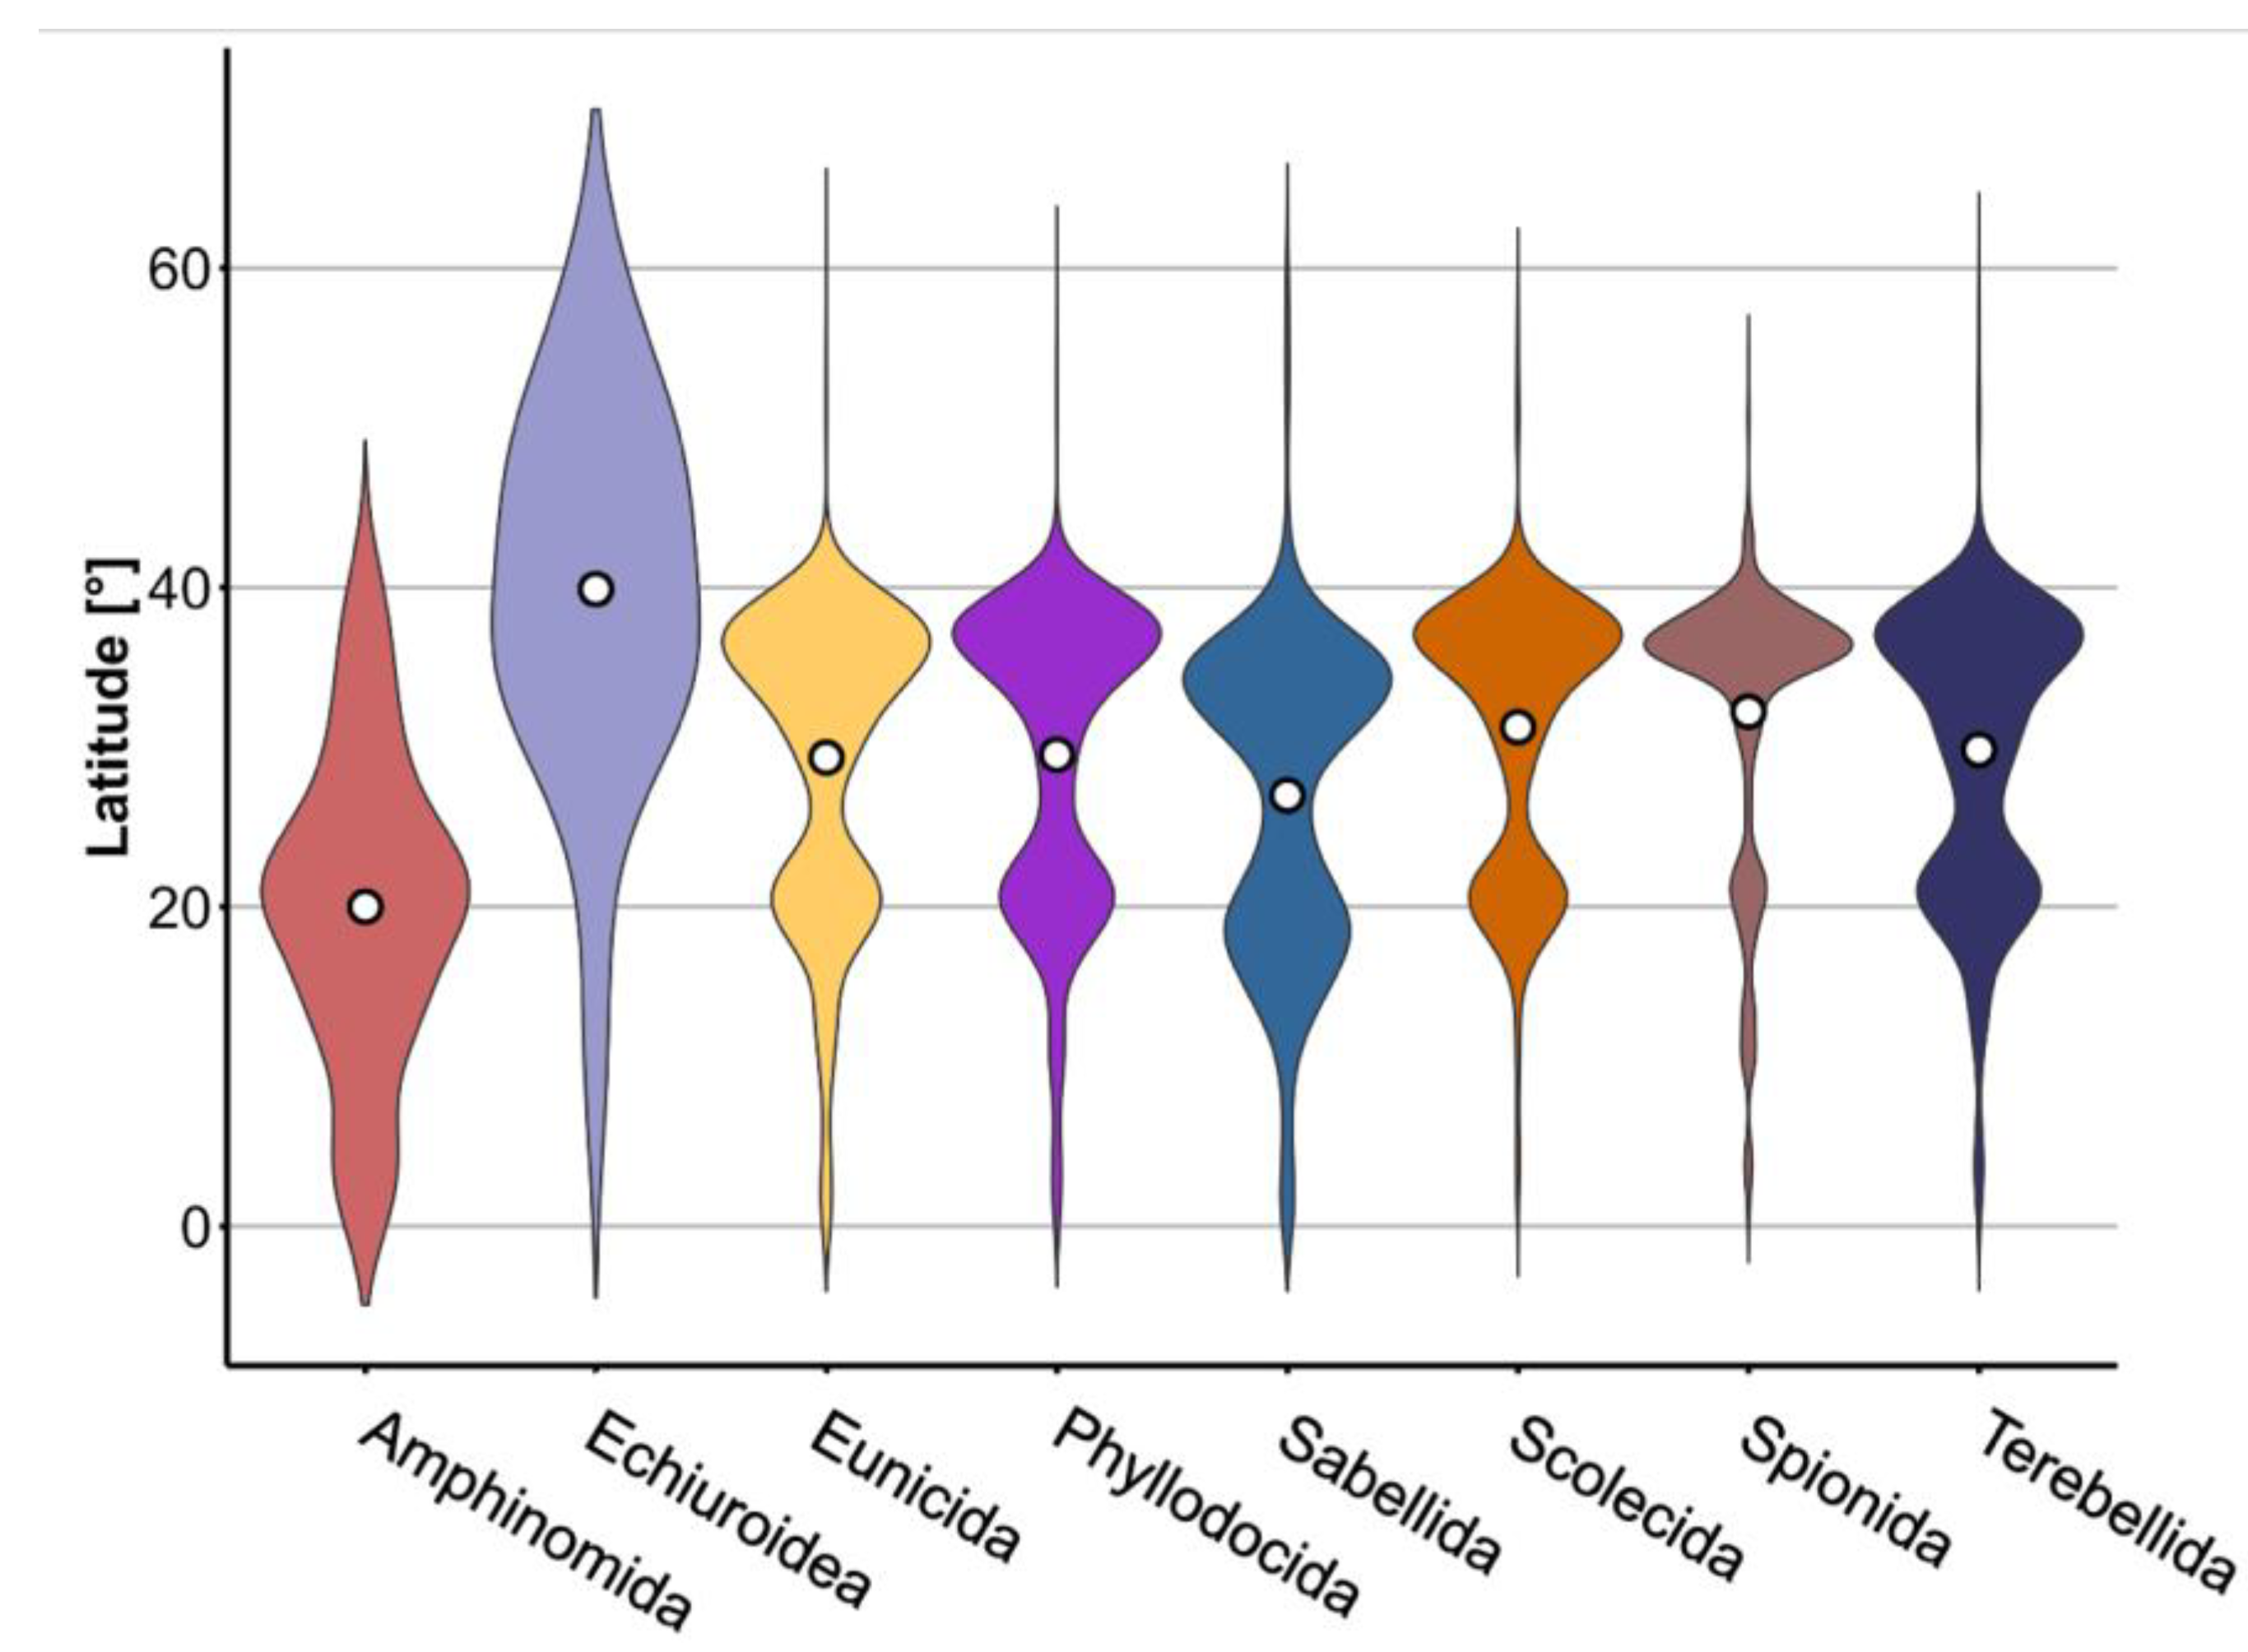
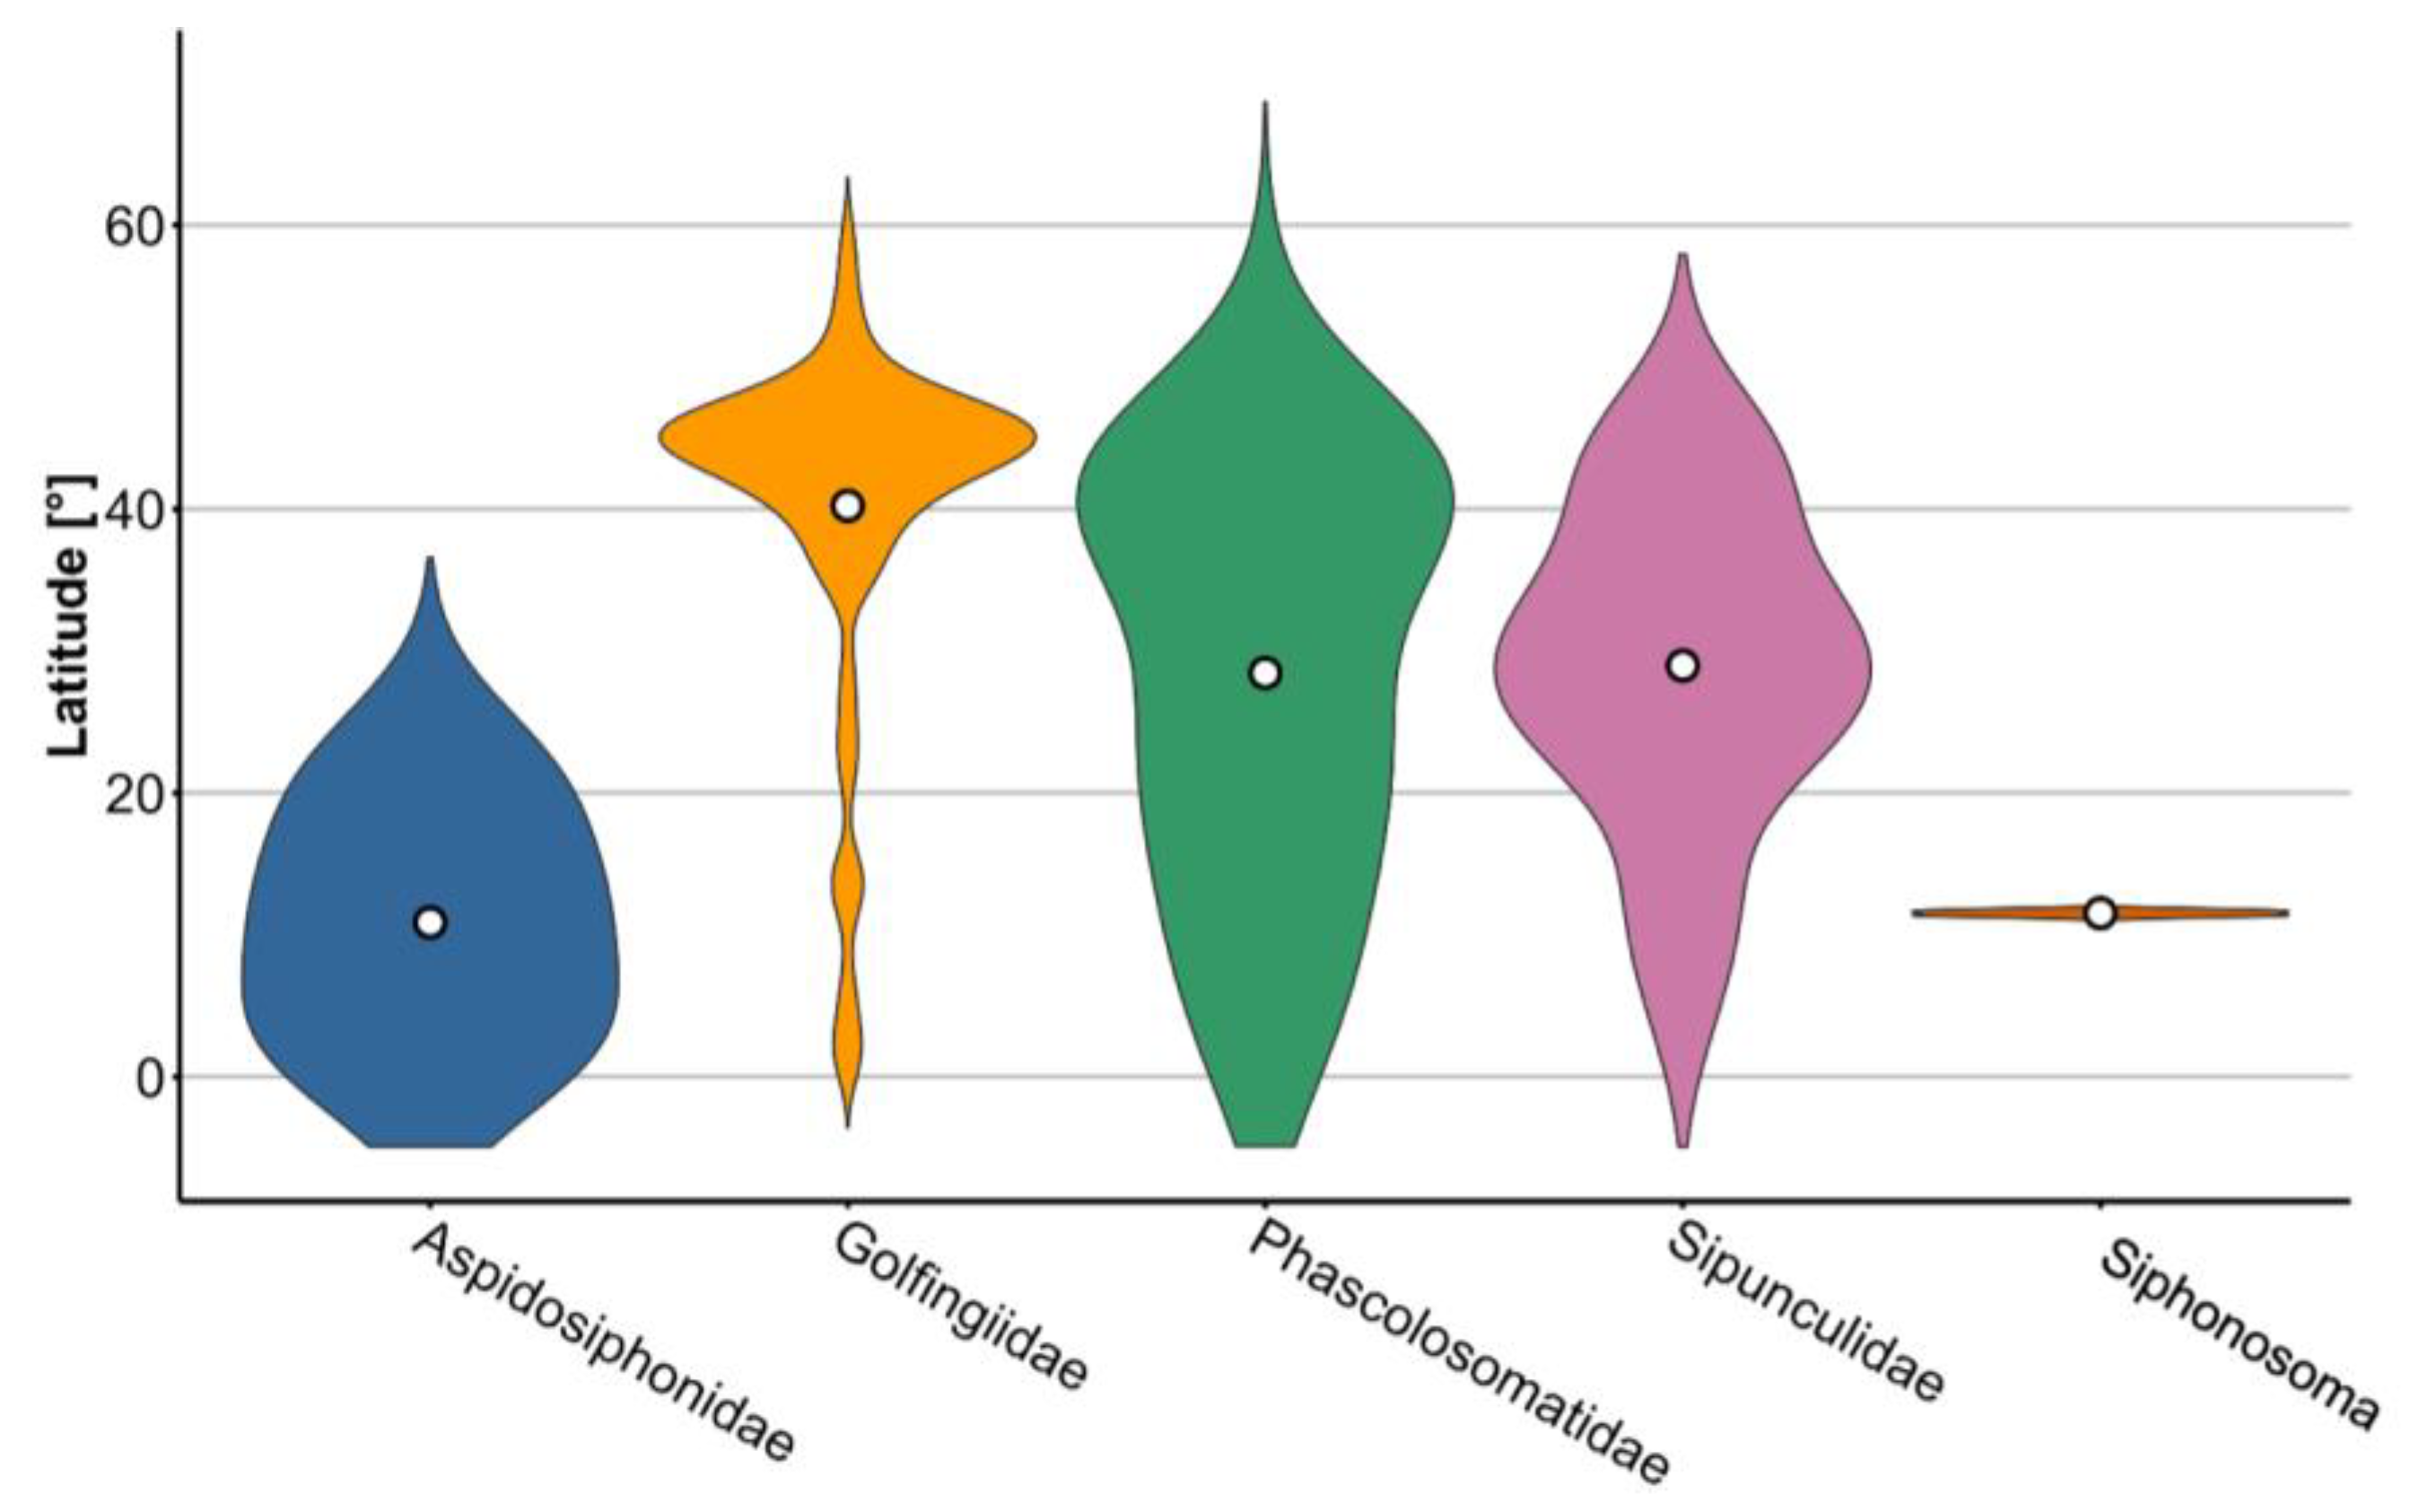
3.2. Latitudinal Distribution

In general, the polychaete sampling effort and gamma species richness values per 5° latitudinal bands were higher than in Sipuncula, with two exceptions. At latitude 50°, the number of sipunculan records exceeded the number of polychaete records (Figure 3A). At latitude 45°, both taxa had similar values (Figure 3A).
For polychaetes, the latitudinal gradient showed the highest sampling effort at latitude 40°, with over 10,000 records (Figure 3A). The sampling effort decreased with decreasing latitude, to less than 1000 records at latitude 5°. In higher latitudes, polychaetes comprised less than 10 records at latitude 65° and only around 100 records at latitudes 45–55°. The gamma species richness followed the same pattern as the sampling effort (Figure 3B), while the ES50 predicted two peaks at 5–10°, as well as at 40–45° (Figure 3C). ES50 for polychaetes from 0 to 500 m peaked at 40°; however, for deep-sea polychaetes, it peaked at latitude 10°, and estimated generally fewer species than that for shallow-water polychaetes (Figure S2A,B).
Sipuncula sampling effort showed a peak at latitude 45°, with around 100 occurrence records, and reached its minimum at latitude 20°, with less than 10 occurrence records (Figure 3A). The gamma species richness peaked at latitudes 45° and between 5 and 15°, with more than 10 species, and also reached its minimum at latitude 20°. The ES50 pattern for Sipuncula was similar to the recorded gamma species richness. It peaked at latitudes 5° and 15° and had a smaller peak at latitude 45° (Figure 3C). Looking at the ES50 for shallow-water and deep-sea sipunculans, a high species richness was expected for shallow-water sipunculans at low latitudes from 5–15° (Figure S2C). For deep-sea sipunculans, the ES50 peaked multiple times at latitudes 15°, 25°, 45° and 50° (Figure S2D).
The polychaete orders Amphinomida and Echiuroidea had the most occurrence records at 20° and 40°, respectively, while being the least abundant orders in our analysis (Figure 2A and Figure 4). In comparison, the other polychaete orders Eunicida, Phyllodocida, Sabellida, Scolecida, Spionida and Terebellida had two peaks in occurrence records at around 20° and 40° latitude (Figure 4).
Occurrence records in higher latitudes decreased strongly, to less than five records and less than 10 records in shallow and deep water, respectively (Figure S4A,B). At low latitudes, close to the equator, the number of records decreased as well, but was still higher than that at high latitudes (Figure S4A,B). In shallow waters, the order Phyllodocida had the most records overall, with almost 4000 records at 40°, followed by the orders Scolecida and Eunicida, with almost 2500 records (Figure S4A). The order Sabellida had the most records in the deep water (also at 40°), with almost 800 records, followed by the order Phyllodocida, with 300 records at latitude 25° (Figure S4B).
The sipunculan families Aspidosiphonidae and Siphonosomae occurred only within a limited latitudinal range, at latitudes 0–38° and around latitude 15°, respectively. The other sipunculan families, such as Golfingiidae, Phascolosomatidae and Sipunculidae, were found along the whole latitudinal gradients from the equator to latitude 65°. The family Golfingiidae had a peak of occurrence records at around 45° and Sipunculidae had a peak around 30°, while Phascolosomatidae was more evenly distributed (Figure 5 and Figure S9).
Comparing the latitudinal distribution between shallow-water and deep-sea records (Figure S4C,D), the maximum of records was reported at 45° latitudes for Phascolosomatidae in shallow water, and at 45–50° for Golfingiidae in deep water. Specimens belonging to the family Aspidosiphonidae occurred between latitudes 5–30° in shallow water, and between 15–25° latitude in deep water (Figure S4C,D). The family Sipunculidae occurred only in shallow waters. The overall number of records was higher for deep-sea Sipuncula (up to almost 100 records) than for shallow-water Sipuncula (up to 55 records).
Most of the rarefaction curves did not reach an asymptote, meaning that most latitudinal bands had not been sampled enough, possibly indicating unknown species (Figure 6). For polychaetes, the sample size and the number of species were highest at latitude 40°, indicating a high species richness (Figure 6A). For sipunculans, the sample size was highest at latitude 45°, but most species were found at latitudes 15° and 5° meaning that the gamma species richness might be highest here, and that more sampling is needed (Figure 6B).

3.3. Distribution of Polychaeta and Sipuncula

The overall sampling effort (number of distribution records) across Polychaeta and Sipuncula peaked around South Korea and the island of Hainan (China) (Figure 7A). Alpha species richness was high around South Korea and Hainan, as well as around Hong Kong, Japan and the Philippines (Figure 7B). The ES50, which took sampling bias into account, showed not only a high alpha species diversity around Hainan and South Korea, but also along the whole pacific coastline, as well as around Indonesia, in the Kuril-Kamchatka Trench (KKT) area, and around Micronesia (Figure 7C).
For the shallow-water records, the hexagon plots showed very similar results (Figure S6). As for the deep-water records, there was no peak of alpha species richness nor ES50 around South Korea. Instead, peaks appeared around the Philippines, Japan and the Mariana Trench (Figure S7).

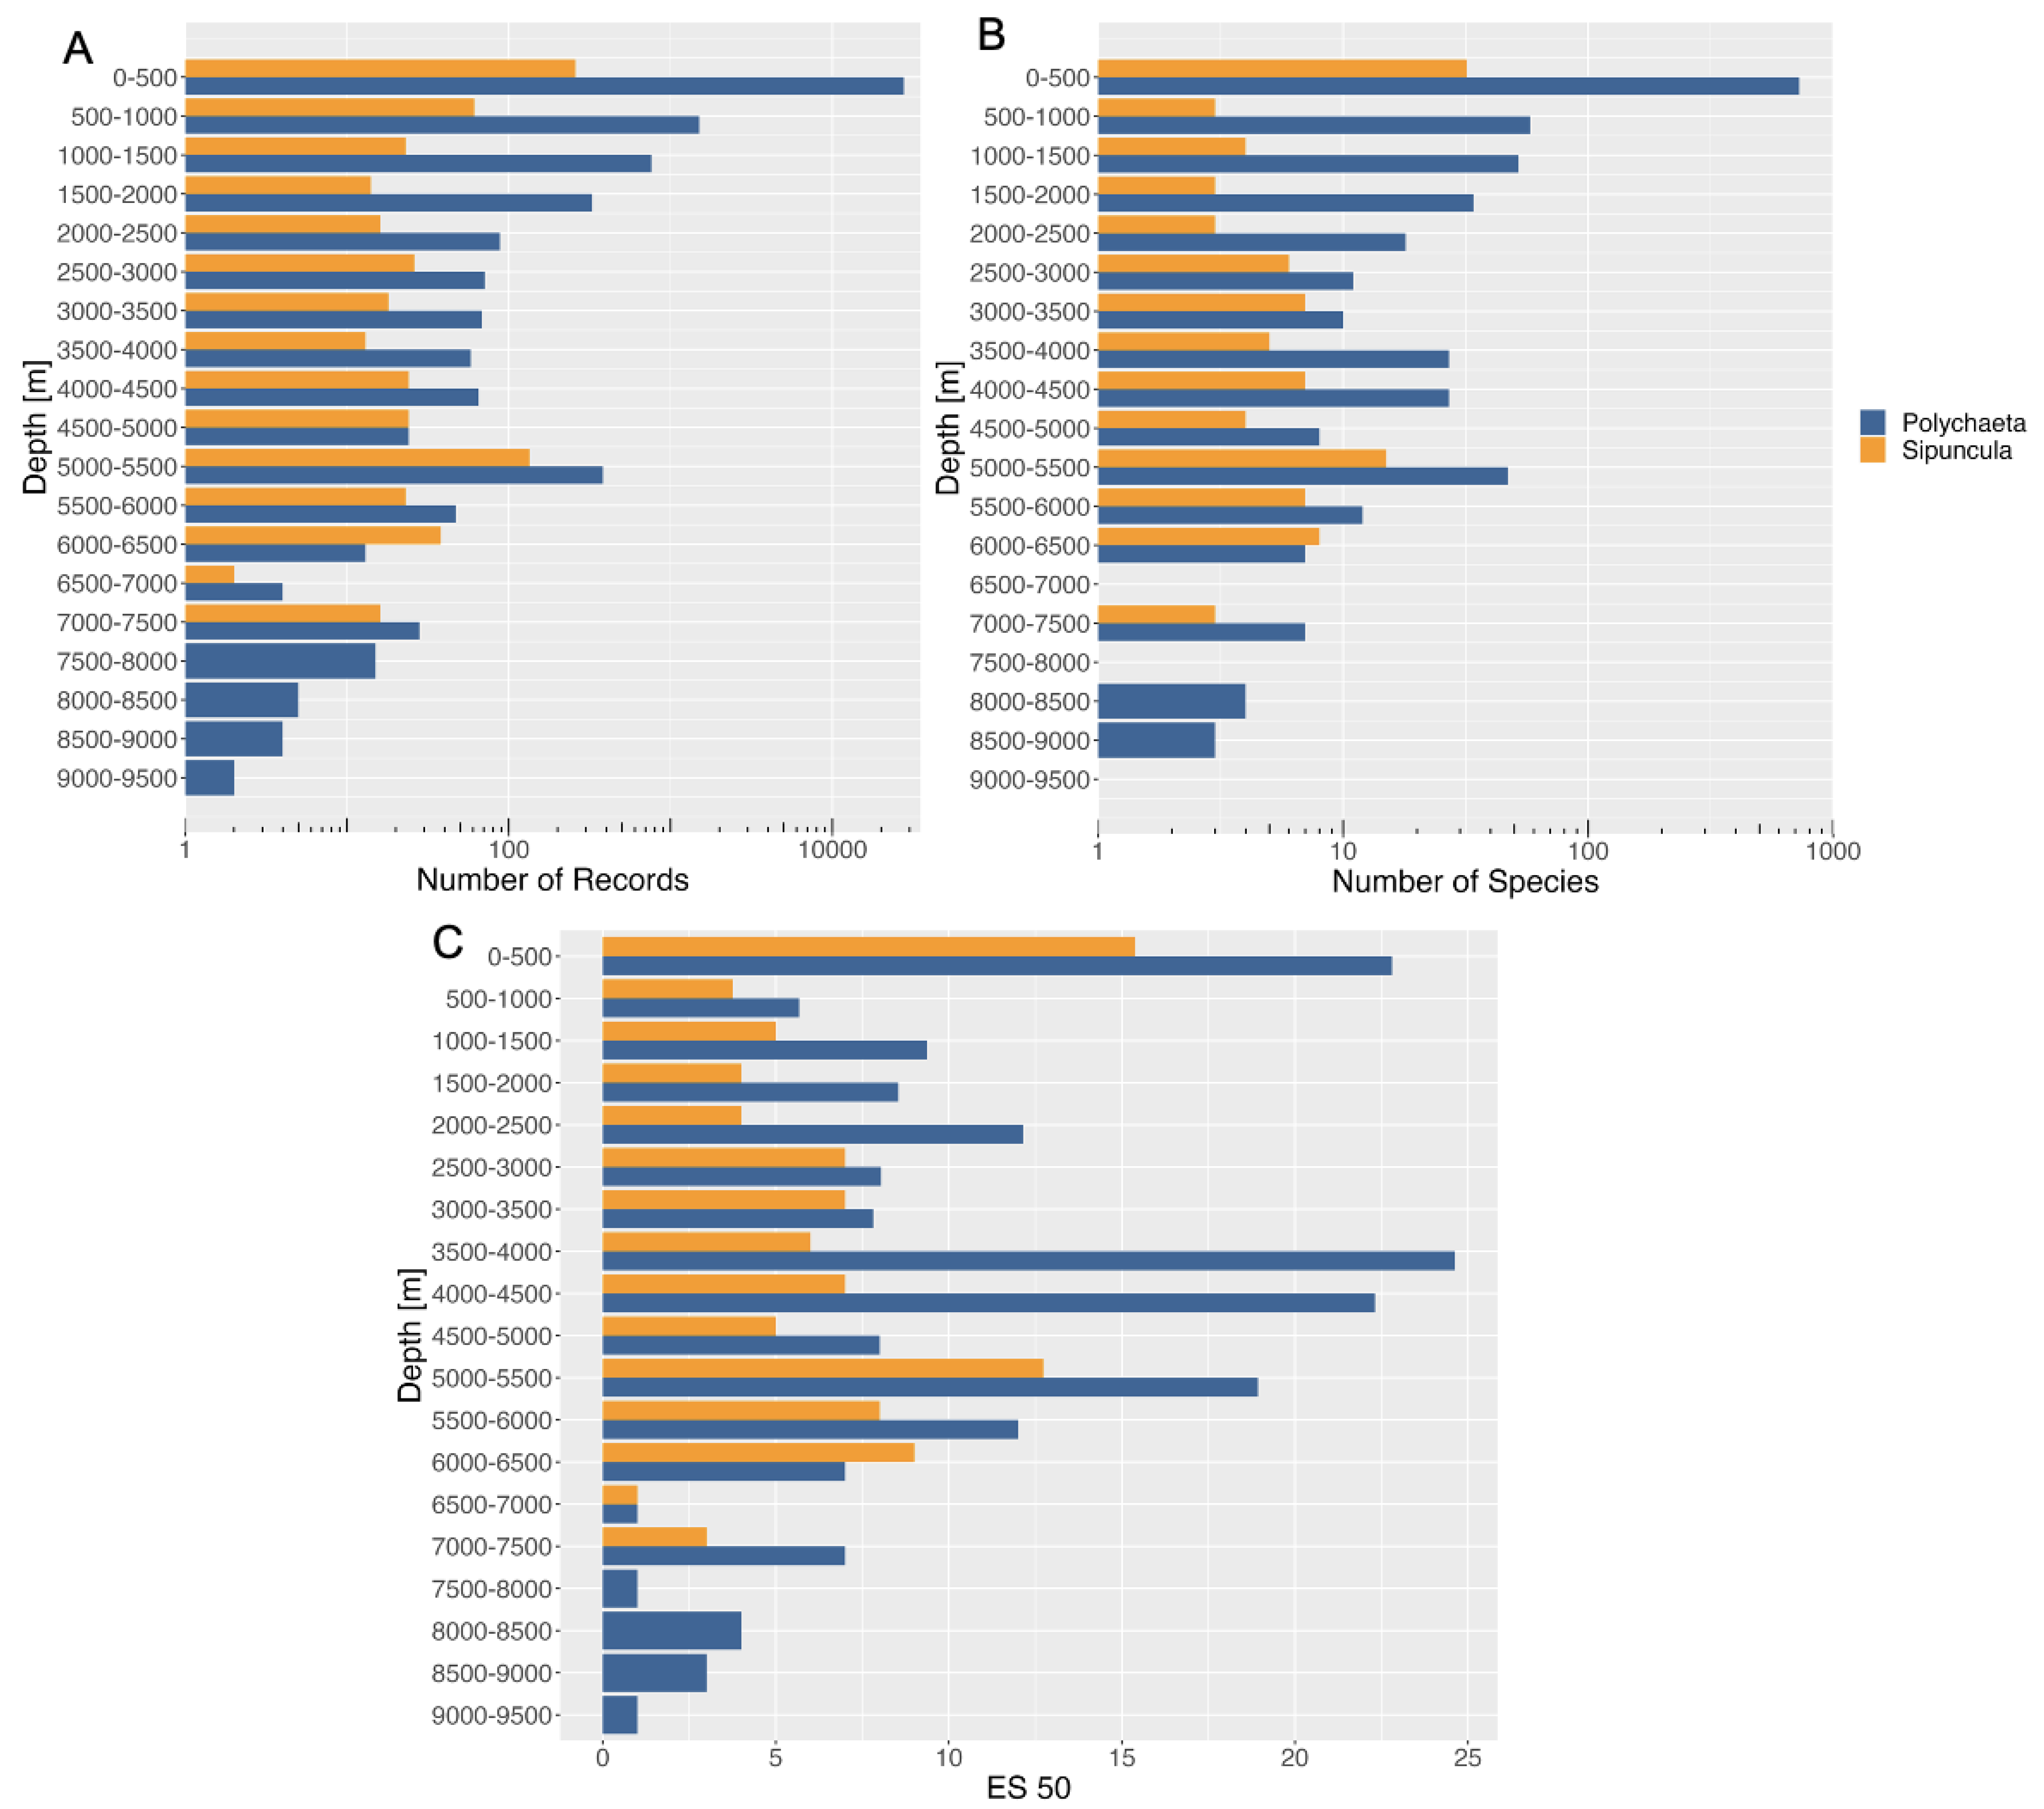
3.4. Bathymetric Distribution

Shallow-water records (0–500 m) accounted for the most records, with 88% for Polychaeta and 37.2% for Sipuncula. Otherwise, the bathymetric distribution patterns were similar between Polychaeta and Sipuncula. The number of polychaete records and species exceeded the sipunculan ones with one exception: at 6000–6500 m depth, the sampling effort and the gamma species richness of Sipuncula were higher.
Polychaete and sipunculan sampling effort and gamma species richness peaked in shallow waters and, after decreasing with increasing depth, they peaked again between 5000 and 5500 m (Figure 8A). Below that, the sampling effort and the gamma species richness decreased, and only polychaetes occurred below 7500 m (Figure 8A,B). When taking sampling bias into account, as done for the ES50, species numbers were still high at shallow depths and peaked again between 3500 and 4500 m for polychaetes (Figure 8C). The ES50 decreased afterward and peaked again at 5000–5500 m, for both polychaetes and sipunculans. Then, the ES50 decreased again with increasing depth.

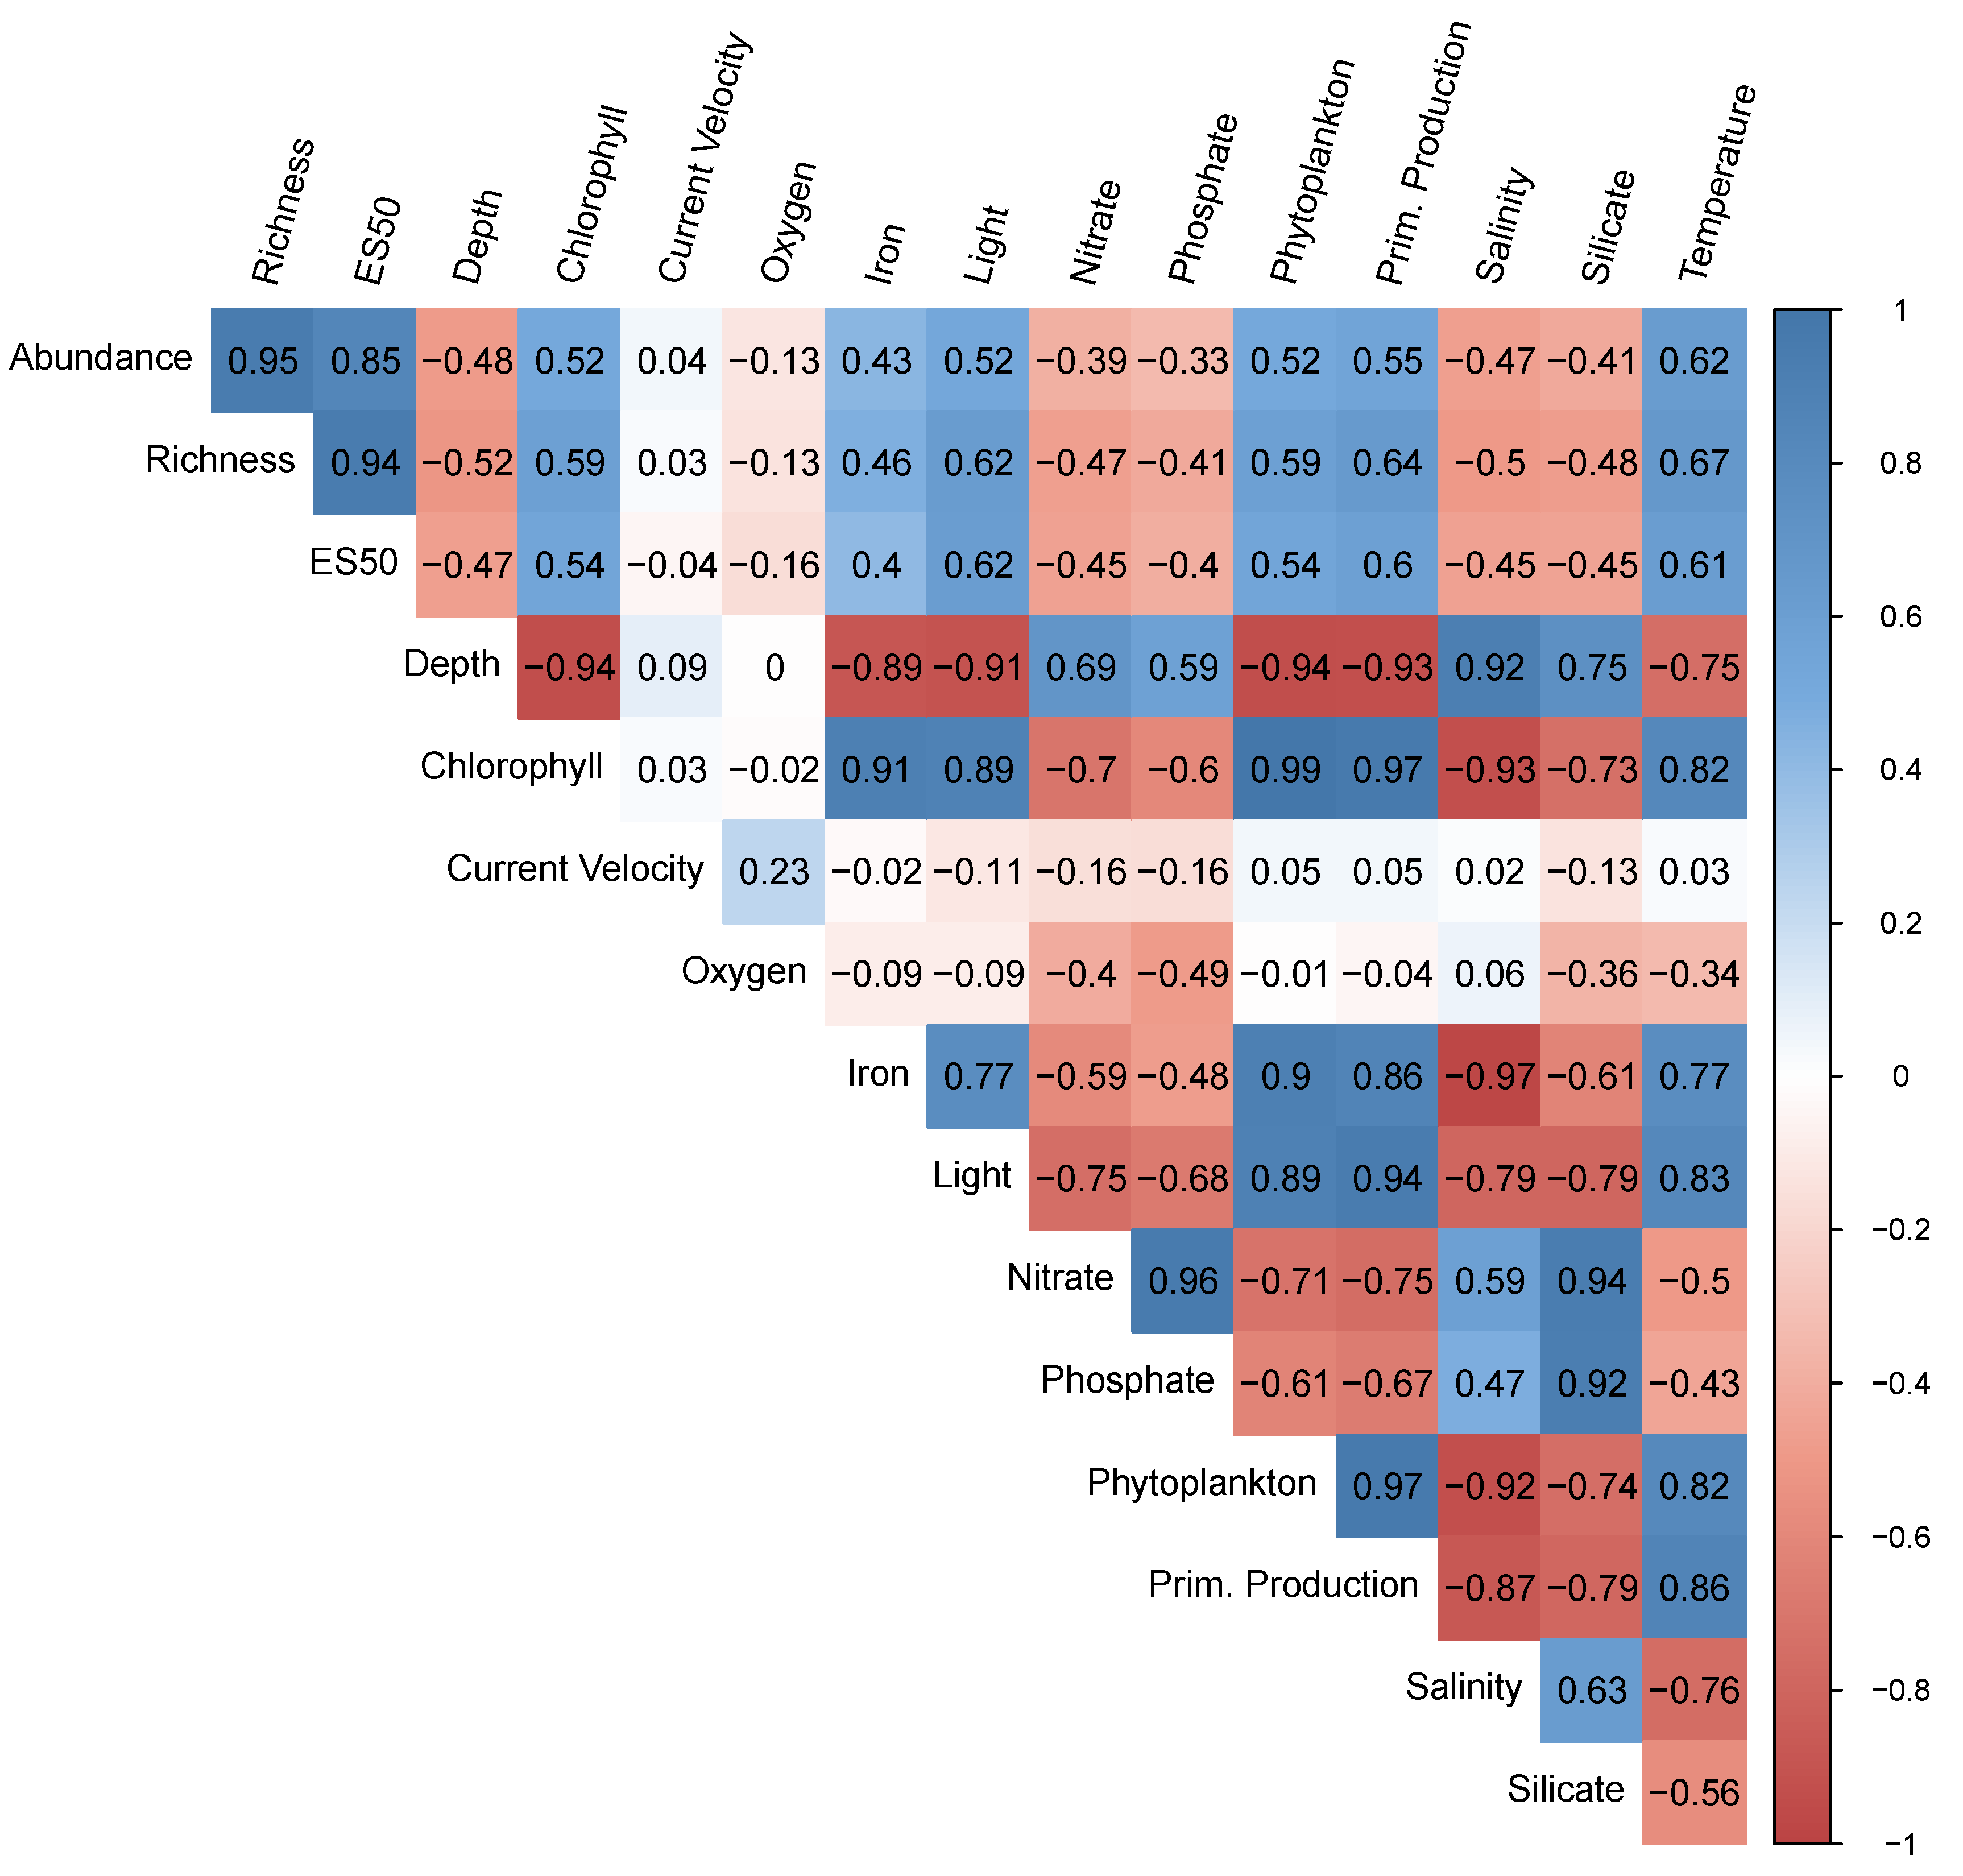
3.5. Environmental Variables

The biodiversity parameters (sampling effort, alpha species richness, and ES50) for each hexagonal cell had overall significant positive relationships with each other (p ≤ 0.01), as to be expected, because they are interdependent (Figure 9). In addition, positive relationships were observed between the biodiversity parameters and chlorophyll, iron, light, phytoplankton, primary production, and temperature. The number of distribution records had a significant negative correlation with depth (p ≤ 0.01), as well as with the nutrients nitrate (p ≤ 0.01), phosphate (p = 0.02), and silicate (p ≤ 0.01), as well as with salinity (p ≤ 0.01), and no significant negative correlation with current velocity (p = 0.77) and oxygen was observed (p = 0.38). The same pattern could be observed with alpha species richness and ES50 (Figure 9).
For further analyses, this correlation matrix was also prepared for shallow-water and deep-sea records (Figure S5). Correlations between iron and salinity for shallow-water sampling effort (p = 0.14; p = 0.2), alpha species richness (p = 0.08; p = 0.09) and ES50 (p = 0.44; p = 0.37), were not significant. In addition, the ES50 did not correlate significantly with depth and phytoplankton (p = 0.13; p = 0.09) (Figure S5A).
The deep-sea sampling effort showed a significant positive correlation only with temperature (p = 0.04). Alpha species richness and ES50 had a significant negative correlation with dissolved oxygen (p = 0.05) (Figure S5B). In general, the correlations in the deep sea were weaker than the overall correlations.

4. Discussion

We found that polychaete and sipunculan gamma species richness decreased from the tropics toward higher latitudes. However, polychaete gamma species richness plateaued between latitudes of 0 and 40°; and sipunculan gamma species richness showed two peaks at latitudes 5–15° and 45°. In comparison, Saeedi et al. [10] found that polychaete and sipunculan gamma species richness decreased with increasing latitude, as they included Arctic latitudes as well [10]. Sampling effort and alpha species richness were highest around South Korea and the island of Hainan and not around the Coral Triangle, as it had been shown in previous studies [48,76]. The ES50 indicated that vast parts of the NWP are still undersampled, as the number of expected species was high in those areas.
In addition, polychaete and sipunculan gamma species richness showed two peaks along a depth gradient from shallow water to abyssal depths, challenging the paradigm that species richness decreases with increasing depth [76,77]. However, the ES50 for both groups sometimes varied considerably from these findings in several cases, and highlighted that a larger sampling effort and greater taxonomic expertise are needed to understand the complex biodiversity patterns.
Furthermore, we found a significant positive relationship between sea surface temperature (SST) and alpha species richness in both shallow-water and deep-sea fauna, which confirms previous findings that sea temperature could drive the species richness in marine realms [39,49,50,76]. In addition, primary production, phytoplankton, and light were correlated significantly with alpha species richness, and this might also explain species richness pattern’s correlations with food availability.

4.1. Latitudinal Distribution

Polychaete gamma species richness plateaued between latitudes 0 and 40°. In comparison, in a previous study by Saeedi et al. [10], polychaete species richness decreased with increasing latitude in the NWP and the Arctic Ocean (AO), and peaked again at latitude 80°. Another study conducted by Pamungkas et al. [78] investigated the polychaete distribution world-wide and found a species richness peak at latitude 60° and a dip near the equator [78]. We found no such peak at latitude 60°; however, this might be attributed to the fact that we only included benthic polychaetes from the NWP, not a global coverage. In addition, the ocean area is narrow at these high latitudes in the NW Pacific, and this limits the species richness significantly [48].
The ES50 for polychaetes showed high values from latitudes 0 to 45°, with dips at latitudes 15° and 30°. Peaks appeared at latitudes 10° and 40°, probably indicating a lack of sampling effort in these regions. The rarefaction curves matched this assumption. Saeedi et al. [10] also found peaks around both latitudes 10° and 40°, as well as around 25° and 80° for polychaetes.
While these authors found that the highest ES15 values for deep-sea polychaetes were at latitudes 15°, 40°, and 80°, and the lowest values were at 20°, 30°, and 85°, we found overall low ES50 values with peaks at latitudes 10° (30 species) and latitudes 5° and 20° (20 species). The shallow-water ES50 values produced a similar pattern to the overall species richness, with peaks at latitudes 5–10° and 40°. This has also been shown in the study from Saeedi et al. [10] and could be caused by the high share of polychaete records (88%) from shallow waters. In a study conducted by Moreno et al. [79] along the Southeastern Pacific coast where they investigated the latitudinal distribution of shallow (up to 200 m) benthic polychaetes, they also found the highest species richness at around latitude 40° S [79].
Two out of eight polychaete orders (Amphinomida and Echiuroidea) had the highest gamma species richness at latitudes 20° and 40°, respectively. However, these were also the orders with only a few species records (378 and 76 out of 31,804 individuals), indicating a possible sampling bias. Saeedi et al. [10] separated the Echiuroidea into its two suborders, Boneliida and Echiurida, revealing different distribution patterns. While the suborder Boneliida had most of its occurrence records slightly over latitude 40°, and only very few south of that, the suborder Echiurida had two peaks at around latitudes 37° and 12° [10].
The other six polychaete orders, including Eunicida, Phyllodocida, Sabellida, Scolecida, Spionida, and Terebellida, peaked at latitudes 20° and 40°. This documents the importance of applying various taxonomic ranks (overall species richness and distinguished for orders) for the identification of distribution patterns. The two peaks in the orders Terebellida and Spionida were also found for their respective suborders by Saeedi et al. [10]. For Phyllodocida, we found the same two peaks, while Saeedi et al. [10] found a peak at lower latitudes for one of its suborders (Aphroditiformia). Phyllodocida was the most-abundant order in this study. This could be due to sampling and taxonomic bias of this order. The order shows a peak at latitudes near 40° (around South Korea), where the highest sampling effort was observed. This high number of distribution records also could be due to a taxonomic bias; for instance, many scientists are working with this order in this region. For the order Sabellida, Giangrande and Licciano [80] did not find two distinct peaks but found that, generally, species richness increased towards the tropics with a dip near the equator [80].
Sipunculan gamma species richness showed two peaks at latitudes 5–15° and 45°. When correcting for sampling bias, we found these peaks at the same latitudes. In the northern hemisphere, the continental shelf area is widest between 10–30° [39], possibly explaining the gamma species richness peak at around 20°. Other studies found that the diversity of different marine taxa did not peak at the equator but around latitudes 10° and 20° [39,81]. Furthermore, a review of 27 published studies found that many previously unimodal interpreted species richness patterns are bimodal, with a dip near the equator [43]. The authors discussed that these findings could indicate that speciation occurs at the tropic margins in response to changing temperatures [43]. Especially the ES50 for polychaetes and sipunculans predicted high species richness at latitudes 5–15°. This could indicate that the water temperature around the equator is increasing too fast and too strongly for many species, forcing them to migrate north- or southwards. It remains unclear as to whether this is a geologically recent development or an ongoing phenomenon, or what the underlying drivers are. A recent study from Yasuhara et al. [82] pinpoints the start of the biodiversity loss at the equator to around 15,000 years ago when the last ice age ended [82]. Their results on foraminifers indicate that, since then, tropical diversity declined and this decline could be accelerated by anthropogenic climate change [43,76,82,83].
For deep-water sipunculans, Saiz et al. [84] found a diversity peak between latitudes 30 and 60°. We found a similar peak between 45° and 50°, which was also predicted by the ES50. However, the ES50 showed a high expected species richness at latitudes 15° and 25° as well. Since the recorded gamma species richness was low at these latitudes, they might be undersampled.
We expected the highest alpha species richness around the Coral Triangle, which is considered to be highly diverse due to the multiple islands and seas meeting there [48,76]. However, the sampling effort and the alpha species richness were highest around South Korea and the island of Hainan, as well as around Hong Kong. South Korea might be so diverse due to different shallow-water habitats along the western (tidal flats), eastern (rocky shoreline) and southern (mixed) coastlines [85]. Around Hong Kong, many studies on polychaete diversity have been conducted, and this, therefore, might lead to a peak of species richness around latitude 20° [86,87]. This could mislead our estimation of species richness in that area, as the sampling effort is high. However, as ES50 also showed high values around these areas, one may suggest that the species richness is indeed high in this area. Since only 6.5% of the records were identified at a species level, and, therefore, used for this analysis, stemmed from the deep sea, the calculated species richness might be biased. The ES50 had a high value around the Coral Triangle, as well as along the whole continental shelf. This indicates that the vast majority of the NWP, especially around the Bering Sea and the area of the KKT, is still undersampled, despite increasing interest, which confirms earlier results [2,4,88]. Nevertheless, protecting the continental shelf area in these regions might favor the protection of species richness and the coexistence of many species. Interestingly, when Saeedi et al. [10] investigated the polychaetes in the Pacific from the equator to latitude 90°, they found the highest sampling effort and gamma species richness was observed at latitude 80° in the Laptev Sea, and not around the tropical latitudes of the Coral Triangle. Investigation of the underlying causes of this pattern is still ongoing. For shallow-water sipunculans (up to 200 m), Murina [89,90,91] found that diversity peaked around tropical regions, with the Indo-West Pacific as a hotspot [89,90,91]. Saiz et al. [84] concluded that the whole NWP is one of the hotspots for deep-sea sipunculans.

4.2. Bathymetric Distribution

While polychaetes were found over the whole depth range as in previous studies [10], there were no sipunculan records below 7500 m in our dataset. This might document the deepest occurrence of sipunculans, or our results might reflect taxonomic difficulties, since species descriptions and genetic analysis lag behind, as sipunculan specialists are rare and the specimens are often damaged, making species delimitation difficult [14,29,92]. Interestingly, most of our polychaete records (84%) occurred in the uppermost 200 m of water, compared to the 44% found by Saeedi et al. [10]. However, we solely focused on benthic species.
Typically, species richness is expected to decrease with increasing depth [76,77]. In contrast, other studies found no common effect of depth on species richness. For example, bivalves showed no clear relationship with depth, polychaete richness decreased with depth and isopods had their highest richness in middle abyssal depth (around 3000 m) [22], indicating that depth distribution patterns might be taxon-specific. In addition, earlier studies showed that marine biodiversity typically peaks at continental slope depths around 2000 m [22].
We found the highest sampling effort and species richness in shallow waters, as well as a negative correlation of all biodiversity parameters with depth. However, sampling effort and gamma species richness peaked again around 5000–5500 m. After accounting for sampling bias, polychaete gamma species richness peaked again in abyssal depths (3500–4500 m). This peak at around 4500 m has been shown for isopods but not yet for polychaetes [10,77].
For sipunculans, earlier studies found a linear regression of gamma species richness with depths greater than 2000 m [84]. In contrast, only one quarter of the records occurred in the upper 200 m, and sipunculan species richness peaked at 5000–5500 m again. However, the study conducted by Saiz et al. [84] investigated global and not regional species richness, which could partially explain the differences in results among regional and global scales studies.

4.3. Environmental Variables

Sea surface temperature (SST) has been described as one of the driving factors of species richness in shallow water [39,49,50,93]. Therefore, we expected the temperature to be the most significant driver at least in shallow-water species. Here, temperature showed a positive significant correlation with alpha species richness, next to other typical shallow-water factors such as primary production, phytoplankton and light. These may be linked to benthic organisms via food webs, since benthic organisms (especially deep-sea species) rely on organic matter flux from the surface [94]. Studies found that polychaete richness and distribution can be explained by elevated nutrient concentrations, for instance, those found in marinas [95] or estuaries [96], even if heavy-metal concentration is high as well [95,96,97]. However, in our study, nutrients such as nitrate, phosphate, and silicate did not correlate significantly with alpha species richness. This might be explained by the fact that these nutrients are typically low in areas with high productivity, because they are taken up during primary production. This is especially the case in the tropics, where the system is constantly nutrient-limited but very productive. At higher latitudes, nutrient concentrations are high during winter due to the mixing of deeper water layers with the surface layer, but primary production can only start once enough light is available. This means that even if the nutrient concentration is high, there might be no primary production, and, thus, less food for benthic organisms [98]. Furthermore, bioturbation activities and subsequent reactions such as nitrification and denitrification by benthic annelids can lead to a release of nutrients in the water column, and thus distort the correlation between nutrient concentration and alpha species richness [97]. In addition, other nutrients such as iron have been shown to also be limiting for phytoplankton in certain areas [99,100]. Therefore, in these regions, nitrate, phosphate, and silicate levels might be high but primary production is still low because it is limited by iron. Iron was also significantly positively correlated with alpha species richness. All of these reasons might explain why nutrients are not significantly correlated with species richness.
A recent review of marine benthic food webs showed that the benthic sampling effort is influenced by food quantity while species richness and composition might be influenced by food quality [98]. Competition due to poor food quality and quantity, as is the case in most deep-sea habitats, can promote food specialization [98]. Correspondingly, we found a significant positive relationship between primary production, phytoplankton, light, and chlorophyll in both shallow water and the deep sea. This aligns with previous findings from the central Pacific, the northeast Atlantic [101], and the Antarctic Ocean [102]. However, other studies about polychaetes, as well as other marine taxa such as bivalves, found a negative correlation with primary production [39,103]. This might be caused by limited food availability, preventing few species from out-competing rare species and, therefore, yielding a higher species richness [103].
Since the deep sea is not only limited in food but often also in oxygen [50,104], we expected dissolved oxygen to be an important environmental factor in the distribution of polychaetes. In a previous study, significant positive correlations of benthic polychaete sampling effort, richness, diversity, and evenness with dissolved oxygen along the northwest Indian coast had been shown [105]. In contrast, we found that dissolved oxygen was negatively correlated with alpha species richness and ES50. It has been shown that some polychaetes can withstand low oxygen levels and can alter their morphology to increase their respiratory area for more efficient oxygen uptake [106,107].
In the deep sea, the correlation between deep-sea diversity parameters and environmental variables was generally less pronounced than in shallow-water biodiversity. This might indicate that other factors are driving the biodiversity here, which we did not incorporate into our study (sediment type, deep-water currents, flux of particulate organic matter). For instance, soft sediment is important for burrowers and deposit feeders, such as polychaetes and sipunculans [108]. It has been suggested that deposit feeders prefer specific sediment size, shape, quality, and composition and that therefore sediment heterogeneity increases species diversity. Studies have found that polychaete sampling effort and diversity were higher at stations with sandy sediments [109,110]. Sediments with a higher sand content generally have more interstitial space for polychaetes and thus might be preferred. In addition, they found lower polychaete sampling efforts at stations with higher organic carbon content. This might be due to anoxic conditions created by the degradation of organic matter. Other factors that influence sediment heterogeneity (e.g., deep-water currents, disturbances, bioturbation) also influence species richness. However, higher species richness itself may cause sediment heterogeneity through different activities, such as feeding and burrowing reviewed by [108]. Moreover, spatial heterogeneity of the deep-sea floor and catastrophic events in the past and present drive biodiversity patterns [48,108]. Overall, further research to understand biodiversity patterns is needed, especially taxon-specific species richness analyses, as well as both local and large-scale biogeography analyses. It is interesting to see how distribution and species richness patterns vary among different taxa and at various geographical scales. For species management plans and habitat restorations, this basic knowledge is needed to estimate and implement the best strategies to preserve both the species and their habitats. Our results here could significantly contribute to these activities as a baseline study.
Open-access data portals such as OBIS and GBIF make it possible to study the species distribution and richness from a regional to a global scale, as done, for instance, for the OBIS-SEAMAP (The World Data Center for Marine Mammal, Sea Bird, and Sea Turtle Distributions) [111] and other studies [112,113,114]. They host an immense amount of scientific knowledge accessible to everyone and have propelled science about biodiversity into a new age. It is important to note, however, that all results based on open-access data are biased due to differences in sampling methodology, digitalization standards, language barriers, sampling effort, as well as taxonomic expertise, depending on the authors and their respective countries. Sampling will always be spatially and temporally biased. This illustrates the necessity of improving data sharing and standards to produce more high-quality data, in order to make more precise estimations about species distribution, especially in large-scale studies.

5. Conclusions

Our study found that polychaete gamma species richness decreases from latitude 40° towards higher latitudes but remains high until latitude 40°, which had not previously been observed for benthic polychaetes in the NWP. Sipunculan gamma species richness peaked twice: at latitudes 5–15° and 45°. The peak slightly above the equator might indicate that the temperatures there are already too high, as has been suggested for other taxa. Furthermore, we found two peaks of gamma species richness along the depth gradient in shallow water (0–500 m) and at 5000–5500 m. This is in contrast to the general assumption that species richness declines with depth. In addition, species richness correlated strongly with temperature, as well as parameters linked to food supply (primary production, light, chlorophyll, phytoplankton). This aligns with previous findings.
Our results show that gamma species richness does not linearly decline with increasing latitude and depth but rather depends on a multitude of biotic and abiotic factors and more importantly is taxa specific. This knowledge is necessary to understand distribution patterns of benthic polychaetes and sipunculans and determine effective ways to preserve their biodiversity. Especially now in light of climate change, it is important to find ways to protect species from extinction, for instance through marine protected areas or the prohibition of deep-sea mining. For further investigations, more quantitative sampling and taxonomic efforts are needed to generate high-quality data on distribution and life stages. In addition, further environmental parameters, such as sediment grain size, hydrology, and topographic features, need to be considered when determining the response of annelids to environmental variables, to be able to further investigate how they will respond to future climate changes.

Supplementary Materials

The following supporting information can be downloaded at: https://www.mdpi.com/article/10.3390/d15040557/s1, Figure S1: Estimated species richness (ES50) for (A) shallow water polychaetes, (B) deep-sea polychaetes, (C) shallow water sipunculans and (D) deep-sea sipunculans in the Northwest Pacific; Figure S2: Number of occurrence records for (A) Polychaeta and (B) Sipuncula orders per 5°-latitudinal bands in the Northwest Pacific. The x-axis are logarithmic; Figure S3: Number of records for (A) shallow water polychaetes, (B) deep-sea polychaetes, (C) shallow water sipunculans (D) deep-sea sipunculans per 5°-latitudinal bands; Figure S4: Correlation matrices of biodiversity parameters and environmental factors in the Northwest Pacific for (A) Polychaeta and (B) Sipuncula on the 5 % confidence value; Figure S5: Distribution and diversity of shallow-water Polychaeta and Sipuncula in the Northwest Pacific; Figure S6: Distribution and diversity of deep-sea Polychaeta and Sipuncula in the Northwest Pacific; Figure S7: Violin plot representing the latitudinal distribution of polychaete records for each order across the Northwest Pacific; Figure S8: Violin plot representing the latitudinal distribution of sipunculan records for each order across the Northwest Pacific; Table S1: Citations of the OBIS dataset.

Author Contributions

Conceptualization, A.B. and H.S.; methodology, K.K., H.K. and H.S.; software, H.S.; validation, H.S. and A.B.; formal analysis, K.K.; investigation, K.K. and H.K.; resources, H.S. and A.B.; data curation, K.K., H.S. and H.K.; writing—original draft preparation, K.K.; writing—review and editing, H.K., A.B. and H.S.; visualization, K.K.; supervision, H.S.; project administration, A.B. and H.S.; funding acquisition, A.B. and H.S. All authors have read and agreed to the published version of the manuscript.

Funding

This paper is part of the Biogeography of the Northwest Pacific deep-sea fauna and their possible future invasions into the Arctic Ocean”—Project (BENEFICIAL). The BENEFICIAL—Project (grant number 03F0833) was funded by the Federal Ministry for Education and Research (BMBF: Bundesministerium für Bildung und Forschung) in Germany. This paper is BENEFICIAL project publication # 40.

Institutional Review Board Statement

Not applicable.

Data Availability Statement

The dataset will be available upon request.

Acknowledgments

We want to thank Aki Nisbet and Mercedes Chumbley for their help as native English speakers in revising this paper.

Conflicts of Interest

The authors declare that they have no known competing financial interest or personal relationship that could have appeared to influence the work reported in this paper.

References

  1. Birstein, J.A. Deep Water Isopods (Crustacea, Isopoda) of the North-Western Part of the Pacific Ocean; Indian National Scientific Documentation Centre: New Delhi, India, 1963. [Google Scholar]
  2. Brandt, A. RV Sonne SO-250 Cruise Report/Fahrtbericht. SO-250 KuramBio II (Kuril Kamchatka Biodiversity Studies) Tomakomai—Yokohama, Japan, 16.08.–26.09.2016. Available online: http://tristan.cordier.free.fr/files/SO250_KuramBio%20II_20161014.pdf (accessed on 4 November 2021).
  3. Brandt, A.; Brix, S.; Riehl, T.; Malyutina, M. Biodiversity and biogeography of the abyssal and hadal Kuril-Kamchatka trench and adjacent NW Pacific deep-sea regions. Prog. Oceanogr. 2020, 181, 102232. [Google Scholar] [CrossRef]
  4. Brandt, A.; Malyutina, M. The German-Russian Deep-Sea Expedition KuramBio (Kuril Kamchatka Biodiversity Studies) to the Kuril Kamchatka Trench and Abyssal Plain on Board of the R/V Sonne, 223rd Expedition (21 July–7 September 2012). 2012. Available online: https://www.researchgate.net/publication/298305628_The_German-Russian_deep-sea_expedition_KuramBio_Kurile_Kamchatka_Biodiversity_Study_to_the_Kurile_Kamchatka_Trench_and_abyssal_plain_on_board_of_the_RV_Sonne_223rd_Expedition_July_21th_-_September_7th (accessed on 4 November 2021).
  5. Brandt, A.; Malyutina, M.; Majorova, N.; Bashmanov, A.; Brenke, N.; Chizhova, T.; Elsner, N.; Golovan, O.; Göcke, C.; Kaplunenko, D.; et al. The Russian-German Deep-Sea Expedition (SoJaBio) to the Sea of Japan Onboard of the R/V Akademik Lavrentyev. 51st Cruise, 11 August–5 September 2010, The Cruise Report. 2010. Available online: https://www.researchgate.net/publication/298305568_The_Russian-German_deep-sea_expedition_SoJaBio_to_the_Sea_of_Japan_onboard_of_the_RV_Akademik_Lavrentyev_51st_Cruise_August_11th_-_September_5th_2010_The_Cruise_Report (accessed on 4 November 2021).
  6. Bogorov, V.G. (Ed.) Fauna of the Kurile-Kamchatka Trench and Its Environment, 86th ed.; Based on Data from the 39th Cruise of the R/V “Vityaz”: Proceedings of the Institue of Oceanology; IPST: Bangkok, Thailand, 1970. [Google Scholar]
  7. Malyutina, M.; Brandt, A.; Ivin, V.V. The Russian-German Deep-Sea Expedition SokhoBio (Sea of Okhotsk Biodiversity Studies) to the Kurile Basin of the Sea of Okhotsk on board of the R/V Akademik M.A.Lavrentyev. The Cruise Report. 2015.
  8. Werner, R.; Hoernle, K.; Hauff, F. RV SONNE Fahrtbericht/Cruise Report SO249. In BERING—Origin and Evolution of the Bering Sea: An Integrated Geochronological, Volcanological, Petrological and Geochemical Approach; GEOMAR Helmholtz-Zentrum für Ozeanforschung Kiel: Kiel, Germany, 2016; Volume 30. [Google Scholar]
  9. WoRMS Editorial Board World Register of Marine Species (WoRMS): WoRMS Editorial Board. 2022. Available online: https://www.marinespecies.org (accessed on 4 November 2021).
  10. Saeedi, H.; Jacobsen, N.L.; Brandt, A. Biodiversity and distribution of Isopoda and Polychaeta along the Northwestern Pacific and the Arctic Ocean. Biodivers. Inform. 2022, 17, 10–26. [Google Scholar] [CrossRef]
  11. Alalykina, I.L. Composition of deep-sea polychaetes from the SokhoBio expedition with a description of a new species of Labioleanira (Annelida: Sigalionidae) from the Sea of Okhotsk. Deep Sea Res. Part II Top. Stud. Oceanogr. 2018, 154, 140–158. [Google Scholar] [CrossRef]
  12. Alalykina, I.L. Polychaete composition from the abyssal plain adjacent to the Kuril–Kamchatka Trench with the description of a new species of Sphaerephesia (Polychaeta: Sphaerodoridae). Deep Sea Res. Part II Top. Stud. Oceanogr. 2015, 111, 166–174. [Google Scholar] [CrossRef]
  13. Fauchald, K. The polychaete worms. definition and keys to the orders, Families, and Genera. In Natural History Museum of Los Angeles County, Science Series; Los Angeles County Museum: Los Angeles, CA, USA, 1977; Volume 28. [Google Scholar]
  14. Saeedi, H.; Brandt, A. Biogeographic Atlas of the Deep NW Pacific Fauna; Pensoft Publishers: Sofia, Bulgaria, 2020. [Google Scholar]
  15. Kamenev, G.M.; Mordukhovich, V.V.; Alalykina, I.L.; Chernyshev, A.V.; Maiorova, A.S. Macrofauna and Nematode Abundance in the Abyssal and Hadal Zones of Interconnected Deep-Sea Ecosystems in the Kuril Basin (Sea of Okhotsk) and the Kuril-Kamchatka Trench (Pacific Ocean). Front. Mar. Sci. 2022, 9, 812464. [Google Scholar] [CrossRef]
  16. Hutchings, P. Biodiversity and functioning of polychaetes in benthic sediments. Biodivers. Conserv. 1998, 7, 1133–1145. [Google Scholar] [CrossRef]
  17. Sikorski, A.; Pavlova, L. Three new species of Laonice (Polychaete: Spionidae) from West and Southwest Africa. Zootaxa 2016, 4097, 353–368. [Google Scholar] [CrossRef]
  18. Pamungkas, J.; Glasby, C.J.; Read, G.B.; Wilson, S.P.; Costello, M.J. Progress and perspectives in the discovery of polychaete worms (Annelida) of the world. Helgol. Mar. Res. 2019, 73, 4. [Google Scholar] [CrossRef]
  19. Moreno, R.A.; Rivadeneira, M.M.; Hernandez, C.E.; Sampértegui, S.; Rozbaczylo, N. Do Rapoport´s rule, the mid-domain effect or the source-sink hypotheses predict bathymetric patterns of polychaete richness on the Pacific coast of South America? Glob. Ecol. Biogeogr. 2008, 17, 415–423. [Google Scholar] [CrossRef]
  20. Ellingsen, K.E.; Brandt, A.; Ebbe, B.; Linse, K. Diversity and species distribution of polychaetes, isopods and bivalves in the Atlantic sector of the deep Southern Ocean. Polar Biol. 2007, 30, 1265–1273. [Google Scholar] [CrossRef]
  21. Hilbig, B.; Blake, J.A. Deep-sea polychaete communities in the northeast Pacific Ocean off the Gulf of the Farallones, California. Bull. Mar. Sci. 2006, 78, 243–269. [Google Scholar]
  22. Brandt, A.; De Broyer, C.; De Mesel, I.; Ellingsen, K.E.; Gooday, A.J.; Hilbig, B.; Linse, K.; Thomson, M.R.; Tyler, P.A. The biodiversity of the deep Southern Ocean benthos. Philos. Trans. R. Soc. Lond. B Biol. Sci. 2007, 362, 39–66. [Google Scholar] [CrossRef] [Green Version]
  23. Cutler, E.B. The Sipuncula: Their Systematics, Biology, and Evolution; Ithaka and London: Ithaca, NY, USA, 1994. [Google Scholar]
  24. Schulze, A.; Maiorova, A.; Timm, L.E.; Rice, M.E. Sipunculan Larvae and “Cosmopolitan” Species. Integr. Comp. Biol. 2012, 52, 497–510. [Google Scholar] [CrossRef] [Green Version]
  25. Dordel, J.; Fisse, F.; Purschke, G.; Struck, T.H. Phylogenetic position of Sipuncula derived from multi-gene and phylogenomic data and its implication for the evolution of segmentation. J. Zool. Syst. Evol. Res. 2010, 48, 197–207. [Google Scholar] [CrossRef]
  26. Mwinyi, A.; Meyer, A.; Bleidorn, C.; Lieb, B.; Bartolomaeus, T.; Podsiadlowski, L. Mitochondrial genome sequence and gene order of Sipunculus nudus give additional support for an inclusion of Sipuncula into Annelida. BMC Genom. 2009, 10, 27. [Google Scholar] [CrossRef] [Green Version]
  27. Shen, X.; Ma, X.; Ren, J.; Zhao, F. A close phylogenetic relationship between Sipuncula and Annelida evidenced from the complete mitochondrial genome sequence of Phascolosoma esculenta. BMC Genom. 2009, 10, 136. [Google Scholar] [CrossRef] [Green Version]
  28. Sung, J.-M.; Karagozlu, M.Z.; Kim, C.-B. The complete mitogenome of a peanut worm Phascolosoma pacificum (Sipuncula, Phascolosomatida, Phascolosomatidea). Mitochondrial DNA Part B 2017, 2, 618–619. [Google Scholar] [CrossRef] [Green Version]
  29. Schulze, A.; Kawauchi, G.Y. How Many Sipunculan Species Are Hiding in Our Oceans? Diversity 2021, 13, 43. [Google Scholar] [CrossRef]
  30. Kędra, M.; Grebmeier, J.M.; Cooper, L.W. Sipunculan fauna in the Pacific Arctic region: A significant component of benthic infaunal communities. Polar Biol. 2018, 41, 163–174. [Google Scholar] [CrossRef] [Green Version]
  31. Kędra, M.; Murina, G.V. The sipunculan fauna of Svalbard. Polar Res. 2007, 26, 37–47. [Google Scholar] [CrossRef]
  32. Maiorova, A.S.; Adrianov, A.V. Distribution of peanut worms (Sipuncula) in the West Pacific. In Proceedings of the China-Russian Bilateral symposium on “Comparison on Marine Biodiversityin the Northwest Pacific Ocean”, Qingdao, China, 10–11 November 2010; pp. 10–11. [Google Scholar]
  33. Maiorova, A.S.; Adrianov, A.V. Peanut worms of the phylum Sipuncula from the Sea of Japan with a key to species. Deep Sea Res. Part II Top. Stud. Oceanogr. 2013, 86–87, 140–147. [Google Scholar] [CrossRef]
  34. Maiorova, A.S.; Adrianov, A.V. Deep-sea sipunculans from the Kuril-Kamchatka Trench and adjacent abyssal plain. Deep Sea Res. Part II Top. Stud. Oceanogr. 2015, 111, 128–134. [Google Scholar] [CrossRef]
  35. Wallace, A.R. Tropical Nature, and Other Essays; Macmillan and Company: New York, NY, USA, 1878. [Google Scholar]
  36. Menegotto, A.; Rangel, T.F. Mapping knowledge gaps in marine diversity reveals a latitudinal gradient of missing species richness. Nat. Commun. 2018, 9, 4713. [Google Scholar] [CrossRef] [PubMed] [Green Version]
  37. Macpherson, E.; Duarte, C.M. Patterns in species richness, size, and latitudinal range of East Atlantic fishes. Ecography 1994, 17, 242–248. [Google Scholar] [CrossRef]
  38. Fischer, A.G. Latitudinal variations in organic diversity. Evolution 1960, 14, 64–81. [Google Scholar] [CrossRef]
  39. Saeedi, H.; Dennis, T.E.; Costello, M.J. Bimodal latitudinal species richness and high endemicity of razor clams (Mollusca). J. Biogeogr. 2017, 44, 592–604. [Google Scholar] [CrossRef]
  40. Hillebrand, H. On the generality of the latitudinal diversity gradient. Am. Nat. 2004, 163, 192–211. [Google Scholar] [CrossRef] [Green Version]
  41. Crame, J.A. Evolution of taxonomic diversity gradients in the marine realm: A comparison of Late Jurassic and Recent bivalve faunas. Paleobiology 2002, 28, 184–207. [Google Scholar] [CrossRef]
  42. Böhm, M.; Mayhew, P.J. Historical biogeography and the evolution of the latitudinal gradient of species richness in the Papionini (Primata: Cercopithecidae). Biol. J. Linn. Soc. 2005, 85, 235–246. [Google Scholar] [CrossRef] [Green Version]
  43. Chaudhary, C.; Saeedi, H.; Costello, M.J. Bimodality of Latitudinal Gradients in Marine Species Richness. Trends Ecol. Evol. 2016, 31, 670–676. [Google Scholar] [CrossRef]
  44. Willig, M.R.; Kaufman, D.M.; Stevens, R.D. Latitudinal Gradients of Biodiversity: Pattern, Process, Scale, and Synthesis. Annu. Rev. Ecol. Evol. Syst. 2003, 34, 273–309. [Google Scholar] [CrossRef]
  45. Zhao, F.; Filker, S.; Wang, C.; Xu, K. Bathymetric gradient shapes the community composition rather than the species richness of deep-sea benthic ciliates. Sci. Total Environ. 2021, 755, 142623. [Google Scholar] [CrossRef]
  46. Danovaro, R.; Gambi, C.; Lampadariou, N.; Tselepides, A. Deep-sea nematode biodiversity in the Mediterranean basin: Testing for longitudinal, bathymetric and energetic gradients. Ecography 2008, 31, 231–244. [Google Scholar] [CrossRef]
  47. Cartes, J.; Sardà, F. Abundance and diversity of decapod crustaceans in the deep-Catalan Sea (Western Mediterranean). J. Nat. Hist. 1992, 26, 1305–1323. [Google Scholar] [CrossRef] [Green Version]
  48. Saeedi, H.; Costello, M.J.; Warren, D.; Brandt, A. Latitudinal and bathymetrical species richness patterns in the NW Pacific and adjacent Arctic Ocean. Sci. Rep. 2019, 9, 9303. [Google Scholar] [CrossRef] [Green Version]
  49. Tittensor, D.P.; Mora, C.; Jetz, W.; Lotze, H.K.; Ricard, D.; Berghe, E.V.; Worm, B. Global patterns and predictors of marine biodiversity across taxa. Nature 2010, 466, 1098–1101. [Google Scholar] [CrossRef]
  50. Woolley, S.N.C.; Tittensor, D.P.; Dunstan, P.K.; Guillera-Arroita, G.; Lahoz-Monfort, J.J.; Wintle, B.A.; Worm, B.; O’Hara, T.D. Deep-sea diversity patterns are shaped by energy availability. Nature 2016, 533, 393–396. [Google Scholar] [CrossRef] [Green Version]
  51. Saeedi, H.; Simões, M.; Brandt, A. Biodiversity and distribution patterns of deep-sea fauna along the temperate NW Pacific. Prog. Oceanogr. 2020, 183, 102296. [Google Scholar] [CrossRef]
  52. Levin, L.A.; Wei, C.; Dunn, D.C.; Amon, D.J.; Ashford, O.S.; Cheung, W.W.L.; Colaço, A.; Dominguez-Carrió, C.; Escobar, E.G.; Harden-Davies, H.R.; et al. Climate change considerations are fundamental to management of deep-sea resource extraction. Glob. Chang. Biol. 2020, 26, 4664–4678. [Google Scholar] [CrossRef]
  53. McClain, C.R.; Hardy, S.M. The dynamics of biogeographic ranges in the deep sea. Proc. R. Soc. B Biol. Sci. 2010, 277, 3533–3546. [Google Scholar] [CrossRef] [Green Version]
  54. Hoegh-Guldberg, O.; Cai, R.; Poloczanska, E.S.; Brewer, P.G.; Sundby, S.; Hilmi, K.; Fabry, V.J.; Jun, S.E. The Ocean, in Climate Change 2014: Impacts, Adaptation, and Vulnerability. Part B: Regional Aspects. Contribution of Working Group II to the Fifth Assessment Report of the Intergovernmental Panel on Climate Change; Barros, V.R., Field, C.B., Dokken, D.J., Mastrandrea, M.D., Mach, K.J., Bilir, T.E., Chatterjee, M., Ebi, K.L., Estrada, Y.O., Genova, R.C., et al., Eds.; Cambridge University Press: Cambridge, UK; New York, NY, USA, 2014; pp. 1655–1731. [Google Scholar]
  55. Abram, N.; Gattuso, J.P.; Prakash, A.; Cheng, L.; Chidichimo, M.P.; Crate, S.; Enomoto, H.; Garschagen, M.; Gruber, N.; Harper, S.; et al. Special Report on the Ocean and Cryosphere in a Changing Climate; Cambridge University Press: Cambridge, UK, 2019; pp. 73–129. [Google Scholar] [CrossRef]
  56. Simões, M.V.P.; Saeedi, H.; Cobos, M.E.; Brandt, A. Environmental matching reveals non-uniform range-shift patterns in benthic marine Crustacea. Clim. Chang. 2021, 168, 31. [Google Scholar] [CrossRef]
  57. Sweetman, A.K.; Thurber, A.R.; Smith, C.R.; Levin, L.; Mora, C.; Wei, C.-L.; Gooday, A.J.; Jones, D.; Rex, M.; Yasuhara, M.; et al. Major impacts of climate change on deep-sea benthic ecosystems. Elementa: Sci. Anthr. 2017, 5, 2–23. [Google Scholar] [CrossRef]
  58. Danovaro, R.; Corinaldesi, C.; Dell’Anno, A.; Snelgrove, P.V.R. The deep-sea under global change. Curr. Biol. 2017, 27, R461–R465. [Google Scholar] [CrossRef] [PubMed] [Green Version]
  59. Ramirez-Llodra, E.; Brandt, A.; Danovaro, R.; De Mol, B.; Escobar, E.; German, C.R.; Levin, L.A.; Martinez Arbizu, P.; Menot, L.; Buhl-Mortensen, P.; et al. Deep, diverse and definitely different: Unique attributes of the world’s largest ecosystem. Biogeosciences 2010, 7, 2851–2899. [Google Scholar] [CrossRef] [Green Version]
  60. Dreutter, S.; Steffen, M.; Arbizu, P.M.; Brandt, A. Will the “top five” deepest trenches lose one of their members? Prog. Oceanogr. 2020, 181, 102258. [Google Scholar] [CrossRef]
  61. Grassle, J.F. The Ocean Biogeographic Information System (OBIS): An on-line, worldwide atlas for accessing, modeling and mapping marine biological data in a multidimensional geographic context. Oceanography 2000, 13, 5–7. [Google Scholar] [CrossRef]
  62. Global Biodiversity Information Facility. 2021. Available online: www.gbif.org (accessed on 4 November 2021).
  63. Glover, A.G.; Higgs, N.; Horton, T. World Register of Deep-Sea Species (WoRDSS). 2021. Available online: http://www.marinespecies.org/deepsea (accessed on 12 November 2021).
  64. R Core Team. R. A Language and Environment for Statistical Computing, Version 2021.09.1; R Foundation for Statistical Computing: Vienna, Austria, 2021.
  65. Wickham, H.; Averick, M.; Bryan, J.; Chang, W.; McGowan, L.; Francois, R.; Grolemund, G.; Hayes, A.; Henry, L.; Hester, J.; et al. Welcome to the Tidyverse. J. Open Source Softw. 2019, 4, 1686. [Google Scholar] [CrossRef] [Green Version]
  66. Chamberlain, S. Scrubr: Clean Biological Occurence Records. 2021.
  67. Provoost, P.; Bosch, S. Obistools: Tools for Data Enhancement and Quality Control: Ocean Biogeographic Information System. Intergovernmental Oceanographic Commission of UNESCO. 2022. Available online: https://cran.r-project.org/package=obistools (accessed on 4 November 2021).
  68. Group, G.C. GEBCO 2021 Grid. [2021 11.11.21]. Available online: https://www.gebco.net (accessed on 4 November 2021).
  69. Assis, J.; Tyberghein, L.; Bosch, S.; Verbruggen, H.; Serrão, E.A.; de Clerck, O. Extending marine data layers for bioclimatic modelling. Glob. Ecol. Biogeogr. 2018, 27, 277–284. [Google Scholar] [CrossRef]
  70. Tyberghein, L.; Verbruggen, H.; Pauly, K.; Troupin, C.; Mineur, F.; de Clerck, O. Bio-ORACLE: A global environmental dataset for marine species distribution modelling. Glob. Ecol. Biogeogr. 2012, 21, 272–281. [Google Scholar] [CrossRef]
  71. Pebesma, E. Simple Features for R: Standardized Support for Spatial Vector Data. R J. 2018, 10, 439–446. [Google Scholar] [CrossRef] [Green Version]
  72. Oksanen, J.; Blanchet, F.G.; Kindt, R.; Legendre, P.; O’hara, R.B.; Simpson, G.L.; Solymos, P.; Stevens, M.H.H.; Wagner, H. Vegan: Community Ecology Package. Package R Package Version 2018, 2, 5–7. Available online: https://CRAN.R-project.org/package=vegan (accessed on 4 November 2021).
  73. Suzuki, R.; Terada, Y.; Shimodaira, H. Pvclust: Hierarchical Clustering with p-Values via Multiscale Bootstrap. 2019. Available online: https://CRAN.R-project.org/package=pvclust (accessed on 4 November 2021).
  74. Wei, T.; Simko, V. R Package “Corrplot”: Visualization of a Correlation Matrix. 2021. Available online: https://github.com/taiyun/corrplot (accessed on 4 November 2021).
  75. Wickham, H. ggplot2: Elegant Graphics for Data Analysis. 2016. Available online: https://ggplot2.tidyverse.org (accessed on 4 November 2021).
  76. Costello, M.J.; Chaudhary, C. Marine Biodiversity, Biogeography, Deep-Sea Gradients, and Conservation. Curr. Biol. 2017, 27, R511–R527. [Google Scholar] [CrossRef]
  77. Brandt, A.; Linse, K.; Schüller, M. Bathymetric distribution patterns of Southern Ocean macrofaunal taxa: Bivalvia, Gastropoda, Isopoda and Polychaeta. Deep Sea Res. Part I Oceanogr. Res. Pap. 2009, 56, 2013–2025. [Google Scholar] [CrossRef]
  78. Pamungkas, J.; Glasby, C.; Costello, M. Biogeography of polychaete worms (Annelida) of the world. Mar. Ecol. Prog. Ser. 2021, 657, 147–159. [Google Scholar] [CrossRef]
  79. Moreno, R.A.; Labra, F.A.; Cotoras, D.D.; Camus, P.A.; Gutiérrez, D.; Aguirre, L.; Rozbaczylo, N.; Poulin, E.; Lagos, N.A.; Zamorano, D.; et al. Evolutionary drivers of the hump-shaped latitudinal gradient of benthic polychaete species richness along the Southeastern Pacific coast. PeerJ 2021, 9, e12010. [Google Scholar] [CrossRef]
  80. Giangrande, A.; Licciano, M. Factors influencing latitudinal pattern of biodiversity: An example using Sabellidae (Annelida, Polychaeta). Biodivers. Conserv. 2004, 13, 1633–1646. [Google Scholar] [CrossRef]
  81. Powell, M.G.; Beresford, V.P.; Colaianne, B.A. The latitudinal position of peak marine diversity in living and fossil biotas. J. Biogeogr. 2012, 39, 1687–1694. [Google Scholar] [CrossRef]
  82. Yasuhara, M.; Wei, C.-L.; Kucera, M.; Costello, M.J.; Tittensor, D.P.; Kiessling, W.; Bonebrake, T.C.; Tabor, C.R.; Feng, R.; Baselga, A.; et al. Past and future decline of tropical pelagic biodiversity. Proc. Natl. Acad. Sci. USA 2020, 117, 12891–12896. [Google Scholar] [CrossRef]
  83. Molinos, J.G.; Halpern, B.S.; Schoeman, D.S.; Brown, C.J.; Kiessling, W.; Moore, P.J.; Pandolfi, J.M.; Poloczanska, E.S.; Richardson, A.J.; Burrows, M.T. Climate velocity and the future global redistribution of marine biodiversity. Nat. Clim. Chang. 2016, 6, 83–88. [Google Scholar] [CrossRef]
  84. Saiz, J.I.; Bustamante, M.; Tajadura, J. A census of deep-water sipunculans (Sipuncula). Mar. Biodivers. 2018, 48, 449–464. [Google Scholar] [CrossRef]
  85. Khim, J.S.; Lee, C.; Song, S.J.; Bae, H.; Noh, J.; Lee, J.; Kim, H.-G.; Choi, J.-W. Marine biodiversity in Korea: A review of macrozoobenthic assemblages, their distributions, and long-term community changes from human impacts. Oceanogr. Mar. Biol. Annu. Rev. 2021, 59, 483–532. [Google Scholar] [CrossRef]
  86. Shin, P.K. Biodiversity of subtidal benthic polychaetes in Hong Kong coastal waters. In The Marine Biology of the South China Sea. In Proceedings of the Third International Conference on the Marine Biology of Hong Kong and the South China Sea, Hong Kong, China, 28 October–1 November 1998; Volume 28, pp. 57–74. [Google Scholar]
  87. Sun, Y.; ten Hove, H.A.; Qiu, J.-W. Serpulidae (Annelida: Polychaeta) from Hong Kong. Zootaxa 2012, 3424, 1–42. [Google Scholar] [CrossRef] [Green Version]
  88. Golovan, O.A.; Błażewicz, M.; Brandt, A.; Jażdżewska, A.; Jóźwiak, P.; Lavrenteva, A.V.; Malyutina, M.V.; Petryashov, V.V.; Riehl, T.; Sattarova, V.V. Diversity and distribution of peracarid crustaceans (Malacostraca) from the abyss adjacent to the Kuril-Kamchatka Trench. Mar. Biodivers. 2019, 49, 1343–1360. [Google Scholar] [CrossRef]
  89. Murina, G.V. Geographical distribution of marine worms of the phylum Sipuncula in the world ocean. Zool. Zh. 1971, 50, 184–192. [Google Scholar]
  90. Murina, G.V. Novye taksony morskikh chervei sipunkulid roda Golfingia. Zool. Zh. 1975, 54, 1085–1089. [Google Scholar]
  91. Murina, G.V. Morskie chervy sipunkulidy arkticheskikh i boreal’nykh vod Evrazii. Oprediteli Po Faune SSSR 1977, 111. Available online: https://agris.fao.org/agris-search/search.do?recordID=US201300379732 (accessed on 4 November 2021).
  92. Maiorova, A.S.; Adrianov, A.V. Deep-sea sipunculans (Sipuncula) of the northwestern Pacific. Russ. J. Mar. Biol. 2017, 43, 181–189. [Google Scholar] [CrossRef]
  93. Chaudhary, C.; Saeedi, H.; Costello, M.J. Marine Species Richness Is Bimodal with Latitude: A Reply to Fernandez and Marques. Trends Ecol. Evol. 2017, 32, 234–237. [Google Scholar] [CrossRef]
  94. Angel, M.; Gage, J.; Tyler, P. Deep-Sea Biology: A Natural History of Organisms at the Deep-Sea Floor. J. Anim. Ecol. 1991, 61, 233. [Google Scholar] [CrossRef]
  95. Fernández-Romero, A.; Moreira, J.; Guerra-García, J.M. Marinas: An overlooked habitat for exploring the relation among polychaete assemblages and environmental factors. Mar. Pollut. Bull. 2019, 138, 584–597. [Google Scholar] [CrossRef]
  96. Dafforn, K.A.; Kelaher, B.P.; Simpson, S.L.; Coleman, M.A.; Hutchings, P.A.; Clark, G.F.; Knott, N.A.; Doblin, M.A.; Johnston, E.L. Polychaete Richness and Abundance Enhanced in Anthropogenically Modified Estuaries Despite High Concentrations of Toxic Contaminants. PLoS ONE 2013, 8, e77018. [Google Scholar] [CrossRef] [Green Version]
  97. Arvanitidis, C.; Koutsoubas, D.; Dounas, C.; Eleftheriou, A. Annelid fauna of a Mediterranean lagoon (Gialova Lagoon, south-west Greece): Community structure in a severely fluctuating environment. J. Mar. Biol. Assoc. United Kingd. 1999, 79, 849–856. [Google Scholar] [CrossRef]
  98. Campanyà-Llovet, N.; Snelgrove, P.V.; Parrish, C.C. Rethinking the importance of food quality in marine benthic food webs. Prog. Oceanogr. 2017, 156, 240–251. [Google Scholar] [CrossRef]
  99. Boyd, P.W.; Jickells, T.; Law, C.S.; Blain, S.; Boyle, E.A.; Buesseler, K.O.; Coale, K.H.; Cullen, J.J.; de Baar, H.J.W.; Follows, M.; et al. Mesoscale Iron Enrichment Experiments 1993-2005: Synthesis and Future Directions. Science 2007, 315, 612–617. [Google Scholar] [CrossRef] [Green Version]
  100. De Baar, H.J.W.; de Jong, J.; Bakker, D.; Löscher, B.M.; Veth, C.; Bathmann, U.; Smetacek, V. Importance of iron for plankton blooms and carbon dioxide drawdown in the Southern Ocean. Nature 1995, 373, 412–415. [Google Scholar] [CrossRef]
  101. Glover, A.G. Abyssal Polychaete Assemblages along Latitudinal Gradients of Productivity in the Equatorial Pacific and North Atlantic Oceans. Ph.D. Thesis, University of Southampton, Southampton, UK, 2000. [Google Scholar]
  102. Neal, L.; Hardy, S.L.M.; Smith, C.R.; Glover, A.G. Polychaete species diversity on the West Antarctic Peninsula deep continental shelf. Mar. Ecol. Prog. Ser. 2011, 428, 119–134. [Google Scholar] [CrossRef] [Green Version]
  103. Ambrose, W.G., Jr.; Renaud, P.E.; Cochrane, S.K.J.; Denisenko, S.G.; Skardhamar, J. Polychaete diveristy patterns on two Artic shelves: Impacts of ice and primary production? Zoosymposia 2009, 2, 457–485. [Google Scholar] [CrossRef] [Green Version]
  104. Rogers, A.D. The role of oceanic oxygen minima in generating biodiversity in the deep sea. Deep Sea Reserach II Top. Stud. Oceanogr. 2000, 47, 119–148. [Google Scholar] [CrossRef]
  105. Jayaraj, K.A.; Jayalakshmi, K.V.; Saraladevi, K. Influence of environmental properties on macrobenthos in the northwest Indian shelf. Environ. Monit. Assess. 2007, 127, 459–475. [Google Scholar] [CrossRef] [Green Version]
  106. Llanso, R.J.; Diaz, R.J. Tolerance to low dissolved oxygen by the tubicolous polychaete Loimia medusa. J. Mar. Biol. Assoc. United Kingd. 1994, 74, 143–148. [Google Scholar] [CrossRef]
  107. Lamont, P.A.; Gage, J.D. Morphological responses of macrobenthic polychaetes to low oxygen on the Oman continental slope, NW Arabian Sea. Deep Sea Res. Part II 2000, 47, 9–24. [Google Scholar] [CrossRef]
  108. Levin, L.A.; Etter, R.J.; Rex, M.A.; Gooday, A.J.; Smith, C.R.; Pineda, J.; Stuart, C.T.; Hessler, R.R.; Pawson, D. Environmental Influences on Regional Deep-Sea Species Diversity. Annu. Rev. Ecol. Syst. 2001, 32, 51–93. [Google Scholar] [CrossRef] [Green Version]
  109. Muniz, P.; Pires, A.M.S. Polychaete associations in a subtropical environment (São Sebastião Channel, Brazil): A structural analysis. Mar. Ecol. 2000, 21, 145–160. [Google Scholar] [CrossRef]
  110. Musale, A.S.; Desai, D.V. Distribution and abundance of macrobenthic polychaetes along the South Indian coast. Environ. Monit. Assess. 2011, 178, 423–436. [Google Scholar] [CrossRef]
  111. Halpin, P.N.; Read, A.J.; Fujioka, E.; Best, B.D.; Donnely, B.; Hazen, L.J.; Kot, C.; Urian, K.; LaBrecque, E.; Dimatteo, A.; et al. OBIS-SEAMAP: The world data center for marine mammal, sea bird, and sea turtle distributions. Oceanography 2009, 22, 104–115. Available online: http://www.jstor.org/stable/24860963 (accessed on 4 November 2021). [CrossRef]
  112. Bosch, S.; Tyberghein, L.; Deneudt, K.; Hernandez, F.; de Clerck, O. In search of relevant predictors for marine species distribution modelling using the MarineSpeed benchmark dataset. Divers. Distrib. 2018, 24, 144–157. [Google Scholar] [CrossRef] [Green Version]
  113. Coro, G.; Magliozzi, C.; Berghe, E.V.; Bailly, N.; Ellenbroek, A.; Pagano, P. Estimating absence locations of marine species from data of scientific surveys in OBIS. Ecol. Model. 2016, 323, 61–76. [Google Scholar] [CrossRef]
  114. Ready, J.; Kaschner, K.; South, A.B.; Eastwood, P.D.; Rees, T.; Rius, J.; Agbayani, E.; Kullander, S.; Froese, R. Predicting the distributions of marine organisms at the global scale. Ecol. Model. 2010, 221, 467–478. [Google Scholar] [CrossRef]
Figure 1. Map of the study region in the Northwest Pacific from latitudes 0–65° and longitudes 100–180°. BS = Bering Sea, SO = Sea of Okhotsk, SJ = Sea of Japan, ECS = East China Sea, SCS = South China Sea, PS = Philippine Sea.
Diversity 15 00557 g001
Figure 2. Taxa distribution in the Northwest Pacific within the polychaete (A) and sipunculan (B) dataset. The pie charts show the composition of polychaete orders, as well as the infraclass Scolecida (31,114 records), and sipunculan families (690 records) occurring within the dataset as a percentage. Records that were not identified beyond the family level are listed under NA.
Diversity 15 00557 g002
Figure 3. (A) Sampling effort (number of distribution records), (B) gamma species richness (number of species) and (C) ES50 (estimated species richness) for both Polychaeta and Sipuncula per 5° latitudinal band in the Northwest Pacific. The x-axes in (A,B) are logarithmic.
Diversity 15 00557 g003
Figure 4. Violin plot representing the latitudinal distribution of polychaete records for each order across the Northwest Pacific. All plots have the same maximum width, making comparisons of density across the orders impossible. The white dots indicate the median.
Diversity 15 00557 g004
Figure 5. Violin plot representing the latitudinal distribution of Sipuncula records for five families across the Northwest Pacific. All plots have the same maximum width making comparisons of density across the families impossible. The white dots indicate the median.
Diversity 15 00557 g005
Figure 6. Rarefaction curves of Polychaeta (A) and Sipuncula (B) gamma species richness across 5°-latitudinal bands. The tags at the tip of the curve indicate the latitudinal band. Curves reaching an asymptote indicate that the latitudinal band has been mostly sampled and only a few species remain unknown.
Diversity 15 00557 g006
Figure 7. Distribution and diversity of Polychaeta and Sipuncula in the Northwest Pacific. (A) Sampling effort (number of distribution records), (B) alpha species richness (number of species), and (C) ES50 (expected number of species) of benthic polychaetes and sipunculans in the NWP per 700,000 km2 hexagons. Empty hexagons had zero values.
Diversity 15 00557 g007
Figure 8. (A) Sampling effort (number of distribution records), (B) gamma species richness (number of species) and (C) ES50 (estimated species richness) for both Polychaeta and Sipuncula per 500 m depth intervals in the Northwest Pacific. The water depth was based on the maximum depth indicated by GEBCO. The x-axes in (A,B) are logarithmic.
Diversity 15 00557 g008
Figure 9. Correlation matrix of biodiversity parameters and environmental factors in the Northwest Pacific for Polychaeta and Sipuncula, with the 5% confidence value. The color red indicates a strong negative correlation, while blue indicates a strong positive correlation. We used ORACLE layers for the environmental factors and ran a Spearman correlation analysis between them and biodiversity parameters from the 700,000 km2 hexagons: the alpha species richness (number of species), the sampling effort (number of occurrence records) and the estimated species richness (ES50).
Diversity 15 00557 g009
Disclaimer/Publisher’s Note: The statements, opinions and data contained in all publications are solely those of the individual author(s) and contributor(s) and not of MDPI and/or the editor(s). MDPI and/or the editor(s) disclaim responsibility for any injury to people or property resulting from any ideas, methods, instructions or products referred to in the content.

