
Scale-Dependent Spatial Ecology of Paleotropical Leaf Litter Ants (Hymenoptera: Formicidae)
1
Department of Biological Sciences, Missouri University of Science and Technology, Rolla, MO 65409, USA
2
Huck Institutes of the Life Sciences, Pennsylvania State University, State College, PA 16802, USA
*
Author to whom correspondence should be addressed.
Diversity 2023, 15(4), 494; https://doi.org/10.3390/d15040494
Submission received: 15 February 2023
/
Revised: 17 March 2023
/
Accepted: 20 March 2023
/
Published: 27 March 2023
(This article belongs to the Special Issue Monitoring of Insect Biodiversity Loss)
Abstract
:The grain for which an observer conducts a study is an important determinant of its outcome. Studies of ants have considered spatial grains spanning from single meters to entire forest ecosystems and found patterns related to nutrient availability, leaf litter depth, disturbance, and forest composition. Here, we examine a Bornean leaf litter ant community at small (1–4 m) and large (50–250 m) spatial scales and consider the differences in community structure using structured 1 m2 quadrats sampled via leaf litter sifting and Berlese extraction. We found that small-scale patterns in ant abundance and richness did not spatially autocorrelate within a plot until >1.5 m. Leaf litter characteristics, forest stand characteristics and sampling season were homogenous among our sites, suggesting that macro-scale stand variables are not largely regulating the small spatial scale ant communities: These may be driven by microclimate, competition, niche space, nutrient available, microclimatic conditions, or other localized effects. Further experimental work is needed to elicit causal mechanisms.
1. Introduction
Environmental gradients and spatial dynamics influence species distributions and community composition at multiple scales [1], and “ecological patterns and processes are characteristically scale-dependent” [2]. Gradients in temperature and elevation [3], climate [4], abundance of sympatric colonies [5], and disturbance [6] shape ant metacommunities (metacommunity = set of interacting communities connected by dispersing species [7]) at various scales. However, ant metacommunity dynamics are most commonly examined at forest-stand or site scales and less commonly at small scales, despite known high variation in abundance and species richness at the small scale, and despite the fact that environmental heterogeneity at both the local and landscape scale structures local ant communities [8]. Supporting this, Kaspari found that densities of litter ants vary 10–20-fold at the 1-m2 scale in neotropical forests [9].
Ant species appear to distribute randomly across vertical environmental gradients in tropical forests; however, abundant species segregate into patchy mosaics [10]. Ant mosaics occur when competition between species results in patchworks of mutually exclusive territories: Ant mosaics are documented in tropical forest canopies [11], but less evidence exists for high interspecific competition in leaf litter ants [12]. Thus, resource availability, not competition, is thought to be the likely driver of tropical leaf litter metacommunities [9,13]. Patchy distribution of ground-dwelling ants [13,14] may be explained by leaf litter physical (e.g., moisture, leaf shape, temperature) or chemical (e.g., compounds present in leaf tissues, state of decomposition) characteristics, local topography [15], resource availability [15,16], and vegetation structure and composition [17]. Theunis and colleagues found that leaf litter ant species distribution shows a periodic spatial structure related to interspecific competition at small scales (<10 m), but that at larger scales (>50 m), environmental factors aggregated colonies of species that responded favorably to those factors [12]. The small-scale patterns that drive ant diversity may have large implications for the larger ecosystem, since leaf litter ants comprise 45–50% of all leaf litter macroinvertebrates [18] and engage with their environment at multiple trophic levels [19].
The grain at which observations are made for an ecological study has the potential to influence its outcome. While other studies [12,15] have considered spatial questions of grain (the finest level of spatial detail observable [20]) and extent (maximum area of consideration [20]), we found no literature that addressed the smallest spatial scales (immediate adjacency) of variance, despite its importance for overall community structure and dynamics. Herein, we examined patterns in spatial distribution and variance of ant communities at the 1 m (small) and >50 m (large) scales. Specifically, we examined the effect of distance on the composition, similarity, and richness of ant communities across short (1–4 m) and long (50 m) distances.
2. Materials and Methods
2.1. Study Site
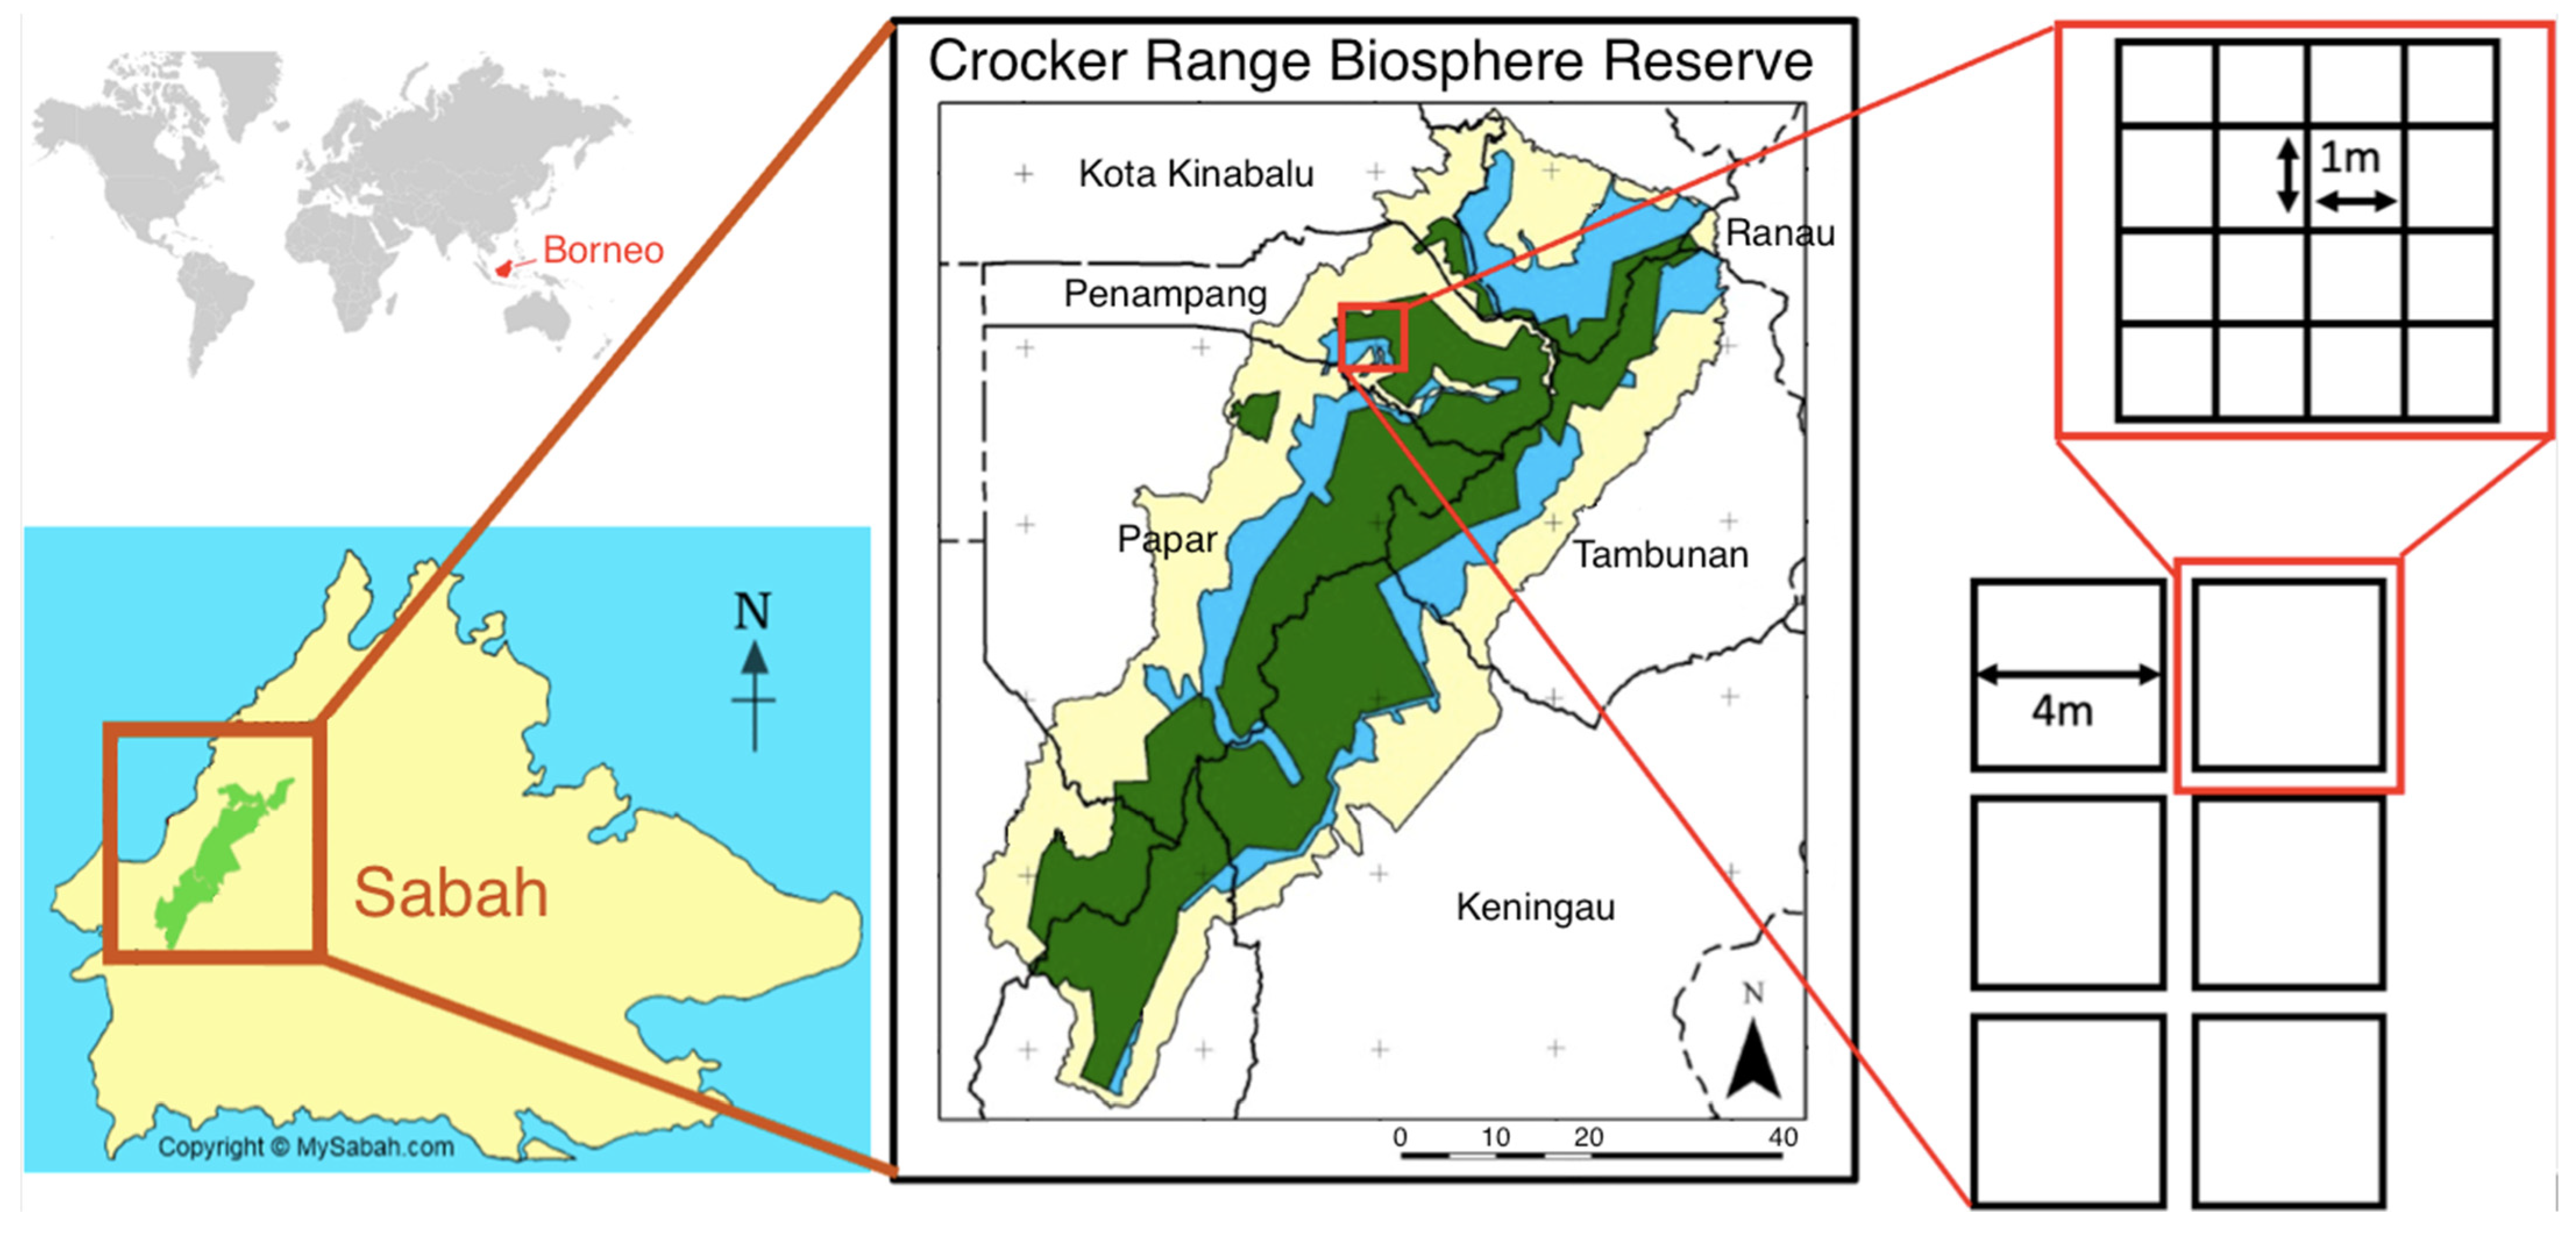
Sampling was conducted from June to July 2019 at the Crocker Range Biosphere Reserve, Sabah, Malaysian Borneo (5°51′23.9″ N, 116°08′15.9″ E). The Crocker Range Biosphere Reserve was designated an UNESCO Man and Biosphere (MAB) Reserve in 2014. MAB sites are characterized by three protection zones: core, buffer, and transition. Core areas (144,492 hectares) are those in which very limited human activities are permitted, ecotourism is restricted, and forest product harvesting is forbidden. Buffer areas (60,313 hectares) are those areas that protect core forest reserves from encroachment by transitional and agricultural sites. Buffer forests allow higher rates of ecotourism and limited harvesting of forest products. Transition sites are agriculturally developed and human-inhabited. The land use types in these areas do not support comparisons with core and buffer forests for leaf litter arthropods; thus, they were excluded from this analysis. The Crocker Range core and buffer forests are home to approximately 400 distinct ecological communities. We restricted the spatial extent of our sites to minimize sampling multiple forest communities. A complete description of the study area can be found in Yoh et al., (2020) [21].
2.2. Field Methods
We sampled leaf litter ant communities at twelve forest plots (six core sites, six buffer sites) in June and July 2019 (dry season). Each plot was characterized by percent canopy cover, canopy height, size of largest local trees (cm, height, and circumference at breast height, then converted to diameter at breast height), distance among trees, size of largest rotting logs (cm, circumference), abundance and size class of lianas, and abundance and size class of standing vegetation. Each plot was separated by >50 m and consisted of 16 (1 m × 1 m) quadrats (n = 192 quadrats). Quadrats were placed immediately adjacent to one another such that all 16 quadrats were contained in a 4 m × 4 m grid (16 m2). Plot locations were chosen randomly with consideration of sampling ease (Figure 1).
Ants were sampled within each plot between 10:00–16:00 h in fair weather using Berlese extraction [22]. All quadrats within a plot were sampled a single time on a given day for a total of 192 samples. Quadrat sampling order and sampler were haphazardly selected. Leaf litter depth was measured to the nearest 1 cm by inserting a wire vertically through the litter to mineral soil at four haphazardly selected locations within each quadrat. Leaf litter depth was then averaged for each individual quadrat. We collected all leaf litter and biological material within a plot down to mineral soil and separated the coarse material from the fine leaf fragments and arthropods in a 1 cm mesh litter sifter [23]. Siftate was stored in linen bags for <4 h, then placed in passive hanging Berlese funnels for 48 h.
Collected ants were stored in 70% ethanol, sorted, counted, pointed, and identified to genus using published global and regional keys [24,25,26]. Identifying to genus served as the most efficient way to assess community composition and ecological patterns [27]. Voucher specimens were deposited in the entomological collection at the Institute for Tropical Biology and Conservation at the Universiti Malaysia Sabah, Kota Kinabalu.
2.3. Data Analysis
We calculated Jaccard similarity coefficients among all quadrats and among quadrats within plots as a measurement of evenness and measured quadrat distance as a continuous variable representing linear distance between individual pairs of quadrat centers. We compared evenness among quadrats nested within plots using a least squares model. We compared evenness, genus richness, and abundance among plots using a standard least squares model. We compared differences (the absolute value of the difference between values) in genus richness and ant abundance among quadrat distances within plots using a nested least squares model. We used a standard least squares model to test the effects of litter depth and its interaction with plots on ant genus richness and abundance (independent of one another).
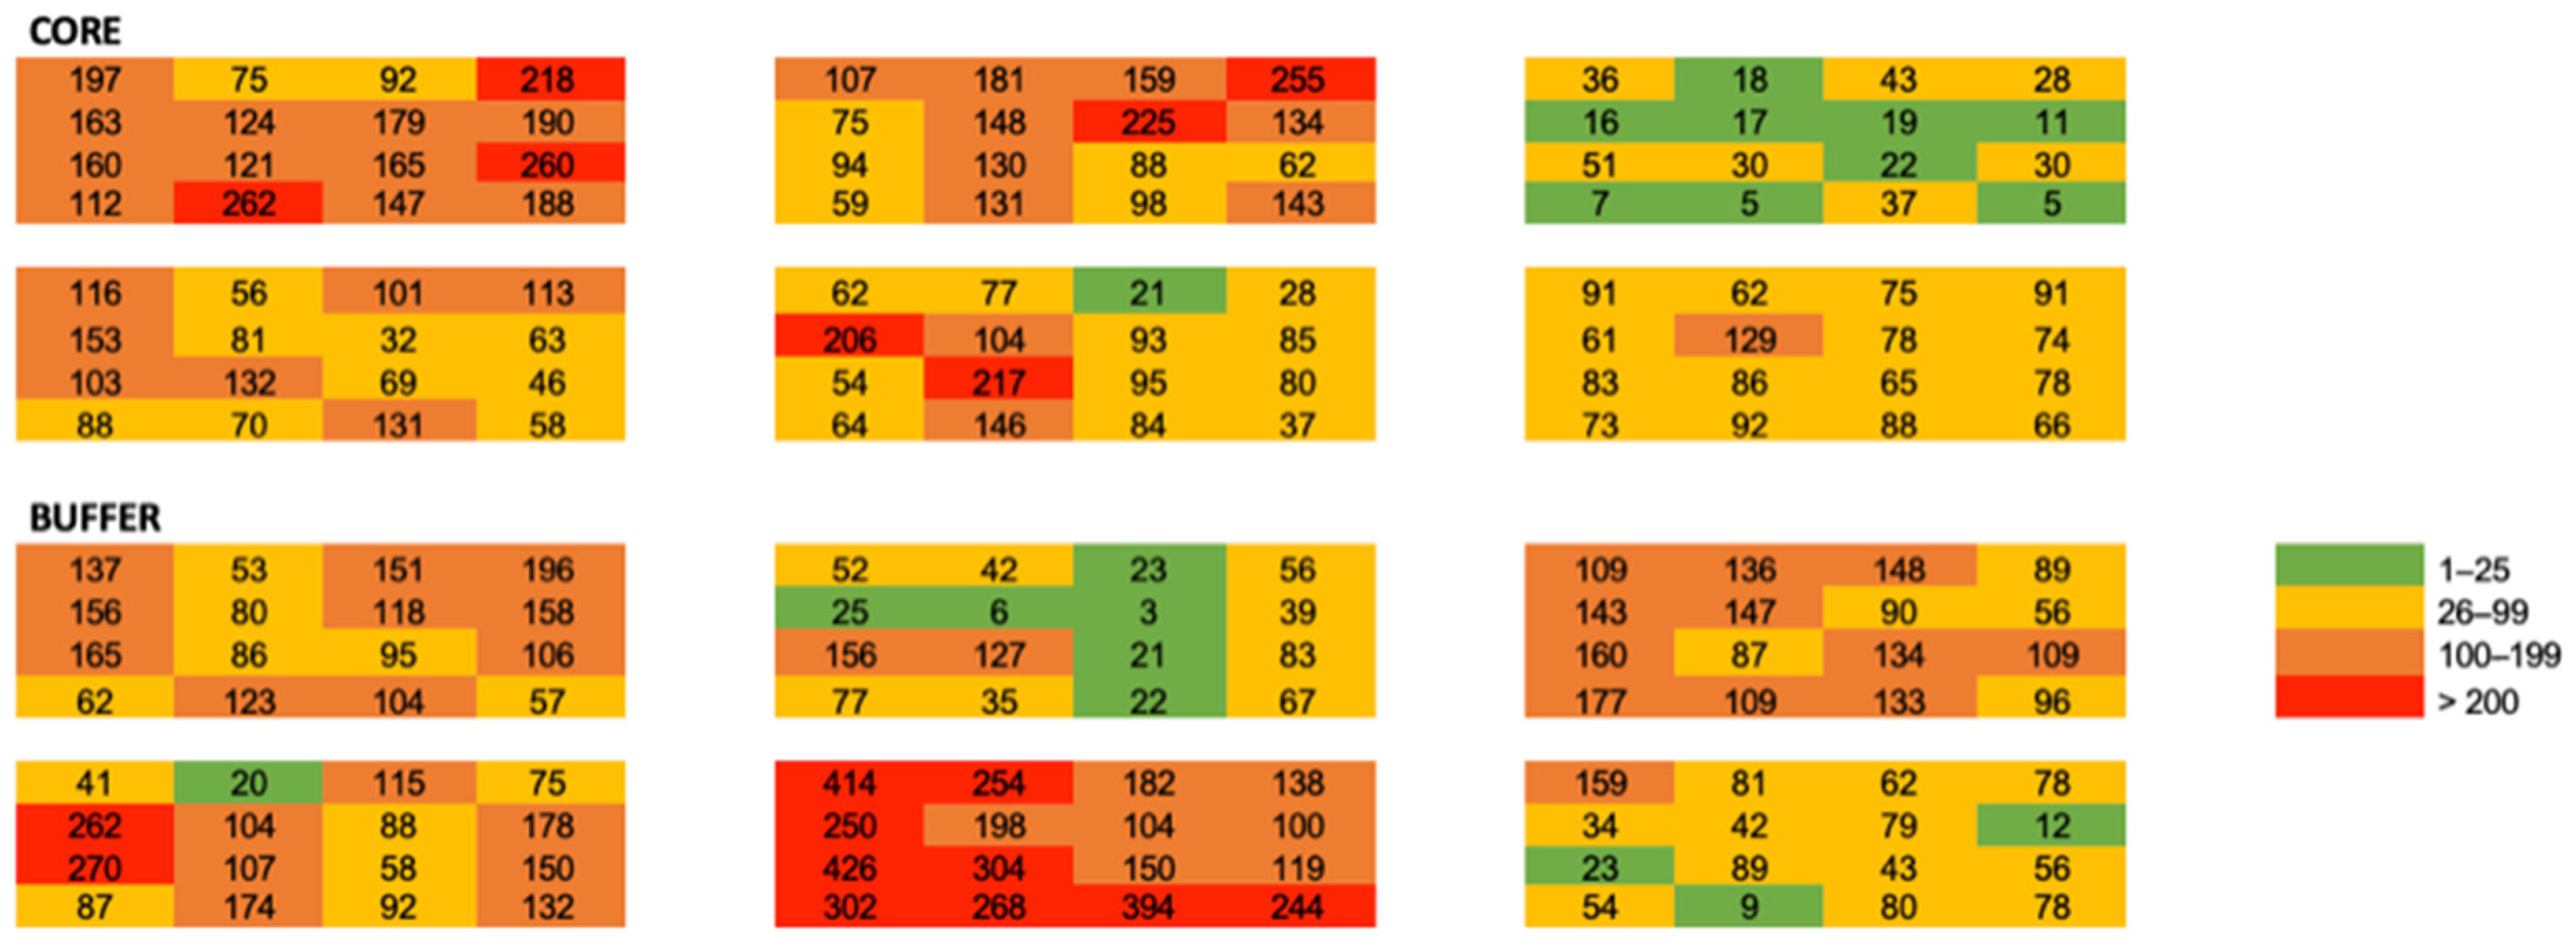
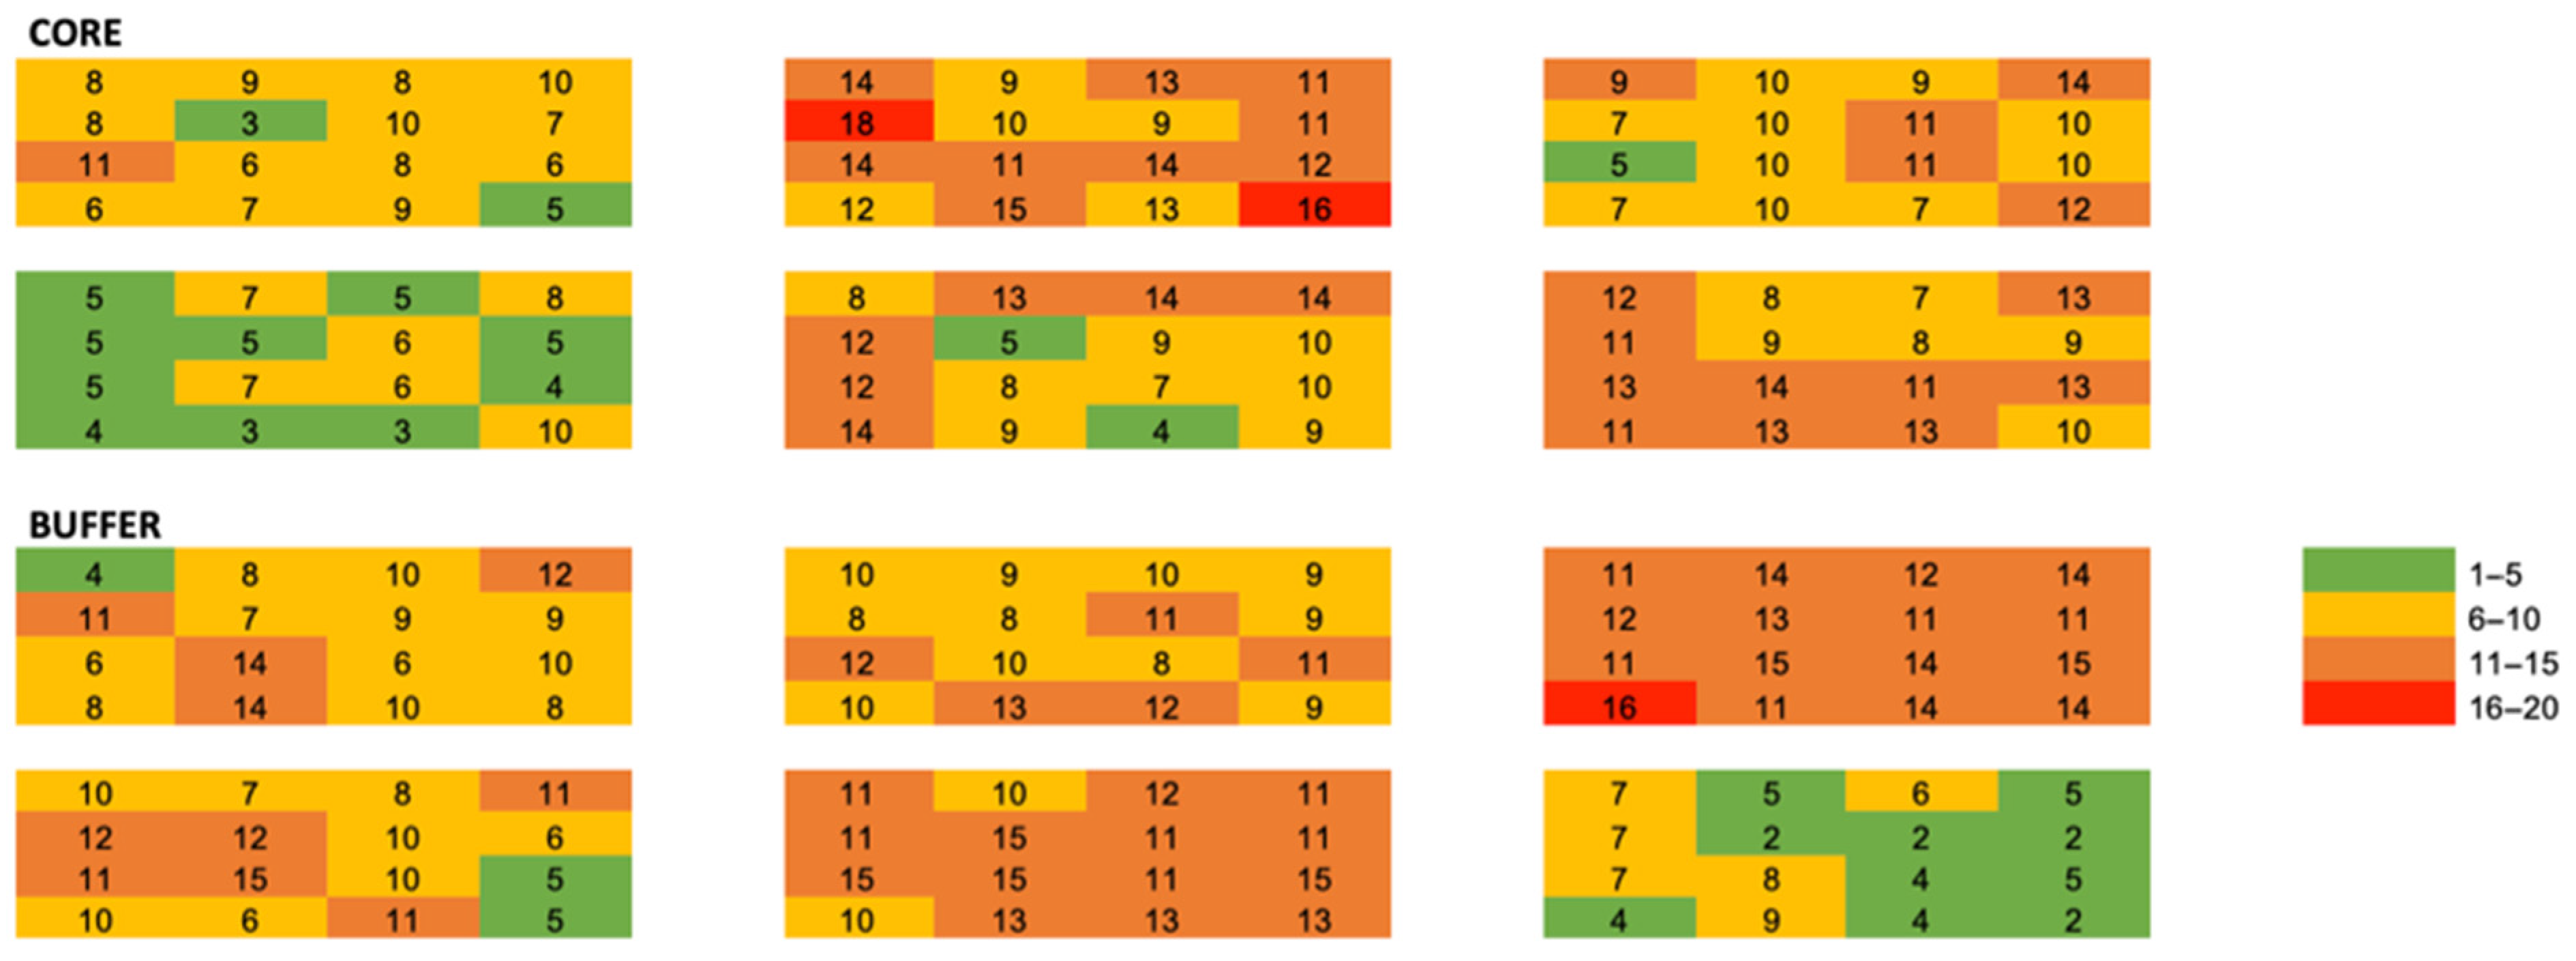
We applied uniformity tests to quadrats within plots to compare community metrics among quadrats within plots. We used mixed models to examine the effect of quadrat position within plots on leaf litter depth, ant abundance, and ant genus richness. We used a spatial repeated structure and fit six spatial models (spherical, Gaussian, exponential, power, and best fit with anisotropic and nugget effects) to our data. The best fit model was selected comparing AICc among all plots and selecting the lowest values. We generated semivariograms by plotting distance (x) against semivariance (y) for ant abundance and ant genus richness for all quadrats within plots and averaged semivariance, sill, range, and nugget among quadrats resulting in mean values with standard errors for each plot. We visualized genus-level abundance and richness using a heat map where red represents higher abundance and green represents lower abundance. Abundance categories are consistent among genera to allow for inter-genus comparisons. Finally, we visualized Shannon diversity across all local-scale plots using the same heat map.
We regressed relevant community metrics against leaf litter depth and leaf litter surface temperature independently and calculated linear fit using R2 values. We also regressed ant abundance and genus richness and calculated fit using an R2 value. We calculated relative abundance for all genera and subfamilies as the number of individuals counted in that genus or subfamily divided by the total number of ants collected.
Forest plot characteristics were compared among plots using multivariate analyses of variance (MANOVA, alpha = 0.05). Cumulative ant genus richness was compared between core and buffer forest using incidence-based sample accumulation curves [28] generated by the program EstimateS. The curves illustrate how the number of genera captured compares to the number of genera that are likely present at a site based on the number of new genera added per sample. All analyses were conducted in EstimateS [29], JMP 2019, SAS 2019, and Excel (Microsoft Office 2019).
3. Results
We collected a total of 20,657 ants representing 61 genera and 9 subfamilies during this study, representing approximately 95% of the genera present in the community based on estimates from sample accumulation curves (asymptote Core = 53, Buffer = 58; Figure 2). The number of ant genera found in a sample increased linearly with ant abundance across all samples (n = 192, R2 = 0.65). Core forests housed 50 genera, and buffer forests were home to 54 genera; 42 genera were found in both zones (Table 1). We found no relationship between litter surface temperature and ant abundance (R2 < 0.01) or ant genera richness (R2 = 0.03). Leaf litter depth correlated with ant genera richness (R2 = 0.16), but less with ant abundance (R2 = 0.05). Ant genus richness and abundance correlated (R2 = 0.39). Stand-level forest characteristics did not significantly vary among plots (p > 0.05 for all characteristics measured).
We found no difference in genus richness between core and buffer forests (p = 0.21; mean genus richness per quadrat: core = 9.27, buffer = 9.87). Among quadrats nested within plots, we observed no difference in genus richness (p = 0.1030). We observed a difference in total ant abundance between core and buffer forests (p = 0.008, MS = 39,016.5. F = 7.1875. p = 0.008. Core mean = 93.3 ants per quadrat. Buffer mean = 123.18 ants per quadrat). We also observed differences in ant abundance among quadrats nested within plots (F = 2.08, DF = 36, p = 0.0013) and among plots (p < 0.0001, MS = 51,913.5. F = 18.7129. p < 0.0001. Range: 23.44–240.44, Figure S1).
Small Scale Spatial Ecology
Taxonomic similarity was highly variable among plots and quadrat distances nested within plots (p < 0.0001, F = 5.16, DF = 11) and showed no relationship to distance (R2 = 0.02). Spatial spherical models showed best fit for distances between quadrats within plots. At short distances, quadrats did show spatial autocorrelation (mean range among all plots = 1.27 m, SE = 0.109; Table S1); however, for all plots, at distances greater than 1.5 m, quadrats were not spatially autocorrelated. There was no observable pattern in distance-decay of similarity within plots and no linear correlation between distance between plots and the similarity of ant assemblages (Jaccard similarity coefficient, R2 = 0.0207).
4. Discussion
We found that ant genus richness was similar between core and buffer sites, and ant abundance varied between the two, with the highest ant abundance in buffer sites. Additionally, we found that small-scale patterns in ant abundance did not spatially autocorrelate. Thus, our results demonstrate that large-scale patterns in ant abundance may not mirror those at smaller spatial scales; however, both are predictably patchy [17].
The effects of large-scale forest disturbances on ant communities have been well characterized in tropical ecosystems [30,31,32]). Fewer studies have examined smaller-scale persistent disturbances, such as low impact trail systems or long-term research plots such as those present in the MAB buffer zones, and their impacts on ant communities. The small-scale studies that do exist generally find negative associations (e.g., Mohamed et al., 2019, hiking trails [33]; Barber 2015, hiking trails [34]) or no effect (Kwon 2015, roads [35]). Ant abundance can respond positively to human presence [36], possibly because of novel or more abundant resources, which may help explain the increase in ant abundance observed in this study. Known drivers of semi-local (<10 m scale) ant distribution and abundance patterns include land use patterns [37], leaf litter characteristics [38], seasonal trends [39], forest stand characteristics, and resource availability [40].
Leaf litter characteristics, forest stand characteristics and sampling season were homogenous among our sites, suggesting that macro-scale stand variables are not largely regulating the small spatial scale ant communities: These may be driven by microclimate, competition, niche space, nutrient availability, microclimatic conditions, or other localized effects. Very less is known about how communities function at this scale; however, work by Xing et al., (2022) [41] found that ant species turnover is higher in horizontal space than in vertical space. While these effects can be species-specific [42], we observed that the total ant abundance decayed rapidly with distance (Figure 3 and Figure 4).
Within a subfamily, we observed multiple genera that were often found in only core and only buffer forests (Table 1). In particular, Strumigenys, Nylanderia, and Loweriella were highly abundant in buffer forests as compared to core forests. The genus Nylanderia is known from a single species in Borneo (N. kraepelini Forel, 1905) [43], but is a well-known invader in other systems [44]. Likewise, Loweriella is a monotypic genus found only in Borneo (L. boltoni Shattuck, 1992). A study by Rubiana et al., (2015) found that the genus occurred in disturbed forests [45]. Borneo is the epicenter of Strumigenys diversity with 97 recorded species, and the genus has at least 24 species that are known to occur outside their native range [46].
Locally rare genera were likely to be found in core forests than in buffer forests, and locally abundant genera were more likely to be found in the buffer forests. Rare species are the first to become locally extinct as a result of human disturbance [47]. We found locally rare species that occurred exclusively in both core and buffer forests. Our results may be a product of undersampling, high degrees of patchiness, or human disturbance in both zones. From a conservation management perspective, our study provides support for the continued application of zonation models in the Crocker Range MAB site. Given the similarity of the buffer and core forests, the high degree of overlap in genus composition, and the positive numerical response of ants to increased human presence, our study lends support to this model as an effective way to maintain biodiversity in ant communities at MAB sites, and it provides support for the assertion that low impact human use of forests can coexist with sustainable models of biodiversity conservation, though caution is warranted in overextrapolation of this result. Our study is limited in its short sampling time and small sample size. We sampled a relatively small spatial area of the entire MAB reserve. Ant abundance has limitations in its usefulness as a metric of community diversity, given that ants are central-place foragers, and abundance can be skewed by nest location [2]. Nonetheless, abundance may be interpreted as a surrogate for local ant activity and provide important information about the site’s nutrient and microclimatic conditions.
We encourage future studies in the region that continue to examine ant and leaf litter fauna in the Crocker Range, which is an understudied taxon in the region. Ecological, life history behavioral, and basic science studies are lacking for many of the ants known from the site. Future studies should also consider the impacts of large-scale forest management strategies for the MAB site and sustainable economic activities that can be created in the buffer zone.
Supplementary Materials
The following supporting information can be downloaded at: https://www.mdpi.com/article/10.3390/d15040494/s1. Table S1: Spatial autocorrelation in ant abundance occurs at scales > 1.5 m in all plots; Figure S1: Ant abundance (number of individuals) among all plots (16 m2). X = quadrat. Y = number of ants present. Sites connected by a letter are not significantly different (alpha = 0.05). Bars represent standard error.
Author Contributions
R.V. obtained financial support. R.V. and T.S. designed the project. R.V., T.S. and L.G. prepared project logistics and supplies. T.S and L.G. conducted field data collection. L.G. and T.S. completed most ant identification. R.V. and L.G. performed data analysis. R.V. and L.G. wrote the manuscript. All authors have read and agreed to the published version of the manuscript.
Funding
This research was funded by NSF-IRES, grant number 1658711.
Institutional Review Board Statement
Not applicable.
Data Availability Statement
Data are available from the corresponding author upon request.
Acknowledgments
We thank T. Kingston, M. Farmer, S. Fritts, K. Yusah, A. Mahyudin, A. Troutman, K. Fitzgerald, S. Hajar, and the staff of the Crocker Range National Park for their contributions to data collection and fieldwork. Texas Tech University and the Missouri University of Science and Technology Opportunities for Undergraduate Research Experience program supported student and project costs. The Universiti Malaysia Sabah supported logistics and field travel. J. McCoy and N. Winterburg coordinated logistics and kept the whole operation running: We could not have done any of this without them.
Conflicts of Interest
The authors declare no conflict of interest.
References
- Liu, C.; Dudley, K.L.; Xu, Z.-H.; Economo, E.P. Mountain metacommunities: Climate and spatial connectivity shape ant diversity in a complex landscape. Ecography 2018, 41, 101–112. [Google Scholar] [CrossRef]
- Andersen, A.N. Using ants as bioindicators: Multiscale issues in ant community ecology. Conserv. Ecol. 1997, 1, 8. [Google Scholar] [CrossRef] [Green Version]
- Sanders, N.J.; Lessard, J.P.; Fitzpatrick, M.C.; Dunn, R.R. Temperature, but not productivity or geometry, predicts elevation diversity gradients in ants across spatial grains. Glob. Ecol. Biogeogr. 2007, 16, 640–649. [Google Scholar] [CrossRef]
- Kaspari, M.; Yuan, M.; Alonso, L. Spatial grain and the causes of regional diversity gradients in ants. Am. Nat. 2003, 161, 459–477. [Google Scholar] [CrossRef] [PubMed]
- Gordon, D.M.; Kulig, A.W. Founding, foraging, and fighting: Colony size and the spatial distribution of harvester ant nests. Ecology 1996, 77, 2393–2409. [Google Scholar] [CrossRef]
- Verble, R.M.; Yanoviak, S.P. Short-term effects of prescribed burning on ant (Hymenoptera: Formicidae) assemblages in Ozark forests. Ann. Entomol. Soc. Am. 2013, 100, 198–203. [Google Scholar] [CrossRef] [Green Version]
- Leibold, M.A.; Holyoak, M.; Mouquet, N.; Amarasekare, P.; Chase, J.M.; Hoopes, M.F.; Holt, R.D.; Shurin, J.B.; Law, R.; Tilman, D.; et al. The metacommunity concept: A framework for multi-scale community ecology. Ecol. Lett. 2004, 7, 601–613. [Google Scholar] [CrossRef]
- Spiesman, B.J.; Cumming, G.S. Communities in context: The influences of multiscale environmental variation on local ant community structure. Landsc. Ecol. 2008, 23, 313–325. [Google Scholar] [CrossRef]
- Kaspari, M. Testing resource-based models of patchiness in four neotropical litter ant assemblages. Oikos 1996, 76, 443–454. [Google Scholar] [CrossRef]
- Law, S.J.; Parr, C. Numerically dominant species drive patterns in resource use along a vertical gradient in tropical ant assemblages. Biotropica 2019, 52, 101–112. [Google Scholar] [CrossRef]
- Yusah, K.M.; Foster, W.A.; Reynolds, G.; Fayle, T.M. Ant mosaics in Bornean primary rain forest high canopy depend on spatial scale, time of day, and sampling method. PeerJ 2018, 6, e4231. [Google Scholar] [CrossRef] [PubMed] [Green Version]
- Thenuis, L.; Gilbert, M.; Roisin, Y.; Leponce, M. Spatial structure of litter-dwelling ant distribution in a subtropical dry forest. Insectes Sociaux 2005, 52, 366–377. [Google Scholar] [CrossRef]
- Kaspari, M. Litter ant patchiness at the 1-m2 scale: Disturbance dynamics in three Neotropical forests. Oecologia 1996, 107, 265–273. [Google Scholar] [CrossRef]
- Leponce, M.; Theunis, L.; Delabie, J.H.C.; Roisin, Y. Scale dependence of diversity measures in a leaf-litter ant assemblage. Ecography 2004, 27, 253–267. [Google Scholar] [CrossRef]
- Vasconcelos, H.L.; Macedo, A.C.C.; Vilhena, J.M.S. Influence of topography on the distribution of ground-dwelling ants in an Amazonian Forest. Stud. Neotrop. Fauna Environ. 2003, 38, 115–124. [Google Scholar] [CrossRef]
- Herbers, J.M. Community structure in north temperate ants: Temporal and spatial variation. Oecologia 1989, 81, 201–211. [Google Scholar] [CrossRef] [PubMed]
- Wilson, E.O. Patchy distributions of ant species in New Guinea rain forests. Psyche 1958, 65, 26–38. [Google Scholar] [CrossRef] [Green Version]
- Bruhl, C.A. Leaf Litter Ant Communities in Tropical Lowland Rain Forests in Sabah, Malaysia: Effects of Forest Disturbance and Fragmentation. Ph.D. Thesis, Julius-Maximilians-Universität Würzburg, Würzburg, Germany, 2001. [Google Scholar]
- Holldobler, B.; Wilson, E.O. The Ants; Harvard University Press: Cambridge, MA, USA, 1990. [Google Scholar]
- Karl, J.W.; Maurer, B.A. Spatial dependence of predictions from image segmentation: A variogram-based method to determine appropriate scales for producing land-management information. Ecol. Inform. 2010, 5, 194–202. [Google Scholar] [CrossRef]
- Yoh, N.; Azhar, I.; Fitzgerald, K.V.; Yu, R.; Smith-Butler, T.; Mahyudin, A.; Kingston, T. Bat ensembles differ in response to use zones in a tropical biosphere reserve. Diversity 2020, 12, 60. [Google Scholar] [CrossRef] [Green Version]
- Southwood, T.R.E.; Brown, V.K.; Reader, P.M. The relationships of plant and insect diversities in succession. Biol. J. Linn. Soc. 1978, 12, 327–348. [Google Scholar] [CrossRef]
- Bestelmeyer, B.T.; Agosti, D.; Alonso, L.E.; Brandão, C.R.F.; Brown, W.L.; Delabie, J.H.C.; Silvestre, R. Field techniques for the study of ground dwelling ants. An overview, description, and evaluation. In Ants: Standard Methods for Measuring and Monitoring Biodiversity; Agosti, D., Majer, J.D., Alonso, L.E., Schultz, T.R., Eds.; Smithsonian Institution Press: Washington, DC, USA; London, UK, 2000; pp. 122–144. [Google Scholar]
- Bolton, B. Identification Guide to the Ant Genera of the World; Harvard University Press: Cambridge, MA, USA, 1995. [Google Scholar]
- Hashimoto, Y. Identification guide to the ant genera of Borneo. In Inventory & Collection: Total Protocol for Understanding of Biodiversity; International Union for Conservation of Nature: Fontainebleau, France, 2003; Chapter 9; pp. 89–162. [Google Scholar]
- General, D.M.; Alpert, G.D. A synoptic review of the ant genera (Hymenoptera: Formicidae) of the Philippines. Zookeys 2012, 1, 1–111. [Google Scholar] [CrossRef] [PubMed] [Green Version]
- Souza, J.L.P.; Baccaro, F.B.; Landeiro, V.L.; Franklin, E.; Magnusson, W.E.; Pequeno, P.A.C.L.; Fernandes, I.O. Taxonomic sufficiency and indicator taxa reduce sampling costs and increase monitoring effectiveness for ants. Divers. Distrib. 2016, 22, 111–122. [Google Scholar] [CrossRef]
- Colwell, R.K.; Mao, C.X.; Chang, J. Interpolating, extrapolating, and comparing incidence-based species accumulation curves. Ecology 2004, 85, 2717–2727. [Google Scholar] [CrossRef] [Green Version]
- Colwell, R.K. EstimateS: Statistical Estimation of Species Richness and Shared Species from Samples; Wiley: New York, NY, USA, 2013; Version 9. [Google Scholar]
- Eguchi, K.; Yamane, S. Species diversity of ants (Hymenoptera, Formicidae) in a lowland rainforest, Northwestern Borneo. New Entomol. 2003, 52, 2. [Google Scholar]
- Brühl, C.A.; Gunsalam, G.; Linsenmair, K.E. Stratification of ants (Hymenoptera, Formicidae) in a primary rain forest in Sabah, Borneo. J. Trop. Ecol. 1998, 14, 285–297. [Google Scholar] [CrossRef]
- Brühl, C.A.; Eltz, T. Fueling the biodiversity crisis: Species loss of ground-dwelling forest ants in oil palm plantations in Sabah, Malaysia (Borneo). Biodivers. Conserv. 2010, 19, 519–529. [Google Scholar] [CrossRef]
- Kamel, M.; Semida, F.; Moursy, M.; Kassem, H. Impact of hiking trail disturbance on ants’ diversity at Mount Sinai, St. Katherine protectorate, Egypt. J. Environ. Sci. 2019, 45, 37–56. [Google Scholar] [CrossRef] [Green Version]
- Barber, G.W. Ant (Hymenoptera: Formicidae) Assemblages in Three New York Pine Barrens and the Impacts of Hiking Trails. Master’s Thesis, University of Massachusetts Amherst, Amherst, MA, USA, 2015. [Google Scholar]
- Kwon, T.S. Ant assemblages along the Baekdudaegan Mountain Range in South Korea: Human roads and temperature niche. J. Asia-Pacific Biodivers. 2015, 8, 152–157. [Google Scholar] [CrossRef] [Green Version]
- Sanford, M.P.; Manley, P.N.; Murphy, D.D. Effects of urban development on ant communities: Implications for ecosystem services and management. Conserv. Biol. 2009, 23, 131–141. [Google Scholar] [CrossRef]
- Nakamura, A.; Catterall, C.P.; House, A.P.; Kitching, R.L.; Burwell, C.J. The use of ants and other soil and litter arthropods as bio-indicators of the impacts of rainforest clearing and subsequent land use. J. Insect Conserv. 2007, 11, 177–186. [Google Scholar] [CrossRef]
- Silva, P.S.; Bieber, A.G.; Corrêa, M.M.; Leal, I.R. Do leaf-litter attributes affect the richness of leaf-litter ants? Neotrop. Entomol. 2011, 40, 542–547. [Google Scholar] [PubMed]
- Levings, S.C. Seasonal, annual, and among-site variation in the ground ant community of a deciduous tropical forest: Some causes of patchy species distributions. Ecol. Monographs 1983, 53, 435–455. [Google Scholar] [CrossRef]
- Ribas, C.R.; Schoereder, J.H.; Pic, M.; Soares, S.M. Tree heterogeneity, resource availability, and larger scale processes regulating arboreal ant species richness. Austral Ecol. 2003, 28, 305–314. [Google Scholar] [CrossRef] [Green Version]
- Xing, S.; Hood, A.S.C.; Dial, R.J.; Fayle, T.M. Species turnover in ant assemblages is greater horizontally than vertically in the world’s tallest tropical forest. Ecol. Evol. 2022, 12, e9158. [Google Scholar] [CrossRef]
- Morlon, H.; Chuyong, G.; Condit, R.; Hubbell, S.; Kenfack, D.; Thomas, D.; Valencia, R.; Green, J.L. A general framework for the distance-decay of similarity in ecological communities. Ecol. Lett. 2008, 11, 904–917. [Google Scholar] [CrossRef] [Green Version]
- AntWiki: The Ants—Online. 2023. Available online: https://www.antwiki.org/wiki/Nylanderia#South_Pacific (accessed on 1 February 2023).
- Williams, J.L.; Lucky, A. Non-native and invasive Nylanderia crazy ants (Hymenoptera: Formicidae) of the world: Integrating genomics to enhance taxonomic preparedness. Ann. Entomol. Soc. Am. 2020, 113, 318–336. [Google Scholar] [CrossRef]
- Rubiana, R.; Rizali, A.; Denmead, L.H.; Alamsari, W.; Hidayat, P.; Pudjianto, H.D.; Clough, Y.; Tscharntke, T.; Buchori, D. Agricultural land use alters species composition but not species richness of ant communities. Asian Myrmecol. 2015, 7, 73–85. [Google Scholar]
- Hamer, M.T.; Marquis, A.D.; Guenard, B. Strumigenys perplexa (Smith, 1876) (Formicidae: Myrmicinae) a new exotic ant to Europe with establishment in Guernsey, Channel Islands. J. Hymenopt. Res. 2021, 83, 101–124. [Google Scholar] [CrossRef]
- Leitao, R.P.; Zuanon, J.; Villeger, S.; Williams, S.E.; Baraloto, C.; Fortunel, C.; Mendonca, F.P.; Mouillot, D. Rare species contribute disproportionately to the functional structure of species assemblages. Proc. R. Soc. B 2016, 283, 20160084. [Google Scholar] [CrossRef] [Green Version]
Figure 1.
Location of study site within the Crocker Range Biosphere Reserve, Sabah, Malaysia. The study site encompasses both the core and buffer forest (green and blue respectively; center panel). Within each of the core and buffer zones, six 16 m2 plots were established with 16−1 m2 quadrats within for a total of 12 plots and 192 quadrats.

Figure 2.
Genus accumulation curves for buffer and core forests. Our 16 plots capture approximately 95% of the genus-level ant diversity present in both core and buffer forests. Symbols represent the cumulative number of genera recorded as the cumulative number of plots increased.
Figure 2.
Genus accumulation curves for buffer and core forests. Our 16 plots capture approximately 95% of the genus-level ant diversity present in both core and buffer forests. Symbols represent the cumulative number of genera recorded as the cumulative number of plots increased.

Figure 3.
Heat map of total ant abundance among all plots and quadrats.

Figure 4.
Heat map of genus richness among all quadrats and plots. Values are absolute richness per quadrat.
Figure 4.
Heat map of genus richness among all quadrats and plots. Values are absolute richness per quadrat.


Table 1.
Relative abundance of all genera collected across all plots. RA = relative abundance. Values represented as proportions.
Table 1.
Relative abundance of all genera collected across all plots. RA = relative abundance. Values represented as proportions.
| Subfamily | Genus | Total Abundance | Genus RA | Subfamily RA | Genus Total Abundance Buffer | Genus Total Abundance Core |
|---|---|---|---|---|---|---|
| Amblyoponinae | Mystrium | 3 | <0.001 | 0.002 | 3 | 0 |
| Stigmatomma | 41 | <0.001 | 26 | 15 | ||
| Dolichoderinae | Dolichoderus | 2 | <0.001 | 0.063 | 0 | 2 |
| Loweriella | 454 | 0.022 | 409 | 45 | ||
| Dorylinae | Aenictus | 69 | 0.003 | 0.006 | 35 | 34 |
| Cerapachys | 7 | <0.001 | 7 | 0 | ||
| Lioponera | 18 | <0.001 | 0 | 18 | ||
| Parasycia | 26 | 0.001 | 16 | 10 | ||
| Ectatomminae | Gnamptogenys | 14 | <0.001 | <0.001 | 4 | 10 |
| Formicinae | Anaplolepis | 2 | <0.001 | 0.140 | 1 | 1 |
| Camponotus | 28 | 0.001 | 15 | 13 | ||
| Colobopsis | 2 | <0.001 | 0 | 2 | ||
| Echinopla | 2 | <0.001 | 2 | 0 | ||
| Euprenolepis | 2 | <0.001 | 0 | 2 | ||
| Myrmoteras | 167 | 0.008 | 119 | 48 | ||
| Nylanderia | 2486 | 0.120 | 1939 | 547 | ||
| Paraparatrachina | 13 | <0.001 | 2 | 11 | ||
| Polyrachis | 6 | <0.001 | 1 | 5 | ||
| Prenolepis | 93 | 0.004 | 93 | 0 | ||
| Pseudolasius | 29 | 0.001 | 29 | 0 | ||
| Leptanillinae | Leptanilla | 2 | <0.001 | <0.001 | 0 | 2 |
| Myrmicinae | Acanthomyrmex | 60 | 0.003 | 0.695 | 25 | 35 |
| Calyptomyrmex | 58 | 0.003 | 29 | 29 | ||
| Cardiocondyla | 34 | 0.002 | 26 | 8 | ||
| Carebara | 3537 | 0.171 | 1683 | 1854 | ||
| Cataulacus | 2 | <0.001 | 2 | 0 | ||
| Crematogaster | 50 | 0.002 | 2 | 48 | ||
| Eurhopalothrix | 12 | <0.001 | 0 | 12 | ||
| Lophomyrmex | 2932 | 0.142 | 1347 | 1585 | ||
| Lordomyrma | 13 | <0.001 | 7 | 6 | ||
| Mayriella | 322 | 0.016 | 233 | 89 | ||
| Meranoplus | 29 | 0.001 | 25 | 4 | ||
| Monomorium | 37 | 0.002 | 37 | 0 | ||
| Myrmecina | 114 | 0.006 | 35 | 79 | ||
| Myrmicaria | 309 | 0.015 | 0 | 309 | ||
| Pheidole | 4284 | 0.207 | 2374 | 1910 | ||
| Pristomyrmex | 65 | 0.003 | 31 | 34 | ||
| Proatta | 73 | 0.004 | 73 | 0 | ||
| Solenopsis | 77 | 0.004 | 4 | 73 | ||
| Strumigenys | 1154 | 0.056 | 970 | 184 | ||
| Syllophopsis | 81 | 0.004 | 40 | 41 | ||
| Tetramorium | 1018 | 0.049 | 537 | 481 | ||
| Vollenhovia | 92 | 0.004 | 40 | 52 | ||
| Vombisidris | 2 | <0.001 | 0 | 2 | ||
| Ponerinae | Anochetus | 28 | 0.001 | 0.096 | 21 | 7 |
| Brachyponera | 1235 | 0.060 | 765 | 470 | ||
| Cryptopone | 16 | <0.001 | 12 | 4 | ||
| Diacamma | 1 | <0.001 | 1 | 0 | ||
| Ectomomyrmex | 7 | <0.001 | 3 | 4 | ||
| Emeryopone | 1 | <0.001 | 1 | 0 | ||
| Harpagnathos | 2 | <0.001 | 2 | 0 | ||
| Hypoponera | 424 | 0.021 | 246 | 178 | ||
| Leptogenys | 64 | 0.003 | 44 | 20 | ||
| Mesoponera | 1 | <0.001 | 1 | 0 | ||
| Myopias | 32 | 0.002 | 26 | 6 | ||
| Odontomachus | 51 | 0.002 | 7 | 44 | ||
| Odontoponera | 59 | 0.003 | 39 | 20 | ||
| Ponera | 52 | 0.003 | 19 | 33 | ||
| Proceratiinae | Discothyrea | 11 | <0.001 | <0.001 | 5 | 6 |
| Probolomyrmex | 3 | <0.001 | 1 | 2 |
Disclaimer/Publisher’s Note: The statements, opinions and data contained in all publications are solely those of the individual author(s) and contributor(s) and not of MDPI and/or the editor(s). MDPI and/or the editor(s) disclaim responsibility for any injury to people or property resulting from any ideas, methods, instructions or products referred to in the content. |
© 2023 by the authors. Licensee MDPI, Basel, Switzerland. This article is an open access article distributed under the terms and conditions of the Creative Commons Attribution (CC BY) license (https://creativecommons.org/licenses/by/4.0/).
Share and Cite
MDPI and ACS Style
Germeroth, L.; Sumnicht, T.; Verble, R. Scale-Dependent Spatial Ecology of Paleotropical Leaf Litter Ants (Hymenoptera: Formicidae). Diversity 2023, 15, 494. https://doi.org/10.3390/d15040494
AMA Style
Germeroth L, Sumnicht T, Verble R. Scale-Dependent Spatial Ecology of Paleotropical Leaf Litter Ants (Hymenoptera: Formicidae). Diversity. 2023; 15(4):494. https://doi.org/10.3390/d15040494
Chicago/Turabian StyleGermeroth, Lillian, Theodore Sumnicht, and Robin Verble. 2023. "Scale-Dependent Spatial Ecology of Paleotropical Leaf Litter Ants (Hymenoptera: Formicidae)" Diversity 15, no. 4: 494. https://doi.org/10.3390/d15040494
Note that from the first issue of 2016, this journal uses article numbers instead of page numbers. See further details here.