Article

Assessing Effects of Multi-Scale Landscape Pattern and Habitats Attributes on Taxonomic and Functional Diversity of Urban River Birds

1
School of Design and Communication, Kunming University of Science and Technology, Kunming 650500, China
2
School of Ecology and Environmental Science, Yunnan University, Kunming 650500, China
*
Author to whom correspondence should be addressed.
Diversity 2023, 15(4), 486; https://doi.org/10.3390/d15040486
Submission received: 20 February 2023 / Revised: 13 March 2023 / Accepted: 16 March 2023 / Published: 25 March 2023
(This article belongs to the Special Issue Biodiversity and Human-Environment Interactions II)

Abstract

:
Several studies have revealed that urban rivers with relatively complete habitat structures can support a high level of biodiversity in urban areas. However, few studies have analyzed the impact of the plan, design, and management of multi-scale urban riverside green space on bird communities by assessing several aspects of diversity (e.g., taxonomic and functional). In this study, we explored bird community variation (taxonomic and functional) among three rivers (28 sampling sites) with different levels of human disturbance along the urban development gradient in Kunming, Yunnan Province, China, during an annual cycle. This study related bird species richness and functional diversity to environmental variables at three spatial scales: landscape metrics at two different landscape scales (500 and 100 m radius) and vegetation structure at patch scales (20 m radius). Using partial least squares regression (PLSR) and multiple linear regression, we found that bird species richness and functional diversity were strongly related to various landscape- and patch-level variables. Multiple linear regression models revealed that, compared with the richness influenced by explanatory variables on three spatial scales (500, 100, and 20 m), the functional diversity was significantly influenced by explanatory variables on the 100 and 20 m scales. Tree cover at the 20 m scale had significantly positive impacts on bird species richness and functional diversity. Forest land in the 100 m scale had a significantly positive effect on bird species richness and functional diversity, while construction land in the two landscape scales (the 500- and 100 m scales) had a significantly negative effect on species richness. Accordingly, we suggest that urban riverside green space should be planned and managed at multiple scales.

1. Introduction

Globally, urban land expansion causes the loss of natural habitat, the fragmentation of remaining natural areas, and the alteration of natural areas’ abiotic and biotic characteristics [1,2,3]. This has had and will continue to have a significant influence on biodiversity, both directly and indirectly [4]. On the one hand, biodiversity is an important part of any healthy ecosystem and is thus essential to the provision of ecosystem services [5]. On the other hand, urban biodiversity is crucial for human well-being because high biodiversity enables residents to enjoy nature in cities.
Several recent studies have focused on the analysis of the relationship between bird diversity and urban landscape patterns at different scales [6,7,8]. On the landscape scale, patch area, connectivity, and level of urbanization in the surrounding matrix were found to be the most important variables in explaining bird species diversity in urban areas [9,10,11]. Meanwhile, open features, especially open water, could be an important factor affecting bird diversity in forests in urban areas [12]. Bird distribution patterns in urban areas were strongly associated with habitat evenness, the largest patch index for woodland at the 400 m scale, and the contagion index at the 400 and 1000 m scales [13].
At the patch scale, attention was paid to management intensity and habitat characteristics, like the vertical heterogeneity of forest patches [10,14,15]. A study of bird communities and habitat vegetation composition in Shanghai’s urban park found that vegetation complexity and structure positively affected bird community composition [14]. Bird species richness was related not only to the amount of vegetation structure but also to whether the green space was cultivated or natural, and it was discovered that cultivated greenery leads to homogeneous bird communities in the urban landscape [15].
The appropriate way to quantify and enhance the function of urban green space as a wildlife habitat has been frequently mentioned. Many studies suggest that species diversity estimates based on landscape indicators should be multi-scaled [16,17,18]; however, there are few case studies, particularly on birds [19,20,21]. One of the reasons is that the statistical approaches required to manage these challenges are still being researched [17].
In recent years, several studies have focused on bird diversity in specific urban green spaces, such as streets, small parks, and backyards. A study analyzing the taxonomic, functional, and phylogenetic diversity of birds influenced by street design suggested minimizing paved road areas to boost bird diversity in streets [22]. The abundance of bird species in small urban parks may be predicted most accurately by two factors: the area of the park and the proportion of canopy cover [7]. A study explored the contribution of residential backyards to urban bird diversity, finding that backyards with the largest areas, tallest trees and bushes, and proximity to other green places increase species diversity [23].
Studies have revealed that the urbanization process impacted the decrease of bird functional diversity through biotic homogenization [24,25]. Functional diversity (FD) is a measure of the diversity of species traits found in communities that provides a link between species’ traits and how they influence ecosystem functions [26]. Taxonomic and functional diversity may respond differently to anthropogenic effects and therefore necessitate different conservation strategies.
Urban rivers are essential for preserving urban biodiversity and promoting the health of urban ecosystems [27,28]. Urban rivers have relatively complete habitat structures and are ecological corridors that support a high level of biodiversity and connect fragmented urban green space, reducing isolation, and thus maintaining urban biodiversity [29,30]. However, human activities change the form and function of urban river landscapes, such as buried, cut, and hardened rivers, and increase the surface coverage of roads and buildings [31,32]. This reduces the naturalness, variety, sustainability, and landscape quality of rivers, ultimately decreasing biodiversity [33]. Due to these challenges, researchers are becoming increasingly interested in urban river corridors and are paying attention to the relationship between river network connectivity and bird community structure [27]; the landscape-scale characteristics of suburban rivers impacting bird diversity [29]; and the impact of urban structure, combination of land use, and infrastructure on avian riparian habitat [34]. However, few studies have analyzed the impact of the plan, design, and management of multi-scale urban riverside green space on bird communities by assessing several facets of diversity, such as taxonomic and functional.
In this study, we explored bird community variation (taxonomic and functional) among the three rivers with different levels of human disturbance along the urban development gradient. This study related bird species richness and FD to environmental variables at three spatial scales: landscape metrics at two different landscape scales (500 and 100 m radius) and vegetation structure at patch scales (20 m radius).

2. Materials and Methods

2.1. Study Area

The research was conducted in Kunming, the capital of Yunnan Province, China (24°53′ N, 102°42′ E). Yunnan is well known for the Hengduan Mountains and the Yunnan–Guizhou Plateau, and it has the highest bird species richness in China, accounting for more than 60% of the country’s total [35,36]. Kunming is the largest city in Yunnan, located in the center of the Yunnan–Guizhou Plateau. It covers an area of 21,013 km2 and has a permanent population of 8.5 million people [37]. Kunming has a variety of vegetation types dominated by subtropical evergreen broad-leaved forest and coniferous-broad mixed forest [37], while the main urban area and its surroundings are primarily covered with artificial woods, secondary forests, and secondary bushes. The main urban area is developing around Dianchi Lake, which is expanding from north to south to encircle the lake. A dozen rivers flow through the city’s construction zone into Dianchi Lake, establishing ecological corridors for the city.
The bird survey was conducted in three major rivers (namely, the Panlong River, the Maliao River, and the Laoyu River) along the urban development gradient (Figure 1). We chose the typical riverside green spaces along each river that flows through the urban area to set up 28 sampling sites (Figure 1). The three rivers were found to be affected by human activity at different levels (the Panlong River—high-human disturbance rivers; the Maliao River—medium-human disturbance rivers; the Laoyu River—low-human disturbance rivers). The Panlong River running through the old city has a width of 12–20 m, and the green space is around 45–150 m wide (including the river surface). The revetment is concrete, and there are walkways and piazzas nearby the river revetment. The Maliao River is approximately 15–90 m wide, and the green space is around 100–160 m wide. The trees, such as Cinnamomum camphora and Ligustrum lucidum, are normally not tall, and there are soft revetments and several aquatic plants. The width of the Laoyu River is around 30–100 m, while the width of the green space is approximately 100–330 m. Large trees like Camptotheca acuminate and Taxodium distichum can be found, as well as a big area of lawn with low management intensity, few trails, and a high canopy density of trees (Figure 1).

2.2. Bird Survey

We conducted monthly bird surveys from March 2021 to February 2022 and obtained a total of 12 months of field data, covering both the breeding and non-breeding seasons. We surveyed between 7:00–10:00 and 15:00–18:00 on sunny days. Within a 100 m radius of the sampling sites, we identified and counted birds with the naked eye or binoculars over 10 min [38]. The sampling sites were at least 300–1000 m apart to assure each site’s independence. The nomenclature of species follows the BirdLife taxonomic checklist version 3.0 [39].

2.3. Functional Traits and Functional Diversity

To evaluate FD, birds’ functional traits were obtained using the EltonTraits database [40], which includes feeding habits, vertical foraging strata, and body mass. The EltonTraits database [40] provides the proportions for 10 food categories as well as proportions for 7 foraging strata (see Appendix B). To quantify functional diversity, we calculated the functional dispersion index (FDis) using the R package “FD”. The functional dispersion index is the mean distance of individual species to the community centroid of all species in trait space [41]. A higher value of FDis indicates a higher level of niche differentiation.

2.4. Landscape-Level Variables

We assessed landscape- and patch-level variables at three different spatial scales for each sampling site: 500 m, 100 m, and 20 m (Table 1). High-resolution satellite pictures were collected using Google Earth Pro, which has been extensively used in other studies [13,42,43], and land use data was extracted within a 500 m radius using ArcGIS 10.0 [44]. We identified six land cover variables: forest, open green space (lawn, weedy patch), aquatic plant, river, constructed land (impervious surface, excluding municipal roads), and road (municipal roads). Using the FRAGSTATS 2.4 program [45], we calculated three landscape indices: PLAND (percentage of coverage area), ED (edge density), and AREA MN (mean patch area) for each land cover type within a circle of radius 500 m and 100 m, respectively (Table 1).

2.5. Patch-Level Variables

Taking each sampling site as the center, we formed four perpendicular 20 m lines along which observation points were selected at 4 m intervals. The height profiles of foliage were determined using the 20 observation points [10,46]. Using a 4 m measuring stick as a visual reference, we recorded the presence or absence of leaves at heights of 0–0.5, 0.5–1, 1–2, 2–3, 3–4, 4–6, 6–8, 8–10, 10–12, 12–15, and >15 m at each observation point [10,47]. The observer (YD) visually assessed the proportion of litter layer cover within a 20 m radius around each sampling site [48,49].
We calculated the proportion of vegetation cover across each height range by dividing the number of points in each height range that have leaves by the total number of observation points in that height range [10]. We counted the number of points with leaves at each height range and used that number as individuals to compute the Shannon–Wiener index, which is the index of vertical heterogeneity of vegetation (Table 1) [10,50].

2.6. Statistical Analysis

We combined each set of 12 surveys into community data for each sampling site [15,51]. We then calculated the bird species richness, abundance, Shannon–Wiener index, and FDis in the annual cycle, breeding season, and non-breeding season, respectively. A one-way analysis of variance (ANOVA) and Tukey’s HSD post hoc test were used to examine differences in bird species richness, Shannon–Wiener index, and FDis among three urban river habitat types. The R packages “fundiversity” and “vegan” were used.
To assess the impact of habitat attributes on taxonomic and functional diversity of birds, we used species richness and FDis as dependent variables. We used the following variables as initial independent variables: 36 landscape-level variables (three landscape indices: PLAND, ED, and AREA MN for each land cover type in 100 and 500 m scales) and 13 patch-level variables in 20 m scales (see Table 1 for details). The number of predictor variables was higher than our observations, thus we needed to select important ones before the multiple regression analysis. When describing the impact of landscape structure on certain characteristics of biotic communities, it is hard to determine a priori which metrics should be selected to depict the various landscape structure components [52]. We used partial least squares regression (PLSR) to select a subset of the important predictors, after which we could apply multiple regression analysis [17,53].
Partial least squares regression is a linear regression approach that maximizes the covariance between the scores and the response, as well as calculates scores and residuals, by decomposing a matrix with predictors and a matrix with responses [54]. This approach is useful when there are more explanatory variables than observations and significant multicollinearity [53]. It has been applied in chemistry and ecology studies [55,56,57,58,59].
With the landscape- and patch-level variables as predictors and species richness and FDis as responses, we applied the PLSR using R 3.5.3 [60] and the package “mdatools” [61]. We used the function “vipscores” in the package “mdatools” to calculate the variable importance in the projection (VIP), which can be used to choose the most important predictors. See [62] for further information about VIP scores. We kept the predictors with VIP ≥ 1 to reduce the number of predictors and the possibility of collinearity so that we could proceed to the next steps for multiple regression analysis [62].
We constructed multiple linear regression using the predictor with VIP scores greater than 1 and no multiple collinearity to assess how landscape- and patch-level variables affected bird species richness and functional diversity. We performed multiple linear regression with no more than three predictors since the number of predictors has to be limited to one-tenth of the sample size to prevent overfitting [15,63]. For model selection, we applied information theoretic methods to calculate Akaike’s Information Criterion corrected (AICc) for small sample size [64]. We then calculated the Δ A I C c i = A I C c i min ( A I C c ) for the ith model and selected the models with ΔAICc < 2, which were considered to have the best fit [64]. To compute model coefficients, we applied model averaging to the selected models. We used the package “MuMIn” in R [65] for model selection and averaging.

3. Result

3.1. Species Diversity and Functional Diversity and Their Variation among Rivers

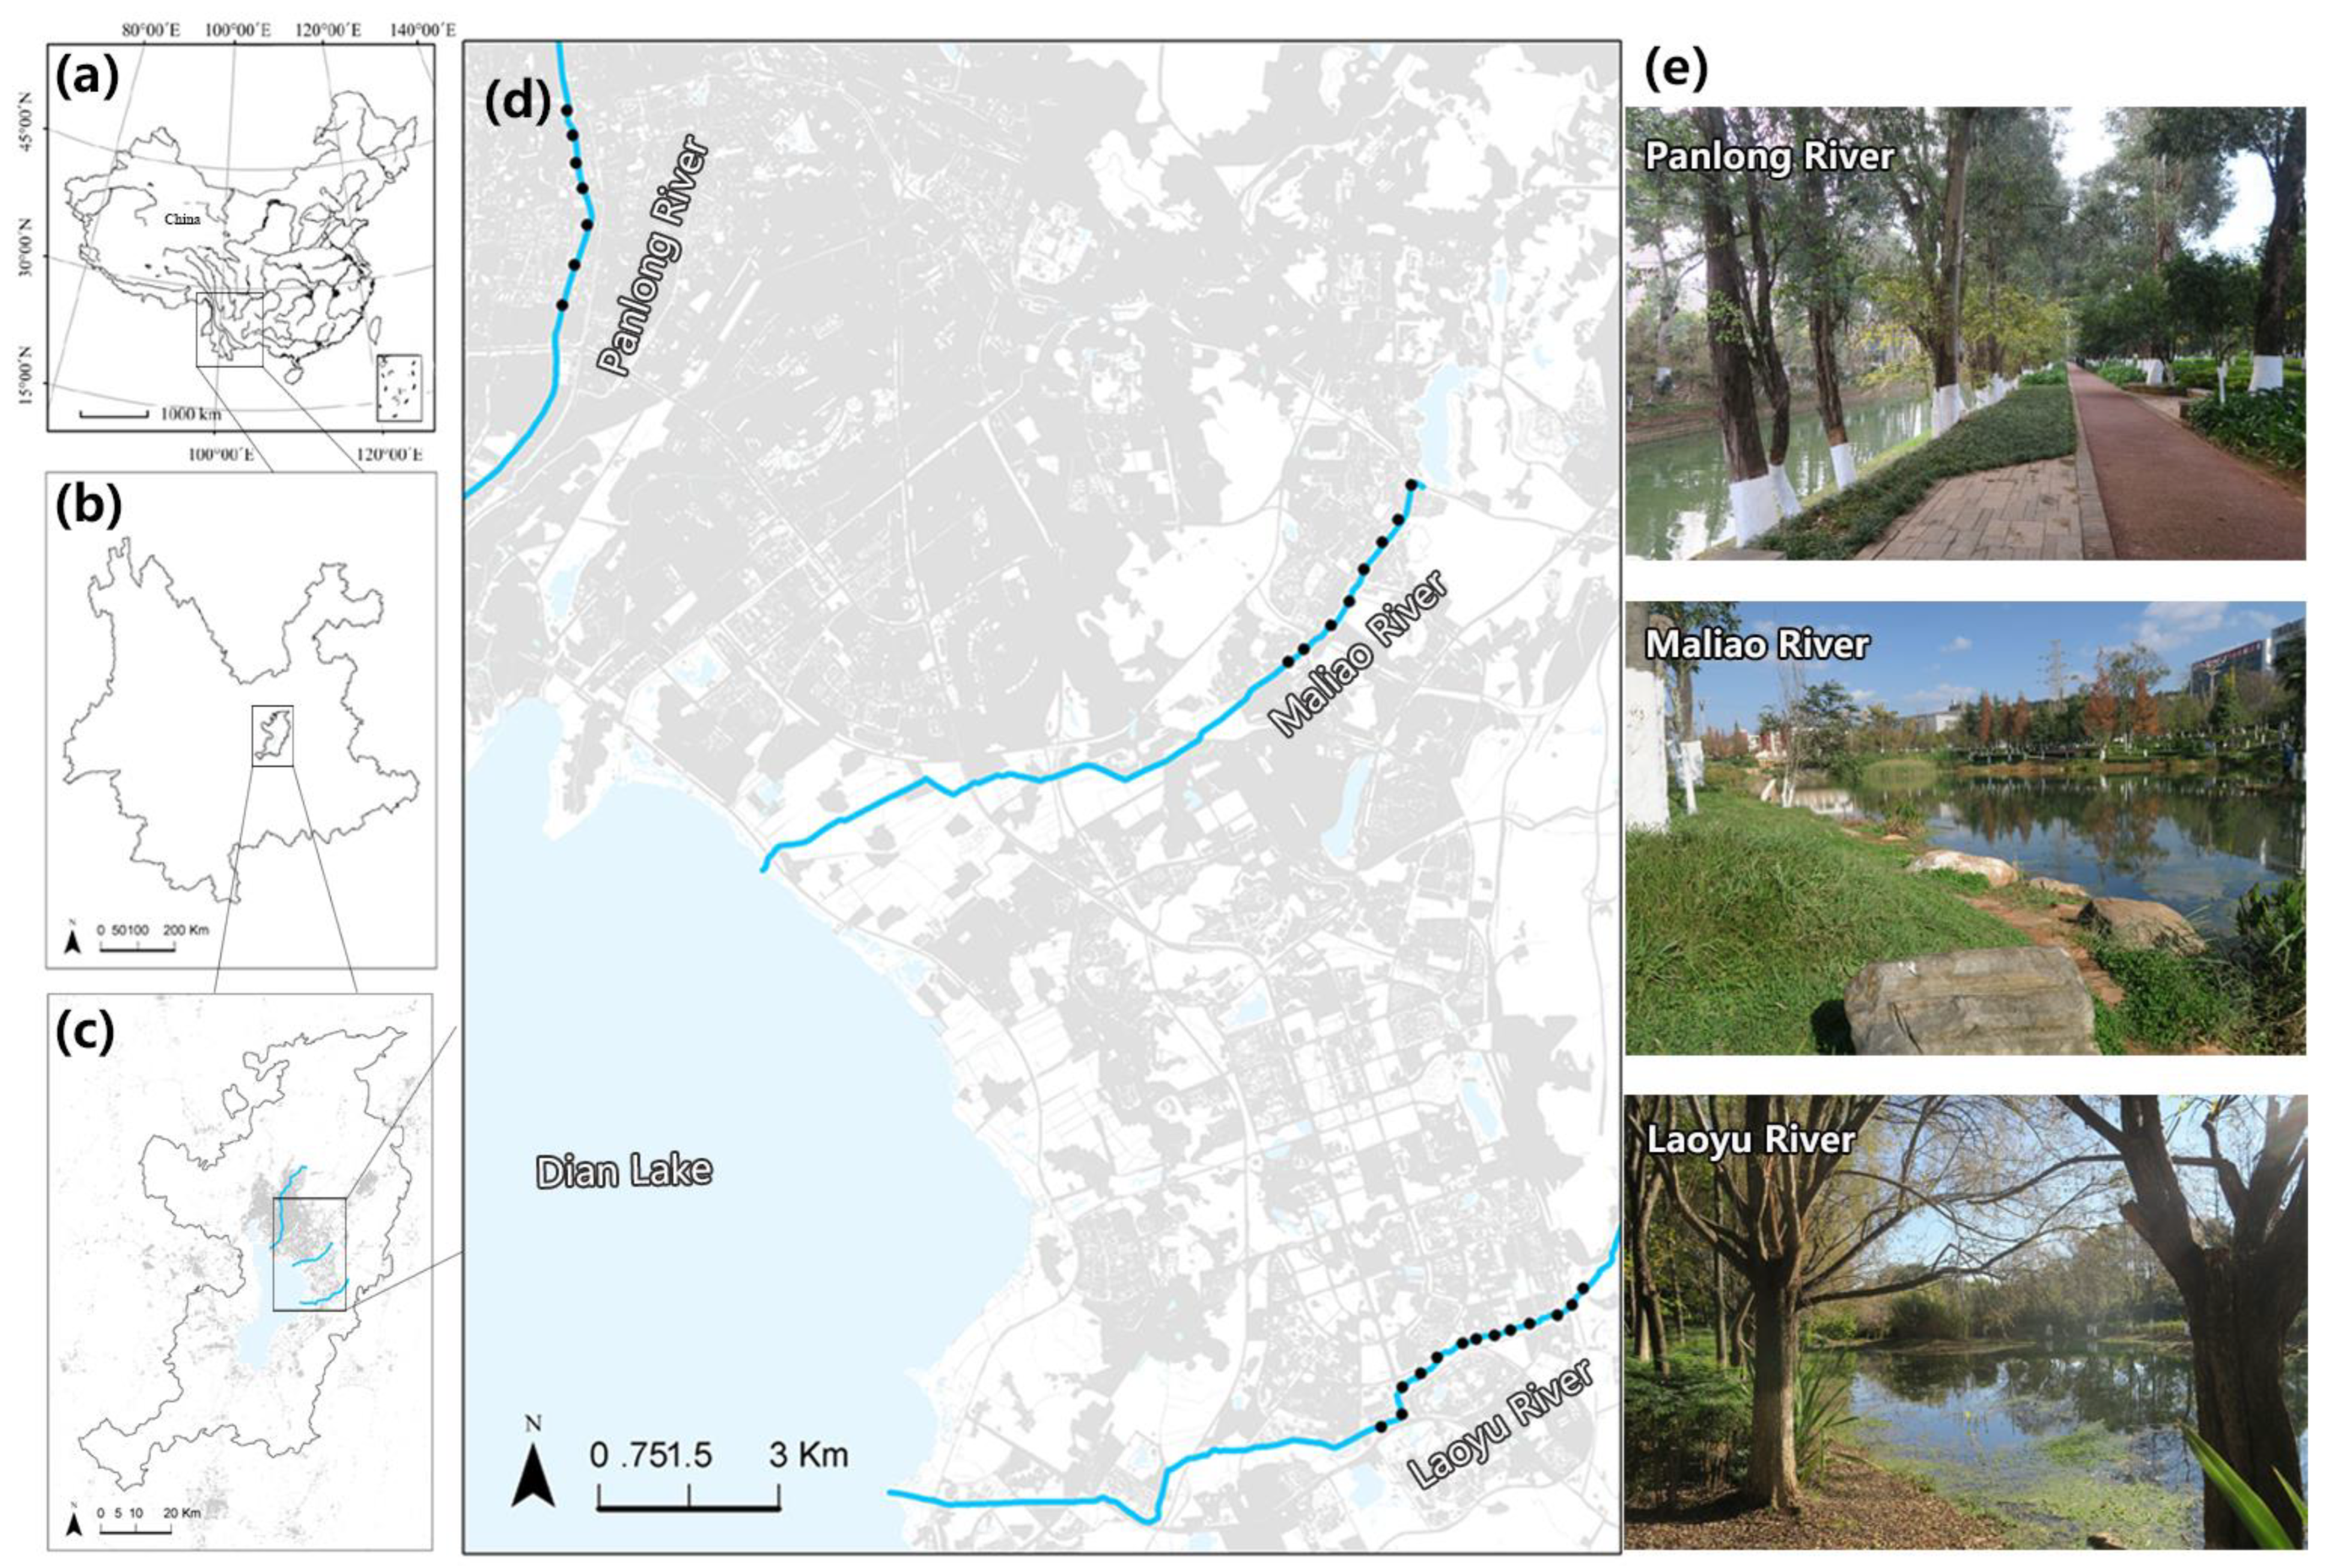
We recorded 71 species (3387 counts) from 34 families and 12 orders in 12 replicated surveys covering 28 sampling sites during the breeding and non-breeding seasons (see Appendix A). The bird species richness ranged from 11 to 32 (mean ± s.e. = 19.11 ± 1.05) for the different sites. The Panlong River (a high-human disturbance river) contained 38 species; the Maliao River (a medium-human disturbance river) contained 46 species; and the Laoyu River (a low-human disturbance river) contained 57 species. We recorded a total of 45 bird species in the breeding season and 63 species in the non-breeding season across all sampling sites in the three rivers (Figure 2). The range of species observed at each sampling site in the breeding season was between 7 and 21 (mean ± s.e. = 12.32 ± 0.67), while in the non-breeding season, the range was between 5 and 27 (mean ± s.e. = 14.00 ± 0.99). Meanwhile, Moran’s S from the spatial correlation analysis was not significant (p = 0.118), indicating that species richness was spatially independent.
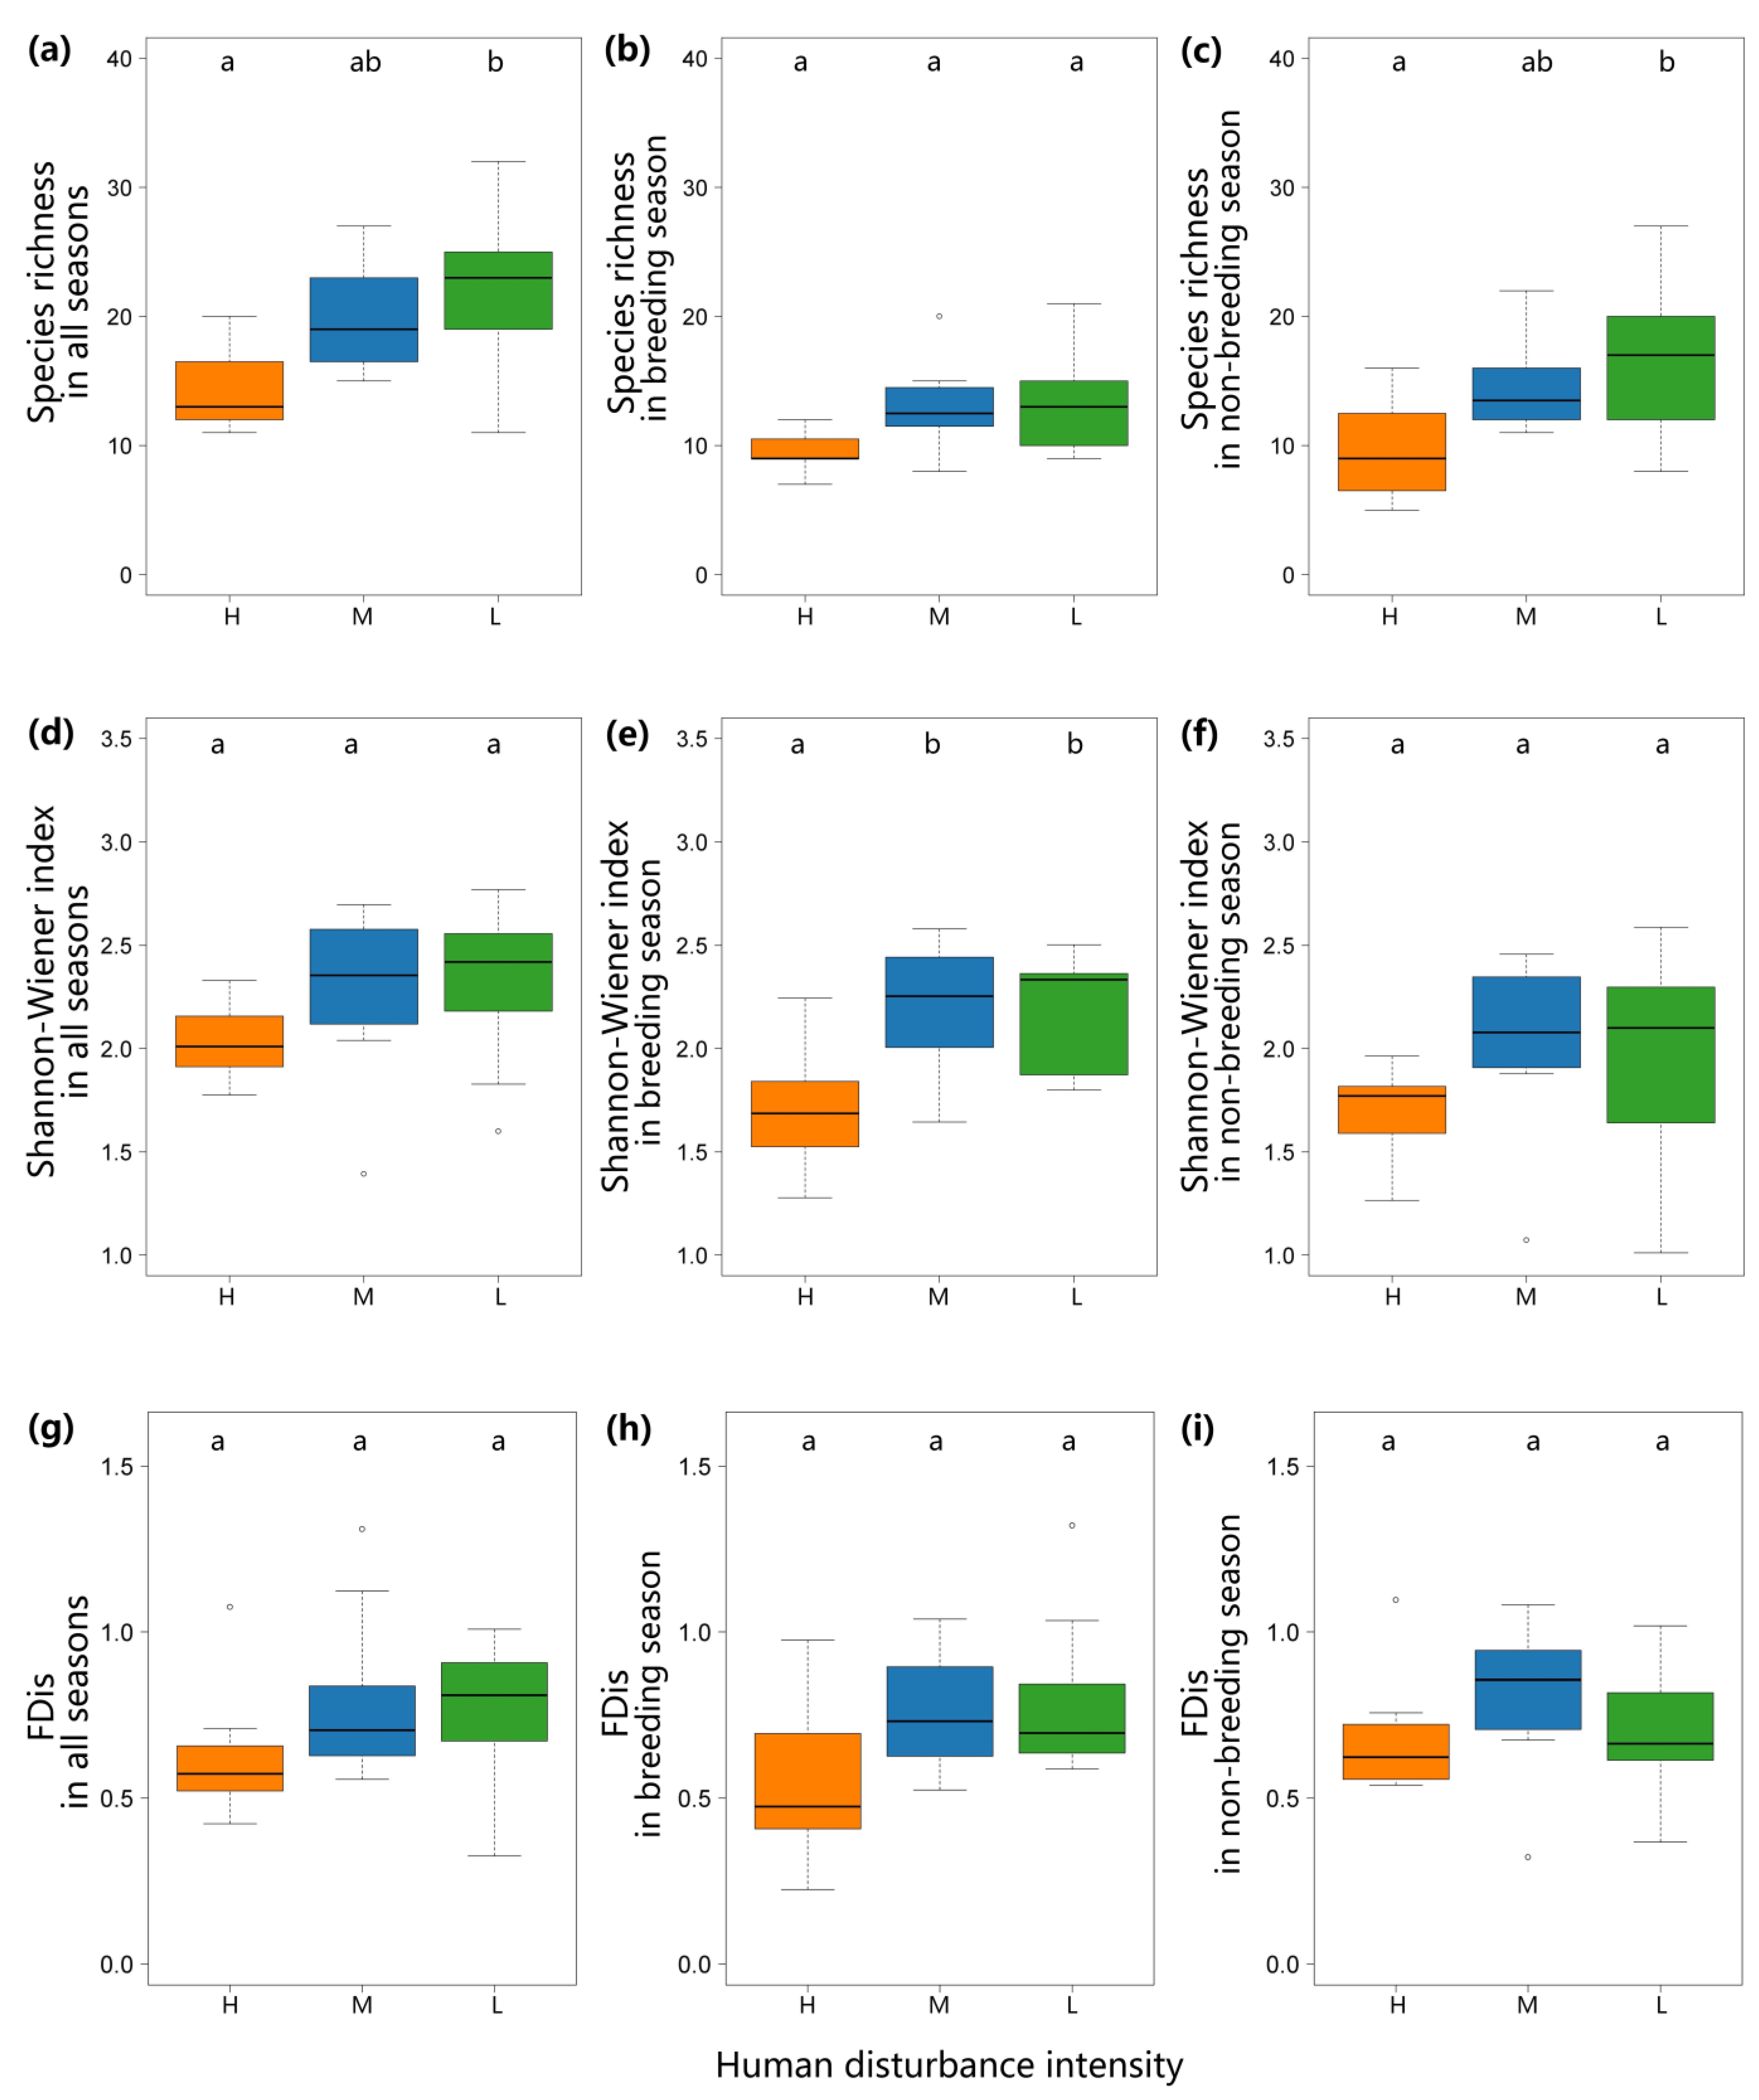
During both seasons, the bird species richness along the low-human disturbance river was highest, followed by the medium-human disturbance river and the high-human disturbance river. The degree of human disturbance had a significant effect on bird richness according to the analysis of the one-way ANOVA (Figure 2; F2,25 = 4.239, p = 0.026). Tukey’s HSD post hoc test revealed that the low-human disturbance river had a significantly higher bird richness than the high-human disturbance river (p = 0.022; Figure 2). The richness of the three types of rivers during the breeding season has no significant difference. In the non-breeding season, Tukey’s HSD post hoc test revealed that the low-human disturbance river had a significantly higher bird richness than the high-human disturbance river (p = 0.030; Figure 2).
Throughout the year and the non-breeding season of birds, the Shannon–Wiener index showed no significant difference. However, in the breeding season, low- and medium-human disturbance rivers had a significantly higher Shannon–Wiener index than the high-human disturbance river (p = 0.006, p = 0.009). There was no significant difference in FDis among the three types of rivers during the annual cycle, the breeding or non-breeding season.
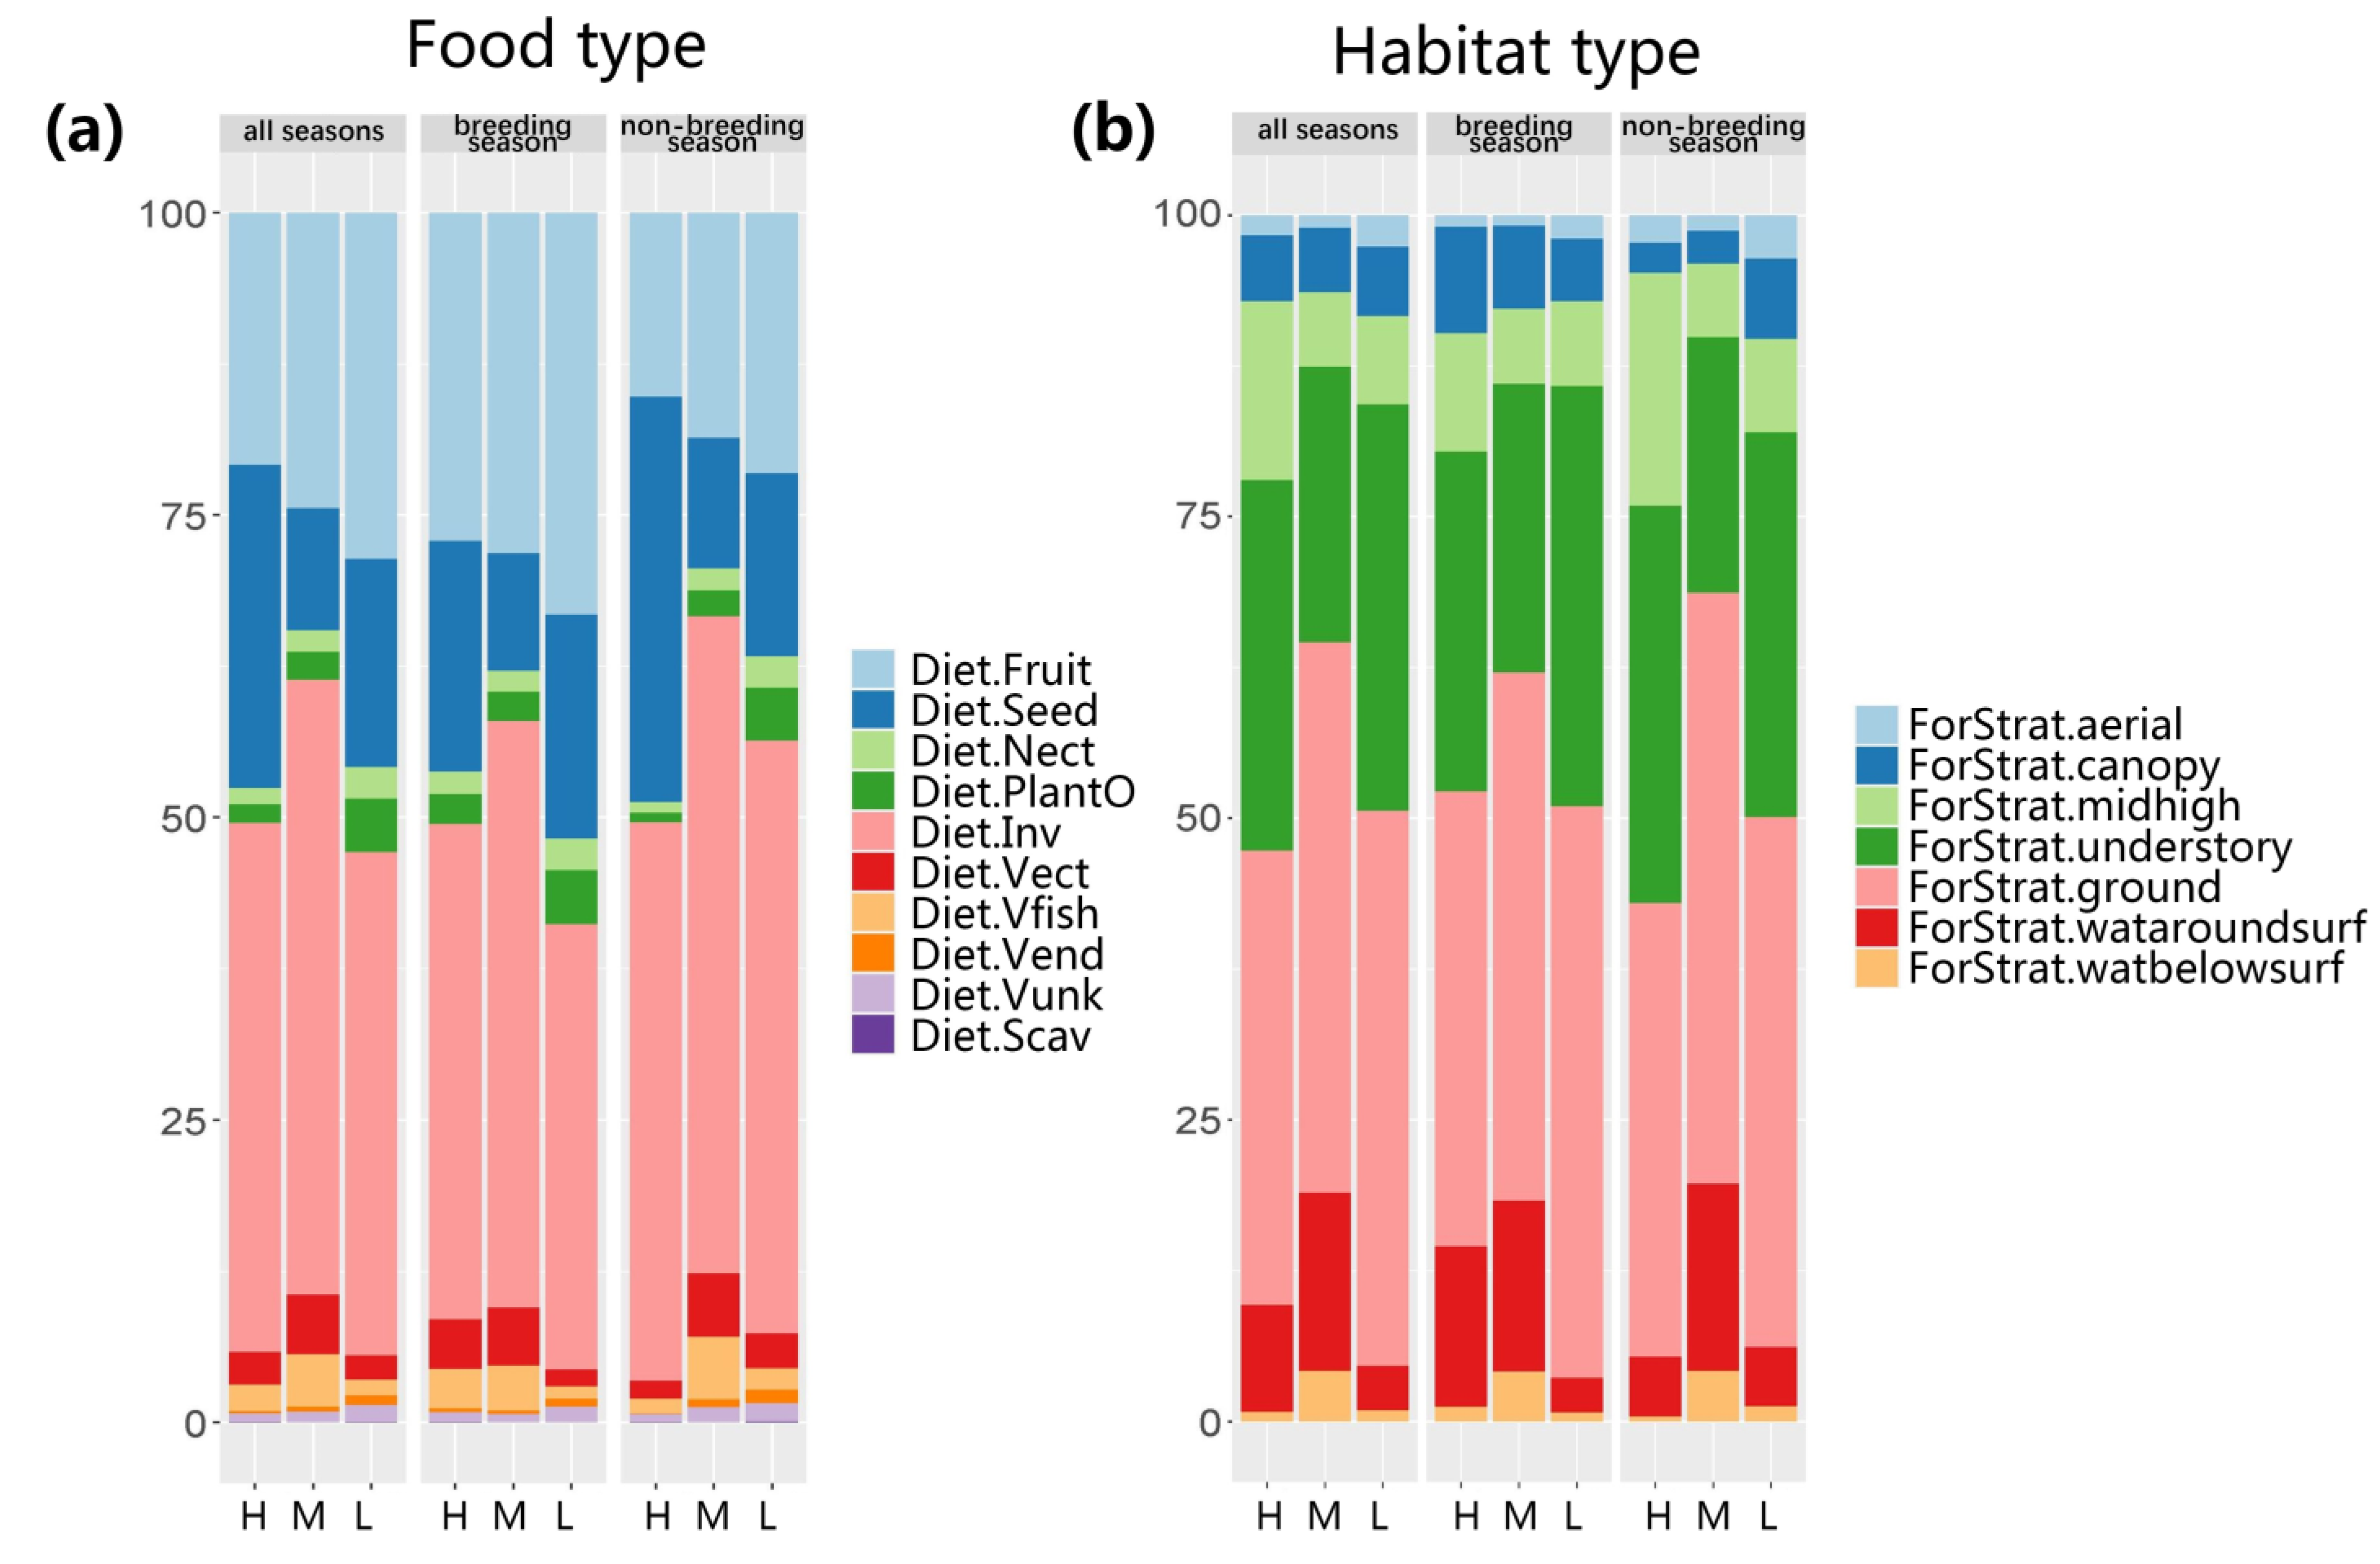
In the three rivers, the food source of bird species was dominated by invertebrates, followed by fruits, seeds, amphibians, fish, other plants, nectar, birds, and corrosion. With the increase in human disturbance, the relative abundance of fruit-eating and nectar-eating birds decreased while that of seed-eating birds increased (Figure 3). Considering the vertical foraging strata, with the increase in human disturbance, the relative abundance of time spent on the ground stratum by bird species increased (Figure 3; low-human disturbance rivers = 46.01%, medium-human disturbance rivers = 45.62%, high-human disturbance rivers = 37.62%).

3.2. PLSR Linked Species Diversity and Functional Diversity with Landscape- and Patch-Level Variables

First, we used richness and FDis as the response variables and landscape- and patch-level variables as the explanatory variables to perform PLSR, and the first components explained 38.8% and 16.2% of the variation in the response variable for richness and FDis, respectively. There were 19 and 18 metrics with VIP ≥ 1 (i.e., the important explanatory variable; see Table A3 and Table A4).
For bird richness, in 19 important explanatory variables, there were 8 landscape indicators on the 100 m scale, 6 landscape indicators on the 500 m scale, respectively, and 5 patch-level variables on the 20 m scale (that is, 42.1%, 31.6%, and 26.3% of the 19 important explanatory variables). For open green space and aquatic plants, the effect in the 100 m radius was more significant than that in the 500 m radius (VIP ≥ 1). For constructed land, the three landscape indices on both the 500 and 100 m scales were important. The AREA_MN of the forest was important on both the 500 and 100 m scales. In the 20 m radius, litter layer and ground herbaceous plant coverage, as well as a vertical range of 3–10 m vegetation cover, were important explanatory variables.
For bird FDis, in the 18 important explanatory variables, there were 8 landscape indicators on the 100 m scale, 7 landscape indicators on the 500 m scale, and 3 landscape indicators on the 20 m scale (that is, 44.4%, 38.9%, and 16.7% of the 18 important explanatory variables, respectively). Similar to bird species richness, the AREA_MN of the forest was also significant for bird FDis at both the 500- and 1000-m scales, and metrics at the 100-m scale were more significant for open green space. For constructed land, the ED and PLAND in both the 500 m and 100 m scales are important, and the metrics in the 500 m scale are more important than those in the 100 m scale for aquatic plants. On the 20 m scale, the litter layer, foliage cover in 0.5–1 m, and foliage cover in 4–6 m are important.

3.3. Multiple Regression Linked Species Diversity and Functional Diversity with Landscape- and Patch-Level Variables

For richness as a response variable, PLSR and VIP approaches were used to derive 19 explanatory variables of interest (i.e., VIP ≥ 1). To avoid multicollinearity, we selected indicators with variance inflation factors (VIFs) < 10 (n = 15) [66] to create multiple linear regression models. We obtained 7 candidate models (i.e., top models) with independent variable counts less than or equal to 3 and ΔAICc < 2 (Table 2). Then we applied the model averaging to the top model set, and the independent variables in the average model were mean foliage cover in 4–6 m in the 20 m scale (p < 0.05), ED of constructed land in the 100 m scale (p < 0.05), AREA_MN of open green space in the 100 m scale, AREA_MN of forest in the 100 m scale (p < 0.05), ED of aquatic plant in the 100 m scale, ED of forest in the 500 m scale, and AREA_MN of constructed land in the 500 m scale (Table 3).
For FDis as the response variable, PLSR and VIP approaches were used to derive 19 explanatory variables of interest (i.e., VIP ≥ 1). To avoid multicollinearity, we selected 15 indicators whose VIFs < 10 [66] to create multiple linear regression models. We obtained 4 candidate models (i.e., top models) with independent variable counts less than or equal to 3 and ΔAICc < 2 (Table 4). Then we applied the model averaging to the top model set, and independent variables in the average model are ED of forest in the 100 m scale, PLAND of forest in the 100 m scale (p < 0.05), ED of open green spaces in the 100 m scale (p < 0.05), mean foliage cover in 4–6 m in the 20 m scale (p < 0.05), and ED of constructed land in the 100 m scale (Table 5).

4. Discussion

As the scale dependency of ecological processes and multiple environmental factors at different spatial scales affects bird diversity, multi-scale approaches are better than single-scale models due to the models they produce to assess the effects of multi-scale landscape structure on bird distribution and habitat use [18,67,68]. This study linked environmental variables both at small- and medium-sized landscape scales and patch scales with river bird species richness and functional diversity (FDis). We found that the landscape characteristics at 500 and 100 m scales, and patch attributes at 20 m scale had a significant effect on bird species richness, while FD was significantly affected by indexes at 100 and 20 m scales. To improve the urban riverfront landscape management and design strategy, multi-scale habitat attributes should be considered to address how to optimize land uses, which are mainly human driven at multiple scales of space, time, and intricacy of management.
There were significant differences in richness among three different intensities of human disturbance of rivers, either throughout the year or during the non-breeding season, respectively. The species richness of the low-human disturbance river (the Laoyu River) was significantly higher than that of the high-human disturbance river (the Panlong River). During the non-breeding season, some migratory birds, such as shorebirds, prefer to stay in the low-human disturbance river. Low-human disturbance rivers in urban areas are a refuge for birds [48], especially during the non-breeding season [69].
There was no significant difference for FDis among the three rivers, whether for the whole year or in the different seasons. As urbanization increases the functional similarity of the bird community [3,20], the differences in FDis among the sampling sites were not significant. Unlike bird species richness, the FDis was significantly influenced by explanatory variables on 100 and 20-m scales but not on the 500-m scale (Table 5). Functional diversity has a complex relationship with habitat variables because it depends on the habitat and landscape structural needs of species in each functional category at the survey site [70]. For example, frugivore and nectarivore birds can be influenced by vegetation structure and specific plant species [70,71].
Recent studies have explored the functional and taxonomic diversity of birds in urban green spaces [72,73], showing different situations. The canopy heterogeneity affected FD [73] and the presence of large trees enhanced taxonomic diversity and functional diversity [74]. A study conducted in Austria revealed that sealed areas (e.g., roads and buildings) had a considerable negative impact on bird species richness and functional diversity [73]. However, another study showed that tree coverage and site size had a positive correlation with richness, while none of the measured land use characteristics were associated with FD, which means functional diversity was unrelated to measured landscape structure variables [72]. We found that the average patch area of forest had significantly positive impacts on bird richness, the average patch area of constructed land had negative impacts on bird richness, and the area proportion of forest had significantly positive impacts on functional diversity.
Edge density (ED) is a tool to quantify how many marginal habitats are next to other types of land cover. The ED at the class level is the entire length of the patch’s edge per unit area for a certain class [75]. The characteristic of a patch edge for a class or an entire landscape is crucial to multiple ecological processes, especially for wildlife. We found that the ED of construction land and forest had negative impacts on bird richness and functional diversity. The ED of construction land reflects the characteristics of its shape, and an increase in ED shows the increasing negative effects on those species sensitive to human disturbance. A higher ED for forestland with the same percentage of forestland area suggests more habitat exposure to human disturbance, which will be detrimental to sensitive species [76,77,78].
Previous studies have demonstrated the significance of forest leaf litter for insectivorous birds because it provides greater habitat for litter-dependent invertebrates [79,80,81]. Many birds like to forage among the ground’s dead leaves, such as Turdus merula and Turdus dissimilis. Protection of woodland insectivorous birds is essential since they are in global decline [82,83] and depend on specific forest structures, including large trees, dense undergrowth, and thick leaf litter [80]. Studies indicate that the degree of park management may play a significant role in influencing the bird community structure in urban green space [84,85], and successful management should avoid excessive understory cleanup. In this study, although the litter layer did not appear in the average models, we obtained the VIP scores of the litter layer by PLSR for bird richness and FD greater than 1 (Table A3 and Table A4), which means the litter layer area was an important habitat attribute. In addition, our study focused on a general analysis of anthropogenic impact, but further research could expand on these findings by incorporating additional variables such as human population density and building type.
We suggest that urban riverside green space should be planned and managed at multiple scales, including landscape-scale management (landscape composition and configuration) and patch-scale management (vegetation structure and litter layer). Multi-scale management may be beneficial for the conservation of bird species richness and FD in urban riverside green space. It is critical to increase the total and mean area of the forest while decreasing the mean area and ED of constructed land [13,86,87] at the landscape scale, as well as maintain high vegetation structure [51,88], vertical vegetation heterogeneity [47], and low-intensity management that preserves the litter layer at the patch scale.

5. Conclusions

This study linked environmental variables both at small and medium landscape scales and at patch scales with urban river bird species richness and FDis. Bird species richness and FD were strongly related to various landscape- and patch-level variables. Tree cover at the 20 m scale had significantly positive impacts on bird species richness and functional diversity. Forest land in the 100 m scale had a significantly positive effect on bird species richness and FD, while construction land in the two landscape scales (the 500 and 100 m scales) had a significantly negative effect on species richness. To improve the urban riverfront landscape management and design strategy, multi-scale habitat attributes should be considered to address how to optimize land uses, which are mainly human driven at multiple scales of space, time, and intricacy of management.

Author Contributions

Q.M. and Z.W. were responsible for the research design. Q.M. drafted the main text and prepared the figures. Q.M. and H.B. did the bird survey. Q.M., J.S. and Y.D. surveyed vegetation structure. Q.M., J.S. and Y.D. finished the land cover classification. Q.M., J.S. and Y.D. processed the data. Q.M. developed the modeling framework. Q.M. analyzed the results. All authors were involved in discussions and editing. All authors have read and agreed to the published version of the manuscript.

Funding

This research was financially supported by the National Natural Science Foundation of China project “Evaluation of Urban Bird Habitat and Cross-Scale Collaborative Optimization Based on Multi-scale Landscape Coupling” (Project No. 52008195). The authors are also thankful for support from Kunming University of Science and Technology’s talent development program, “Research on Optimization of Land Use Structure in Kunming City from the Perspective of Ecological Protection” (Project No. KKZ3202155001).

Institutional Review Board Statement

Not applicable.

Data Availability Statement

The datasets used in this study are available upon reasonable request from the corresponding authors.

Acknowledgments

We would like to express our gratitude to Chencan Liao and Kexin Chen for supporting fieldwork. We also appreciate the valuable feedback and comments provided by the anonymous reviewers, which contributed to improving the quality of our manuscript.

Conflicts of Interest

The authors declare no conflict of interest.

Appendix A

Table A1. List of bird species observed in three rivers in Kunming, Yunnan Province, China, during an annual cycle (spring and winter census).
Common NameScientific Name
Little GrebeTachybaptus ruficollis
Oriental Turtle DoveStreptopelia orientalis
Spotted DoveSpilopelia chinensis
House SwiftApus nipalensis
White-breasted WaterhenAmaurornis phoenicurus
Common MoorhenGallinula chloropus
Cinnamon BitternIxobrychus cinnamomeus
Black-crowned Night-heronNycticorax nycticorax
Striated HeronButorides striata
Chinese Pond-heronArdeola bacchus
Cattle EgretBubulcus ibis
Grey HeronArdea cinerea
Intermediate EgretArdea intermedia
Little EgretEgretta garzetta
Grey-headed LapwingVanellus cinereus
Common SandpiperActitis hypoleucos
Green SandpiperTringa ochropus
Black-winged KiteElanus caeruleus
Eurasian BuzzardButeo buteo
Eurasian HoopoeUpupa epops
Common KingfisherAlcedo atthis
White-throated KingfisherHalcyon smyrnensis
Eurasian WryneckJynx torquilla
Common KestrelFalco tinnunculus
White-throated FantailRhipidura albicollis
Black DrongoDicrurus macrocercus
Ashy DrongoDicrurus leucophaeus
Long-tailed ShrikeLanius schach
Common MagpiePica pica
Grey-headed Canary-flycatcherCulicicapa ceylonensis
Yellow-bellied TitPardaliparus venustulus
Green-backed TitParus monticolus
Great TitParus major
Plain PriniaPrinia inornata
Clamorous Reed-warblerAcrocephalus stentoreus
Barn SwallowHirundo rustica
Mountain BulbulIxos mcclellandii
Brown-breasted BulbulPycnonotus xanthorrhous
Sooty-headed BulbulPycnonotus aurigaster
Yellow-browed WarblerPhylloscopus inornatus
Pallas’s Leaf-warblerPhylloscopus proregulus
Dusky WarblerPhylloscopus fuscatus
Black-throated TitAegithalos concinnus
Oriental White-eyeZosterops palpebrosus
Black-streaked Scimitar-babblerErythrogenys gravivox
White-browed LaughingthrushGarrulax sannio
Blue-winged MinlaSiva cyanouroptera
Chestnut-tailed StarlingSturnia malabarica
Red-billed StarlingSpodiopsar sericeus
Common BlackbirdTurdus merula
Black-breasted ThrushTurdus dissimilis
Oriental Magpie-robinCopsychus saularis
Blue Whistling ThrushMyophonus caeruleus
Red-throated FlycatcherFicedula albicilla
White-capped Water-redstartPhoenicurus leucocephalus
Plumbeous Water RedstartPhoenicurus fuliginosus
Daurian RedstartPhoenicurus auroreus
Common StonechatSaxicola torquatus
White-rumped MuniaLonchura striata
Scaly-breasted MuniaLonchura punctulata
Russet SparrowPasser cinnamomeus
Eurasian Tree SparrowPasser montanus
Olive-backed PipitAnthus hodgsoni
Rosy PipitAnthus roseatus
Gray WagtailMotacilla cinerea
Citrine WagtailMotacilla citreola
White WagtailMotacilla alba
BramblingFringilla montifringilla
Chinese GrosbeakEophona migratoria
Common RosefinchCarpodacus erythrinus
Black-headed GreenfinchChloris ambigua

Appendix B

Table A2. List of functional traits for birds with descriptions.
Functional TraitDefinition
Diet.FruitPercentage of fruit in the diet
Diet.SeedPercentage of seeds in the diet
Diet.NectPercentage of nectar in the diet
Diet.PlantOPercentage of other plant material in the diet
Diet.InvPercentage of invertebrates in the diet
Diet.VectPercentage of reptiles and amphibians in the diet
Diet.VfishPercentage of fish in the diet
Diet.VendPercentage of mammals and birds in the diet
Diet.VunkPercentage of vertebrates (general or unknown) in the diet
Diet.ScavPercentage of scavenge, garbage, offal, carcasses, trawlers, and carrion in the diet
ForStrat.aerialPercentage time spent in the canopy stratum
ForStrat.canopyPercentage time spent in the canopy stratum
ForStrat.midhighPercentage time spent in the mid-high stratum
ForStrat.understoryPercentage time spent in the understory stratum
ForStrat.groundPercentage time spent on the ground stratum
ForStrat.wataroundsurfPercentage time spent around the water surface
ForStrat.watbelowsurfPercentage time spent below the water surface
Body massBody mass in grams

Appendix C

Table A3. The PLSR analysis utilizes richness as the response variable and landscape- and patch-level variables as the explanatory variables. The explanatory variables with VIP ≥ 1 were selected (sorted by VIP score value).
AcronymLAND USEBuffer Radius (m)VIP
AREA_MNOpen green space1001.722
PLANDOpen green space1001.490
EDAquatic plant1001.482
EDConstructed land1001.464
PLANDMean foliage cover 3–4 m201.377
PLANDMean foliage cover < 0.5 m201.306
AREA_MNForest1001.263
EDForest5001.235
AREA_MNConstructed land5001.206
EDConstructed land5001.175
PLANDConstructed land5001.163
PLANDMean foliage cover 4–6 m201.160
PLANDLitter layer201.156
PLANDMean foliage cover 8–10 m201.128
PLANDConstructed land1001.070
AREA_MNForest5001.061
AREA_MNConstructed land1001.055
EDRiver5001.033
EDOpen green space1001.032
Table A4. The PLSR analysis utilizes bird FDis as the response variable and landscape- and patch-level variables as the explanatory variables. The explanatory variables with VIP ≥ 1 were selected (sorted by VIP score value).
AcronymLand UseBuffer Radius (m)VIP
AREA_MNForest5001.990
EDConstructed land1001.759
PLANDConstructed land5001.633
PLANDMean foliage cover 0.5–1 m201.594
EDConstructed land5001.517
PLANDConstructed land1001.514
PLANDMean foliage cover 4–6 m201.505
PLANDLitter layer201.494
AREA_MNOpen green space1001.381
AREA_MNForest1001.378
EDOpen green space1001.287
PLANDOpen green space1001.183
EDRiver5001.171
EDAquatic plant5001.145
PLANDForest1001.068
EDForest1001.051
PLANDForest5001.047
AREA_MNOpen green space5001.034

References

  1. Cohen, B. Urban Growth in Developing Countries: A Review of Current Trends and a Caution Regarding Existing Forecasts. World Dev. 2004, 32, 23–51. [Google Scholar] [CrossRef]
  2. Alberti, M. The Effects of Urban Patterns on Ecosystem Function. Int. Reg. Sci. Rev. 2005, 28, 168–192. [Google Scholar] [CrossRef]
  3. Sol, D.; González-Lagos, C.; Moreira, D.; Maspons, J.; Lapiedra, O. Urbanisation Tolerance and the Loss of Avian Diversity. Ecol. Lett. 2014, 17, 942–950. [Google Scholar] [CrossRef] [PubMed]
  4. McDonald, R.I.; Mansur, A.V.; Ascensão, F.; Colbert, M.; Crossman, K.; Elmqvist, T.; Gonzalez, A.; Güneralp, B.; Haase, D.; Hamann, M.; et al. Research Gaps in Knowledge of the Impact of Urban Growth on Biodiversity. Nat. Sustain. 2020, 3, 16–24. [Google Scholar] [CrossRef]
  5. Kremer, P.; Hamstead, Z.; Haase, D.; McPhearson, T.; Frantzeskaki, N.; Andersson, E.; Kabisch, N.; Larondelle, N.; Rall, E.; Voigt, A.; et al. Key Insights for the Future of Urban Ecosystem Services Research. Ecol. Soc. 2016, 21, 29. [Google Scholar] [CrossRef] [Green Version]
  6. Filloy, J.; Andres Zurita, G.; Isabel Bellocq, M. Bird Diversity in Urban Ecosystems: The Role of the Biome and Land Use Along Urbanization Gradients. Ecosystems 2019, 22, 213–227. [Google Scholar] [CrossRef]
  7. Jasmani, Z.; Ravn, H.P.; van den Bosch, C.C.K. The Influence of Small Urban Parks Characteristics on Bird Diversity: A Case Study of Petaling Jaya, Malaysia. Urban Ecosyst. 2017, 20, 227–243. [Google Scholar] [CrossRef]
  8. Wellmann, T.; Lausch, A.; Scheuer, S.; Haase, D. Earth Observation Based Indication for Avian Species Distribution Models Using the Spectral Trait Concept and Machine Learning in an Urban Setting. Ecol. Indic. 2020, 111, 106029. [Google Scholar] [CrossRef]
  9. Shanahan, D.F.; Miller, C.; Possingham, H.P.; Fuller, R.A. The Influence of Patch Area and Connectivity on Avian Communities in Urban Revegetation. Biol. Conserv. 2011, 144, 722–729. [Google Scholar] [CrossRef]
  10. Suarez-Rubio, M.; Thomlinson, J.R. Landscape and Patch-Level Factors Influence Bird Communities in an Urbanized Tropical Island. Biol. Conserv. 2009, 142, 1311–1321. [Google Scholar] [CrossRef]
  11. Chaiyarat, R.; Wutthithai, O.; Punwong, P.; Taksintam, W. Relationships between Urban Parks and Bird Diversity in the Bangkok Metropolitan Area, Thailand. Urban Ecosyst. 2019, 22, 201–212. [Google Scholar] [CrossRef]
  12. Lee, M.-B.; Zhang, M.; Chan, S.; Zhang, Q.; Che, X.; Wong, K.C.; Zhao, X.; Zou, F. Environmental Determinants of Avian Species Richness in Forests in a Highly Urbanized Subtropical City: The Effects of Spatial Scale and Open Space Feature. Glob. Ecol. Conserv. 2021, 30, e01802. [Google Scholar] [CrossRef]
  13. Zhou, D.; Fung, T.; Chu, L.M. Avian Community Structure of Urban Parks in Developed and New Growth Areas: A Landscape-Scale Study in Southeast Asia. Landsc. Urban Plan. 2012, 108, 91–102. [Google Scholar] [CrossRef]
  14. Yang, G.; Xu, J.; Wang, Y.; Wang, X.; Pei, E.; Yuan, X.; Li, H.; Ding, Y.; Wang, Z. Evaluation of Microhabitats for Wild Birds in a Shanghai Urban Area Park. Urban For. Urban Green. 2015, 14, 246–254. [Google Scholar] [CrossRef]
  15. Chong, K.Y.; Teo, S.; Kurukulasuriya, B.; Chung, Y.F.; Rajathurai, S.; Tan, H.T.W. Not All Green Is as Good: Different Effects of the Natural and Cultivated Components of Urban Vegetation on Bird and Butterfly Diversity. Biol. Conserv. 2014, 171, 299–309. [Google Scholar] [CrossRef]
  16. Krauss, J.; Steffan-Dewenter, I.; Tscharntke, T. How Does Landscape Context Contribute to Effects of Habitat Fragmentation on Diversity and Population Density of Butterflies? J. Biogeogr. 2003, 30, 889–900. [Google Scholar] [CrossRef] [Green Version]
  17. Rossi, J.-P.; van Halder, I. Towards Indicators of Butterfly Biodiversity Based on a Multiscale Landscape Description. Ecol. Indic. 2010, 10, 452–458. [Google Scholar] [CrossRef]
  18. Schindler, S.; von Wehrden, H.; Poirazidis, K.; Wrbka, T.; Kati, V. Multiscale Performance of Landscape Metrics as Indicators of Species Richness of Plants, Insects and Vertebrates. Ecol. Indic. 2013, 31, 41–48. [Google Scholar] [CrossRef]
  19. Chang, C.-R.; Chien, H.-F.; Shiu, H.-J.; Ko, C.-J.; Lee, P.-F. Multiscale Heterogeneity within and beyond Taipei City Greenspaces and Their Relationship with Avian Biodiversity. Landsc. Urban Plan. 2017, 157, 138–150. [Google Scholar] [CrossRef]
  20. Meffert, P.J.; Dziock, F. The Influence of Urbanisation on Diversity and Trait Composition of Birds. Landsc. Ecol. 2013, 28, 943–957. [Google Scholar] [CrossRef]
  21. Morelli, F.; Pruscini, F.; Santolini, R.; Perna, P.; Benedetti, Y.; Sisti, D. Landscape Heterogeneity Metrics as Indicators of Bird Diversity: Determining the Optimal Spatial Scales in Different Landscapes. Ecol. Indic. 2013, 34, 372–379. [Google Scholar] [CrossRef]
  22. Leveau, L.M.; Leveau, C.M. Street Design in Suburban Areas and Its Impact on Bird Communities: Considering Different Diversity Facets over the Year. Urban For. Urban Green. 2020, 48, 126578. [Google Scholar] [CrossRef]
  23. Gonçalves, S.F.; Lourenço, A.C.D.P.; Filho, J.S.D.S.B.; de Toledo, M.C.B. Characteristics of Residential Backyards That Contribute to Conservation and Diversity of Urban Birds: A Case Study in a Southeastern Brazilian City. Urban For. Urban Green. 2021, 61, 127095. [Google Scholar] [CrossRef]
  24. Devictor, V.; Julliard, R.; Clavel, J.; Jiguet, F.; Lee, A.; Couvet, D. Functional Biotic Homogenization of Bird Communities in Disturbed Landscapes. Glob. Ecol. Biogeogr. 2008, 17, 252–261. [Google Scholar] [CrossRef]
  25. Morelli, F.; Benedetti, Y.; Diego Ibanez-Alamo, J.; Jokimaki, J.; Mand, R.; Tryjanowski, P.; Moller, A.P. Evidence of Evolutionary Homogenization of Bird Communities in Urban Environments across Europe. Glob. Ecol. Biogeogr. 2016, 25, 1284–1293. [Google Scholar] [CrossRef]
  26. Petchey, O.L.; Gaston, K.J. Functional Diversity: Back to Basics and Looking Forward. Ecol. Lett. 2006, 9, 741–758. [Google Scholar] [CrossRef]
  27. Rouquette, J.R.; Dallimer, M.; Armsworth, P.R.; Gaston, K.J.; Maltby, L.; Warren, P.H. Species Turnover and Geographic Distance in an Urban River Network. Divers. Distrib. 2013, 19, 1429–1439. [Google Scholar] [CrossRef]
  28. Everard, M.; Moggridge, H.L. Rediscovering the Value of Urban Rivers. Urban Ecosyst. 2012, 15, 293–314. [Google Scholar] [CrossRef]
  29. Suri, J.; Anderson, P.M.; Charles-Dominique, T.; Hellard, E.; Cumming, G.S. More than Just a Corridor: A Suburban River Catchment Enhances Bird Functional Diversity. Landsc. Urban Plan. 2017, 157, 331–342. [Google Scholar] [CrossRef]
  30. Ranta, E.; Vidal-Abarca, M.R.; Calapez, A.R.; Feio, M.J. Urban Stream Assessment System (UsAs): An Integrative Tool to Assess Biodiversity, Ecosystem Functions and Services. Ecol. Indic. 2021, 121, 106980. [Google Scholar] [CrossRef]
  31. Kondolf, G.M.; Pinto, P.J. The Social Connectivity of Urban Rivers. Geomorphology 2017, 277, 182–196. [Google Scholar] [CrossRef]
  32. Sica, Y.V.; Quintana, R.D.; Radeloff, V.C.; Gavier-Pizarro, G.I. Wetland Loss Due to Land Use Change in the Lower Paraná River Delta, Argentina. Sci. Total Environ. 2016, 568, 967–978. [Google Scholar] [CrossRef]
  33. Rehman, S.; Tiwary, N.K.; Urfi, A.J. Conservation Monitoring of a Polluted Urban River: An Occupancy Modeling Study of Birds in the Yamuna of Delhi. Urban Ecosyst. 2021, 24, 1399–1411. [Google Scholar] [CrossRef]
  34. Trammell, E.J.; Bassett, S. Impact of Urban Structure on Avian Diversity along the Truckee River, USA. Urban Ecosyst. 2012, 15, 993–1013. [Google Scholar] [CrossRef]
  35. Department of Ecology and Environment of Yunnan Province; Kunming Institute of Botany; Kunming Institute of Zoology. Species Red List of Yunnan Province; 2017 ed.; Department of Ecology and Environment of Yunnan Province: Kunming, China, 2017.
  36. Biodiversity Committee of Chinese Academy of Sciences. (Ed.) JI Liqiang China Checklist of Animals; Catalogue of Life China: 2022 Annual Checklist. Available online: http://sp2000.org.cn/ (accessed on 10 January 2023).
  37. Yunnan Statistical Bureau, Yunnan Statistical Yearbook 2022; China Statistics Press: Beijing, China, 2022.
  38. Ralph, C.J.; Sauer, J.R.; Droege, S. Monitoring Bird Populations by Point Counts; Pacific Southwest Research Station: Albany, CA, USA, 1995.
  39. BirdLife International. The BirdLife Checklist of the Birds of the World: Version 3.0. Available online: http://datazone.birdlife.org/species/taxonomy (accessed on 23 March 2023).
  40. Wilman, H.; Belmaker, J.; Simpson, J.; de la Rosa, C.; Rivadeneira, M.M.; Jetz, W. EltonTraits 1.0: Species-Level Foraging Attributes of the World’s Birds and Mammals. Ecology 2014, 95, 2027. [Google Scholar] [CrossRef] [Green Version]
  41. Laliberté, E.; Legendre, P. A Distance-Based Framework for Measuring Functional Diversity from Multiple Traits. Ecology 2010, 91, 299–305. [Google Scholar] [CrossRef]
  42. Huang, Y.; Zhao, Y.; Li, S.; von Gadow, K. The Effects of Habitat Area, Vegetation Structure and Insect Richness on Breeding Bird Populations in Beijing Urban Parks. Urban For. Urban Green. 2015, 14, 1027–1039. [Google Scholar] [CrossRef]
  43. Xu, X.; Xie, Y.; Qi, K.; Luo, Z.; Wang, X. Detecting the Response of Bird Communities and Biodiversity to Habitat Loss and Fragmentation Due to Urbanization. Sci. Total Environ. 2018, 624, 1561–1576. [Google Scholar] [CrossRef]
  44. ESRI. ArcGIS Desktop: Release 10; Environmental Systems Research Institute: Redlands, CA, USA, 2011. [Google Scholar]
  45. McGarigal, K.; Marks, B.J. FRAGSTATS: Spatial Pattern Analysis Program for Quantifying Landscape Structure; US Department of Agriculture, Forest Service, Pacific Northwest Research Station: Portland, OR, USA, 1995; Volume 351, p. 122. [CrossRef]
  46. Wunderle, J.M. Avian Distribution in Dominican Shade Coffee Plantations: Area and Habitat Relationships (Distribución de Aves En Algunas Plantaciónes de Café de Sombra En La República Dominicana: Relaciones Entre Área y Habitat). J. Field Ornithol. 1999, 70, 58–70. [Google Scholar]
  47. Xie, S.; Su, Y.; Xu, W.; Cai, W.; Wang, X.; Lu, F.; Ouyang, Z. The Effect of Habitat Changes along the Urbanization Gradient for Breeding Birds: An Example from the Xiong’an New Area. PeerJ 2019, 7, e7961. [Google Scholar] [CrossRef]
  48. Stagoll, K.; Manning, A.D.; Knight, E.; Fischer, J.; Lindenmayer, D.B. Using Bird–Habitat Relationships to Inform Urban Planning. Landsc. Urban Plan. 2010, 98, 13–25. [Google Scholar] [CrossRef]
  49. Zúñiga-Vega, J.J.; Solano-Zavaleta, I.; Sáenz-Escobar, M.F.; Ramírez-Cruz, G.A. Habitat Traits That Increase the Probability of Occupancy of Migratory Birds in an Urban Ecological Reserve. Acta Oecologica 2019, 101, 103480. [Google Scholar] [CrossRef]
  50. Sekercioglu, C.H. Effects of Forestry Practices on Vegetation Structure and Bird Community of Kibale National Park, Uganda. Biol. Conserv. 2002, 107, 229–240. [Google Scholar] [CrossRef]
  51. Ikin, K.; Beaty, R.M.; Lindenmayer, D.B.; Knight, E.; Fischer, J.; Manning, A.D. Pocket Parks in a Compact City: How Do Birds Respond to Increasing Residential Density? Landsc. Ecol. 2013, 28, 45–56. [Google Scholar] [CrossRef]
  52. Cushman, S.A.; McGarigal, K.; Neel, M.C. Parsimony in Landscape Metrics: Strength, Universality, and Consistency. Ecol. Indic. 2008, 8, 691–703. [Google Scholar] [CrossRef]
  53. Carrascal, L.M.; Galván, I.; Gordo, O. Partial Least Squares Regression as an Alternative to Current Regression Methods Used in Ecology. Oikos 2009, 118, 681–690. [Google Scholar] [CrossRef]
  54. Mehmood, T.; Liland, K.H.; Snipen, L.; Sæbø, S. A Review of Variable Selection Methods in Partial Least Squares Regression. Chemom. Intell. Lab. Syst. 2012, 118, 62–69. [Google Scholar] [CrossRef]
  55. Clavero, M.; Hermoso, V.; Levin, N.; Kark, S. Biodiversity Research: Geographical Linkages between Threats and Imperilment in Freshwater Fish in the Mediterranean Basin. Divers. Distrib. 2010, 16, 744–754. [Google Scholar] [CrossRef]
  56. Crone, E.E.; Pelton, E.M.; Brown, L.M.; Thomas, C.C.; Schultz, C.B. Why Are Monarch Butterflies Declining in the West? Understanding the Importance of Multiple Correlated Drivers. Ecol. Appl. 2019, 29, e01975. [Google Scholar] [CrossRef]
  57. Ferreira, A.R.L.; Sanches Fernandes, L.F.; Cortes, R.M.V.; Pacheco, F.A.L. Assessing Anthropogenic Impacts on Riverine Ecosystems Using Nested Partial Least Squares Regression. Sci. Total Environ. 2017, 583, 466–477. [Google Scholar] [CrossRef]
  58. Jia, J.; Deng, H.; Duan, J.; Zhao, J. Analysis of the Major Drivers of the Ecological Footprint Using the STIRPAT Model and the PLS Method—A Case Study in Henan Province, China. Ecol. Econ. 2009, 68, 2818–2824. [Google Scholar] [CrossRef]
  59. Huang, Z. Partial Least Squares Regression Analysis to Factor of Influence for Ecological Footprint. Clust. Comput. 2019, 22, 6425–6433. [Google Scholar] [CrossRef]
  60. R Core Team, R. R: A Language and Environment for Statistical Computing; R Foundation for Statistical Computing: Vienna, Austria, 2013. [Google Scholar]
  61. Kucheryavskiy, S. Mdatools–R Package for Chemometrics. Chemom. Intell. Lab. Syst. 2020, 198, 103937. [Google Scholar] [CrossRef]
  62. Chong, I.-G.; Jun, C.-H. Performance of Some Variable Selection Methods When Multicollinearity Is Present. Chemom. Intell. Lab. Syst. 2005, 78, 103–112. [Google Scholar] [CrossRef]
  63. Bickford, D.; Ng, T.H.; Qie, L.; Kudavidanage, E.P.; Bradshaw, C.J. Forest Fragment and Breeding Habitat Characteristics Explain Frog Diversity and Abundance in Singapore. Biotropica 2010, 42, 119–125. [Google Scholar] [CrossRef]
  64. Burnham, K.P.; Anderson, D.R. Model Selection and Multimodel Inference: A Practical Information-Theoretic Approach; Springer: New York, NY, USA, 2002; ISBN 978-1-280-00948-8. [Google Scholar]
  65. Bartoń, K. Multi-Model Inference. R Package, Version 1.43.6. Available online: https://cran.r-project.org/web/packages/MuMIn/MuMIn.pdf (accessed on 12 February 2023).
  66. Craney, T.A.; Surles, J.G. Model-Dependent Variance Inflation Factor Cutoff Values. Qual. Eng. 2002, 14, 391–403. [Google Scholar] [CrossRef]
  67. Boscolo, D.; Metzger, J.P. Is Bird Incidence in Atlantic Forest Fragments Influenced by Landscape Patterns at Multiple Scales? Landsc. Ecol. 2009, 24, 907–918. [Google Scholar] [CrossRef]
  68. Lechner, A.M.; Langford, W.T.; Jones, S.D.; Bekessy, S.A.; Gordon, A. Investigating Species-Environment Relationships at Multiple Scales: Differentiating between Intrinsic Scale and the Modifiable Areal Unit Problem. Ecol. Complex. 2012, 11, 91–102. [Google Scholar] [CrossRef]
  69. Caula, S.; Marty, P.; Martin, J.-L. Seasonal Variation in Species Composition of an Urban Bird Community in Mediterranean France. Landsc. Urban Plan. 2008, 87, 1–9. [Google Scholar] [CrossRef]
  70. Suárez-Castro, A.F.; Maron, M.; Mitchell, M.G.E.; Rhodes, J.R. Disentangling Direct and Indirect Effects of Landscape Structure on Urban Bird Richness and Functional Diversity. Ecol. Appl. 2022, 32, e2713. [Google Scholar] [CrossRef]
  71. Silva, P.A.; Silva, L.L.; Brito, L. Using Bird-Flower Interactions to Select Native Tree Resources for Urban Afforestation: The Case of Erythrina Velutina. Urban For. Urban Green. 2020, 51, 126677. [Google Scholar] [CrossRef]
  72. Morelli, F.; Mikula, P.; Benedetti, Y.; Bussière, R.; Tryjanowski, P. Cemeteries Support Avian Diversity Likewise Urban Parks in European Cities: Assessing Taxonomic, Evolutionary and Functional Diversity. Urban For. Urban Green. 2018, 36, 90–99. [Google Scholar] [CrossRef]
  73. Schütz, C.; Schulze, C.H. Functional Diversity of Urban Bird Communities: Effects of Landscape Composition, Green Space Area and Vegetation Cover. Ecol. Evol. 2015, 5, 5230–5239. [Google Scholar] [CrossRef]
  74. Morelli, F.; Benedetti, Y.; Su, T.; Zhou, B.; Moravec, D.; Simova, P.; Liang, W. Taxonomic Diversity, Functional Diversity and Evolutionary Uniqueness in Bird Communities of Beijing’s Urban Parks: Effects of Land Use and Vegetation Structure. Urban For. Urban Green. 2017, 23, 84–92. [Google Scholar] [CrossRef]
  75. Hargis, C.D.; Bissonette, J.A.; David, J.L. Understanding Measures of Landscape Pattern. In Wildlife and Landscape Ecology: Effects of Pattern and Scale; Bissonette, J.A., Ed.; Springer: New York, NY, USA, 1997; pp. 231–261. ISBN 978-1-4612-1918-7. [Google Scholar]
  76. Soifer, L.G.; Donovan, S.K.; Brentjens, E.T.; Bratt, A.R. Piecing Together Cities to Support Bird Diversity: Development and Forest Edge Density Affect Bird Richness in Urban Environments. Landsc. Urban Plan. 2021, 213, 104122. [Google Scholar] [CrossRef]
  77. Reidy, J.L.; Thompson Iii, F.R.; Peak, R.G. Factors Affecting Golden-Cheeked Warbler Nest Survival in Urban and Rural Landscapes. J. Wildl. Manag. 2009, 73, 407–413. [Google Scholar] [CrossRef]
  78. Villaseñor, N.R.; Driscoll, D.A.; Escobar, M.A.H.; Gibbons, P.; Lindenmayer, D.B. Urbanization Impacts on Mammals across Urban-Forest Edges and a Predictive Model of Edge Effects. PLoS ONE 2014, 9, e97036. [Google Scholar] [CrossRef] [PubMed] [Green Version]
  79. Cintra, R.; Naka, L.N. Spatial Variation in Bird Community Composition in Relation to Topographic Gradient and Forest Heterogeneity in a Central Amazonian Rainforest. Int. J. Ecol. 2011, 2012, e435671. [Google Scholar] [CrossRef] [Green Version]
  80. Fox, V.L.; Buehler, C.P.; Byers, C.M.; Drake, S.E. Forest Composition, Leaf Litter, and Songbird Communities in Oak- vs. Maple-Dominated Forests in the Eastern United States. For. Ecol. Manag. 2010, 259, 2426–2432. [Google Scholar] [CrossRef]
  81. Mansor, M.S.; Rozali, F.Z.; Abdullah, N.A.; Nor, S.M.; Ramli, R. How Important Is Aerial Leaf Litter for Insectivorous Birds Foraging in a Malaysian Tropical Forest? Glob. Ecol. Conserv. 2019, 20, e00722. [Google Scholar] [CrossRef]
  82. Şekercioḡlu, Ç.H.; Ehrlich, P.R.; Daily, G.C.; Aygen, D.; Goehring, D.; Sandí, R.F. Disappearance of Insectivorous Birds from Tropical Forest Fragments. Proc. Natl. Acad. Sci. USA 2002, 99, 263–267. [Google Scholar] [CrossRef] [PubMed] [Green Version]
  83. Stratford, J.A.; Stouffer, P.C. Forest Fragmentation Alters Microhabitat Availability for Neotropical Terrestrial Insectivorous Birds. Biol. Conserv. 2015, 188, 109–115. [Google Scholar] [CrossRef]
  84. Shwartz, A.; Shirley, S.; Kark, S. How Do Habitat Variability and Management Regime Shape the Spatial Heterogeneity of Birds within a Large Mediterranean Urban Park? Landsc. Urban Plan. 2008, 84, 219–229. [Google Scholar] [CrossRef]
  85. Shwartz, A.; Muratet, A.; Simon, L.; Julliard, R. Local and Management Variables Outweigh Landscape Effects in Enhancing the Diversity of Different Taxa in a Big Metropolis. Biol. Conserv. 2013, 157, 285–292. [Google Scholar] [CrossRef]
  86. MacGregor-Fors, I. Relation between Habitat Attributes and Bird Richness in a Western Mexico Suburb. Landsc. Urban Plan. 2008, 84, 92–98. [Google Scholar] [CrossRef]
  87. Pei, N.; Wang, C.; Jin, J.; Jia, B.; Chen, B.; Qie, G.; Qiu, E.; Gu, L.; Sun, R.; Li, J.; et al. Long-Term Afforestation Efforts Increase Bird Species Diversity in Beijing, China. Urban For. Urban Green. 2018, 29, 88–95. [Google Scholar] [CrossRef]
  88. Zivanovic, A.J.; Luck, G.W. Social and Environmental Factors Drive Variation in Plant and Bird Communities across Urban Greenspace in Sydney, Australia. J. Environ. Manag. 2016, 169, 210–222. [Google Scholar] [CrossRef]
Figure 1. Location of the 28 sampling sites among three rivers with different levels of human disturbance along the urban development gradient in Kunming, Yunnan Province, China (the Panlong River—high-human disturbance rivers; the Maliao River—medium-human disturbance rivers; the Laoyu River—low-human disturbance rivers). (a) The location of Yunnan Province in China. (b) The location of the main urban area (the six administrative districts) of Kunming surrounding Dianchi Lake. (c) The three rivers with different levels of human disturbance along the urban development gradient in Kunming. (d) The location of the 28 sampling sites. The sampling sites we selected were located in the typical green space along each river. (e) Pictures of the typical habitat types in each river.
Diversity 15 00486 g001
Figure 2. The bar plots depict bird richness (ac), the Shannon–Wiener Index (df), and the FDis (gi) in all seasons, breeding season, and non-breeding season, at high-, medium-, and low-human disturbance rivers (H—high-human disturbance rivers; M—medium-human disturbance rivers; L—low-human disturbance rivers).
Diversity 15 00486 g002
Figure 3. Relative abundance of different avian groups in the annual cycle, breeding season, and non-breeding season at high-, medium-, and low-human disturbance rivers (H—high-human disturbance rivers; M—medium-human disturbance rivers; L—low-human disturbance rivers). (a) Birds were grouped by their diet (Diet.Fruit—fruit; Diet.Seed—seeds; Diet.Nect—nectar; Diet.PlantO—other plant material; Diet.Inv–invertebrate; Diet.Vect—reptiles, amphibians; Diet.Vfish—fish; Diet.Vend—mammals, birds; Diet.Vunk—vertebrates (general or unknown); Diet.Scav–scavenge, garbage, offal, carcasses, trawlers, carrion). (b) Percentage time spent on the seven categories of the stratum (ForStrat.aerial—canopy stratum; ForStrat.canopy—canopy stratum; ForStrat.midhigh—mid-high stratum; ForStrat.understory—understory stratum; ForStrat.ground—ground stratum; ForStrat.wataroundsurf—around water surface; ForStrat.watbelowsurf—below the water surface).
Diversity 15 00486 g003
Table 1. List of landscape- and patch-level variables assessed for each sampling site in three urban rivers at the 500, 100, and 20 m scales.
MetricsLand CoverBuffer Radius (m)Description
AREA_MNForest, open green space (lawn, weedy patch), aquatic plant, river, constructed land (impervious surface besides municipal roads), road (municipal roads)500; 100The mean patch area of a selected land cover type within a 500 or 100 m radius
EDForest, open green space (lawn, weedy patch), aquatic plant, river, constructed land (impervious surface besides municipal roads), road (municipal roads)500; 100The edge density of a selected land cover type within a 500 or 100 m radius
PLANDForest, open green space (lawn, weedy patch), aquatic plant, river, constructed land (impervious surface besides municipal roads), road (municipal roads)500; 100% of a selected land cover type within a 500 or 100 m radius
PLANDMean foliage cover < 0.5 m20% of foliage cover at 0–0.5 m height within a 20 m radius
PLANDMean foliage cover 0.5–1 m20% of foliage cover at 0.5–1 m height within a 20 m radius
PLANDMean foliage cover 1–2 m20% of foliage cover at 1–2 m height within a 20 m radius
PLANDMean foliage cover 2–3 m20% of foliage cover at 2–3 m height within a 20 m radius
PLANDMean foliage cover 3–4 m20% of foliage cover at 3–4 m height within a 20 m radius
PLANDMean foliage cover 4–6 m20% of foliage cover at 4–6 m height within a 20 m radius
PLANDMean foliage cover 6–8 m20% of foliage cover at 6–8 m height within a 20 m radius
PLANDMean foliage cover 8–10 m20% of foliage cover at 8–10 m height within a 20 m radius
PLANDMean foliage cover 10–12 m20% of foliage cover at 10–12 m height within a 20 m radius
PLANDMean foliage cover 12–15 m20% of foliage cover at 12–15 m height within a 20 m radius
PLANDMean foliage cover >15 m20% of foliage cover above 15 m height within a 20 m radius
Foliage vertical diversity-20The Shannon–Wiener index computed by using the number of points with leaves at each height range as individuals
PLANDLitter layer20 % of the litter layer cover area within a 20 m radius
Table 2. The top model set connected landscape- and patch-level variables and bird species richness, with ΔAICc < 2 and the number of predictors ≤ 3.
AcronymLand UseBuffer Radius (m)Model1Model2Model3Model4Model5Model6Model7
(Int)---30.36025.60016.25038.83010.75025.23021.470
PLANDMean foliage cover 4–6 m2010.89010.830 11.51012.180
EDConstructed land100−0.021−0.017 −0.017 −0.015−0.014
AREA_MNOpen green space100−75.290 −108.600
AREA_MNForest100 42.110 48.530
EDAquatic plant100 0.016 0.019 0.008
EDForest500 −0.030−0.040
AREA_MNConstructed land500 −0.635
AICc 174.500174.700175.300175.600176.200176.400176.400
ΔAICc 0.0000.2700.8801.1101.7501.9301.970
weight 0.2340.2050.1510.1350.0980.0890.088
Table 3. Results of model averaging for bird species richness for the top models (Table 2). The definitions of predictors are listed in Table 1. p values < 0.05 are in bold font.
AcronymLand UseBuffer Radius (m)Estimatep
(Int)---25.8070.004
PLANDMean foliage cover 4–6 m2011.1880.017
EDConstructed land100−0.0180.001
AREA_MNOpen green space100−87.4600.081
AREA_MNForest10043.9580.002
EDAquatic plant1000.0140.073
EDForest500−0.0350.059
AREA_MNConstructed land500−0.6350.312
Table 4. The top model set connected landscape- and patch-level variables and bird species FDis, with ΔAICc < 2 and the number of predictors ≤ 3.
AcronymLand UseBuffer Radius (m)Model1Model2Model3Model4
(Int)---0.6940.2940.5550.493
EDForest100−0.001 −3.249 × 10⁻⁴
PLANDForest1000.011
EDOpen green space1003.109 × 10−43.421 × 10−43.717 × 10−42.631 × 10⁻⁴
PLANDMean foliage cover 4–6 m20 0.5620.6450.537
EDConstructed land100 −2.145 × 10⁻⁴
AICc −6.600−6.300−6.200−4.700
ΔAICc 0.0000.3600.4101.980
weight 0.3310.2760.2700.123
Table 5. Results of model averaging for bird species FDis for the top models (Table 4). The definitions of predictors are listed in Table 1. p values < 0.05 are in bold font.
AcronymLand UseBuffer Radius (m)Estimatep
(Int)---0.5470.034
EDForest100−0.0010.081
PLANDForest1000.0110.003
EDOpen green space1003.286 × 10−40.030
PLANDMean foliage cover 4–6 m200.5960.009
EDConstructed land100−2.145 × 10−40.304
Disclaimer/Publisher’s Note: The statements, opinions and data contained in all publications are solely those of the individual author(s) and contributor(s) and not of MDPI and/or the editor(s). MDPI and/or the editor(s) disclaim responsibility for any injury to people or property resulting from any ideas, methods, instructions or products referred to in the content.

