Article

Seasonality and Long-Term Effect of Environmental Variables on the Orb Weaver Spider Community of a Tropical Dry Forest in the Balsas Basin, Mexico

by
Miguel Menéndez-Acuña
1,
Mónica Salas-Rodríguez
1,
Griselda Montiel-Parra
2,
Solange Sotuyo
3 and
Ma Ventura Rosas-Echeverría
1,*
1
Escuela de Estudios Superiores de Jicarero, Universidad Autónoma del Estado de Morelos, Carretera Galeana-Tequesquitengo s/n Col. El Jicarero, Jojutla C.P. 62909, Morelos, Mexico
2
Colección Nacional de Ácaros, Instituto de Biología, Universidad Nacional Autónoma de México, Ciudad Universitaria, Mexico City C.P. 04510, Mexico
3
Departamento de Botánica, Instituto de Biología, Universidad Nacional Autónoma de México, Ciudad Universitaria, Mexico City C.P. 04510, Mexico
*
Author to whom correspondence should be addressed.
Diversity 2023, 15(3), 466; https://doi.org/10.3390/d15030466
Submission received: 24 January 2023 / Revised: 2 March 2023 / Accepted: 14 March 2023 / Published: 21 March 2023
(This article belongs to the Special Issue Forest Spider Communities Diversity)

Abstract

:
Spiders are significant predators in terrestrial habitats, with the highest diversity found in tropical ecosystems, but it is also where they are studied least. In this study, we analyzed the effect of seasonality and three environmental variables (precipitation, evaporation, and temperature) in the orb-weaver composition, richness, abundance, dominance, and diversity. In addition, the species turnover between three localities with differences in the vegetation composition and maintenance in the Sierra de Huautla, Morelos, Mexico, were evaluated. The collection methods used included beating vegetation and direct searches conducted over seven hours during daylight, once per month, between April 2013 and March 2014. A total of 17 species from 14 genera were registered. With the records, we compiled the first species inventory of araneids for the three localities, adding eight new species records for the state of Morelos. The predominant species were Neoscona oaxacensis (Keyserling, 1864) and Trichonephila clavipes (Linnaeus, 1767), but over 50% of the species that we recorded corresponded to a single individual. The Araneid community changed between the dry and rainy seasons in all three localities, with each locality responding differently to changes in environmental variables, with most variables maintaining a long-term effect on the spider community.

1. Introduction

Spiders are essential members of any terrestrial ecosystem, and because of their high richness and abundance, wide distribution, and variety of hunting strategies, they constitute a relevant order of predators, especially of insect populations [1,2]). Their diversity is high in tropical forests, although this is where they are also the least well-known [3]. Spider communities seem to respond directly and indirectly to multiple biotic and abiotic factors, such as environmental variables, prey availability, vegetation composition, disturbance, and even the genetic diversity of foundation species [4,5,6,7,8,9]). Nevertheless, the evidence of the magnitude and direction of this response remains controversial, sometimes with conflicting results depending on the geographical location and the researcher’s delimitation of the community evaluated.
In the actual context of rapid climate change, studies on the effects of environmental variables would provide a better understanding of the community assembly: information that can be applied to the conservation and management of this species and their habitat. As with other poikilotherm species, the temperature is expected to have an impact on spider establishment and distribution [10]; in addition, other environmental factors, such as precipitation, have been shown to have a direct effect on spider community, both directly or via their trophic interactions [5,11].
This is even more important in habitats where precipitation plays an important role in plant physiognomy (and therefore primary production) or seasonality changes, such as tropical dry forests (TDF).
The TDF is considered a type of tropical vegetation that is most in danger of disappearing [12,13]. In Mexico, the TDF previously occupied almost 10% of the total surface [14]; at the start of the 90th decade, and despite the ecological, economic, and cultural importance of the TDF [15,16,17], the presence of this vegetation type decreased to 22% of the total surface; with an estimated rate of loss of 1.4% annually [18]. While TDF is known for its great diversity, there are few studies on arthropods [19,20,21,22], particularly spiders.
For this vegetation type, the factors that spatially structure spider communities are not known with certainty [7]. In spiders, resource availability (spatial and trophic) and biotic interactions (competition) can affect their presence [23,24]. The seasonal TDF variation in these factors could cause higher abundance and richness, particularly during the rainy season in the TDF [7]. During this season, most plants have foliage, which increases the diversity of flying insects, especially herbivores, such as hemipterans, homopterans, coleopterans, and lepidopterans [22,25,26], which are common prey of spiders.
Among the 131 families that comprise the order Araneae, the family Araneidae (commonly known as orb-weaver spiders) is the third most diverse, with 187 genera and 3119 species recorded worldwide [27,28]. The members of this family are spiders with a cosmopolitan distribution, characterized by the construction of orb-webs constructed in vegetation to trap their prey, which mainly includes flying and jumping insects [29,30,31,32]. Due to their high abundance, simple collection, and adequate taxonomic knowledge, araneid spiders have been proposed as suitable models for diversity studies [7,33].
We hypothesize that biological (vegetation composition) and environmental (seasonality, precipitation, evaporation, and temperature) variables will affect the assembly of the spider community. We predict that: (1) Communities within protected forest areas have a greater richness, abundance, and diversity than the community outside; (2) Spider composition and dominant species vary between localities due to differences in vegetation composition; (3) Communities in the rainy season have greater richness, abundance and diversity and different composition and dominant species when compared with the dry season; (4) Orb-weaver richness, abundance, and diversity are affected by precipitation, evaporation and temperature in the three study sites.

2. Materials and Methods
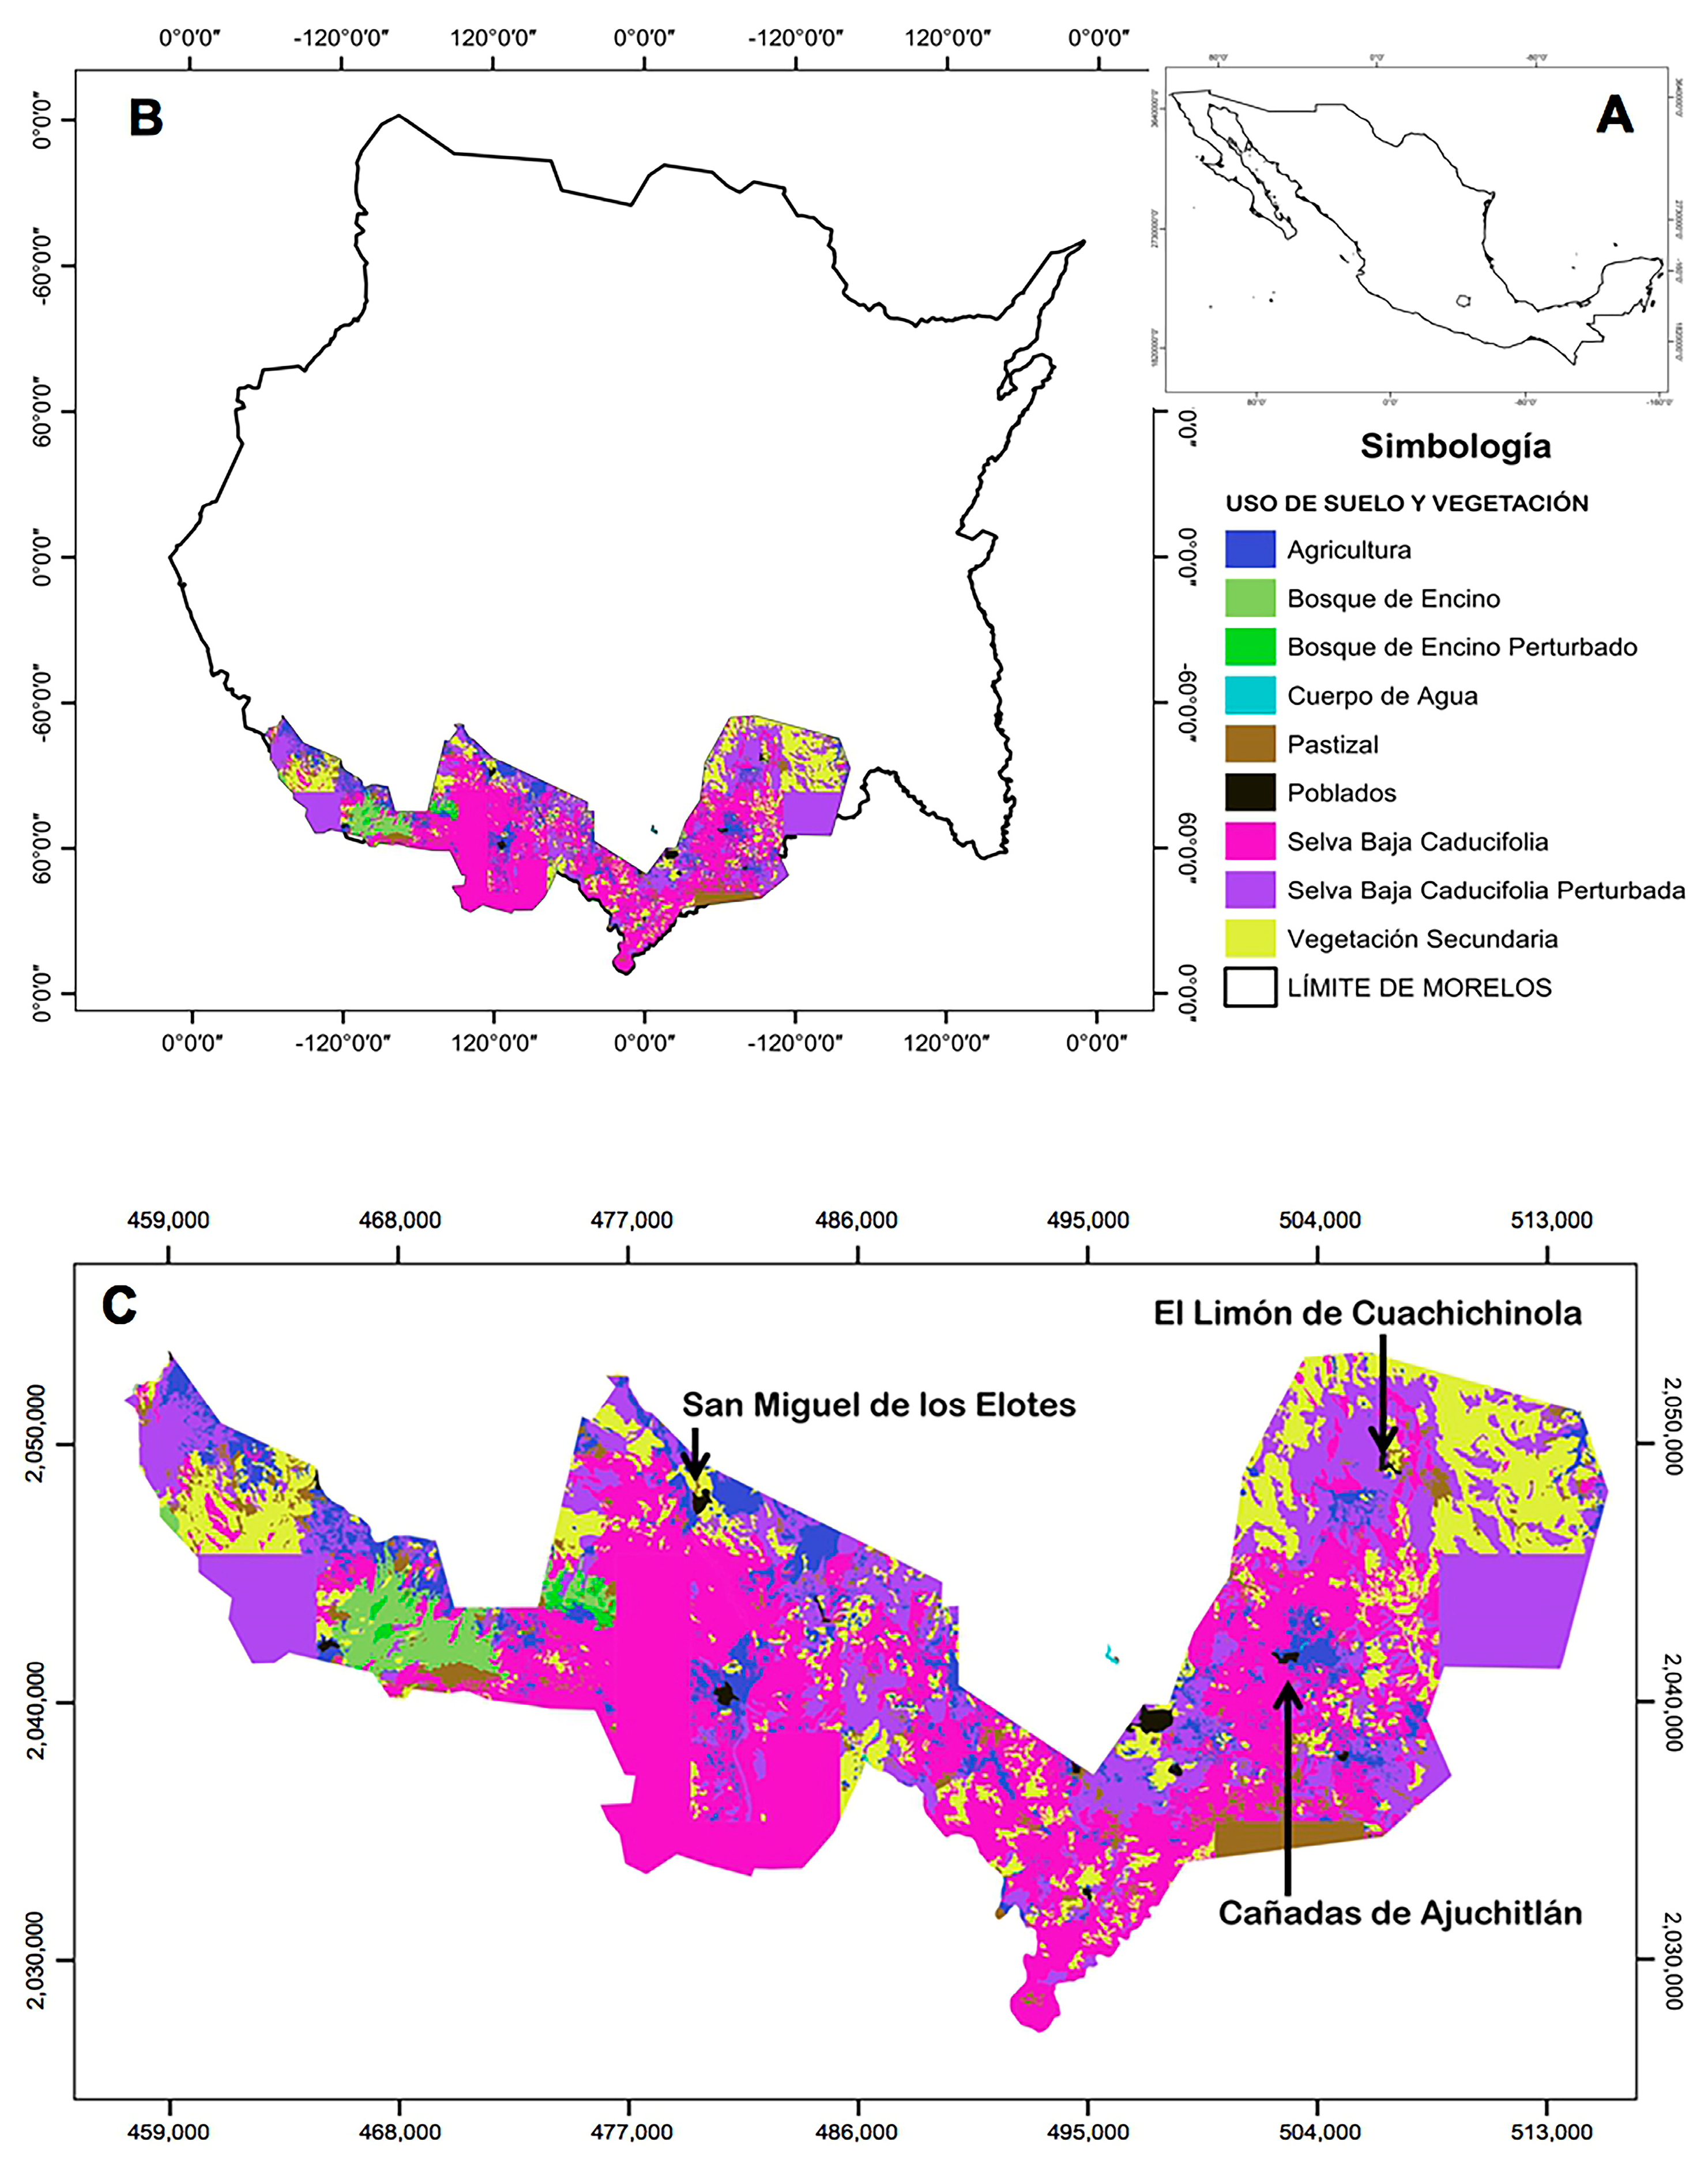
2.1. Study Area

The systematic sampling of orb-weaver spiders was carried out at localities inside and outside a natural protected area known as Sierra de Huautla Biosphere Reserve (REBIOSH), which protects the greatest TDF area in the state Morelos (Figure 1) [34]. REBIOSH is part of the Rio Balsas depression in central Mexico. TDF’s main feature is its remarkable seasonality, with a rainy season, from June to September, when vegetation is abundant, and a dry season from October to May, when leaf cover is drastically reduced. TDF is dominated by relatively short trees, most of which shed their foliage completely during the dry season [15,35]). In this community, herbs and slender woody climbers are better represented [15,36]. Dominant plant species include members of the families: Bignoniaceae, Bombacaceae, Burseraceae, Cactaceae, Convolvulaceae, Julianaceae, and Leguminosae [34]. Within the REBIOSH, altitudes range from 700 to 2200 m [34]. The climate is warm subhumid (Aw1), the driest of the subhumid climates in Mexico (Table 1), with rainfall in summer and drought in midsummer [37].
We established a conservation gradient based on the plant community species present in three localities. Two localities—El Limón de Cuauchichinola (EL) and a valley between Huautla and Ajuchitlán towns (HA)—are inside the REBIOSH (Table 1). The first locality, EL, is a conserved area, while HA presents a mosaic of TDF and crop fields. Finally, the third locality, San Miguel de Los Elotes (SME), is outside the REBIOSH, and the anthropogenic disturbance in this area is notably higher. At the three localities, for one year, we described the structure community in terms of diversity, composition, richness, abundance, dominance, and phenology at a local scale (α diversity), as well as its species turnover (β diversity). Considering the accentuated seasonality, we evaluated changes in spider communities in dry and rainy seasons. In addition, we examined how three environmental variables (temperature, precipitation, and evaporation) affect orb-weaver spider communities in the short (same month) and long (next month, two, and three months) terms. Finally, we evaluated the completeness of the taxonomic inventory and estimated the expected richness in the areas and the time needed to achieve a complete record of orb-weaver spiders.
Among the three localities, the most conserved area was EL which presented the typical TDF vegetation with the highest orographic complexity among the study sites; characterized by a series of hills and valleys with a large proportion of original vegetation, although some rainfed agricultural activities occupied part of the area.
The second locality, HA, is a valley with a riverbed and a road with a mosaic of riparian vegetation with patches of preserved and disturbed TDF. The riparian vegetation along the riverbed comprises trees above the TDF height average, which retain their leaves even during the dry season. The conserved TDF was found on the hills surrounding the valley, and the disturbed TDF was found near agroecosystems of Zea mays L., Phaseolus vulgaris L., and Cucurbita spp. associated with the roadside (per. obs.).
The third locality, SME, is outside the REBIOSH and includes secondary vegetation mainly of thorny shrubs (Mimosoid clade, Leguminosae) and several agroecosystems (Zea mays, Phaseolus vulgaris, Cucurbita spp., Agave spp., and Saccharum officinarum L.). The presence of human settlements is one of the principal causes of disturbance within the area, where the main economic activities are agriculture and raising livestock (per. obs.). In the three study sites, the agroecosystems were avoided for sampling.

2.2. Sampling Protocol

Sampling was conducted monthly at the three localities from April 2013 to March 2014. Spiders were collected under collection permits SGPA/DGVS/00269/13 and FAUT-0209, issued by the General Direction of Wildlife (Direction General de Vida Silvestre). Sampling was performed by a total of five people on walks during seven daylight hours (10:00–17:00). At each locality, two different techniques were used to collect the spiders. During the walks, three people used a beating technique [38] to shake spiders loose from bushes and trees into a beating sheet (100 cm × 100 cm). The other two people used a direct search technique, collecting the araneids they found in the vegetation from knee height to two meters above the ground (“looking up” [39]). The captured spiders were deposited in vials with 70% ethanol for later labeling with curatorial data. Pitfall traps are only suitable for cursorial forms [40]), which do not affect the study results since orb-weavers have a mainly aerial lifestyle and rarely occur as cursorial spiders. In those cases, the direct search technique allowed the inclusion of those specimens.

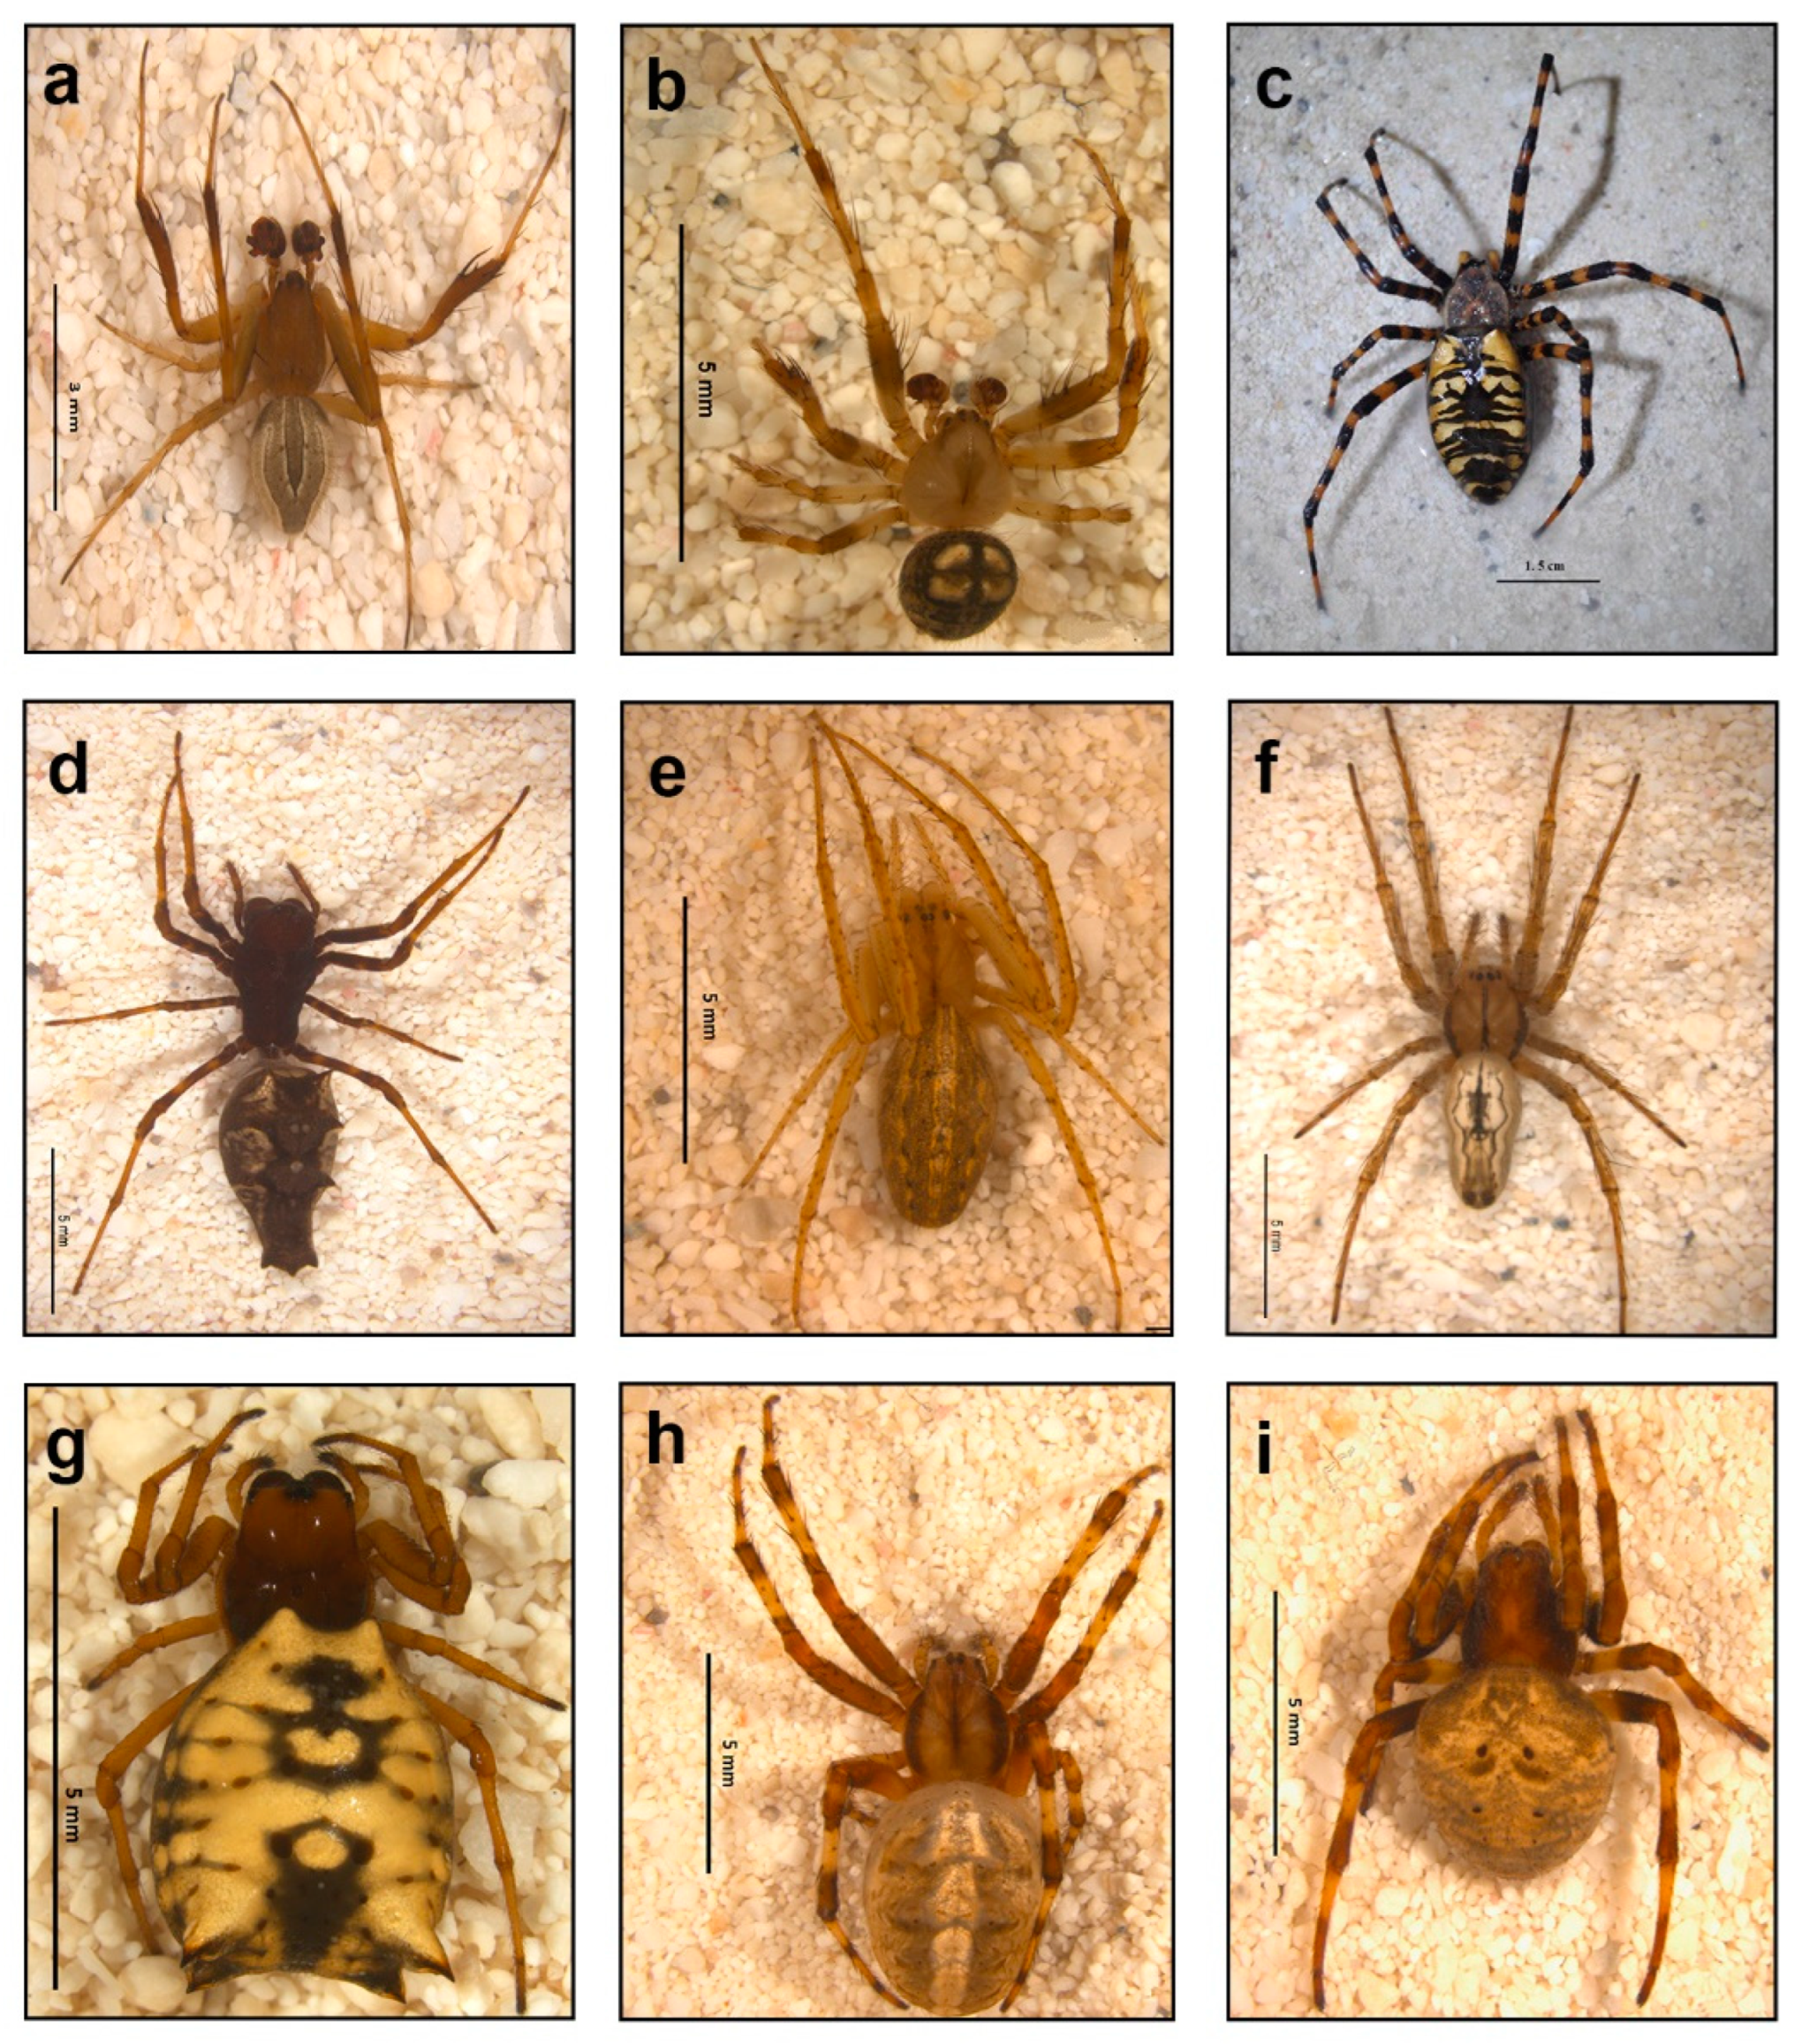
2.3. Taxonomic Determination

Spiders were identified by examination under a stereoscopic microscope (Carl Zeiss, model Stemi 2000), using taxonomic keys to determine the family [41], genera [30,42], and species of Araneidae [43,44,45,46,47,48,49,50,51,52,53,54]. We used The World Spider Catalog [27] to corroborate species distribution and the validity of names. The material collected was deposited at the National Arachnid Collection (Colección Nacional de Arácnidos, CNAN) at the Institute of Biology (Instituto de Biología, IB) of the National Autonomous University of Mexico (Universidad Nacional Autónoma de México, UNAM), under the consecutive specimen numbers from CNAN-AR011161 to CNAN-AR011193. The specimens were photographed under a Leica stereoscopic microscope, model Z16 APO A, with a Leica DFC490 camera, using the Leica application Suite LAS 4.3.0 software at the Laboratory of Microscopy and Biodiversity Photography (II) at the IB, UNAM.

2.4. Vegetation Characterization

To obtain data on the floristic composition for each site, the predominant species in each locality and those from which the spiders were collected were registered and identified in the field with the help of experts in local biodiversity and the literature for Morelos [55,56]. In cases where field determination was unavailable, pictures of the main diagnostic characteristics were taken and determined by the specialist in the groups (Table S1). Classification and valid names follow the proposal of World Flora Online [57].

2.5. Environmental Data and Seasonality Delimitation

We obtained climate data (average precipitation, evaporation, and temperature) from three meteorological stations (MS). The MS of El Limon was used to evaluate data for EL, MS of Huautla for HA, and MS of Nexpa for SME [58,59,60]). The dry season begins when evaporation values increase above precipitation values; on the other hand, the rainy season starts when precipitation values increase above evaporation ones [61]. Based on data from MS, we determined that the dry season during the study period was from November through May, and the rainy season was from June to October.

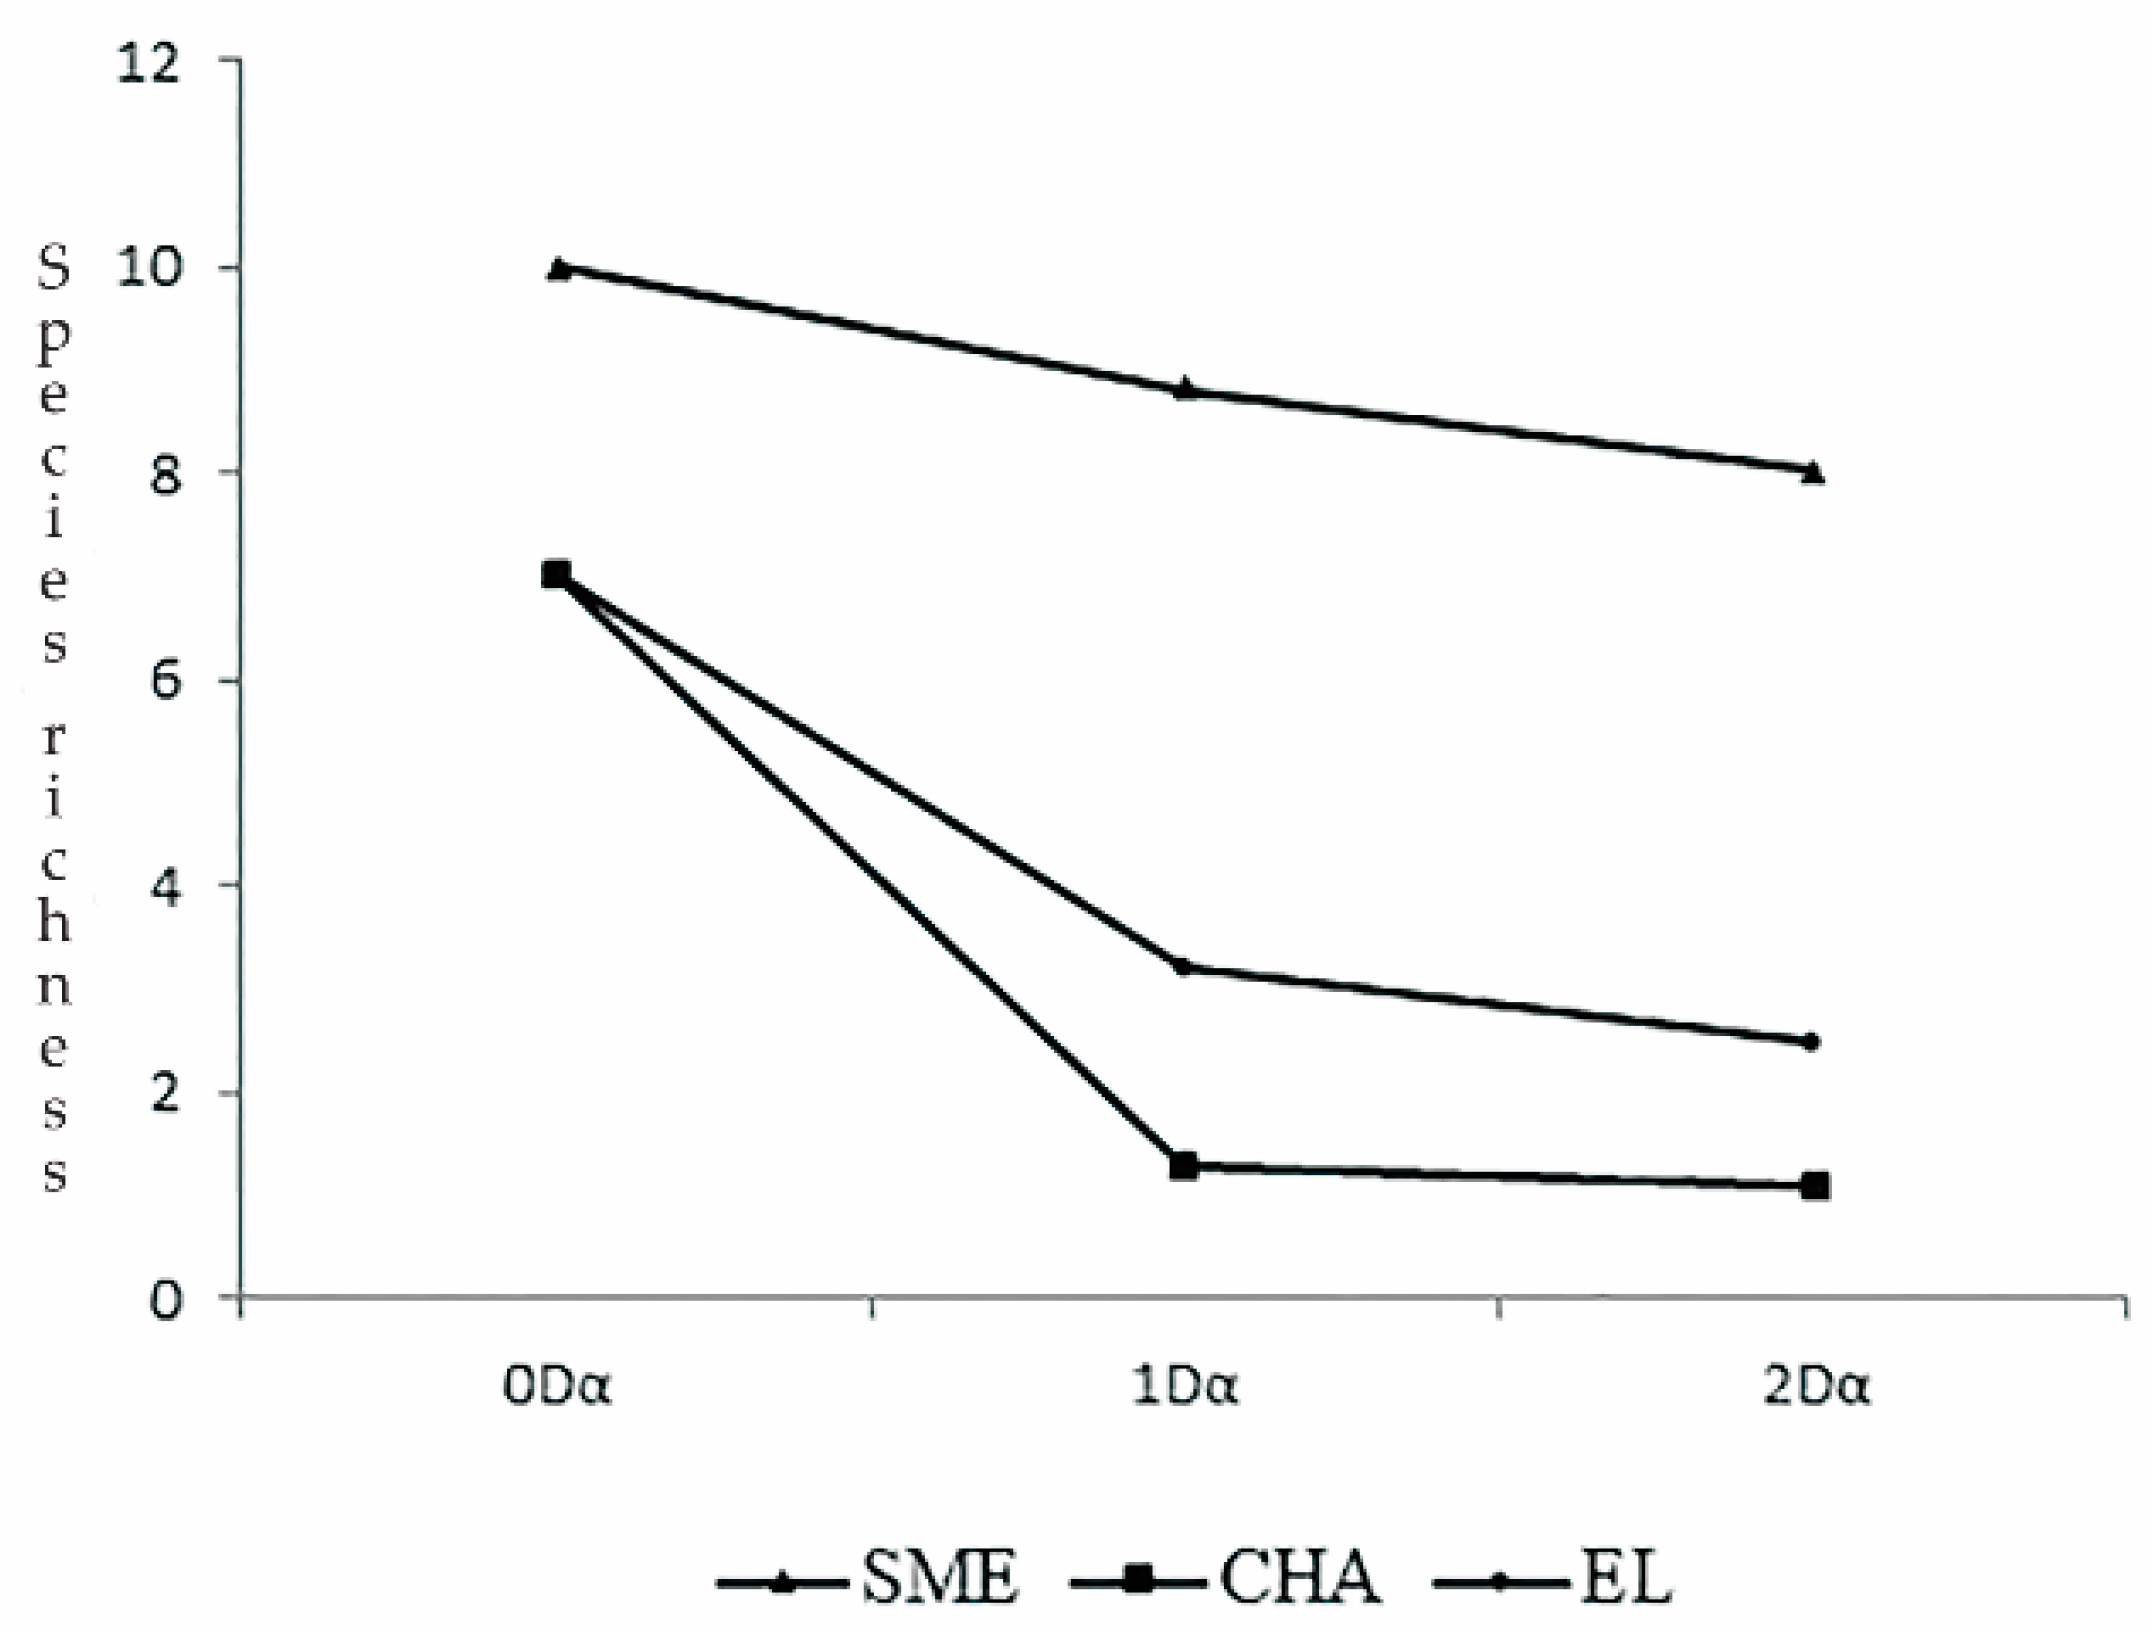
2.6. Diversity Analysis

Description and Evaluation of the Spider Community Structure

An analysis of species richness, diversity, composition, and dominance included only mature individuals due to the limitation that juveniles cannot be accurately assigned to species without sexual characteristics. However, we used the total individuals when evaluating the abundance within and between localities and seasonality. To assess alpha diversity at each locality, the effective number of species was estimated and calculated using Hill’s formula with q-values of 0, 1, and 2. We followed the proposal of Jost [62], where q = 0 considers the species richness only (0D), q = 1 weights species in proportion with their relative abundance (1D), and q = 2 overvalues common species (2D) [62,63,64]. Finally, we performed a diversity/dominance plot to represent the dominant species among sites. All the analyses were estimated using the software PAST 3.14 [65], except for the diversity/dominance plot constructed directly in Excel.

2.7. Spider and Plant Beta Diversity

A dissimilarity analysis between the three sites was calculated with presence-absence data using a broad and narrow-sense turnover index; the Jaccard index (ßj) was used as a broad-sense turnover index, while the ß Simpson (ßsim) was used to calculate turnover in a narrow sense [66]. The values of the ßj index ranged from 0 to 1, where a value of 0 denoted no shared species, and values approached 1 when the two sites had the same species composition. Given that the Jaccard coefficient measures similarity, the result is understood to be the inverse of beta diversity; therefore, the species turnover was calculated, for each locality, as follows: ß = 1 − Ij [67]. Inversely, the ßsim index reached a value of 1 when no species were shared among sites and a value of 0 when two sites shared the same species composition [68].

2.8. Seasonality and Phenological Analysis

To analyze phenology, we compared the total abundance and richness versus precipitation and evaporation by month at each locality. Diversity was evaluated with effective a number of species and q = 1 and q = 2 values. Seasonality composition was evaluated with ßsim and ßj indices. Finally, changes in dominance were evaluated using a dominance/diversity plot.

2.9. Effect of the Environmental Variables on the Spider Community

To evaluate the effects of the environment (temperature, precipitation, and evaporation), a polynomial regression model was performed, with the environmental data of the current month indicating independent variables and the richness, abundance, and diversity of the same month as dependent variables for each locality (M0). For the evaluation of the total community (data from SME, HA, and EL together), the mean values of the three environmental variables were calculated. The data were evaluated in the software PAST 3.14 [65]. To explore the possibility that orb-weaver spiders responded with delay to changes in the environmental variables, as reported by other authors [6], three sets of regressions were carried out, evaluating the effect of one- (M-1), two- (M-2) and three- months (M-3) delay of the environmental variables on the spider community variables (abundance, richness, and diversity). Differences in precipitation, evaporation, and temperature between locations were tested with ANOVA. Only statistically significant results were provided.

2.10. Non-Parametric Richness Estimators

We performed the non-parametric richness estimators Chao 1 and Chao 2 based on abundance and incidence data, respectively. The Chao 1 estimator calculates the number of species that are expected based on the number of species represented by a single individual (singletons) and the number of species represented by two individuals (doubletons) in the full sample. Chao 2 estimates the total number of species using the number of species occurring in a single sample (unique) and the number of species sharing two samples (duplicates), regardless of their abundance [69]. Chao 1 and 2 values were calculated using EstimateS 8.2 [70].

2.11. Species Accumulation Curves Based on the Clench Model

We used species accumulation curves to graphically present the increase in the number of species added to the inventory as the sampling effort increased in a defined area. Sampling effort was expressed in sampling units to simplify the design of the collection protocol [71]. In this study, each sampling unit represents a complementarily set of two collection techniques (beating sheets and direct search of the vegetation) applied by five people for seven daylight hours in each locality, once per month.
Species accumulation curves were constructed using the software EstimateS 8.2 [70]. We used 100 randomized iterations with the following data: the number of units of sampling effort (samples) and the average number of species accumulated (Sobs). These data were analyzed with software STATISTICA 7.0 [72], and the Clench model was applied; then, the “Simplex and Quasi-Newton” method was applied, which helped to fit the parameters of the model to the observed data. We used several parameters from the a and b functions to determine whether the inventories and samplings were sufficient. The parameters used were the following: (a) the asymptote of the curve, which indicates the total number of expected species; (b) the slope of the curve, which determines the rate of incorporation for new species into the inventory in the chosen sampling unit; if the slope is less than 0.1 the inventory can be considered reliable; (c) the proportion of spiders recorded, considering at least a 70% sufficient proportion; (d) an estimation of the number of sampling effort units (SEU) needed to record 95% of the species; based on the difference between the SEU performed and this estimate, we quantified the time (years) required to collect 95% of the species present in the study area.

3. Results

3.1. Spider Community

A total of 674 individuals of the family Araneidae were collected, of which 302 were adults (214 ♀♀ and 88 ♂♂), and 372 were juveniles. The composition of the araneid community in the three localities comprised 14 genera and 17 species, from which eight species were new records for Morelos. The genera with the highest species richness were Mangora, Mecynogea, and Micrathena, with two species each, and the rest of the genera were represented by a single species (Table S2). The dominant species were Neoscona oaxacensis (Figure 2h), with 225 specimens, and Trichonephila clavipes, with 45, while the rest of the species were represented by less than 10 individuals (Figure 3, Table S2). SME was the locality with the highest richness, followed by HA and EL, both with the same number of species. In contrast, the highest abundance of araneids was in HA, and the locality with the lowest abundance was SME. In terms of diversity (1D and 2D), the most diverse locality was SME, followed by EL; HA is the locality with the lowest diversity (Figure 4). Regarding 1D diversity, SME is 2.76 times more diverse than EL and 6.77 times more diverse than HA, and EL is 2.44 more diverse than HA.
  • SME
The spider community in SME consisted of 10 species, each belonging to one genus. The abundance was represented by 79 individuals (21 adults, 58 juveniles, Table 2). The community had 8.828 equally abundant (1D) and 8.019 equally dominant species (2D) (Table 3). N. oaxacensis was the dominant species (N = 4) in the community.
2.
HA
The spider community in the HA was composed of seven species, each belonging to one genus. The abundance was represented by 409 individuals (208 adults, 201 juveniles, Table 2). The community had a diversity of 1303 species of equal abundance (1D) and 1102 species of equal dominance (2D) (Table 3). N. oaxacensis was the dominant species in the community (N = 198).
3.
EL
The spider community in EL consisted of seven species in six genera. The abundance was represented by 186 individuals (73 adults, 113 juveniles, Table 2). The community had a diversity of 3189 equally abundant species (1D) and 2470 equally dominant species (2D) (Table 3). T. clavipes was the dominant species (N = 40) in the community.

3.2. Plant Community Description

The locality of SME has a plant community comprising 15 families, 22 genera, and 28 species, while HA comprises 15 families, 31 genera, and 35 species. Finally, EL was the richest locality, with 41 species in 26 genera and 15 families. Leguminosae is the richest family in SME and HA, with nine and ten species, respectively. In EL, the family Burseraceae is the richest one, with 11 species (Table S1).

3.3. Spider and Plant Beta Diversity (β)

From the 17 total spider species collected, 11 (69%) were exclusive to the locality where they were collected. SME was the locality with the highest percentage of exclusive species (six species, 38% of the total), followed by HA (three species, 19% of the total) and EL (two species, 13% of the total).
Regarding the spider species turnover with a broad sense analysis (ßj), SME and HA differed in 86% of the species, while SME and EL differed in 78%. Finally, the two localities within the REBIOSH presented the lowest species turnover, with 72% of the species changed. On the other hand, the narrow sense analysis (ßsim) showed the greatest turnover between SME and HA, with 77% of species change and a similar value for EL with SME and HA, with 70% in both cases (Table 4).
The plant composition turnover between localities showed that, as in spiders, both localities within the REBIOSH share more species, with a ßj of 81% and a ßsim of 74% of dissimilarity (Table 5).

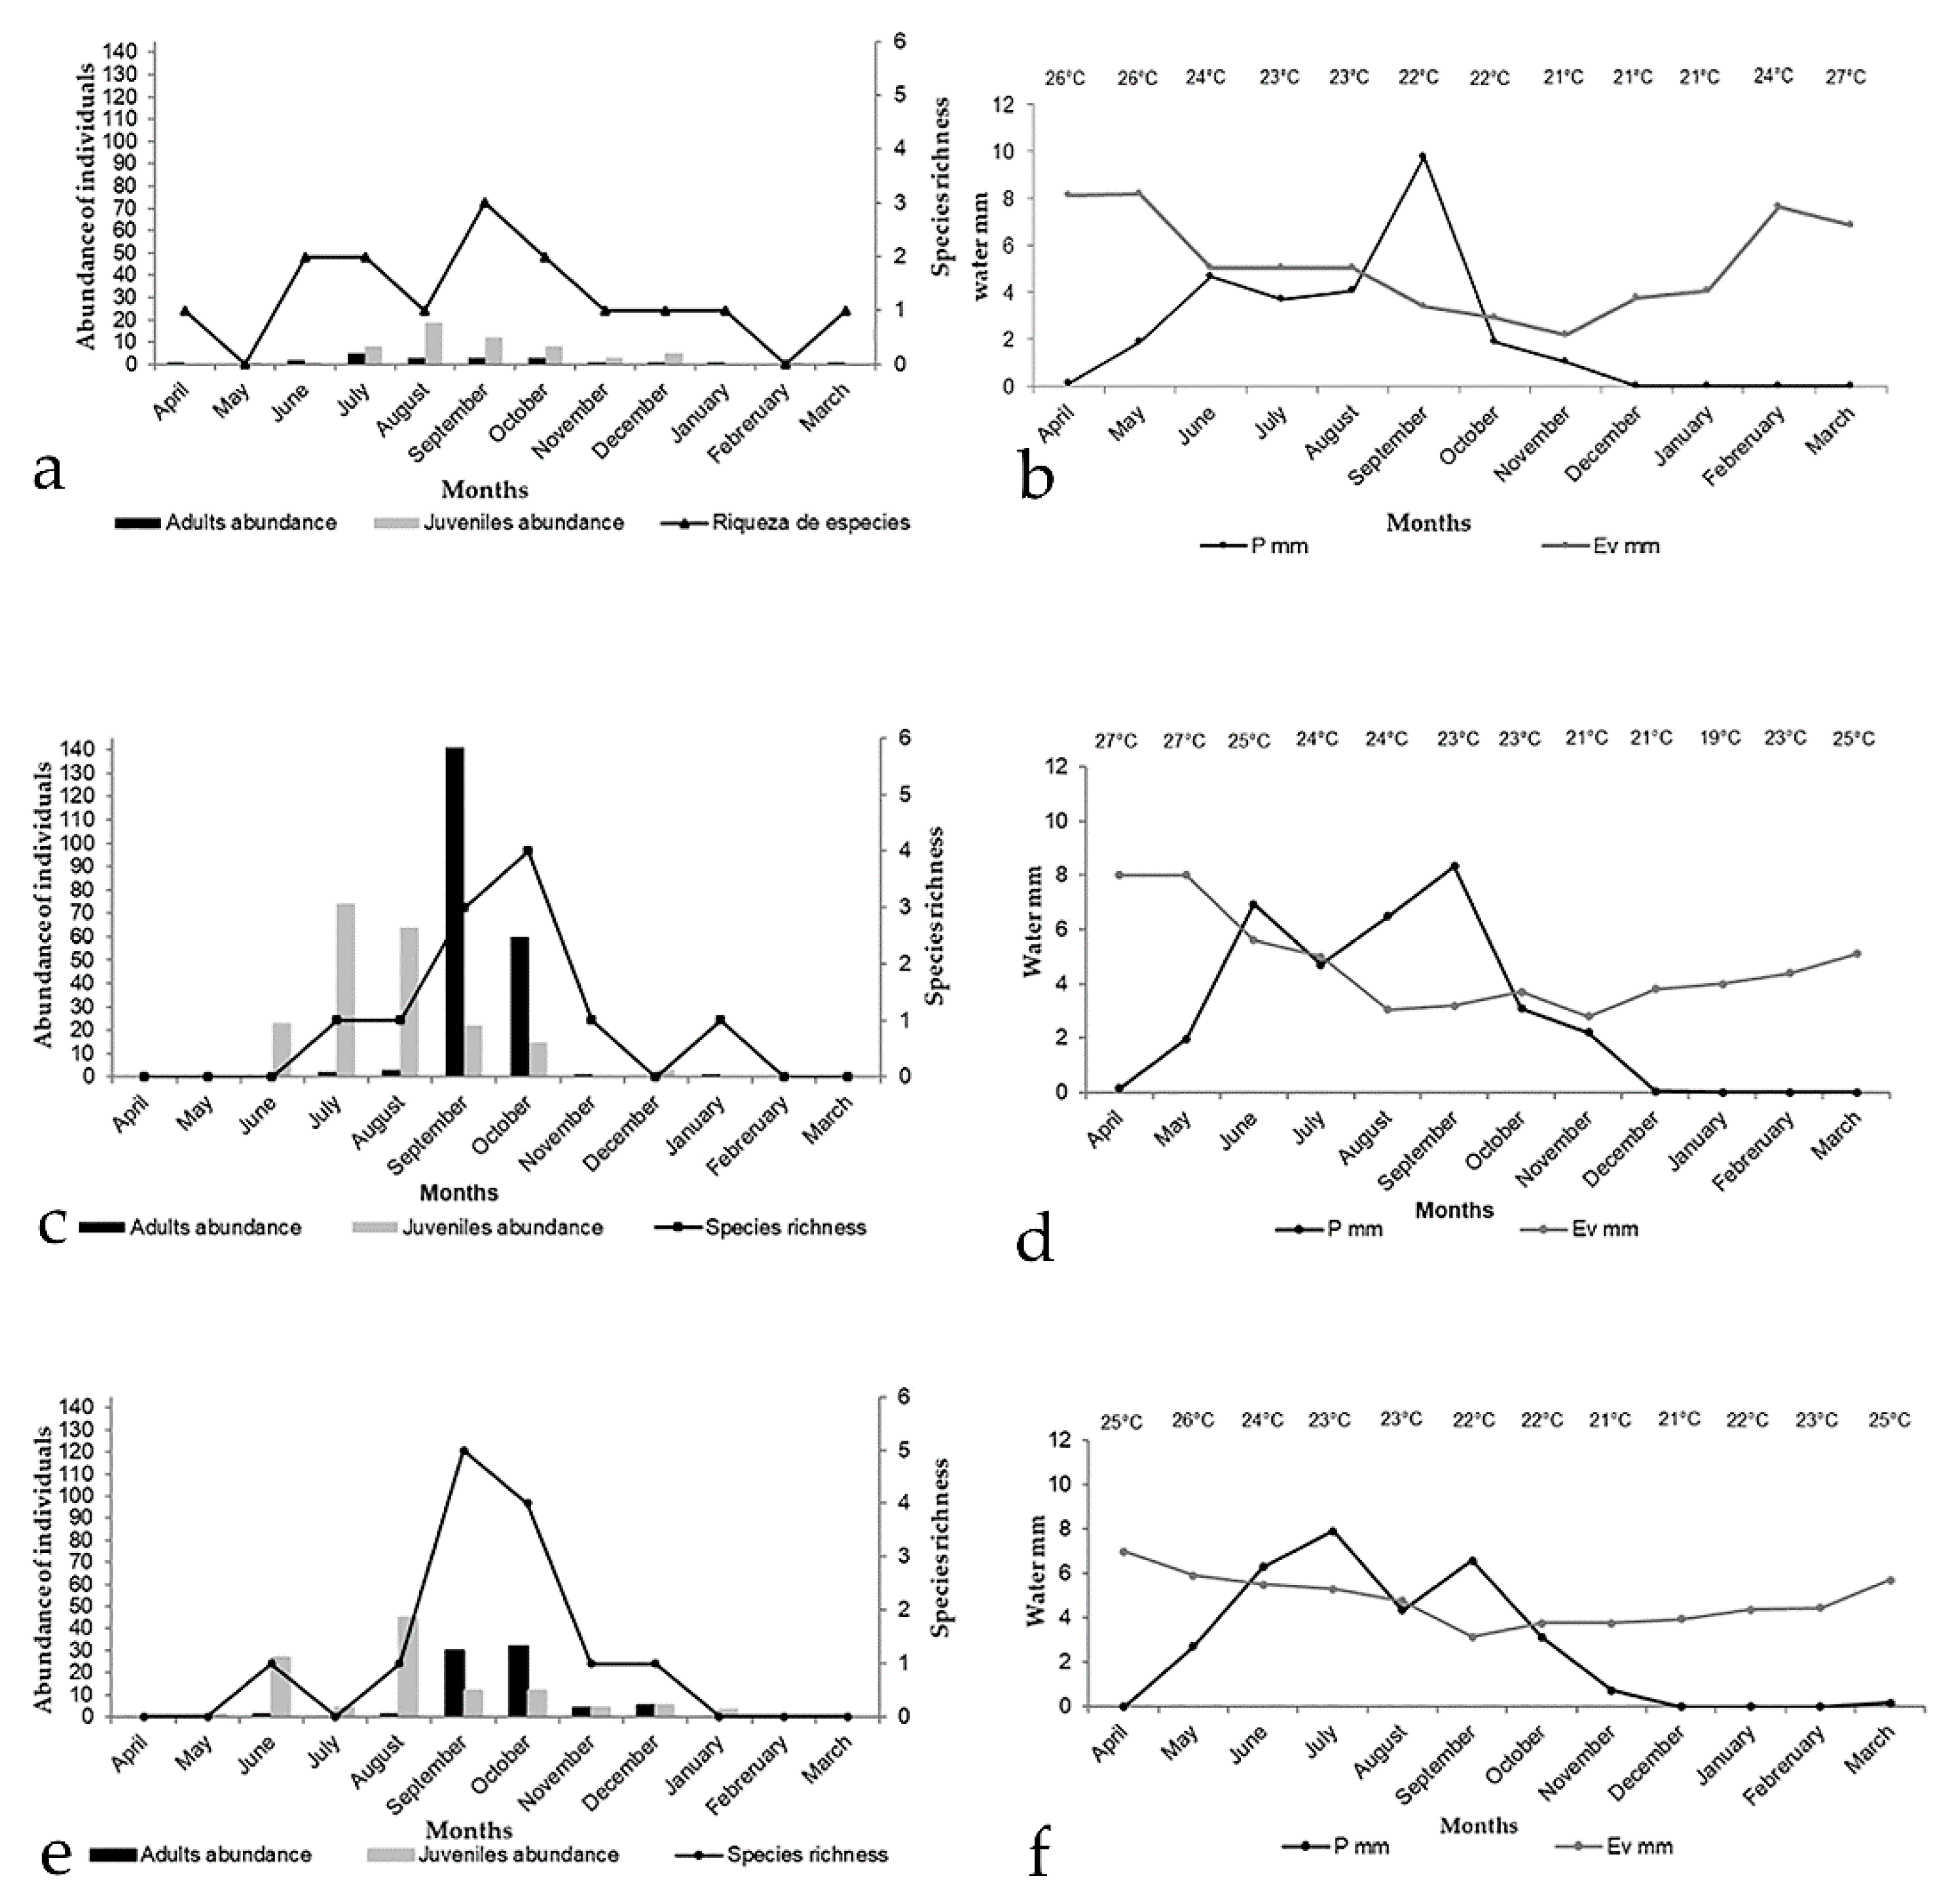
3.4. Seasonality and Phenology

3.4.1. SME

When evaluating the community structure between seasons, the wet season showed the highest value for richness (N = 8), abundance (N = 64), 1D diversity (6.87), and 2D diversity (6.09). By contrast, the dry season spider community consists of three species and 15 individuals, with a 1D diversity of 2.87 and a 2D diversity of 2.77. There is a turnover of spider composition of 75% and 90% of species with ßsim and ßj, respectively.

3.4.2. HA

The community structure between seasons shows the highest levels of richness (N = 6) and abundance (N = 404) during the rainy season, while the dry season accounts for two species and five individuals. On the other hand, diversity seems to be higher in the dry season (1D and 2D diversity = 2) than in the wet season (1.26 and 1.09, respectively). Although, this could be the result of the sample size rather than an accurate reflection of the diversity in the season. Regarding the turnover of spider composition, there is a dissimilarity of 66% and 85% for the species with ßsim and ßj, respectively.

3.4.3. EL

The community during the wet season consisted of the seven recorded species and 164 individuals, with a 1D diversity of 3.32 and a 2D diversity of 1.65. In contrast, the dry season community consisted of two species and 22 individuals, with a 1D diversity of 1.98 and a 2D diversity of 1.97. The species turnover between the seasons comprised 50% and 71% of the species with ßsim and ßj, respectively.
Regarding spider phenology, the maximum richness and abundance values coincided with the rainy season (June-October). Meanwhile, the minimum richness and abundance values were present during the dry season (November-May) (Figure 5). As for the activity of adult araneid species in the number of months recorded, eleven species were present during the rainy season, two in the dry season, and four were active during both seasons: Araneus pegnia, Larinia directa (Figure 2e), Trichonephila clavipes and Neoscona oaxacensis. Among these species, Neoscona oaxacensis had the most activity throughout the year (July–November). There were also temporal differences in the total abundance of orb-weaver spiders since we collected 632 individuals (346 juveniles and 286 adults) during the rainy season and 42 individuals (26 juveniles and 16 adults) during the dry season. The highest richness values in SME (N = 3) and EL (N = 5) were reached in September, while in HA, the highest month was October (N = 4). On the other hand, the highest abundance values were in August in SME (N = 22) and EL (N = 46) and in September in HA (N = 163). Concerning juveniles, 93% of the individuals were present in the rainy months, and the highest abundances were in July in HA (N = 74) and August in SME and EL (N = 19 and 45, respectively).

3.5. Effect of Environmental Variables

Regression models show that the community at each locality responds differently in the short- and long-term.
In SME, M0 presents a positive effect on precipitation and abundance (R2 = 0.50; F = 4.511; p = 0.04) and richness (R2 = 0.53; F = 5.133; p = 0.03) and only a marginal effect on diversity (R2 = 0.47; F = 4.064; p = 0.05). When the long-term effect of the environmental variables was evaluated with a one-month (M-1) delay, precipitation continued to have a positive and stronger effect on abundance (R2 = 0.86; F = 25.493; p = 0.0003) and richness (R2 = 0.55; F = 4.980; p = 0.03), while now a statistically significant effect on diversity was also observed (R2 = 0.53; F = 4.513; p = 0.04). At an M-3 delay, evaporation (R2 = 0.71; F = 7.361; p = 0.02) and temperature (R2 = 0.75; F = 9.348; p = 0.01) had a significant effect on orb-weaver abundance.
For HA, M0 and M-1 showed a significant effect of precipitation on the spider abundance (R2 = 0.68; F = 9.738; p = 0.005, and R2 = 0.65; F = 7.675; p = 0.01, respectively). At M-2, the effect of precipitation on abundance was maintained (R2 = 0.57; F = 4.770; p = 0.04), while the effect of precipitation on richness (R2 = 0.63; F = 6.091; p = 0.02) and temperature on abundance (R2 = 0.58; F = 4.912; p = 0.04) was also observed. Finally, with a delay of M-3, only temperature still had an effect on abundance (R2 = 0.68; F = 6.490; p = 0.03).
At EL, evaporation had a negative and statistically short-term (M0) effect on abundance (R2 = 0.58; F = 6.348; p = 0.01), richness (R2 = 0.49; F = 4.327; p = 0.04), and diversity (R2 = 0.49; F = 4.428; p = 0.04); precipitation had a positive effect in the long-term (M-3) overabundance (R2 = 0.74; F = 8.560; p = 0.01), richness (R2 = 0.70; F = 7.322; p = 0.02) and diversity (R2 = 0.70; F = 7.258; p = 0.02).
When the total richness, abundance, and diversity were tested against mean values of precipitation, evaporation, and temperature for the three localities, evaporation had a negative short-term (M0) effect on orb weaver abundance (R2 = 0.59; F = 6.500; p = 0.01) and richness (R2 = 0.49; F = 4.457; p = 0.04). On the other hand, precipitation had a positive long-term (M-1) effect on richness (R2 = 0.62; F = 6.576; p = 0.02) and abundance (R2 = 0.75; F = 12.048; p = 0.003), this last effect remained at an M-2 delay (R2 = 0.63; F = 6.062; p = 0.02).

3.6. Richness Estimators

The Chao 1 estimator, based on singletons and doubletons, indicated that the locality with the highest number of expected species was HA (17 species), followed by SME (14 species) and EL (10 species). Similarly, the Chao 2 estimator, using the analysis of unique and duplicate samples, coincided with the results of Chao 1, with the highest number of estimated species in HA (20.75 species), followed by SME (16 species) and EL (9.25 species). Thus, based on the results of the estimators, the remaining species to be recorded at each locality were, in the case of HAm 10 and 14, for SME, four and six, and lastly, for EL, three and two (Chao 1 and Chao 2, respectively, Table 3).

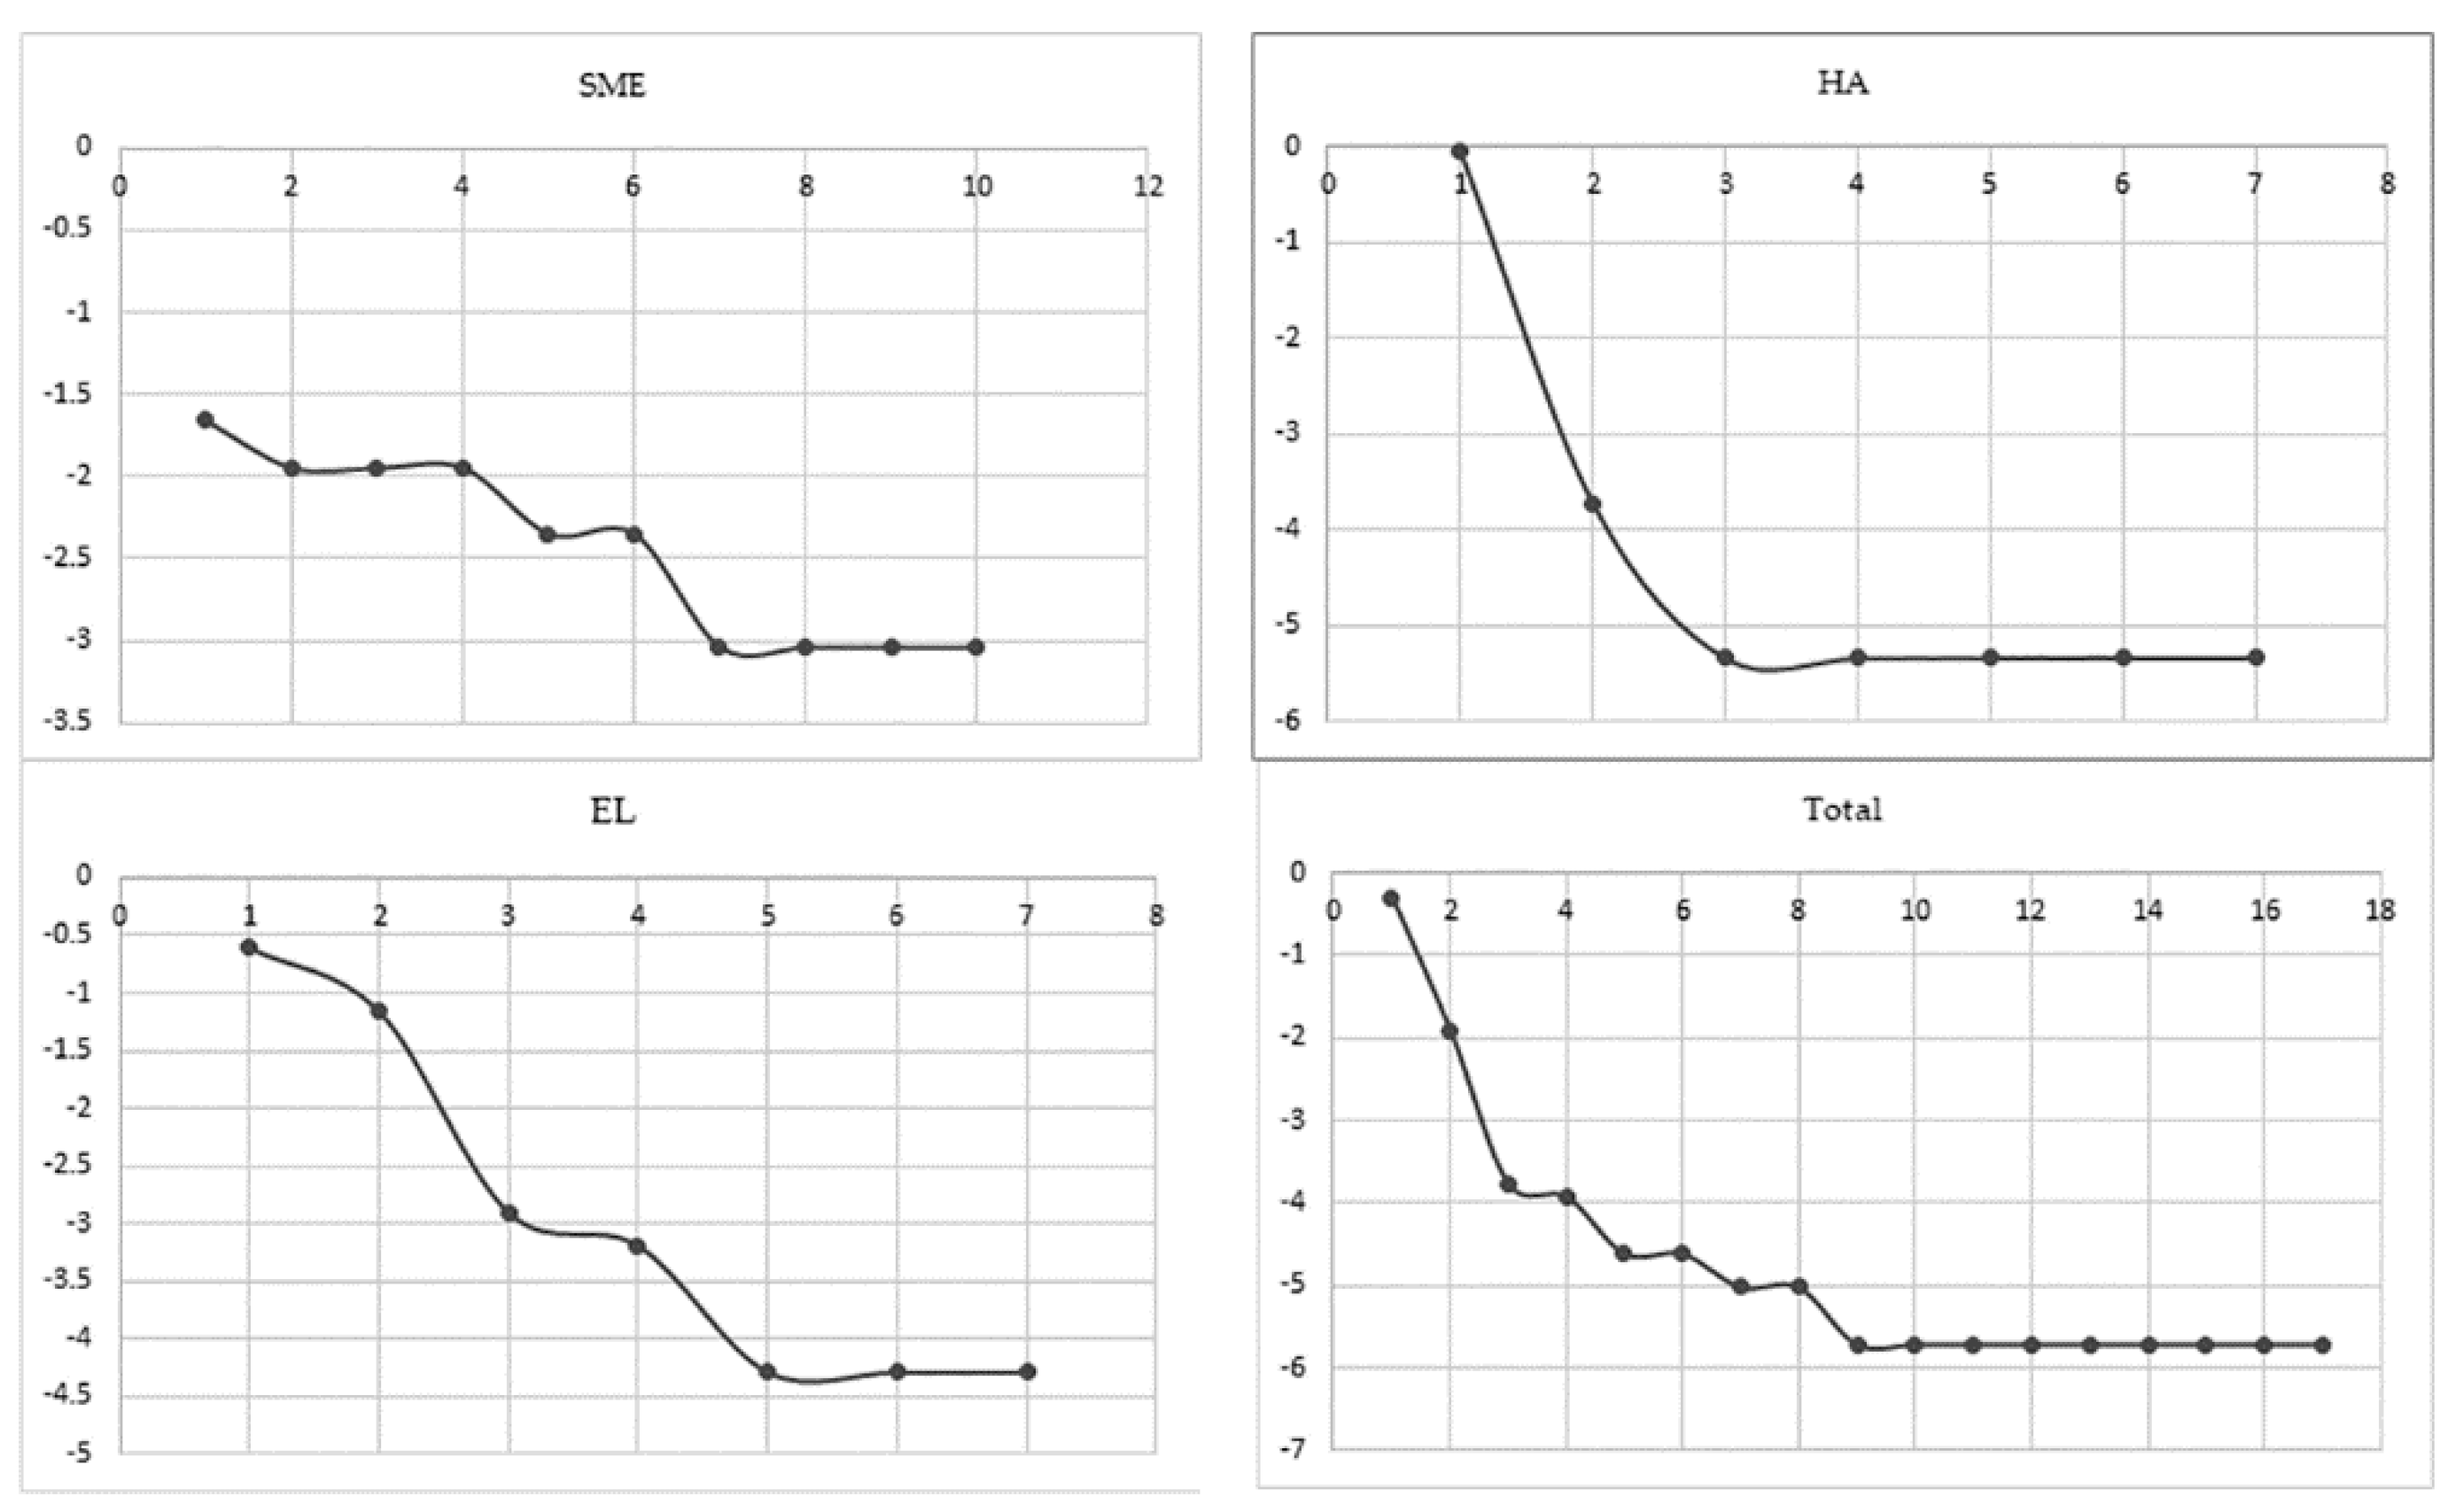
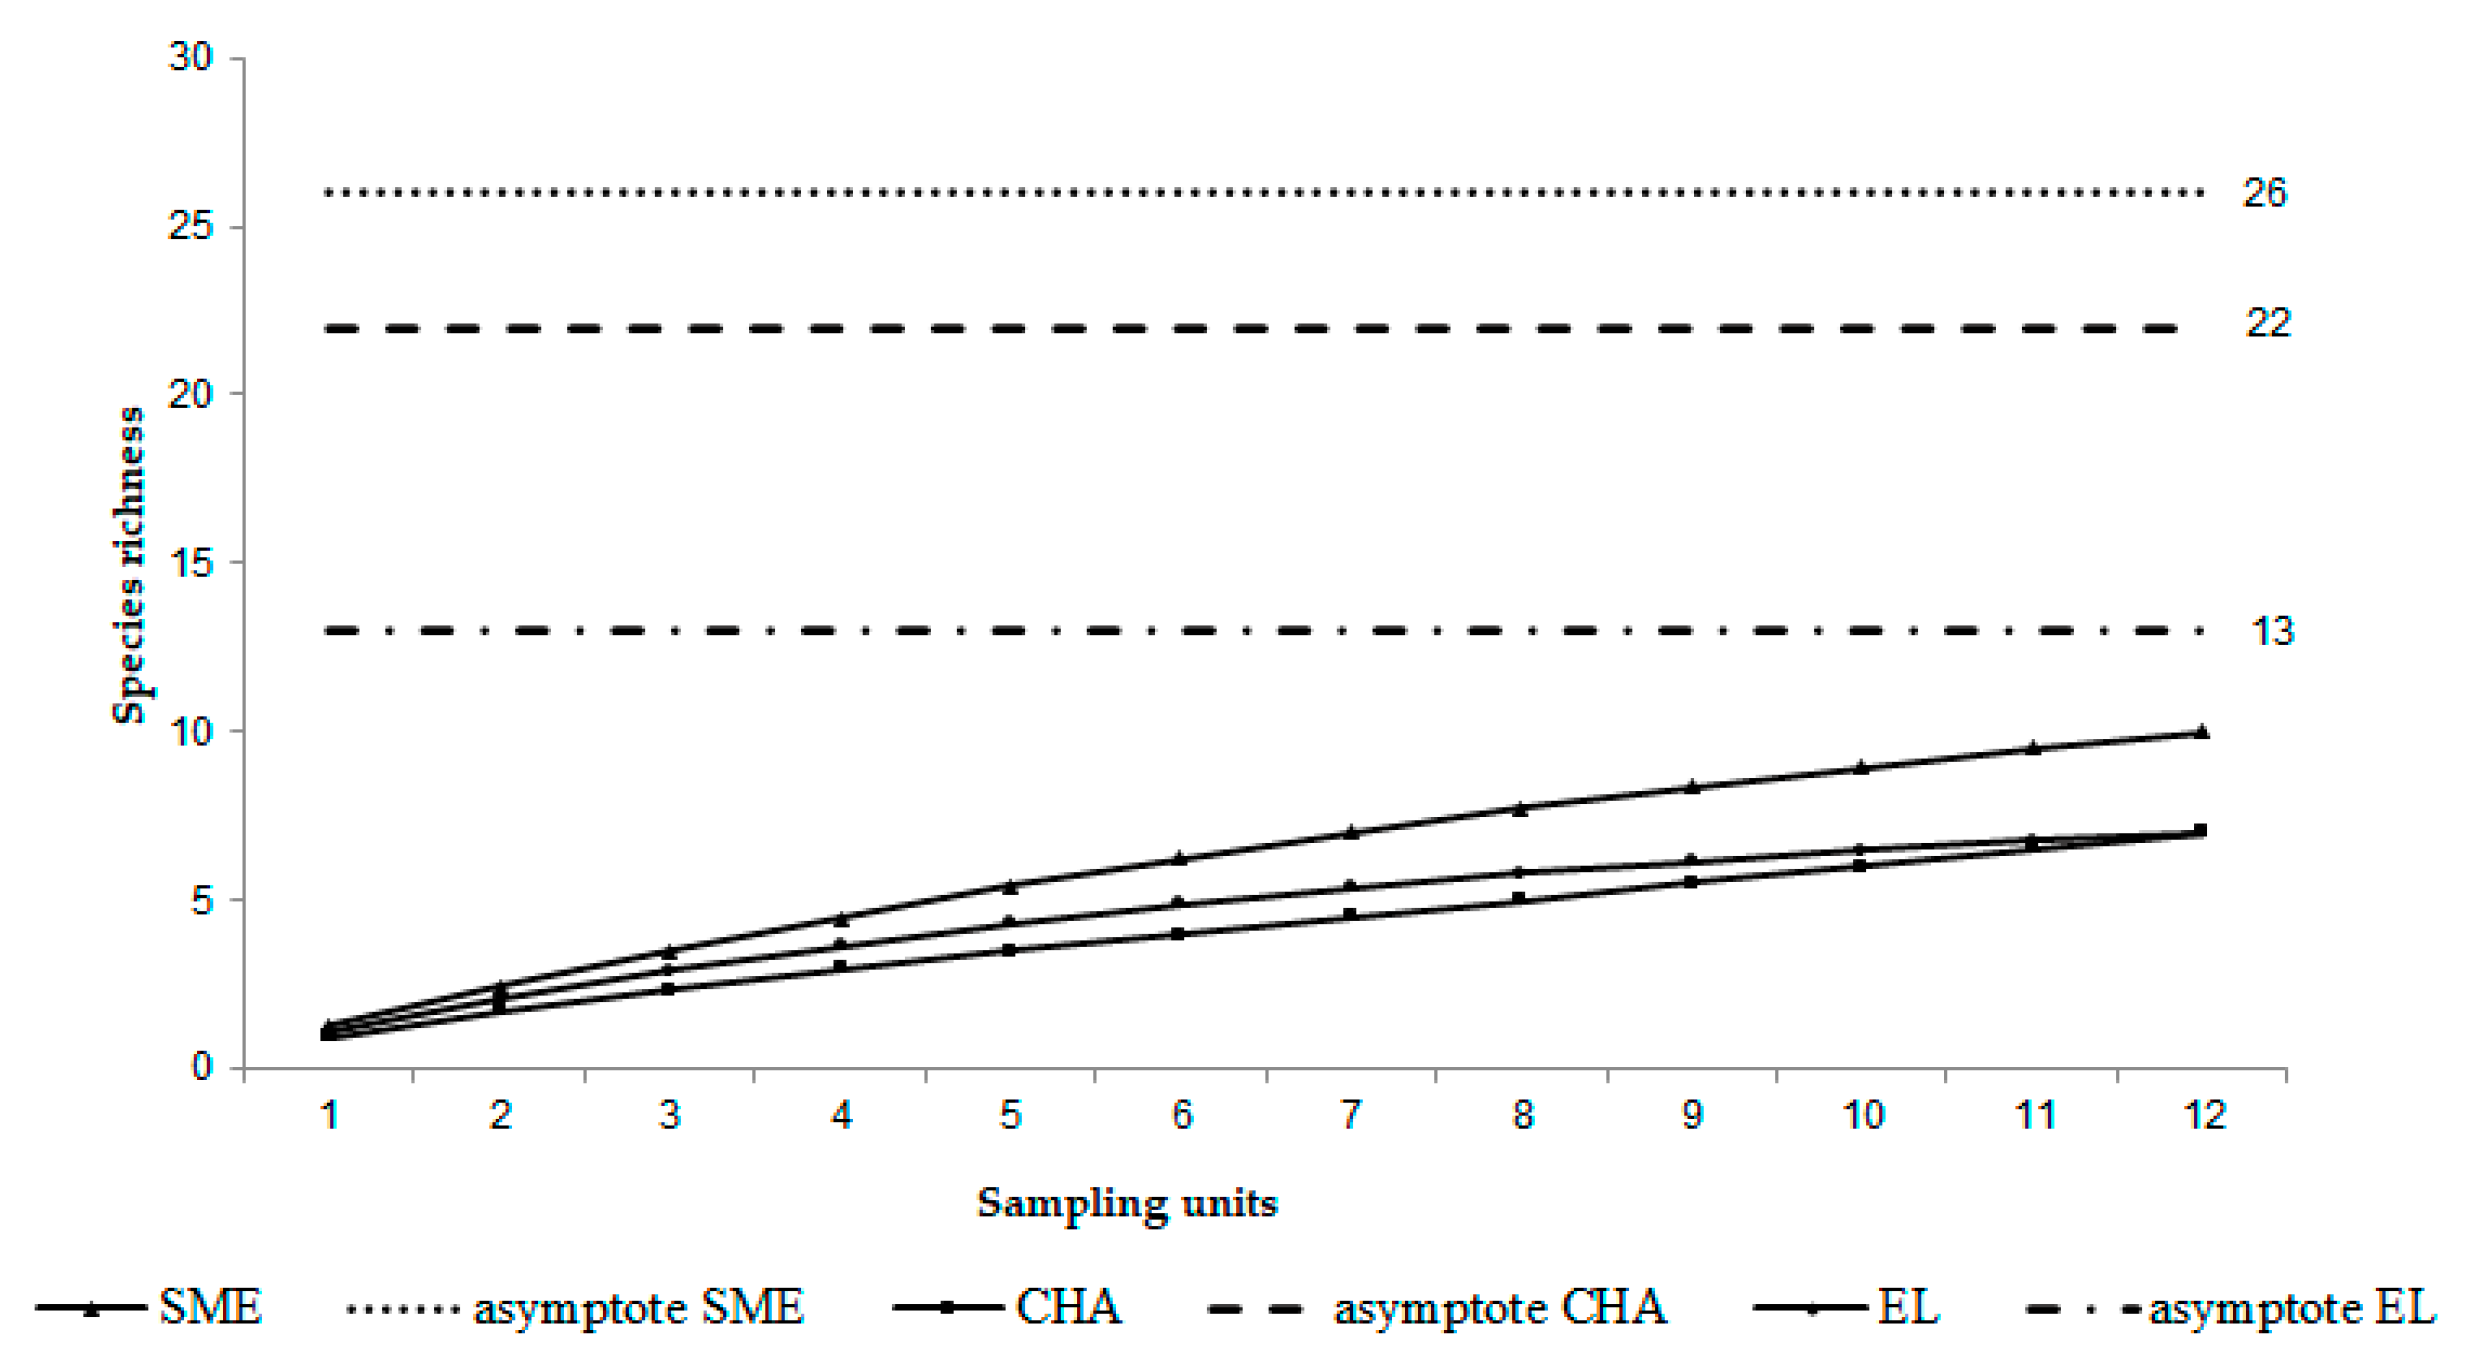
3.7. Species Accumulation Curve

The species accumulation curves at the three localities did not reach the asymptote (values are shown in Table 6), and the slope values were higher than 0.1, which meant that the inventories at these localities were incomplete (Figure 6). According to the results of the species accumulation curves, in SME, we collected 38% of the species estimated at the asymptote. To collect 95% of the species present at the locality, the sampling effort needed to be increased by 359 sampling effort units (SEU) to obtain the remaining 57% of the species. In this context, following the same sampling effort as in this study and considering that every 12 SEU corresponds to a year, the species inventory of araneids took approximately 30 years to be nearly complete (Table 6). For the HA locality, we collected 31% of the total species estimated by the asymptote; to reach 95% of the species at this locality sampling effort would need to increase by 501 SEU to collect the remaining 64% of species, which would take approximately 42 years. In EL, we collected 53% of the species estimated by the asymptote; therefore, we would need to increase sampling by 189 SEU to collect the remaining 42% of species, which translates into 16 additional years of sampling.

4. Discussion

Spider composition: Currently, 46 genera and 227 species are recorded in Mexico [27]. In Morelos, 19 species from 12 genera were reported [43,44,45,46,47,48,49,50,51,52,53,54,73], representing 8% of the total araneid species reported for the country. Since most of the species recognized in Morelos were detected through sporadic sampling, only the studies with Trichonephila clavipes at the El Limón de Cuauchichinola (EL) locality included ethological and morphological aspects [74]. These findings above show the poorly known diversity of araneids in this state and the localities therein.
Of the 17 total species recorded, eight were new records for the state. The number of araneid species reported in Morelos increased from 19 to 27 species. The above means that Morelos contained 14% of the total number of Araneid species reported in Mexico, which is a high percentage considering the small number of inventories carried out in the state. There is only a previous inventory work of orb-weaver spiders for the study site [21]; they report four genera and seven species from Morelos, of which all the genera and four species were also recorded in the present study.
On a larger scale, our study shared 12 species with Candia-Ramírez and Valdéz-Mondragón [75], who evaluated the spiders from the Orbiculariae clade in a tropical rainforest in Calakmul, Campeche, and five species with De la Cruz-Pérez et al. [76], from Theobroma cacao L. agroecosystems in Tabasco, Mexico. Since most of the species recorded in the present study have a wide distribution in Mexico and America [27], it is not surprising that there was a high percentage of shared species in other states with different vegetation types. However, the construction of actualized inventories remains relevant for monitoring the localities under study or the better comprehension of the ecological and distribution patterns of the species.
Richness: There are few studies describing the richness of the araneid community for the TDF in general and for the Mexican TDF in particular. Cabra-García et al. [77] record from a TDF at Colombia 20 genera and 28 morphospecies, from which seven genera and two species are shared with the present study. In contrast, and despite the proximity of the study site, Corcuera et al. [78] recorded four genera and species of orb-weaver spiders from a TDF in Jalisco, Mexico, of which the four genera and one specie (N. oaxacensis) are shared with our results. Our study reported intermediate values of richness between the two studies (14 genera and 17 species), reflecting how little is known about orb-weaver richness patterns in this vegetation type.
In the present study, the highest value of richness was recorded at SME, a locality in which legume trees and shrubs are the main vegetal component, which provides a complex microarchitecture that seems to favor spiders, as recorded by Corcuera et al. [78] who found a positive relationship between spider abundance and richness with bipinnate small-leaved plants, most of them in the Leguminosae family.
Another possible explanation for the high richness recorded at SME could be related to the higher alteration present in that locality and the presence of agroecosystems. Constant disturbance at the site may keep dominant species established and promoted the continuous opening of niches that may be occupied by many orb weaver spiders; in contrast, HA and EL are more stable localities in terms of the microenvironment and human disturbance, which promotes the establishment of dominant species (v. gr. N. oaxacensis and T. clavipes). Evidence supporting this explanation is provided by Esquivel-Gómez et al. [33], who found that agroecosystems with mixtures of trees showed a higher abundance, richness, and diversity of orb-weaver spiders, as well as different compositions when compared to monocultures. Similarly, patches of native vegetation near agroecosystems increased spider richness and the diversity of spiders in the fynbos biome [79].
Abundance: The family Araneidae is a common component in the spider community at the TDF, usually among the five more dominant species [7,80,81,82] and among the orb-weaver guild, which represents the family with the highest richness in several works [33,75,76]).
In terms of abundance, orb weaver spiders had the most success in HA compared to the other two localities, which could be related to the microenvironment. That is, in temporally contrasting environments such as TDF, canyons act as patches of resources that provide a favorable microenvironment (higher humidity, less sun exposure) and maintain foliage longer in the dry season, and thus allow insects that benefit from them to remain there (herbivores, pollinators), which translates into the increased availability of food and refuge for spiders [83,84,85].
Diversity: Alpha diversity showed the highest diversity in SMEs and the lowest in EL and HA. Although the degree t of anthropogenic disturbance was not analyzed in this study, SME was recognized as a locality that has lost a large proportion of its TDF and has undergone changes in land use due to the establishment of secondary vegetation, agricultural fields, and human settlements. Therefore, during our sampling, we collected araneids not only in areas of natural vegetation such as the TDF or riparian vegetation but also in disturbed areas around agricultural fields and human settlements. We hypothesized that the higher diversity in SME may result from the high evenness among species; probably, the high disturbance rate and the constant change in terrain architecture prevent the establishment of dominant species, thus increasing diversity values. Recent studies have shown that in forests with species that act as monocultures, spider diversity, and interactions are not only modified but also diminished [8,9].
Dominance: With regard to araneid dominance, the values varied greatly among species due to the under-representation of most species versus the dominance of a few. This was not an isolated case, as disproportion in relative abundance among recorded species has been very frequently reported in studies of diverse ecosystems and taxa [22,26,86] and is a common pattern in the TDF, with evidence among butterflies with Memphis pithyusa pithyusa R. Felder, reaching 54% of total abundance at one locality [22], hemipterans five species out of 32 reaching 80% of total abundance; ref. [87], and broad-nosed weevils (Coleocerus setosus, Rosas-Echeverría in prep). For example, N. oaxacensis was the most abundant species in the total sample and the only one present at all three study localities. This species has been similarly represented in samplings at other TDF localities in Morelos and other states [88,89]. The presence of this species is very common in Mexico [49,73], even in highly anthropized environments such as agricultural fields, gardens, and backyards [49,90]. N. oaxacensis is a species that inhabits different strata of vegetation (herbaceous, shrub, tree), a trait that decreases competition for food and space with other species, leading to a greater number of individuals [91], and this increased structural complexity provides a larger number of anchor points for web construction [92].
β Diversity: HA and SME are the localities with the highest species turnover between the spider and plant communities. These results are not consistent with the positive correlation between beta diversity and geographic distance that is frequently observed for several taxa [93], as SME was further away from EL (56 km) than from HA (45 km). However, other studies analyzing spider turnover also found that geographic distance had no effect on beta diversity [94]. The same authors found that environmental variables had good explanatory power in predicting species turnover of the Araneidae family. Nevertheless, in the three study sites, the ANOVA test showed no statistical differences in precipitation, temperature, or evaporation (p = 0.6; p = 0.8 and p = 0.7, respectively). Therefore, the variation in species composition among sampling localities could be due to the vegetation composition in each location, as both SME and EL presented a traditional TDF physiognomy, while in HA, a significant proportion of the vegetation came from riparian forms (higher tree height) and similar evidence was provided by Jiménez-Valverde et al. [94], who argued that vegetation structure also has an effect on the araneid species turnover. (Table 6, Vegetación/Jaccard vegetation).
In general, a high beta diversity among localities in the TDF produced a recurrent pattern (Dirzo et al. 2011 [95]), usually reaching turnover values above 50%, even in species with high dispersal capacity, such as butterflies [22]. Consistent with this evidence, our results show high beta diversity, with more than 70% of species turnover among localities for spider and plant composition. Vegetation turnover agreed in its high values with other TDF works in Mexico [96] and other TDF from the Neotropic [97]. An interesting pattern found was that the two localities within the REBIOSH shared more plant and spider species, which could suggest that the degree of disturbance could be playing a role in shaping the species turnover of insect communities. Some studies show [9] that it is better to conserve undisturbed forest areas to maintain interactions that cannot be restored. However, more research in this direction is needed to form a conclusion.
Seasonality and phenology: For the tropical dry forest, it is not known with certainty whether the factors that spatially structure communities in the vegetation [7] for spiders have shown resource availability (spatial and trophic) and biotic interactions (competition) can affect their presence in the vegetation [23,24]. Variations in these three factors could cause a higher abundance of spiders during the rainy season in tropical dry forests [7]. During this season, most plants have foliage, which increases the diversity of flying insects, especially herbivores, such as hemipterans, homopterans, coleopterans, and lepidopterans [22,25,26], which are food for spiders. Higher richness and abundance values in the rainy season are a widely described pattern for spiders among several vegetation types and localities [6,7,85,98,99]. The sampled localities had their maximum values of richness and abundance during the rainy season (June–October), mainly in September, when the highest abundance of adults was collected. During nearly all samplings, the abundance of females was higher than males: a situation that was especially marked in September, when male abundance was drastically reduced. Regarding the juvenile araneids, their abundance was highest at the beginning and middle of the rainy season (June–August), after which the richness and abundance of both adults and juveniles gradually decreased as the dry season approached (November–May). This seasonal pattern coincided with that mentioned by Levi & Levi [100], who indicated that in early fall, araneids reproduce, after which the males die, females build ovisacs in late fall and die as well in late spring, the eggs hatch and, after the first month, juvenile spiders disperse on silk threads that they produce and are carried by the wind (ballooning). Given the seasonal variation in araneids, they are recognized as univoltine (annual life-cycle) spiders.
Another interesting pattern is that species turnover also occurs among seasons, with changes in spider composition of 50% or more. This pattern of seasonal communities can be found in several arthropod groups at the TDF [22,87,101], and it is probably a bottom-up effect triggered by increased primary production in the rainy season.
Environmental variables: The relevance, direction, and degree of the effect of the abiotic factors on spider community structure remains one of the more controversial aspects, with contrasting results varying from a high explanatory power of environmental variables [7] to no effect [99], and while some authors mention a direct effect on the spider community [24], others found evidence of an indirect effect [6]. Evidence also showed that climatic variables might have no effect on predicting spider richness or abundance but could be a good predictor of changes in spider composition [94,102]).
This contrasting evidence may be the result of differences in the geographic area, vegetation type, and even the spider community selected to be assessed, varying from a taxonomic delimitation (one or several spider families, Jiménez-Valverde and Lobo [102]; Carvalho et al. [6]; Esquivel-Gómez et al. [33]) to an ecological delimitation (ground-dwelling spiders or orb-weaver families, Quijano-Cuervo et al. [7]; Campuzano and Padilla-Ramírez [99]).
In the present study, we found that orb-weaver spiders responded differently and early to each environmental variable and that each community had a different response to changes in climatic variables [103,104,105]. When assessing the overall community, evaporation, which can be interpreted as environmental evidence of the onset of the dry season, had an almost instantaneous effect on decreasing abundance, richness, and diversity in the same month that began to increase. Precipitation, on the other hand, had a sustained effect on the community from the same month as the onset of rainfall up to one and two months later.
When evaluating the effect at each locality, community richness and abundance in SME responded positively and immediately to rainfall, and that effect was maintained over the following month; while it took three months for the community to respond to changes in evaporation and temperature since SMEs had lost most of their tree cover and is the most disturbed area, it is reasonable to think that the start of the rainy season triggered primary production of the rapidly developing herbaceous and shrub strata, which in turn, caused an upstream effect that could quickly reach the spider community.
On the other hand, the community at HA had a positive and maintained effect of precipitation on spider abundance (same month, one- and two-month delay), while spider richness took two months to respond to precipitation. Changes in precipitation only had an effect on spider richness with a two- and three months delay. The fact that precipitation played an important role in community structuring, but evaporation had no effect at this locality may be due to the microclimatic conditions at HA, as it is the only locality with riparian vegetation, with vegetation that tends to keep leaves even during the dry season and with a permanently present water body.
Finally, EL showed a rapid and negative effect of evaporation on all the community variables, but it seemed that the spider community took three months to respond to changes in the amount of rainfall. EL has the most traditional TDF physiognomy, with a high diversity of tree species, which are slow to produce leaves and flowers, thus delaying the response time of the araneid community. In contrast, when the dry season begins, most species abruptly shed their leaves, creating a fast upward effect that could quickly reach the spider community.
Our results suggest that environmental variables may interact in different ways with the orb-weaver community, mediated by microclimatic conditions and even the conservation status at each locality. Furthermore, in order to discover any effect of the environmental variables on the spider community, the time that the community needed to respond to these changes must be considered. Some variables seem to have rapid effects (such as evaporation and precipitation), while others always appear after a delay of two or three months (as temperature). As more studies continued to look for these short- and long-term responses, the effect of the abiotic factors on the structuring of spider communities might become less obscure.

Non-Parametric Estimators and Species Accumulation Curves

In some cases, even more, than half of the total number of reported species were singletons and doubletons [33,106,107]. In spider inventories, there are usually many rare species [89].
The number of expected species from each locality differed depending on the estimator used (asymptote of the species accumulation curve, Chao 1, or Chao 2). In the case of SME and EL, the different estimators differed considerably, while in HA, all three estimators indicated a similar number of species. EL was the locality with the highest percentage of the total species inventoried compared to the value of the asymptote. It is also important to mention that this locality had a slope closest to 0.1, indicating that this inventory was the most complete and reliable among the three localities sampled (Table 6). New [108] and Jiménez-Valverde and Hortal [86], thus recognizing that results such as those obtained in this study are frequent since spiders are a diverse group with a large number of rare species (singletons, doubletons, unique, and duplicates). Considering the diversity of this group, it can be hypothesized that with systematic sampling, the number of species collected could even exceed the estimate.

Supplementary Materials

The following supporting information can be downloaded at: https://www.mdpi.com/article/10.3390/d15030466/s1, Table S1: Vegetation inventory of the three localities studied. El Limón (EL), Cañadas Huautla-Ajuchitlán (HA) and San Miguel de Los Elotes (SME); Table S2: Inventory of species collected in each sampling locality from Abril 2013 through March 2014. The eight new records for the state of Morelos are indicated with “*”.

Author Contributions

M.M.-A. participated in the conceptualization and methods, collected field material and data curation, performed the analyses, and edited the manuscript. M.S.-R. participated in the conceptualization and methods, conducted field material collection, assisted in data collection and analysis, and prepared the draft. G.M.-P. collaborated with data curation, methodology, review, and draft preparation and assisted in editing the manuscript. S.S. contributed to plant determinations, drafting-revision and editing of the manuscript. M.V.R.-E. contributed to project administration, founding acquisition, collected field material, writing-preparation of the draft, and editing. All authors have read and agreed to the published version of the manuscript.

Funding

We thank the Teacher Improvement Program (PROMEP/UAEMOR-103.5/13/6626) for its support in carrying out this research.

Institutional Review Board Statement

Not applicable.

Data Availability Statement

Not applicable.

Acknowledgments

The authors are grateful to the people who helped us in the field: Eurídice Tinoco, Nazario García Ángel, Ana Karen Santillán-Vázquez, Quetzalli Domínguez-Domínguez, Masiel Moreno Romero, Carlos A. Coyote-Ávila, Adrián Gómez and Mónica Morales. Evodio Rendón and Engineer Alejandro Mata for their help in logistics, we acknowledge for allowing the use of the field stations to the Centro de Investigación en Biodiversidad y Conservación (CIBYC). Our greatest gratitude to Biol. L. Julio-Catarino and Evodio Rendón for their invaluable support in the identification and corroboration of the plant species. We thank The Comisión Nacional del Agua, Servicio Meteorológico Nacional (CONAGUA) for lending the environmental data. We thank Susana Guzmán who supports us in the The National Biodiversity Laboratory (LANABIO) at the Institute of Biology. We thank Lynna Kiere for her revision to English.

Conflicts of Interest

The author declares no conflict of interest. The financing program did not have a role in the data preparation or analysis; neither in the preparation or writing of the manuscript.

References

  1. Riechert, S.; Lockley, T. Spiders as biological controls agents. Annu. Rev. Entomol. 1984, 29, 299–320. [Google Scholar] [CrossRef]
  2. Nyffeler, M.; Benz, G. Spiders in natural pest control: A review. J. Appl. Entomol. 1987, 103, 321–339. [Google Scholar] [CrossRef] [Green Version]
  3. Coddington, J.A.; Levi, H.W. Systematics and evolution of spiders (Araneae). Annu. Rev. Ecol. Evol. Syst. 1991, 22, 565–592. [Google Scholar] [CrossRef]
  4. Wimp, G.M.; Martinsen, G.D.; Floate, K.D.; Bangert, R.K.; Whitham, T.G. Plant genetic determinants of arthropod community structure and diversity. Evolution 2005, 59, 61–69. [Google Scholar] [PubMed]
  5. Wojtowicz, T.; Compson, Z.G.; Lamit, L.J.; Whitham, T.G.; Gehring, C.A. Plant genetic identity of foundation tree species and their hybrids affects a litter-dwelling generalist predator. Oecologia 2014, 176, 799–810. [Google Scholar] [CrossRef]
  6. Carvalho, L.S.; Sebastian, N.; Araújo, H.F.; Dias, S.C.; Venticinque, E.; Brescovit, A.D.; Vasconcellos, A. Climatic variables do not directly predict spider richness and abundance in semiarid Caatinga vegetation, Brazil. Environ. Entomol. 2015, 44, 54–63. [Google Scholar] [CrossRef] [PubMed]
  7. Quijano-Cuervo, L.; Rangel-Acosta, J.; Martínez-Hernández, N.; Sabogal-González, A. Estratificación vertical de arañas tejedoras (Araneae) en fragmentos de bosque seco tropical del Caribe colombiano. Rev. Biol. Trop. 2019, 67, 224–242. [Google Scholar] [CrossRef]
  8. Michalko, R.; Košulič, O.; Martinek, P.; Birkhofer, K. Disturbance by invasive pathogenic fungus alters arthropod predator–prey food webs in ash plantations. J. Anim. Ecol. 2021, 90, 2213–2226. [Google Scholar] [CrossRef]
  9. Michalko, R.; Košulič, O.; Wongprom, P.; Songsangchote, C.; Saksongmuang, V.; Trisurat, Y. Reforestations of tropical forests alter interactions between web-building spiders and their prey. Ecosystems 2021, 24, 1962–1975. [Google Scholar] [CrossRef]
  10. Leroy, B.; Paschetta, M.; Canard, A.; Bakkenes, M.; Isaia, M.; Ysnel, F. First assessment of effects of global change on threatened spiders: Potential impacts on Dolomedes plantarius (Clerck) and its conservation plans. Biol. Conserv. 2013, 161, 155–163. [Google Scholar] [CrossRef]
  11. Spiller, D.A.; Schoener, T.W. Control climático de la fuerza de interacción trófica: El efecto de las lagartijas sobre las arañas. Ecologia 2008, 154, 763–771. [Google Scholar]
  12. Janzen, D.H. Tropical dry forests: The most endangered major tropical ecosystem. In Biodiversity; Wilson, E.O., Peters, F.M., Eds.; National Academy Press: New York, NY, USA, 1988; pp. 130–137. [Google Scholar]
  13. Ceballos, G.; Valenzuela, D. Diversidad, Ecología y Conservación de los Mamíferos de Latinoamérica. In Diversidad, Amenazas y Áreas Prioritarias para la Conservación de las Selvas Secas del Oeste de México; Ceballos, G., García, A., Martínez, L., Espinoza, E., Bezaury Creel, J., Dirzo, R., Eds.; National Commission for the Knowledge and Use of Biodiversity/National Autonomous University of Mexico: Mexico City, Mexico, 2010; pp. 93–118. [Google Scholar]
  14. Challenger, A.; Soberón, J. Los ecosistemas terrestres. In Capital Natural de México; Conocimiento Actual de la Biodiversidad; Comisión Nacional para el Conocimiento y Uso de la Biodiversidad: Mexico City, Mexico, 2008; Volume 1, pp. 87–108. [Google Scholar]
  15. Pérez-García, E.A.; Meave, J.A.; Cevallos-Ferriz, S.R. Flora and vegetation of the seasonally dry tropics in Mexico: Origin and biogeographical implications. Acta Bot. Mex. 2012, 100, 149–193. [Google Scholar]
  16. Maldonado, B.; Caballero, J.; Delgado-Salinas, A.; Lira, R. Relationship between Use Value and Ecological Importance of Floristic Resources of Seasonally Dry Tropical Forest in the Balsas River Basin, México. Econ. Bot. 2013, 67, 17–29. [Google Scholar] [CrossRef]
  17. Estrada-Márquez, A.S.; Villaseñor, J.L.; Escalante, T. Áreas de endemismo de Magnoliophyta en Morelos, México. Bot. Sci. 2020, 98, 377–392. [Google Scholar] [CrossRef]
  18. Trejo, I. Las selvas secas del Pacífico mexicano. In Diversidad, Amenazas y Áreas Prioritarias para la Conservación de las Selvas Secas del Oeste de México; Ceballos, G., García, A., Martínez, L., Espinoza, E., Bezaury Creel, J., Dirzo, R., Eds.; National Commission for the Knowledge and Use of Biodiversity/National Autonomous University of Mexico: Mexico City, Mexico, 2010; pp. 41–51. [Google Scholar]
  19. Morrone, J.J. Hacia una síntesis biogeográfica de México. Rev. Mex. Biodivers. 2005, 76, 207–252. [Google Scholar] [CrossRef]
  20. Luna-Reyes, M.; Llorente-Bousquets, J.; Luis-Martinez, A. Papilionoidea de la Sierra de Huautla, Morelos y Puebla, México (Insecta: Lepidoptera). Rev. Biol. Trop. 2008, 56, 1677–1716. [Google Scholar] [CrossRef] [PubMed] [Green Version]
  21. Nieto-Castañeda, I.G.; Pérez-Miguel, L.; García-Cano, A.A. New records of spiders (Arachnida: Araneae) from the Balsas Basin in central Mexico. Southwest. Nat. 2014, 59, 426–430. [Google Scholar] [CrossRef]
  22. Rosas-Echeverria, M.V.; Coyote-Ávila, C.A.; Aguilar-Dorantes, K.M.; Martínez-Peralta, C. Diversity of butterflies (Lepidoptera) in Sierra de Huautla, Morelos, México: A conservation approach. Ann. Entomol. Soc. Am. 2019, 112, 409–417. [Google Scholar] [CrossRef]
  23. Brown, K.M. Foraging ecology and niche partitioning in orb-weaving spiders. Oecologia 1981, 50, 380–385. [Google Scholar] [CrossRef] [PubMed]
  24. Wise, D.H. Spiders in Ecological Webs; Cambridge University Press: New York, NY, USA, 1993; 328p. [Google Scholar]
  25. Zaragoza Caballero, S.; Noguera, F.A.; Gonzalez-Soriano, E.; Ramirez-Garcia, E.; Rodriguez-Palafox, A. Insectos. In Diversidad, Amenazas y Áreas Prioritarias para la Conservación de las Selvas Secas del Pacífico de México; Ceballos, G., Martinez, L., Garcia, A., Espinoza, E., Bezaury Creel, J., Dirzo, R., Eds.; National Commission for the Knowledge and Use of Biodiversity/National Autonomous University of Mexico: Mexico City, Mexico, 2010; pp. 195–214. [Google Scholar]
  26. Peñaloza-Villadiego, A.; García-Garrido, J.; Flórez-Daza, E.; Sampedro-Marin, A. Araneofauna de la Reserva Forestal Protectora Serranía de Coraza, Sucre-Colombia. Rev. Colomb. Cienc. Anim. 2013, 5, 36–47. [Google Scholar] [CrossRef]
  27. World Spider Catalog. Version 23.5. Natural History Museum Bern. 2023. Available online: http://wsc.nmbe.ch (accessed on 8 January 2023).
  28. Agnarsson, I.; Coddington, J.A.; Kuntner, M. Systematics: Progress in the study of spider diversity and evolution. In Spider Research in the 21st Century: Trends and Perspectives; Penney, D., Ed.; Siri Scientific Press: Manchester, UK, 2013; pp. 58–111. [Google Scholar]
  29. Gilede-Moncayo, O.; Bello-Silva, J.C. La familia Araneidae (Araneoidea: Orbicularie) en el departamento del Meta, Colombia. Biota Neotrop. 2000, 1, 125–130. [Google Scholar]
  30. Levi, H.W. Keys to the genera of Araneid Orbweavers (Araneae, Araneidae) of the Americas. J. Arachnol. 2002, 30, 527–562. [Google Scholar] [CrossRef]
  31. Jimenez-Valverde, A.; Lobo, J.M.; Lopez-Martos, M.L. Listado actualizado de especies de araneidos y tomísidos (Araneae, Araneidae y Thomisidae) de la comunidad de Madrid: Mapas de distribución conocida, potencial y patrones de riqueza. Graellsia 2006, 62, 461–481. [Google Scholar] [CrossRef] [Green Version]
  32. Levi, H.W.; Kallal, R.J. Araneidae. In Spiders of North America: An Identification Manual; Ubick, D., Paquin, P., Cushing, P.E., Roth, V., Eds.; American Arachnological Society: Keene, NH, USA, 2017; pp. 77–84. [Google Scholar]
  33. Esquivel-Gómez, L.; Abdala-Roberts, L.; Pinkus-Rendón, M.; Parra-Tabla, V. Effects of tree species diversity on a community of weaver spiders in a tropical forest plantation. Biotropica 2017, 49, 63–70. [Google Scholar] [CrossRef]
  34. Dorado, O.; Maldonado, B.; Arias, D.M.; Sorani, V.; Ramirez, R.; Leyva, E.; Valenzuela, D. Programa de Conservación y Manejo Reserva de la Biosfera Sierra de Huautla. México; Comisión Nacional de Áreas Naturales Protegidas-Secretaría de Medio Ambiente y Recursos Naturales (CONANP-SEMARNAT), National Commission of Natural Protected Areas-Ministry of Environment and Natural Resources: Mexico City, Mexico, 2005; 202p. [Google Scholar]
  35. Miranda, F.; Hernandez, X.E. Los tipos de vegetación de México y su clasificación. Bol. Soc. Bot. 1963, 28, 29–179. [Google Scholar] [CrossRef] [Green Version]
  36. Challenger, A.; Caballero, J.; Zarate, S.; Elizondo, R. Utilización y Conservación de los Ecosistemas Terrestres de México: Pasado, Presente y Futuro; Agrupación Sierra Madre, National Commission for the Knowledge and Use of Biodiversity/Biology Institute/National Autonomous University of Mexico: Mexico City, MX, 1998; 847p. [Google Scholar]
  37. García, E. Modificaciones al Sistema de Clasificación Climática de Köppen, 5th ed.; Instituto de Geografía, UNAM: Mexico City, Mexico, 2004; 155p. [Google Scholar]
  38. Cushing, P.E. Introduction. In Spiders of North America: An Identification Manual; Ubick, D., Paquin, P., Cushing, P.E., Roth, V., Eds.; American Arachnological Society: Keene, NH, USA, 2017; pp. 1–16. [Google Scholar]
  39. Coddington, J.A.; Griswold, C.E.; Davila, D.S.; Peñaranda, E.; Larcher, S.F. Designing and testing sampling protocols to estimate biodiversity in tropical Ecosystems. In The Unity of Evolutionary Biology, Proceedings of the Fourth International Congress Of systematic and Evolutionary Biology, College Park, MD, USA, 1–7 July 1990; Dudley, E.C., Ed.; Dioscorides Press: Portland, OR, USA, 1991; pp. 44–60. [Google Scholar]
  40. Uetz, G.W.; Unzicker, J.D. Pitfall trapping in ecological studies of wandering spiders. J. Aracnol. 1975, 3, 101–111. [Google Scholar]
  41. Ubick, D. Key to spider families of North America North of Mexico. In Spiders of North America: An Identification Manual; Ubick, D., Paquin, P., Cushing, P.E., Roth, V., Eds.; American Arachnological Society: Keene, NH, USA, 2017; pp. 30–48. [Google Scholar]
  42. Bradley, R.A.; Buchanan, S. Common Spiders of North America; University of California Press: Berkeley, CA, USA, 2013; 288p. [Google Scholar]
  43. Levi, H.W. The Ravilla group of the orbweaver genus Eriophora in North America (Araneae: Araneidae). Psyche 1970, 77, 280–302. [Google Scholar] [CrossRef]
  44. Levi, H.W. Small orb-weavers of the genus Araneus North of Mexico (Araneae: Araneidae). Bull. Mus. Comp. Zool. 1973, 145, 473–552. [Google Scholar]
  45. Levi, H.W. The American orb-weaver genera Cyclosa, Metazygia, and Eustala North of Mexico (Araneae: Araneidae). Bull. Mus. Comp. Zool. 1977, 148, 61–127. [Google Scholar]
  46. Levi, H.W. The spiny orb-weaver genera Micrathena and Chaetacis (Araneae: Araneidae). Bull. Mus. Comp. Zool. 1985, 150, 429–618. [Google Scholar]
  47. Levi, H.W. The Neotropical orb-weaver genera Edricus and Wagneriana (Araneae: Araneidae). Bull. Mus. Comp. Zool. 1991, 152, 363–415. [Google Scholar]
  48. Levi, H.W. American Neoscona and corrections to previous revisions of Neotropical orb-weavers (Araneae: Araneidae). Psyche 1992, 99, 221–239. [Google Scholar] [CrossRef] [Green Version]
  49. Levi, H.W. The Neotropical orb-weaving spiders of the genera Wixia, Pozonia, and Ocrepeira (Araneae: Araneidae). Bull. Mus. Comp. Zool. 1993, 153, 47–141. [Google Scholar]
  50. Levi, H.W. The American orb weavers of the genera Mecynogea, Manogea, Kapogea, and Cyrtophora (Araneae: Araneidae). Bull. Mus. Comp. Zool. 1997, 155, 215–255. [Google Scholar]
  51. Levi, H.W. Comments and new records for the American genera Gea and Argiope with the description of new species (Araneae: Araneidae). Bull. Mus. Comp. Zool. 2004, 158, 47–66. [Google Scholar] [CrossRef]
  52. Levi, H.W. The orb-weaver genus Mangora of Mexico, Central America, and The West Indies (Araneae: Araneidae). Bull. Mus. Comp. Zool. 2005, 158, 139–182. [Google Scholar] [CrossRef]
  53. Harrod, J.C.; Levi, H.W.; Leibensperger, L.B. The Neotropical orbweavers of the genus Larinia (Araneae: Araneidae). Psyche 1990, 97, 241–265. [Google Scholar] [CrossRef]
  54. Glueck, S. A taxonomic revision of the orb-weaver genus Acacesia (Araneae: Araneidae). Psyche 1994, 101, 59–84. [Google Scholar] [CrossRef] [Green Version]
  55. Dorado, O.; Arias, D.M.; Ramírez, R.; Sousa, M. Leguminosas de la Sierra de Huautla; Centro de Educación Ambiental y Conservación Sierra de Huautla, Universidad Autónoma del Estado de Morelos: Mexico City, Mexico, 2005; 176p. [Google Scholar]
  56. Domínguez-Domínguez, Q.A. La Familia Burseraceae (Kunth) en el Estado de Morelos. Bachelor’s Thesis, Universidad Autónoma del Estado de Morelos, Mexico City, Mexico, 2013. [Google Scholar]
  57. An Online Flora of All Known Plants Supporting the Global Strategy for Plant Conservation. Available online: http://www.worldfloraonline.org/ (accessed on 12 April 2022).
  58. Comisión Nacional del Agua, Servicio Meteorológico Nacional (CONAGUA-SMN). Estación Operando # 17038, 18.52; -99.145, 2015.
  59. Comisión Nacional del Agua, Servicio Meteorológico Nacional (CONAGUA-SMN). Estación operando # 17008, 18.44; -99.025, 2015.
  60. Comisión Nacional del Agua, Servicio Meteorológico Nacional (CONAGUA-SMN). Estación operando # 17057, 18.5311; -98.9375, 2015.
  61. Stephen, H.S.; Barnes, B.V. Forest Ecology, 3rd ed.; John Wiley & Sons: New York, NY, USA, 1980; 687p. [Google Scholar]
  62. Jost, L. Entropy and diversity. Oikos 2006, 113, 363–375. [Google Scholar] [CrossRef]
  63. Moreno, C.; Barragán, E.F.; Pineda, E.; Pavón, N.P. Reanálisis de la diversidad alfa: Alternativas para interpretar y comparar información sobre comunidades ecológicas. Rev. Mex. Biodivers. 2011, 82, 1249–1261. [Google Scholar] [CrossRef] [Green Version]
  64. Jost, L.; González-Oreja, J.A. Midiendo la diversidad biológica: Más allá del índice de Shannon. Acta Zool. Lilloana 2012, 56, 3–14. [Google Scholar]
  65. Hammer, Ø.; Harper, D.A.T.; Ryan, P.D. Paleontological Statistics (Past) Software Versión 3.14; Natural History Museum; University of Oslo: Oslo, Norway, 2001. [Google Scholar]
  66. Koleff, P.; Gaston, K.J.; Lennon, J.J. Measuring beta diversity for presence–absence data. J. Anim. Ecol. 2003, 72, 367–382. [Google Scholar] [CrossRef] [Green Version]
  67. Moreno, C. Métodos para Medir la Biodiversidad; Serie Manuales y Tesis SEA, Programa Iberoamericano de Ciencia y Tecnología para el Desarrollo; Oficina Regional de Ciencia y Tecnología para América Latina y el Caribe de UNESCO y Sociedad Entomológica Aragonesa: Zaragoza, Spain, 2001; 84p. [Google Scholar]
  68. Lennon, J.J.; Koleff, P.; Greenwood, J.J.D.; Gaston, K.J. The geographical structure of British bird distributions: Diversity, spatial turnover and scale. J. Anim. Ecol. 2001, 70, 966–979. [Google Scholar] [CrossRef] [Green Version]
  69. Chao, A.; Chiu, C.H. Nonparametric Estimation and Comparison of Species Richness. In eLS; John Wiley & Sons, Ltd: Chichester, UK, 2016. [Google Scholar] [CrossRef]
  70. Colwell, R.K.; EstimateS. Version 8.2: Statistical Estimation of Species Richness and Shared Species from Samples. Software and User´s Guide. 2013. Available online: http://viceroy.eeb.uconn.edu/EstimateS (accessed on 8 May 2018).
  71. Moreno, C.E.; Halffter, G. On the measure of sampling effort used in species accumulation curves. J. Appl. Ecol. 2001, 38, 487–490. [Google Scholar] [CrossRef]
  72. StatSoft. STATISTICA Version 7.0. Data Analysis Software System and Computer Program Manual; StatSoft, Inc.: Tulsa, OK, USA, 2004. [Google Scholar]
  73. Hoffmann, A. Relación Bibliográfica Preliminar de las Arañas de México (Arachnida: Araneae); Instituto de Biología, Universidad Nacional Autónoma de México: Mexico City, Mexico, 1976; 117p. [Google Scholar]
  74. González-Tokman, D.; Martínez-Garza, C. Effect of ecological restoration on body condition of a predator. PLoS ONE 2015, 10, e0133551. [Google Scholar] [CrossRef]
  75. Candia-Ramírez, D.T.; Valdez-Mondragón, A. Spiders of the Orbiculariae clade (Araneae: Araneomorphae) from Calakmul municipality, Campeche, Mexico. Rev. Mex. Biodivers. 2017, 88, 154–162. [Google Scholar] [CrossRef] [Green Version]
  76. De La Cruz-Pérez, A.S.; Sánchez-Soto, C.F.; Ortiz-García, M.; Pérez-De La, C. Diversidad y distribución de arañas tejedoras diurnas (Arachnida: Araneae) en los microhábitats del agroecosistema cacao en Tabasco, México. Bol. Mus. Entomol. Univ. 2009, 10, 1–9. [Google Scholar]
  77. Cabra-García, J.; Chacón, P.; Valderrama-Ardila, C. Additive partitioning of spider diversity in a fragmented tropical dry forest (Valle del Cauca, Colombia). J. Arachnol. 2010, 38, 192–205. [Google Scholar] [CrossRef]
  78. Corcuera, P.; Jiménez, M.L.; Valverde, P.L. Does the microarchitecture of Mexican dry forest foliage influence spider distribution? J. Arachnol. 2008, 36, 552–556. [Google Scholar] [CrossRef]
  79. Theron, K.J.R.; Gaigher, J.S.; Pryke, M.J. Samways. High quality remnant patches in a complex agricultural landscape sustain high spider diversity. Biol. Conserv. 2020, 243, 108480. [Google Scholar] [CrossRef]
  80. Hernández-Silva, Y.G. Araneofauna de Vegetación en Tratamientos de Restauración Ecológica en Selva Estacional de Sierra de Huautla, Morelos. Bachelor’s Thesis, Facultad de Ciencias Biológicas, Universidad Autónoma del Estado de Morelos, Mexico City, Mexico, 2016. [Google Scholar]
  81. Menéndez-Acuña, M. Efecto de la Diversidad Genética de Una Especie Fundadora sobre la Comunidad de Plantas y Arañas Asociadas: El Caso de Bursera copallifera en Morelos, México. Master’s Thesis, Centro de Investigación en Biodiversidad y Conservación, Universidad Autónoma del Estado de Morelos, Mexico City, Mexico, 2017. [Google Scholar]
  82. Villa-Cosme, E.; Menéndez-Acuña, M. Diversidad y composición de la araneofauna (Arachnida: Araneae) en la zona arqueológica de Xochicalco, Morelos, México; Facultad de Biología, Universidad Autónoma del Estado de Morelos: Cuernavaca, Mexico, 2021; status (manuscript in preparation; to be submitted). [Google Scholar]
  83. Balfour, R.A.; Rypstra, A.L. The influence of habitat structure on spider density in a no-till soybean agroecosystem. J. Arachnol. 1998, 26, 221–226. [Google Scholar]
  84. Halaj, J.; Ross, D.W.; Moldenke, A.R. Habitat structure and prey availability as predictors of the abundance and community organization of spiders in Western Oregon forest canopies. J. Arachnol. 1998, 26, 203–220. [Google Scholar]
  85. Guerrero-Fuentes, D.R.; Desales-Lara, M.A. Arañas edáficas del clado RTA (Arachnida:Araneae) del sur de Tonatico, Estado de México, México. Acta Zool. Mex. Nueva Ser. 2021, 37, 1–25. [Google Scholar]
  86. Jiménez-Valverde, A.; Hortal, J. Las curvas de acumulación de especies y la necesidad de evaluar la calidad de los inventarios biológicos. Rev. Iber. Aracnol. 2003, 8, 151–161. [Google Scholar]
  87. Martínez-Hernández, J.G.; Brailovsky, H.; Corona-López, A.M.; Flores-Palacios, A.; Toledo-Hernández, V.H. Diversidad y estacionalidad de Coreidae (Hemiptera: Heteroptera) en el bosque tropical caducifolio en Morelos, México. Rev. Mex. Biodivers. 2020, 91, e913244. [Google Scholar] [CrossRef]
  88. Desales-Lara, M.A.; Durán-Barrón, C.G.; Mulia-Solano, C.E. Nuevos registros de aranéidos y terídidos (Araneae: Araneidae, Theridiidae) del Estado de México. Dugesiana 2008, 15, 1–6. [Google Scholar]
  89. Peña-Mendoza, M.T.; Cano-Santana, Z.; Saucedo-Morquecho, E.A.; Villeda-Hernandez, M.; Valdez, E. Densidad poblacional de Sphenarium purpurascens (Orthoptera: Pyrgomorphophidae) y Neoscona oaxacensis (Araneae: Araneidae) en dos zonas sujetas a restauración ecológica en la Reserva del Pedregal de San Ángel, D.F. México. Entomol. Mex. 2009, 8, 303–308. [Google Scholar]
  90. Berman, J.D.; Levi, H. The orb-weaver genus Neoscona in North America (Araneae: Araneidae). Bull. Mus. Comp. Zool. 1971, 141, 465–500. [Google Scholar]
  91. Nieto-Castañeda, I.G. Inventario de arañas de algunas localidades de los estados de Puebla y Morelos en la parte Alta del Balsas. Bachelor’s Thesis, FES-Zaragoza, Universidad Nacional Autónoma de México, Mexico City, Mexico, 2000. [Google Scholar]
  92. Maya-Morales, J.; Ibarra-Nuñez, G. Gremios de arañas de la vegetación del bosque mesófilo de montaña de la Reserva de la Biosfera Volcán Tacana, Chiapas, México. Entomol. Mex. 2012, 11, 53–58. [Google Scholar]
  93. Perez-Hernandez, C.X.; Zaragoza-Caballero, S. Diversidad alfa y beta de Cantharidae (Coleoptera) en el bosque tropical caducifolio de la vertiente del Pacífico mexicano. Rev. Mex. Biodivers. 2015, 86, 771–781. [Google Scholar] [CrossRef] [Green Version]
  94. Jiménez-Valverde, A.; Baselga, A.; Melic, A.; Txasko, N. Climate and regional beta-diversity gradients in spiders: Dispersal capacity has nothing to say? Insect. Conserv. Divers. 2010, 3, 51–60. [Google Scholar] [CrossRef]
  95. Dirzo, R.; Young, H.S.; Mooney, H.A.; Ceballos, G. Bosques Tropicales Estacionalmente Secos: Ecología y Conservación; Island Press: Washington, DC, USA, 2011; 392p. [Google Scholar]
  96. Trejo, I.; Dirzo, R. Diversidad florística de los bosques tropicales estacionalmente secos de México. Biodivers. Conserv. 2002, 11, 2063–2084. [Google Scholar] [CrossRef]
  97. Linares-Palomino, R.; Oliveira-Filho, A.T.; Pennington, R.T. Neotropical seasonally dry forests: Diversity, endemism, and biogeography of woody plants. In Seasonally Dry Tropical Forests, Dirzo, R., Young, H.S., Mooney, H.A., Ceballos, G., Eds.; Island Press: Washington, DC, USA, 2011; pp. 3–21. [Google Scholar]
  98. Sosa-Romero, M.; Menéndez-Acuña, M.; Burgos-Solorio, A. Fenología y estacionalidad del género Mexigonus Edwards, 2002 (Araneae: Salticidae) en un bosque templado al norte de Cuernavaca, Morelos, México. Entomol. Mex. 2016, 3, 919–923. [Google Scholar]
  99. Campuzano, E.F.; Padilla-Ramírez, J.R. Spatial and seasonal patterns of ground-dwelling spider assemblages belonging to the retrolateral tibial apophysis clade (Araneae: Araneomorphae) in two remnants of pine-oak forest from Mexico. Semental. Neotrop. Entorno Faunístico 2021, 56, 220–233. [Google Scholar] [CrossRef]
  100. Levi, H.; Levi, L. Arácnidos y Otros Artrópodos; Trillas: Mexico City, Mexico, 1993; 166p. [Google Scholar]
  101. Luna-Reyes, M.; Llorente-Bousquets, J.; Luis-Martínez, A.; Vargas, I. Composición faunística y fenología de las mariposas (Rhopalocera: Papilionoidea) de Cañón de Lobos, Yautepec, Morelos, México. Rev. Mex. Biodivers. 2010, 81, 315–342. [Google Scholar] [CrossRef]
  102. Jiménez-Valverde, A.; Lobo, J.M. Determinants of local spider (Araneidae and Thomisidae) species richness on a regional scale: Climate and altitude vs. habitat structure. Ecol. Entomol. 2007, 32, 113–122. [Google Scholar] [CrossRef]
  103. Obuid-Allah, A.H.; El-Shimy, N.A.; Hussien, E.H.; Aboulnasr, G.N. Factors affecting the spatial and seasonal distribution of spiders in assiut, Egypt. Indian J. Arachnol. 2017, 6, 55–68. [Google Scholar]
  104. Avila, C.A.; Stenert, C.; Rodrigues, E.N.L.; Maltchik, L. Habitat structure determines spider diversity in highland ponds. Ecol. Res. 2017, 32, 359–367. [Google Scholar] [CrossRef]
  105. Ferretti, N.E.; Arnedo, M.; González, A. Impact of climate change on spider species distribution along the La Plata River basin, southern South America: Projecting future range shifts for the genus Stenoterommata (Araneae, Mygalomorphae, Nemesiidae). Ann. Zool. Fenn. 2018, 55, 123–133. [Google Scholar] [CrossRef] [Green Version]
  106. Benavides, L.; Florez, E. Comunidades de arañas (Arachnida: Araneae) en microhábitats de dosel en bosques de tierra firme e Igapó de la Amazonía Colombiana. Rev. Iber. Aracnol. 2006, 14, 49–62. [Google Scholar]
  107. Silva, D.; Coddington, J.A. Spiders of Pakitza (Madre de Dios, Perú): Species richness and notes on community structure. In The Biodiversity of Southeastern Perú; Wilson, D.E., Sandoval, A., Eds.; Smithsonian Institution: Washington, DC, USA, 1996; pp. 253–311. [Google Scholar]
  108. New, T.R. Untangling the web: Spiders and the challenge of invertebrate conservation. J. Insect Conserv. 1999, 3, 251–256. [Google Scholar] [CrossRef]
Figure 1. (A) Map of Mexico showing the Morelos state. (B) Close up of the state of Morelos showing REBIOSH. (C) Closeup of the REBIOSH showing the three localities studied. El Limón (EL), and Cañadas Huautla- Ajuchitlán (HA) are located within the REBIOSH. San Miguel de Los Elotes (SME) lies outside the protected area.
Diversity 15 00466 g001
Figure 2. Species of the family Araneidae found at the sampling localities. (ai), Habitus, dorsal view: (a) Acacesia hamata, (b) Araneus pegnia, (c) Argiope aurantia, (d) Edricus productus, (e) Larinia directa, (f) Mecynogea apatzingan, (g) Micrathena mitrata, (h) Neoscona oaxacensis, and (i) Ocrepeira redempta.
Diversity 15 00466 g002
Figure 3. Diversity-dominance graphs for each locality and the total spider community. X-axes represent species richness and Y-axis represents the natural logarithm of the relative abundance.
Diversity 15 00466 g003
Figure 4. True diversity at each locality based on values of order q = 0, 1, and 2.
Diversity 15 00466 g004
Figure 5. Species richness and abundance of adult and juvenile araneids from April 2013 to March 2014 in the localities (a) SME, (c) HA, and (e) EL. Monthly average precipitation (P mm), evaporation (Ev mm), and temperature. Meteorological information is from the climatological stations of (b) Nexpa, Tlaquiltenango, 8.6 km from SME [58], (d) Huautla, Tlaquiltenango [59], and (f) El Limón, Tepalcingo [60].
Diversity 15 00466 g005
Figure 6. Species accumulation curves for the inventory of Araneidae at the localities SME, HA, and EL, over the period from April 2013 to March 2014. Each sampling unit consisted of two sampling strategies (direct search and beating) performed by a total of five people during 7 daylight hours, once per month. Solid lines indicate the average number of species accumulated per sampling effort unit. Dotted lines indicate the richness estimated at the asymptote.
Diversity 15 00466 g006
Table 1. Characteristics of three sampling localities in the tropical dry forest Morelos, Mexico.
Locality
CharacteristicsSMEHAEL
Coordinates18°30′57.34″ N
−99°06′46.26″ W
18°27′58.82″ N
−98°59′32.1″ W
18°32′52.93″ N
−98°55′57.97″ W
Altitude (m)85910361323
MunicipalityTlaquiltenangoTlaquiltenangoTepalcingo
Annual average temperature23.46 °C23.56 °C 23.16 °C
Annual average precipitation (mm)2.27 mm2.82 mm 2.65 mm
Within REBIOSHNoYesYes
Table 2. Genera and species richness and abundance of juveniles and adults by locality.
LocalityNumber of GeneraNumber of SpeciesTotal Adult IndividualsTotal Juvenile Individuals
SME10102158
HA77208201
EL6773113
Total--302372
Table 3. The true diversity of order q = 0, 1 and 2 compared to diversity indices (Shannon, Simpson) and Chao 1 and 2 estimators in the three sampling localities: SME, HA and EL.
Locality
Estimator
SMEHAEL
0D1077
1D8.8281.3033.189
2D8.0191.1022.470
Chao 1141710
Chao 21620.759.25
Table 4. Spider composition turnover between localities, measured with ßj and ßsim indices.
ßsim
ß DiversitySMEHAEL
SME 0.780.7
ßjHA0.87 0.7
EL0.790.73
Table 5. Plant composition turnover between localities, measured with ßj and ßsim indices.
ßsim
ß DiversitySMEHAEL
SME 0.880.85
ßjHA0.93 0.74
EL0.920.81
Table 6. Clench equation. Sn = a•n/(1 + b•n) where a = the rate of increase in new species at the beginning of the inventory, b = curve shape parameter, n = sampling units. Parameters analyzed from the species accumulation curve based on the Clench equation.
Locality
ParameterSMEHAEL
Sobs1077
Samples121212
a1.3520.8261.259
b0.0510.0370.094
Asymptote
(spp)
262213
Slope0.5180.3950.275
% fauna recorded 383153
Estimated sampling effort units required to record 95% of fauna (SEU)371513201
Additional sampling effort units required359501189
Time
(years)
304216
Disclaimer/Publisher’s Note: The statements, opinions and data contained in all publications are solely those of the individual author(s) and contributor(s) and not of MDPI and/or the editor(s). MDPI and/or the editor(s) disclaim responsibility for any injury to people or property resulting from any ideas, methods, instructions or products referred to in the content.

