Article

Use of Formalin-Preserved Collections to Infer Trophic Indicators of Marine Zooplankton from Stable Isotopes

Instituto Español de Oceanografía, IEO-CSIC, Centro Oceanográfico de A Coruña, 15001 A Coruña, Spain
*
Author to whom correspondence should be addressed.
Diversity 2023, 15(3), 459; https://doi.org/10.3390/d15030459
Submission received: 29 November 2022 / Revised: 15 February 2023 / Accepted: 17 March 2023 / Published: 20 March 2023
(This article belongs to the Special Issue Advances in the Diversity and Ecology of Zooplankton)

Abstract

:
Formalin preservation affects the stable isotope composition of zooplankton samples, thus limiting the analysis of valuable collections covering large time intervals. Here, we compare different procedures for correcting the bias caused by formalin in δ13C and δ15N of zooplankton community samples. Zooplankton samples representative of seasonal variations in the period 2000–2009 were collected off A Coruña (NW Spain). Part of the sample was immediately dried and analysed for δ13C, δ15N, and elemental composition within 3 years of collection. These values were used as the unpreserved reference. The remaining sample was preserved in 4% formaldehyde and aliquots obtained after a period ranging from 3 years to more than 10 years of storage were analysed as the originally dried samples. Additionally, the copepod fraction of total biomass was determined in the preserved samples. Corrections of formalin effects based on ordinary least squares regression had large uncertainties, while mass balance corrections based on the change in C:N ratio (only possible for δ13C) overestimated reference values. However, either simple corrections based on the mean difference between values in dry and preserved samples or more complex generalised additive models considering seasonality, copepod biomass, and time of sample storage, produced estimations with relatively low uncertainty. Our results highlight the importance of determining specific correction solutions for each preserved collection before reconstructing stable isotope time series. Furthermore, the uncertainties associated with the estimates can be used in sensitivity analysis to assess their potential impact on the interpretation of the series.

1. Introduction

Marine ecosystems are in a permanent change because of external and internal drivers. Climate and its present interaction with anthropogenic factors is one of the main external forcing mechanisms [1,2]. In turn, internal drivers, generally identified with changes and adjustments in the species composition, affect ecological interactions and succession patterns [3]. Recent changes in global and regional ocean biogeochemistry and productivity [4] have altered species distribution and phenology [5]. Most of these changes are reflected in the structure and functioning of food webs, modifying their length (i.e., the number of trophic steps) or the trophic position of some species [6,7,8].
Changes in marine food web structure can be investigated by the stable isotope analysis of carbon and nitrogen. For instance, the time series of natural isotope has been successfully employed to detect long-term changes in the planktonic food web structure in the ocean. Temporal variations in nitrogen isotopes have been associated with changes in the source of nutrients [8,9] but also on the trophic position of some species [10]. However, determining long-term changes in planktonic food web structure from stable isotopes is limited by the availability of samples covering large periods. One way to overcome this problem is the use of sample collections initially intended for biodiversity analyses by microscopical examination [8,11]. Studies on preserved marine zooplankton samples revealed a variety of effects on stable isotope composition depending on the type of organisms considered, the chemical nature of the preservative, and the conditions of the preservation. For instance, a significant decrease in the abundance of heavy isotopes of carbon (δ13C) and small changes in those of nitrogen (δ15N) were generally reported for species preserved in formaldehyde solutions (formalin), mainly copepods [8,11,12,13,14,15] but also from other groups such as chaetognaths [12] or euphausiids [13]. However, the magnitude of the changes in the isotopic composition varied not only with the species but also with the time of storage of the specimens in the preservative solution before analysis [11,13], thus requiring specific studies for each collection of samples and selected species or taxonomic groups. In contrast with the results obtained with freshwater zooplankton, [16], the changes in the C:N ratio caused by the preservative in marine species did not allow for a prediction of the effects beyond relatively small storage periods [11], while the magnitude of the changes in isotopic composition was generally higher in freshwater species [16,17].
An alternative to analyse only selected species would be using samples of zooplankton assemblages including all the species in a given size fraction but, to our knowledge, there were no studies considering the effect of the preservative on isotopes analysed in samples composed of a mixture of species. Therefore, there is a need for determining feasible methodological corrections of isotopic results obtained from collections of formalin-preserved samples of zooplankton species assemblages to infer changes in food web structure during long time periods. One application of these corrections would be the investigation of the food web structure in the different regimes identified in plankton communities of the North Atlantic and other ocean basins in recent decades [18,19,20].
The objective of this study is to develop a procedure for correcting the bias observed in δ13C and δ15N of samples of zooplankton species assemblages stored for long periods in a formaldehyde solution. For this purpose, we compare several models of correction, including lineal regression, direct subtraction of mean differences, and more complex generalised additive models considering the effect of seasonality, storage time, and copepod dominance.

2. Materials and Methods

2.1. Zooplankton Sampling

The zooplankton samples were collected at stations E2CO (43°25.32 N, 08°26.22 W, 77 m depth) and E4CO (43°21.78 N, 08°22.20 W, 22 m depth) off A Coruña (NW Spain) with double-oblique tows of Juday-Bogorov or Bongo plankton nets (200 µm mesh size, 50 cm diameter). Samples were obtained at approximate monthly time intervals as part of a long-term study of oceanographic and planktonic variables [21]. This ecosystem is under the influence of a seasonal upwelling and is characterised by large variations in zooplankton diversity and biomass, as described in previous studies [20,21,22]. In the present study, we used samples collected at station E2CO during the period 2000–2009 and at station E4CO during 2006. In all cases, visible gelatinous organisms (e.g., jellyfish or salps) were removed and subsamples were obtained using a Folsom splitter. One half of the sample was immediately dried (60 °C, 48 h) to measure the dry weight biomass (±0.01 mg) and subsequently analysed for C and N elemental and stable isotope composition within 3 years of collection (dry samples). The remaining sample was preserved in borax-buffered formalin solution (PANREAC 37–38% formaldehyde solution stabilised with methanol, analytical grade) diluted with seawater to a final concentration of ca. 4% formaldehyde. Preserved samples were stored until analysis of stable isotope composition by first rinsing the sample with filtered seawater using a 40 µm mesh sieve before drying in an oven as with the unpreserved samples. Previously, species composition was analysed in the preserved samples by microscopical examination [20,21,22]. Percent contribution of copepods to total zooplankton biomass (i.e., total dry weight of the sample) was estimated from species abundance and body size values. The mean length (L, mm) for each species was obtained from the Marine Planktonic Copepods Database from the Oceanological Observatory of Banyuls sur Mer [23]. Length and individual biomass in wet weight (WW, mg) were related by an allometric relationship using the WW values provided by Acuña et al. [24] for some species:
log WW = 2.949 log L − 1.463
This equation was then applied to compute the WW for the remaining species. Biomass data in WW were converted into DW using the regression equation proposed by Wiebe [25]:
log DW = log [(0.001 WW) + 2.002]/0.950
Finally, the biomass of the copepod species in each sample was calculated (as mg m−3) by multiplying their abundance (individuals m−3) by the corresponding species DW. The dominance of copepods in the zooplankton biomass (% copepod biomass) was computed as:
% copepod biomass = 100 ∑ DWi/DWs
where DWi and DWs are the biomass of individual species and of the whole zooplankton sample, respectively.

2.2. Stable Isotope Analysis

The elemental and stable isotope composition of carbon and nitrogen were determined in aliquots of dry zooplankton material, homogenised using a mortar and pestle and encapsulated in tin boats that were subsequently fed into an elemental analyser (Carlo Erba CHNSO 1108) coupled to an isotope-ratio mass spectrometer (Thermo Finnigan Mat Delta Plus). The system was calibrated with IAEA isotope standards (USGS40 and L-alanine) obtaining offsets from certified δ13C and δ15N values <0.1‰. The standard error of triplicate determinations of internal acetanilide standards and samples was <0.1‰ and <0.3‰ for δ13C and δ15N, respectively. Isotopic determinations were made at the Servizos de Apoio á Investigación of the Universidade da Coruña (Spain). Raw results including sampling dates, copepod biomass fraction, and stable isotopes in preserved and unpreserved samples, are available through the PANGAEA repository [26].

2.3. Statistical Analysis
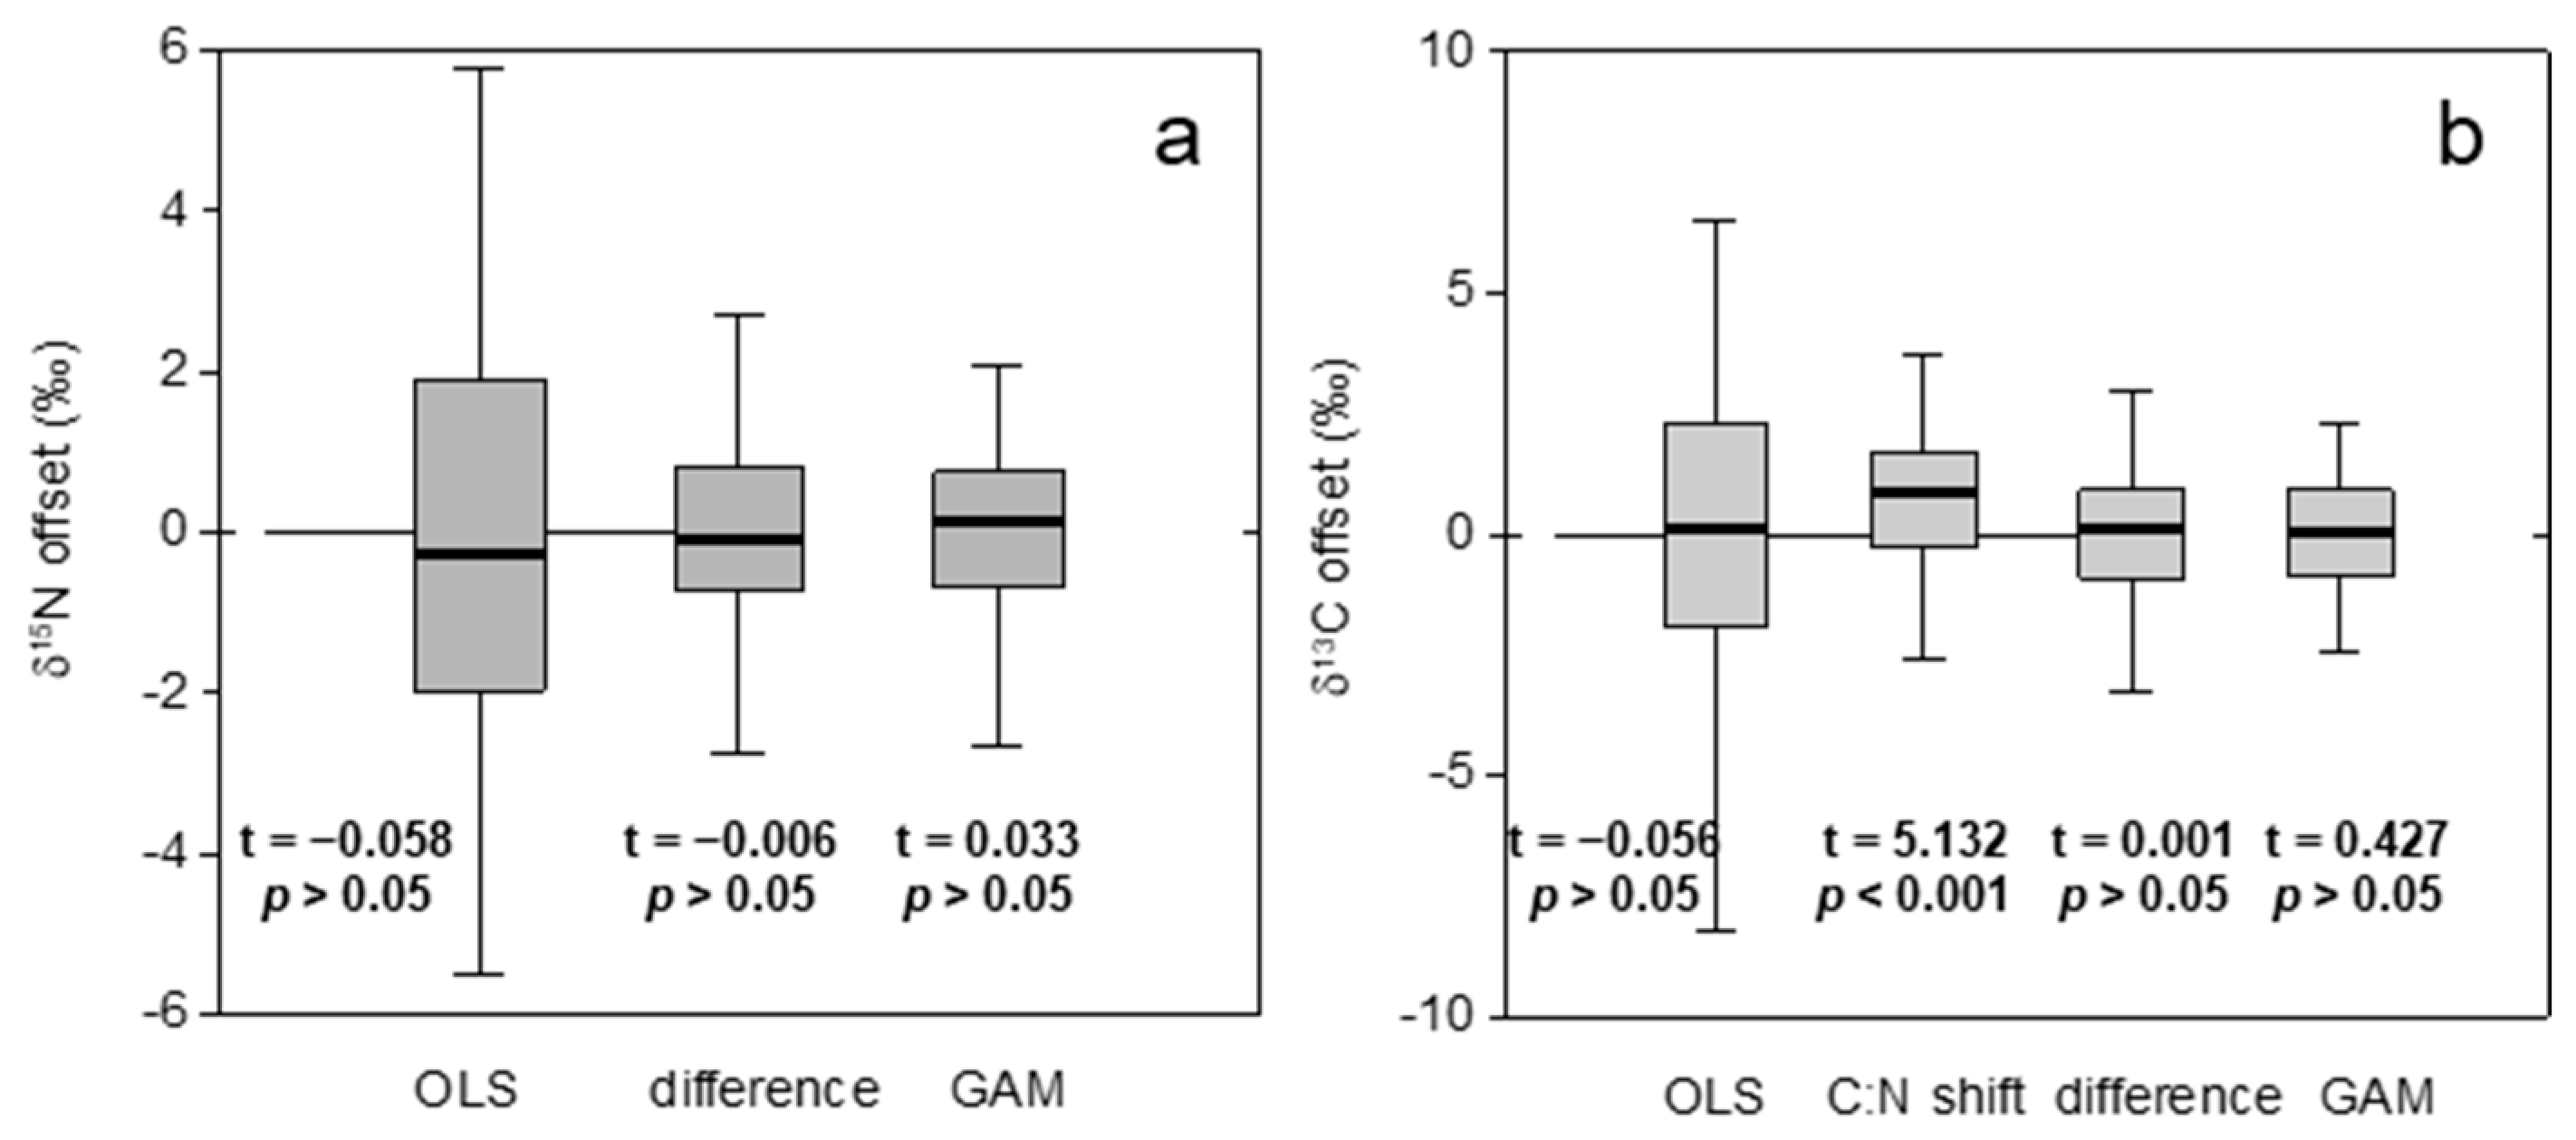
The differences between mean values of δ13C, δ15N, and the C:N ratio determined in the formalin-preserved and dry samples were first assessed using Student’s t-tests for paired observations. Thereafter, up to four models for correction of the bias in stable isotope composition caused by the formalin preservation were employed. First, values measured in formalin-preserved samples were linearly related with those measured in dry samples by ordinary least squares regression (OLS), as the resulting equations were later employed for estimating values in unpreserved samples [27]. Second, the difference between the formalin-preserved and dry sample values was modeled by OLS with the relative change in the C:N ratio [16,28]:
δfor−δdry = D (C:Ndry − C:Nfor)/C:Ndry
where δfor and δdry are the isotopic values measured in the formalin and dry samples, respectively, and C:Nfor and C:Ndry the corresponding C:N values. D is a constant indicating the correction factor.
Third, the values obtained from formalin-preserved samples were corrected by subtracting the mean value of the difference between the preserved and dry samples. Finally, generalised additive models (GAM) [25] assuming a Gaussian distribution were constructed to predict values in unpreserved samples. Predictors in the GAMs included the sampling date measured as the day of the year (DoY) as an index of seasonality in nutrient sources, the storage time in formalin (number of days) before isotopic analysis, and the fraction of copepods represented in total biomass, as an index of variability in taxonomic composition. The non-parametric smoothing functions in the GAMs were fit by penalised cyclic and cubic regression splines with a maximum of six and three knots for the day of the year, storage time, and fraction of copepods. Models were fit using the ‘mgcv 1.8–40’ package [29] in R (version 4.2.) [30].
The final assessment of the performance of the different models when correcting for the bias in formalin samples was carried out by comparing the values of the coefficient of determination (r2) of the regression models and the 95% confidence interval of the mean offset between the estimated and observed values in dry zooplankton samples.

3. Results

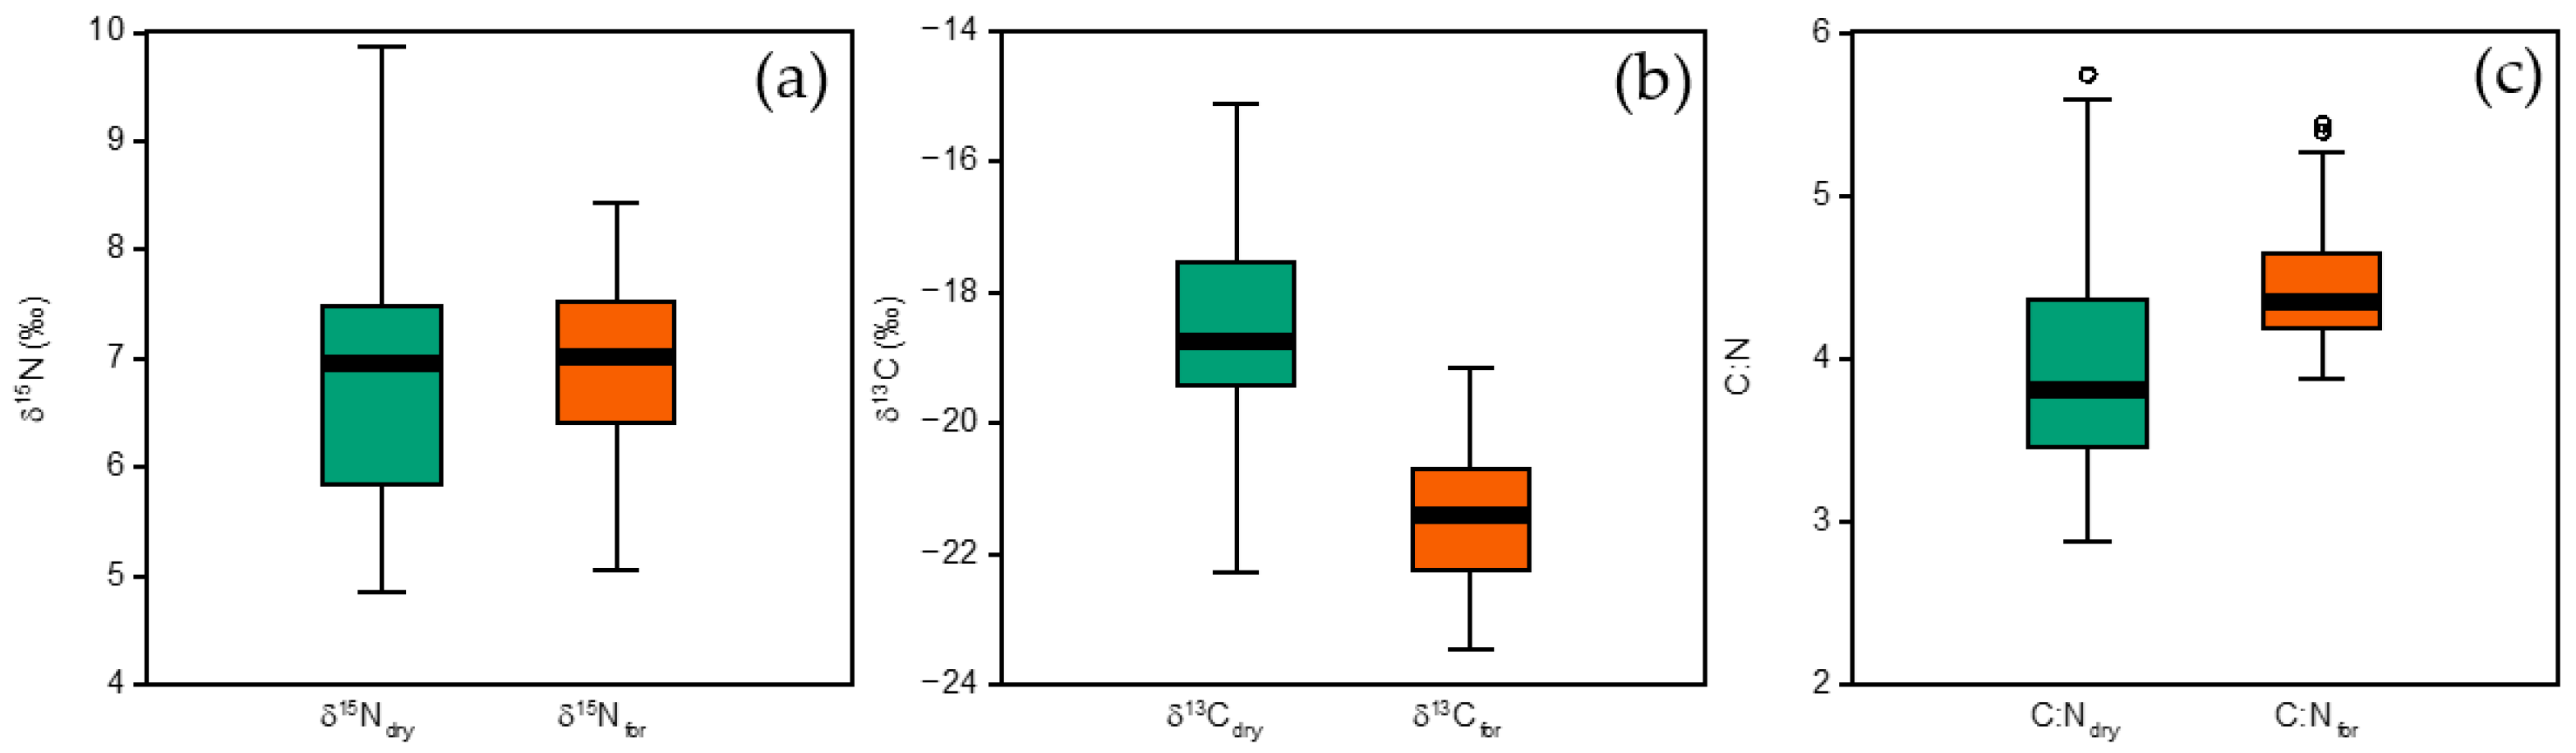
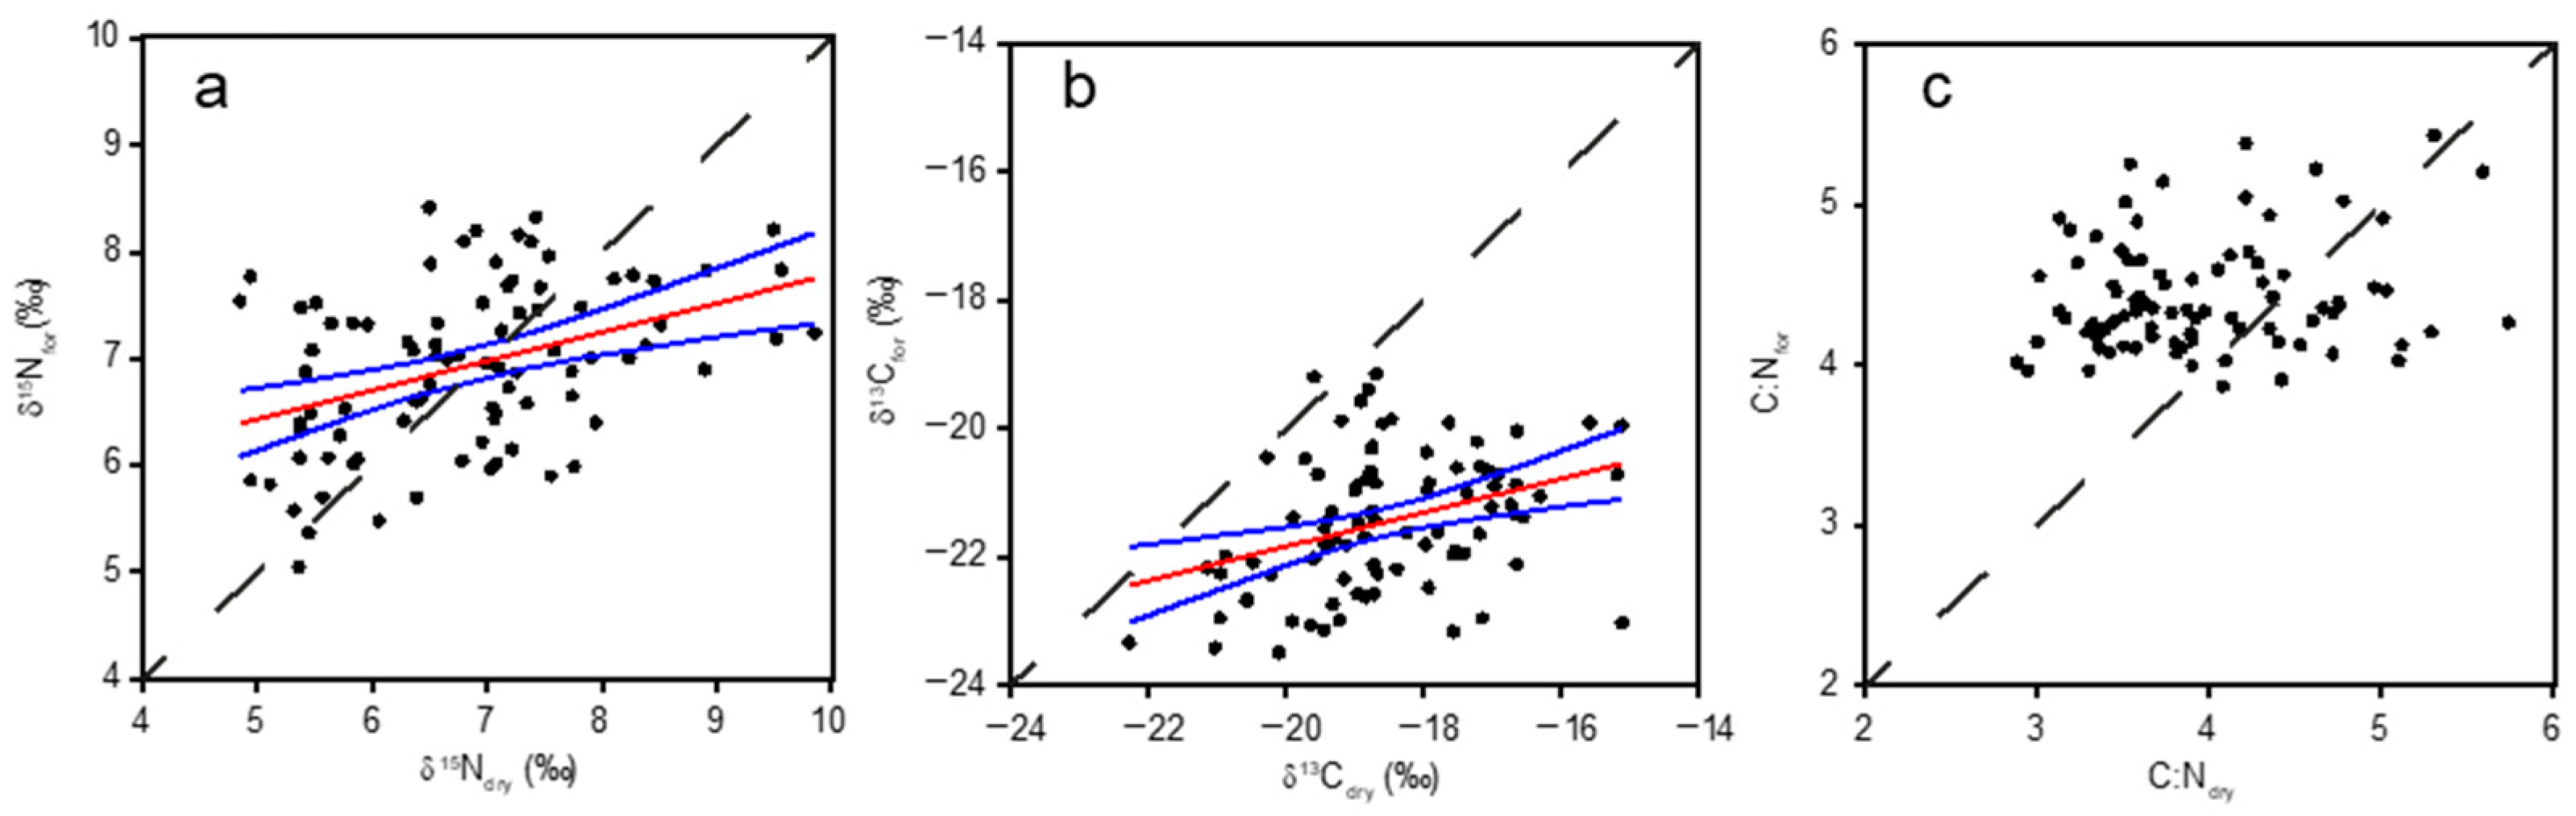
3.1. Comparison of Formalin vs. Dry Sample Measurements

Measurements in formalin preserved samples differed from those in dry samples (Figure 1). These differences were not significant for δ15N (Student’s t = −0.707, p > 0.05, n = 87) but highly significant for δ13C (Student’s t = 18.659, p < 0.001) and C:N ratio (Student’s t = −6.570, p < 0.001). Mean (±se) differences between formalin and dry values were 0.08 ± 0.12‰, −2.86 ± 0.15‰, and 0.48 ± 0.07 for δ15N, δ13C, and C:N, respectively. Values measured in both types of samples showed significant positive correlations, except in the case of C:N (Figure 2).
In turn, the differences between δ13C (but not δ15N) values in formalin and dry samples were significantly correlated with the relative shift observed in C:N (Figure 3). Therefore, a correction of δ13Cfor based in the C:N shift described by Equation (1) was feasible.

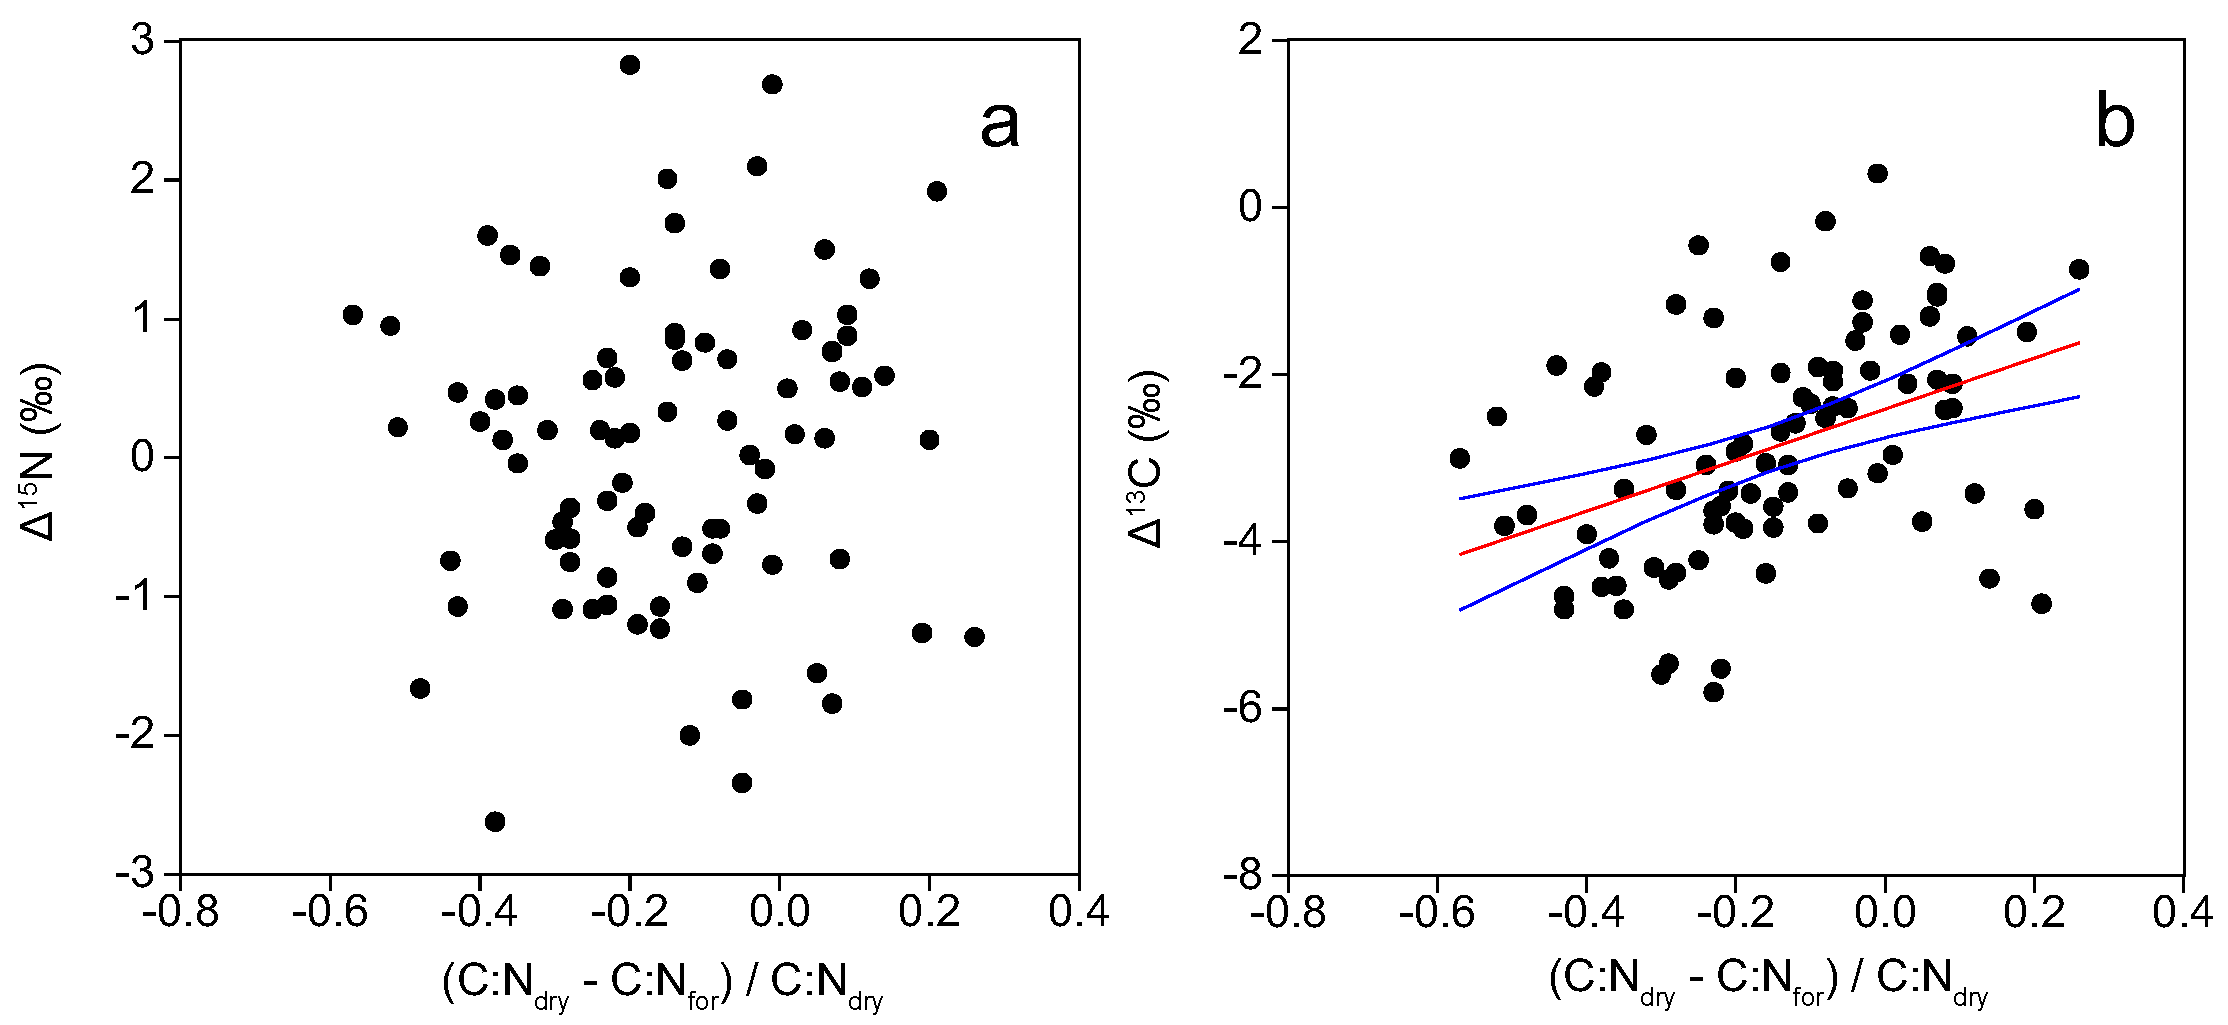
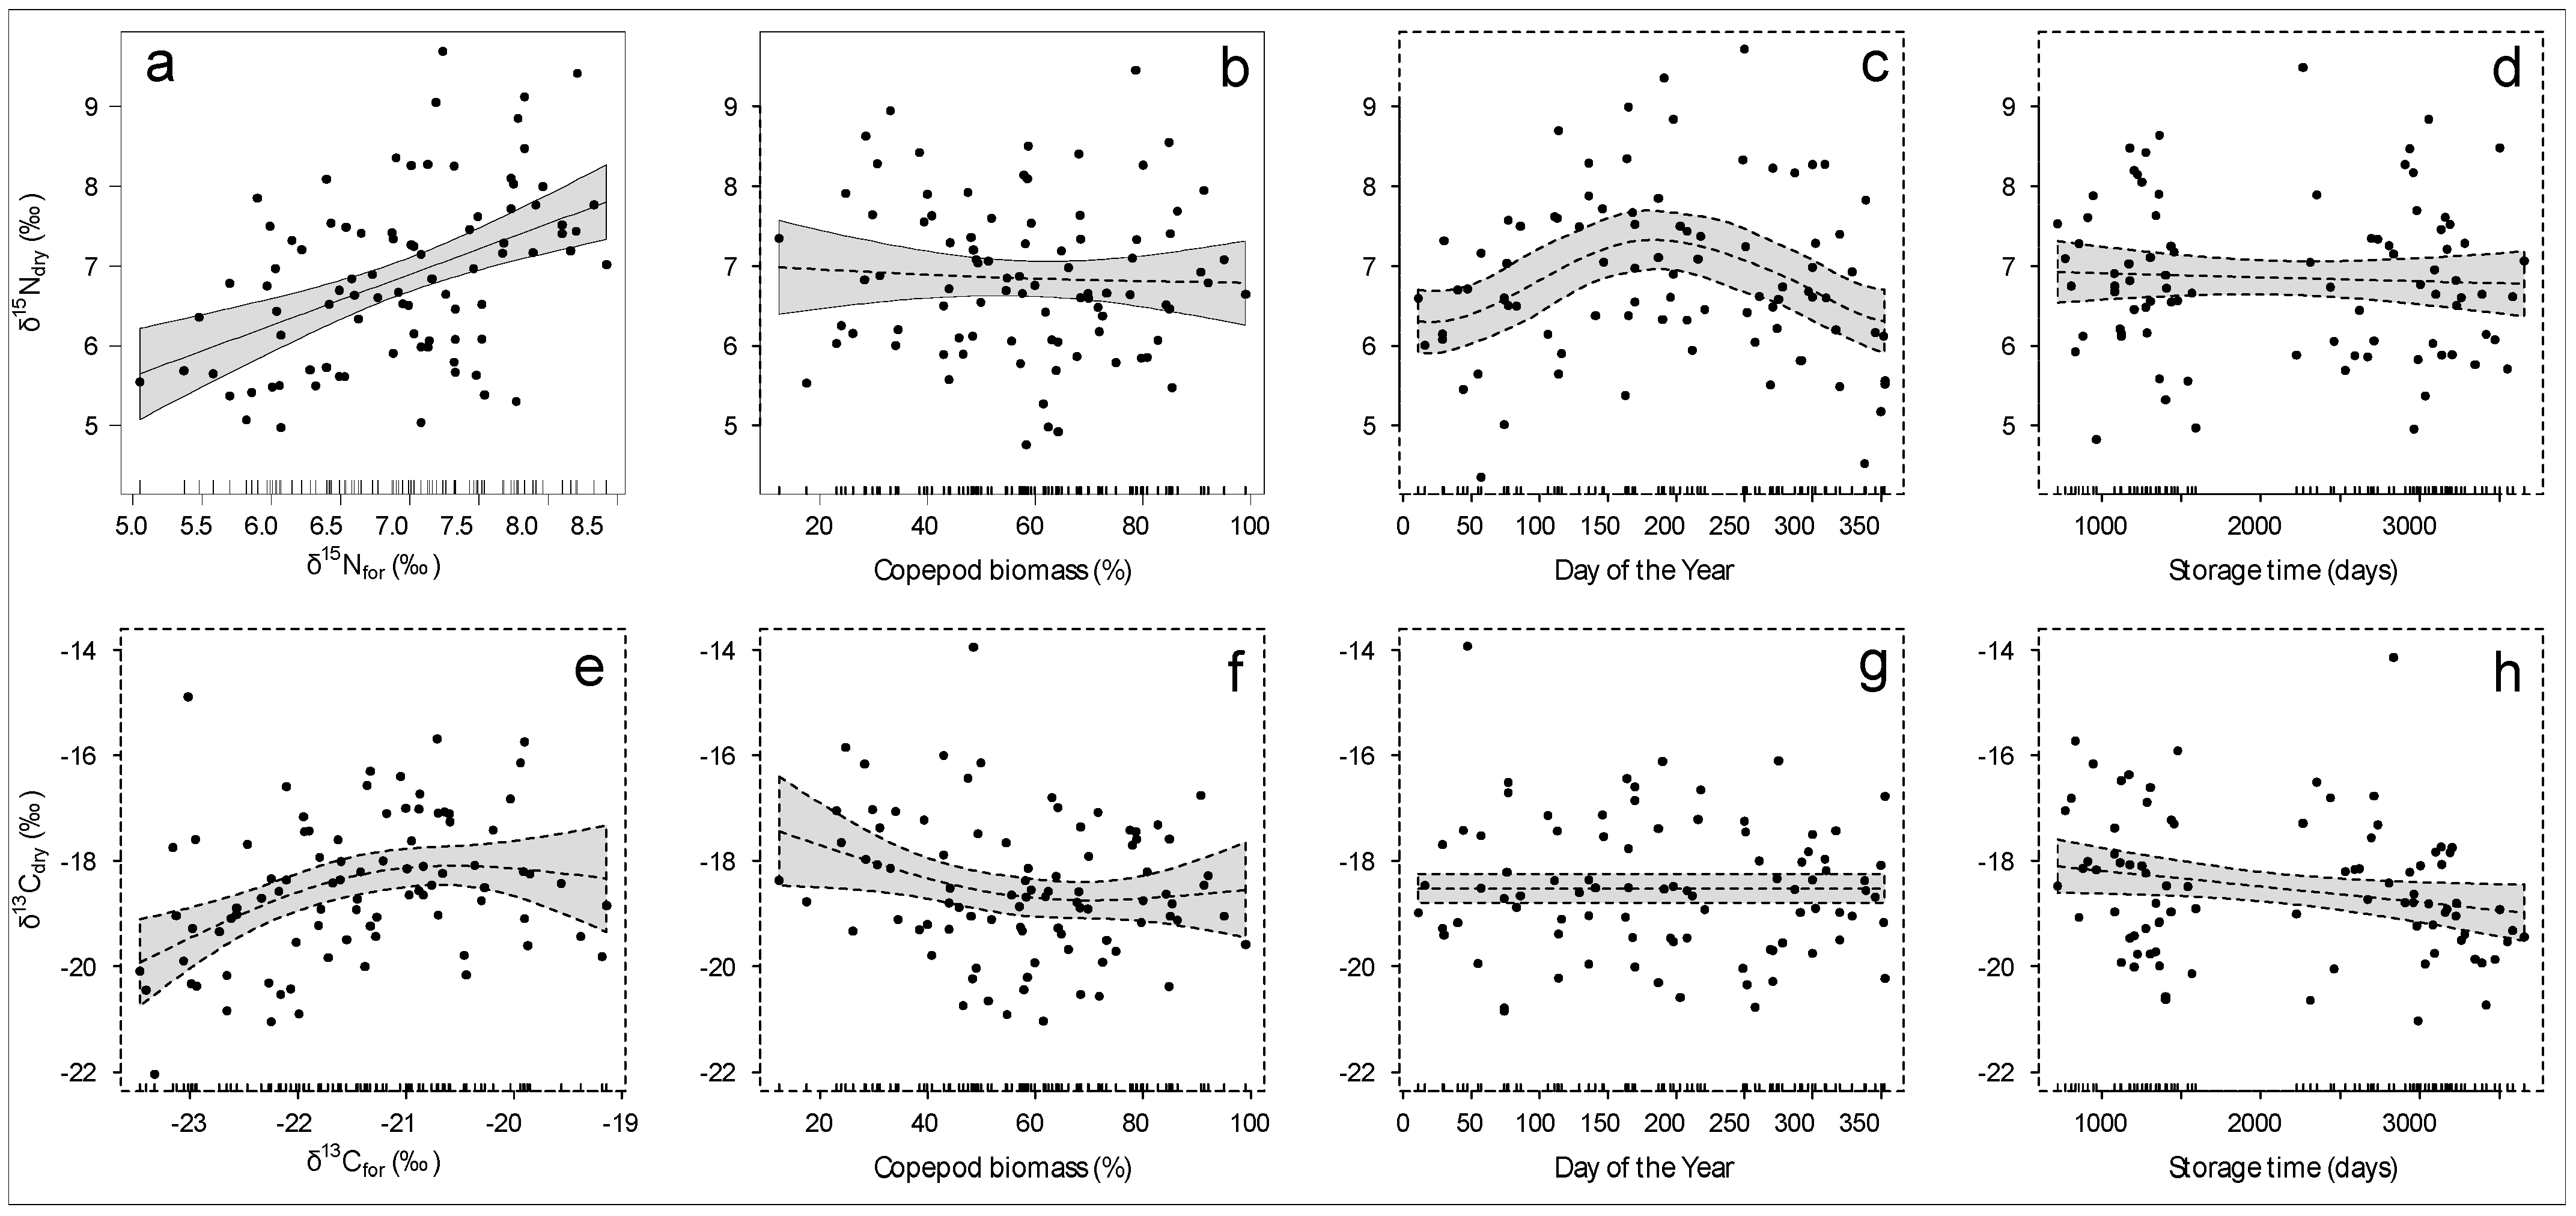
3.2. Models for Correction of Measurements in Formalin

The slope of the regression lines between formalin and dry sample measurements for both δ15N and δ13C was <<1, indicating that the values measured in formalin increased less than the corresponding values measured in dry samples (Table 1). In addition, the coefficients of determination of these linear regression models were low, as a large part of the variability was not accounted for the regression fits, thus limiting their predictive power.
In the case of the corrections based on the C:N shift, the slope of the regression line between the difference δ13Cfor−δ13Cdry was used as an estimate of D in Equation (1) but, as in the previous regression models, the coefficient of determination was low (Table 1).
Because of the low predictive power of OLS models, corrections using alternative GAMs examined the potential of several explanatory variables (Figure 4). These models slightly improved r2 values (Table 2) compared to those of the OLS regressions (Table 1). In the case of δ15Ndry, the model confirmed the linear increase with δ15Nfor already indicated by the OLS model, but also a seasonal increase with maximum values in summer and minimum values in winter. However, the individual contributions of other variables, as the fraction of total biomass accounted for by copepods or the storage time in formalin, were not statistically significant (Figure 4a–d and Table 2). The GAM for δ13Cdry also revealed a significant relationship with δ13Cfor, but in this case in the form of a non-linear increase up to a maximum δ13Cfor value of ca. −21.5‰, reaching a constant value thereafter. Seasonality or the fraction of copepods were not significant predictors of δ13Cdry. Finally, the GAM indicated that the storage time was negatively correlated with δ13Cdry (Table 2).
Corrections of δ15N or δ13C values measured in formalin based on OLS, C:N, shift or GAM, along with the simple correction based on subtracting the mean value of the difference observed between values in formalin and dry samples, were compared with the dry sample values (Figure 5). The corresponding offsets between estimated and measured values indicated a good agreement (i.e., mean offsets non-significantly different from 0, Student’s t, p > 0.05) in most cases with the exception of the estimates based on the C:N shift (Student’s t, p < 0.001). The latter overestimated δ13C values measured in dry samples by 0.76 ± 0.15‰ (mean ± se).
However, most models showed large variability in the estimations, with interquartile ranges exceeding 2‰ (Table 3). Only the corrections based on the subtraction and GAM models had interquartile ranges <2% and the 95% confidence intervals for the mean offset were <0.5‰ and <0.6‰, for δ15N and δ13C, respectively.

4. Discussion

Our results confirm the significant depletion in heavy carbon isotopes and the low effect on nitrogen isotopes of formalin in samples of marine zooplankton assemblages preserved for long periods (>1 year). These findings are, to our knowledge, the first reported for samples representative of plankton assemblages, as previous studies examined these effects in individual species, mostly copepods [8,12]. The described changes showed lower variability than those considering smaller sampling storage periods [11,14,31], likely because of the relatively long equilibration time required for the preservative to interact with the zooplankton tissues. In fact, we did not detect a significant effect on δ15N, and only a slight linear decrease on δ13C, when comparing samples stored for periods between 3 and 10 years. It must be noted that through our study, we used formalin from the same provider, thus reducing the probability of differences caused by the composition of the preservative [11].
Particularly in the case of carbon isotopes, the decrease in δ13C has been attributed to the hydrolysis of 13C enriched molecules, as proteins, caused by the formaldehyde while less enriched molecules, as lipids, are conserved [32,33]. In addition, the loss of heavy isotopes may be compensated by the incorporation of light isotopes from the formalin solution [11,32,33,34]. In any case, both effects would result in an increase in the C:N ratio, as observed in our study. In contrast, the effects on δ15N were small, likely because the formalin solution does not contain nitrogen and the only effect would be the leaching of light nitrogen atoms after hydrolysis of the zooplankton tissues [11]. Our study showed that the difference in δ15N between formalin and dry samples was non-significant, in agreement with published studies with marine copepoda [8,11,12,13] where mean differences were up to 0.3‰, and thus within the limits of the analytical error of δ15N determinations. This result suggests that, in our series, no corrections would be necessary when comparing δ15N values measured in zooplankton samples stored in formalin, as assumed in other studies [8,12,13]. Indeed, both the OLS and GAM indicated a significant linear relationship between values measured in formalin and those in dry samples, but this relationship accounted for only <30% of the variability in δ15Ndry. Therefore, the correction of δ15Nfor using either OLS or GAM would not substantially improve the estimation of δ15Ndry.
The correction of formalin effects on δ13C was generally not recommended for marine zooplankton because of the large variety of effects described for various combinations of species, preservation time, and fixative agents [11,14,31]. Since we used samples composed of several species, variations in the proportions of species as a consequence of seasonal succession [35] could be one of the causes of this variability. However, as shown in the GAM analysis, the dominance of copepods or the seasonality were not significantly related to the variations in δ13Cdry. Furthermore, the average effect of formalin on δ13C in our case is within the values reported for marine copepods stored for similar periods [8,12], and has an associated error of similar magnitude to the analytical error, thus suggesting that the simple subtraction of this value from δ13Cfor can be a robust estimate of δ13Cdry. Estimations based on the OLS regression between δ13Cfor and δ13Cdry had large uncertainty because of the low fraction of variance accounted for by the model (r2 = 0.13). The mass balance correction based on the C:N shift slightly improved the prediction (r2 = 0.17); however, in contrast to the findings reported for freshwater zooplankton species [15], it still resulted in being a poor predictor of δ13Cdry. Finally, the estimations using the GAM model increased the r2 value (0.20), though this model produced similar variability in δ13Cdry estimates when compared to the subtraction method, the later requiring fewer complex calculations.
This study provides feasible procedures for estimating δ15N and δ13C values in dry (unaltered) samples of zooplankton assemblages from measurements in samples preserved in formalin for more than 3 years. These procedures can be used to reconstruct the long time series of isotopic data from stored zooplankton collections, as implemented for other aquatic organisms [36,37,38,39]. However, it must be noted that the estimated values, particularly in the case of δ13C, have an associated error that can confound the interpretation of the results. For instance, the reconstruction of isotopic signatures for Bayesian stable isotope mixing models can be compromised by these errors [40]. The use of corrections could not be required in the case of time series studies, as long as all the data were obtained from samples preserved or analysed in the same way (e.g., dry or formalin preserved). Alternatively, the effect of the variability in the estimates on the interpretation of trends in isotope signatures can be examined through sensitivity analysis based on the error intervals obtained. For instance, the correction by subtraction of the mean difference between formalin and dry samples can be modeled for various estimates within the 95% interval of the mean determined in this study.
The use of dry or frozen samples of single species is always preferable to obtain accurate measurements of δ15N and δ13C of marine zooplankton because any other preservation method can affect the isotopic determinations. However, the preservation and availability of samples in adequate quantities for isotopic analysis is often compromised and alternative determinations can be performed using preserved collections. The interpretation of isotopic measurements on preserved samples requires the critical application of corrections to estimate the original values in unpreserved samples. Furthermore, non-living particles, as microplastics, are often collected by plankton nets [41] but its effect on the isotopic determinations of plankton samples is not known. Our study illustrates the search for feasible correction methods applied to a specific sample collection. Here, we have proposed the simple subtraction of the mean difference between isotopic values measured in formalin samples and those in dry samples determined in this study as a simple method to extend the time series of zooplankton to periods when dry samples are not available but there are samples preserved in formalin. However, we stress that any correction procedure may be not of general application to all collections of plankton samples, thus requiring the development of specific protocols in each particular case. The resulting time series and the associated estimation errors would allow performing sensitivity analyses in order to assess the reliability of specific results, as those related to the patterns of temporal variability.

Author Contributions

Conceptualisation, A.B. and C.M.; methodology, C.M. and Á.F.L.; formal analysis, A.B. and J.O.; investigation, A.B. and C.M.; resources, A.B. and J.O.; data curation, A.B.; writing—original draft preparation, A.B. and C.M.; writing—review and editing, A.B., J.O., Á.F.L. and C.M.; visualization, A.B. and J.O.; funding acquisition, A.B. and J.O. All authors have read and agreed to the published version of the manuscript.

Funding

This research was funded by projects QLOCKS (PID2020-115620RB-100, MCIN/AEI/10.13039/501100011033) and RADIALES (Instituto Español de Oceanografía, Spain). C.M. was supported by a FPI fellowship from the Instituto Español de Oceanografía (Spain).

Data Availability Statement

Isotopic data are available through the PANGAEA repository (https://doi.pangaea.de/10.1594/PANGAEA.932538, accessed on 2 November 2022).

Acknowledgments

We acknowledge the collaboration of the crew of the R/V Lura during sampling. Isotopic analysis was carried out by M. Lema at the Servizo de Apoio a Investigación (Universidade da Coruña, Spain).

Conflicts of Interest

The authors declare no conflict of interest. The funders had no role in the design of the study; in the collection, analyses, or interpretation of data; in the writing of the manuscript; or in the decision to publish the results.

References

  1. Jackson, J.B.C.; Kirby, M.X.; Berger, W.H.; Bjorndal, K.A.; Botsford, L.W.; Bourque, B.J.; Bradbury, R.H.; Cooke, R.; Erlandson, J.; Estes, J.A.; et al. Historical Overfishing and the Recent Collapse of Coastal Ecosystems. Science 2001, 293, 629–637. [Google Scholar] [CrossRef] [PubMed] [Green Version]
  2. Ruiz-Cooley, R.I.; Gerrodette, T.; Fiedler, P.C.; Chivers, S.J.; Danil, K.; Ballance, L.T. Temporal variation in pelagic food chain length in response to environmental change. Sci. Adv. 2017, 3, e1701140. [Google Scholar] [CrossRef] [PubMed] [Green Version]
  3. Barton, A.D.; Finkel, Z.V.; Ward, B.A.; Johns, D.G.; Follows, M.J. On the roles of cell size and trophic strategy in North Atlantic diatom and dinoflagellate communities. Limnol. Oceanogr. 2013, 58, 254–266. [Google Scholar] [CrossRef]
  4. Malone, T.C.; Azzaro, M.; Bode, A.; Brown, E.; Duce, R.; Kamykowski, D.; Kang, S.H.; Kedong, Y.; Thorndyke, M.; Wang, J.; et al. Primary production, cycling of nutrients, surface layer and plankton. In The First Global Integrated Marine Assessment: World Ocean; Cambridge University Press: Cambridge, UK, 2017; pp. 119–148. [Google Scholar]
  5. Walther, G.-R.; Post, E.; Convey, P.; Menzel, A.; Parmesan, C.; Beebee, T.J.C.; Fromentin, J.M.; Hoegh-Guldberg, O.; Bairlein, F. Ecological responses to recent climate change. Nature 2002, 416, 389–395. [Google Scholar] [CrossRef] [PubMed]
  6. Reum, J.C.P.; Jennings, S.; Hunsicker, M.E. Implications of scaled δ15N fractionation for community predator-prey body mass ratio estimates in size-structured food webs. J. Anim. Ecol. 2015, 84, 1618–1627. [Google Scholar] [CrossRef]
  7. Ruiz-Cooley, R.I.; Koch, P.L.; Fiedler, P.C.; McCarthy, M.D. Carbon and Nitrogen Isotopes from Top Predator Amino Acids Reveal Rapidly Shifting Ocean Biochemistry in the Outer California Current. PLoS ONE 2014, 9, e110355. [Google Scholar] [CrossRef]
  8. Rau, G.H.; Ohman, M.D.; Pierrot-Bults, A. Linking nitrogen dynamics to climate variability off central California: A 51 year based on 15N/14N in CalCOFI zooplankton. Deep Sea Res. II 2003, 50, 2431–2447. [Google Scholar] [CrossRef]
  9. El-Sabaawi, R.W.; Trudel, M.; Mackas, D.L.; Dower, J.F.; Mazumder, A. Interannual variability in bottom-up processes in the upstream range of the California Current system: An isotopic approach. Prog. Oceanogr. 2012, 106, 16–27. [Google Scholar] [CrossRef]
  10. Chiba, S.; Sugisaki, H.; Kuwata, A.; Tadokoro, K.; Kobari, T.; Yamaguchi, A.; Mackas, D.L. Pan-NorthPacific comparison of long-term variation in Neocalanus copepods based on stable isotope analysis. Prog. Oceanogr. 2012, 97, 63–75. [Google Scholar] [CrossRef]
  11. Bicknell, A.W.J.; Campbell, M.; Knight, M.E.; Bilton, D.T.; Newton, J.; Votier, S.C. Effects of formalin preservation on stable carbon and nitrogen isotope signatures in Calanoid copepods: Implications for the use of Continuous Plankton Recorder Survey samples in stable isotope analyses. Rapid Commun. Mass Spectrom. 2011, 25, 1794–1800. [Google Scholar] [CrossRef]
  12. Mullin, M.M.; Rau, G.H.; Eppley, R.W. Stable nitrogen isotopes in zooplankton: Some geographic and temporal variations in the North Pacific. Limnol. Oceanogr. 1984, 29, 1267–1273. [Google Scholar] [CrossRef]
  13. Hannides, C.C.S.; Popp, B.N.; Landry, M.R.; Graham, B.S. Quantification of zooplankton trophic position in the North Pacific Subtropical Gyre using stable nitrogen isotopes. Limnol. Oceanogr. 2009, 54, 50–61. [Google Scholar] [CrossRef] [Green Version]
  14. De Lecea, A.M.; Cooper, R.; Omarjee, A.; Smit, A.J. The effects of preservation methods, dyes and acidification on the isotopic values (δ15N and δ13C) of two zooplankton species from the KwaZulu-Natal Bight, South Africa. Rapid Commun. Mass Spectrom. 2011, 25, 1853–1861. [Google Scholar] [CrossRef]
  15. Hetherington, E.D.; Kurle, C.M.; Ohman, M.D.; Popp, B.N. Effects of chemical preservation on bulk and amino acid isotope ratios of zooplankton, fish, and squid tissues. Rapid Commun. Mass Spectrom. 2019, 33, 935–945. [Google Scholar] [CrossRef]
  16. Ventura, M.; Jeppesen, E. Effects of fixation on freshwater invertebrate carbon and nitrogen isotope composition and its arithmetic correction. Hydrobiologia 2009, 632, 297–308. [Google Scholar] [CrossRef]
  17. Feuchtmayr, H.; Grey, J. Effect of preparation and preservation procedures on carbon and nitrogen stable isotope determinations from zooplankton. Rapid Commun. Mass Spectrom. 2003, 17, 2605–2610. [Google Scholar] [CrossRef]
  18. Beaugrand, G.; Reid, P.C.; Ibañez, F.; Lindley, J.A.; Edwards, M. Reorganization of North Atlantic Marine Copepod Biodiversity and Climate. Science 2002, 296, 1692–1694. [Google Scholar] [CrossRef] [Green Version]
  19. Reid, P.C.; Hari, R.E.; Beaugrand, G.; Livingstone, D.M.; Marty, C.; Straile, D.; Barichivich, J.; Goberville, E.; Adrian, R.; Aono, Y.; et al. Global impacts of the 1980s regime shift. Glob. Change Biol. 2016, 22, 682–703. [Google Scholar] [CrossRef] [Green Version]
  20. Bode, A.; Álvarez, M.; García García, L.M.; Louro, M.A.; Nieto-Cid, M.; Ruíz-Villarreal, M.; Varela, M.M. Climate and local hydrography underlie recent regime shifts in plankton communities off Galicia (NW Spain). Oceans 2020, 1, 181–197. [Google Scholar] [CrossRef]
  21. Valdés, L.; Bode, A.; Latasa, M.; Nogueira, E.; Somavilla, R.; Varela, M.M.; González-Pola, C.; Casas, G. Three decades of continuous ocean observations in North Atlantic Spanish waters: The RADIALES time series project, context, achievements and challenges. Prog. Oceanog. 2021, 198, 102671. [Google Scholar] [CrossRef]
  22. Bode, A.; Alvarez-Ossorio, M.T.; Miranda, A.; López-Urrutia, A.; Valdés, L. Comparing copepod time-series in the north of Spain: Spatial autocorrelation of community composition. Prog. Oceanogr. 2012, 97–100, 108–119. [Google Scholar] [CrossRef] [Green Version]
  23. Razouls, C.; Desreumaux, N.; Kouwenberg, J.; de Bovée, F. Biodiversity of Marine Planktonic Copepods (Morphology, Geographical Distribution and Biological Data). 2005–2023. Available online: http://copepodes.obs-banyuls.fr/en (accessed on 30 June 2022).
  24. Acuña, J.L.; Lopez-Urrutia, A.; Colin, S. Data compilation of marine pelagic organism oxygen respiration rates and biomasses. Pangaea 2014. [Google Scholar] [CrossRef]
  25. Wiebe, P. Functional regression equations for zooplankton displacement volume, wet weight, dry weight, and carbon: A correction. Fish. Bull. 1988, 86, 833–835. Available online: https://spo.nmfs.noaa.gov/node/14372 (accessed on 30 June 2022).
  26. Bode, A.; Mompeán, C.; Lamas, Á.F. Stable C and N isotope data for mesozooplankton samples unpreserved and preserved in formalin. Pangaea 2021. [Google Scholar] [CrossRef]
  27. Sokal, R.R.; Rohlf, F.J. Biometry, 2nd ed.; W.H. Freeman: San Francisco, CA, USA, 1981; p. 858. [Google Scholar]
  28. Smyntek, P.M.; Teece, M.A.; Schulz, K.L.; Thackeray, S.J. A standard protocol for stable isotope analysis of zooplankton in aquatic food web research using mass balance correction models. Limnol. Oceanogr. 2007, 52, 2135–2146. [Google Scholar] [CrossRef] [Green Version]
  29. Wood, S. Generalized Additive Models: An Introduction with R; Chapman & Hall/CRC Press: Boca Raton, FL, USA, 2006; p. 384. [Google Scholar]
  30. R Core Team. R: A language and environment for statistical computing. In R Foundation for Statistical Computing; The R Foundation: Vienna, Austria, 2022; ISBN 3-900051-07-0. Available online: http://R-project.org (accessed on 30 June 2022).
  31. Sano, M.; Makabe, R.; Kurosawa, N.; Moteki, M.; Odate, T. Effects of Lugol’s iodine on long-term preservation of marine plankton samples for molecular and stable carbon and nitrogen isotope analyses. Limnol. Oceanogr. Methods 2020, 18, 635–643. [Google Scholar] [CrossRef]
  32. Hobson, K.A.; Gibbs, H.L.; Gloutney, M.L. Preservation of blood and tissue samples for stable-carbon and stable-nitrogen isotope analysis. Can. J. Zool.-Rev. Can. Zool. 1997, 75, 1720–1723. [Google Scholar] [CrossRef]
  33. Bosley, K.L.; Wainright, S.C. Effects of preservatives and acidification on the stable isotope ratios (15N:14N, 13C:12C) of two species of marine animals. Can. J. Fish. Aquat. Sci. 1999, 56, 2181–2185. [Google Scholar] [CrossRef]
  34. Sarakinos, H.C.; Johnson, M.L.; Vander Zanden, M.J. A synthesis of tissue-preservation effects on carbon and nitrogen stable isotope signatures. Can. J. Zool. 2002, 80, 381–387. [Google Scholar] [CrossRef] [Green Version]
  35. Valdés, L.; López-Urrutia, A.; Beaugrand, G.; Harris, R.P.; Irigoien, X. Seasonality and interannual variability of copepods in the Western English Channel, Celtic Sea, Bay of Biscay, and Cantabrian Sea with a special emphasis to Calanus helgolandicus and Acartia clausi. ICES J. Mar. Sci. 2022, 79, 727–740. [Google Scholar] [CrossRef]
  36. Le Bourg, B.; Lepoint, G.; Michel, L.C.N. Effects of preservation methodology on stable isotope compositions of sea stars. Rapid Commun. Mass Spectrom. 2020, 34, e8589. [Google Scholar] [CrossRef]
  37. Durante, L.M.; Sabadel, A.J.M.; Frew, R.D.; Ingram, T.; Wing, S.R. Effects of fixatives on stable isotopes of fish muscle tissue: Implications for trophic studies on preserved specimens. Ecol. Appl. 2020, 30, e02080. [Google Scholar] [CrossRef]
  38. Willert, M.S.; France, C.A.M.; Brooks, B.L.; Baldwin, C.C.; Hay, M.E. Effects of formalin preservation on carbon and nitrogen stable isotopes of seaweeds: A foundation for looking back in time. Limnol. Oceanogr. Methods 2020, 18, 717–724. [Google Scholar] [CrossRef]
  39. Welicky, R.L.; Rolfe, T.; Leazer, K.; Maslenikov, K.P.; Tornabene, L.; Holtgrieve, G.W.; Wood, C.L. Fluid-preserved fishes are one solution for assessing historical change in fish trophic level. Ecol. Evol. 2021, 11, 415–426. [Google Scholar] [CrossRef]
  40. Silberberger, M.J.; Koziorowska-Makuch, K.; Kulinski, K.; Kedra, M. Stable isotope mixing models are biased by the choice of sample preservation and pre-treatment: Implications for studies of aquatic food webs. Front. Mar. Sci. 2021, 7, 621978. [Google Scholar] [CrossRef]
  41. Carretero, O.; Gago, J.; Filgueiras, A.V.; Viñas, L. The seasonal cycle of micro and meso-plastics in surface waters in a coastal environment (Ría de Vigo, NW Spain). Sci. Total Environ. 2022, 803, 150021. [Google Scholar] [CrossRef]
Figure 1. Box plot of (a) δ15N, (b) δ13C, and (c) C:N of mesozooplankton samples immediately dried after sampling (dry) or preserved in formalin (for). Box: 25 and 75% quartiles; whiskers: 1.5× the interquartile range; horizontal line: median; circles: outliers (>1.5× the interquartile range).
Diversity 15 00459 g001
Figure 2. Relationships between measurements of (a) δ15N, (b) δ13C, or (c) C:N in mesozooplankton samples immediately dried after sampling (dry) or preserved in formalin (for). Significant ordinary least squares regression lines are indicated in red and the corresponding 95% confidence limits are in blue. The dashed line indicates the 1:1 relationship.
Diversity 15 00459 g002
Figure 3. Relationships between the difference in (a) δ15N (Δ15N = δ15Nfor − δ15Ndry) or (b) δ13C (Δ13C = δ13Cfor − δ13Cdry) and the relative change in C:N ratio between formalin-preserved and dried zooplankton samples ([C:Ndry − C:Nfor]/C:Ndry). The significant ordinary least squares regression line for Δ13C is indicated by red line and the corresponding 95% confidence limits in blue.
Diversity 15 00459 g003
Figure 4. Partial effects plots obtained from fitting a GAM to (ad) δ15Ndry or (eh) δ13Cdry data. Shown are the effects for (a,e) formalin, (b,f) copepod contribution to total biomass (%), (c,g) seasonality (day of the year), and (d,h) storage time in formalin. Significant (non-significant) trends are indicated by continuous (dashed) lines. Bands indicate 95% confidence intervals and the rugs along the x-axes display the distribution of the data.
Diversity 15 00459 g004
Figure 5. Box plot of the offset in (a) δ15N or (b) δ13C between measured values in dried samples and values estimated by ordinary least squares regression (OLS), the relative shift in C:N ratio (C:N shift), subtraction of the mean difference between formalin-preserved and dried samples (difference), or by generalised additive models (GAM). Box: 25 and 75% quartiles; whiskers: 1.5× the interquartile range; horizontal line: median. The values of the Student’s t statistic (t) and the significance (p) of differences between the mean offset and zero were indicated in each case.
Diversity 15 00459 g005
Table 1. Parameters of the different regression models relating values measured in dry and formalin-preserved aliquots of zooplankton samples. The subindex dry or for indicates if dry or formalin-preserved aliquots were used, respectively. Δ15N = δ15Nfor − δ15Ndry; Δ13C = δ13Cfor − δ13Cdry. Regressions are of the form: y = a + b · x; x: independent variable; y: dependent variable; a: constant, b: slope; r: correlation; r2: coefficient of determination; p: significance value; sea, seb: standard error of the a or b estimates, respectively. The number of data pairs was n = 87 for all models.
xyaseabsebrr2p
δ15Ndryδ15Nfor5.0750.4630.2720.0670.4040.1640.000
δ13Cdryδ13Cfor−16.5751.3960.2630.0750.3550.1260.001
C:NdryC:Nfor----------------0.1680.0280.121
Δ15N(C:Ndry − C:Nfor)/C:Ndry----------------0.0690.0050.528
Δ13C(C:Ndry − C:Nfor)/C:Ndry−2.4430.1843.2160.7800.4080.1670.000
Table 2. Results of the generalised additive models (GAMs) fitted to the isotope measures. SE: standard error; EDF: estimated degrees of freedom; p: significance.; N: number of data; r2adj: adjusted determination coefficient.
IsotopeParameterEstimate (±SE)EDFt-ValueF-Valuep
δ15NdryIntercept6.85 (±0.11) 64.91 <0.001
N = 87δ15Nfor 1.00 20.76<0.001
r2adj = 0.27Copepod biomass 1.08 0.100.779
Day of the Year 2.10 3.400.001
Storage time 1.00 0.200.659
δ13CdryIntercept−18.52 (±0.14) −133.90 <0.001
N = 87δ13Cfor 1.81 7.810.003
r2adj = 0.20Copepod biomass 1.69 1.900.108
Day of the Year 0.00 0.000.746
Storage time 1.00 4.040.048
Table 3. Values (‰) of the interquartile range (25–75% quartiles) and the 95% confidence interval of the mean offset between estimated and observed values in dry zooplankton samples using different types of correction models. OLS: ordinary least squares regression; difference: mean difference between formalin and dry sample values; GAM: generalised additive models; C:N shift: regression between difference values and the relative change in C:N caused by formalin.
VariableType of CorrectionInterquartile Range95% Interval
δ15NOLS3.871.12
difference1.520.47
GAM1.430.41
δ13COLS4.211.32
C:N shift1.990.59
difference1.850.58
GAM1.800.50
Disclaimer/Publisher’s Note: The statements, opinions and data contained in all publications are solely those of the individual author(s) and contributor(s) and not of MDPI and/or the editor(s). MDPI and/or the editor(s) disclaim responsibility for any injury to people or property resulting from any ideas, methods, instructions or products referred to in the content.

