Article

Effects of Organic Enrichment on Bioturbation Attributes: How Does the Macrofauna Community Respond in Two Different Sedimentary Impacted Areas?

1
National Institute of Oceanography and Applied Geophysics-OGS, Via A. Piccard, 54, 34151 Trieste, Italy
2
Department of Life Sciences, University of Trieste, Via A. Valerio, 4/1, 34127 Trieste, Italy
*
Author to whom correspondence should be addressed.
Diversity 2023, 15(3), 449; https://doi.org/10.3390/d15030449
Submission received: 22 January 2023 / Revised: 27 February 2023 / Accepted: 14 March 2023 / Published: 17 March 2023
(This article belongs to the Special Issue Ecology and Biogeography of Marine Benthos)

Abstract

:
We assessed the influence of different organic matter (OM) inputs associated with terrigenous/freshwater allochthonous and sewage derive on bioturbation and irrigation potential community indices (BPc and IPc) of the soft-bottom macrofauna community. The macrofauna was sampled from two different sedimentary impacted areas, in front of the Po River Delta (northern Adriatic Sea) and sewage discharge diffusion zone (Gulf of Trieste). The highest values of BPc and IPc were observed at the northward sampling stations of the prodelta and the stations 25 m distance in front of the main sewage outfall. Species richness showed high values in the prodelta likely due to the OM positive effect from the delta, and it increased with increasing distance from the pipeline due to the effect of OM from the sewage discharge. The bioturbation indices differed due to the presence of surface deposit feeders and the injection depth (from 2 to 5 cm) with limited movement at the station located northwards in the prodelta and 25 m distance in the diffusion zone. We infer that the difference in bioturbation indices was likely due to the effects of grain-size composition and the degree of organic enrichment in both study areas.

1. Introduction

Macrofauna organisms are considered a key biological component due to high biomass and biodiversity [1], further, most of them are sessile and play a critical role in cycling nutrients, oxygenation of deeper sediment layers, and sediment reworking. They show marked responses to environmental changes depending on their species-specific sensitivity/tolerance levels [2,3,4]. Biogenic activities such as bioturbation and bio-irrigation by benthic organisms are fundamental due to not only to mixing the substrate as sediment particle preservation and sediment reworking (i.e., burrow and mound construction, particle ingestion, food caching, prey excavation, etc., as bioturbation activities), but also burrow-dwelling can ventilate the sediments, creating a rapid exchange of water between the overlying water and subsurface sediment (i.e., bio-irrigation activities), which relates directly to species activities; food availability and geochemical composition within the substrate are all affected [5,6,7]. These fundamental processes also affect sediment turnover, diffusive and advective processes that transport elements in dissolved and particulate among sediments [8,9], and consequently, have implications for ecosystem-related functions [10,11,12].
The coastal marine ecosystems are subjected to several impacts from natural to anthropogenic origins, which depose huge amounts of organic matter (OM). The major natural point of OM sources are rivers which largely contribute to accumulating allochthonous OM in the area interested by their plumes [13,14]. Besides, the human impacts and growing urban development of coastal areas entail increased anthropogenic pressures such as domestic and municipal wastewater disposal into marine environments. Sewage-derived materials present a widespread environmental problem in coastal waters which often release a high amount of OM into shallow subtidal habitats [15,16] and contain organic contaminants, fecal sterols, heavy metals, bacteria, nutrients, and large amounts of suspended and particulate organic matter [17].
The coastal sediments act as a sink for the accumulation of allochthonous-OM [18]. Despite this, some studies have documented the importance of allochthonous, terrestrial/riverine resource supply for marine communities, e.g., [19,20]. However, a high amount of allochthonous OM could cause the most pervasive threat to the diversity, structure, and functioning of marine coastal ecosystems [21,22,23].
Macrofauna communities adapt to environmental disturbances, and the anthropogenic impact factors have to be measured against the background of natural forces; an anthropogenic factor can be detected if its impact exceeds the intensity and frequency of natural physical disturbance [24]. Detrimental effects of sewage discharge are evidenced [25,26], but it is challenging to disentangle and quantify the relative importance of anthropogenic and natural organic matter in environments with competing activities, permanent alterations, and persistent usage [27,28]. Community responses to anthropogenic disturbances are rarely compared to natural disturbance patterns. Such comparisons increase our ability to predict the responses of organisms to future disturbances and help place human activity in a more realistic perspective of natural history [29]. Hence, biogenic activities such as bioturbation and bioirrigation can diminish the possible negative effects of organic contaminants in the sediment, if contamination does not reach high levels causing partial or total defaunation [8,30]. However, in some cases, these can be influenced by the different amounts of OM and its allochthonous origin [31].
Generally, the degree of bioturbation increases with decreasing subaerial exposure time of a deposit. The strength of this association can vary greatly at a local scale and is determined by the organism, the consistency of the substrate, and grain size [32]. Many of the environmental stresses affecting organisms within shallow subtidal to supratidal environments vary as a function of grain size [33]. In fact, the lability of OM affects the exchange rate of dissolved compounds between the sediment and water column [34]. Muddy sediments generally have more reduced conditions than sandy sediments, which affect the mineralization rates of OM in the sediments, and therefore, their metabolic capacity [35].
Bioturbation has been quantified by a series of modeled simulations and calculated with metrics from benthic quantitative data, such as bioturbation potential community-BPc [36] and irrigation potential community-IPc [37] calculations. Bioturbation potential calculations are linked to the adoption of a trait-based approach and can be quantitatively estimated from benthic quantitative data using the metric of bioturbation indices (BPc and IPc) and it is useful when trying to categorize and understand ecosystem functions conducted by benthic communities [12,36,37].
The consequences of environmentally driven changes in biodiversity to BPc, and its relation to ecosystem functioning, have been explored in terrestrial [38], marine habitats [36,39], local scales [40,41], regional scales [12,42,43], for different contexts [42,44,45]; for a variety of ecosystem functions including productivity [43], nutrient cycling [36], carbon storage [40,43], and decomposition of plant pigments in surface sediments [46].
Besides, another important feature is the sediment irrigation derived from animals that affect the different biogeochemical processes on the seafloor. Bio-irrigation is mainly caused by burrow-dwelling organisms that can ventilate the sediments, creating a fast water interchange between the overlying water and subsurface sediments [31,47]. The latter process is mostly induced by suspension deposit-feeding activities and ventilation rates of benthic organisms [48]. Accordingly, bio-irrigation is predominantly related to body mass and feeding type [49]. Ref. [37] modified the BPc index suggested by [36] into community irrigation potential (IPc), as a new index, whereas in the bioturbation potential calculation-BPc, the mobility trait presumably underrates the contribution of sessile organisms with low mobility rate but high bio-irrigation efficiency. In this context, [37] tried to replace the reworking and mobility traits with the feeding types, burrow, and depth pocket injection of burrows (as bio-irrigation functional characteristics).
So far, the BPc index has been usefully applied in many marine studies and by calculating BPc over time, or for different locations or scenarios, changes in the efficiency of the organism-sediment couple can be monitored for compliance in support of management and policy objectives [50,51]; the new IPc index has been less adopted in ecological surveys [31,52].
The environmental effects of OM enrichment depend on origin-specific conditions including the prevailing physicochemical and biological features of the receiving environment [53,54]. The results presented in this study will help to understand the relationship between macrofauna invertebrates and their bioturbation processes and the spatial distribution of OM with two different origins (natural and anthropogenic), which has been poorly investigated, especially in coastal marine environments. In addition, they will provide how macrofauna bioturbation attributes can play a key role in protecting and managing marine coastal areas. Therefore, we provide the different biological responses of macrofauna community to perturbation impact by evaluating changes in the metric of bioturbation indices (BPc and IPc) caused by natural and anthropogenic organic enrichment in two different areas. We focused on the Po River Delta (northern Adriatic Sea) and Servola pipelines (Gulf of Trieste, northern Adriatic Sea).
Specifically, this study aims to investigate the effects of organic enrichment by natural and anthropogenic impacts on the macrofauna community by applying bioturbation and bio-irrigation indices (BPc and IPc) in two different impacted areas. We hypothesized that the macrofauna community, inhabiting the coastal area in front of the Po River Delta and nearby sewage outfalls, respond differently in terms of bioturbation attributed to uneven amounts of OM. We aimed to answer the following specific questions: (1) Does the structure of the benthic macrofauna community affect bioturbation processes in different sedimentary environments? (2) Do macrofauna bioturbation attributes show spatial variability associated with different OM inputs of terrigenous/freshwater allochthonous and sewage-derived materials? (3) Are the bioturbation attribute patterns driven by specific sediment physicochemical parameters?

2. Material and Methods
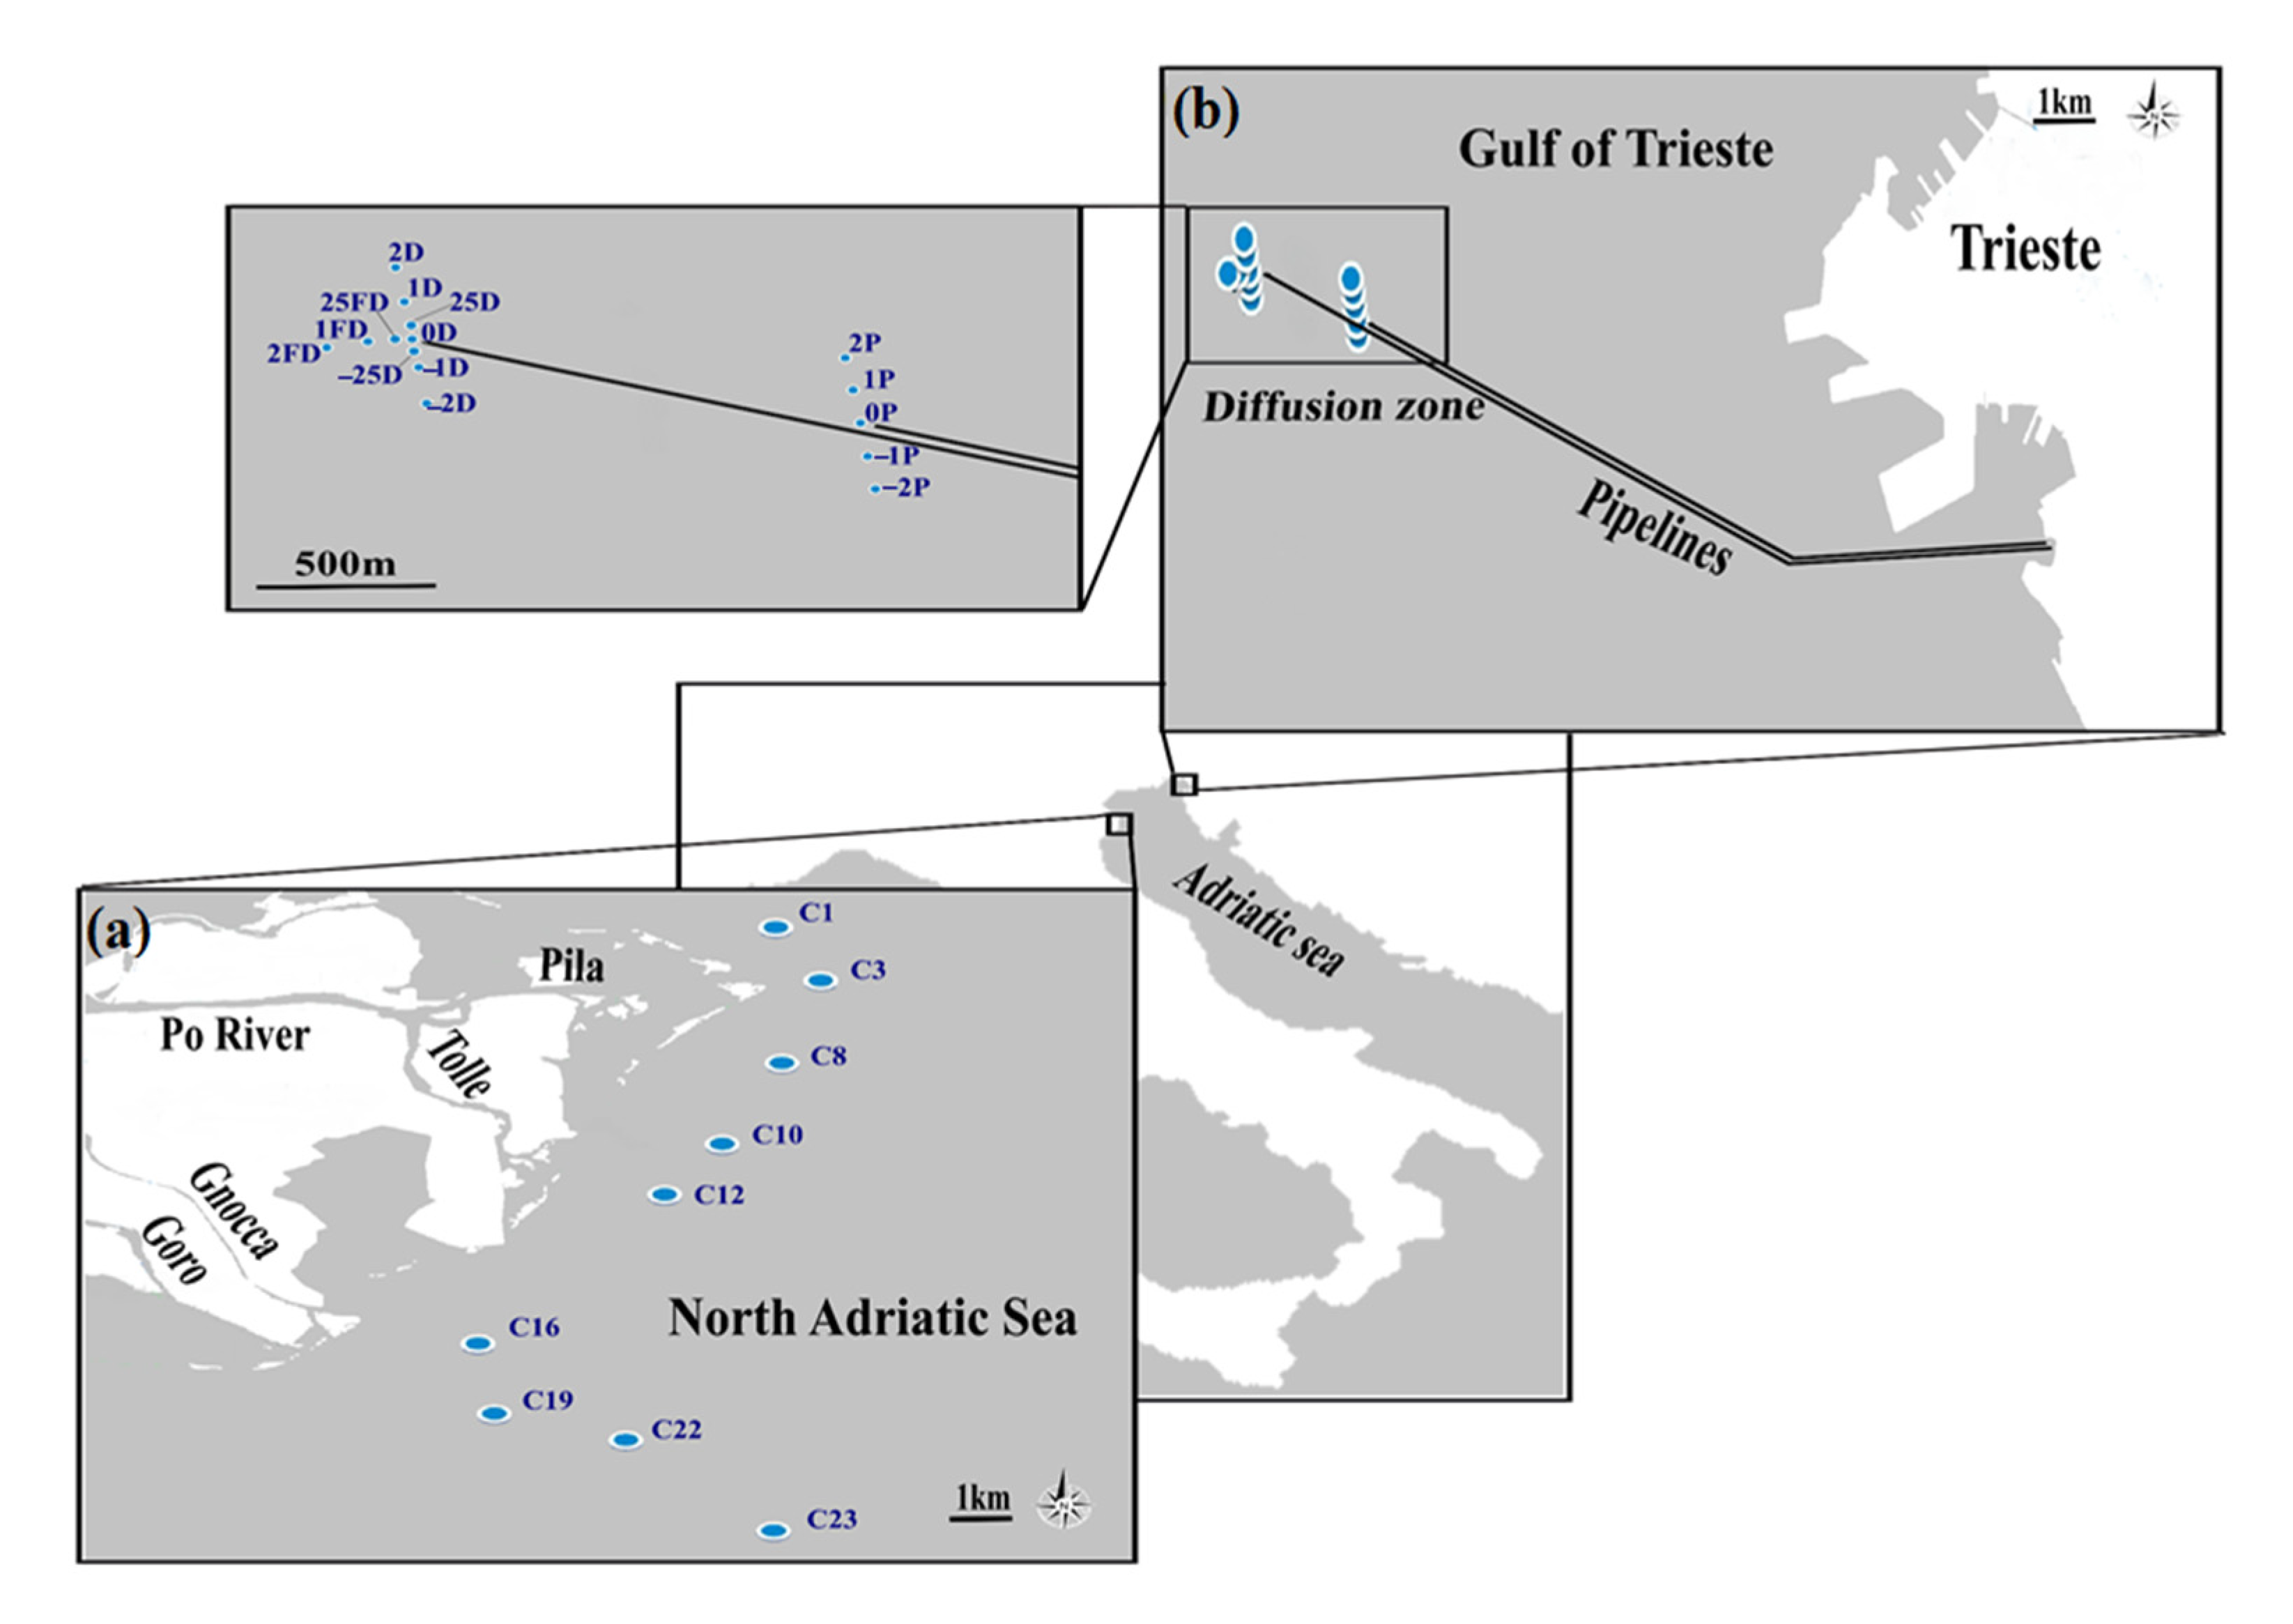
2.1. Study Area

The study was performed in coastal areas located in the northern Adriatic Sea subjected to a high amount of organic enrichment from natural (Po River Delta) and anthropogenic origins (sewage discharges in the Gulf of Trieste) (Figure 1 and Table S1).
Among European transitional systems, the Po River Delta is considered the major one, which is characterized by multiple physical-chemical and biological processes favoring natural organic enrichment and sedimentation [55], and wide seasonal, daily variability in chemical-physical parameters and fluvial inputs [56]. The Po River, with a drainage basin of 71,000 km2 and a length of 673 km, is the most important river in Italy and one of the largest in Europe. It extends over 685 km2 and most of the drainage basin runs through a wide low-gradient alluvial plain, with seven river branches, several lagoons, and wetlands [57], it is characterized by two annual floods (>5000 m3 s−1) associated with rainfall in autumn and snowmelt in spring [58]. Its total discharge is not equally distributed along the coast of the delta, where only 20% flows into the northern coast, 30% to the Pila tip (then driven southward by coastal currents), and the remaining 50% into the southern coast. During normal flow conditions, transported fine-grained sediments undergo a relatively rapid deposition nearby the mouths (~6 cm year −1 near the Pila distributary; [57]). Conversely, during flood events, these particles may cover a wide distance before reaching the sea bottom. The plume is principally transported southward along the shelf due to the predominant cyclonic Western Adriatic Coastal Current–WAC (driven chiefly by the pressure gradient established between interior dense water and coastal freshwater set up by the Italian rivers), and it is subjected to wind-induced resuspension events promoted principally by the north-easterly Bora wind [59]. Furthermore, the latter tends to confine the plume along the Italian coastline [60], especially during winter when this katabatic wind is stronger; the south-easterly Scirocco drives riverine water northward [61].
The Gulf of Trieste is a shallow embayment of about 100 km coastline and vastness of about 600 km2, located in the northern Adriatic Sea (Italy) with an average depth of 17 m. Geographical, hydrological, and sedimentological features and the physical and chemical features of the Gulf were exhaustively described by [62,63,64]. The Gulf hosts the main sewage treatment plant of Trieste city which is carrying out organic enrichment from anthropogenic origin. The plant is located at the foot of the Servola hill, serving up to 200,000 inhabitants of Trieste with a maximum flow of 6000 L sec−1 [64,65]. In this plant, the wastewaters are subjected to a treatment of the physical-chemical type since 1992 (while for the sludge anaerobic digestion heated with the recovery of the biogas produced is used). The Servola sewage disposal plant is composed of two adjacent pipelines (6.5 and 7.5 km) leading to the sea at a depth of 20 to 23 m with 600 sewage diffusion towers and a length of dispersion zone of about 1.5 km (1 km longest and 0.5 km shortest pipe, respectively) [63,66] by type of mixture collected and treating both wastewaters and meteoric within 35 million m3 per year [16]. There is a greater flow of wastewater through pipe ends than through diffusion towers because fluid parts of wastewater only flow upward through diffusion towers due to the difference in density, which is distributed by currents throughout the area [64].

2.2. Sampling Design and Samples Processing

Sediments in front of the Po River delta were collected in December 2014 (after flood events; [14]); whereas the sampling nearby sewage outfalls (in the Gulf of Trieste) was performed in April 2018 before the improvement of sewage treatments; [16] in the spatial scales, in order to consider the best time to conduct sampling in both study areas which most probably contained the highest possible amounts of organic enrichment discharged (natural and anthropogenic) and could change the community structures to the highest possible degrees. Therefore, according to the seawater currents [14], nine sampling sites in the Po River prodelta area were located at increasing depths (between 9 and 21 m) and distance from the main distributary mouth (Po di Pila) along the southward river plume (Figure 1a, Table S1). In the Gulf of Trieste, to expose the best coverage of the whole diffusion area, as well as consider the seawater currents in the gulf and the largest amount of organic enrichment discharged from the main outfall [63], 15 stations were sampled following an increasing distance from the pipelines (<5, 100, and >200 m) for each outfall, the shortest pipe (‘proximal’ transect) and the longest and main one (‘distal’ transect). Additionally, in the ‘distal’ transect were sampling stations at 25 m from the duct (Figure 1b, Table S1).
In both areas, sediments were collected by a van Veen grab (0.1 m2). The macrofauna was collected in three replicates and sieved with a 1 mm mesh and the organisms were instantly fixed with ethanol (80%). In the laboratory, the organisms were separated from the sediment and identified into the lowest possible taxonomical level employing a stereomicroscope (Model; Zeiss Discovery V.12, 8–110× final magnification) and counted for each station separately, and species names were updated wherever needed.
Weight estimate (Wet Weight-WW) was measured for each taxon [64]. Subsequently, to obtain the Dry Weight (DW), samples were placed in an oven at 100 °C for 24 h, cooled in a lab desiccator to the normal temperature of the room, and then weighed. The organisms were heated to 500°C for 24 h in an oven and cooled in a lab desiccator to the room temperature to obtain their ash quantity, and then weighed. Ash weight was subtracted from DW to obtain Ash Free Dry Weight (AFDW) [67]. The environmental variables considered in this study (i.e., shells, sand, silt, clay, Total Organic Carbon-TOC, Total Nitrogen-TN, and carbon and nitrogen molar ratio-C:N) were determined in the same samples, which were thoroughly described by [31] for the Po River coastal area, whereas by [63] for the Gulf of Trieste.

2.3. Estimation of the Bioturbation Potential (BP) and Irrigation Potential (IP)

Community bioturbation potential (BPc) is a metric first described by [36], which combines abundance and biomass data with information about the life traits of individual species or taxonomic groups. This information describes modes of sediment reworking and mobility of taxa in a dataset, two traits known to regulate biological sediment mixing, a key component of bioturbation [39,68].
The bioturbation potential-BP [36] was computed according to the following equation:
BP c = i = 1 n   BP i ,   whereas   BP i = ( B i / A i )   0.5     A i     M i     R i
where Bi and Ai metrics are biomass AFDW in (gr m−2), and the number of individuals (m2), respectively. Mi and Ri are categorical scores of species that represent increasing mobility (Mi) and increasing sediment reworking (Ri). Community-level bioturbation potential (BPc) and individual taxa (BPi) were calculated across the whole sampling species. This study used the list of mobility (M) and reworking (R) scores from literature, i.e., [69,70] and expert knowledge [31,63,64,71] (Supplementary Table S2 provides the category of species scores for Mi and Ri).
The irrigation potential (IP) of [37] is defined by traits including burrow type (BTi), feeding type (FTi) and injection pocket depth (IDi) which are the irrigation behaviors of benthic macrofauna species and their effects on ecosystem functioning. The irrigation potential equation of each species taking into account the different sampled stations is given by:
IP c = i = 1 n     IP i ,   where   IP i = ( B i / A i )   0.75     A i     BT i     FT i     ID i  
The mean individual biomass of each species (i) is expressed by the ratio Bi/Ai, where Bi is the biomass of species (AFDW) grams per m2, while Ai is abundance per m2. As described by [37], the categorical trait demonstrates the species-specific occurrence of the relevant trait and is assigned by numerical scores. We considered a bit of modification for the categorical trait scores due to the lack of the sub-suspension/funnel habit in the sampling area and the prevailing occurrence of the deposit-feeding type. The categorical traits were adjusted by different scores considering deposit feeder type in surface and subsurface deposit feeder moods (Table S2 provides the categorical taxa scores for BTi, FTi and IDi). The data collection on BTi was obtained from previous studies [47,52,72]. We acquired the scores on FTi mood based on the literature, e.g., [73] and the databases (www.polytraits.lifewatchgreece.eu; www.marlin.ac.uk/biotic, accessed on 1 April 2020). Moreover, we implemented the information on IDi moods from the literature, e.g. [74,75,76]. If no information could be available for the categorical trait scores at the species level, a score was used from the next highest taxonomic rank or indicated as not available information (n.a. in Table S2) and deleted from the index calculation.

2.4. Statistical Analyses

Before all the analyses, data were explored and checked for normality and collinearity following Shapiro–Wilk’s and Spearman’s rank correlation coefficient, respectively [77]. The differences in species number (richness), BPc, IPc, and environmental factors among groups of stations in both study areas (for factors see the ‘transects’ namely in Table S1) were computed by Mann–Whitney U tests. A one-way PERMANOVA test was used to check for significant differences in BPi and IPi values for every single species among groups of stations in both study areas, where factors (reported in Table S1) were selected as fixed factors. When significant differences were noticed, PERMANOVA pairwise tests were performed. Unrestricted permutations of raw data and 9999 permutations were applied.
To observe any spatial patterns in bioturbation attribute values, a non-metric multidimensional scaling analysis (nMDS) was applied for two matrices (i.e., BPi and IPi, for both study areas, separately). The environmental variables (i.e., sand, silt, clay, TOC, and C:N) were overlaid as supplementary variables (vectors) onto ordination spaces to investigate their relations in this distribution.
In addition, we measured the relative frequencies of scores for the factors ‘north and south’ in the prodelta and ‘distance gradient’ in the diffusion zones in order to assess the variation in species scores in sampling areas.
Further, to indicate the significance covaried coherently on the BPi and IPi values, i in both study areas and Similarity Profiles (SIMPROF) analysis was applied. To detect which taxa were mainly responsible for bioturbation and irrigation activities (BPi and IPi data, respectively) at stations gathered into different transects in both study areas, SIMPER analysis was used and different factors (see Table S1) were determined. A cut-off at <70 % was applied.
Additionally, distance-based redundancy analysis (dbRDA) was used to detect the relationships between bioturbation indices (BPi and IPi values) and selected species by the SIMPER test and environmental variables. Before analysis, environmental data were normalized.
To highlight the spatial relationship between predictor variables (the considered environmental parameters) and response variables (BPc and IPc values and scores frequencies), linear regression and Spearman’s correlations were computed for each area separately. By doing so, the predictive power of environmental parameters for each bioturbation attribute was discriminated via the coefficient of determination rs (Spearman’s correlation) and R2 (linear regression).
For the multivariate analyses, the matrices BPi and IPi for sampling areas were square root, and the Bray–Curtis similarity was applied. The Mann–Whitney test was computed using STATISTICA 7 software and the multivariate analyses were performed using PRIMER 7 (PRIMER-E Ltd., Plymouth, UK) software.

3. Results

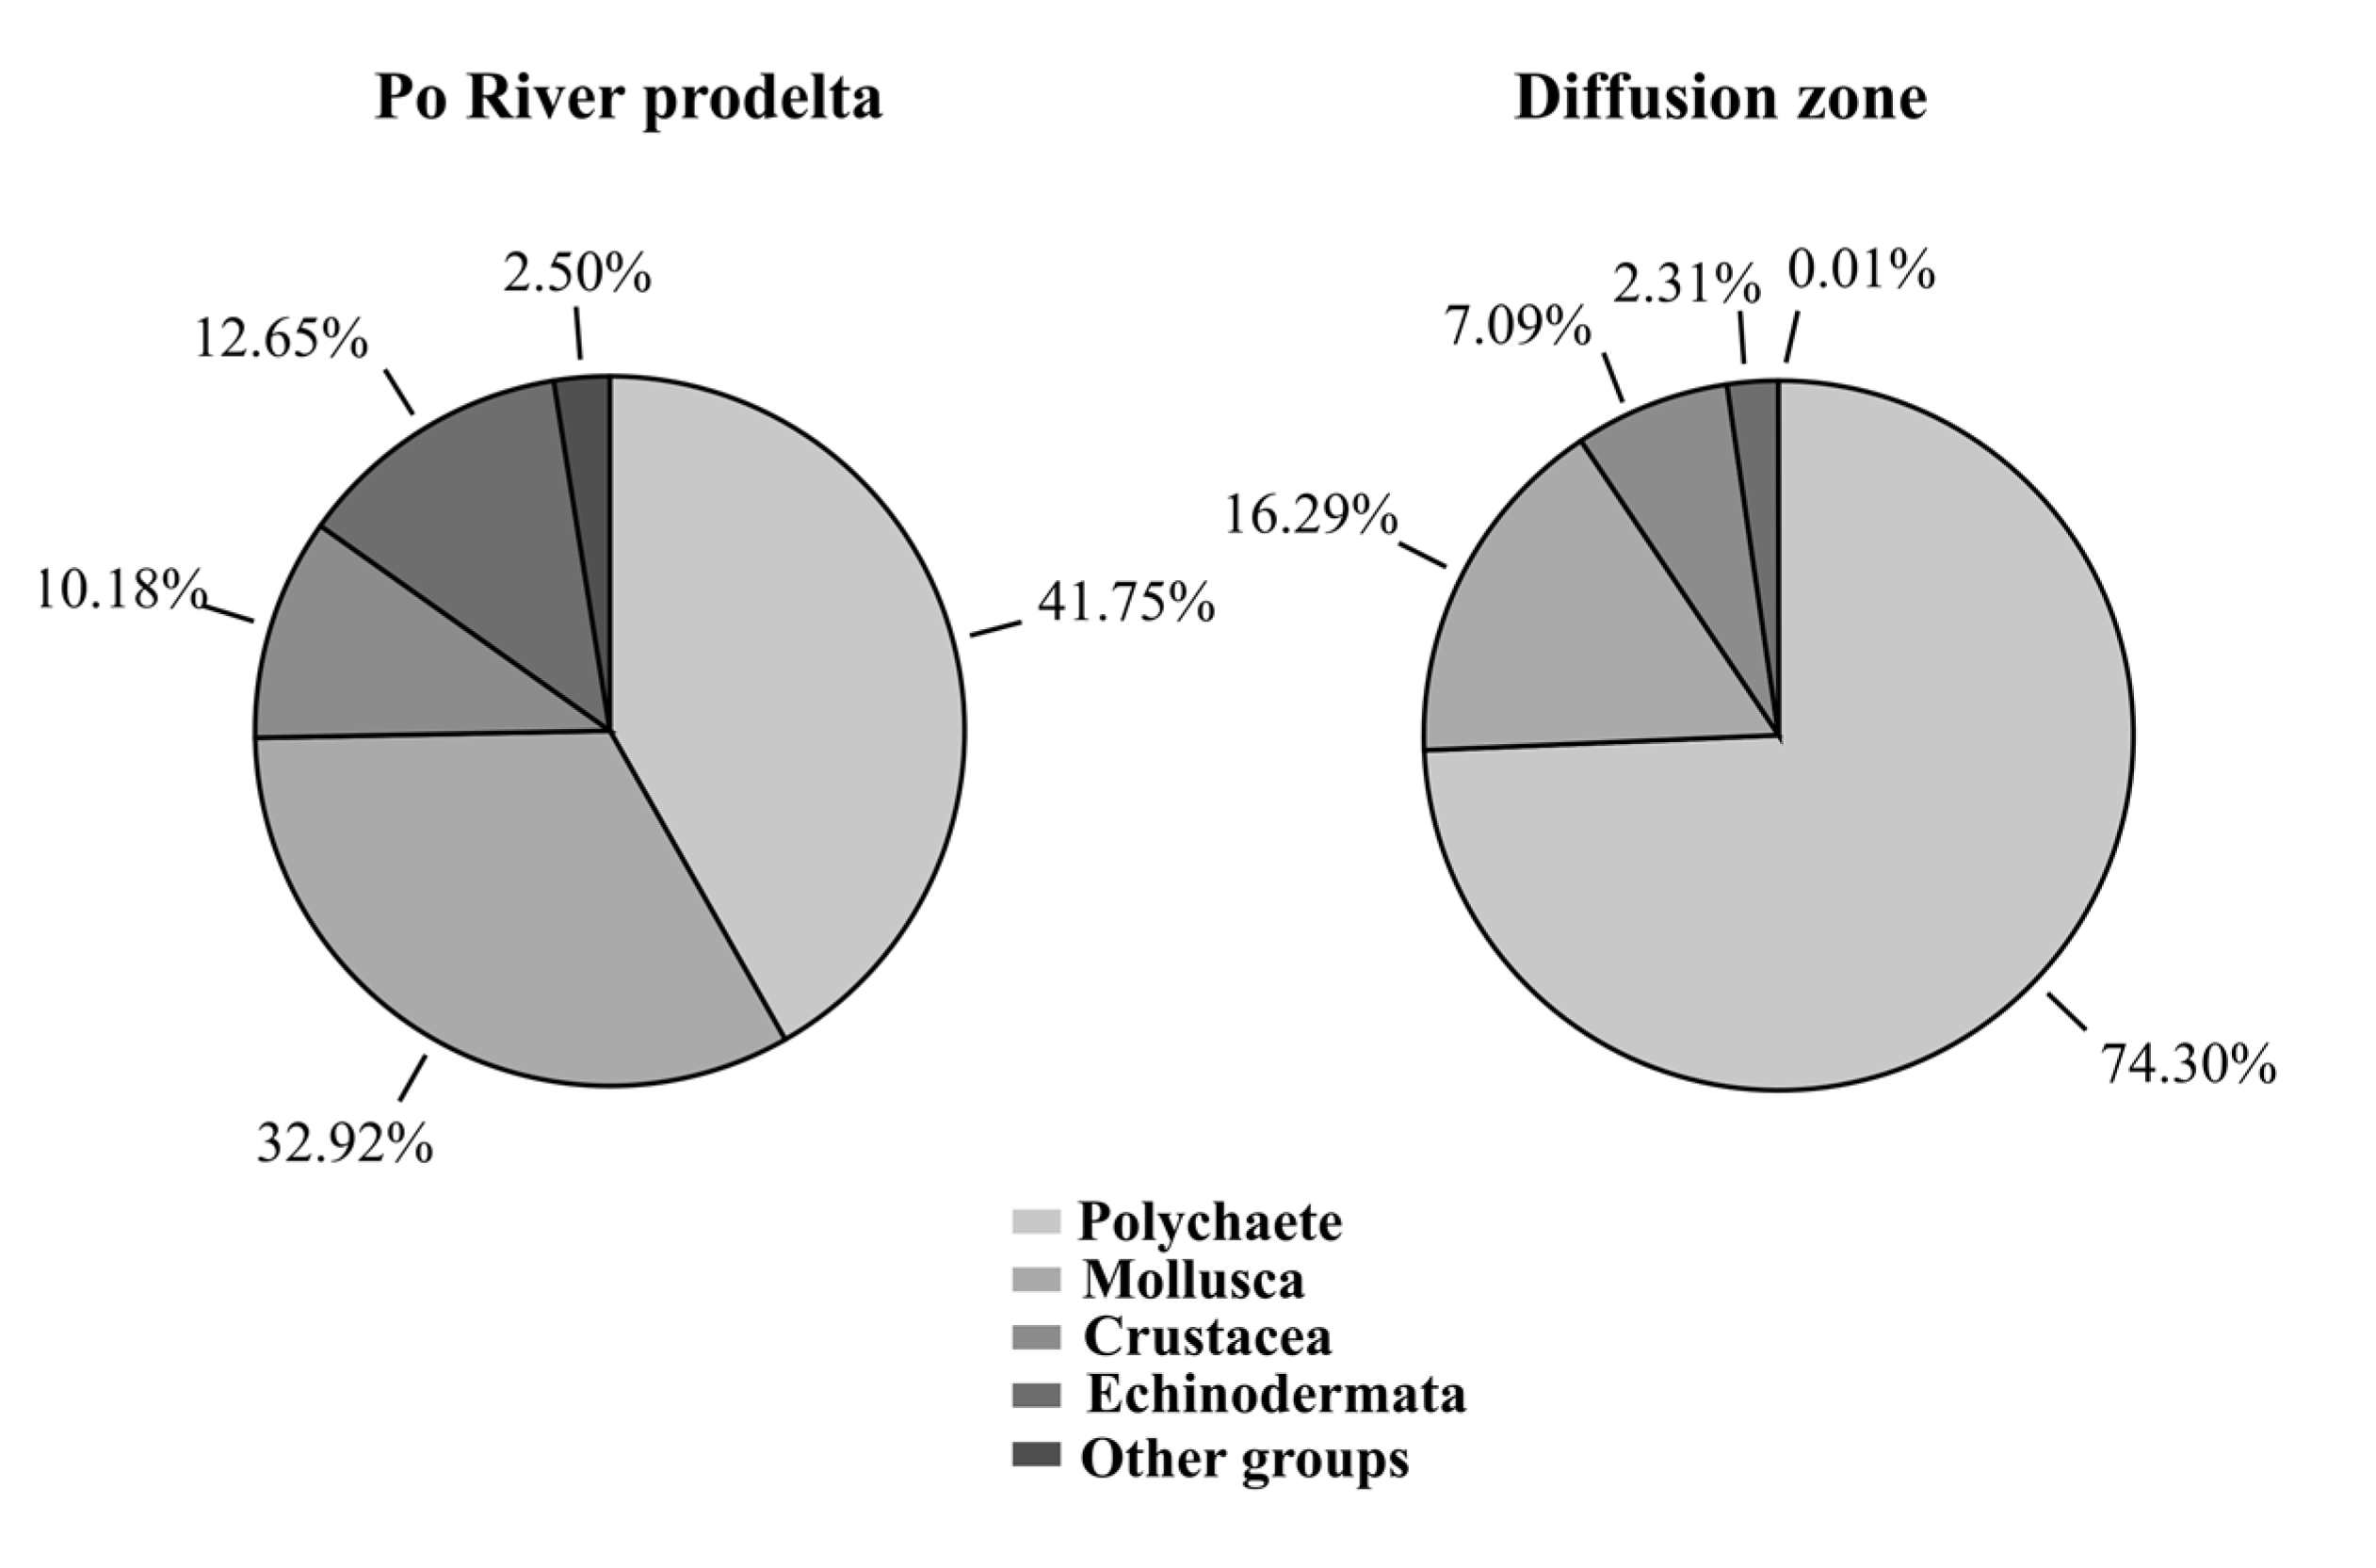
3.1. Taxonomic Composition of the Macrobenthic Community

In both study areas, the macrofauna abundance varied from 7.3 ± 1.4 ind. m−2 at C23 to 532.3 ± 62.0 ind. m−2 at C8 and ranged from 36.0 ± 0.6 ind. m−2 at 0P to 343.6 ± 9.0 ind. m−2 at -1D in the Po River delta and the Gulf of Trieste, respectively. Regarding biomass, the lowest value was observed at C12 (0.03 ± 0.0 g m−2), whereas at -25D the highest biomass was measured (2.6 ± 0.1 g m−2). Polychaetes were the dominant taxa (41.75%), mollusks (32.92%), crustaceans (10.18%), echinodermata (12.65%), and other groups (anthozoa and sipuncula together 2.50%) were found in the Po River prodelta, whereas polychaetes (74.30% of the total abundance) followed by mollusks (16.29%), crustaceans (7.09%), echinodermata (2.31%), and other groups (sipuncula = 0.01%) in the diffusion zone (Gulf of Trieste) (Figure 2). In both sampling areas, a total of 253 taxa were found. In the Po River delta, C23 had the lowest species number (six species) and C1 was the highest one (39 species), whereas, the species number showed the minimum value at 0D (35 species) and maximum value at the 2P (75 species), in the Gulf of Trieste (Figure 3).
Overall, in the diffusion zone area, significantly higher species numbers were recorded if compared to the Po River prodelta (U test, z = 3.8; p < 0.01) (Figure 3).

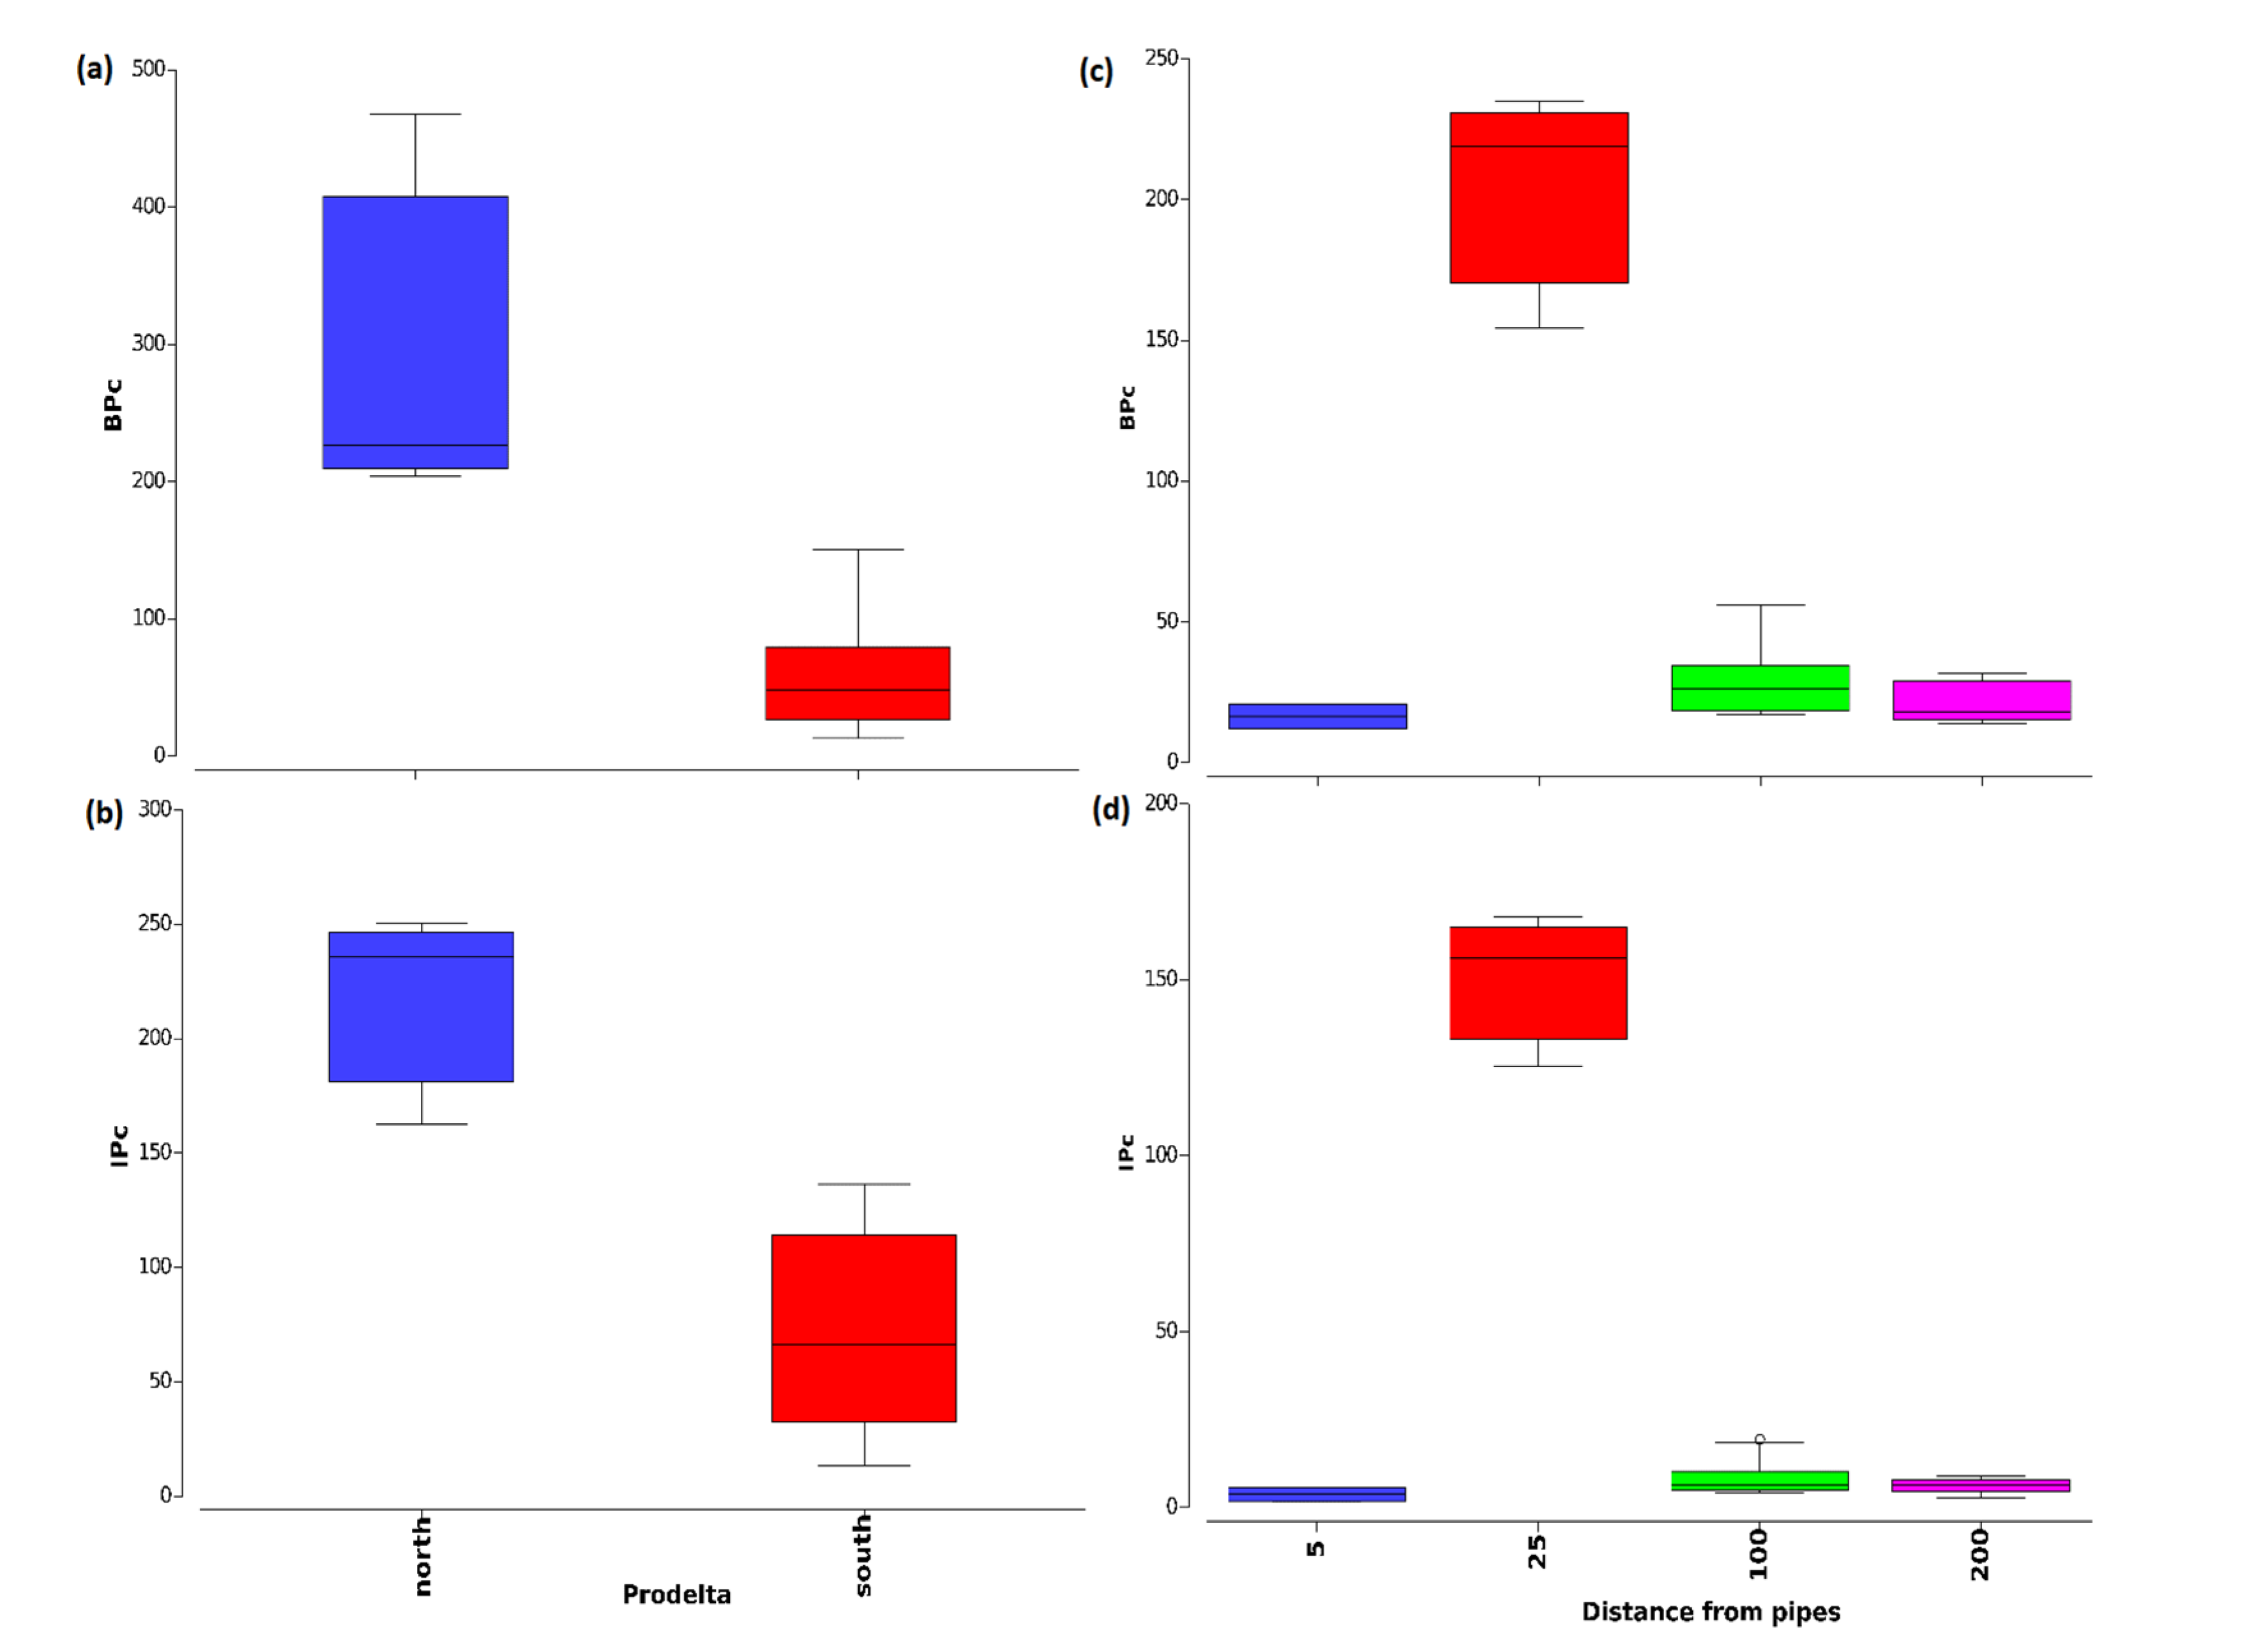
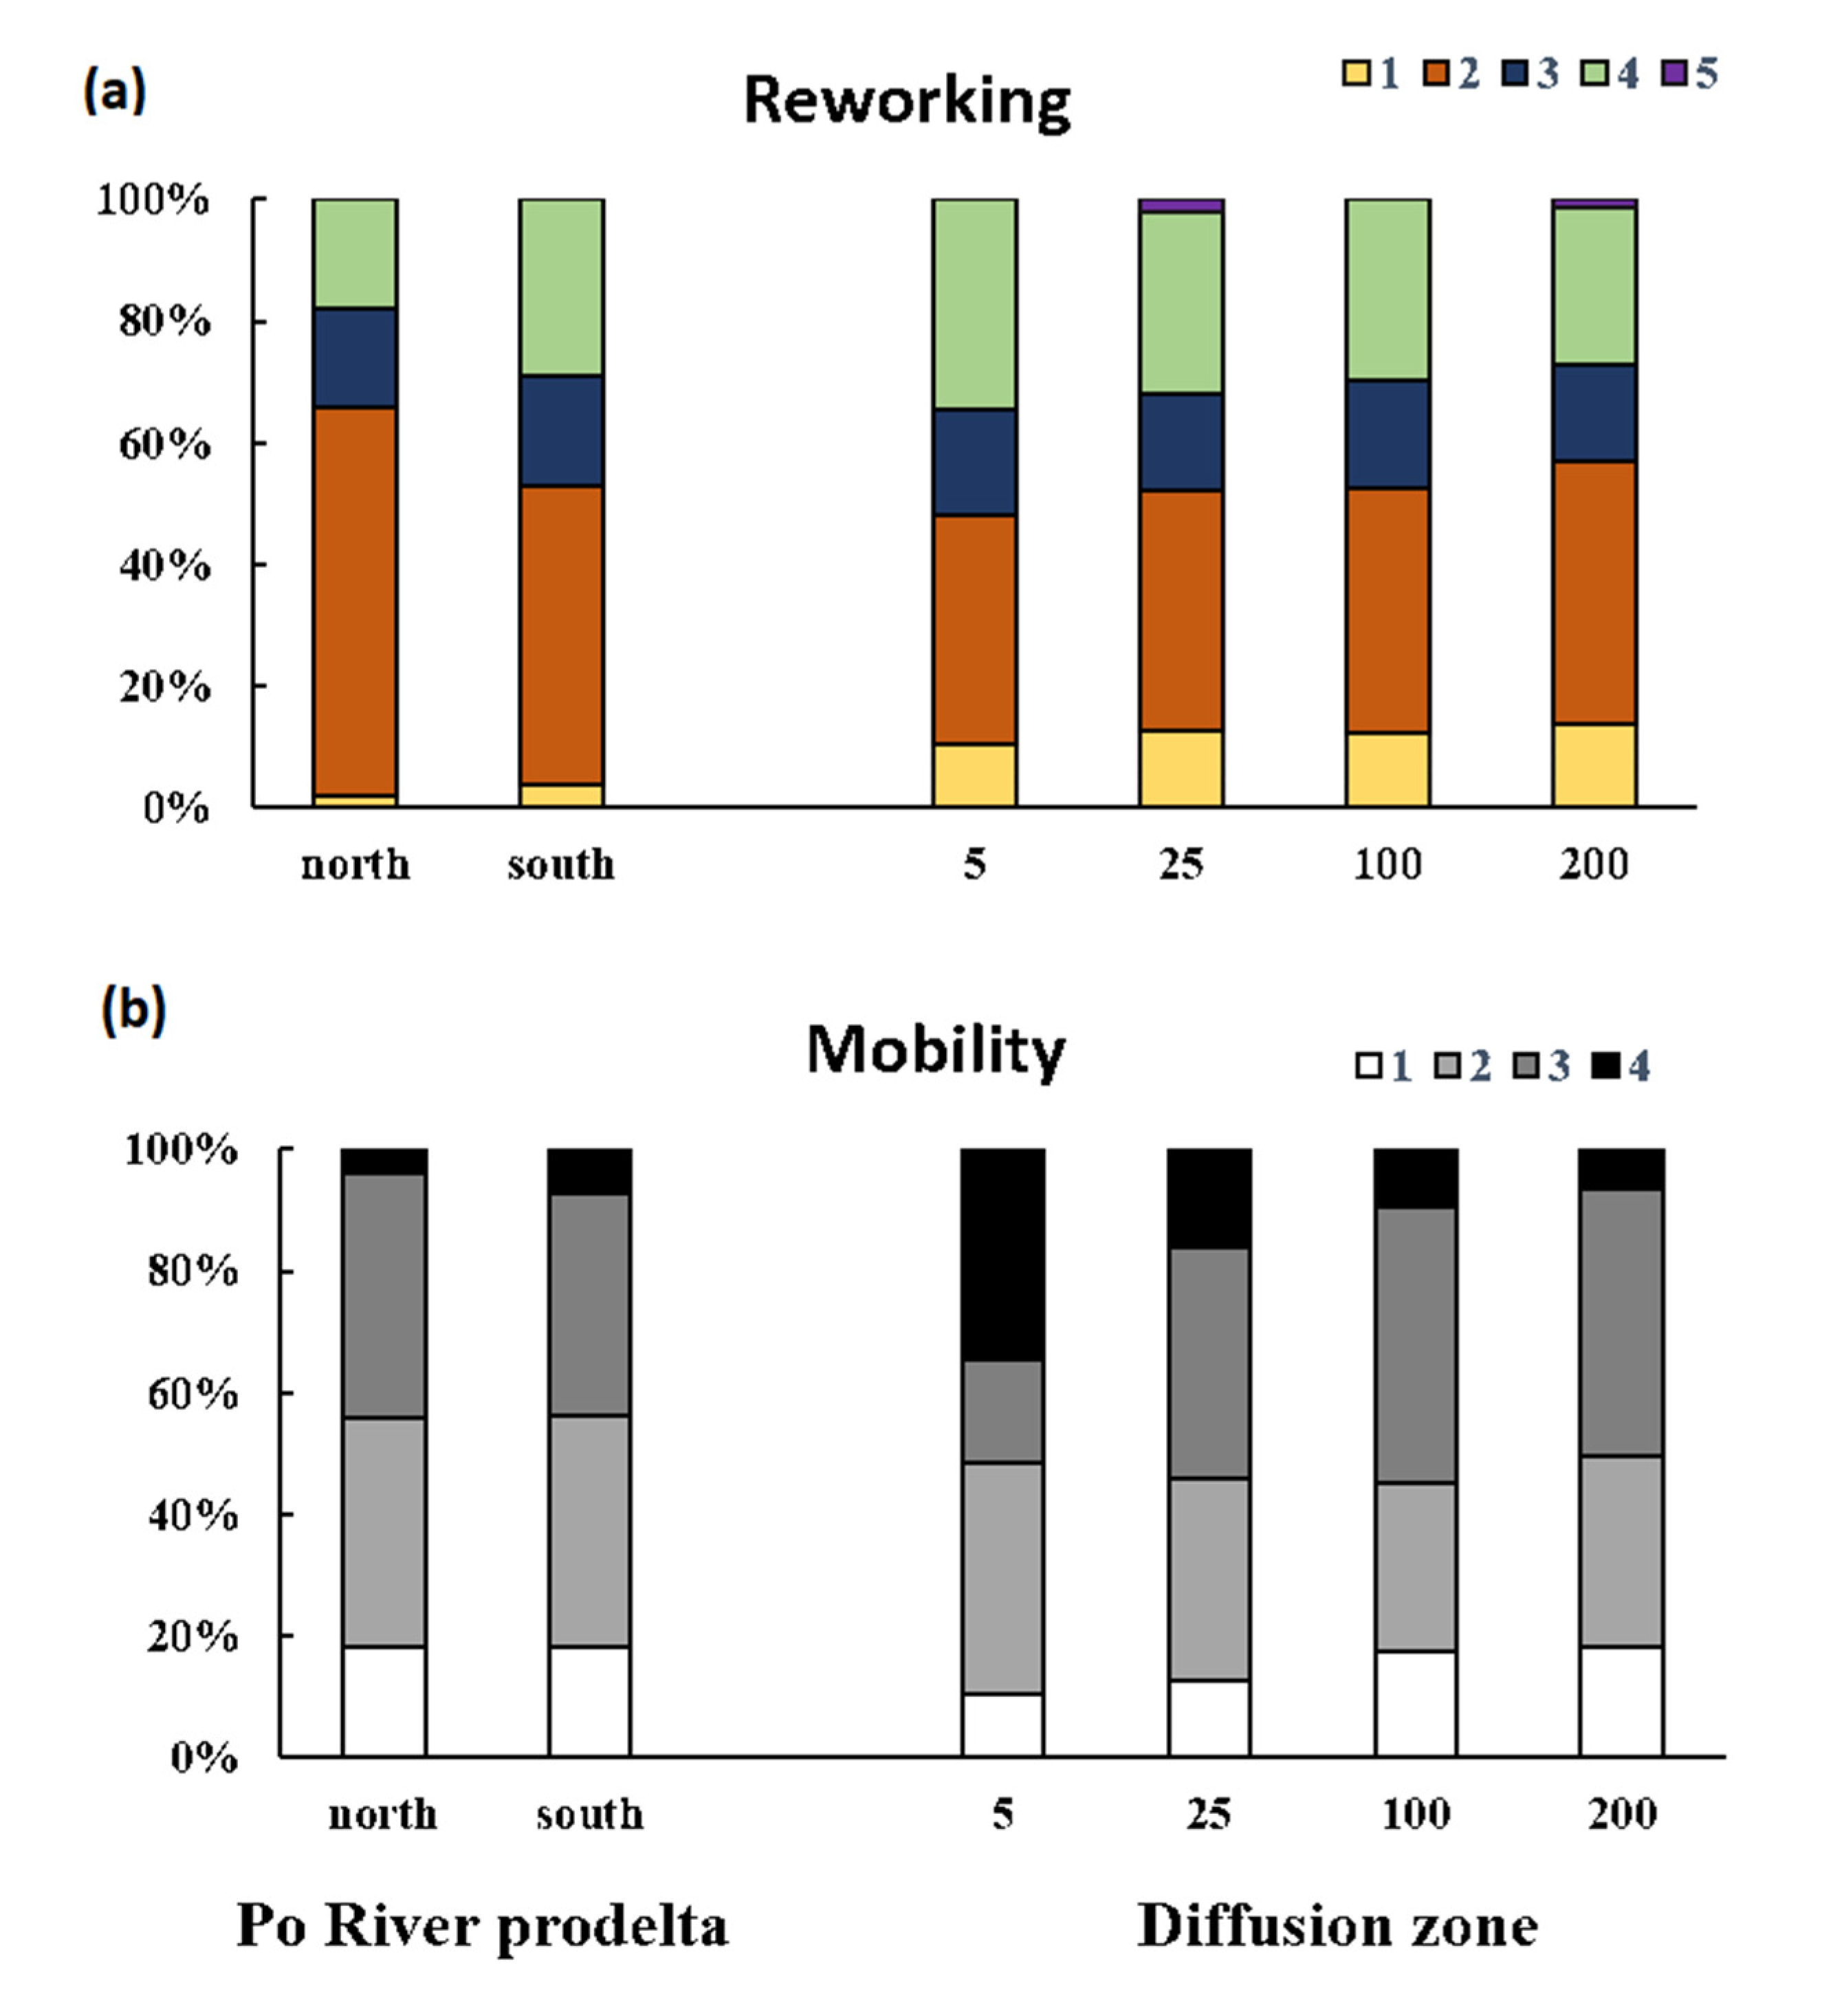
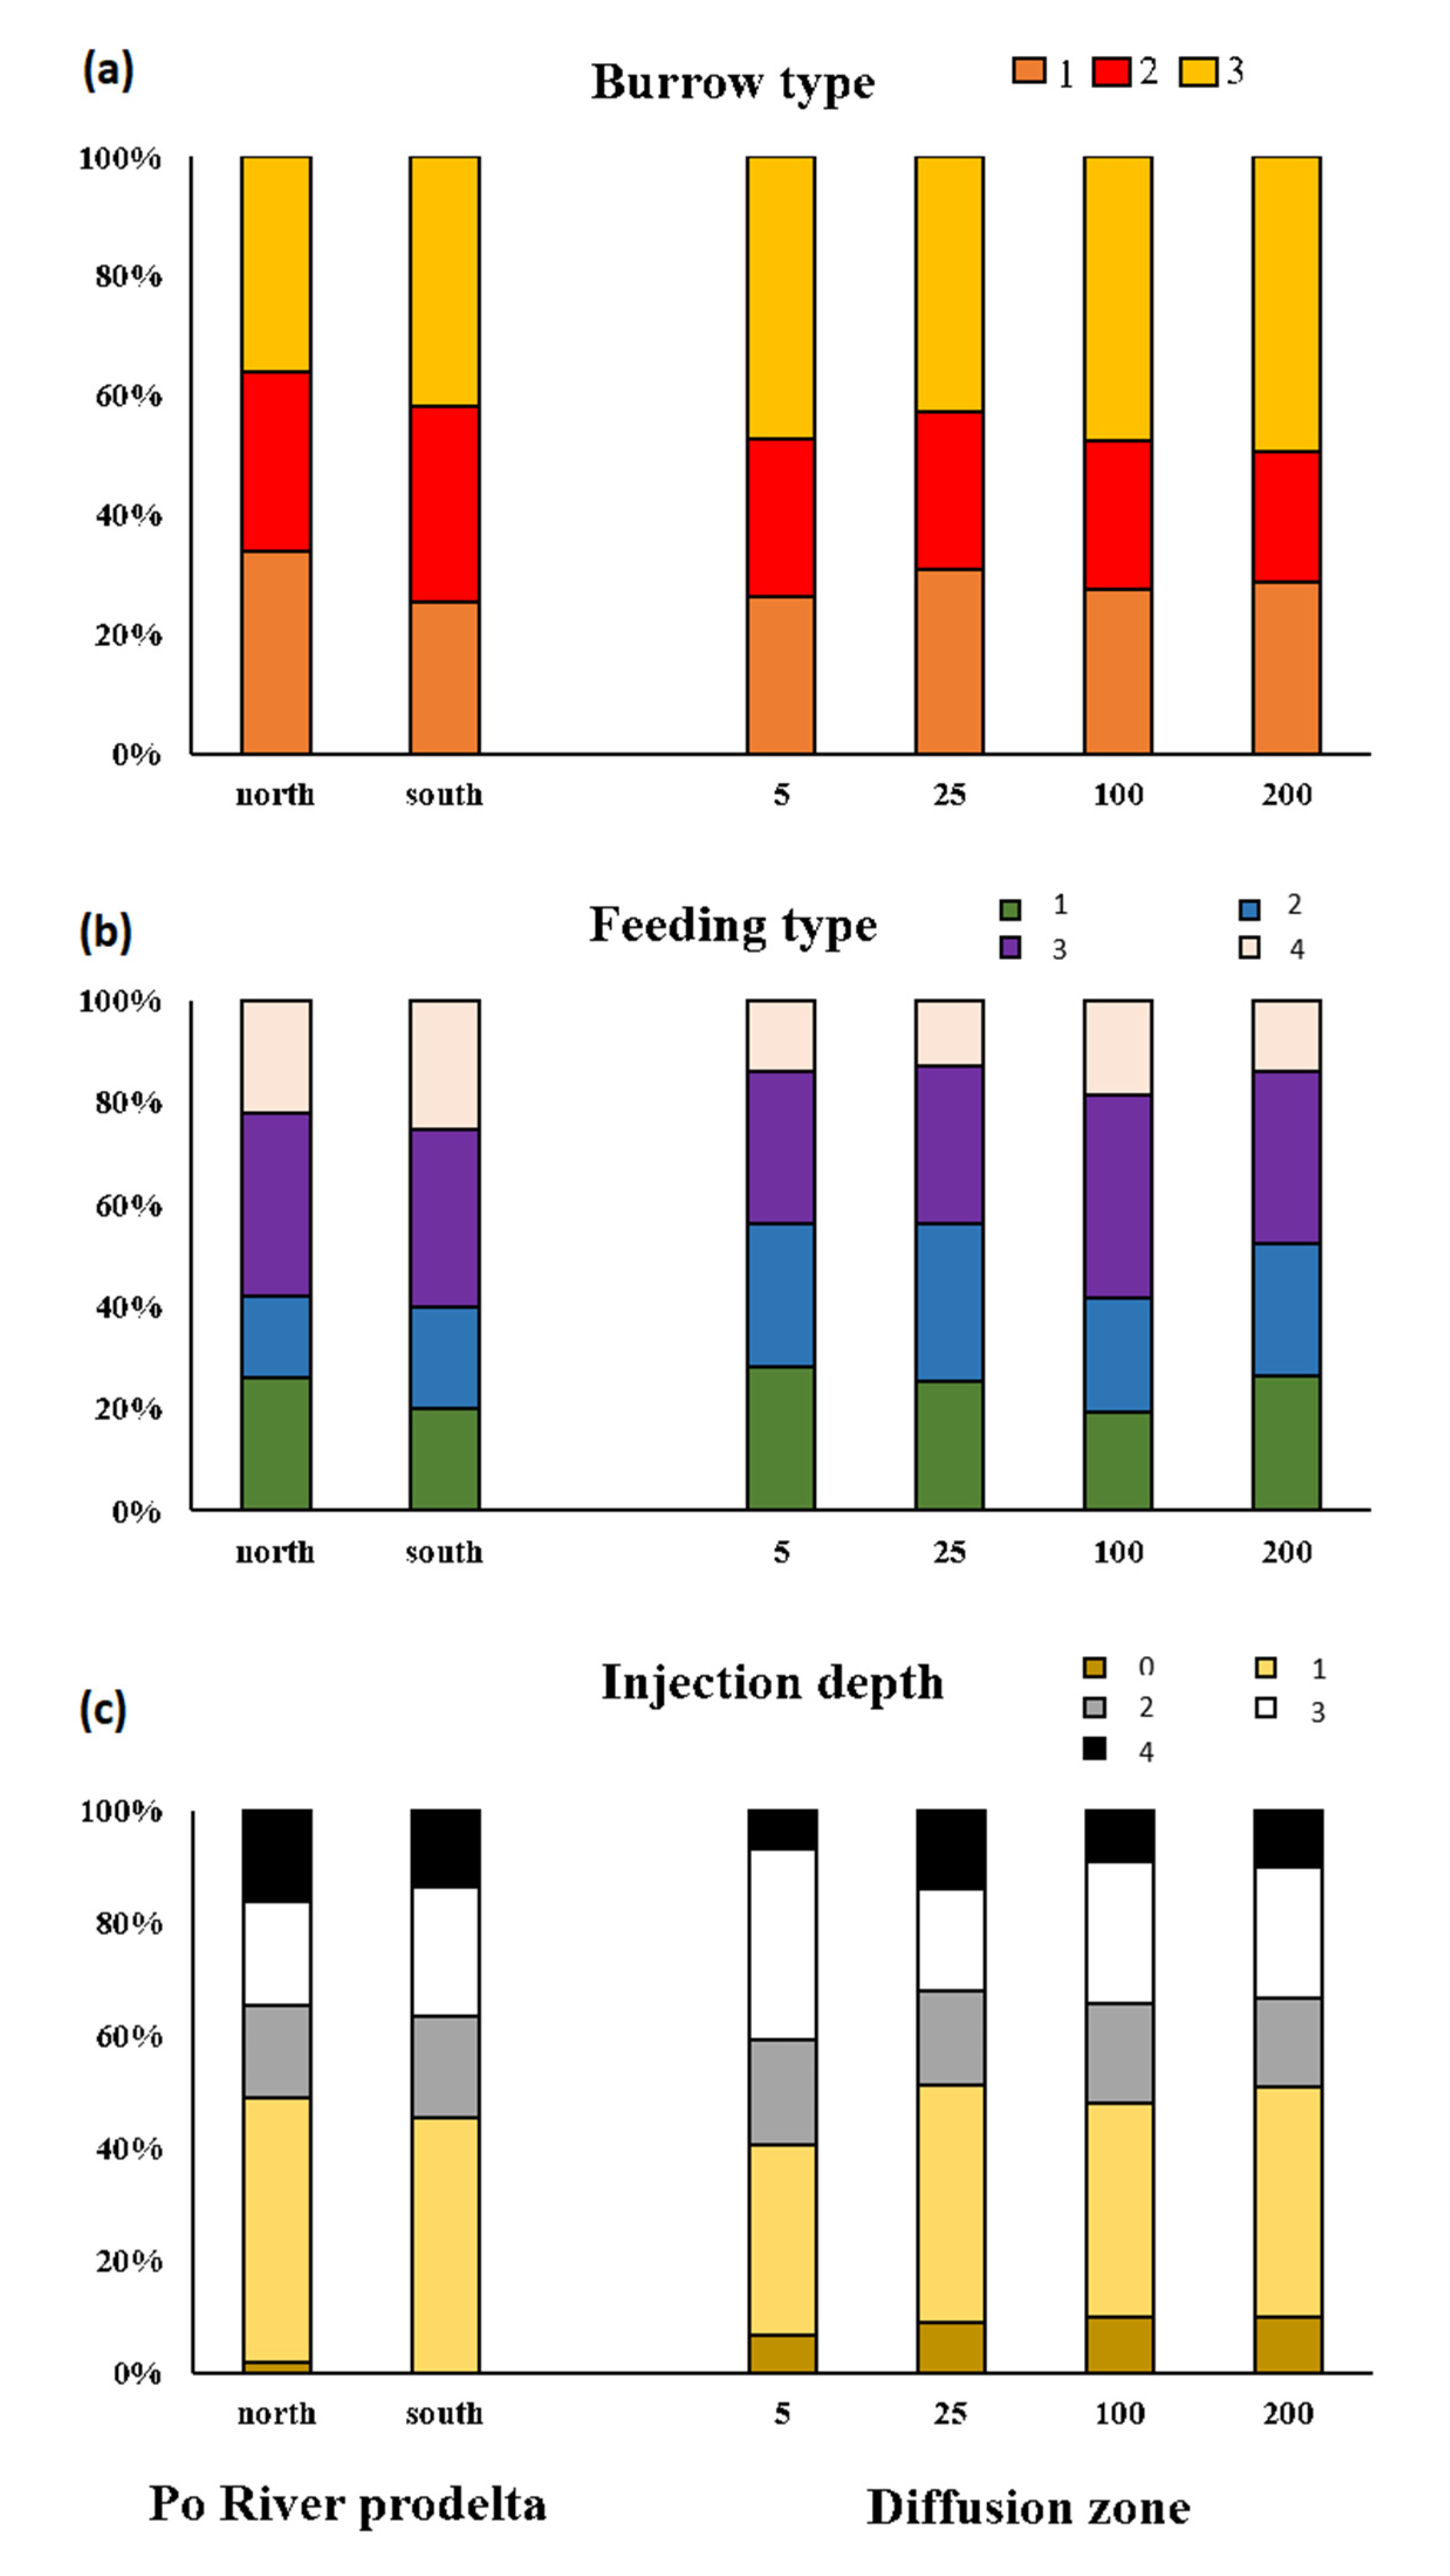
3.2. Macrofauna Bioturbation Attributes

The community bioturbation potential (BPc) values were lower at C12 (12.8) and 0P (11.8), while the highest ones were estimated at C8 (468.01) and 25D (234.8) in the Po River delta and the Gulf of Trieste, respectively. Similarly, the irrigation potential (IPc) showed lower values at C12 (13.2) and 0P (1.82), whereas this index was higher at C3 (250.0) and 25D (167.9) in the coastal area nearby the Po River mouth and pipelines, respectively. In addition, BPc and IPc did not follow variation patterns with species richness in both sampling areas (Figure 3). Overall, higher values of irrigation potential were noticed at the Po River prodelta if compared to the area nearby the pipelines, as corroborated by the U test (z = −2.9; p < 0.01). Further, higher values of the indices were noticed at the stations placed in the north part of the Po River (U test ‘north’ vs ‘south’: z = 2.3; p < 0.05) for BPc and IPc (Figure 4). In addition, significantly major values of BPc and IPc were measured at stations located 25 m from the sewage pipeline (H = 7.8; p < 0.05 for both indices). No differences were measured between stations gathered in ‘distal’ and ‘proximal’ transects for diffusion area (Figure 4).
The PERMANOVA tests on bioturbation attribute values (BPi and IPi) for every single species showed differences between both study areas. According to the PERMANOVA main test, a highly significant difference was observed at increasing distances from the main distributary mouth (Po di Pila) along the southward river plume (Pseudo-F = 2.5 and 2.6; p < 0.05 for BPi and IPi, respectively). Similarly, significant differences were noticed in bioturbation indices among stations placed at increasing distances from the pipes (Pseudo-F = 3.02 and 3.03; p < 0.01, respectively). In addition, the bioturbation indices of species significantly differed between stations gathered in ‘distal’ and ‘proximal’ transects (Pseudo-F = 2.0; p < 0.05 for BPi and IPi).
Additionally, SIMPER analysis performed on BPi and IPi values showed differences among the sampling stations in the Po River prodelta area and the Gulf of Trieste. For the first sampling area, the higher BPi values of the bivalve Striarca lactea (Contrib% = 7.4) and the polychaete Owenia fusiformis (Contrib% = 6.9) were responsible for the main difference from the stations placed on the northward part and southward of the Po River delta (north vs south: 77.8 %, average dissimilarity). Similarly, O. fusiformis mostly contributed to the dissimilarity between ‘north vs south’ (Contrib% = 11.8) due to high values of IPi at northern sites (average dissimilarity = 75.6). By SIMPER analysis on BPi and IPi values, the dissimilarity in the Gulf of Trieste between stations placed in <5 m and 25 m distance groups (<5 vs 25: 77.8 and 87.8 % average dissimilarity for BPi and IPi values, respectively) were mainly due to the high BPi and IPi values of the mollusk Polititapes aureus sampled at 25 m from the main pipe (Contribution% = 5.7 and 8.6, respectively). The dissimilarity between stations located in 25 and 100 m groups (25 vs 100: 77.1% and 84.9 average dissimilarity for BPi and IPi values, respectively) was mostly due to the high value of polychaetes Capitella capitata (25 m group), with contribution% = 5.65 and 8.35 for BPi and IPi values, respectively. SIMPER analysis showed the dissimilarity between stations placed at 25 vs >200 m (25 vs >200: 85.9 and 90.5%, average dissimilarity for BPi and IPi values, respectively) were characterized by polychaetes C. capitata that were highly present at 25 m station group with contribution 6.1 and 8.7% for BPi and IPi values, respectively.
Considering the relative frequencies (%) of scores belonging to the BPc values, it showed higher occurrences for reworking scores representing the superficial modifiers (64.0%) for the stations located in the northern and southern part of the prodelta (64.0 and 49.0%, respectively). In addition, towards the southern stations, a higher% of biodiffusers was calculated (29.0%). In the diffusion area, we measured slightly increasing percentages of ‘superficial modifiers’ score coupled with decreasing values of ‘biodiffusors’ from the stations located nearby the main outfall towards the farther ones (Figure 5a). Regarding the mobility scores (Figure 5b), in the coastal area of Po River, major values of relative frequencies of organisms with ‘limited movements’ were measured in northern stations compared to southern ones. In addition, in the Gulf of Trieste, we observed great changes in score % belonging to ‘movements through the sediment matrix’ and ‘free movements via ‘burrow types’. The latter was noticed with a higher value nearby the outfalls (34.5%) and remarkably decreased towards the stations far from the diffusion zone. On the contrary, we measured increasing values of ‘movements through ‘the sediment matrix’ and ‘organism that lives in fixed tubes’ scores at stations placed at 100 and >200 m from the main pipe.
According to the IPc values, relative frequencies (%) indicated the scores belonging to burrow type varied in the coastal area of prodelta. A higher % of ‘infauna with internal irrigation’ score in northern stations (34.0%), whereas the increasing value of the ‘blind-ended irrigation’ score (41.8%) was noticed at southern ones. A decreasing value of the ‘open irrigation’ score was observed moving away from the stations’ nearby diffusion zone towards the farther ones in the Gulf of Trieste (Figure 6a). ‘Surface deposit feeder’ and ‘injection depth from 2 to 5 cm’ were highly expressed northward and 25 m distance from the main outfall in the prodelta and Gulf of Trieste, respectively (Figure 6b,c). Lastly, the stations gathered in 25 m were characterized by a higher percentage of ‘depth over 10 cm’ score when compared with the later stations in both study areas.

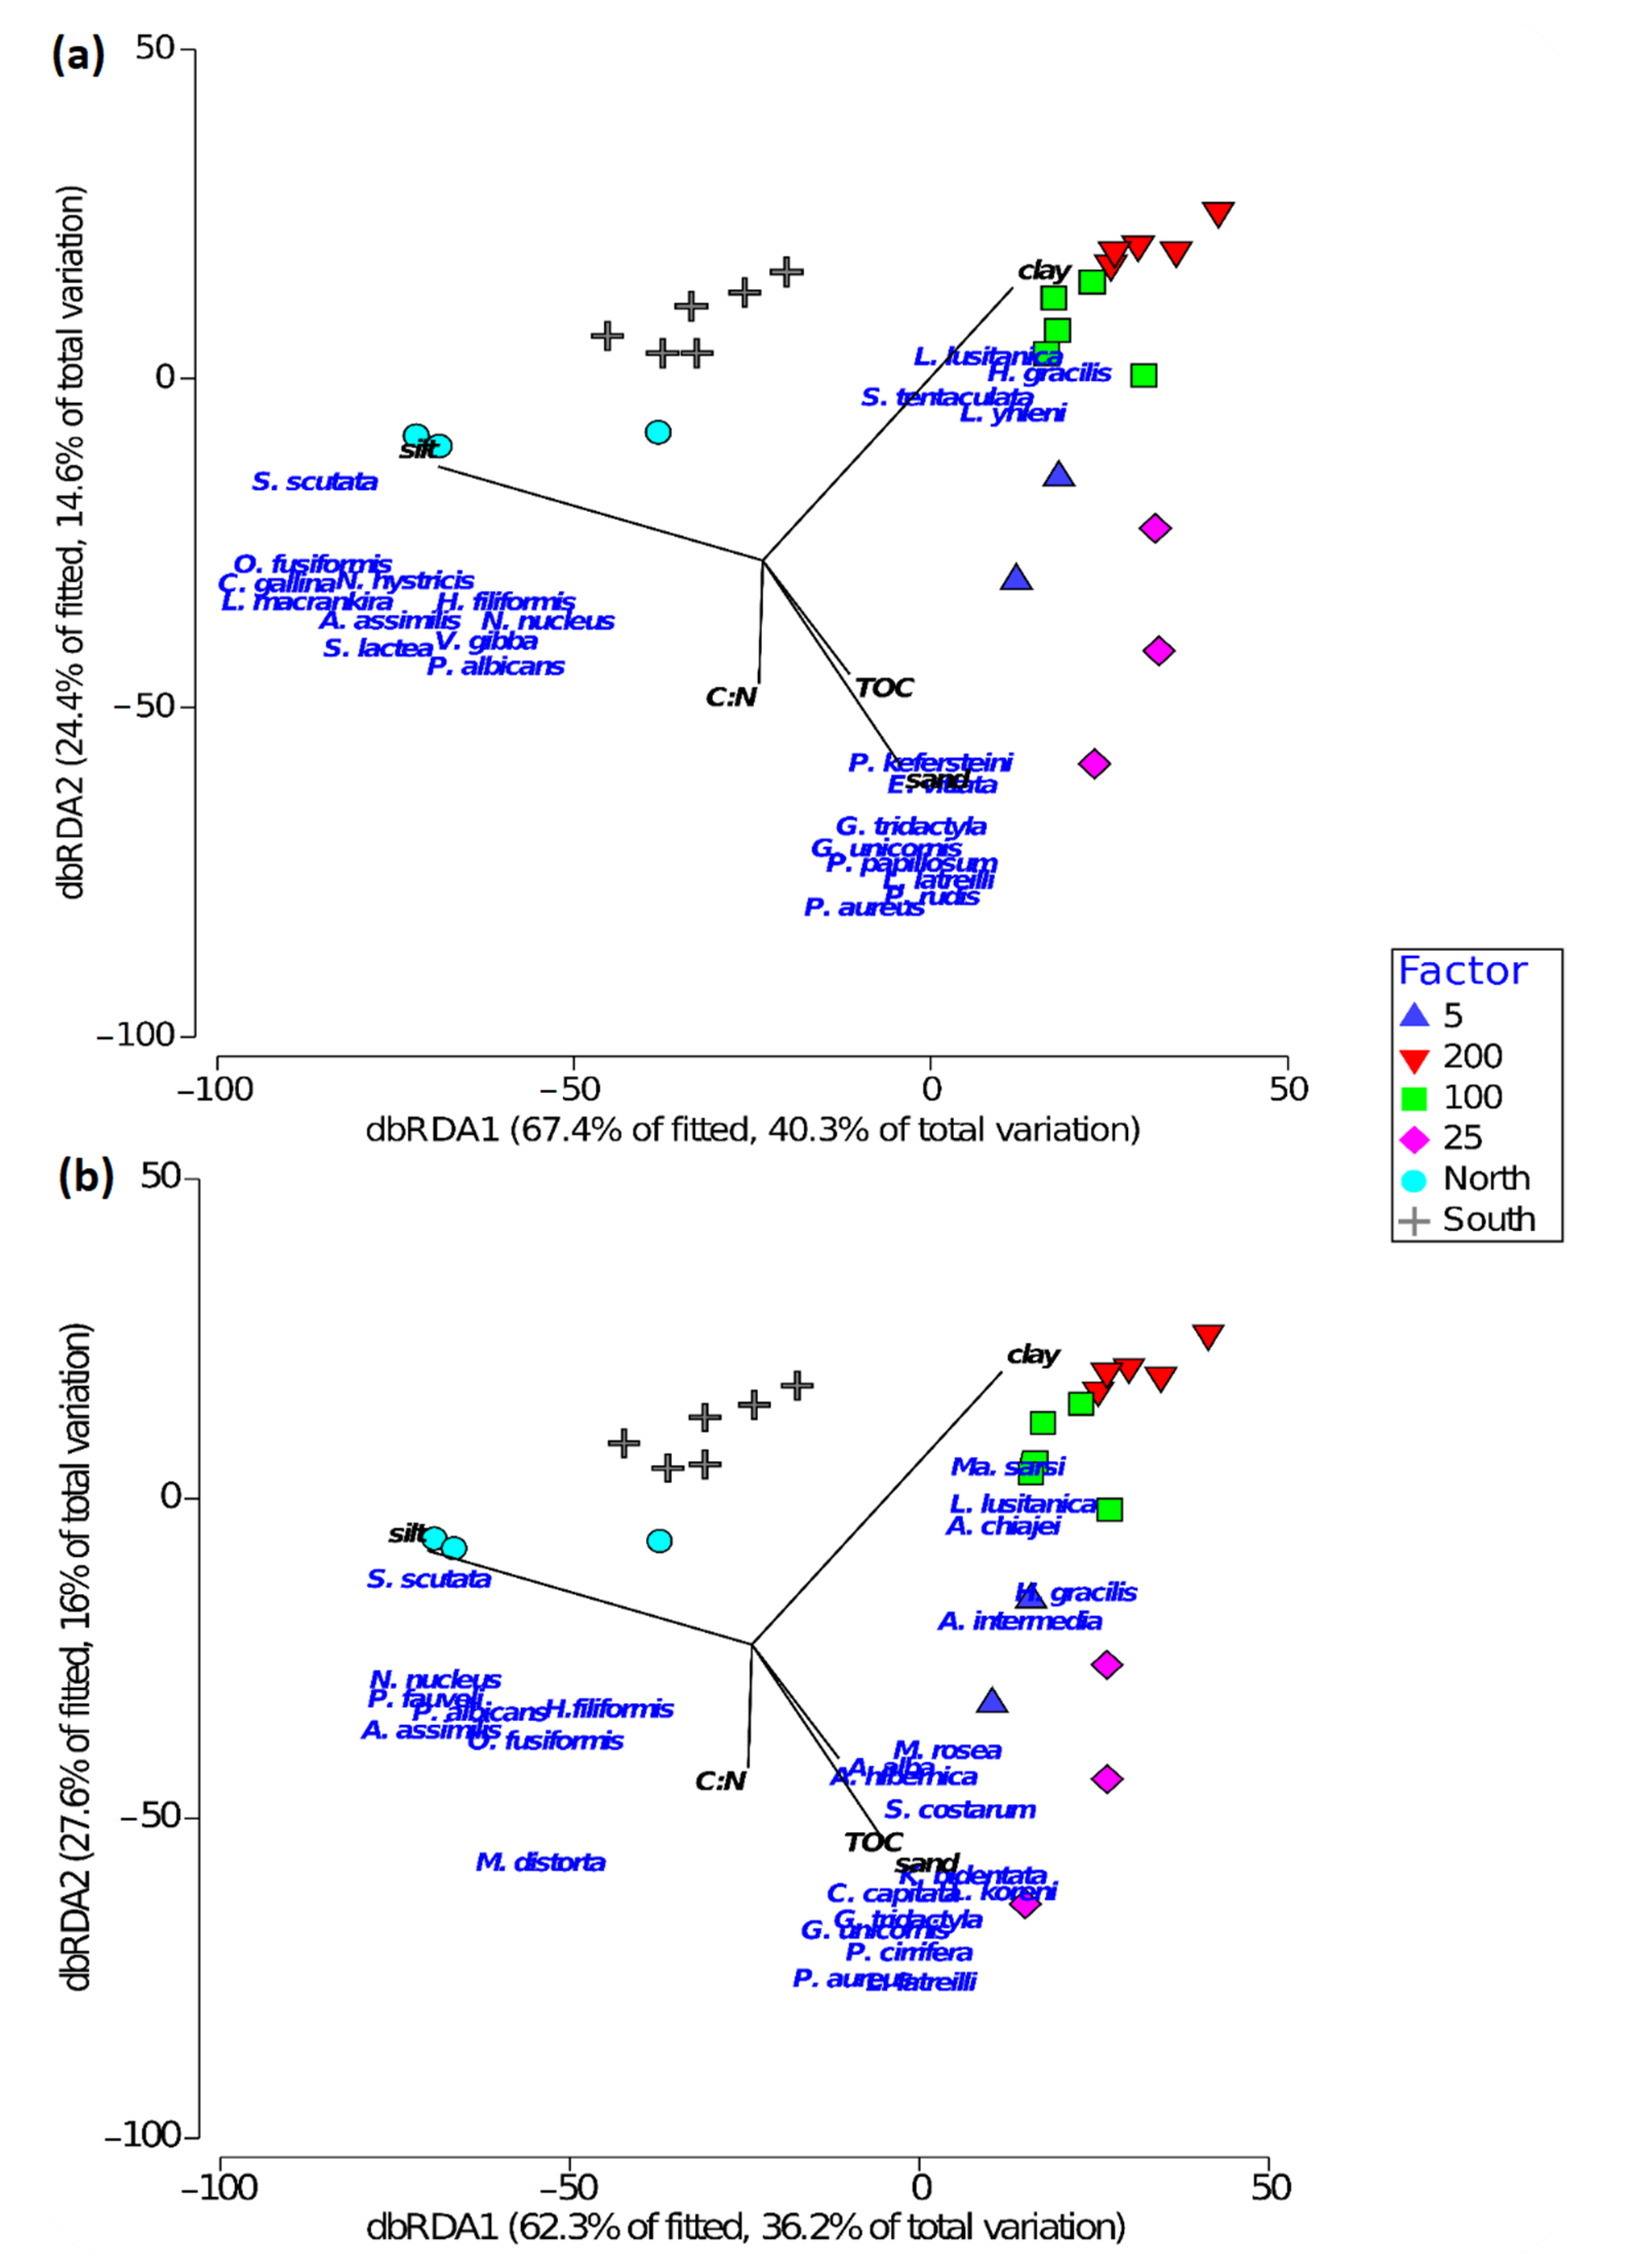
3.3. Relation between Bioturbation Indices and Environmental Factors

Considering both sampling areas, TN and TOC were highly covaried (rs = 0.906), therefore, we deleted TN from the subsequent analyses. Table 1 summarizes the linear regression analysis for environmental parameters as predictors and bioturbation indices (BPc and IPc) as response variables.
The nMDS was performed on BPi and IPi values of the Po River coastal area and confirmed the PERMANOVA results (Figure S1a,b). Further, the differences among groups of stations (i.e., ‘north and south’) were enhanced by SIMPROF analyses, particularly for IPi values. The stations located in the northern part of prodelta (C1, C3, and C8) were plotted on the right side of the nMDS plot-based BPi (Figure S1a) and on the left side of the nMDS plot-based IPi values (Figure S1b). Figure S1a,b explains that clay is only responsible for the difference among the stations mainly those increasing away from the main distributary mouth (Po di Pila) along the southward river plume (i.e., C12, C19, C22, and C23). In addition, the nMDS performed on BPi and IPi composition in the Gulf of Trieste did not follow (by SIMPROF test) the same results obtained by the PERMANOVA test. Furthermore, the nMDS showed the stations located at a 25 m distance from the sewage duct (i.e., stations -25D, 25FD, and 25D) were placed on the left side of the nMDS plot-based BPi (Figure S2a) and the right side of the nMDS plot-based IPi (Figure S2b) values at the maximum distance (Bray–Curtis maximum dissimilarity) from stations located at 100 and >200 m. To compare with those stationed at 5 m away from the duct, these results indicated that species at 25 m away from the duct had different compositions in reworking and bioirrigation attributes. The latter differences could be due to higher values of sand and TOC at stations gathered at 25 m from the duct, whereas a major % of silt and clay was noticed at the 100 and >200 m group of stations.
The distance-based redundancy analysis (dbRDA) performed using BPi and IPi values of species selected by SIMPER and environmental variables for both sampling areas, explained the 54.9 and 52.2% of the total variation, respectively (Figure 7a,b). Overall, both analyses plotted the stations separately according to sampling areas and factors. Regarding the negative part of dbRDA1 (left side of Figure 7a), higher percentages of silt corresponded to high occurrences of the polychaete Sternaspis scutata, O. fusiformis, and Heteromastus filiformis in the prodelta area. Clay was the predominant element of the positive axis of dbRDA2, related principally with the polychaetes Lumbrinereis lusitanica and Hilbigneris gracilis that occurred in the farther stations from the diffusion zone. In addition, C:N, TOC, and sand were the predominant elements of the negative part of dbRDA2, strictly related to some bivalve species in the prodelta area (e.g., Varicorbula gibba, S. lactea, and Peronidia albicans and polychaetes such as Glycera trydactila and Eunice vittata). Regarding the dbRDA analyses performed on IPi values (Figure 7b), some different species were related to the second axis (e.g., the bivalve Moerella distorta, and the polychaetes C. capitata and Maldane sarsi).

4. Discussion

This study shows that the variations in macrofauna bioturbation attributes among stations considering the spatial scales in both study areas were likely due to the effects of grain-size composition and the degree of organic enrichment more than the differences in the type of organic matter inputs (terrigenous/freshwater allochthonous and sewage derive). The temporal scale was not of fundamental importance here because the two study areas were far apart. In this study, two different snapshots of environmental conditions were compared in order to determine how they might influence macrofauna bioturbation characteristics in different ways. However, it was unclear how much OM affected macrofauna communities in the two sampling areas, as well as the relationship between the increased OM in the sediments and changes in benthic fauna structure and metabolism is quite complicated [78]. As a result of this study, two different macrofauna communities responded similarly to the amount of organic enrichment, which followed the model of Pearson and Rosenberg [30]. The macrofauna sampled at the stations close to the main outflow (Gulf of Trieste) and in front of the main river month (Po delta River) were characterized by a higher density and a lower diversity with the presence of opportunistic species, as compared to the macrofauna studied at the more distant stations, where the situation was the opposite.
In addition, our results show that macrofauna invertebrates with high burrowing depths and blind-ended burrows, abundant at sandier stations, enhanced bio-irrigation. Regardless of the type of organic matter sources, the high density of superficial modifiers and biodiffusors (belonging to ‘reworking’ traits categories) enhance the bioturbation activities, increasing the entire ecosystem functioning in both study areas, where a higher % of biodiffusers was found towards the southern stations at the coastal area of Po River, while a slightly increasing percentage of ‘superficial modifiers’ score coupled with decreasing values of ‘biodiffusors’ were observed from the stations located nearby the main outfall towards the farther ones in the diffusion area.
In both sampling areas, there was no evident variation pattern of species number and macrofaunal bioturbation attributes. In the Gulf of Trieste, the highest values of species number were observed toward the increasing distance from the pipe, whereas the maximum of BPc and IPc was noticed at stations located 25 m from the main outfall. Similarly, in the prodelta area, where despite the higher numbers of species at northern stations if compared to southern ones, the major values of BPc and IPc at northern sites did not follow richness values. Accordingly, our results evidenced that the structure of the benthic macrofauna community did not affect bioturbation processes in different sedimentary environments. Our finding is in contrast to those observed by [31]. They reported that the structure of the macrobenthic community deeply influenced the bioturbation attributes. However, they studied macrofauna invertebrates from brackish environments. The latter community is per se less structured if compared to one from coastal areas, thus few species were able to sustain the bioturbation processes [31].
We inferred that physical environmental features, mainly different grain-size fractions, determine the broad pattern of benthic organism distribution, instead of the origin of organic matters (i.e., terrigenous or sewage-derived materials). Our findings are in accord with previous studies that have reported grain size as the main driver of the spatial distribution pattern of the bioturbation attributes [70,76].
In addition, despite the lower values of species richness, the bioturbation attributes (i.e., BPc and IPc) in the prodelta area, were higher if compared to the diffusion zone (Gulf of Trieste), also at the stations farther from the main point of contamination (the principal distributary mouth). This is principally linked to the presence of the highest dominance of surface deposit feeders at northern sites whereas sub-surface deposit feeders and biodiffusors in the southern ones. The feeding strategy of macrofauna invertebrates is fundamental to determining the type of burrows and the modes of locomotion and defecation [47,73,79].
Our results, as observed by other authors [70,80] indicated that surface and subsurface deposit feeders mostly contributed to BPc and IPc of coastal marine environments. The huge amount of riverine organic matter deeply influenced the bioturbation features in prodelta areas. The continuous and high load of terrigenous material from a river is known to affect suspension-feeding animals by clogging feeding structures, interfering with particle selection, and requiring the use of energy to clear away unvented particles [81]. In fact, in the central part of the Po delta system (i.e., C8), where high current velocities and low turbidity were reported [82,83], we observed a high dominance of suspension feeder on the account of O. fusiformis and the bivalve Varicorbula gibba. The majority of these suspension feeders are superficial modifiers. Those can rework sediments but not as much as biodiffusers. The majority of these suspension feeders are superficial modifiers. Superficial modifiers are considered weak bioturbators since these animals can rework only the most superficial sediments and thus have a low impact on bioturbation processes compared to the other reworking modalities (i.e., conveyors, biodiffusors, and regenerators) [69]. The higher values of BPc in this station (i.e., C8) were principally due to the huge amount of O. fusiformis.
Southern stations were characterized by high expression of biodiffuser and deposit feeders, on the account of S. scutata and the echinoderm Amphiura chiajei. Biodiffusers are dominant in muddy sediments since they can constantly and randomly biomix (both horizontally and vertically) the local sediments over a short distance, which results in particle transport [84]. Among them, gallery biodiffusers often occur in finer sediments in which they are promoters of diffusive local biomixing primarily due to burrowing activities within the upper 10–30 cm of sediments [47]. These animals, in particular polychaetes, are considered non-selective deposit feeders [85] able to feed on both fresh and aged organic matter, promoting nutrient cycling within sediment layers [31,86]. Commonly, S. scutata is a deep burrowing subsurface deposit feeder living below 4 cm of depth and can use the food resource provided by river floods later on and over a longer period [87].
Regarding IPc, higher values of bio-irrigation were noticed at both groups of the site in prodelta areas, if compared to the diffusion zone, however, major bioturbation activities were reported in the southern station if compared to sediment reworking ones. These results confirmed the importance of grain-size distribution for bio-irrigation features. In finer sediments, the permeability rate is low, and therefore, open irrigation (U- or Y-shaped burrows with two or more openings to the sediment surface and radial diffusion mode) is prevalent and enhance the water interchange. These differences reflect the fact that bio-irrigation rates are species-specific and depend on the physical mechanism used [88,89,90]. This is supported by a shift from anoxia to air-saturated conditions at the burrow opening and increases microbial respiration faster than possible than by the molecular diffusion system [91].
The bioturbation processes in the Gulf of Trieste were lower if compared to the Po River prodelta area. We inferred that this difference could be strictly linked to the biomass but above all to the abundance of species found. In the diffusion zone, we have higher values of species but also not so many individuals for species (higher evenness values, data not reported), except for Capitella capitata which was observed with higher abundance but low biomass at only 0D station. On the contrary, in the prodelta coastal area, we noticed in many stations’ major specimen densities [31]; the values of BPc and IPc were higher. The highest values of BPc and IPc latter, confirmed by the U test, were observed at stations placed 25 m distance away from the main sewage outfall. Regarding bioturbation processes, the latter results were due to the dominance of conveyors.
In both sampling areas, the stations close to the main outflow (Gulf of Trieste) and in front of the main river month (Po delta River) were characterized by high values of TOC and TN compared to the more distant stations [31,63]. A similar pattern was noticed for C:N ratio. Since the highest dominance of surface deposit feeders at northern sites (Po river prodelta) and the subsurface deposit feeder (e.g., C. capitata) at 25 m from the pipe (Gulf of Trieste), could have influenced the distribution of organic matter within sediments (i.e., TOC and TN), promoting the unexpected decreasing of organic matter at surface layers. Further, it is known that the high presence of C. capitata may promote the mineralization of organic matter deposited in the sea bottom within a relatively short period [92]. This result agrees well with the finding that subsurface-deposit feeders, protruding deep into the sediment and causing most of the diffusive mixing, dominate sediments containing intermediate to low-quality organic matter [93].
Reworking and ingestion of sediment particles may have contributed to modifying sediment properties and so promoted microbial population resulting in accelerated degradation of organic matter [94]. Additionally, the latter was confirmed by [95], suggesting that BPc values could be a good predictor of oxygen consumption, denitrification, alkalinity and ammonium fluxes in fine sandy sediments. What was observed by the authors might explain the hypoxic conditions in the area nearby the outfall despite high sediment reworking. Furthermore, the higher values of IPc at stations gathered at <5 and 25 m from the pipes were principally due to the presence of open irrigation system at sandier sites. In fact, the main role in determining how the exchange of pore water within sediments is linked to the morphology of burrows [31,79], and further, burrow irrigation is characterized by the advection of pore water in more penetrable sandy sediments, causing the building of blind-ending burrows [47]. Moreover, we observed more injection depth at the stations nearby the diffusion zone. The burrowing depth is important for the pore water exchange and local input of oxygen into anoxic sediments. In particular, the effects of deep burrowing organisms are enhanced in oxic or suboxic sediments compared to those of shallow burrowers [96].

5. Conclusions

The present study contributes to the growing body of bioturbation research, especially in the relatively less investigated coastal marine ecosystems. We provided insight into the different macrofauna responses influenced by natural and anthropogenic organic enrichment by using bioturbation indices (BPc and IPc) in two different sedimentary study areas. In both sampling areas, there was no evident variation pattern in species number and macrofaunal bioturbation attributes, where the highest values of species number were noticed toward the increasing distance from the pipe, whereas the maximum of BPc and IPc was noticed at stations located 25 m from the main outfall. Similarly, in the prodelta area, the major values of BPc and IPc at northern sites did not follow richness values. However, at the stations close to the main outflow (Gulf of Trieste) and in front of the main river month (Po delta River), which were characterized by high values of TOC and TN as well as C:N, two different macrofauna communities responded similarly to the amount of organic enrichment, which is characterized by a higher density and a lower diversity with the presence of opportunistic species. The difference in bioturbation indices was due to the presence of surface deposit feeders and injection depth (from 2 to 5 cm) with limited movement at the station located northwards and 25 m distance in the prodelta and diffusion zone, respectively. Such a strong dominance of these taxa in the implementation of bioturbation indices can cause instability in the ecosystem functions if these organisms disappear as a result of ecological disasters or environmental degradation. Grain-size fractions were the main drivers of the significant differences in BPc and IPc, and the major number of taxa in coarse sediments contributed to the highest values of bioturbation indices. The use of both BPc and IPc could be matched with experimental data to corroborate our findings and help introduce the application of functional traits in the assessment of the benthic ecosystem functioning, and it could be useful for monitoring programs in differing sedimentary environments, which could allow for cross-system comparisons over habitats and geographic scales. Accordingly, the deepening of the knowledge on macrofauna bioturbation attributes concerning their sediment reworking and ventilation abilities after anoxic and dystrophic events is of paramount importance in the framework of efficient management and sustainable use of coastal resources, especially areas deeply influenced by human impacts.

Supplementary Materials

The following supporting information can be downloaded at: https://www.mdpi.com/article/10.3390/d15030449/s1, Figure S1: nMDS ordination plot based on BPi (a) and IPi (b) values at sampled stations in the Po River prodelta area. The significant covaried groups of stations (by SIMPROF test) are indicated. The environmental variables vectors are overlaid; Figure S2: nMDS ordination plot based on BPi (a) and IPi (b) values at sampled stations nearby the diffusion zone in the Gulf of Trieste. The significant covaried groups of stations (by SIMPROF test) are indicated. The environmental variables vectors are overlaid; Table S1: Coordinates and depth for both sampling stations (a) along the coastal Po River Pro delta and (b) in the Gulf of Trieste along with the sewage discharge. Indication of the transect to which the station belongs as well as the distance from the sewage pipelines are reported; Table S2: Bioturbation Potential (BPi) [69] and Irrigation Potential (IPi) [37] categorical scores of taxa observed in both sampling areas. Ri (Reworking) scores: 1-epifauna, 2-superficial modifiers, 3-upward and downward conveyors, 4-biodiffusors, 5-regenerators; Mi (Mobility) scores: 1-organism that lives in fixed tubes, 2-organism with limited movement, 3-movements through the sediment matrix, 4-free movements via burrow types. BTi (Burrow type) scores: 1-infauna with internal irrigation (e.g. siphons), 2-open irrigation (U- or Y- shaped burrows), 3-blind ended irrigation (blind-ended burrows, no burrows systems); FTi (Feeding type) scores: 1-surface filter feeder, 2-predator, 3-surface deposit feeder, 4-subsurface deposit feeder; IDi (Injection depth) scores:0-epibiont; 1-depth from 0 to 2 cm, 2-depth from 2 to 5 cm, 3-depth from 5 to 10 cm and 4-depth over 10 cm. From [37], the calculation of FTi was modified by dividing deposit feeder habit in surface and subsurface deposit feeder modalities, with different categorical scores.

Author Contributions

Conceptualization, F.N. and R.A.; Formal analysis, S.E.V. and F.N.; Funding acquisition, P.D.N.; Investigation, S.E.V., F.N. and R.A.; Methodology, S.E.V., F.N. and R.A.; Supervision, P.D.N.; Writing—original draft, S.E.V. and F.N. All authors have read and agreed to the published version of the manuscript.

Funding

This research received no external funding.

Institutional Review Board Statement

Not applicable.

Data Availability Statement

Not applicable.

Acknowledgments

In the Po River coastal area, the activities were supported by the Flagship Project RITMARE–La Ricerca ITaliana per il MARE-The Italian Research for the Sea, coordinated by the National Research Council and supported by the Ministry of Education, University and Research. In the Gulf of Trieste, the study was supported by AcegasApsAmga Hera. The authors wish to thanks Marco Segarich and Carlo Franzosini for logistical support during sampling activities, Larissa Ferrante for macrofaunal sorting activities and taxonomic identification, and Matteo Bazzaro and Federica Relitti for the grain-size and sediment organic carbon analyses.

Conflicts of Interest

The authors declare no conflict of interest.

References

  1. Snelgrove, P.V. The biodiversity of macrofaunal organisms in marine sediments. Biodivers. Conserv. 1998, 7, 1123–1132. [Google Scholar] [CrossRef]
  2. 2Ferraro, S.P.; Cole, F.A. Taxonomic level sufficient for assessing pollution impacts on the Southern California bight macrobenthos—Revisited. Environ. Toxicol. 1995, 14, 1031–1040. [Google Scholar] [CrossRef]
  3. Lancellotti, D.A.; Stotz, W.B. Effects of shoreline discharge of iron mine tailings on a marine softbottom community in northern Chile. Mar. Pollut. Bull. 2004, 48, 303–312. [Google Scholar] [CrossRef] [PubMed]
  4. Bremner, J.; Rogers, S.I.; Frid, C.L.J. Methods for describing ecological functioning of marine benthic assemblages using biological traits analysis (BTA). Ecol. Indic. 2006, 6, 609–622. [Google Scholar] [CrossRef]
  5. Rhoads, D.C.; Boyer, L.F. The effects of marine benthos on physical properties of sediments. In Animal-Sediment Relations; Springer: Boston, MA, USA, 1982; pp. 3–52. [Google Scholar] [CrossRef]
  6. Schaffner, L. Small-scale organism distributions and patterns of species diversity: Evidence for positive interactions in an estuarine benthic community. Mar. Ecol. Prog. Ser. 1990, 61, 107–117. [Google Scholar] [CrossRef]
  7. Meysman, F.J.; Middelburg, J.J.; Heip, C.H. Bioturbation: A fresh look at Darwin’s last idea. Trends Ecol. Evol. 2006, 21, 688–695. [Google Scholar] [CrossRef]
  8. Remaili, T.A.; Simpson, S.L.; Amato, E.D.; Spadaro, D.A.; Jarolimek, C.V.; Jolley, D.F. The impact of sediment bioturbation by secondary organisms on metal bioavailability, bioaccumulation and toxicity to target organisms in benthic bioassays: Implications for sediment quality assessment. Environ. Pollut. 2016, 208, 590–599. [Google Scholar] [CrossRef] [Green Version]
  9. Remaili, T.M.; Simpson, S.L.; Jolley, D.E.F. Effects of enhanced bioturbation intensities on the toxicity assessment of legacy-contaminated sediments. Environ. Pollut. 2017, 226, 335–345. [Google Scholar] [CrossRef]
  10. Mermillod-Blondin, F. The functional significance of bioturbation and biodeposition on biogeochemical processes at the water-sediment interface in freshwater and marine ecosystems. J. N. Am. Benthol. Soc. 2011, 30, 770–778. [Google Scholar] [CrossRef] [Green Version]
  11. Rosenberg, R.; Grémare, A.; Ducheme, J.C.; Davey, E.; Frank, M. 3D visualization and quantification of marine benthic biogenic structures and particle transport utilizing computer-aided tomography. Mar. Ecol. Prog. Ser. 2008, 363, 171–182. [Google Scholar] [CrossRef]
  12. Birchenough, S.; Parker, R.; McManus, E.; Barry, J. Combining bioturbation and redox metrics: Potential tools for assessing seabed function. Ecol. Indic. 2012, 12, 8–16. [Google Scholar] [CrossRef]
  13. Giani, M.; Berto, D.; Rampazzo, F.; Savelli, F.; Alvisi, F.; Giordano, P.; Ravaioli, M.; Frascari, F. Origin of sedimentary organic matter in the north-western Adriatic Sea. Estuar. Coast. Shelf Sci. 2009, 84, 573–583. [Google Scholar] [CrossRef]
  14. Bongiorni, L.; Nasi, F.; Fiorentino, F.; Auriemma, R.; Rampazzo, F.; Nordström, M.C.; Berto, D. Contribution of deltaic wetland food sources to coastal macrobenthic consumers (Po River Delta, north Adriatic Sea). Sci. Total Environ. 2018, 643, 1373–1386. [Google Scholar] [CrossRef] [PubMed]
  15. Koop, K.; Hutchins, P. Disposal of sewage to the ocean—A sustainable solution? Mar. Pollut. Bull. 1996, 33, 121–123. [Google Scholar] [CrossRef]
  16. Nasi, F.; Vesal, S.E.; Relitti, F.; Bazzaro, M.; Teixidó, N.; Auriemma, R.; Cibic, T. Taxonomic and functional macrofaunal diversity along a gradient of sewage contamination: A three-year study. Environ. Pollut. 2023, 323, 121022. [Google Scholar] [CrossRef]
  17. Moon, H.-B.; Yoon, S.-P.; Jung, R.-H.; Choi, M. Wastewater treatment plants (WWTPs) as a source of sediment contamination by toxic organic pollutants and fecal sterols in a semi-enclosed bay in Korea. Chemosphere 2008, 73, 880–889. [Google Scholar] [CrossRef]
  18. Wilkinson, G.M.; Besterman, A.; Buelo, C.; Gephart, J.; Pace, M.L. A synthesis of modern organic carbon accumulation rates in coastal and aquatic inland ecosystems. Sci. Rep. 2018, 8, 15736. [Google Scholar] [CrossRef] [Green Version]
  19. Darnaude, A.M.; Salen-Picard, C.; Polunin, N.V.C.; HarmelinVivien, M.L. Trophodynamic linkage between river runoff and coastal fishery yield elucidated by stable isotope data in the Gulf of Lions (NW Mediterranean). Oecologia 2004, 138, 325–332. [Google Scholar] [CrossRef]
  20. Savage, C.; Thrush, S.F.; Lohrer, A.M.; Hewitt, J.E. Ecosystem services transcend boundaries: Estuaries provide resource subsidies and influence functional diversity in coastal benthic communities. PLoS ONE 2012, 7, e42708. [Google Scholar] [CrossRef]
  21. Lotze, H.K.; Lenihan, H.S.; Bourque, B.J.; Bradbury, R.H.; Cooke, R.G.; Kay, M.C.; Kidwell, S.M.; Kirby, M.X.; Peterson, C.H.; Jackson, J.B.C. Depletion, Degradation, and Recovery Potential of Estuaries and Coastal Seas. Science 2006, 312, 1806–1809. [Google Scholar] [CrossRef]
  22. Airoldi, L.; Balata, D.; Beck, M.W. The Gray Zone: Relationships between habitat loss and marine diversity and their applications in conservation. J. Exp. Mar. Biol. 2008, 366, 8–15. [Google Scholar] [CrossRef]
  23. Crain, C.M.; Halpern, B.S.; Beck, M.W.; Kappel, C.V. Understanding and managing human threats to the coastal marine environment. Ann. N. Y. Acad. Sci. 2009, 1162, 39–62. [Google Scholar] [CrossRef] [PubMed]
  24. Kaiser, M.J.; Clarke, K.R.; Hinz, H.; Austen, M.C.V.; Somerfield, P.J.; Karakassis, I. Global analysis of response and recovery of benthic biota to fishing. Mar. Ecol. Prog. Ser. 2006, 311, 1–14. [Google Scholar] [CrossRef] [Green Version]
  25. Borja, A.; Galparsoro, I.; Solaun, O.; Muxika, I.; Tello, E.M.; Uriarte, A.; Valencia, V. The European Water Framework Directive and the DPSIR, a methodological approach to assess the risk of failing to achieve good ecological status. Estuar. Coast. Shelf Sci. 2006, 66, 84–96. [Google Scholar] [CrossRef]
  26. Borja, A.; Dauer, D.M.; Elliott, M.; Simenstad, C. Medium and long-term recovery of estuarine and coastal ecosystems: Patterns, rates and restoration effectiveness. Estuaries Coast. 2010, 33, 1249–1260. [Google Scholar] [CrossRef] [Green Version]
  27. Kenny, A.J.; Skjoldal, H.R.; Engelhard, G.H.; Kershaw, P.J.; Reid, J.B. An integrated approach for assessing the relative significance of human pressures and environmental forcing on the status of Large Marine Ecosystems. Prog. Oceanogr. 2009, 81, 132–148. [Google Scholar] [CrossRef]
  28. Kenny, A.J.; Jenkins, C.; Wood, D.; Bolam, S.G.; Mitchell, P.; Scougal, C.; Judd, A. Assessing cumulative human activities, pressures, and impacts on North Sea benthic habitats using a biological traits approach. ICES J. Mar. Sci. 2018, 75, 1080–1092. [Google Scholar] [CrossRef] [Green Version]
  29. Lissner, A.L.; Taghorn, G.L.; Diener, D.R.; Schroeter, S.C.; Dixon, D. Recolonization of deep-water hard substrate communities: Potential impacts from oil and gas development. Ecol. Appl. 1991, 1, 258–267. [Google Scholar] [CrossRef]
  30. Pearson, T.H.; Rosenberg, R. Macrobenthic succession in relation to organic enrichment and pollution of the marine environment. Oceanogr. Mar. Biol. Ann. Rev. 1978, 16, 229–311. [Google Scholar]
  31. Nasi, F.; Ferrante, L.; Alvisi, F.; Bonsdorff, E.; Auriemma, R.; Cibic, T. Macrofaunal bioturbation attributes in relation to riverine influence: What can we learn from the Po River lagoonal system (Adriatic Sea)? Estuar. Coast. Shelf Sci. 2020, 232, 106405. [Google Scholar] [CrossRef]
  32. Dashtgard, S.E.; Gingras, M.K.; Pemberton, S.G. Grain-size controls on the occurrence of bioturbation. Palaeogeogr. Palaeoclimatol. Palaeoecol. 2008, 257, 224–243. [Google Scholar] [CrossRef]
  33. Gingras, M.K.; Pemberton, S.G.; Saunders, T.; Clifton, H.E. The ichnology of modern and Pleistocene brackish-water deposits at Willapa Bay, Washington: Variability in estuarine settings. Palaios 1999, 14, 352–374. [Google Scholar] [CrossRef]
  34. Martinez-Garcia, E.; Sanchez-Jerez, P.; Aguado-Giménez, F.; Ávila, P.; Guerrero, A.; Sánchez-Lizaso, J.L.; Fernandez-Gonzalez, V.; González, N.; Gairin, J.I.; Carballeira, C.; et al. A meta-analysis approach to the effects of fish farming on soft bottom polychaeta assemblages in temperate regions. Mar. Pollut. Bull. 2013, 69, 165–171. [Google Scholar] [CrossRef]
  35. Papageorgiou, N.; Ioanna Kalantzi, I.; Karakassis, I. Effects of fish farming on the biological and geochemical properties of muddy and sandy sediments in the mediterranean sea. Mar. Environ. Res. 2010, 69, 326–336. [Google Scholar] [CrossRef]
  36. Solan, M.; Cardinale, B.J.; Downing, A.L.; Engelhardt, K.A.; Ruesink, J.L.; Srivastava, D.S. Extinction and ecosystem function in the marine benthos. Science 2004, 306, 1177–1180. [Google Scholar] [CrossRef] [Green Version]
  37. Wrede, A.; Beermann, J.; Dannheim, J.; Gutow, L.; Brey, T. Organism functional traits and ecosystem supporting services. A novel approach to predict bioirrigation. Ecol. Indicat. 2018, 91, 737–743. [Google Scholar] [CrossRef]
  38. Bunker, D.E.; DeClerck, F.; Bradford, J.C.; Colwell, R.K.; Perfecto, I.; Phillips, O.L.; Naeem, S. Species loss and aboveground carbon storage in a tropical forest. Science 2005, 310, 1029–1031. [Google Scholar] [CrossRef] [PubMed] [Green Version]
  39. Solan, M.; Wigham, B.D.; Hudson, I.R.; Kennedy, R.; Coulon, C.H.; Norling, K.; Rosenberg, R. In situ quantification of bioturbation using time-lapse fluorescent sediment profile imaging (f-SPI), luminophore tracers and model simulation. Mar. Ecol. Prog. Ser. 2004, 271, 1–12. [Google Scholar] [CrossRef] [Green Version]
  40. Lohrer, A.; Halliday, N.; Thrush, S.; Hewitt, J.; Rodil, I. Ecosystem functioning in a disturbance-recovery context: Contribution of macrofauna to primary production and nutrient release on intertidal sandflats. J. Exp. Mar. Biol. Ecol. 2010, 390, 6–13. [Google Scholar] [CrossRef]
  41. Teal, L.; Parker, E.; Solan, M. Coupling bioturbation activity to metal (Fe and Mn) profiles in situ. Biogeosciences 2013, 10, 2365–2378. [Google Scholar] [CrossRef] [Green Version]
  42. Queirós, A.M.; Hiddink, J.G.; Johnson, G.; Cabral, H.N.; Kaiser, M.J. Context dependence of marine ecosystem engineer invasion impacts on benthic ecosystem functioning. Biol. Invasions 2011, 13, 1059–1075. [Google Scholar] [CrossRef]
  43. Solan, M.; Scott, F.; Dulvy, N.K.; Godbold, J.A.; Parker, R. Incorporating extinction risk and realistic biodiversity futures: Implementation of trait-based extinction scenarios. In Marine Biodiversity and Ecosystem Functioning: Frameworks, Methodologies, and Integration; Oxford University Press: Oxford, UK, 2012; pp. 127–148. [Google Scholar]
  44. Van Colen, C.; Rossi, F.; Montserrat, F.; Andersson, M.G.I.; Gribsholt, B.; Herman, P.M.J.; Degraer, S.; Vincx, M.; Ysebaert, T.; Middelburg, J.J. Organism-sediment interactions govern post-hypoxia recovery of ecosystem functioning. PLoS ONE 2012, 7, e49795. [Google Scholar] [CrossRef] [Green Version]
  45. Villnäs, A.; Norkko, J.; Lukkari, K.; Hewitt, J.; Norkko, A. Consequences of increasing hypoxic disturbance on benthic communities and ecosystem functioning. PLoS ONE 2012, 7, e44920. [Google Scholar] [CrossRef] [PubMed] [Green Version]
  46. Josefson, A.B.; Norkko, J.; Norkko, A. Burial and decomposition of plant pigments in surface sediments of the Baltic Sea: Role of oxygen and benthic fauna. Mar. Ecol. Prog. Ser. 2012, 455, 33–49. [Google Scholar] [CrossRef] [Green Version]
  47. Kristensen, E.; Penha-Lopes, G.; Delefosse, M.; Valdemarsen, T.; Quintana, C.O.; Banta, G.T. What is bioturbation? The need for a precise definition for fauna in aquatic sciences. Mar. Ecol. Prog. Ser. 2012, 446, 285–302. [Google Scholar] [CrossRef] [Green Version]
  48. Aller, R.C. The effects of macrobenthos on chemical properties of marine sediment and overlying water. In Animal Sediment Relations; McCall, P.L., Tevesz, M.J.S., Eds.; Plenum Press: New York, NY, USA, 1982; pp. 53–102. [Google Scholar] [CrossRef]
  49. Christensen, B.; Vedel, A.; Kristensen, E. Carbon and nitrogen fluxes in sediment inhabited by suspension-feeding (Nereis diversicolor) and non-suspension feeding (N. virens) polychaetes. Mar. Ecol. Prog. Ser. 2000, 192, 203–217. [Google Scholar] [CrossRef]
  50. Painting, S.J.; Van der Molen, J.; Parker, E.; Coughlan, C.; Birchenough, S.; Bolam, S.; Aldridge, J.N.; Forster, R.M.; Greenwood, N. Development of indicators of ecosystem functioning in a temperate shelf sea: A combined fieldwork and modelling approach. Biogeochemistry 2012, 113, 237–257. [Google Scholar] [CrossRef]
  51. Van Hoey, G.; Permuy, D.C.; Vandendriessche, S.; Vincx, M.; Hostens, K. An ecological quality status assessment procedure for soft-sediment benthic habitats: Weighing alternative approaches. Ecol. Ind. 2013, 25, 266–278. [Google Scholar] [CrossRef]
  52. Renz, J.R.; Powilleit, M.; Gogina, M.; Zettler, M.L.; Morys, C.; Forster, S. Community bioirrigation potential (BIPc), an index to quantify the potential for solute exchange at the sediment-water interface. Mar. Environ. Res. 2018, 181, 214–224. [Google Scholar] [CrossRef]
  53. Islam, S. Nitrogen and phosphorus budget in coastal and marine cage aquaculture and impacts of effluent loading on ecosystem: Review and analysis towards model development. Mar. Pollut. Bull. 2005, 50, 48–61. [Google Scholar] [CrossRef]
  54. Sweetman, A.K.; Norling, K.; Gunderstad, C.; Haugland, B.T.; Dale, T. Benthic ecosystem functioning beneath fish farms in different hydrodynamic environments. Limnol. Oceanogr. 2014, 59, 1139–1151. [Google Scholar] [CrossRef]
  55. Hedges, J.I.; Keil, R.G. Sedimentary organic matter preservation: An assessment and speculative synthesis. Mar. Chem. 1995, 49, 81–115. [Google Scholar] [CrossRef]
  56. Marchini, A.; Munari, C.; Mistri, M. Functions and ecological status of eight Italian lagoons examined using biological traits analysis (BTA). Mar. Pollut. Bull. 2008, 56, 1076–1085. Available online: https://www.marlin.ac.uk/biotic (accessed on 1 April 2021). [CrossRef] [PubMed]
  57. Tesi, T.; Miserocchi, S.; Goñi, M.A.; Turchetto, M.; Langone, L.; De Lazzari, A.; Albertazzi, S.; Correggiari, A. Influence of distributary channels on sediment and organic matter supply in event-dominated coastal margins: The Po prodelta as a study case. Biogeosciences 2011, 8, 365. [Google Scholar] [CrossRef] [Green Version]
  58. Boldrin, A.; Langone, L.; Miserocchi, S.; Turchetto, M.; Acri, F. Po River plume on the Adriatic continental shelf: Dispersion and sedimentation of dissolved and suspended matter during different river discharge rates. Mar. Geol. 2005, 222, 135–158. [Google Scholar] [CrossRef]
  59. Frignani, M.; Langone, L.; Ravaioli, M.; Sorgente, D.; Alvisi, F.; Albertazzi, S. Fine-sediment mass balance in the western Adriatic continental shelf over a century time scale. Mar. Geol. 2005, 222, 113–133. [Google Scholar] [CrossRef]
  60. Kourafalou, V.H. Process studies on the Po River plume, North Adriatic Sea. J. Geophys. Res. 1999, 104, 29963–29985. [Google Scholar] [CrossRef] [Green Version]
  61. Pirazzoli, P.A.; Tomasin, A. Recent evolution of surge-related events in the northern Adriatic area. J. Coast. Res. 2002, 18, 537–554. [Google Scholar]
  62. Lipizer, M.; De Vittor, C.; Falconi, C.; Comici, C.; Tamberlich, F.; Giani, M. Effects of intense physical and biological forcing factors on CNP pools in coastal waters (Gulf of Trieste, Northern Adriatic Sea). Estuar. Coast. Shelf Sci. 2012, 115, 40–50. [Google Scholar] [CrossRef]
  63. Vesal, S.E.; Nasi, F.; Pazzaglia, J.; Ferrante, L.; Auriemma, R.; Relitti, F.; Bazzaro, M.; Del Negro, P. Assessing the sewage discharge effects on soft-bottom macrofauna through traits-based approach. Mar. Pollut. Bull. 2021, 173, 113003. [Google Scholar] [CrossRef]
  64. Vesal, S.E.; Auriemma, R.; Libralato, S.; Nasi, F.; Del Negro, P. Impacts of organic enrichment on macrobenthic production, productivity, and transfer efficiency: What can we learn from a gradient of sewage effluents? Mar. Pollut. Bull. 2022, 182, 113972. [Google Scholar] [CrossRef]
  65. Solis-Weis, V.; Aleffi, I.F.; Bettoso, N.; Rossini, P.; Orel, G. The benthic macrofauna at the outfalls of the underwater sewage discharges in the Gulf of Trieste (Northern Adriatic Sea, Italy). Ann. Ser. Hist. Nat. 2007, 17, 1–16. [Google Scholar]
  66. Novelli, G. Gli Scarichi a Mare Nell’alto Adriatico; Rassegna Tecnica del Friuli Venezia Giulia: Udine, Italy, 1996; Volume 3, pp. 11–19. [Google Scholar]
  67. Wetzel, M.A.; Leuchs, H.; Koop, J.H.E. PRESERVATION effects on wet weight, dry weight, and ash-free dry weight biomass estimates of four common estuarine macro-invertebrates: No difference between ethanol and formalin. Helgol. Mar. Res. 2005, 59, 206–213. [Google Scholar] [CrossRef] [Green Version]
  68. Solan, M. The Concerted Use of ‘Traditional’ and Sediment Profile Imagery (SPI) Methodologies in Marine Benthic Characterisation and Monitoring. Ph.D. Thesis, Department of Zoology, National University of Ireland, Galway, Ireland, 2000. (Unpublished work). [Google Scholar]
  69. Queirós, A.M.; Birchenough, S.N.; Bremner, J.; Godbold, J.A.; Parker, R.E.; Romero-Ramirez, A.; Reiss, H.; Solan, M.; Somerfield, P.J.; Van Colen, C.; et al. A bioturbation classification of European marine infaunal invertebrates. Ecol. Evol. 2013, 3, 3958–3985. [Google Scholar] [CrossRef] [PubMed] [Green Version]
  70. Gogina, M.; Morys, C.; Forster, S.; Gräwe, U.; Friedland, R.; Zettler, M.L. Towards benthic ecosystem functioning maps: Quantifying bioturbation potential in the German part of the Baltic Sea. Ecol. Indicat. 2017, 73, 574–588. [Google Scholar] [CrossRef]
  71. Nasi, F.; Nordstr¨om, M.C.; Bonsdorff, E.; Auriemma, R.; Cibic, T.; Del Negro, P. Functional biodiversity of marine soft-sediment polychaetes from two Mediterranean coastal areas in relation to environmental stress. Mar. Environ. Res. 2018, 137, 121–132. [Google Scholar] [CrossRef]
  72. De-la-Ossa-Carretero, J.A.; Del-Pilar-Ruso, Y.; Giménez-Casalduero, F.; Sánchez-Lizaso, J.L. Assessing reliable indicators to sewage pollution in coastal soft-bottom communities. Environ. Monit. Assess. 2012, 184, 2133–2149. [Google Scholar] [CrossRef]
  73. Jumars, P.A.; Dorgan, K.M.; Lindsay, S.M. Diet of worms emended: An update of polychaete feeding guilds. Annu. Rev. Mar. Sci. 2015, 7, 497–520. [Google Scholar] [CrossRef] [Green Version]
  74. Levin, L.; Blair, N.; DeMaster, D.; Plaia, G.; Fornes, W.; Martin, C.; Thomas, C. Rapid subduction of organic matter by maldanid polychaetes on the North Carolina slope. J. Mar. Res. 1997, 55, 595–611. [Google Scholar] [CrossRef]
  75. Atkinson, R.J.A.; Froglia, C.; Arneri, E.; Antolini, B. Observations on the burrows and burrowing behaviour of Brachynotus gemmellari and on the burrows of several other species occurring on Squilla grounds off Ancona, Central Adriatic. Sci. Mar. 1998, 62, 91–100. [Google Scholar] [CrossRef] [Green Version]
  76. Morys, C.; Powilleit, M.; Forster, S. Bioturbation in relation to the depth distribution of macrozoobenthos in the southwestern Baltic Sea. Mar. Ecol. Prog. Ser. 2017, 579, 19–36. [Google Scholar] [CrossRef]
  77. Zuur, A.F.; Ieno, E.N.; Elphick, C.S. A protocol for data exploration to avoid common statistical problems. Methods Ecol. Evol. 2010, 1, 3–14. [Google Scholar] [CrossRef]
  78. Magni, P.; Vesal, S.E.; Giampaoletti, J.; Como, S.; Gravina, M.F. Joint use of biological traits, diversity and biotic indices to assess the ecological quality status of a Mediterranean transitional system. Ecol. Ind. 2023, 147, 109939. [Google Scholar] [CrossRef]
  79. Kristensen, E.; Kostka, J.E. Macrofaunal burrows and irrigation in marine sediment: Microbiological and biogeochemical interactions. In Interactions between Macro- and Microorganisms in Marine Sediments; Kristensen, E., Haese, R.R., Kostka, J.E., Eds.; American Geophysical Union: Washington, DC, USA, 2005; pp. 125–157. [Google Scholar]
  80. Breine, N.T.; De Backer, A.; Van Colen, C.; Moens, T.; Hostens, K.; Van Hoey, G. Structural and functional diversity of soft–bottom macrobenthic communities in the Southern North Sea. Estuar. Coast. Shelf Sci. 2018, 214, 173–184. [Google Scholar] [CrossRef]
  81. Thrush, S.F.; Hewitt, J.E.; Cummings, V.J.; Ellis, J.I.; Hatton, C.; Lohrer, A.; Norkko, A. Muddy waters: Elevating sediment input to coastal and estuarine habitats. Front. Ecol. Environ. 2004, 2, 299–306. [Google Scholar] [CrossRef]
  82. Braga, F.; Zaggia, L.; Bellafiore, D.; Bresciani, M.; Giardino, C.; Lorenzetti, G.; Maicu, F.; Manzo, C.; Riminucci, F.; Ravaioli, M.; et al. Mapping turbidity patterns in the Po river prodelta using multi-temporal Landsat 8 imagery. Estuar. Coast. Shelf Sci. 2017, 198, 555–567. [Google Scholar] [CrossRef]
  83. Maicu, F.; De Pascalis, F.; Ferrarin, C.; Umgiesser, G. Hydrodynamics of the Po River-Delta-Sea system. J. Geophys. Res. Ocean. 2018, 123, 6349–6372. [Google Scholar] [CrossRef]
  84. Queirós, A.M.; Fernandes, J.A.; Faulwetter, S.; Nunes, J.; Rastrick, S.P.; Mieszkowska, N.; Artioli, Y.; Yool, A.; Calosi, P.; Arvanitidis, C.; et al. Scaling up experimental ocean acidification and warming research: From individuals to the ecosystem. Glob. Chang. Biol. 2015, 21, 130–143. [Google Scholar] [CrossRef] [Green Version]
  85. Lopez, G.R.; Levinton, J.S. Ecology of deposit feeding animals in marine sediments. Q. Rev. Biol. 1987, 62, 235–260. [Google Scholar] [CrossRef]
  86. Töornroos, A.; Bonsdorff, E. Developing the multitrait concept for functional diversity: Lessons from a system rich in functions but poor in species. Ecol. Appl. 2012, 22, 2221–2236. [Google Scholar] [CrossRef] [Green Version]
  87. Salen-Picard, C.; Arlhac, D.; Alliot, E. Responses of a Mediterranean soft bottom community to short-term (1993–1996) hydrological changes in the Rhone river. Mar. Environ. Res. 2003, 55, 409–427. [Google Scholar] [CrossRef]
  88. Kristensen, E. Impact of polychaetes (Nereis spp. and Arenicola marina) on carbon biogeochemistry in coastal marine sediments. Geochem. Trans. 2001, 2, 92–103. [Google Scholar] [CrossRef] [PubMed]
  89. Shull, D.H.; Benoit, J.M.; Wojcik, C.; Senning, J.R. Infaunal burrow ventilation and pore-water transport in muddy sediments. Estuar. Coast. Shelf Sci 2009, 83, 277–286. [Google Scholar] [CrossRef]
  90. Kristensen, E.; Delefosse, M.; Quintana, C.O.; Flindt, M.R.; Valdemarsen, T. Influence of benthic macrofauna community shifts on ecosystem functioning in shallow estuaries. Front. Mar. Sci. 2014, 1, 41. [Google Scholar] [CrossRef] [Green Version]
  91. Mermillod-Blondin, F.; Rosenberg, R. Ecosystem engineering: The impact of bioturbation on biogeochemical processes in marine and freshwater benthic habitats. Aquat. Sci. 2006, 68, 434–442. [Google Scholar] [CrossRef]
  92. Chareopanich, C.; Montani, S.; Tsutsumi, H.; Matsuoka, S. Modification of chemical characteristics of organically enriched sediment by Capitella sp. I. Mar. Poll. Bull. 1993, 26, 375–379. [Google Scholar] [CrossRef]
  93. Dauwe, B.P.H.J.; Herman, P.M.J.; Heip, C.H.R. Community structure and bioturbation potential of macrofauna at four North Sea stations with contrasting food supply. Mar. Ecol. Prog. Ser. 1998, 173, 67–83. [Google Scholar] [CrossRef]
  94. Kinoshita, K.; Wada, M.; Kogure, K.; Furota, T. Microbial activity and accumulation of organic matter in the burrow of the mud shrimp, Upogebia major (Crustacea: Thalassinidea). Mar. Biol. 2008, 153, 277–283. [Google Scholar] [CrossRef]
  95. Braeckman, U.; Foshtomi, M.Y.; Van Gansbeke, D.; Meysman, F.; Soetaert, K.; Vincx, M.; Vanaverbeke, J. Variable importance of macrofaunal functional biodiversity for biogeochemical cycling in temperate coastal sediments. Ecosystems 2014, 17, 720–737. [Google Scholar] [CrossRef]
  96. Aller, R.C. Interactions between bioturbation and Mn cycling in marine sediments. EOS Transact. Am. Geophys. Union 1988, 69, 1106. [Google Scholar]
Figure 1. Map showing the location of both study areas: (a) the Po River prodelta and (b) the area nearby the two outfalls of Servola sewage plant (Gulf of Trieste).
Diversity 15 00449 g001
Figure 2. Pie charts representing the proportion of polychaetes, mollusks, crustaceans, echinodermata, and other groups for both study areas. The values close to the pie charts indicate total abundance.
Diversity 15 00449 g002
Figure 3. Total bioturbation potential (BPc) and irrigation potential (IPc) of community and species number in different sampled areas.
Diversity 15 00449 g003
Figure 4. Boxplots showing the variability of bioturbation potential (BPc) and irrigation potential (IPc) of community at north and south for Po River coastal area (a,b), and at increasing distance from pipelines (<5, 25, 100, and >200 m) in the Gulf of Trieste (c,d).
Diversity 15 00449 g004
Figure 5. Relative frequencies (%) of scores belonging to reworking (a) and mobility (b) of bioturbation activities of community at north and south for Po River coastal area and at increasing distance from pipelines (<5, 25, 100, and >200 m) in the Gulf of Trieste. See Table S2 for scores.
Diversity 15 00449 g005
Figure 6. Relative frequencies (%) of scores belonging to burrow type (a), feeding type (b), and injection depth (c) of bio-irrigation activities of community at north and south for Po River coastal area and at increasing distance from pipelines (<5, 25, 100, and >200 m) in the Gulf of Trieste. See Table S2 for scores.
Diversity 15 00449 g006
Figure 7. Distance-based redundancy analysis (dbRDA) performed using BPi (a) and IPi (b) values of species selected by SIMPER and environmental variables for both sampling areas. Arrows indicate environmental variables: sand, silt, Total Organic Carbon (TOC), Total Nitrogen (TN), and the ratio between carbon and nitrogen (C:N). See Table S2 for species names.
Diversity 15 00449 g007
Table 1. Linear regression of bioturbation indices (BPc and IPc) as response variables and environmental parameters as predictor. R2: coefficient of determination; df: degrees of freedom; F and P give the calculated F value (F-test) and the corresponding probability associated with the null hypothesis. The negative linear regressions are in bold. TOC-Total Organic Carbon; C:N-carbon and nitrogen ratio.
AreaResponse VariablesPredictor VariablesR2dfFP
Po River prodeltaBPcClay0.741.720.71<0.01
IPcSand0.751.721.12<0.01
Clay0.791.726.65<0.01
C:N0.491.76.770.03
Diffusion zoneBPcSand0.561.1317.07<0.01
Silt0.571.1317.28<0.01
Clay0.531.1314.94<0.01
TOC0.291.135.440.03
IPcClay0.551.1316.3<0.01
TOC0.311.135.960.02
Silt0.611.1320.78<0.01
Sand0.61.1319.62<0.01
Disclaimer/Publisher’s Note: The statements, opinions and data contained in all publications are solely those of the individual author(s) and contributor(s) and not of MDPI and/or the editor(s). MDPI and/or the editor(s) disclaim responsibility for any injury to people or property resulting from any ideas, methods, instructions or products referred to in the content.

