

Do Deep Mitochondrial DNA Divergences within Intertidal Gastropods Reveal Phylogeographic Signals from Earlier Glacial Cycles?

Malacology Group, Australian Museum Research Institute, The Australian Museum, 1 William St., Sydney 2010, Australia
Diversity 2023, 15(3), 346; https://doi.org/10.3390/d15030346
Submission received: 25 December 2022
/
Revised: 23 February 2023
/
Accepted: 24 February 2023
/
Published: 1 March 2023
(This article belongs to the Special Issue Systematics, Phylogeography, Evolution and Conservation of Molluscs)
Abstract
:Climatic cycles have frequently been hypothesised to influence the phylogeography of temperate marine organisms through such factors as hydrological changes and landbridge formation at glacial maxima. However, it is rarely considered whether observed phylogeographic patterns are predominantly influenced by the most recent cycle or those that preceded it. Whether high genetic divergences within intertidal taxa provide an opportunity to investigate such questions is studied here. Three southeastern Australian gastropod taxa that exhibit such divergence were studied, namely, Ascorhis tasmanica, Phallomedusa solida and the regions’ two species of the genus Nerita. Maximum likelihood phylogenetic analyses revealed bootstrap-supported clades within Nerita atramentosa, N. melanotragus and P. solida each of which may have been influenced by climatically induced isolation in previous glacial cycles. These clades are all now very widely distributed within the ranges of their respective species. The loss of variants resulting in the divergence of the haplotypes in the clades may be stochastic but was more likely due to selection, at least for P. solida. Ascorhis tasmanica was revealed to have a comparatively large number of sporadically distributed divergent groups; however, their evolution may have been more influenced by factors other than climate cycles.
1. Introduction
Climatic cycles have frequently been hypothesised to influence the phylogeography of temperate marine organisms through such factors as hydrological changes and landbridge formation at glacial maxima. However, it is less often considered whether observed phylogeographic patterns are predominantly due to the most recent cycle or those that preceded it. The best systems for approaching such questions would be expected to be well-studied regions that have taxa showing patterns of deep genetic divergences likely to have been generated at earlier times.
The phylogeography of southeastern Australian coasts has been extensively studied as a model system for investigating the evolutionary effects of climatic cycles. A considerable fraction of the studied taxa exhibits genetic divergence between populations east and west of the transect from Wilsons Promontory to northeastern Tasmania [1,2]. This partitioning is usually discussed in relation to the geographic isolation potentially arising during climate cycles. A number of factors might contribute to such isolation. Because Bass Strait to the south of Victoria is shallow, it can be divided by the formation of landbridges between the mainland and the northeast of Tasmania at glacial maxima, of which there have been at least nine in the last 800,000 years [3]. At glacial maxima, the populations of temperate-adapted species may be genetically isolated by the lowering of sea surface temperatures, especially by northwards migration of the Southern Subtropical Front, the boundary between warmer sub-tropical and cooler Antarctic surface waters [4,5,6]. This could displace the range of the species so far north that they no longer have contact around the southern tip of Tasmania. Another complication that may prevent population connectivity is that emergent land extends to the south of Tasmania during glacial maxima. Furthermore, a long sandy stretch of coastline to the east of Wilsons Promontory in Victoria may act as a strong barrier to contemporary dispersal and gene flow [7]. Genetic isolation caused by such factors may induce geographical differences in the partition of variation, for instance through the appearance of new variants in only one of the isolated areas, or the loss of pre-existing types. When the isolating barriers are removed, gene flow may occur between the formerly separated populations as their ranges expand, if they have not become distinct species.
The patterns of variation in marine and estuarine taxa in southeastern Australia has been reviewed [1,2]. Some taxa do not show patterns that are clearly due to climate-cycle-induced isolation. However, the region also has a number of taxa exhibiting patterns of genetic variation which may be associated with climate cycles. These include the gastropods Scutus antipodes Montfort, 1810, Austrolittorina unifasciata (Gray, 1826) (both in [8]), Bembicium nanum (Lamarck, 1822), Haustrum vinosa (Lamarck, 1822) and Cellana tramoserica (Holten, 1802) (all in [7]) in which closely related genetic variants occur in very different frequencies to the east and west of Wilson’s Promontory. The transect between this promontory and norteastern Tasmania is more shallow than other parts of the Bass Strait, meaning that this is the first part of the landbridge across it to emerge as glaciations increases, and the last to be submerged as they recede. Microsatellite analysis of the bivalve Donax deltoides Lamarck, 1818 has also revealed clear demarcations of populations to the east and west of the promontory [9].
Southeastern Australia also has taxa that phylogeographic investigations have revealed to have high genetic divergence. These include the region’s two species in the gastropod Austrocochlea constricta (Lamarck, 1822) complex [10,11], its two species of the gastropod genus Nerita Linnaeus, 1758, N. melanotragus E. A. Smith, 1884 and N. atramentosa Reeve, 1855 [12], the chiton Plaxiphora albida (Blainville, 1825) [7], the estuarine panpulmonate Phallomedusa solida (E. von Martens, 1878) [13] and the barnacle Catomerus polymerus (Darwin, 1854) [7,14]. Another species which may have deep intra-specific divergences is the estuarine caenogastropod micromollusc Ascorhis tasmanica, which is represented in GenBank by very distinct sequences from the studies of Hershler et al. [15] and Zielske et al. [16]. However, the species has not yet been studied phylogeographically; thus, it has been included in this study.
Some of the taxa with deep divergences have been proposed to have had their evolution influenced by earlier climatic cycles [2,13,14]. However, this has not been critically examined. consequently, this investigation was performed to examine whether the phylogenetic relationships, demographic history or spatial distribution of deeply divergent clades or sub-clades within them, could potentially reveal phylogeographic signals of earlier climatic cycles. The investigation focussed on the gastropod taxa with divergent sequences, Nerita, Ascorhis tasmanica and P. solida. The phylogeography of the Austrocochlea constricta complex has been previously investigated. The two deeply divergent clades in the complex have been shown to be distinct species with largely non-overlapping ranges.
The observation of deeply divergent clades reflects the evolutionary loss of haplotypes that were intermediate in sequence between those that are now extant in a population. The loss may have occurred through stochastic processes, possibly with an increased rate due to bottlenecks if range shifts or reductions have been occasioned by climatic cycles. This process may have been repeated in different climatic cycles. In general, the random nature of this loss would suggest that the relative lengths of the branches leading to the clades in phylogenies would tend to not be much greater than other branches in the topologies. The loss of haplotypes may also be related to selective sweeps leading to the fixation of a sequence in one of the regions geographically isolated during glacial maxima. This would be hastened by the occurrence of simultaneous sweeps by different haplotypes in each of the isolated regions. A combination of stochastic loss on one side of a barrier and a selective sweep on the other could contribute to the development of deep divergences between clades, but the process would be much slower than if there were simultaneous sweeps.
Contemporary spatial patterning of genetic variation has been observed not only in the examples of closely related variants listed above, but also in the separation of divergent clades in Nerita, Plaxiphora and Catomerus [9,12,13]. Teske et al. [2] proposed that, generally, the persistence of a structure after the dissolution of isolating mechanisms may depend on the interactive effects of multiple factors including hydrology, temperature-related adaptation and diversifying selection and fitness-related competition. However, the applicability of the proposed interactive effects to deeply divergent clades is problematic. If the clades represent distinct species, the maintenance of geographic patterns after barrier dissolution may be explained by inter-species competition [17]. However, it is difficult to explain the maintenance of geographic divergent clade localisation within a single species. If the localisation has persisted through multiple climate cycles, there would have been repeated opportunities for its erosion via gene flow during each cycle. The localisation might have developed during the most recent cycle(s), but unusual circumstances seem to be needed for this to have occurred, for example, by selective sweeps occurring on both sides of an isolating barrier during a single cycle.
The Nerita of southeastern Australia were long thought to be only one species but are now proposed to be two, N. melanotragus and N. atramentosa, on the basis of opercular colour differences and high divergence of cytochrome c oxidase subunit I (COI) sequences [12,18]. There are very high divergences between populations on the mainland east (N. melanotragus) and west (N. atramentosa) of Wilsons Promontory in this gene [12]. Only one COI sequence from Tasmania [19] is presently available in GenBank, although Teske et al. [2] reported some analyses based on unpublished mitochondrial DNA data. Most but not all Nerita individuals from the east of the Tasmanian main island have the opercular colour characteristic of N. melanotragus, and most of those are from the north of N. atramentosa [20]. There is no apparent spatial separation on the islands between Wilsons Promontory and Tasmania based on opercular colour [21]. Hales [22] showed that the eastern species N. melanotragus is sometimes common somewhat to the west of Wilsons Promontory, at different tidal levels to N. atramentosa. Further investigation of DNA sequences in Nerita is desirable to confirm a species status by establishing the independent assortment of mtDNA and nuclear gene variation, to collect more data from Tasmania and to assess whether the distribution of mitochondrial DNA clades within each of the species is phylogeographically informative. More data are also needed for more northerly populations of N. melanotragus as few specimens from north of Sydney have been sequenced.
Phallomedusa solida is one of two species in the genus, the other being P. austrina Golding, Ponder and Byrne, 2007 which is found in northern Tasmania, western Victoria and South Australia [13]. Phallomedusa solida is found in Queensland, New South Wales, eastern and northen Tasmania and eastern Victoria [13]. Phallomedusa solida comprises two deeply divergent clades of COI sequences with almost complete range overlap. The limited available nuclear DNA data suggest that the clades belong to a single species but do not conclusively show this [13]. Further investigations are needed to confirm the species status of the clades.
The morphology of Ascorhis tasmanica was intensively studied by Ponder and Clark [23]. Ponder and Clark [23] described a related species A. occidua, Ponder and Clark, 1988, from the southern and western coasts of Australia, but found no evidence of additional species in populations on the eastern seaboard. There are large differences between the pair of sequences in GenBank from New South Wales [15] and the pair from Victoria [16].
Genetic divergences in these gastropod taxa were examined using DNA sequences from the nucleus and the mitochondria. The assortment of the variants in these two sequence classes were initially used to study species status. Then, the patterns of variation were examined phylogeographically and demographically to search for evidence of the possible effects of earlier glacial cycles. Such signals might potentially be revealed in the distribution of the clades within species, or sub-clades within them, or in differences between them in their demographic history. The distribution of the clades was particularly considered during the investigation to ascertain whether there were any relictual variation in localised regions that would be at threat from contemporary climate change.
2. Materials and Methods
2.1. Collections and DNA Sequencing
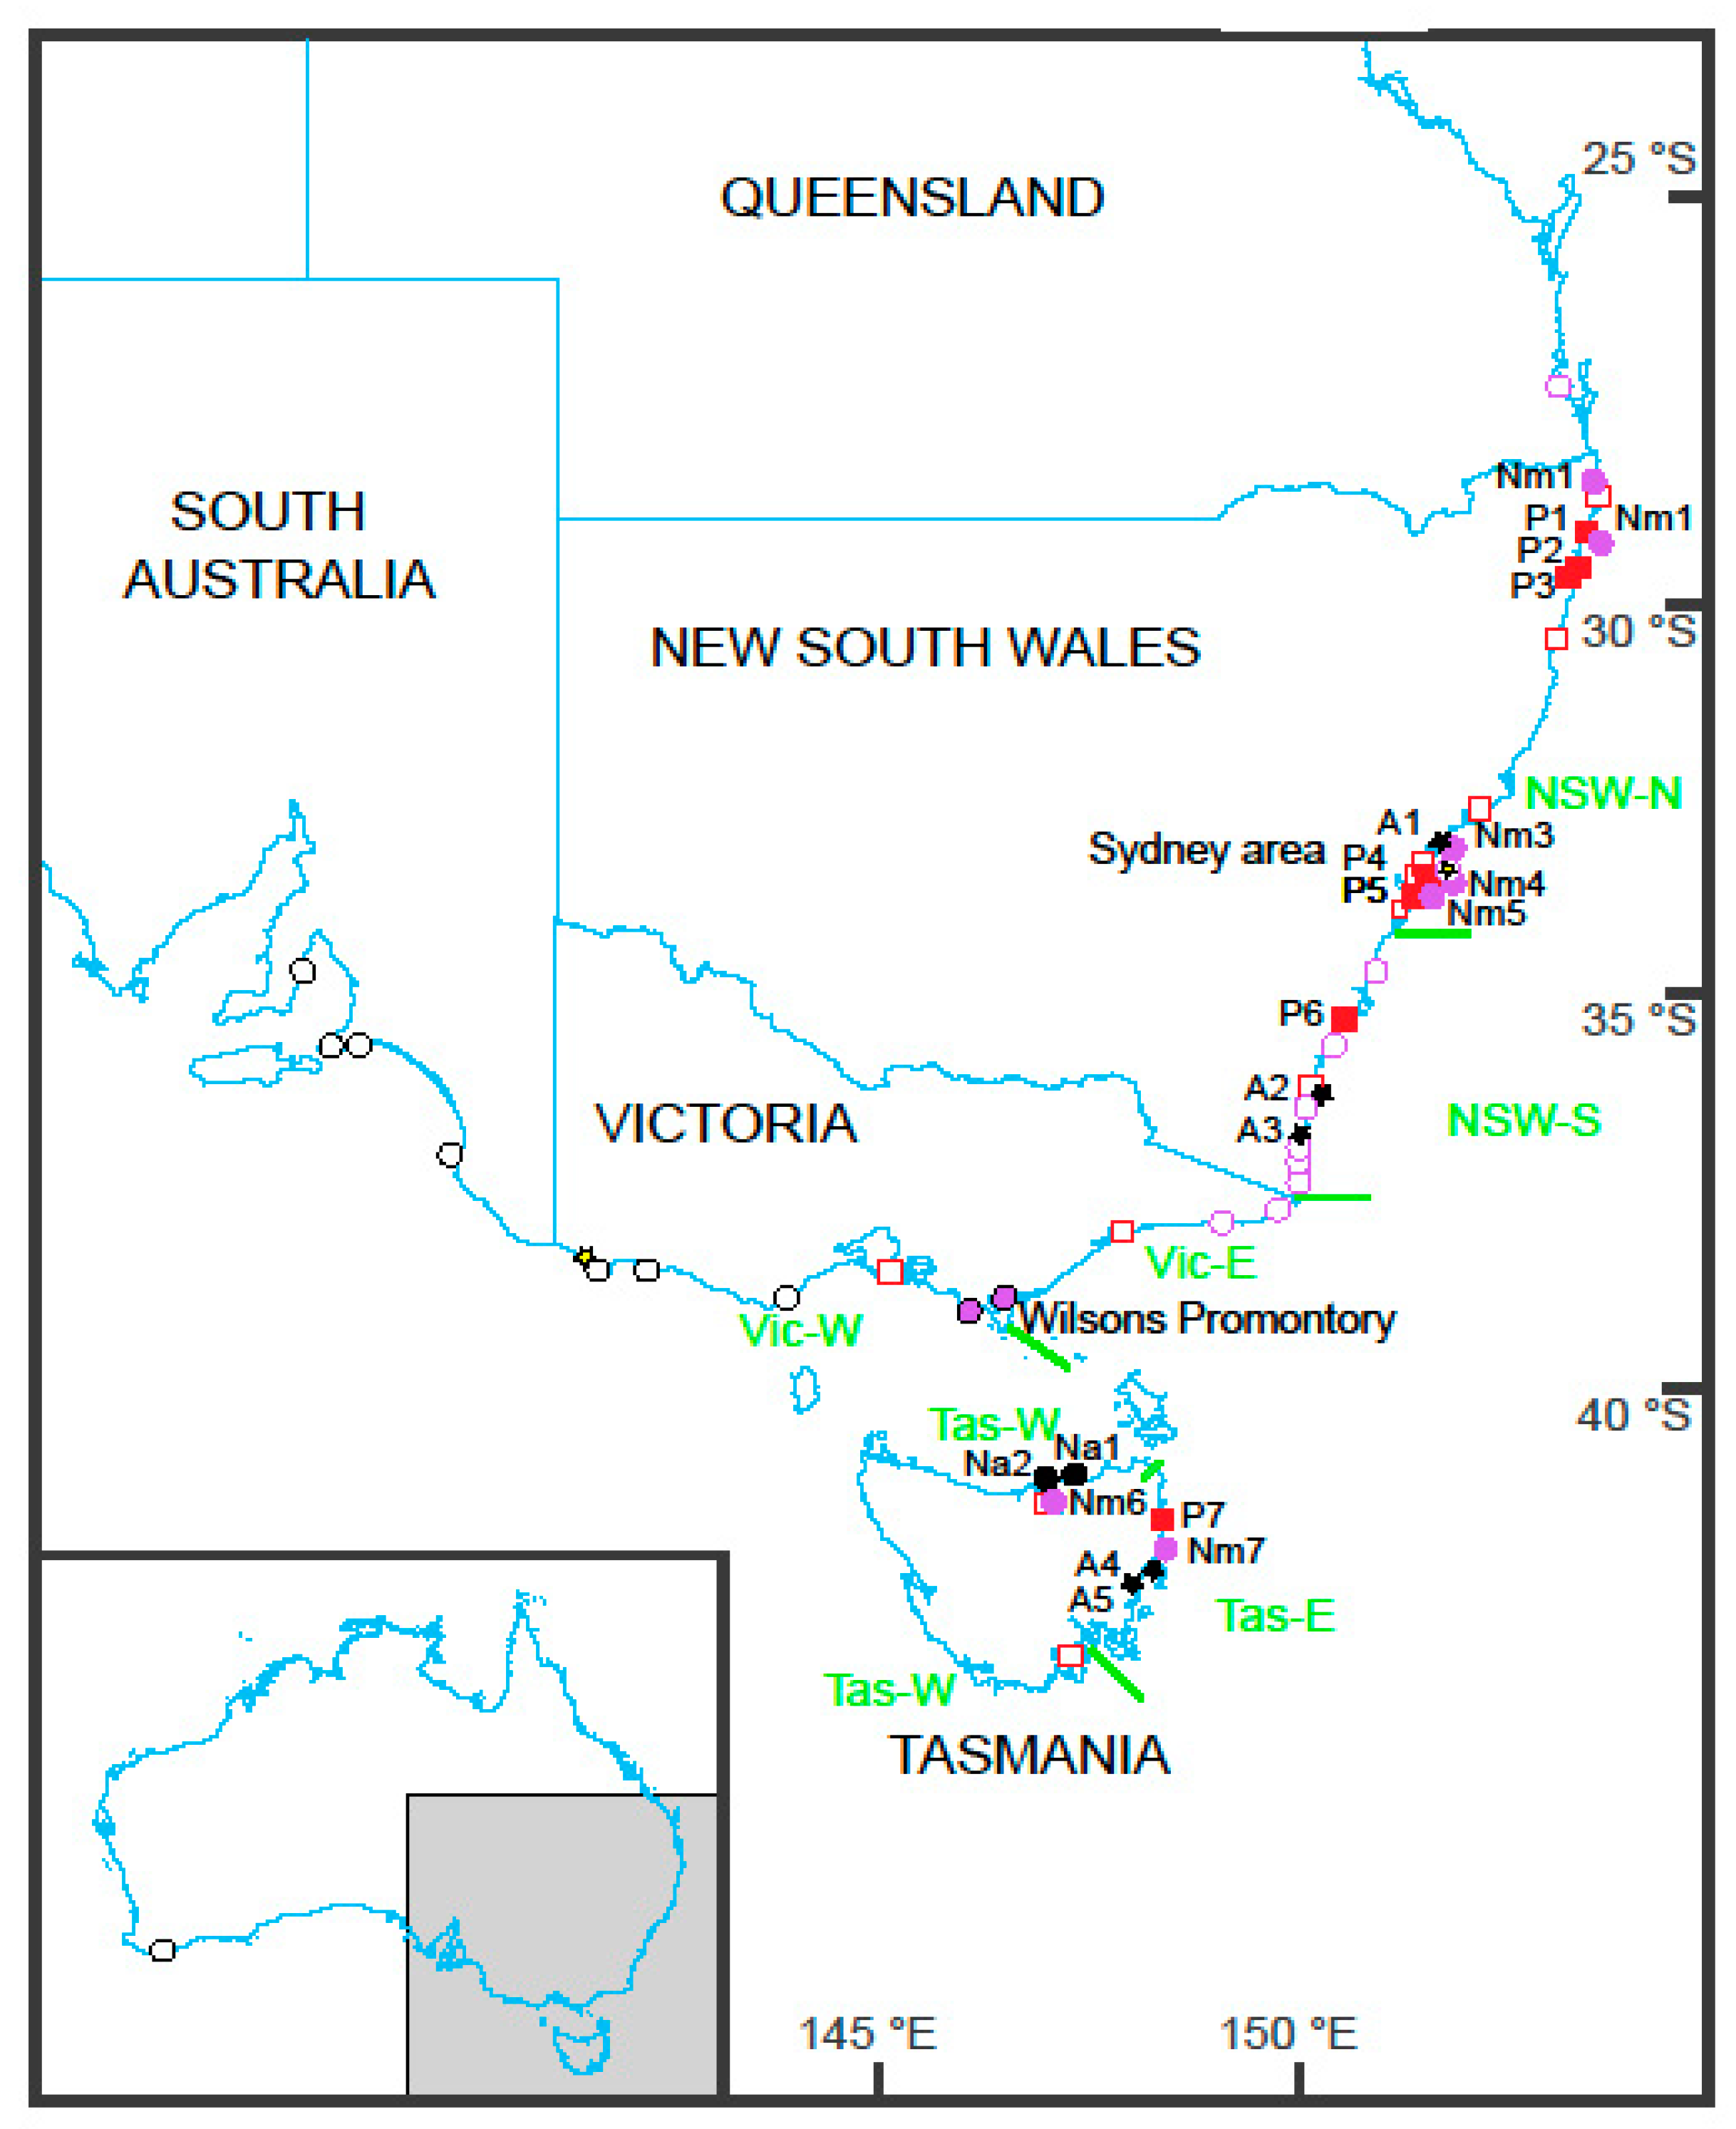
Specimens were collected from estuaries, lagoons or intertidal rocks in localities in New South Wales. Tasmania and Victoria (Table 1, Figure 1) and stored in 95% ethanol or frozen at −80 °C. DNA was extracted using QIAGEN DNeasyTM kits from the whole animal, including the shell, for A. tasmanica or from small amounts of tissue at the posterior end of the body (mantle, gills and foot muscle) for specimens of Nerita. DNA was eluted at the completion of the extraction into the QiagenAE buffer. DNA from specimens of P. solida was available from the study of Golding et al. [13].
PCR was conducted for the nuclear sequences ATP synthase subunit α, including parts of the CDS and the intron (abbreviated as ATPSα) and histone H3 (H3) and the mitochondrial sequences COI and nicotinamide adenine dinucleotide dehydrogenase subunit 1 (ND1).
PCRs were performed in 25 μL of BIOTAQ RED Taq Master Mix (Bio-Line, London, UK), 0.125 μL of each primer (at 100 pM per μL), 23.75 μL of purified water (from the RED Taq kit) and 1 μL of DNA (the original elution was diluted 1 in 8 for a few samples that required further dilution) in a total reaction volume of 50 μL.
The cycling profile for COI was: 93 °C for 3 min, 43 °C for 1 min, 72 °C for 1 min for one cycle; 93 °C for 30 s, 43 °C for 1 min, 72 °C for 1 min for 32 cycles; and 72 °C for 5 min for the final cycle. Aliquots (3 μL) of PCR products were run on 2% agarose gels and visualised using UV-fluorescence. Single-banded products were treated with ExoSAP-IT (USB Corporation, Cleveland, Ohio) and sequenced in both directions by Macrogen Inc (Geumchun-Gu, Korea) using the original primers individually. Amplifications of the other sequences were similar to annealing temperatures of 50 °C for ND1 and H3, and 54 to 56 °C for ATPSα.
PCR amplifications of COI were performed with the Folmer et al. [24] primers, those for ATPSα with the primers in Jarman et al. [25], and those for H3 with the H3NF/H3NR set of Colgan et al. [26] and ND1 with primers designed here: NAD1F: ACTTCATARGAAATNGTYTG; and NAD1R: TTTACYTTATTAGAACGNAARGG.
GenBank accession numbers for the COI sequences are OQ194189–OQ194192 for N. atramentosa, OQ1941869–OQ194188 for N. melanotragus, OQ300061 for P. solida and OQ192103–OQ192115 for A. tasmanica. Accession numbers for ATPSα are OQ291304 and OQ291305 for N. atramentosa, OQ291301–OQ291303 and OQ291306–OQ291308 for N. melanotragus, OQ302183–OQ302191 for P. solida and OQ291295–OQ291298 for A. tasmanica. Numbers for A. tasmanica H3 are OQ207667–OQ207671 and those for Nerita ND1 are OQ207657– OQ207659 for N. atramentosa and OQ207660–OQ207666 for N. melanotragus.
2.2. Sequence Editing and Alignment
Electropherograms were examined and sequences assembled using Sequencher, version 4.9 (Gene Codes Corporation, Ann Arbor, Michigan). Alignments were made with CLUSTALX [27] using the default parameters, and inspected in BioEdit [28]. A base in ATPSα was considered heterozygous if the peak height of the second most abundant nucleotide in the chromatogram was at least two-thirds of the height of the most abundant. Phase [29] as implemented in DnaSP ver. 5.1 [30] was used to predict haplotypes for variable positions of ATPSα using default parameters except that the number of iterations was increased to 200.
Datasets were compiled from newly collected sequences and those available in GenBank. Four COI sequences for A. tasmanica were added from GenBank [16,17]. Two were published by Hershler et al. [16]. AF129330 is from Careel Bay, near Sydney. AF129329 is recorded in GenBank as being from “13 Mile Creek” but is probably from Manly Lagoon, which is given as the locality of one of the sequences (accession number not specified) by Hershler et al. [16]. No ATPSα sequences were available for this species in GenBank.
For N. atramentosa and N. melanotragus, most GenBank COI sequences were from Waters et al. [12], with two others of each species from Frey and Vermeij [19], one N. melanotragus from Amin et al. [31] and one N. atramentosa from Williams and Ozawa [32]. Three ATPSα sequences were available from Frey and Vermeij [19], one from N. atramentosa and two from N. melanotragus. The ND1 analyses were based only on the sequences collected for this study as no GenBank sequences were available. The P. solida COI sequences of Golding et al. [13] were re-analysed here, with the addition of one newly collected sequence. No ATPSα sequences were available for this species in GenBank to add to those collected here; thus, analyses were restricted to the data collected here.
The provenance of specimens in the figures is generally listed by state. However, the three more intensively sampled states were each divided into two regions. NSW-N included localities in Sydney and northwards in New South Wales, and NSW-S included localities in southern New South Wales; the other regions were Vic-E (eastern Victoria), Vic-W (western Victoria), Tas-E (eastern Tasmania) and Tas-W (western Tasmania) (Figure 1).
2.3. Analyses
Phylogenetic analyses were conducted using maximum likelihood (“ML”) performed on the CIPRES data portal [33] using the RAxML Blackbox [34] with default assumptions (not using empirical data frequencies, no invariable sites). The three sets of codon positions were treated as separate partitions in the COI analyses. Partitioning was not applied to the ATPSα data because of the small size of the partial exon sequence included in the alignment. The numbers of required rapid bootstrap replicates was calculated by the majority rules extended (“MRE”) bootstopping criterion [35]. Trees were examined using Figtree v. 1.4.2. [http://tree.bio.ed.ac.uk/software/figtree/ (accessed on 18 November 2016)].
Pairwise Kimura 2-parameter genetic distances [36] between groups or species were calculated in MEGA 7 [37]. The rate variation among sites was modelled with a gamma distribution (shape parameter = 1). All ambiguous positions were removed for each sequence pair. Standard deviations were estimated using 200 bootstrap replicates.
DnaSP ver. 5.10.01 [30] was used to calculate measures of genetic variability including haplotype and nucleotide diversity and the Tajima D statistic [38]. The probability of obtaining observed values of the D statistic was reported directly by DnaSP. Mismatch analyses [39] were conducted in DnaSP and summarised by the R2 statistic [40], and the Θ and τ parameters of population size were calculated in DnaSP ver. 5.10.01 [30].
POPART [41] was used to the calculate haplotype networks shown in the Supplementary Figures. The TCS procedure [42] was used to construct these networks. Sequences with missing data were retained in the analyses, but sites lacking data for more than 5% of sequences were excluded.
Automatic partitioning of COI variation by ASAP [43] was used to investigate species status where this could not be determined by joint consideration of nuclear and mitochondrial sequences.
3. Results
3.1. Nerita
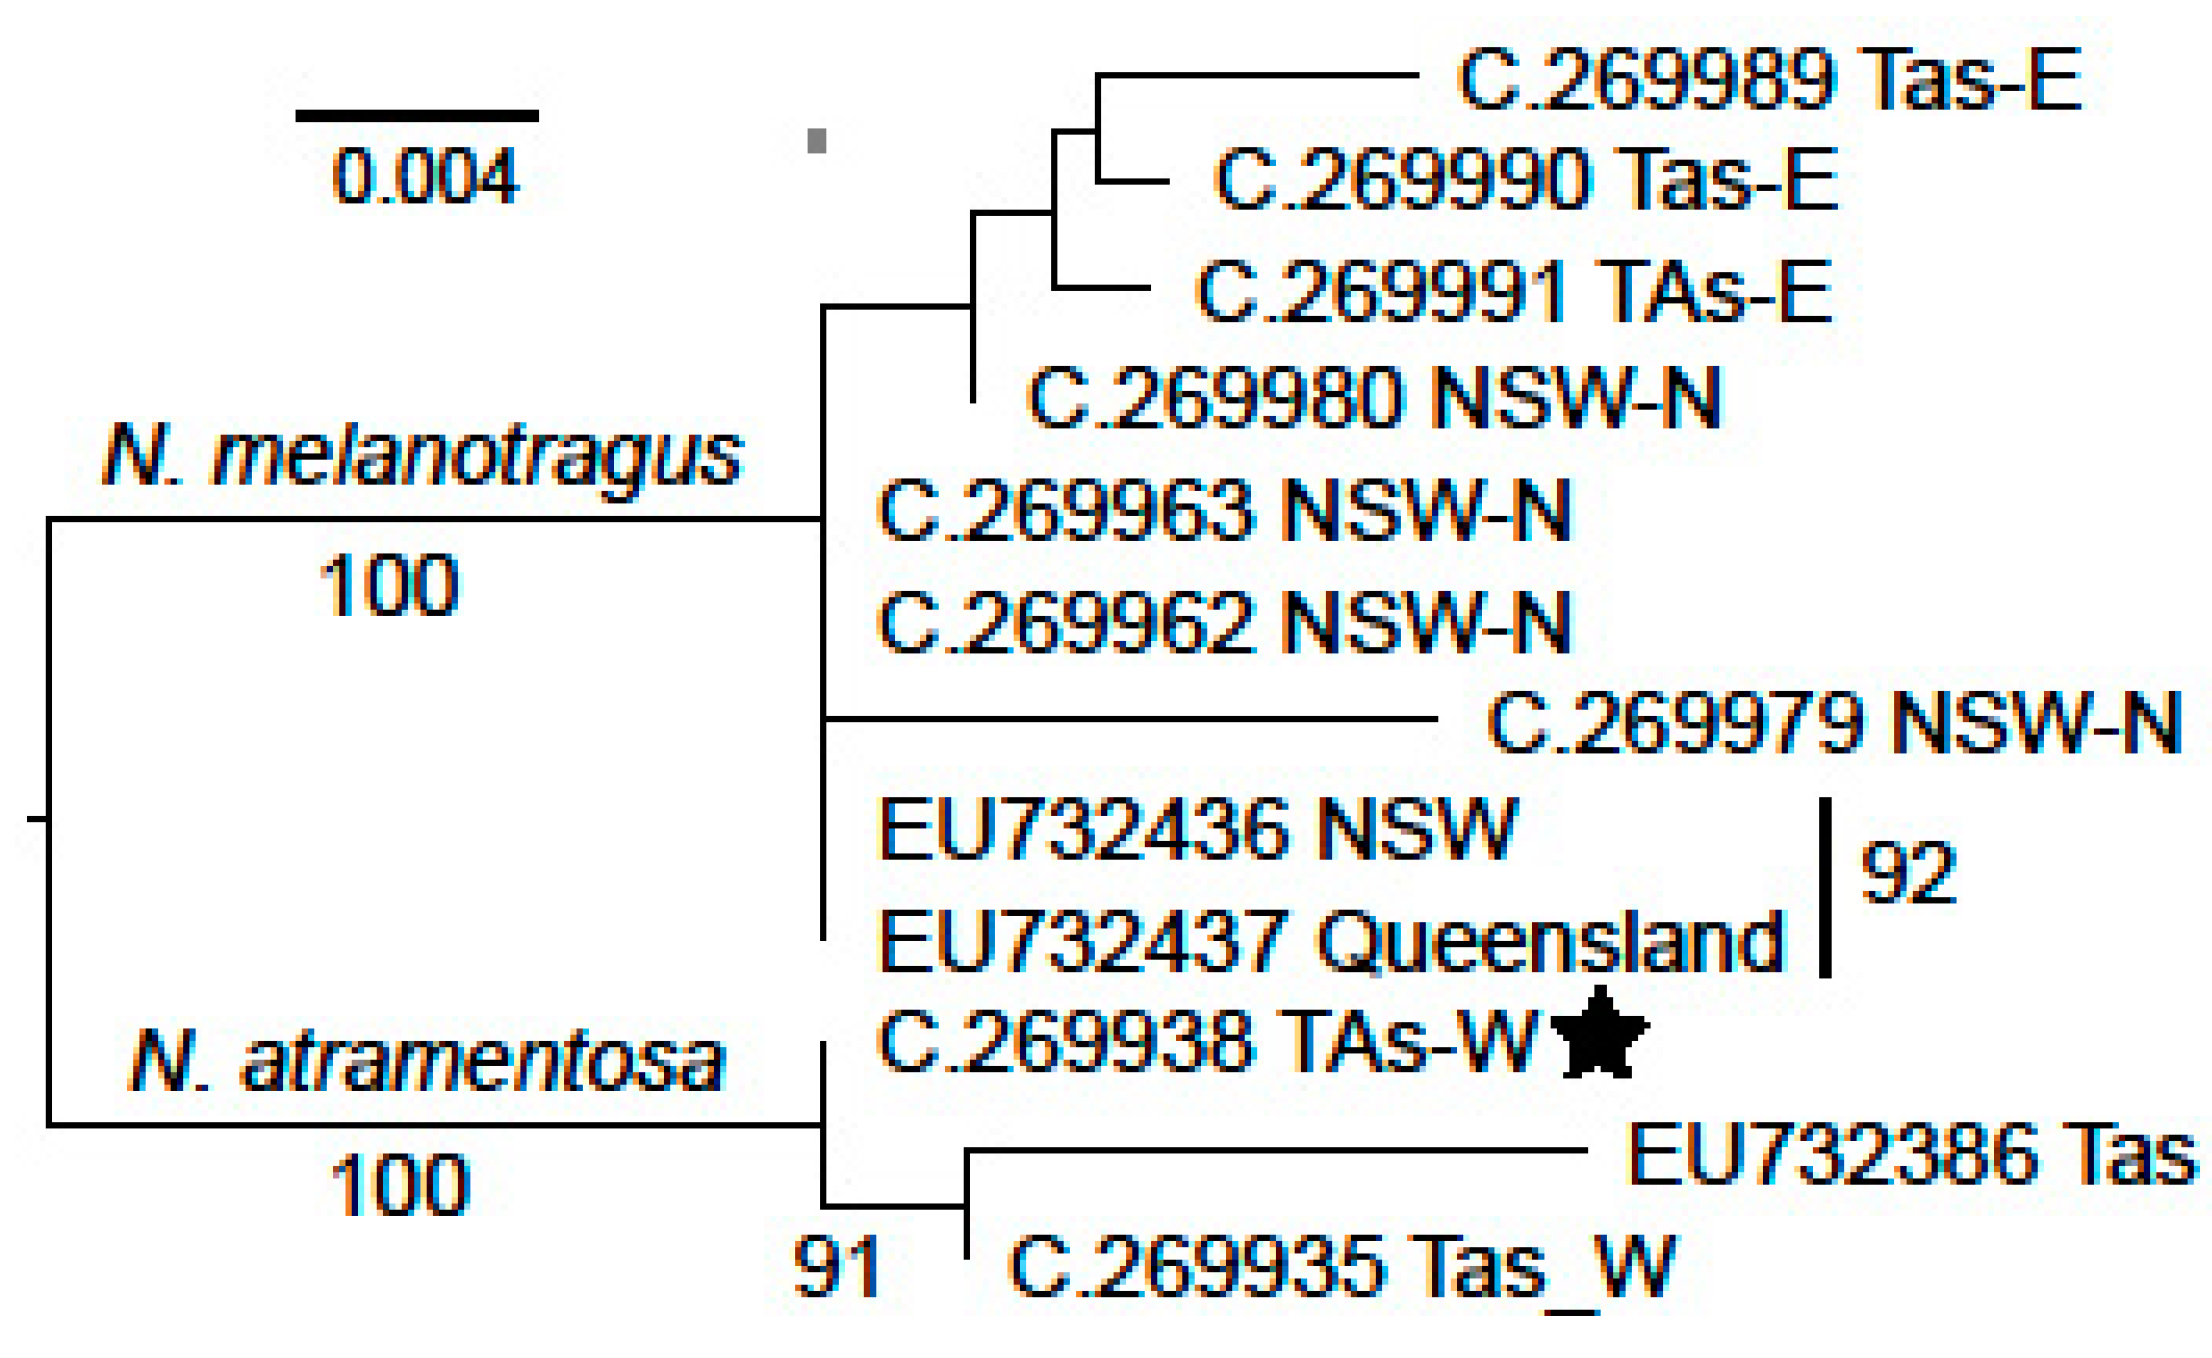
Specimens identified as N. melanotragus or N. atramentosa by COI sequences were distinguished by eight substitutions in the 410 base pair alignment of ATPSα sequences (Treebase). One of the differences was found in the coding region. The strict co-varying of COI and ATPSα sequence classes constituted a non-independent assortment of nuclear and mitochondrial genes which supports the recognition of N. melanotragus and N. atramentosa as two species. The two species were resolved as robustly supported clades in the ML analayis (Figure 2). Specimens identified genetically as N. melanotragus or N. atramentosa were also distinguished by the characteristic operculum colours of these species. Nucleotide divergences within each of the two Nerita species were similar for both COI and ATPSα (Table 2).
Data were collected from ND1 to explore whether they might be more variable than COI sequences and provide a finer scale resolution of mitochondrial DNA networks in Nerita. These preliminary data did not suggest this to be the case. The K2P mean pairwise distance between the species was considerable (0.142 +/− 0.023) but was low within species, being 0.006 +/− 0.003 for both N. melanotragus and N. atramentosa. Three haplotypes were observed in N. atramentosa (among three sequences), and four in N. melanotragus (seven sequences).
Some summary statistics for the COI sequence data (haplotype and nucleotide divergence) did not show great differences between N. atramentosa and N. melanotragus (Table 2). However, significant differences were apparent in the average pairwise K2P distances for the species which were 0.018 +/− 0.082 for the former and 0.008 +/− 0.002 for the latter. The species also appeared to have different demographic histories. The Tajima D value was negative in both species, but was significantly so only in the latter, in which Θi and τ parameters were notably lower and higher, respectively, than in N. atramentosa.
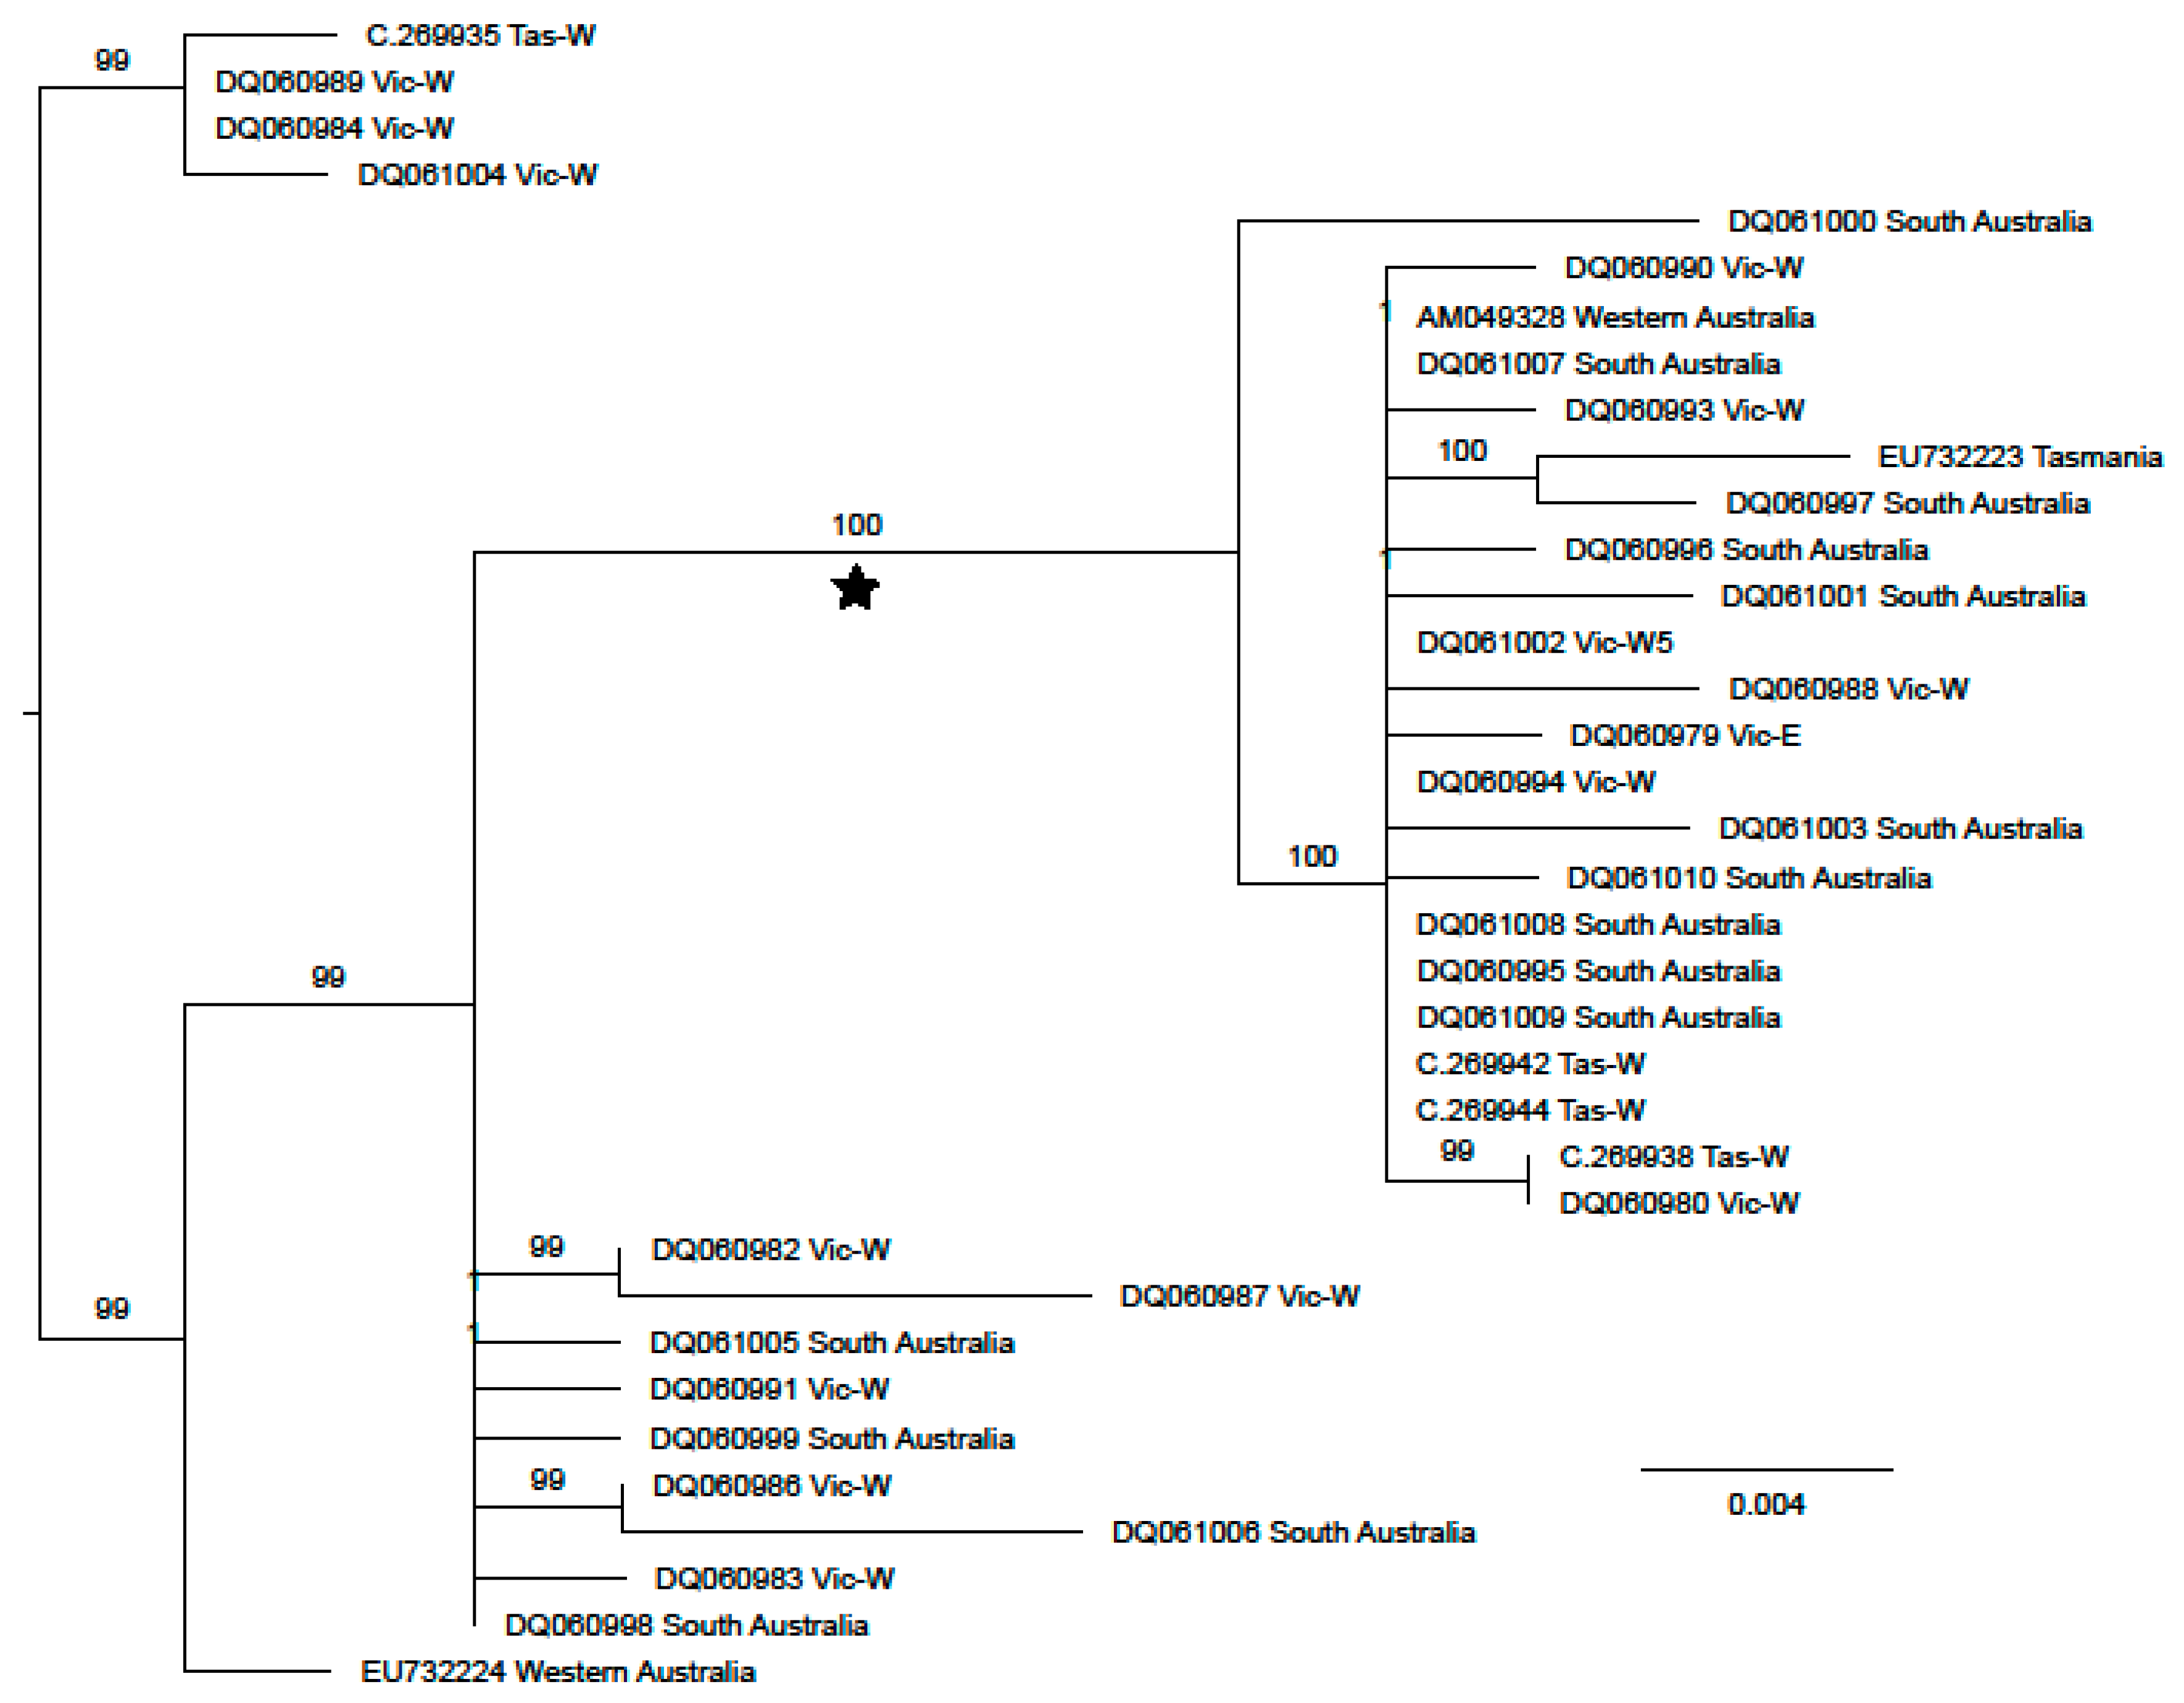
ML analyses conducted separately for each of the Nerita species revealed some evidence of structuring within the topologies (Figure 3 and Figure 4). This was more marked for N. atramentosa in which many sequences were resolved in a derived, strongly supported group, the members of which were separated by at least five mutational steps from all other N. atramentosa sequences (ca. 0.78% of the positions in the alignment). The average pairwise K2P distances between members of supported clade and other N. atramentosa sequences were 0.015 +/− 0.004. Within the clade, it was 0.003 +/− 0.001 and within non-members of the clade it was 0.007 +/− 0.002. Both members and non-members of the supported clade were distributed across the studied range of the taxon in Tasmania, Victoria, South Australia and Western Australia (Supplementary Figure S1).
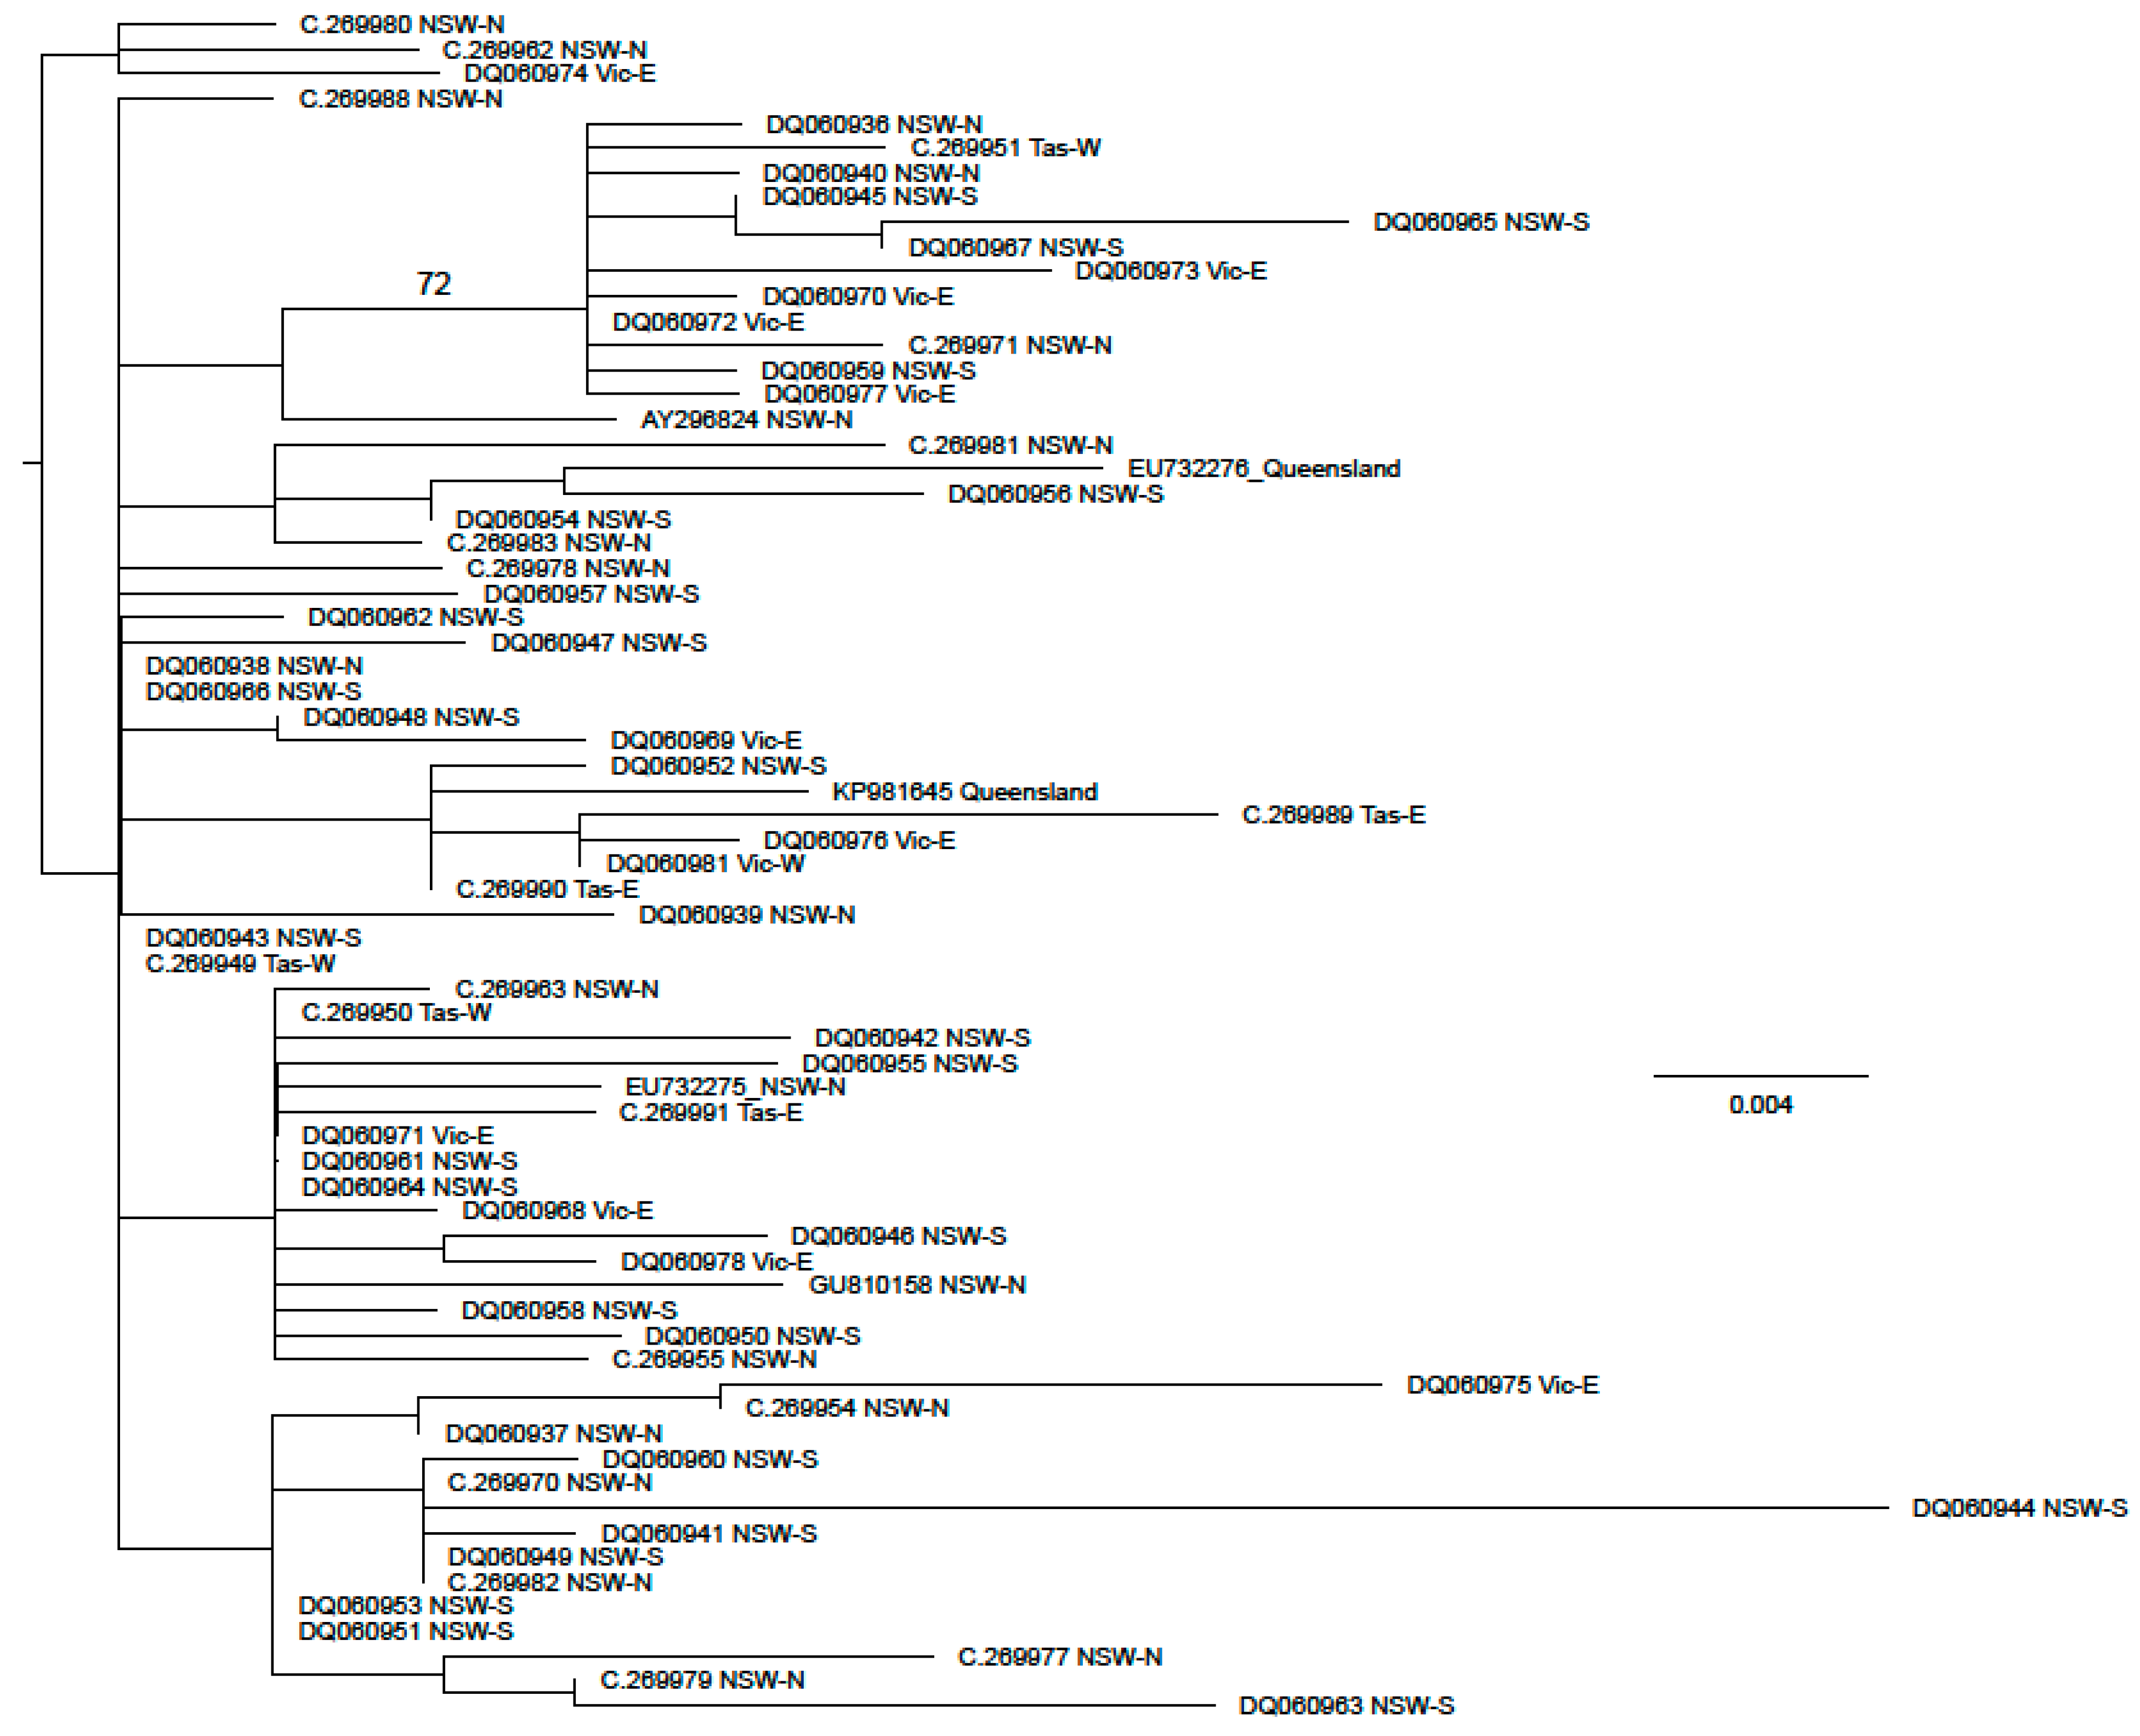
No strong phylogenetic structure was apparent in the analyses of N. melanotragus sequences. Only one group had bootstrap support of more than 70%. This was separated from the closest sequences by four mutational steps (Figure 4). There was no apparent geographic partitioning in the N. melanotragus phylogeny (Figure 4) or haplotype network (Supplementary Figure S2): all main groups were found in all eastern Australian regions. Few east coast Tasmania haplotypes have been sequenced but these are widely distributed in the network. The samples from northern New South Wales were also dispersed in the phylogeny.
3.2. Ascorhis tasmanica
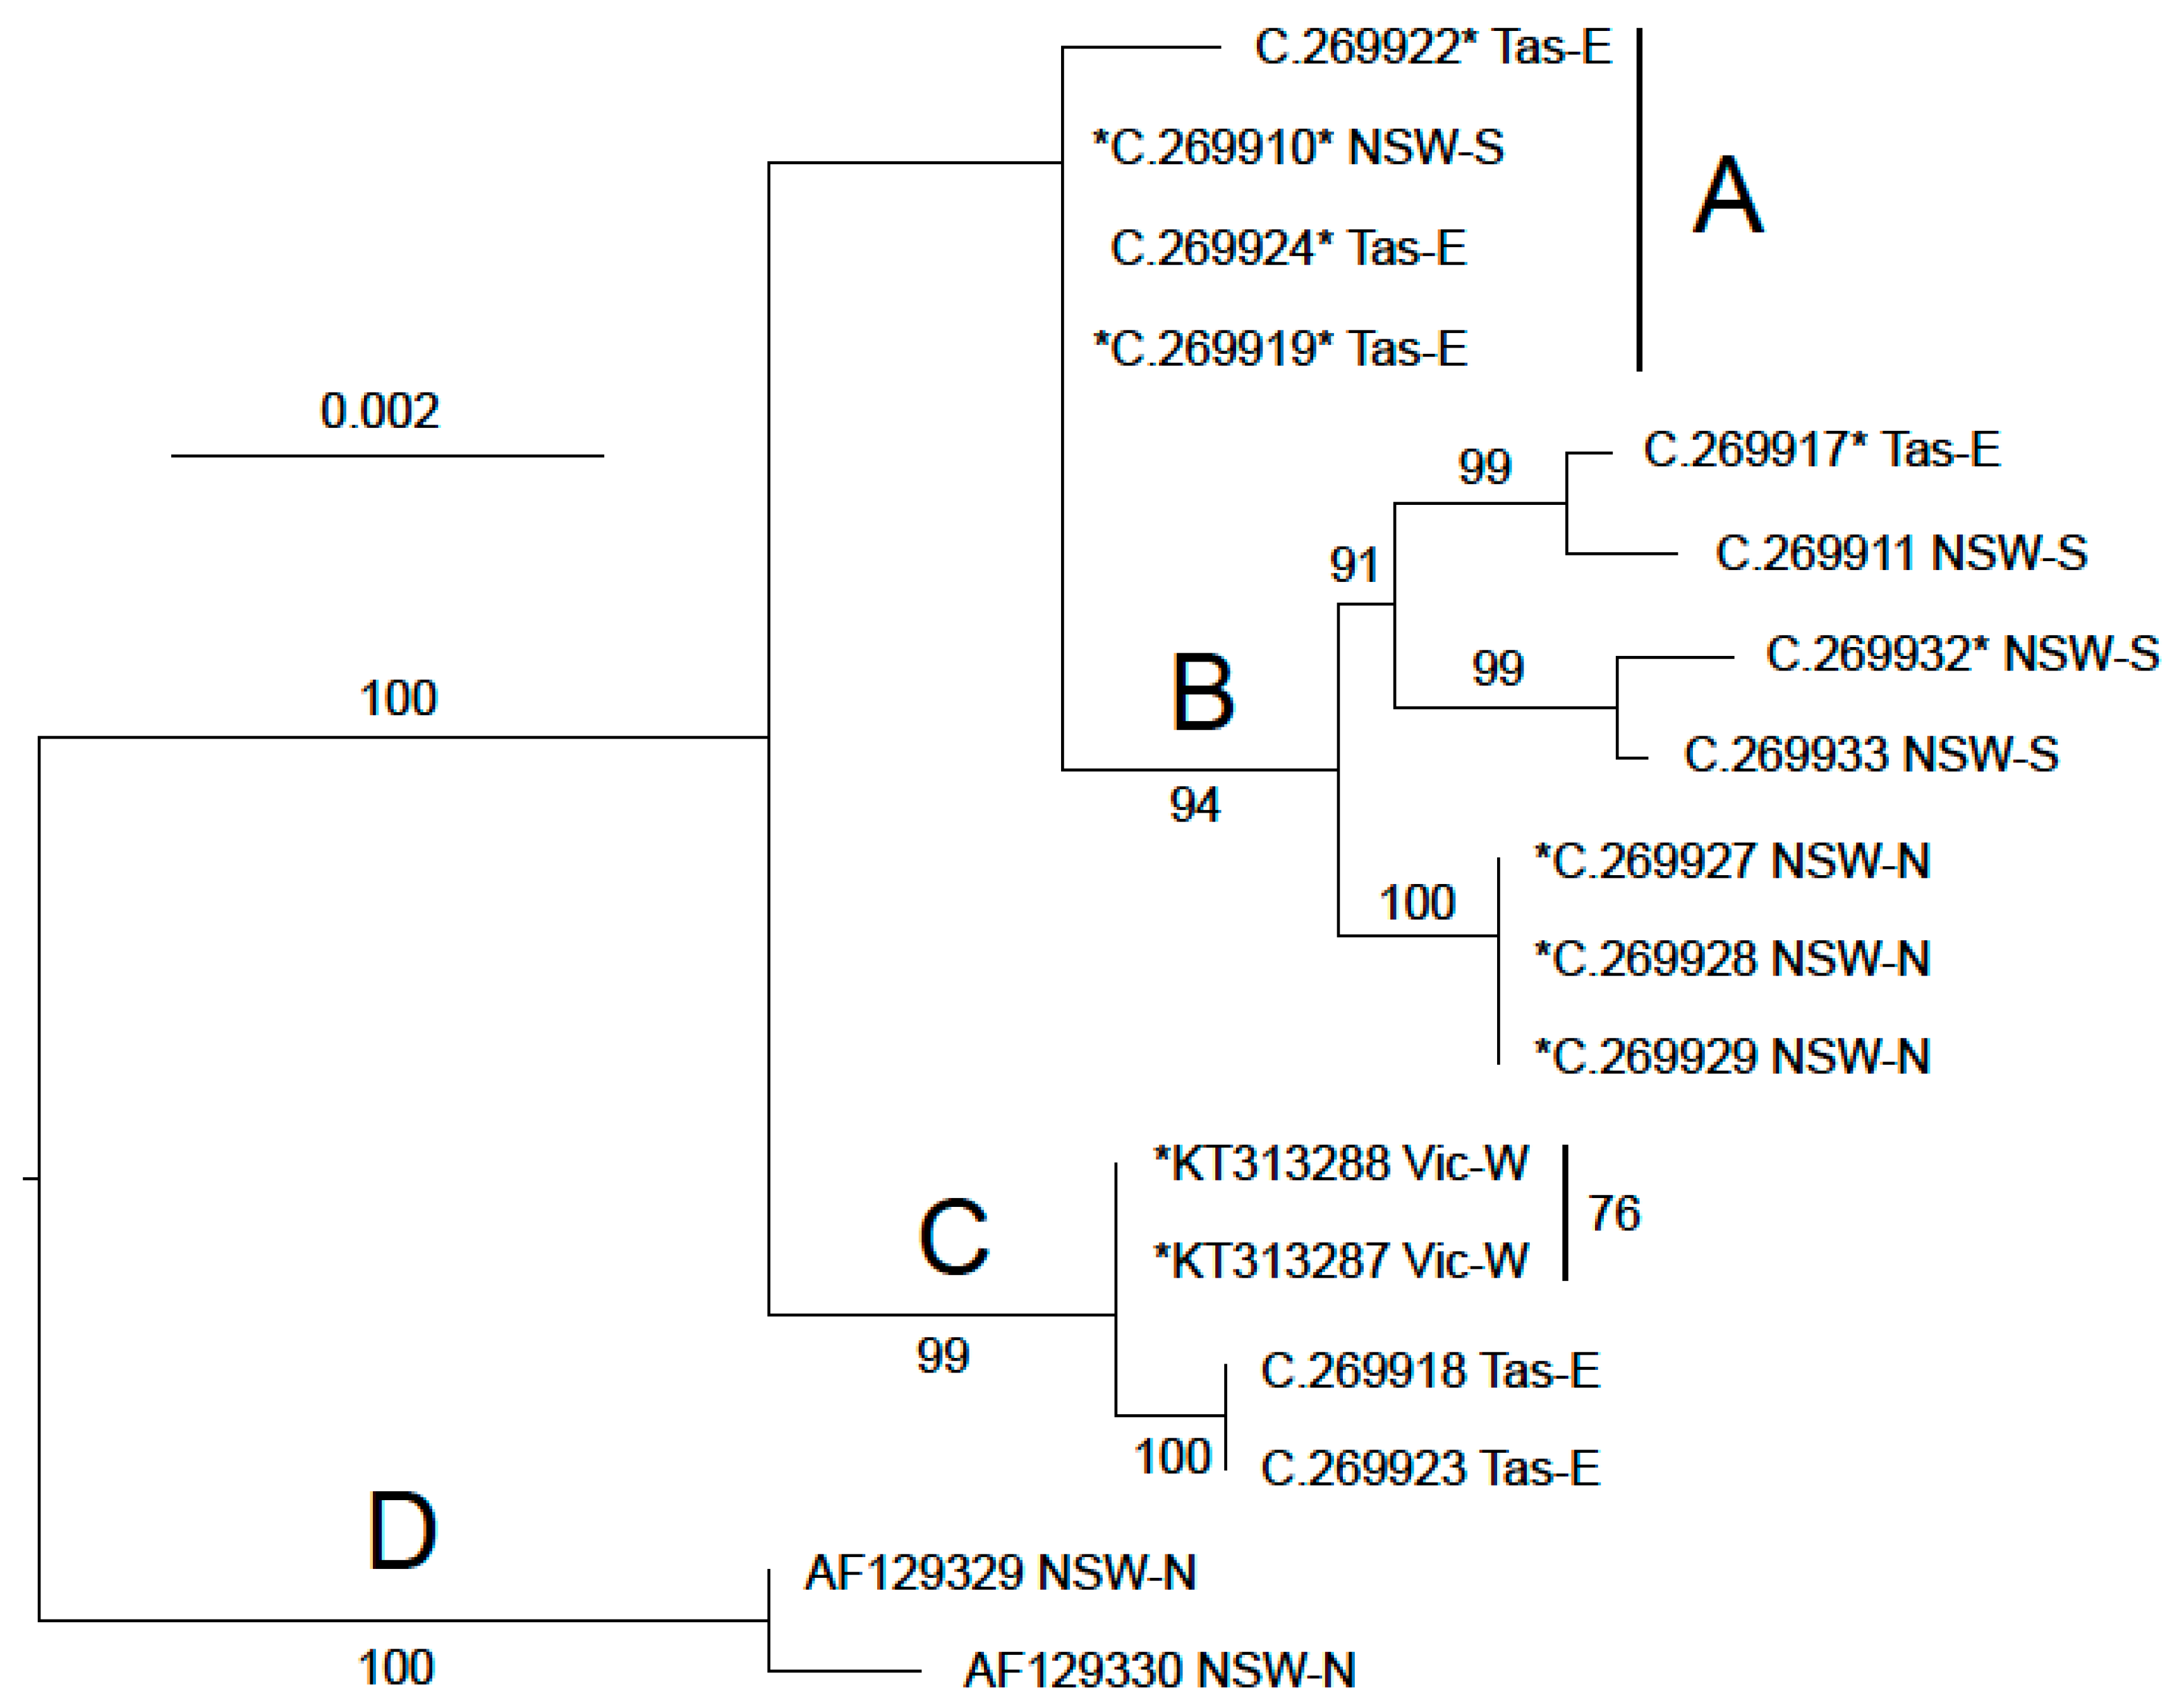
Four groups (labelled A–D, Figure 5) were defined following maximum likelihood analysis of the A. tasmanica COI sequences. Three were distinct, robustly supported clades. There were also four sequences that were closely related to each other, but which did not form a clade. All four groups were genetically distant from each other (Table 3, Supplementary Figure S3). The new specimens from the Sydney area (locality A1) differed from those previously collected from this area and deposited in GenBank (clade D). Rather, the new sequences were more similar to sequences from southern New South Wales and Tasmania (groups A and B). Group C was seen in both eastern Tasmania and Victoria.
There was little variation in four of the five sequences scored for ATPSα. These four were from clades A and B and had only one variable base which had different nucleotides in the pairs of samples from localities A4 and A5. The fifth sequence AMS C.269910 from A2 had an insert of five bases and up to nine other base differences from the other sequences. This may represent divergent northern ATPSα sequences which would imply that the nuclear and mitochondrial markers assorted independently, as the COI sequence from this specimen was identical to some sequences from localities A4 and A5 in Tasmania. H3 sequences showed very little variation suggesting that the groups in which it was sequenced (A, B and C) were conspecific. The only notable variant was that there was a polymorphism at one base position in the sequences from locality A1. The status of clade D was assessed by ASAP analysis [43]. The separation of the sequences into two partitions, clade D and the other sequences, was the third most likely outcome of the analysis. The two more likely outcomes, were contradicted by assortment analysis, also suggested that clade D may be a distinct species.
3.3. Phallomedusa solida
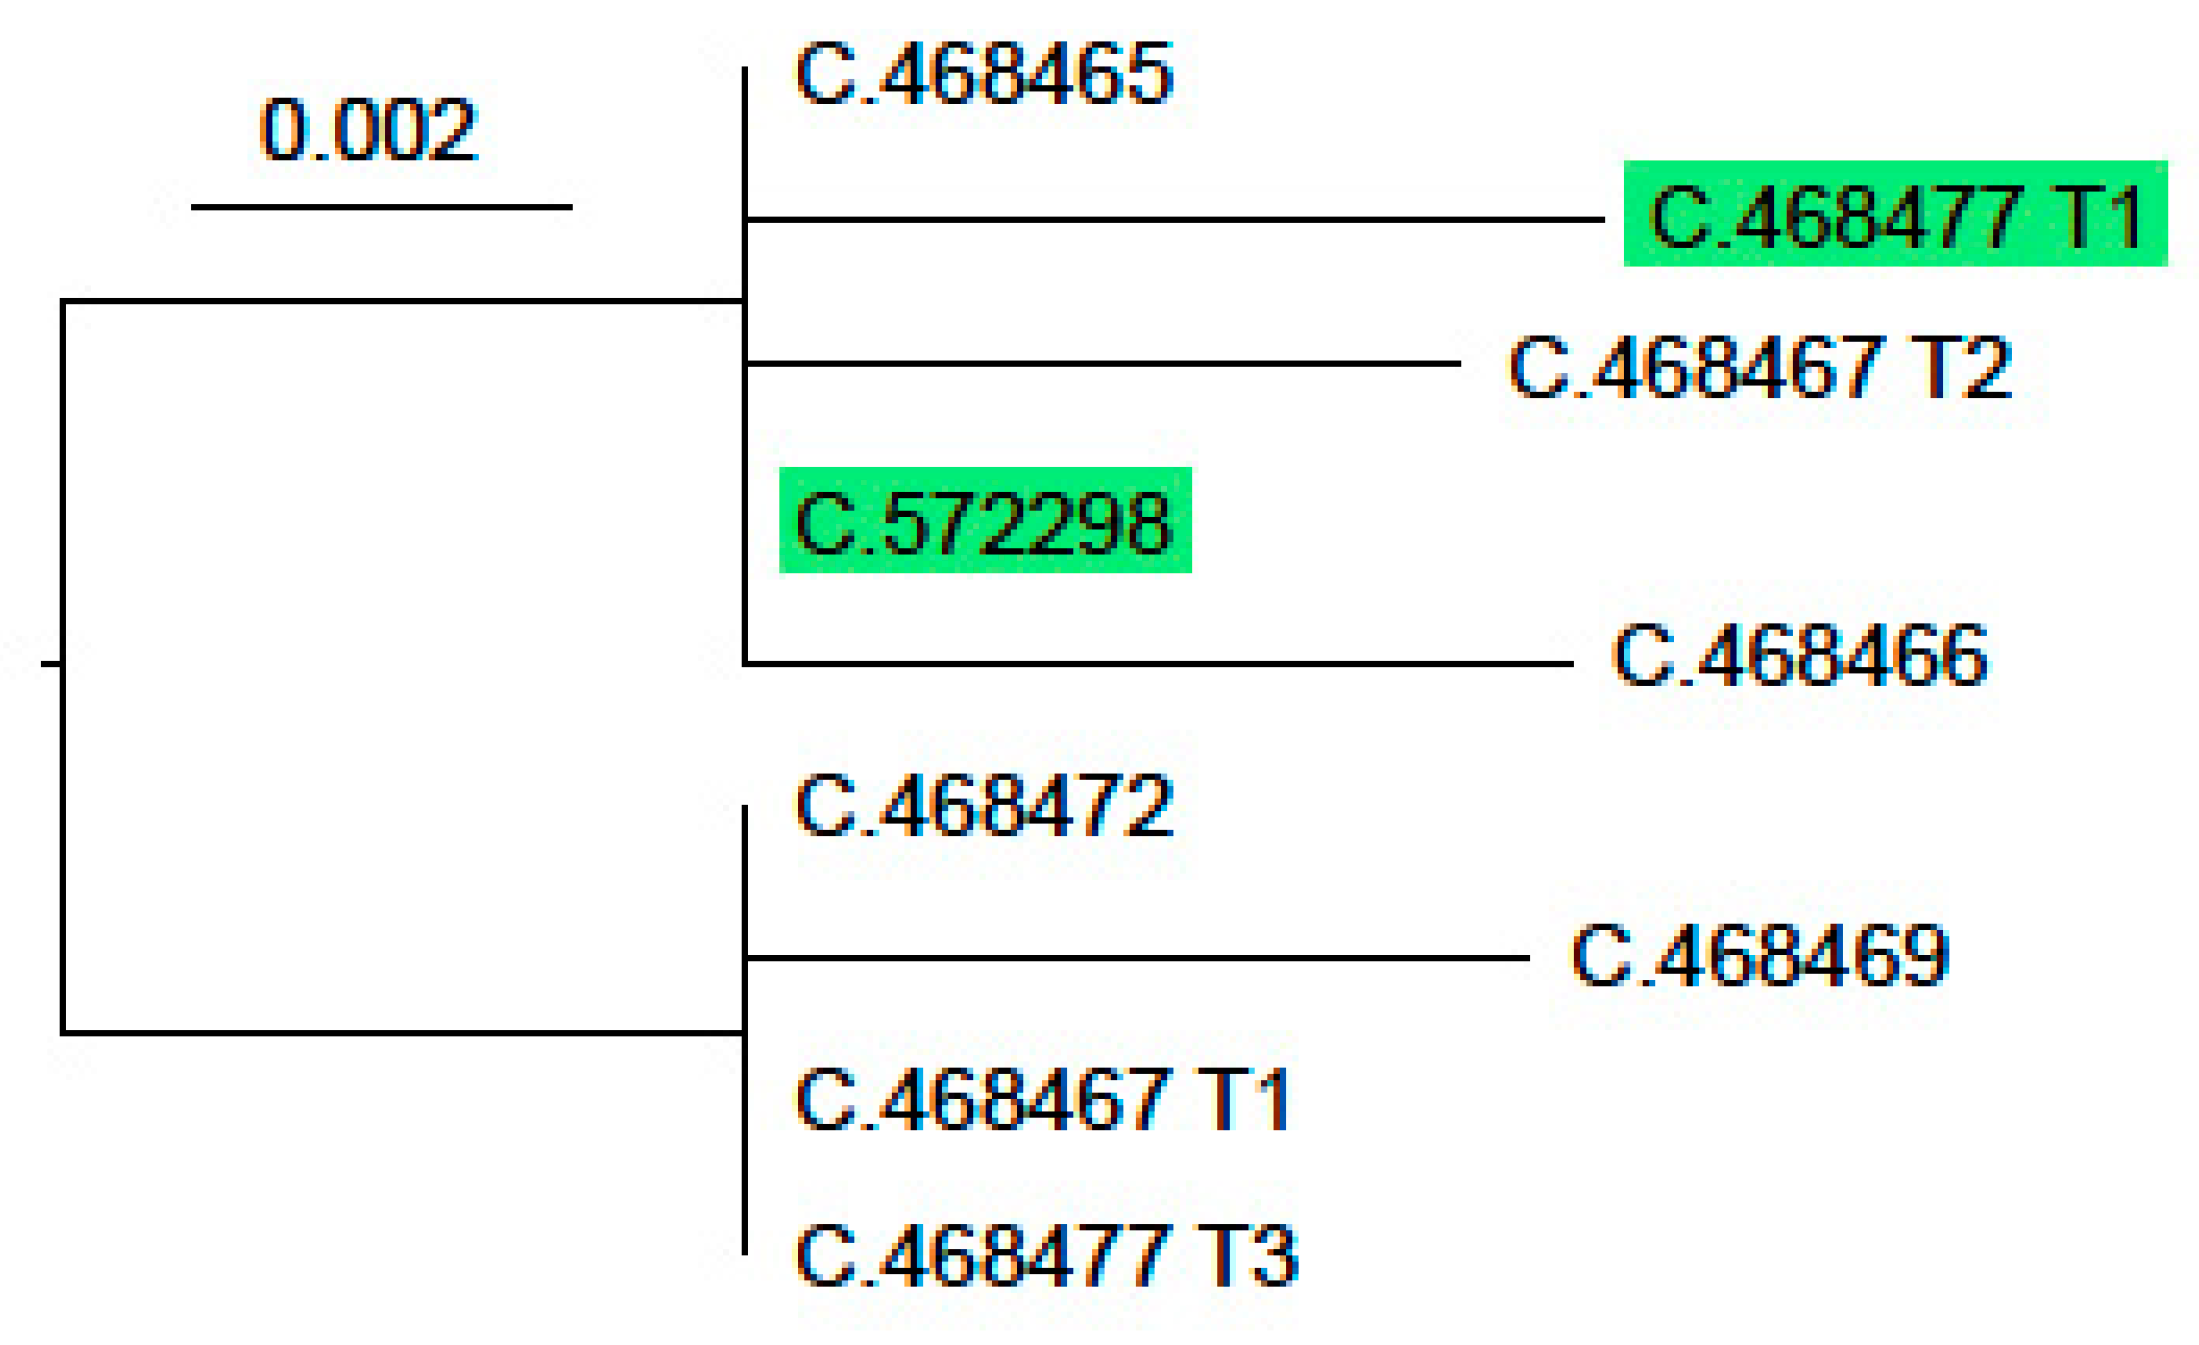
The ATPSα sequences in this species displayed low variation. Only three base positions had two or more variants each found in multiple individuals. Heterozygotes were observed at all three of these positions. All other variants were found in only one individual and as heterozygotes with one exception which was homozygous. Both COI clades were represented in the ATPSα sequences (seven clade A and two clade B). One clade B individual did have a unique sequence at the polymorphic sites, but all three of its variants at these were seen in at least one clade A individual. The ML analysis of the ATPSα sequences (Figure 6) illustrates the independent assortment of the nuclear and mitochondrial genes, indicating that the specimens were conspecific.
The re-analysis of the overall COI data showed two divergent groups of sequences in very close agreement with Figure 3 of Golding et al. [13] so it is not reproduced here. Statistical comparisons for the clades generally suggested that their demographic histories were similar. It was, however, notable that the average pairwise difference between sequences was lower in clade A and its Tajima’s D value was negative and highly significant, suggesting that it may have grown in size or that it had experienced positive selection on (some of) its variants. This was also suggested by the Tajima D value for clade B, but not significantly.
4. Discussion
The first aim of this study was to determine the implications of phylogenetic study of the studied nuclear and mitochondrial sequences for species status. The analyses showed that assortment of nuclear and mitochondrial genes in Nerita was not independent. This supports the distinction of two species of the genus in southern Australia as proposed by Waters et al. [12]. Assortment of the sequence types was independent within each of N. atramentosa and N. melanotragus for the clades in which this could be tested, particularly the large robustly supported clade in the former species. The observation of independent assortment supported the recognition of only one species in P. solida and in A. tasmanica. The possible exception to this was the divergent sequences of A. tasmanica found by Hershler et al. [15] from around Sydney for which neither ATPSα nor H3 sequences are available, and which ASAP analyses [43] suggested might be a distinct species.
There is considerable geographical separation of the two Nerita species in southeastern Australia, but it is not complete. Both species are found east and west of the transect from Wilsons Promontors to northeastern Tasmania ([2,20,21,22], this study). The species’ ranges may have been wholly disjunct at glacial maxima, although this has not been definitely shown and there is a possibility that populations (maybe small) of one or both species persisted both east and west of Wilsons Promontory in a particular cycle. This would potentially allow the generation of phylogeographic structure within species.
There was little evidence of spatial separation of clades within the studied Nerita. Teske et al. [2] also found no regional phylogeographic structure in N. atramentosa (including unpublished COI data from Tasmania). Nerita atramentosa contains a large, robustly supported divergent clade but this did not show geographic localisation as it was found in all studies regions of the species distribution, including the Western Australian specimen studied by Williams and Ozawa [32]. It might however be speculated that the phylogenetic divergence of this clade from other N. atramentosa sequences was generated by haplotype loss during geographical isolation in an earlier climatic cycle. Teske et al. [44] highlighted the importance of local counter currents and over multiple generations, these may have eroded such geographic isolation. The probability of erosion would be increased if multiple climate cycles have occurred since the origin of the isolation.
Similar arguments could be advanced about the origins of the only multi-member bootstrap-supported clade in N. melanotragus, which was also not geographically localised. However, its support was comparatively low (72%), reflecting lesser divergence from other sequences in the species.
The timing of divergence for the haplotype groups in N. atramentosa might also be speculated. Assuming divergence rate of 2% per million years which is in the mid-range of the values suggested for COI in gastropods [45,46], the minimum 0.78% separation between members of the divergent clade and other members of species would suggest a most recent common ancestor about 390 kA, less if the rate were higher and more if it were lower, as has been suggested for Neritidae [19]. Nurnberg et al. [47] gave the dates of the glacial maxima occurring in the last 400,000 years as 10–26, 60–75, 130–190, 242–302 and 333–362. The fourth of these, which was accompanied by the largest fall in sea surface temperatures, and the fifth may be the events more probably associated the divergence in N. atramentosa than more recent cycles.
The broad but sporadic overlap of the divergent haplotype groups in A. tasmanica and the relatively large numbers of these makes it difficult to find a simple interpretation of phylogeographic patterns in this species based solely on climate cycles. Even if climate cycles have a role, other factors may have more influence on the evolution of this species. In this context, it is noteworthy that although the species is generally restricted to the coasts, a short-lived population was found at Dalhousie Springs in central Australia, presumably originating from propagule transport by birds [23]. Such transport would tend to make the distribution of variation more sporadic. The patterns of distribution in A. tasmanica are reminiscent of those in Xenostrobus securis (Lamarck, 1819), an estuarine mussel in which COI variation is highly sporadically distributed [48]. That species also shows very high divergence between nearby water bodies which may be reflected in the distribution of clades A and D in A. tasmanica. It is possible that micro- or meso-scale geographic factors, accompanied by occasional long-distance dispersal, are important in at least some southeastern Australian estuarine molluscs, including A. tasmanica.
It has previously been shown that the two divergent clades among the COI sequences of Phallomedusa solida have ranges that overlap almost completely [13]. It might be hypothesised that the clades resulted from geographic isolation during earlie climate cycles. However, ascribing these origins to a particular climatic cycle would generally be very difficult. There are low numbers of unobserved (lost) haplotypes in the COI parsimony network except in the path between the divergent clades (Supplementary Figure S4) with correspondingly short branch lengths within the clades in phylogenetic analyses. This suggests that the divergence between the two main clades in this species is not predominantly due to stochastic processes. The divergence between the clades is 3.5%, which at a rate estimate of 2% per million years [45,46] would suggest an origin dated at more than one and a half million years ago. This period encompasses numerous climatic cycles [3], so that it would be difficult to identify those that had most influence in the evolution of this species.
In summary, the results of the present investigations suggest that there are clades within at least two species, N. atramentosa and P. solida, and possibly a third, N. melanotragus, that may have been influenced in their evolution by climate cycles before the most recent. It is unlikely that it will become possible to specify with certainty the cycles that have had most influence. However, improvements in the estimation of the rate of molecular evolution and developments in the evolutionary significance of the distribution of topological branch lengths [49] may show which cycles are most likely to have had most impact. The broad distribution of the divergent clades within the Nerita species and P. solida suggest that they do not have a high risk of extinction by contemporary climate change. This is more likely to occur among the divergent clades of A. tasmanica. Further study of this species is, by analogy with X. securis [48], likely to reveal divergent clades of very limited distribution which may be susceptible to either local or global disturbance.
Supplementary Materials
The following supporting information can be downloaded at: https://www.mdpi.com/article/10.3390/d15030346/s1, Figure S1: Nerita atramentosa COI haplotype network, Figure S2: Nerita melanotragus COI haplotype network, Figure S3: Ascorhis tasmanica COI haplotype network, Figure S4: Phallomedusa solida COI haplotype network.
Funding
This research received no external funding.
Institutional Review Board Statement
Collections were undertaken with permissions granted by F86/2163(A) (New South Wales Fisheries Research Permit), 7118 (Tasmania DPIW permit) and RP972 (Victoria General Research Permit) and experiments conducted according to the purposes allowed by these permits. Animal Care and Ethics Committerr approval is not needed for research on gastropods in Australia.
Data Availability Statement
All sequences, including those newly collected here are available in GenBank. The sequence alignment matrices and maximum likelihood trees are available as grouped analyses in the Treebase project http://purl.org/phylo/treebase/phylows/study/TB2:S30128 (accessed on 23 February 2023).
Acknowledgments
I thank Pam Da Costa and Tina Reutelshöfer for assistance with DNA sequencing and Tina Reutelshöfer and Edwina Rickard for assistance with field collection. I thank Mandy Reid and Alison Miller for collection curation and registration of specimens at the Australian Museum. I am very grateful to two anonymous reviewers for their insightful and helpful comments on the previous version of the manuscript.
Conflicts of Interest
The author declares no conflict of interest.
References
- Colgan, D.J. Marine and estuarine phylogeography of the coasts of south-eastern Australia. Mar. Freshw. Res. 2015, 67, 1597–1610. [Google Scholar] [CrossRef]
- Teske, P.R.; Sandoval-Castillo, J.; Waters, J.; Beheregaray, L.B. An overview of Australia’s temperate marine phylogeography, with new evidence from high-dispersal gastropods. J. Biogeogr. 2017, 44, 217–229. [Google Scholar] [CrossRef]
- Siddall, M.; Chappell, J.; Potter, E.K. Eustatic sea level during past interglacials. Dev. Quatern. Sci. 2007, 7, 75–92. [Google Scholar]
- Lawver, L.A.; Gahagan, L.M. Evolution of Cenozoic seaways in the circum-Antarctic region. Palaeogeog. Palaeoclimatol. Palaeoecol. 2003, 198, 11–37. [Google Scholar] [CrossRef]
- McKay, R.; Naish, T.; Carter, L.; Riesselman, C.; Dunbar, R.; Sjunneskog, C.; Winter, D.; Sangiorgi, F.; Warren, C.; Pagani, M.; et al. Antarctic and Southern Ocean influences on Late Pliocene global cooling. Proc. Natl. Acad. Sci. USA 2012, 109, 6423–6428. [Google Scholar] [CrossRef] [Green Version]
- Sikes, E.L.; Howard, W.R.; Samson, C.R.; Mahan, T.S.; Robertson, L.G.; Volkman, J.K. Southern Ocean seasonal temperature and Subtropical Front movement on the South Tasman Rise in the late Quaternary. Paleoceanography 2009, 24, PA2201. [Google Scholar] [CrossRef]
- Ayre, D.J.; Minchinton, T.E.; Perrin, C. Does life history predict past and current connectivity for rocky intertidal invertebrates across a marine biogeographic barrier? Mol. Ecol. 2009, 18, 1887–1903. [Google Scholar] [CrossRef] [PubMed]
- Waters, J.M.; McCulloch, G.A.; Eason, J.A. Marine biogeographical structure in two highly dispersive gastropods: Implications for trans-Tasman dispersal. J. Biogeog. 2007, 34, 678–687. [Google Scholar] [CrossRef]
- Miller, A.D.; Versace, V.L.; Matthews, T.G.; Montgomery, S.; Bowie, K.C. Ocean currents influence the genetic structure of an intertidal mollusc in southeastern Australia–implications for predicting the movement of passive dispersers across a marine biogeographic barrier. Ecol. Evol. 2013, 3, 1248–1261. [Google Scholar] [CrossRef]
- Colgan, D.J.; Schreiter, S. Extrinsic and intrinsic influences on the phylogeography of the Austrocochlea constricta species group. J. Exp. Mar. Biol. Ecol. 2011, 397, 44–51. [Google Scholar] [CrossRef]
- Colgan, D.J. Inter-boundary comparison between Bass Strait and southeastern Tasmania reveals taxon-specific effects of phylogeographic determinants in marine Mollusca. Regional Stud. Mar. Sci. 2019, 25, 100449. [Google Scholar] [CrossRef]
- Waters, J.M.; King, T.M.; O’loughlin, P.M.; Spencer, H.G. Phylogeographical disjunction in abundant high-dispersal littoral gastropods. Mol. Ecol. 2005, 14, 2789–2802. [Google Scholar] [CrossRef] [PubMed]
- Golding, R.E.; Colgan, D.J.; Nelmes, G.; Reutelshöfer, T. Sympatry and allopatry in the deeply divergent mitochondrial DNA clades of the estuarine pulmonate gastropod genus Phallomedusa (Mollusca, Gastropoda). Mar. Biol. 2011, 158, 1259–1269. [Google Scholar] [CrossRef]
- York, K.L.; Blacket, M.J.; Appleton, B.R. The Bassian Isthmus and the major ocean currents of southeast Australia influence the phylogeography and population structure of a southern Australian intertidal barnacle Catomerus polymerus (Darwin). Mol. Ecol. 2008, 17, 1948–1961. [Google Scholar] [CrossRef]
- Hershler, R.; Liu, H.P.; Mulvey, M. Phylogenetic relationships within the aquatic snail genus Tryonia: Implications for biogeography of the North American Southwest. Mol. Phylogenet. Evol. 1999, 13, 377–391. [Google Scholar] [CrossRef] [Green Version]
- Zielske, S.; Ponder, W.F.; Haase, M. The enigmatic pattern of long-distance dispersal of minute freshwater gastropods (Caenogastropoda, Truncatelloidea, Tateidae) across the South Pacific. J. Biogeogr. 2017, 44, 195–206. [Google Scholar] [CrossRef]
- Waters, J.M. Competitive exclusion: Phylogeography’s ‘elephant in the room’? Mol. Ecol. 2011, 20, 4388–4394. [Google Scholar] [CrossRef]
- Spencer, H.G.; Waters, J.M.; Eichhorst, T.E. Taxonomy and nomenclature of black nerites (Gastropoda: Neritimorpha: Nerita) from the South Pacific. Invert. Syst. 2007, 21, 229–237. [Google Scholar] [CrossRef]
- Frey, M.A.; Vermeij, G.J. Molecular phylogenies and historical biogeography of a circumtropical group of gastropods (Genus: Nerita): Implications for regional diversity patterns in the marine tropics. Mol. Phylogenett. Evol. 2008, 48, 1067–1086. [Google Scholar] [CrossRef]
- Waters, J.M. Marine biogeographical disjunction in temperate Australia: Historical landbridge, contemporary currents, or both? Div. Dist. 2008, 14, 692–700. [Google Scholar] [CrossRef]
- Grove, S.J. A Guide to the Seashells and other Marine Molluscs of Tasmania Web-Site. Available online: https://molluscsoftasmania.org.au/ (accessed on 22 December 2022).
- Hales, T.J. The family Neritidae in southern Australia. Mal. Soc. Australasia Newsl. 2021, 176, 9–10. [Google Scholar]
- Ponder, W.F.; Clark, G.A. A morphological and electrophoretic examination of Hydrobia buccinoides, a variable brackish-water gastropod from temperate Australia (Mollusca, Hydrobiidae). Aust. J. Zool. 1988, 36, 661–689. [Google Scholar] [CrossRef] [Green Version]
- Folmer, O.; Black, M.; Hoeh, W.; Lutz, R.; Vrijenhoek, R. DNA primers for amplification of mitochondrial cytochrome c oxidase subunit I from diverse metazoan invertebrates. Mol. Mar. Biol. Biotech. 1994, 3, 294–299. [Google Scholar]
- Jarman, S.N.; Ward, R.D.; Elliott, N.G. Oligonucleotide primers for PCR amplification of coelomate introns. Mar. Biotech. 2002, 4, 347–355. [Google Scholar] [CrossRef] [PubMed]
- Colgan, D.J.; Ponder, W.F.; Eggler, P.E. Gastropod evolutionary rates and phylogenetic relationships assessed using partial 28S rDNA and histone H3 sequences. Zool. Scr. 2000, 2, 29–63. [Google Scholar] [CrossRef]
- Thompson, J.D.; Gibson, T.J.; Plewniak, F.; Jeanmougin, F.; Higgins, D.G. The CLUSTAL X windows interface: Flexible strategies for multiple sequence alignment aided by quality analysis tools. Nucl. Acids Res. 1997, 25, 4876–4882. [Google Scholar] [CrossRef] [Green Version]
- Hall, T.A. BioEdit: A user–friendly biological sequence alignment editor and analysis program for Windows 95/98/NT. Nucl. Acids Symp. Ser. 1999, 41, 95–98. [Google Scholar]
- Stephens, M.; Smith, N.J.; Donnelly, P. A new statistical method for haplotype reconstruction from population data. Am. J. Hum. Genet. 2001, 68, 978–989. [Google Scholar] [CrossRef] [Green Version]
- Librado, P.; Rozas, J. DnaSP v5: A software for comprehensive analysis of DNA polymorphism data. Bioinformatics 2009, 25, 1451–1452. [Google Scholar] [CrossRef] [Green Version]
- Amin, S.; Prentis, P.J.; Gilding, E.K.; Collett, C.; Pavasovic, A. Comparative Transcriptome Analysis of Two Marine Gastropods (Nerita melanotragus and N. albicilla) Offers Novel Insights into Adaptation to Temperature Stress. Unpublished Reference in GenBank Accession Data 2016. Available online: https://www.ncbi.nlm.nih.gov/nuccore/KP981645.1 (accessed on 23 February 2023).
- Williams, S.T.; Ozawa, T. Molecular phylogeny suggests polyphyly of both the turban shells(family Turbinidae) and the superfamily Trochoidea (Mollusca: Vetigastropoda). Mol. Phylogenet. Evol. 2006, 39, 33–51. [Google Scholar] [CrossRef]
- Miller, M.A.; Pfeiffer, W.; Schwartz, T. Creating the CIPRES Science Gateway for inference of large phylogenetic trees. In Proceedings of the Gateway Computing Environments Workshop (GCE), New Orleans, LA, USA, 14 November 2010; pp. 1–8. [Google Scholar]
- Stamatakis, A.; Hoover, P.; Rougemont, J. A rapid bootstrap algorithm for the RAxML web-servers. Syst. Biol. 2008, 75, 758–771. [Google Scholar] [CrossRef]
- Pattengale, N.D.; Alipour, M.; Bininda-Emonds, O.R.P.; Moret, B.M.E.; Stamatakis, A. How many bootstrap replicates are necessary? J. Computat. Biol. 2010, 17, 337–354. [Google Scholar] [CrossRef]
- Kimura, M. A simple method for estimating evolutionary rate of base substitutions through comparative studies of nucleotide sequences. J. Mol. Evol. 1980, 16, 111–120. [Google Scholar] [CrossRef] [PubMed]
- Kumar, S.; Stecher, G.; Tamura, K. MEGA7: Molecular Evolutionary Genetics Analysis version 7.0 for bigger datasets. Mol. Biol. Evol. 2016, 33, 1870–1874. [Google Scholar] [CrossRef] [Green Version]
- Tajima, F. Statistical method for testing the neutral mutation hypothesis by DNA polymorphism. Genetics 1999, 123, 585–595. [Google Scholar] [CrossRef] [PubMed]
- Rozas, J.; Sánchez-DelBarrio, J.C.; Messeguer, X.; Rozas, R. DnaSP, DNA polymorphism analyses by the coalescent and other methods. Bioinformatics 2002, 19, 2496–2497. [Google Scholar] [CrossRef] [PubMed] [Green Version]
- Ramos-Onsins, S.E.; Rozas, J. Statistical properties of new neutrality tests against population growth. Mol. Biol. Evol. 2002, 19, 2092–2100. [Google Scholar] [CrossRef] [PubMed] [Green Version]
- Leigh, J.W.; Bryant, D. POPART: Full-feature software for haplotype network construction. Meth. Ecol. Evol. 2015, 6, 1110–1116. [Google Scholar] [CrossRef]
- Clement, M.; Posada, D.C.; Crandall, K.A. TCS: A computer program to estimate gene genealogies. Mol. Ecol. 2000, 9, 1657–1659. [Google Scholar] [CrossRef] [Green Version]
- Puillandre, N.; Brouillet, S.; Achaz, G. ASAP: Assemble species by automatic partitioning. Mol. Ecol. Resour. 2021, 21, 609–620. [Google Scholar] [CrossRef]
- Teske, P.R.; Sandoval-Castillo, J.; van Sebille, E.; Waters, J.; Beheregaray, L.B. On-shelf larval retention limits population connectivity in a coastal broadcast spawner. Mar. Ecol. Progr. Ser. 2015, 532, 1–12. [Google Scholar] [CrossRef] [Green Version]
- Marko, P.B. Fossil calibration of molecular clocks and the divergence times of geminate species pairs separated by the Isthmus of Panama. Mol. Biol. Evol. 2002, 19, 2005–2021. [Google Scholar] [CrossRef] [Green Version]
- Donald, K.M.; Kennedy, M.; Spencer, H.G. Cladogenesis as the result of long-distance rafting events in South Pacific topshells (Gastropoda, Trochidae). Evolution 2005, 59, 1701–1711. [Google Scholar]
- Nürnberg, D.; Brughmans, N.; Schönfeld, J.; Ninnemann, U.; Dullo, C. Paleo–export production, terrigenous flux and sea surface temperatures around Tasmania—Implications for glacial/interglacial changes in the Subtropical Convergence Zone. In The cenozoic Southern Ocean: Tectonics, Sedimentation and Climate Change between Australia and Antarctica; Exon, N.F., Kennett, J.P., Malone, M.J., Eds.; Geophysical Monograph Series; American Geophysical Union: Washington, DC, USA, 2004; Volume 151, pp. 291–317. [Google Scholar]
- Colgan, D.J. Fine-scale spatial partitioning of genetic variation and evolutionary contestability in the invasive estuarine mussel Xenostrobus securis. Mar. Biol. Res. 2017, 13, 1059–1072. [Google Scholar] [CrossRef]
- Paradis, E. The distribution of branch lengths in phylogenetic trees. Mol. Phylogenet. Evol. 2016, 94, 136–145. [Google Scholar] [CrossRef] [Green Version]
Figure 1.
Map of sample localities. Localities are identified by black circles for Nerita atramentosa, pink circles for N. melanotragus, black stars for A. tasmanica and red squares for P. solida. Filled symbols indicate localities from which new data were collected for this article. These are referenced by letters as detailed in the legend to Table 1. Empty symbols indicate data from the literature (details in text). The localities for Nerita with black outline and pink fill have data for both species in the genus. The superimposed symbols for A. tasmanica and N. melanotragus in the Sydney area of New South Wales denote two and three nearby localities of the species, respectively. Boundaries between regions are indicated by green bars.

Figure 2.
Maximum likelihood topology for Nerita atramentosa ATPSα sequences. Sequences are identified by Australian Museum registration number (e.g., C. 269935) or GenBank accession number. Bootstrap percentages above 70% are written on branches. The N.atramentosa specimen with a star belongs to the clade identified by this symbol in Figure 3. The provenance of each sequence is given according to states, or the regions within states specified in Figure 1. The scale bar shows the number of changes per site.

Figure 3.
Maximum likelihood topology for Nerita atramentosa COI sequences. Sequences are identified by Australian Museum registration number (e.g., C. 269935) or GenBank accession numbers. Bootstrap percentages above 70% are written on branches. The robustly supported clade specified by a star is discussed in the text. The provenance of each sequence is given according to states, or the regions within states specified in Figure 1. The scale bar shows the number of changes per site. The root is placed at the location determined by a combined analysis of the N. melanotragus and N. atramentos sequences.

Figure 4.
Maximum likelihood topology for Nerita melanotragus COI sequences. Sequences are identified by Australian Museum registration number (e.g., C. 269929) or GenBank accession number. Bootstrap percentages above 70% are written on branches. The provenance of each sequence is given according to states, or the regions within states specified in Figure 1. The scale bar shows the number of changes per site. The root is placed at the location determined by a combined analysis of the N. melanotragus and N. atramentos sequences.

Figure 5.
Maximum likelihood topology for Ascorhis tasmanica COI sequences. Sequences are identified by Australian Museum registration number (e.g., C. 269929) or GenBank accession number. Bootstrap percentages above 70% are written on branches. The large letters near branches define the groups in this species referred to in the text. Specimens with identifiers preceded by an asterisk have also been sequenced for H3 and those with a following asterisk for ATPSα. The provenance of each sequence is given according to states, or the regions within states specified in Figure 1. The scale bar shows the number of changes per site.

Figure 6.
Maximum likelihood topology for Phallomedusa solida ATPSα sequences. Sequences are identified by Australian Museum registration number (e.g., C. 468465) No branch was supported by bootstrap percentages of more than 70%. The scale bar shows the number of changes per site. Specimens highlighted with green belong to COI clade B and other specimens belong to clade A.


Table 1.
Population locations for newly collected sequences. The second column provides the location number used in Figure 1 and the third specifies the collection event identifier (“MAL” number) in the collections of the Australian Museum. The final column lists the number of new sequences at each site: figures in plain font are for ATPSα and those in bold for COI. Italic figures are for ND1 in Nerita and for H3 in other taxa.
| Species | Location Number | Collection Event (MAL#) | Locality | Latitude | Longitude | Collection Date | No. of Sequences |
|---|---|---|---|---|---|---|---|
| Ascorhis tasmanica | |||||||
| A1 | MAL71148 | North Avoca | 33°27′27″ | 151°26′30″ | 11 May 2007 | 3, 3 | |
| A2 | MAL88537 | Lake Nangudga, | 36°17′ | 150°08′ | 13 June 2006 | 1, 2, 1 | |
| A3 | MAL72686 | Merimbula, Back Lagoon, | 36°53′08″ | 149°55′01″ | 1 March 2008 | 1, 2, 1 | |
| A4 | MAL72687 | Moulding Lagoon | 41°59′ | 148°14′ | 3 April 2007 | 2, 3 | |
| A5 | MAL72688 | Swansea, | 42°07′52″ | 148°04′35″ | 3 April 2007 | 2, 3, 1 | |
| Nerita atramentosa | |||||||
| Na1 | MAL72701 | Bridport | 40°58′54″ | 147°23′08″ | 3 April 2007 | 2, 1 | |
| Na2 | MAL71157 | Georgetown | 41°06′33″ | 146°48′39″ | 4 April 2007 | 2, 2, 1 | |
| Nerita melanotragus | |||||||
| Nm1 | MAL71145 | Hastings Point | 28°21′46″ | 153°34′46″ | 1 April 2008 | 1 | |
| Nm2 | MAL71144 | Skennars Head | 28°49′20″ | 153°36′26″ | 1 April 2008 | 2, 2, 2 | |
| Nm3 | MAL71148 | Norh Avoca Rock Platform | 33°27′27″ | 151°26′30″ | 11 May 2007 | 2 | |
| Nm4 | MAL71138 | Bottle and Glass Rocks | 33°50′51″ | 151°16′12″ | 28 March 2007 | 2, 2, 2 | |
| Nm5 | MAL71152 | Shelly Beach, Cronulla | 33°04′01″ | 159°09′31″ | 12 May 2009 | 3, 6, 3 | |
| Nm6 | MAL71140 | Bicheno | 41°52′18″ | 148°17′54″ | 3 April 2007 | 3 | |
| Nm7 | MAL71151 | Deviot | 41°15′ | 146°56′ | 4 April 2007 | 3 | |
| Phallomedusa solida | |||||||
| P1 | MAL76554 | Clarence | 29°25′59″ | 153°14′17″ | 31 March 2008 | 1 | |
| P2 | MAL72691 | Ballina, North Creek | 29°28′44″ | 153°21′50″ | 1 April 2008 | 1 | |
| P3 | MAL71151 | Angourie | 28°10′34″ | 153°32′27″ | 2 April 2008 | 1 | |
| P4 | MAL76555 | Roseville, | 33°46′07″ | 151°11′57″ | 28 March 2007 | 2 | |
| P5 | MAL76552 | Little Salt Pan Creek | 33°58′17″ | 151°02′24″ | 3 February 2006 | 1 | |
| P7 | MAL71160 | Narooma, at highway bridge | 36°12′35″ | 150°07′20″ | 13 June 2006 | 2 | |
| P8 | MAL76559 | Falmouth | 41°30′ | 148°16′ | 3 April 2007 | 1 | |
Table 2.
Estimates of evolutionary divergence within groups. The statistics are the number of haplotypes (column 4: No. Hap); haplotype diversity (column 5: Hap. Div.), Nucleotide diversity +/−standard deviations (column 6: π), average pairwise difference between sequences (column 7: Av. Diff.), Tajima’s D (column 8, with probability), the Θi and τ population size parameters (column 9: Popn Growth) and the Ramos-Onsins and Rozas R2 statistic (column 10). The Θf value for all analyses was set at 1000 to allow comparison of Θi values. The lengths of the sequences (column 3) differ from the overall lengths of the alignment as DnaSP performs complete deletion of alignment positions with missing data in any sequence. The figures in the number of sequences column for ATPSα refer to the number of haplotypes (two for each individual).
| Species/Gene | Number of Sequences | Length | No. Hap. | Hap. Div. | π | Av. Diff. | Tajima’s D | Popn Growth | R2 |
|---|---|---|---|---|---|---|---|---|---|
| Ascorhis tasmanica | |||||||||
| ATPSα | 10 | 365 | 2 | 0.356 | 0.009 +/− 0.004 | 3.2 | 0.026, p > 0.1 | Θi 13.973 τ 0.000 | 0.178 |
| COI | 17 | 577 | 11 | 0.941 | 0.024 +/− 0.003 | 13.618 | −0.252, p > 0.1 | Θi 6.506 τ 7.112 | 0.125 |
| Nerita atramentosa | |||||||||
| ATPSα | 6 | 393 | 3 | 0.800 | 0.007 +/− 0.002 | 2.667 | 1.219, p > 0.1 | Θi 1.309, τ 1.788 | 0.267 |
| COI | 36 | 571 | 22 | 0.917 | 0.008 +/− 0.001 | 4.724 | −1.673, p > 0.05 | Θi 2.2267 τ 2.4971 | 0.051 |
| Nerita melanotragus | |||||||||
| ATPSα | 18 | 393 | 10 | 0.85 | 0.007 +/− 0.002 | 2.817 | −1.783, p > 0.05 | Θi 2.2260 τ 0.557 | 0.119 |
| COI | 69 | 512 | 48 | 0.974 | 0.008 +/− 0.001 | 4.179 | −2.066, p < 0.05 | Θi 0.525 τ 0.654 | 0.034 |
| Phallomedusa solida | |||||||||
| ATPSα−overall | 18 | 225 | 9 | 0.869 | 0.007 +/− 0.0001 | 1.601 | −0.723, p > 0.1 | Θi 0.000 τ 1.601 | 0.119 |
| COI−overall | 72 | 593 | 52 | 0.960 | 0.018 +/− 0.002 | 10.967 | −1.133, p > 0.1 | Θi 9.105 τ 1.862 | 0.066 |
| COI-clade A | 48 | 613 | 36 | 0.957 | 0.005 +/− 0.001 | 3.124 | −2.591, p < 0.001 | Θi 0.512 τ 2.612 | 0.024 |
| COI-clade B | 20 | 637 | 16 | 0.983 | 0.007 +/− 0.001 | 4.579 | −1.797, p > 0.05 | Θi 0.780 τ 0.799 | 0.058 |
Table 3.
Average pairwise base substitutions per site between groups in Ascorhis tasmanica based on the Kimura 2-parameter model. Average pairwise distances are shown below the diagonal and standard error estimates are shown above it. Rate variation among sites was modelled with a gamma distribution (shape parameter = 1). All ambiguous positions were removed for each sequence pair. Groups are designated as in Figure 5.
| Group | Group A | Group B | Group C | Group D |
|---|---|---|---|---|
| Group A | 0.004 | 0.008 | 0.005 | |
| Group B | 0.017 | 0.008 | 0.006 | |
| Group C | 0.041 | 0.047 | 0.008 | |
| Group D | 0.019 | 0.030 | 0.041 |
Disclaimer/Publisher’s Note: The statements, opinions and data contained in all publications are solely those of the individual author(s) and contributor(s) and not of MDPI and/or the editor(s). MDPI and/or the editor(s) disclaim responsibility for any injury to people or property resulting from any ideas, methods, instructions or products referred to in the content. |
© 2023 by the author. Licensee MDPI, Basel, Switzerland. This article is an open access article distributed under the terms and conditions of the Creative Commons Attribution (CC BY) license (https://creativecommons.org/licenses/by/4.0/).
Share and Cite
MDPI and ACS Style
Colgan, D.J. Do Deep Mitochondrial DNA Divergences within Intertidal Gastropods Reveal Phylogeographic Signals from Earlier Glacial Cycles? Diversity 2023, 15, 346. https://doi.org/10.3390/d15030346
AMA Style
Colgan DJ. Do Deep Mitochondrial DNA Divergences within Intertidal Gastropods Reveal Phylogeographic Signals from Earlier Glacial Cycles? Diversity. 2023; 15(3):346. https://doi.org/10.3390/d15030346
Chicago/Turabian StyleColgan, Donald James. 2023. "Do Deep Mitochondrial DNA Divergences within Intertidal Gastropods Reveal Phylogeographic Signals from Earlier Glacial Cycles?" Diversity 15, no. 3: 346. https://doi.org/10.3390/d15030346
Note that from the first issue of 2016, this journal uses article numbers instead of page numbers. See further details here.