
Artificial Green Corridors in an Andean City as Effective Support of Avian Diversity


Abstract
:1. Introduction
2. Materials and Methods
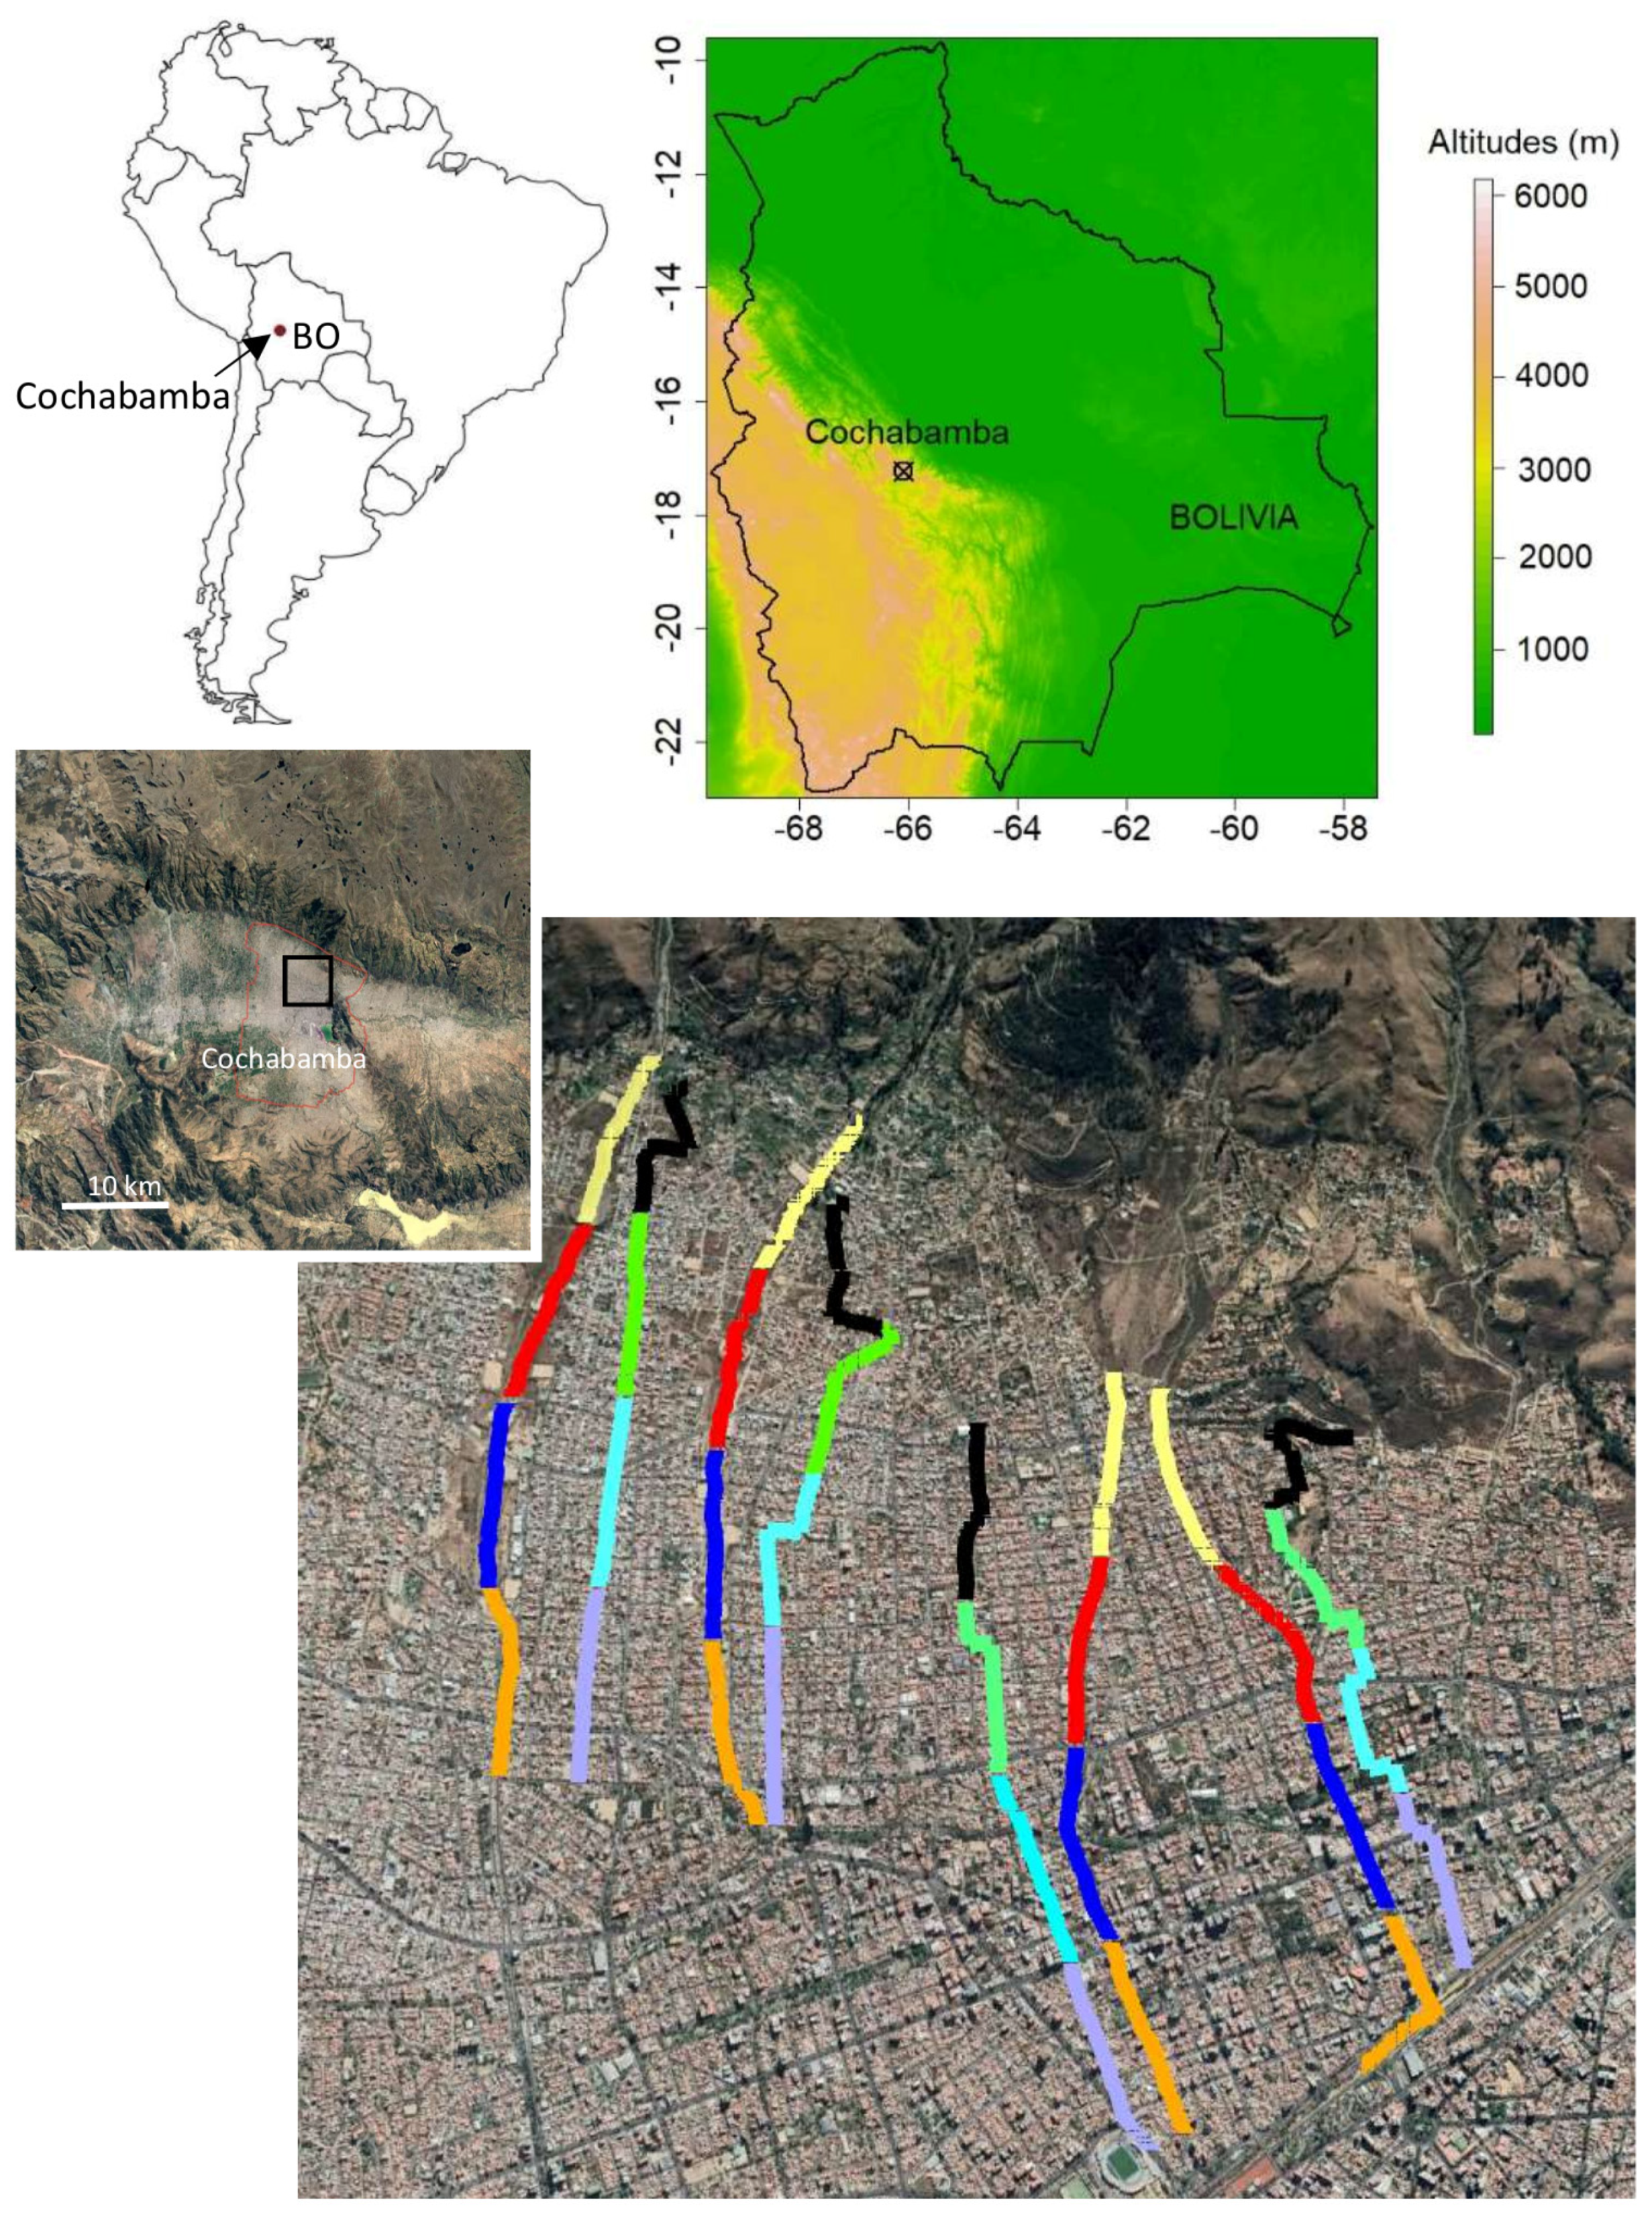
2.1. Study Site
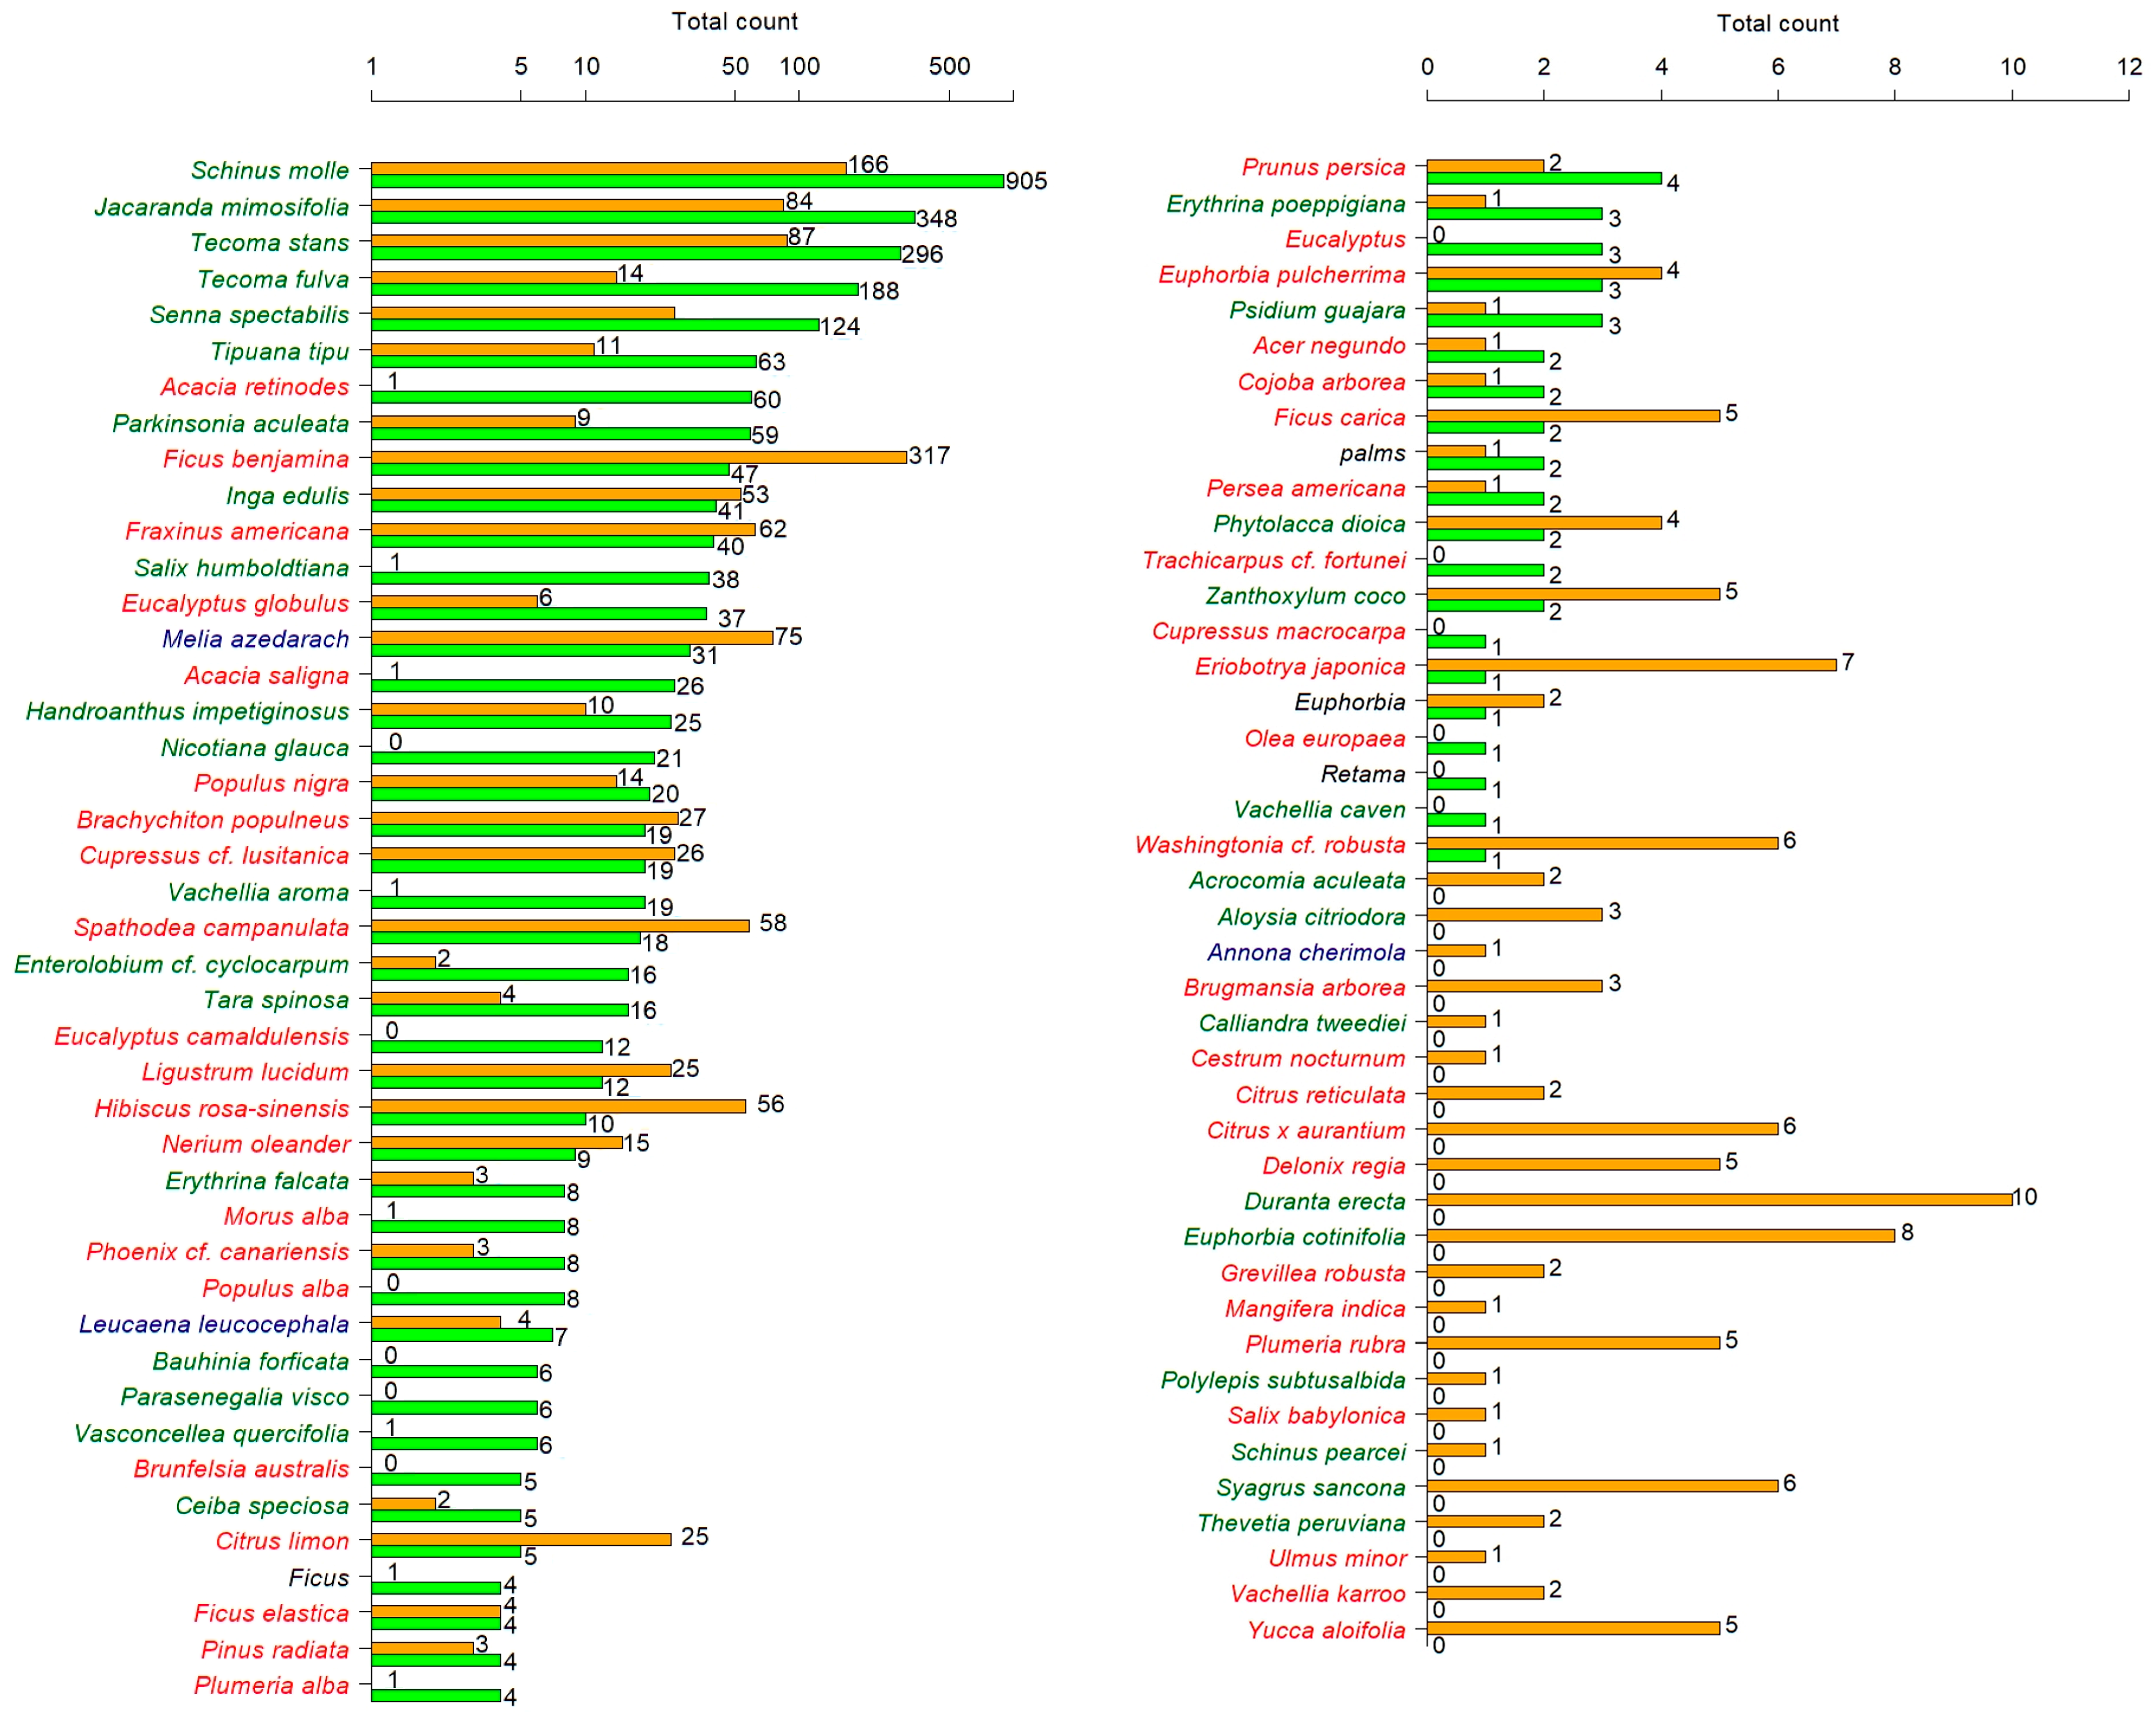
2.2. Corridor Survey
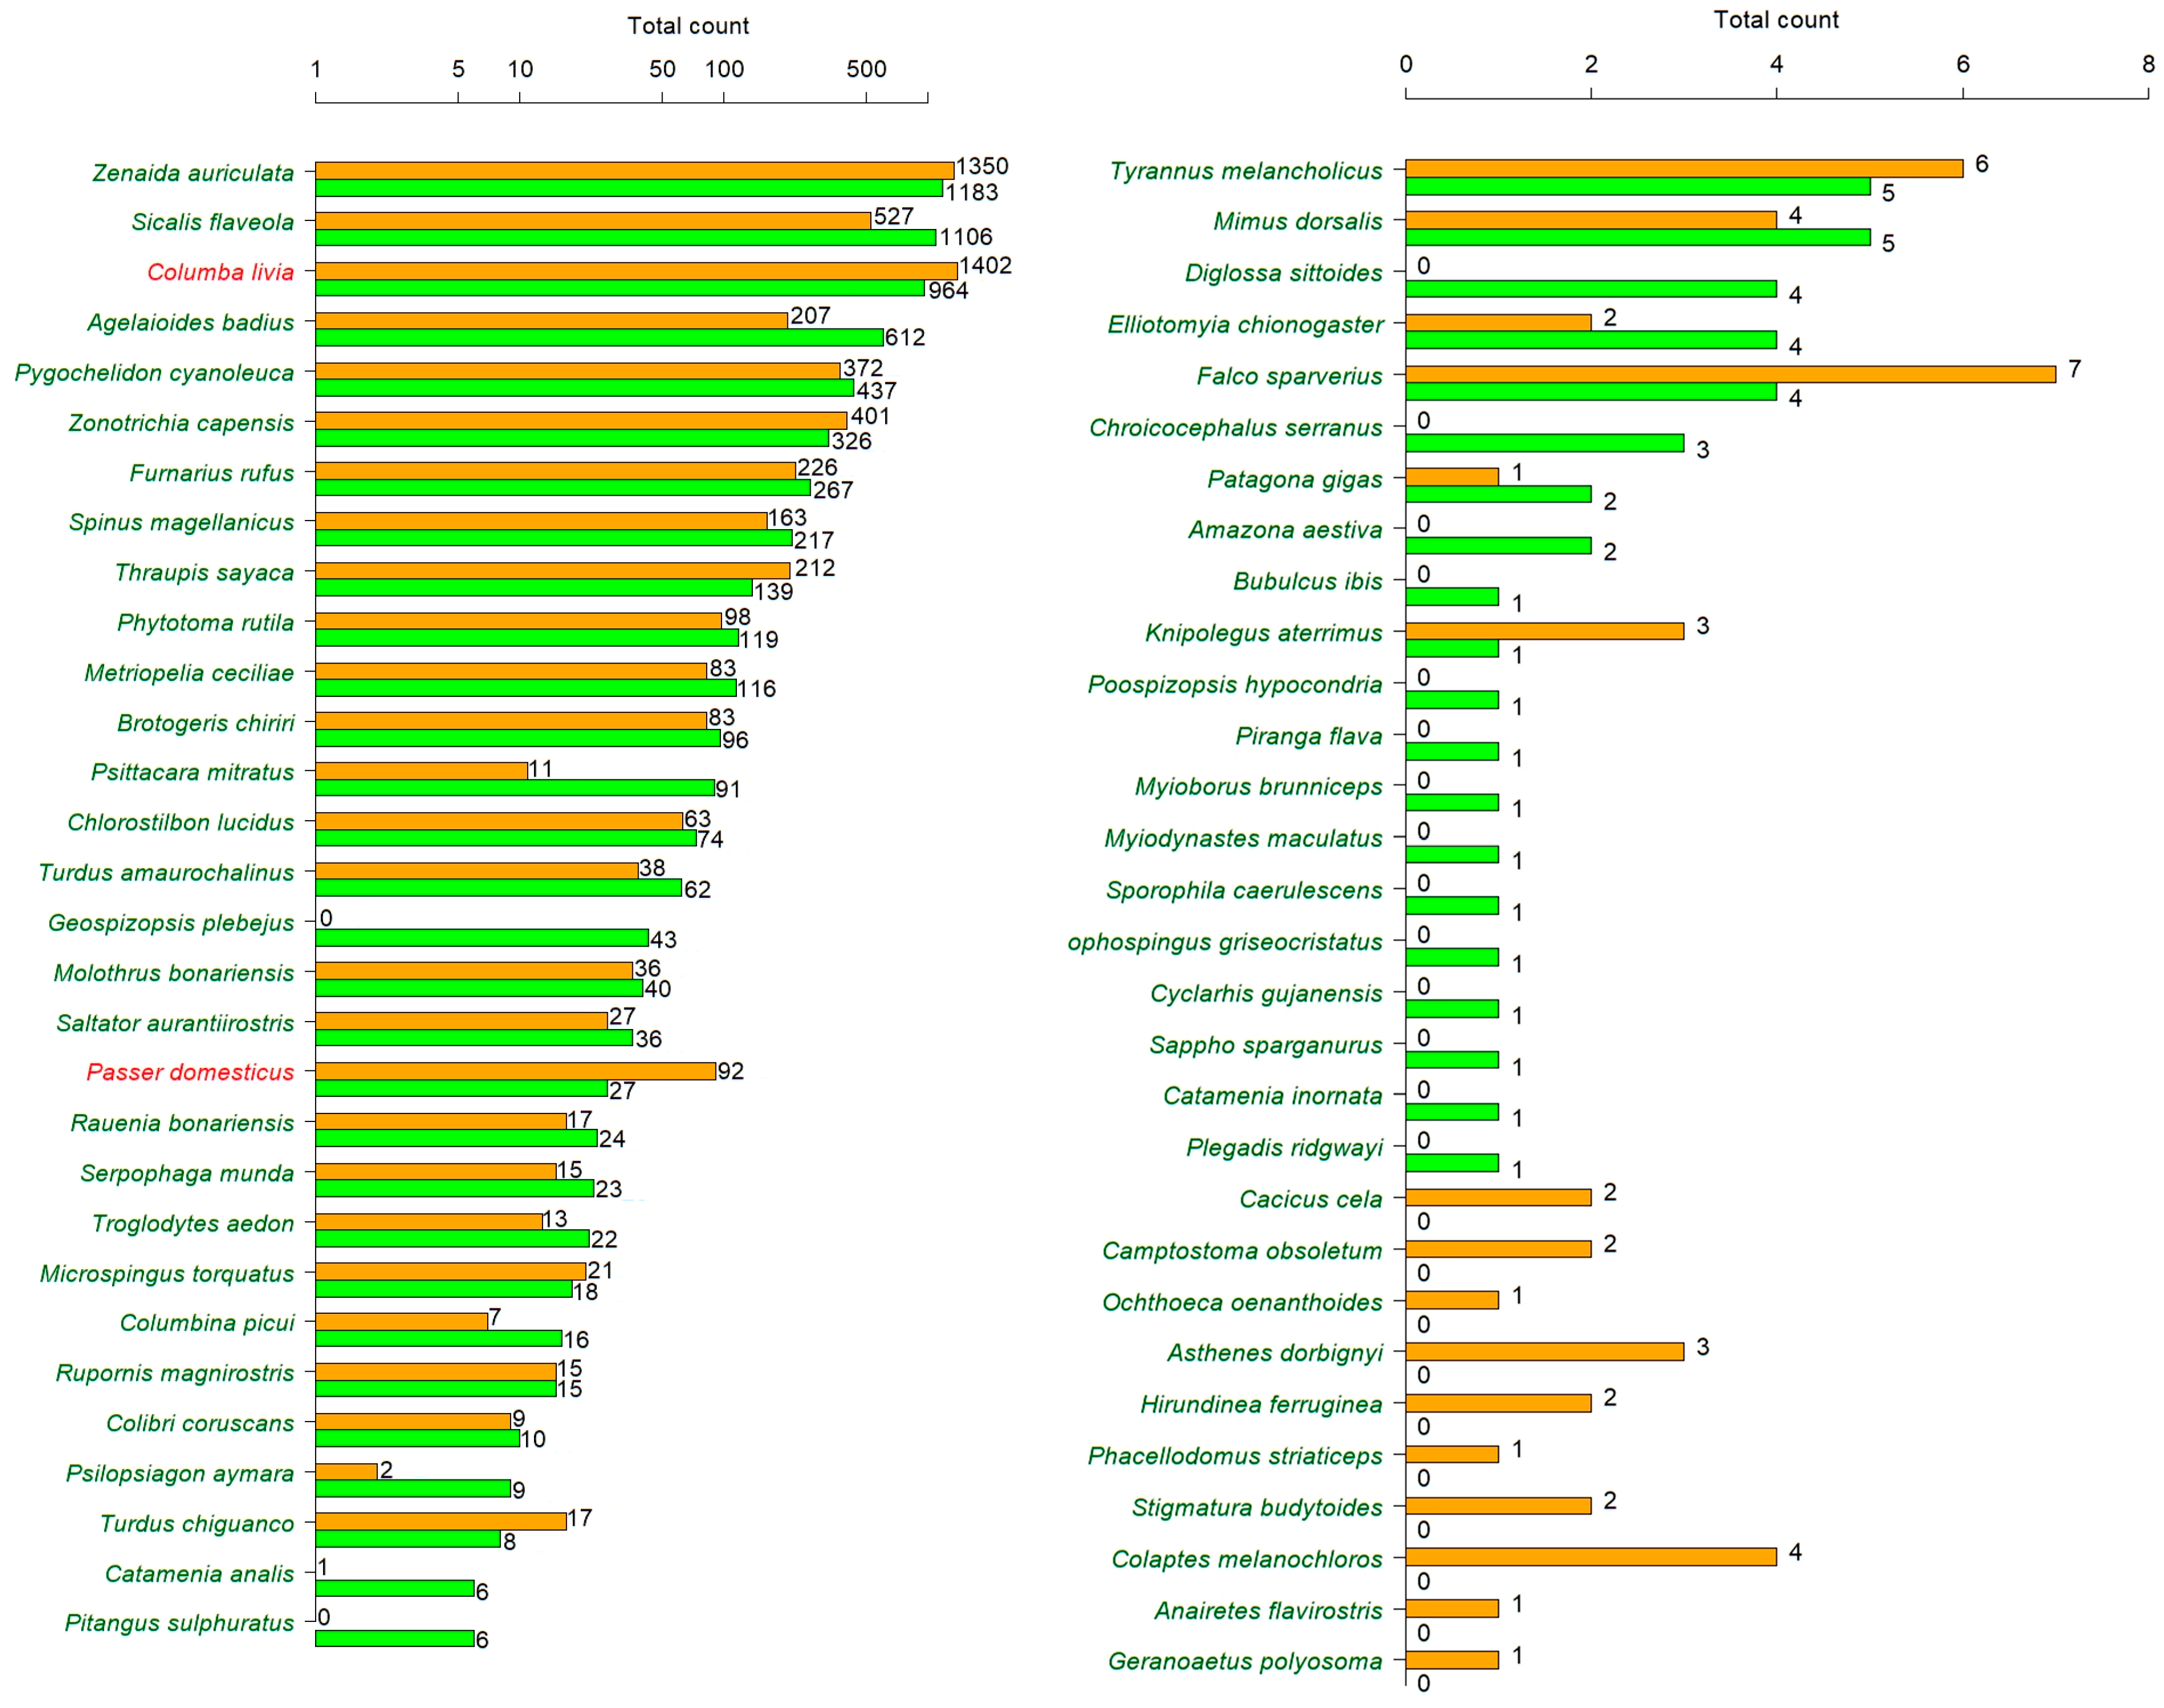
2.3. Bird Surveys
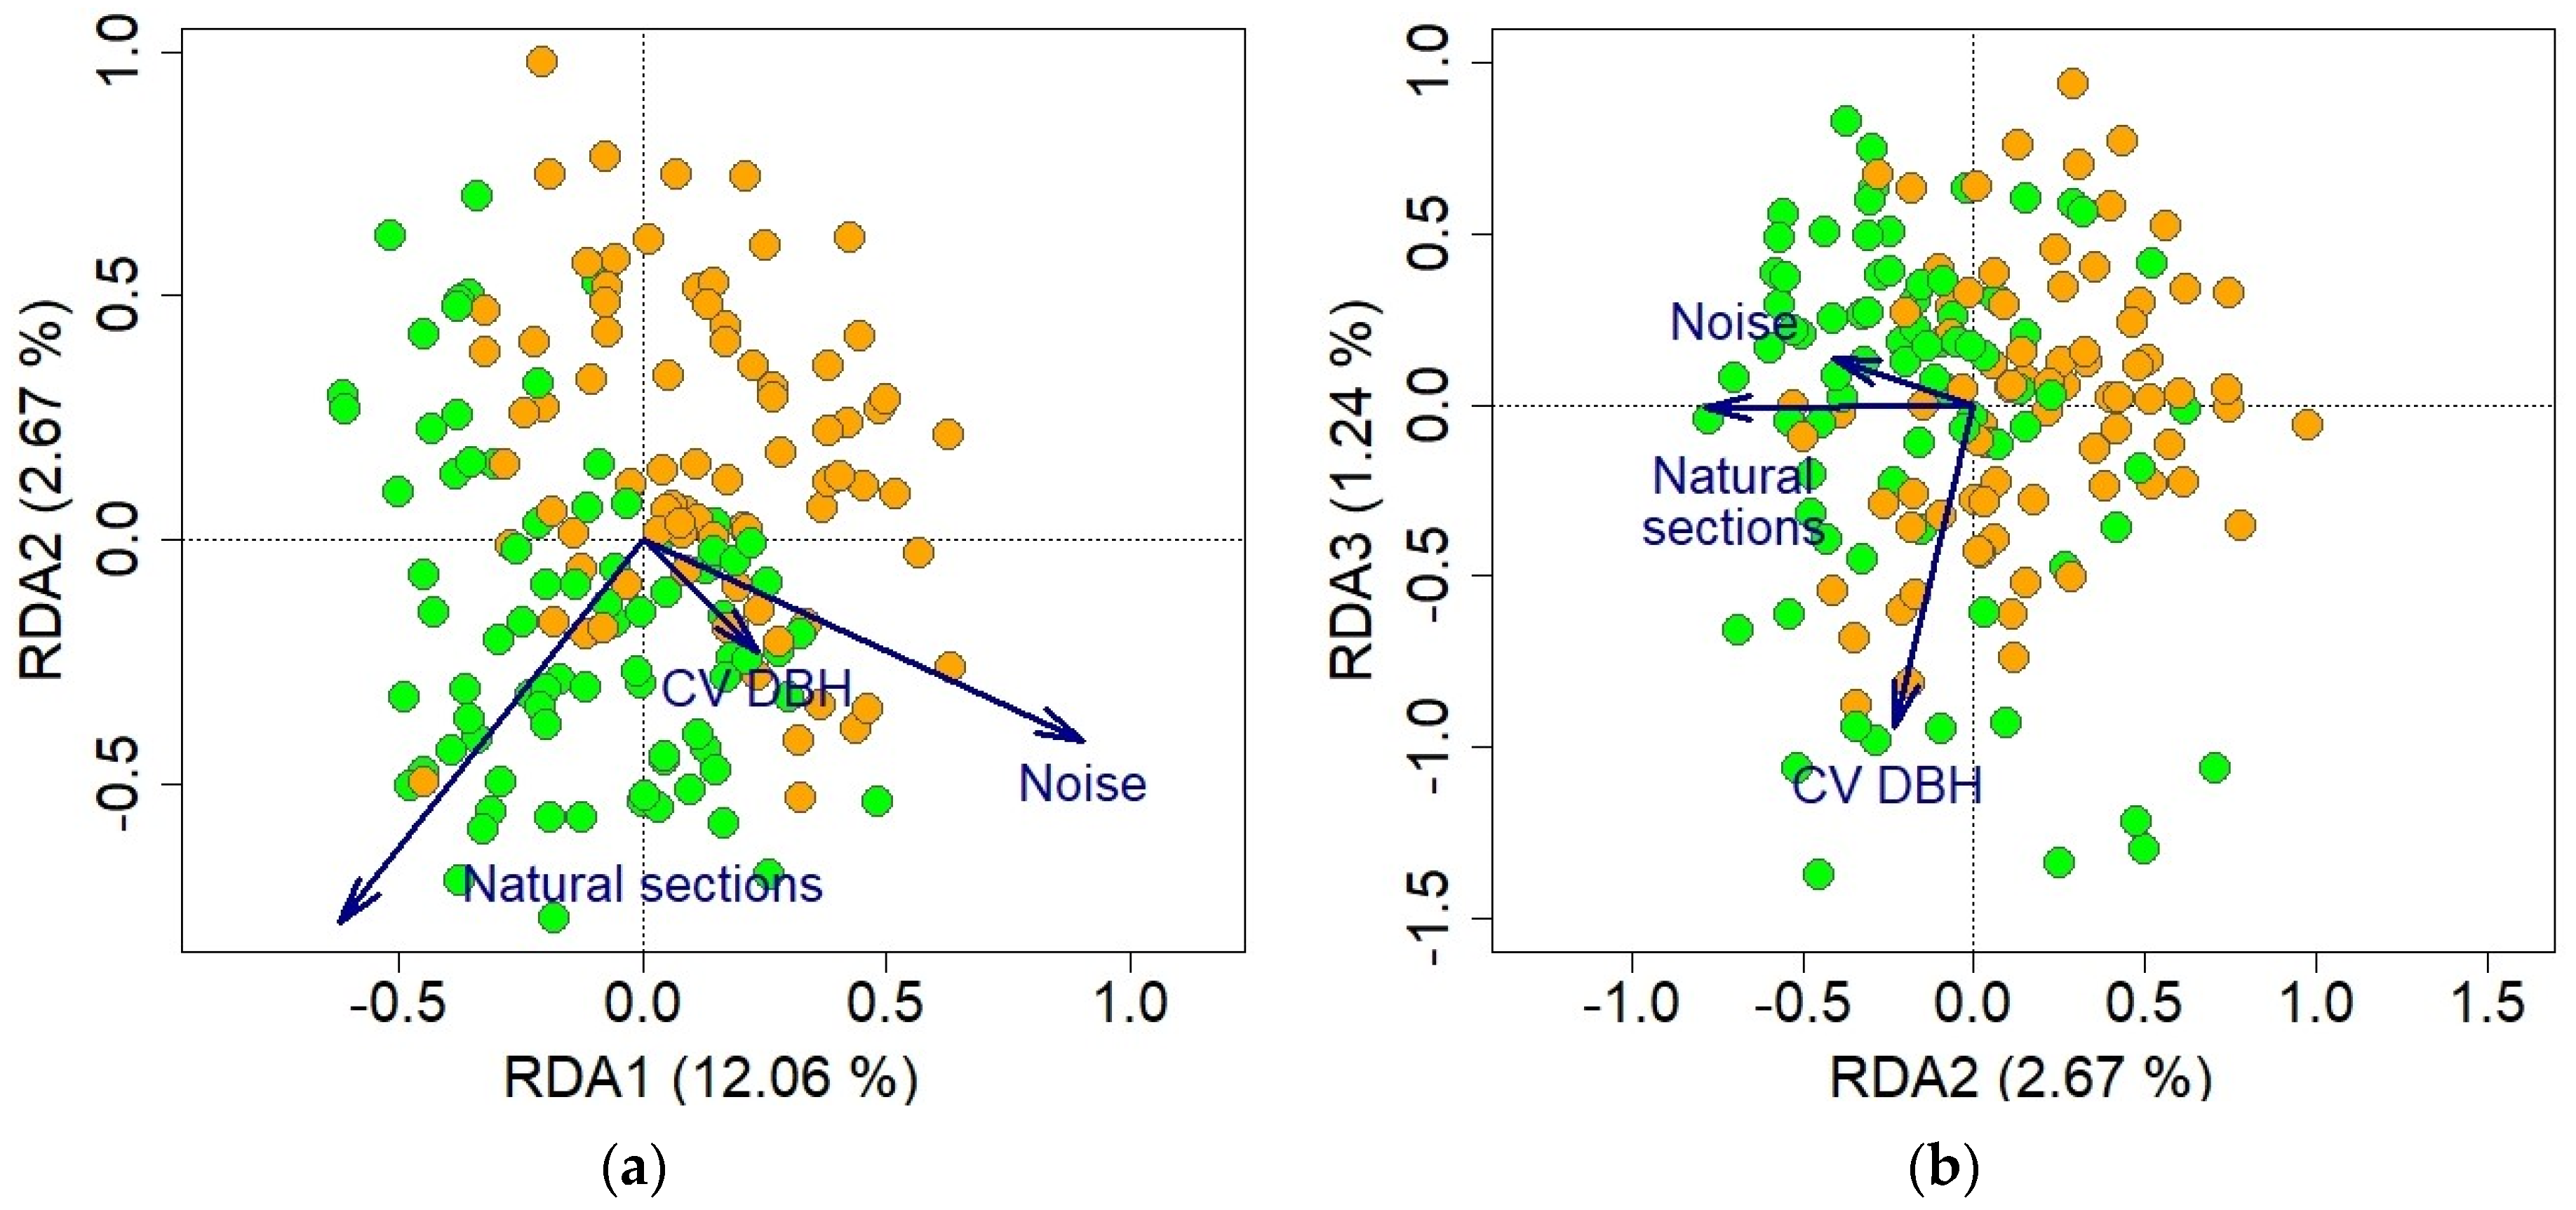
2.4. Data Analyses
3. Results
4. Discussion
5. Conclusions
Supplementary Materials
Author Contributions
Funding
Data Availability Statement
Acknowledgments
Conflicts of Interest
References
- Zuberogoitia, I.; Morant, J.; González-Oreja, J.A.; Martínez, J.E.; Larrinoa, M.; Ruiz, J.; Aginako, I.; Cinos, C.; Díaz, E.; Martínez, F.; et al. Management actions promote human-wildlife coexistence in highly anthropized landscapes: The case of an endangered avian scavenger. Front. Ecol. Evol. 2021, 9, 656390. [Google Scholar] [CrossRef]
- Hilty, J.; Worboys, G.L.; Keeley, A.; Woodley, S.; Lausche, B.; Locke, H.; Carr, M.; Pulsford, I.; Pittock, J.; White, J.W.; et al. Guidelines for Conserving Connectivity through Ecological Networks and Corridors; IUCN: Gland, Switzerland, 2020; Volume 30.
- Chace, J.F.; Walsh, J.J. Urban effects on native avifauna: A review. Landsc. Urban Plan. 2006, 74, 46–69. [Google Scholar] [CrossRef]
- Muñoz-Pacheco, C.B.; Villaseñor, N.R. Avian species richness in cities: A review of the Spanish-language literature from the Southern Cone of South America. Urban Ecosyst. 2022, 25, 601–616. [Google Scholar] [CrossRef]
- Tai, D.; Chen, C.; Song, Y.; Tan, X.; Yang, X.; Wang, Y. Ecological traits and landscape characteristics predicting bird sensitivity to urbanization in city parks. Basic Appl. Ecol. 2022, 58, 110–120. [Google Scholar] [CrossRef]
- Leveau, L.M. Urbanization induces bird color homogenization. Landsc. Urban Plan. 2019, 192, 103645. [Google Scholar] [CrossRef]
- Leveau, L.M.; Ibáñez, I. Nesting site and plumage color are the main traits associated with bird species presence in urban areas. Animals 2022, 12, 1148. [Google Scholar] [CrossRef] [PubMed]
- Sol, D.; Trisos, C.; Múrria, C.; Jeliazkov, A.; González-Lagos, C.; Pigot, A.L.; Ricotta, C.; Swan, C.M.; Tobias, J.A.; Pavoine, S. The worldwide impact of urbanisation on avian functional diversity. Ecol. Lett. 2020, 23, 962–972. [Google Scholar] [CrossRef]
- Kark, S.; Iwaniuk, A.; Schalimtzek, A.; Banker, E. Living in the city: Can anyone become an ‘urban exploiter’? J. Biogeogr. 2007, 34, 638–651. [Google Scholar] [CrossRef]
- La Sorte, F.A.; Lepczyk, C.A.; Aronson, M.F.J.; Goddard, M.A.; Hedblom, M.; Katti, M.; MacGregor-Fors, I.; Mörtberg, U.; Nilon, C.H.; Warren, P.S.; et al. The phylogenetic and functional diversity of regional breeding bird assemblages is reduced and constricted through urbanization. Divers. Distrib. 2018, 24, 928–938. [Google Scholar] [CrossRef] [Green Version]
- Máthé, O.; Batáry, P. Insectivorous and open-cup nester bird species suffer the most from urbanization. Bird Study 2015, 62, 78–86. [Google Scholar] [CrossRef]
- Croci, S.; Butet, A.; Clergeau, P. Does urbanization filter birds on the basis of their biological traits? Condor 2008, 110, 223–240. [Google Scholar] [CrossRef]
- Ferenc, M.; Sedláček, O.; Fuchs, R.; Hořák, D.; Storchová, L.; Fraissinet, M.; Storch, D. Large-scale commonness is the best predictor of bird species presence in European cities. Urban Ecosyst. 2018, 21, 369–377. [Google Scholar] [CrossRef]
- Evans, K.L.; Gaston, K.J.; Sharp, S.P.; McGowan, A.; Hatchwell, B.J. The effect of urbanisation on avian morphology and latitudinal gradients in body size. Oikos 2009, 118, 251–259. [Google Scholar] [CrossRef]
- Bennett, G.; Mulongoy, K. Review of Experience with Ecological Corridors and Buffer Zones; Secretariat of the Convention on Biological Diversity: Montréal, QC, Canada, 2006; Volume 23. [Google Scholar]
- Tannier, C.; Bourgeois, M.; Houot, H.; Foltête, J.C. Impact of urban developments on the functional connectivity of forested habitats: A joint contribution of advanced urban models and landscape graphs. Land Use Policy 2016, 52, 76–91. [Google Scholar] [CrossRef]
- Tremblay, M.A.; St. Clair, C.C. Factors affecting the permeability of transportation and riparian corridors to the movements of songbirds in an urban landscape. J. Appl. Ecol. 2009, 46, 1314–1322. [Google Scholar] [CrossRef]
- Tremblay, M.A.; St. Clair, C.C. Permeability of a heterogeneous urban landscape to the movements of forest songbirds. J. Appl. Ecol. 2011, 48, 679–688. [Google Scholar] [CrossRef]
- Beaugeard, E.; Brischoux, F.; Angelier, F. Green infrastructures and ecological corridors shape avian biodiversity in a small French city. Urban Ecosyst. 2021, 24, 549–560. [Google Scholar] [CrossRef]
- Ersoy, E.; Jorgensen, A.; Warren, P.H. Identifying multispecies connectivity corridors and the spatial pattern of the landscape. Urban For. Urban Green. 2019, 40, 308–322. [Google Scholar] [CrossRef]
- Nor, A.N.M.; Corstanje, R.; Harris, J.A.; Grafius, D.R.; Siriwardena, G.M. Ecological connectivity networks in rapidly expanding cities. Heliyon 2017, 3, e00325. [Google Scholar] [CrossRef] [Green Version]
- Aguirre, L.F. Resumen Ejecutivo del Proyecto Corredores Biológicos Urbanos, Funciones y Equidad. El Caso del Cercado, Cochabamba, (PIA.ACC.II-PCI.08); P-CBUs-Red BioRNMA-CBG/FCyT, Universidad Mayor de San Simón: Cochabamba, Bolivia, 2022; pp. 1–56. [Google Scholar]
- De La Fuente, M.; Cabrera, J. La Expansión Urbana y la Pérdida de Tierras Agrícolas en el Valle Central de Cochabamba y Sacaba; Fundación Tierra: La Paz, Bolivia, 2016. [Google Scholar] [CrossRef]
- Arrázola, S.S.; Mercado, J.M.; de la Barra, N.B. Guía de Plantas de la Laguna Alalay; Universidad Mayor de San Simón, Centro de Biodiversidad y Genética: Cochabamba, Bolivia, 2019. [Google Scholar]
- Herzog, S.K.; Terrill, R.S.; Jahn, A.E.; Van Remsen, J., Jr.; Maillard, J.O.Z.; García-Solíz, V.H.; MacLeod, R.; MacCormick, A.; Vidoz, J.Q. Aves de Bolivia. Guía de Campo; Asociación Armonía: Santa Cruz de la Sierra, Bolivia, 2017. [Google Scholar]
- Laliberte, E.; Legendre, P. A distance-based framework for measuring functional diversity from multiple traits. Ecology 2010, 91, 299–305. [Google Scholar] [CrossRef]
- World Flora. Available online: http://www.worldfloraonline.org/ (accessed on 26 September 2022).
- Tropicos Bolivia catalogue. Available online: http://legacy.tropicos.org/Project/BC (accessed on 14 November 2022).
- Oksanen, J.; Blanchet, F.G.; Friendly, M.; Kindt, R.; Legendre, P.; McGlinn, D.; Minchin, P.R.; O’Hara, R.B.; Simpson, G.L.; Solymos, P.; et al. Vegan: Community Ecology Package. R Package Version 2.5-7. 2020. Available online: https://CRAN.R-project.org/package=vegan (accessed on 24 June 2022).
- Roberts, D.W. Labdsv: Ordination and Multivariate Analysis for Ecology. R Package Version, 2.0-1. 2018. Available online: http://CRAN.R-project.org/package=labdsv (accessed on 6 June 2022).
- Tobias, J.A.; Sheard, C.; Pigot, A.L.; Devenish, A.J.M.; Yang, J.; Sayol, F.; Neate-Clegg, M.H.C.; Alioravainen, N.; Weeks, T.L.; Barber, R.A.; et al. AVONET: Morphological, ecological and geographical data for all birds. Ecol. Lett. 2022, 25, 581–597. [Google Scholar] [CrossRef] [PubMed]
- Fitzpatrick, S. Birds’ tails as signaling devices: Markings, shape, length, and feather quality. Am. Nat. 1998, 151, 157–173. [Google Scholar] [CrossRef] [PubMed]
- Grant, P.R.; Abbott, I.; Schluter, D.; Curry, R.L.; Abbott, L.K. Variation in the size and shape of Darwin’s finches. Biol. J. Linn. Soc. 1985, 25, 1–39. [Google Scholar] [CrossRef]
- Bates, D.; Maechler, M.; Bolker, B.M.; Walker, S.; Christensen, R.H.B.; Singmann, H.; Dai, B.; Grothendieck, G.; Green, P. Linear Mixed-Effects Models Using ’Eigen’ and S4. 2016. Available online: https://cran.r-project.org/src/contrib/Archive/lme4/ (accessed on 19 May 2020).
- Brooks, M.E.; Kristensen, K.; van Benthem, K.J.; Magnusson, A.; Berg, C.W.; Nielsen, A.; Skaug, H.J.; Mächler, M.; Bolker, B.M. glmmTMB balances speed and flexibility among packages for zero-inflated generalized linear mixed modeling. R J. 2017, 9, 378–400. [Google Scholar] [CrossRef] [Green Version]
- Kalogirou, S. Local Correlation, Spatial Inequalities, Geographically Weighted Regression and Other Tools. 2020. Available online: https://cran.r-project.org/package=lctools (accessed on 19 May 2020).
- Balderrama, J.A.; Ruiz, O.; Camacho, D.; Cahill, J.R.A. Aves de la Laguna Alalay y Sus Alrededores; Guía de campo; Centro de Biodiversidad y Genética, UMSS: Cochabamba, Bolivia, 2018. [Google Scholar]
- Singh, A.K.; Singh, H.; Singh, J.S. Plant diversity in cities: Call for assessment and conservation. Curr. Sci. 2018, 115, 428–435. [Google Scholar] [CrossRef]
- Hernández, H.J.; Villaseñor, N.R. Twelve-year change in tree diversity and spatial segregation in the Mediterranean city of Santiago, Chile. Urban For. Urban Green. 2018, 29, 10–18. [Google Scholar] [CrossRef]
- Bazzato, E.; Lallai, E.; Caria, M.; Schifani, E.; Cillo, D.; Ancona, C.; Alamanni, F.; Pantini, P.; Maccherini, S.; Bacaro, G.; et al. Land-use intensification reduces multi-taxa diversity patterns of Small Woodlots Outside Forests in a Mediterranean area. Agric. Ecosyst. Environ. 2022, 340, 108149. [Google Scholar] [CrossRef]
- Rija, A.A.; Said, A.; Mwamende, K.A.; Hassan, S.N.; Madoffe, S.S. Urban sprawl and species movement may decimate natural plant diversity in an Afro-tropical city. Biodivers. Conserv. 2014, 23, 963–978. [Google Scholar] [CrossRef]
- Fenoglio, M.S.; Rossetti, M.R.; Videla, M. Negative effects of urbanization on terrestrial arthropod communities: A meta-analysis. Glob. Ecol. Biogeogr. 2020, 29, 1412–1429. [Google Scholar] [CrossRef]
- Planillo, A.; Kramer-Schadt, S.; Buchholz, S.; Gras, P.; von der Lippe, M.; Radchuk, V. Arthropod abundance modulates bird community responses to urbanization. Divers. Distrib. 2021, 27, 34–49. [Google Scholar] [CrossRef]
- Melles, S.; Glenn, S.; Martin, K. Urban bird diversity and landscape complexity: Species-environment associations along a multiscale habitat gradient. Conserv. Ecol. 2003, 7. Available online: https://www.consecol.org/vol7/iss1/art5 (accessed on 26 September 2022). [CrossRef] [Green Version]
- Suarez-Rubio, M.; Thomlinson, J.R. Landscape and patch-level factors influence bird communities in an urbanized tropical island. Biol. Conserv. 2009, 142, 1311–1321. [Google Scholar] [CrossRef]
- Yang, G.; Xu, J.; Wang, Y.; Wang, X.; Pei, E.; Yuan, X.; Li, H.; Ding, Y.; Wang, Z. Evaluation of microhabitats for wild birds in a Shanghai urban area park. Urban For. Urban Green. 2015, 14, 246–254. [Google Scholar] [CrossRef]
- Strubbe, D.; Salleh Hudin, N.; Teyssier, A.; Vantieghem, P.; Aerts, J.; Lens, L. Phenotypic signatures of urbanization are scale-dependent: A multi-trait study on a classic urban exploiter. Landsc. Urban Plan. 2020, 197, 103767. [Google Scholar] [CrossRef] [Green Version]
- Abbott, I.; Abbott, L.K.; Grant, P.R. Comparative ecology of Galapagos ground finches (Geospiza Gould): Evaluation of the importance of floristic diversity and interspecific competition. Ecol.Monogr. 1977, 47, 151–184. [Google Scholar] [CrossRef]
- Olson, V.A.; Davies, R.G.; Orme, C.D.L.; Thomas, G.H.; Meiri, S.; Blackburn, T.M.; Gaston, K.J.; Owens, I.P.F.; Bennett, P.M. Global biogeography and ecology of body size in birds. Ecol. Lett. 2009, 12, 249–259. [Google Scholar] [CrossRef] [PubMed]
- Van Den Hout, P.J.; Mathot, K.J.; Maas, L.R.M.; Piersma, T. Predator escape tactics in birds: Linking ecology and aerodynamics. Behav. Ecol. 2010, 21, 16–25. [Google Scholar] [CrossRef] [Green Version]
- Rey Gozalo, G.; Suárez, E.; Montenegro, A.L.; Arenas, J.P.; Barrigón Morillas, J.M.; Montes González, D. Noise estimation using road and urban features. Sustainability 2020, 12, 9217. [Google Scholar] [CrossRef]
- Danciulescu, V.; Bucur, E.; Pascu, L.F.; Vasile, A.; Bratu, M. Correlations between noise level and pollutants concentration in order to assess the level of air pollution induced by heavy traffic. J. Environ. Prot. Ecol. 2015, 16, 815–823. [Google Scholar]
- Davies, H.W.; Vlaanderen, J.J.; Henderson, S.B.; Brauer, M. Correlation between co-exposures to noise and air pollution from traffic sources. Occup. Environ. Med. 2009, 66, 347–350. [Google Scholar] [CrossRef]
- Schroeder, J.; Nakagawa, S.; Cleasby, I.R.; Burke, T. Passerine birds breeding under chronic noise experience reduced fitness. PLoS ONE 2012, 7, 1–8. [Google Scholar] [CrossRef] [PubMed] [Green Version]
- Tilgar, V.; Hein, K.; Viigipuu, R. Anthropogenic noise alters the perception of a predator in a local community of great tits. Anim.Behav. 2022, 189, 91–99. [Google Scholar] [CrossRef]
- Francis, C.D. Vocal traits and diet explain avian sensitivities to anthropogenic noise. Glob. Chang. Biol. 2015, 21, 1809–1820. [Google Scholar] [CrossRef] [PubMed]
- Önsal, Ç.; Yelimlieş, A.; Akçay, Ç. Aggression and multi-modal signaling in noise in a common urban songbird. Behav. Ecol. Sociobiol. 2022, 76, 102. [Google Scholar] [CrossRef]
- Nemeth, E.; Pieretti, N.; Zollinger, S.A.; Geberzahn, N.; Partecke, J.; Mirand, A.C.; Brumm, H. Bird song and anthropogenic noise: Vocal constraints may explain why birds sing higher-frequency songs in cities. Proc. R. Soc. B 2013, 280, 20122798. [Google Scholar] [CrossRef] [Green Version]
- De Framond, L.; Brumm, H. Long-term effects of noise pollution on the avian dawn chorus: A natural experiment facilitated by the closure of an international airport. Proc. R. Soc. B 2022, 289, 20220906. [Google Scholar] [CrossRef]
- Luther, D.; Baptista, L. Urban noise and the cultural evolution of bird songs. Proc. R. Soc. B 2010, 277, 469–473. [Google Scholar] [CrossRef] [Green Version]
- Barbosa, K.V.D.C.; Rodewald, A.D.; Ribeiro, M.C.; Jahn, A.E. Noise level and water distance drive resident and migratory bird species richness within a Neotropical megacity. Landsc. Urban Plan. 2020, 197, 103769. [Google Scholar] [CrossRef]
- Carvajal-Castro, J.D.; Ana María Ospina, L.; Toro-López, Y.; Anny Pulido, G.; Cabrera-Casas, L.X.; Guerrero-Peláez, S.; García-Merchán, V.H.; Vargas-Salinas, F. Birds vs bricks: Patterns of species diversity in response to urbanization in a Neotropical Andean city. PLoS ONE 2019, 14, e0218775. [Google Scholar] [CrossRef] [Green Version]
- Ciach, M.; Fröhlich, A. Habitat type, food resources, noise and light pollution explain the species composition, abundance and stability of a winter bird assemblage in an urban environment. Urban Ecosyst. 2017, 20, 547–559. [Google Scholar] [CrossRef] [Green Version]
- De Castro Pena, J.C.; Martello, F.; Ribeiro, M.C.; Armitage, R.A.; Young, R.J.; Rodrigues, M. Street trees reduce the negative effects of urbanization on birds. PLoS ONE 2017, 12, e0174484. [Google Scholar] [CrossRef] [Green Version]
- Perillo, A.; Mazzoni, L.G.; Passos, L.F.; Goulart, V.D.L.R.; Duca, C.; Young, R.J. Anthropogenic noise reduces bird species richness and diversity in urban parks. Ibis 2017, 159, 638–646. [Google Scholar] [CrossRef]
- Rodrigues, A.G.; Borges-Martins, M.; Zilio, F. Bird diversity in an urban ecosystem: The role of local habitats in understanding the effects of urbanization. Iheringia Ser. Zool. 2018, 108, 1–11. [Google Scholar] [CrossRef] [Green Version]
- Riondato, E.; Pilla, F.; Sarkar Basu, A.; Basu, B. Investigating the effect of trees on urban quality in Dublin by combining air monitoring with i-Tree Eco model. Sustain. Cities Soc. 2020, 61, 102356. [Google Scholar] [CrossRef]
- McPherson, E.G. Atmospheric carbon dioxide reduction by Sacramento’s urban forest. J. Arboric. 1998, 24, 215–223. [Google Scholar] [CrossRef]
- Hedblom, M.; Knez, I.; Gunnarsson, B. Bird diversity improves the well-being of city residents. In Ecology and Conservation of Birds in Urban Environments; Murgui, B., Hedblom, M., Eds.; Springer International Publishing: Cham, Switzerland, 2017; pp. 287–306. [Google Scholar] [CrossRef]
- Marselle, M.R.; Lindley, S.J.; Cook, P.A.; Bonn, A. Biodiversity and health in the urban environment. Curr. Environ. Health Rep. 2021, 8, 146–156. [Google Scholar] [CrossRef]
- Methorst, J.; Bonn, A.; Marselle, M.; Böhning-Gaese, K.; Rehdanz, K. Species richness is positively related to mental health—A study for Germany. Landsc. Urban Plan. 2021, 211, 104084. [Google Scholar] [CrossRef]


| Natural | Artificial | F1,31 | p-Value | |
|---|---|---|---|---|
| Tree species number | 18.19 | 14.94 | 2.388 | 0.132 |
| Tree density (number/ha) | 110.3 | 54.53 | 15.11 | 0.0005 |
| Native species number | 8.06 | 7.67 | 0.181 | 0.673 |
| Native tree density (number/ha) | 91.71 | 21.63 | 29.23 | <0.0001 |
| FDis | 0.130 | 0.162 | 13.38 | 0.001 |
| DBH (cm) | 60.5 | 50.82 | 2.721 | 0.109 |
| CV of DBH (%) | 81.95 | 83.67 | 0.060 | 0.809 |
| Noise (db) | 56.11 | 51.69 | 1.783 | 0.192 |
| Variance Partitioning | ||||
|---|---|---|---|---|
| ddl | Variance | F | p-Value | |
| Model | 3 | 0.0483 | 9.8855 | 0.001 |
| Residuals | 156 | 0.2542 | ||
| Test for Significance of the Model | ||||
| Inertia | Proportion | |||
| Total | 0.3026 | 1.0000 | ||
| Constrained | 0.0483 | 0.1597 | ||
| Unconstrained | 0.2542 | 0.8403 | ||
| Tests for Significance of the Coefficients | ||||
| ddl | Variance | F | p-Value | |
| Noise | 1 | 0.0311 | 19.06 | 0.001 |
| Section type | 1 | 0.0131 | 8.006 | 0.001 |
| CV of DBH | 1 | 0.0042 | 2.587 | 0.009 |
| Residuals | 156 | 0.2542 | ||
| Noise | Natural Section | CV of DBH | |
|---|---|---|---|
| Species number | ↓ *** | - | - |
| Bird number | - | - | - |
| FDis | ↓ *** | - | - |
| Beak length/mass | ↓ *** | - | - |
| Beak width/mass | ↓ *** | - | - |
| Beak depth/mass | ↓ *** | ↑ * | - |
| Tarsus length/mass | ↓ *** | - | - |
| Wing length/mass | ↓ *** | - | - |
| Tail length/mass | ↓ *** | - | - |
| Mass | ↑ *** | ↓ * | - |
| Range size | ↑ *** | ↓ *** | - |
| Color number | ↓ *** | - | - |
| Forest habitat | - | ↑ *** | ↑ * |
| Grassland habitat | - | - | - |
| Human-modified habitat | ↑ *** | ↓ ** | ↓ ** |
| Shrubland habitat | ↑ *** | - | - |
| Woodland habitat | ↓ *** | - | - |
| Frugivore | ↓ ** | - | - |
| Granivore | ↑ *** | - | ↓ ** |
| Terrestrial Herbivore | ↓ ** | - | - |
| Invertivore | ↓ *** | - | ↑ ** |
| Nectarivore | ↓ *** | - | - |
| Omnivore | - | - | ↑ * |
| Vertivore | - | - | - |
| Aerial primary lifestyle | ↓ *** | - | ↑ ** |
| Generalist primary lifestyle | ↓ ** | ↓ * | - |
| Insessorial primary lifestyle | ↓ ** | - | - |
| Terrestrial primary lifestyle | ↑ *** | - | ↓ *** |
| Gray | ↑ ** | ↓ ** | - |
| Black | ↓ *** | - | - |
| White | ↓ *** | - | ↑ ** |
| Brown-Cream | - | - | ↓ *** |
| Yellow-Orange | ↑ ** | - | ↑ *** |
| Red-Pink | - | - | - |
| Green | ↑ ** | - | ↑ *** |
| Blue | ↓ ** | - | ↑ *** |
Disclaimer/Publisher’s Note: The statements, opinions and data contained in all publications are solely those of the individual author(s) and contributor(s) and not of MDPI and/or the editor(s). MDPI and/or the editor(s) disclaim responsibility for any injury to people or property resulting from any ideas, methods, instructions or products referred to in the content. |
© 2023 by the authors. Licensee MDPI, Basel, Switzerland. This article is an open access article distributed under the terms and conditions of the Creative Commons Attribution (CC BY) license (https://creativecommons.org/licenses/by/4.0/).
Share and Cite
Hambuckers, A.; Delcourt, J.; Leborgne, B.; Cahill, J.R.A. Artificial Green Corridors in an Andean City as Effective Support of Avian Diversity. Diversity 2023, 15, 302. https://doi.org/10.3390/d15020302
Hambuckers A, Delcourt J, Leborgne B, Cahill JRA. Artificial Green Corridors in an Andean City as Effective Support of Avian Diversity. Diversity. 2023; 15(2):302. https://doi.org/10.3390/d15020302
Chicago/Turabian StyleHambuckers, Alain, Johann Delcourt, Bryan Leborgne, and Jennifer R. A. Cahill. 2023. "Artificial Green Corridors in an Andean City as Effective Support of Avian Diversity" Diversity 15, no. 2: 302. https://doi.org/10.3390/d15020302