
Phylogeography and Population History of Eleutharrhena macrocarpa (Tiliacoreae, Menispermaceae) in Southeast Asia’s Most Northerly Rainforests


Abstract
:1. Introduction
2. Materials and Methods
2.1. Morphological Observations and Analysis
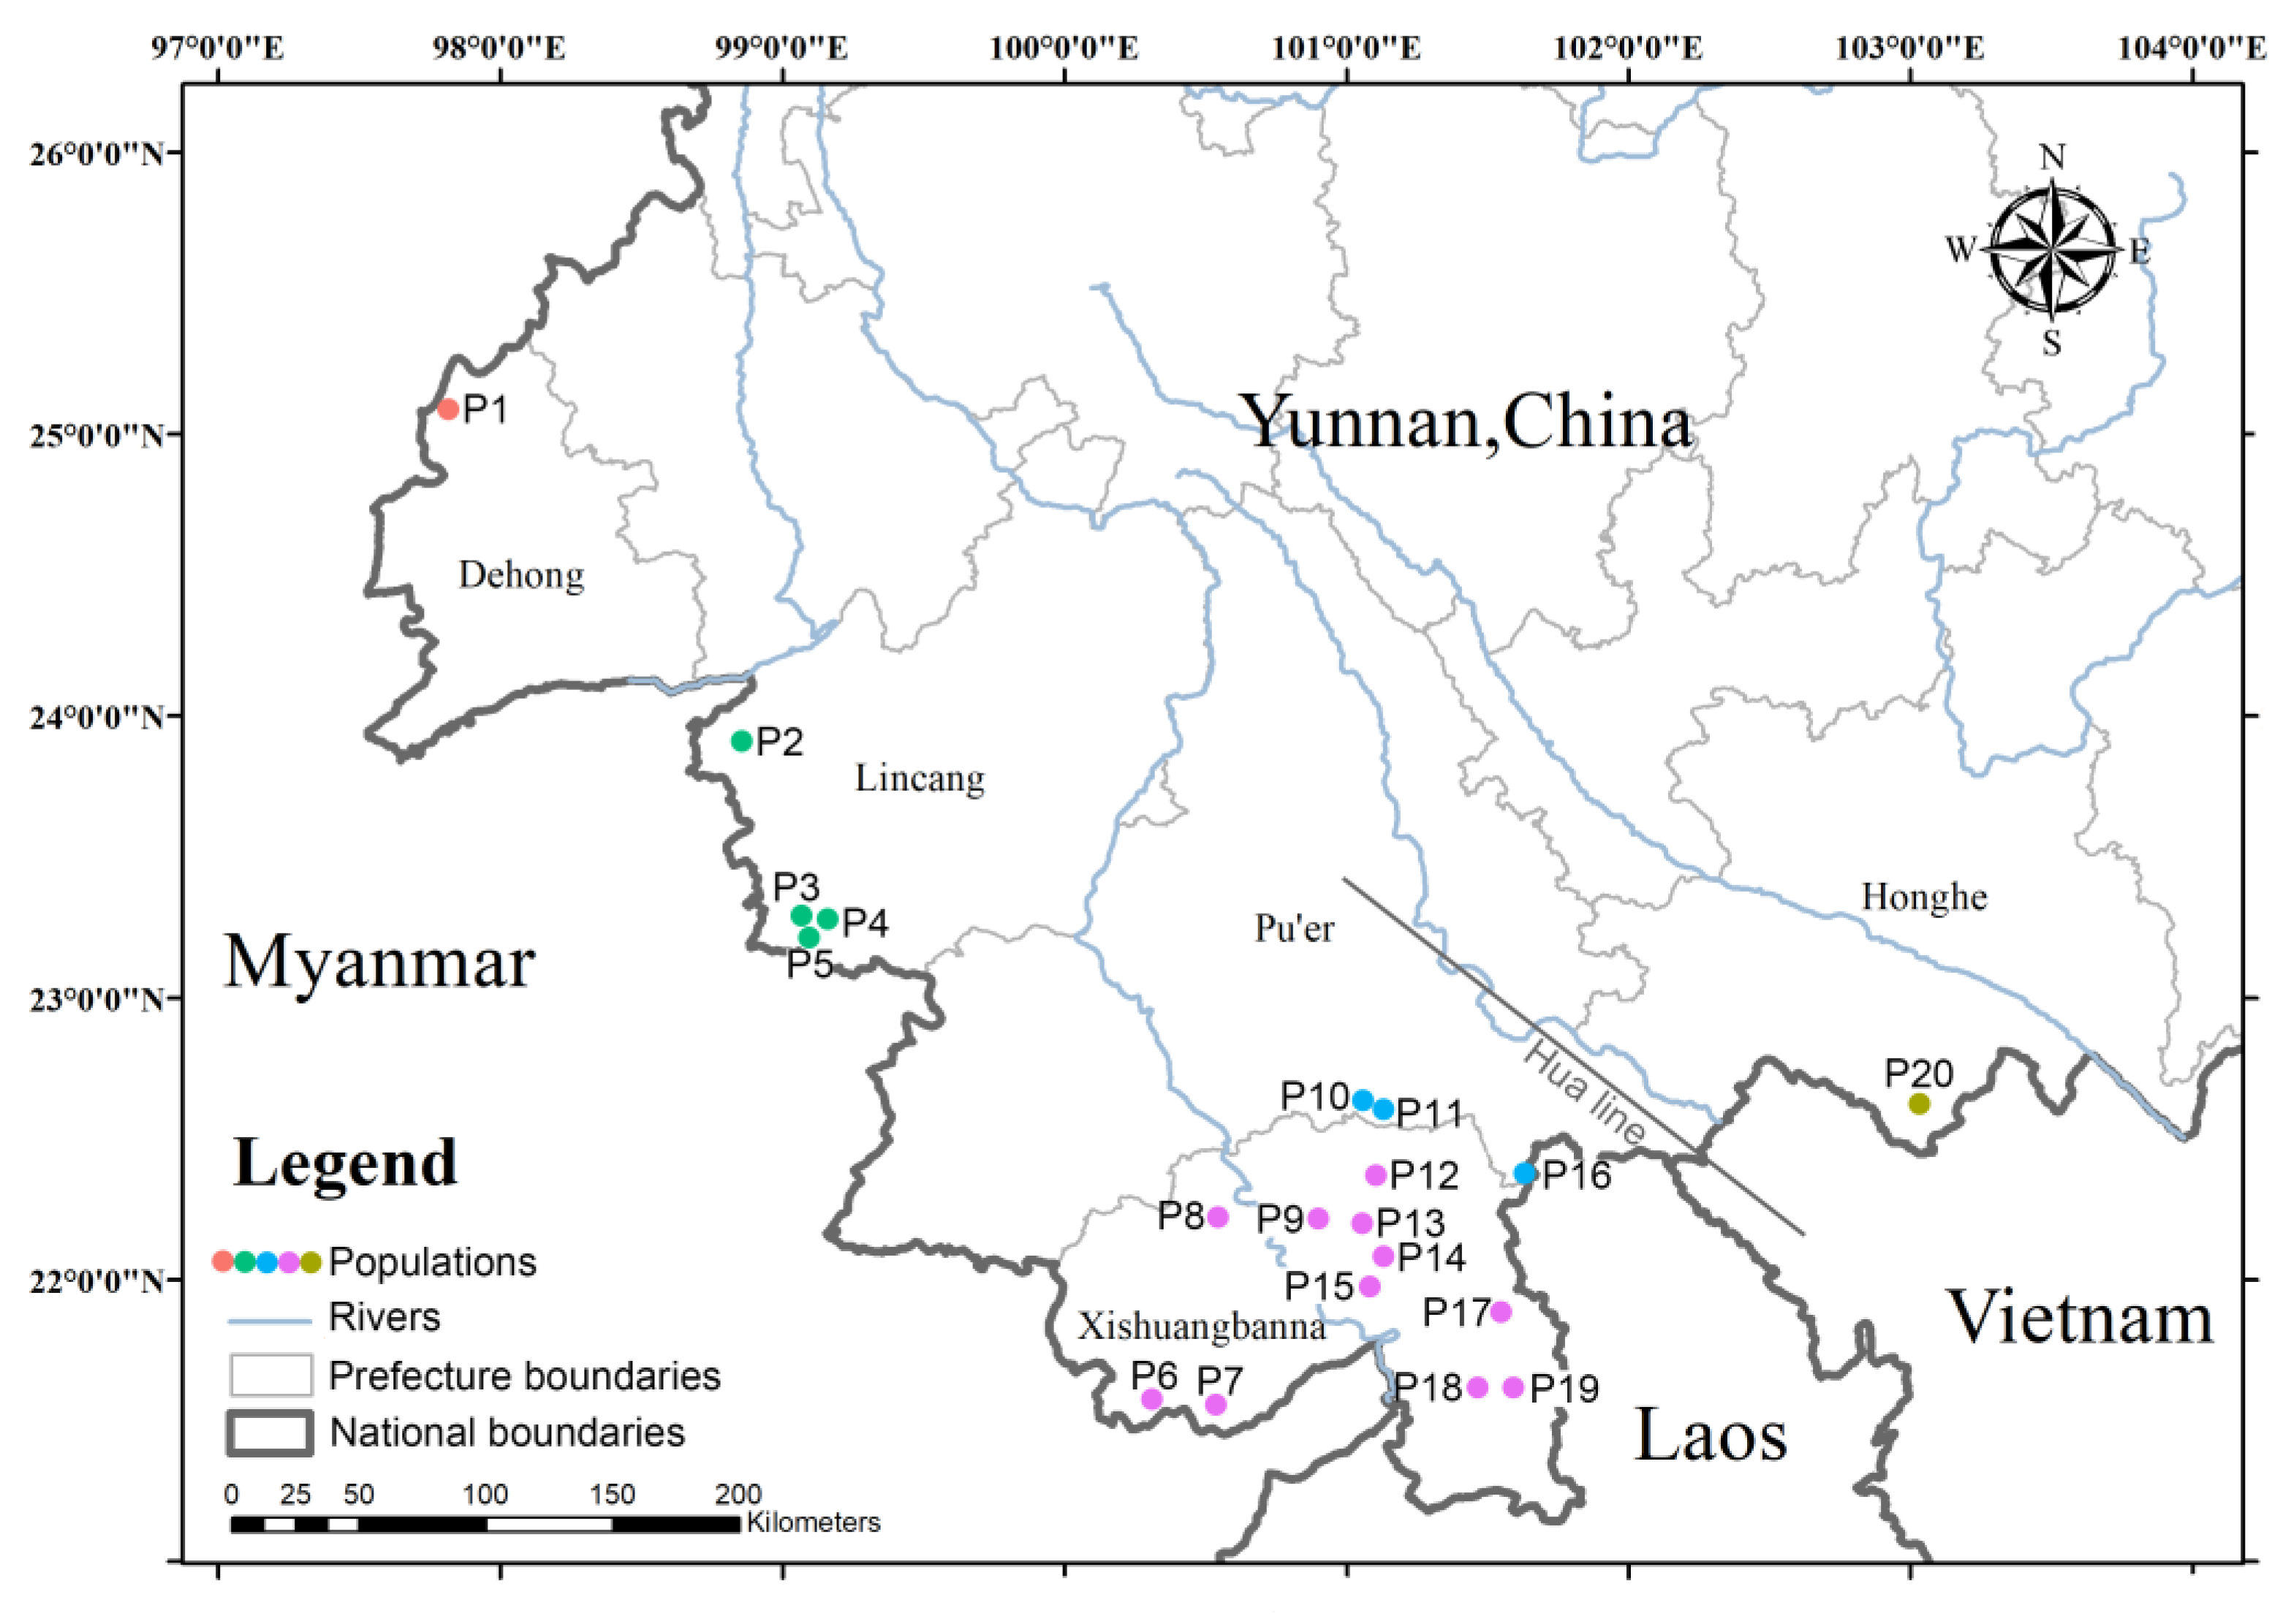
2.2. Sampling, DNA Extraction, PCR, and Electrophoresis
2.3. Phylogenetic Analysis, Dating, and Ancestral Area Reconstruction
2.4. Population Genetic Analysis
3. Results
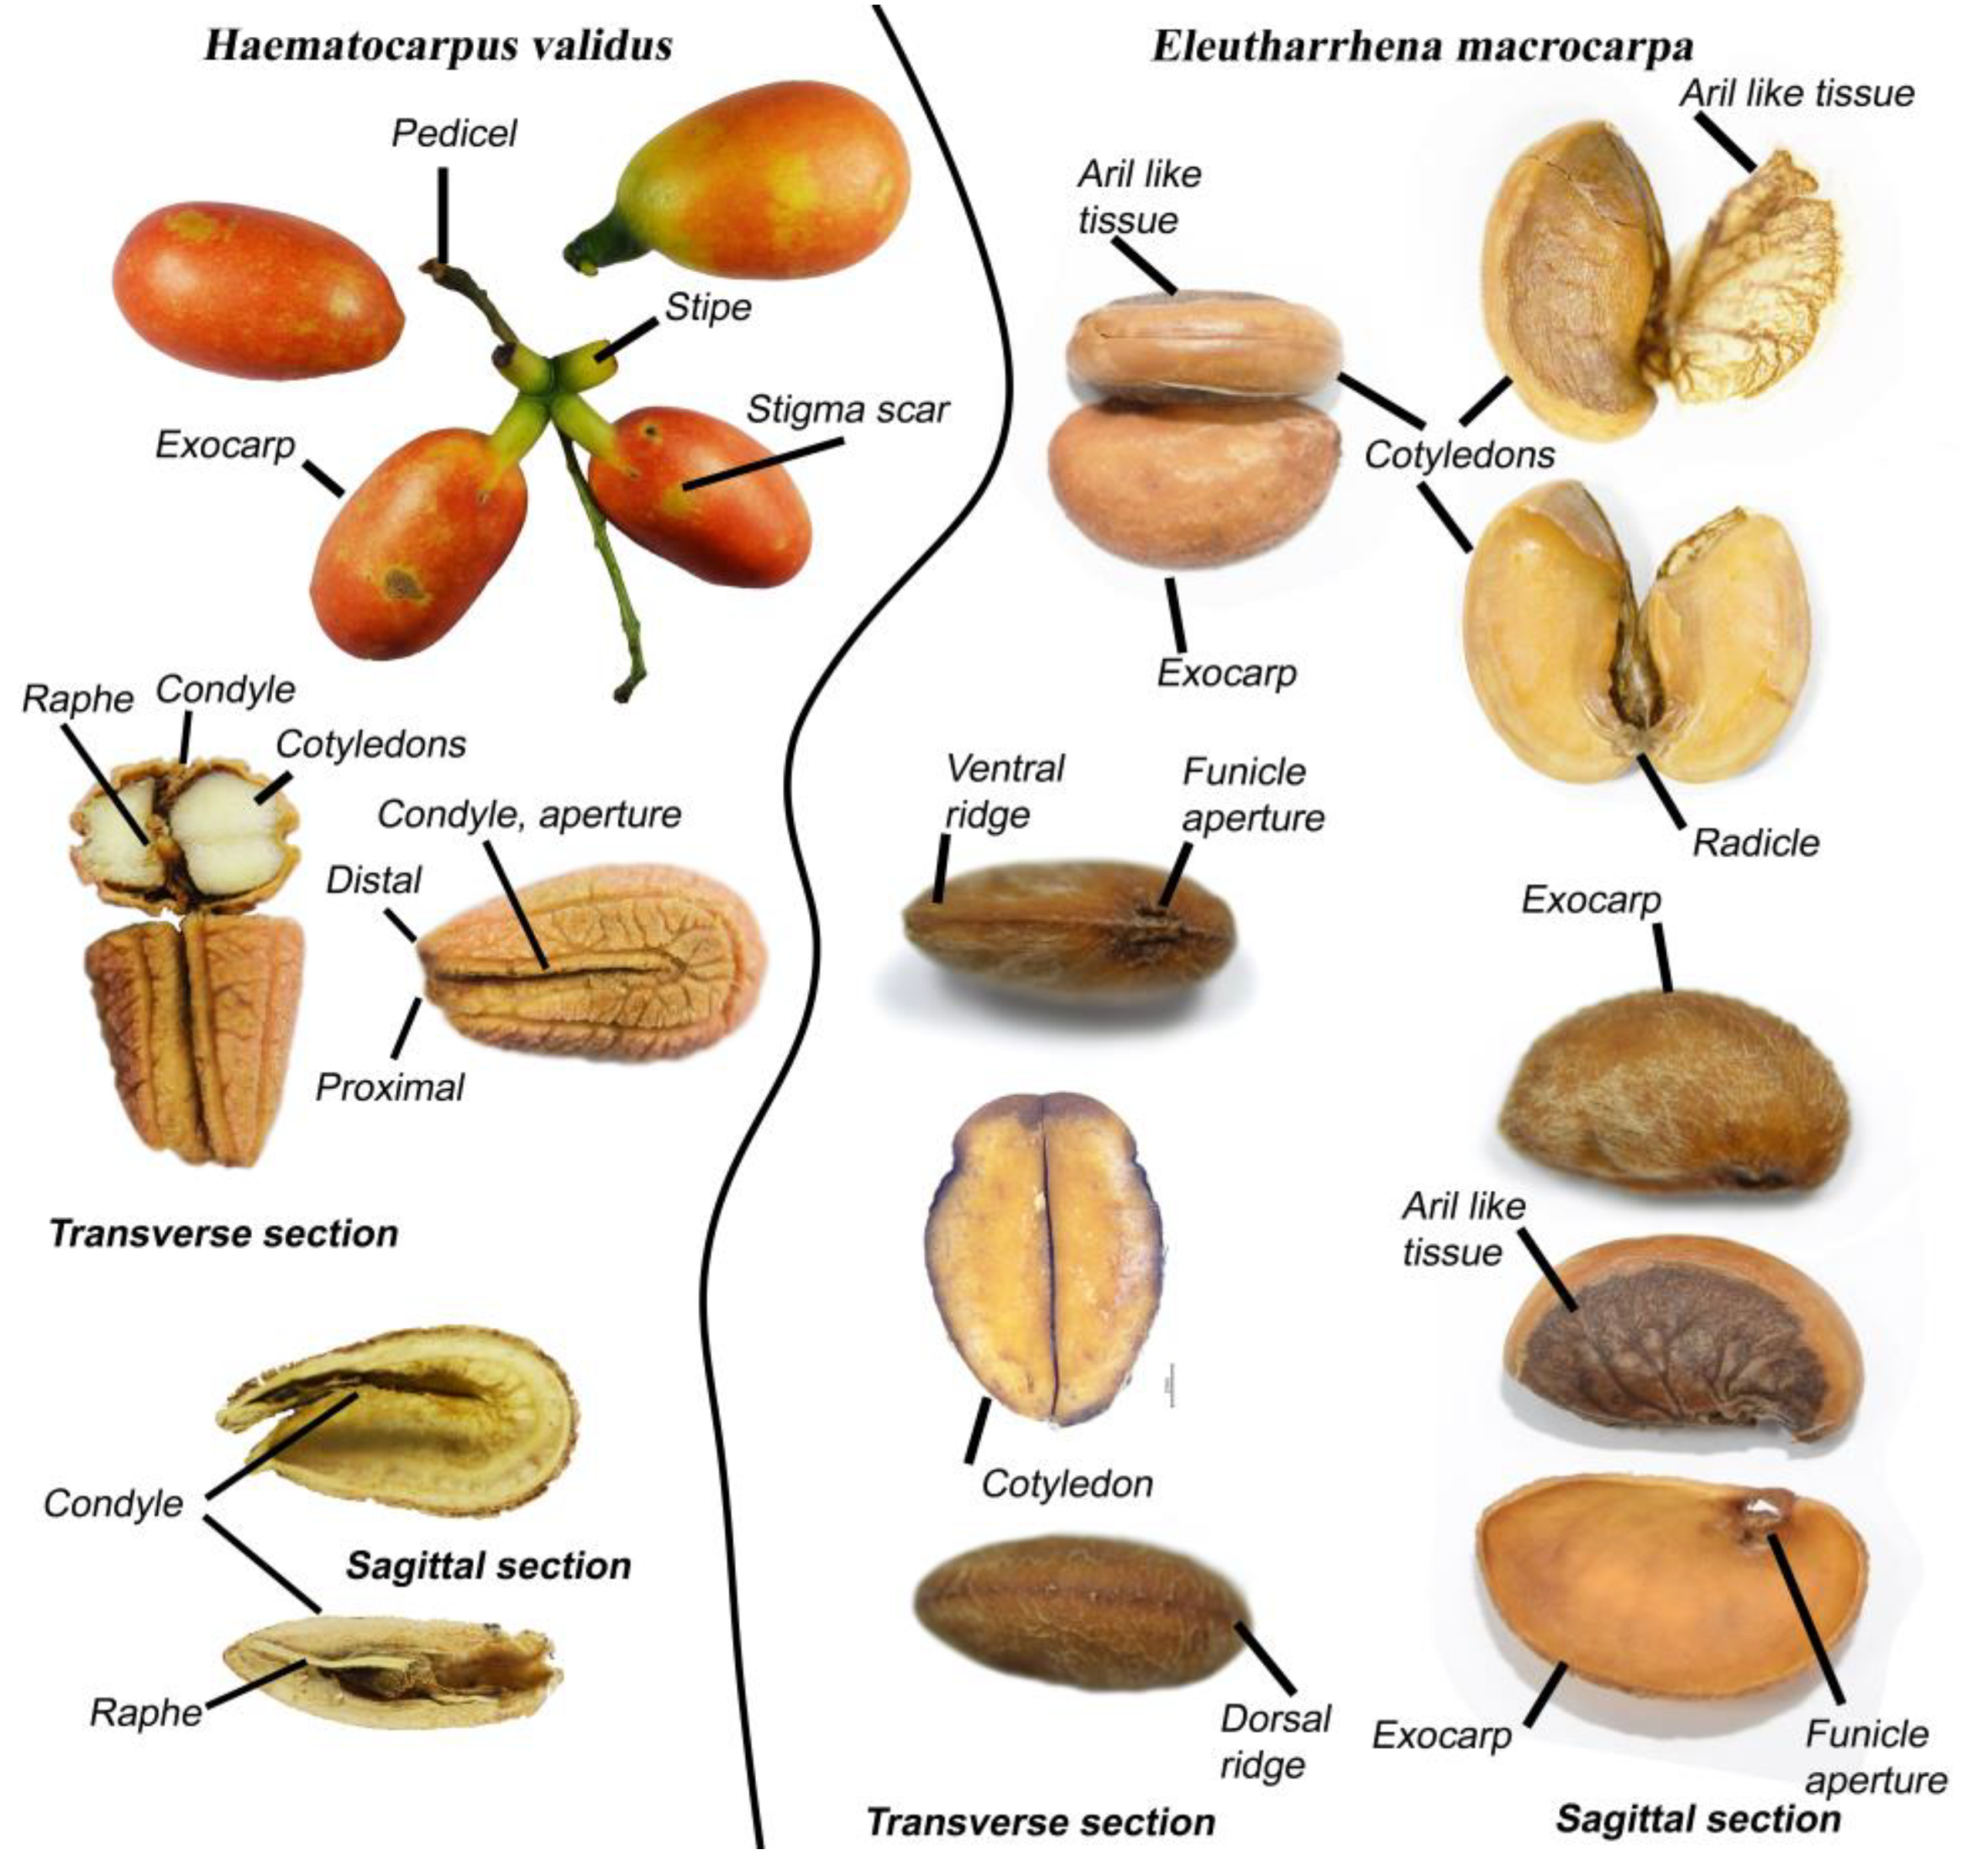
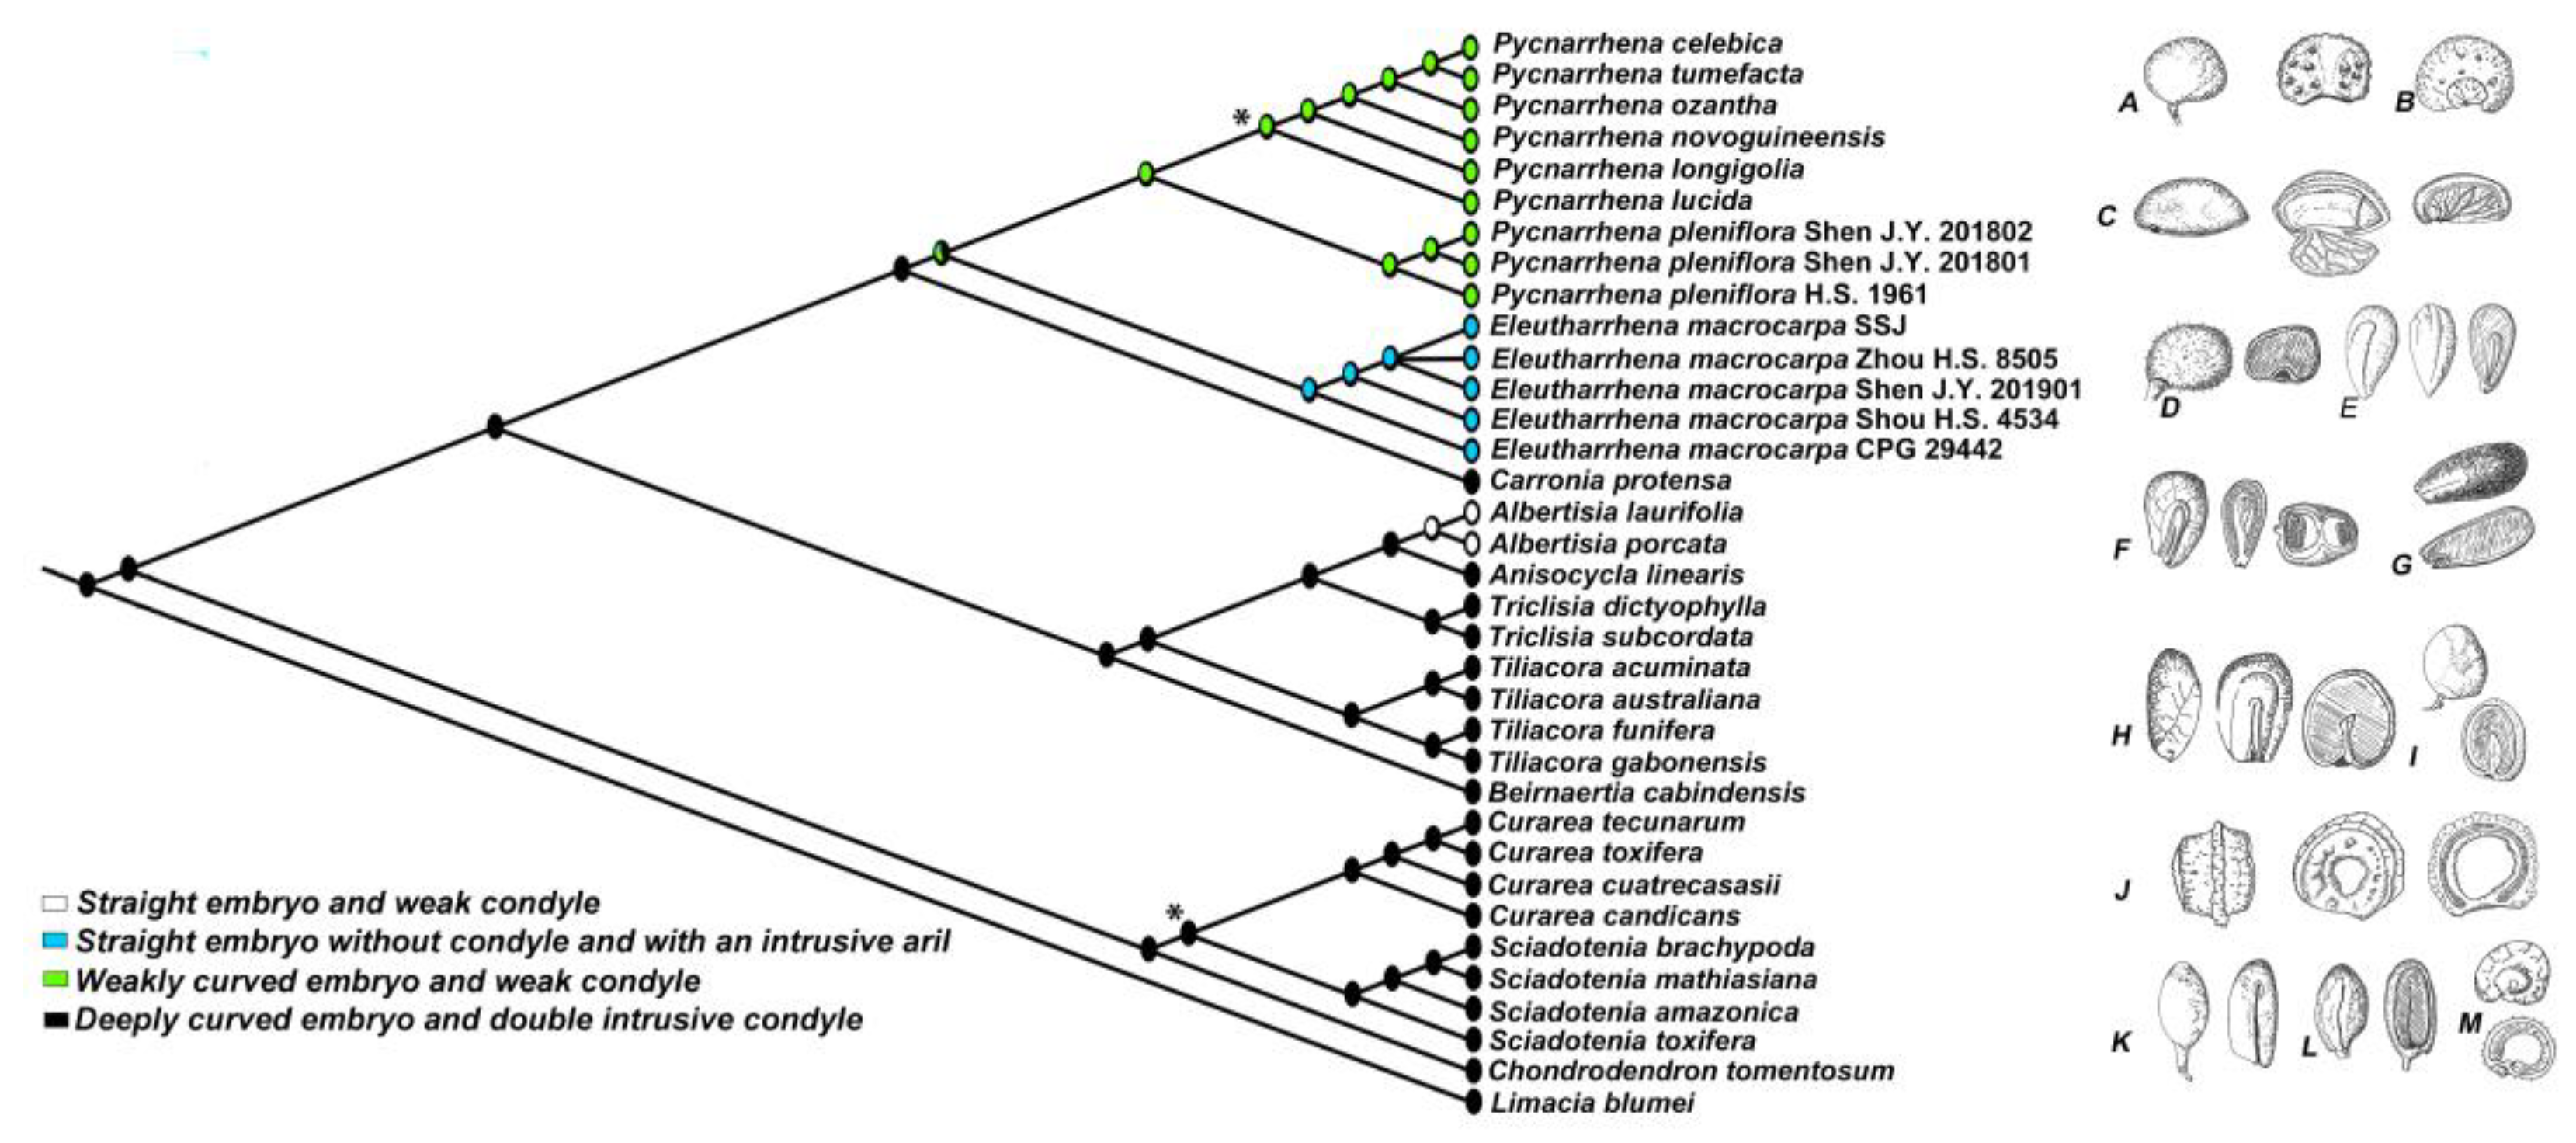
3.1. Endocarps
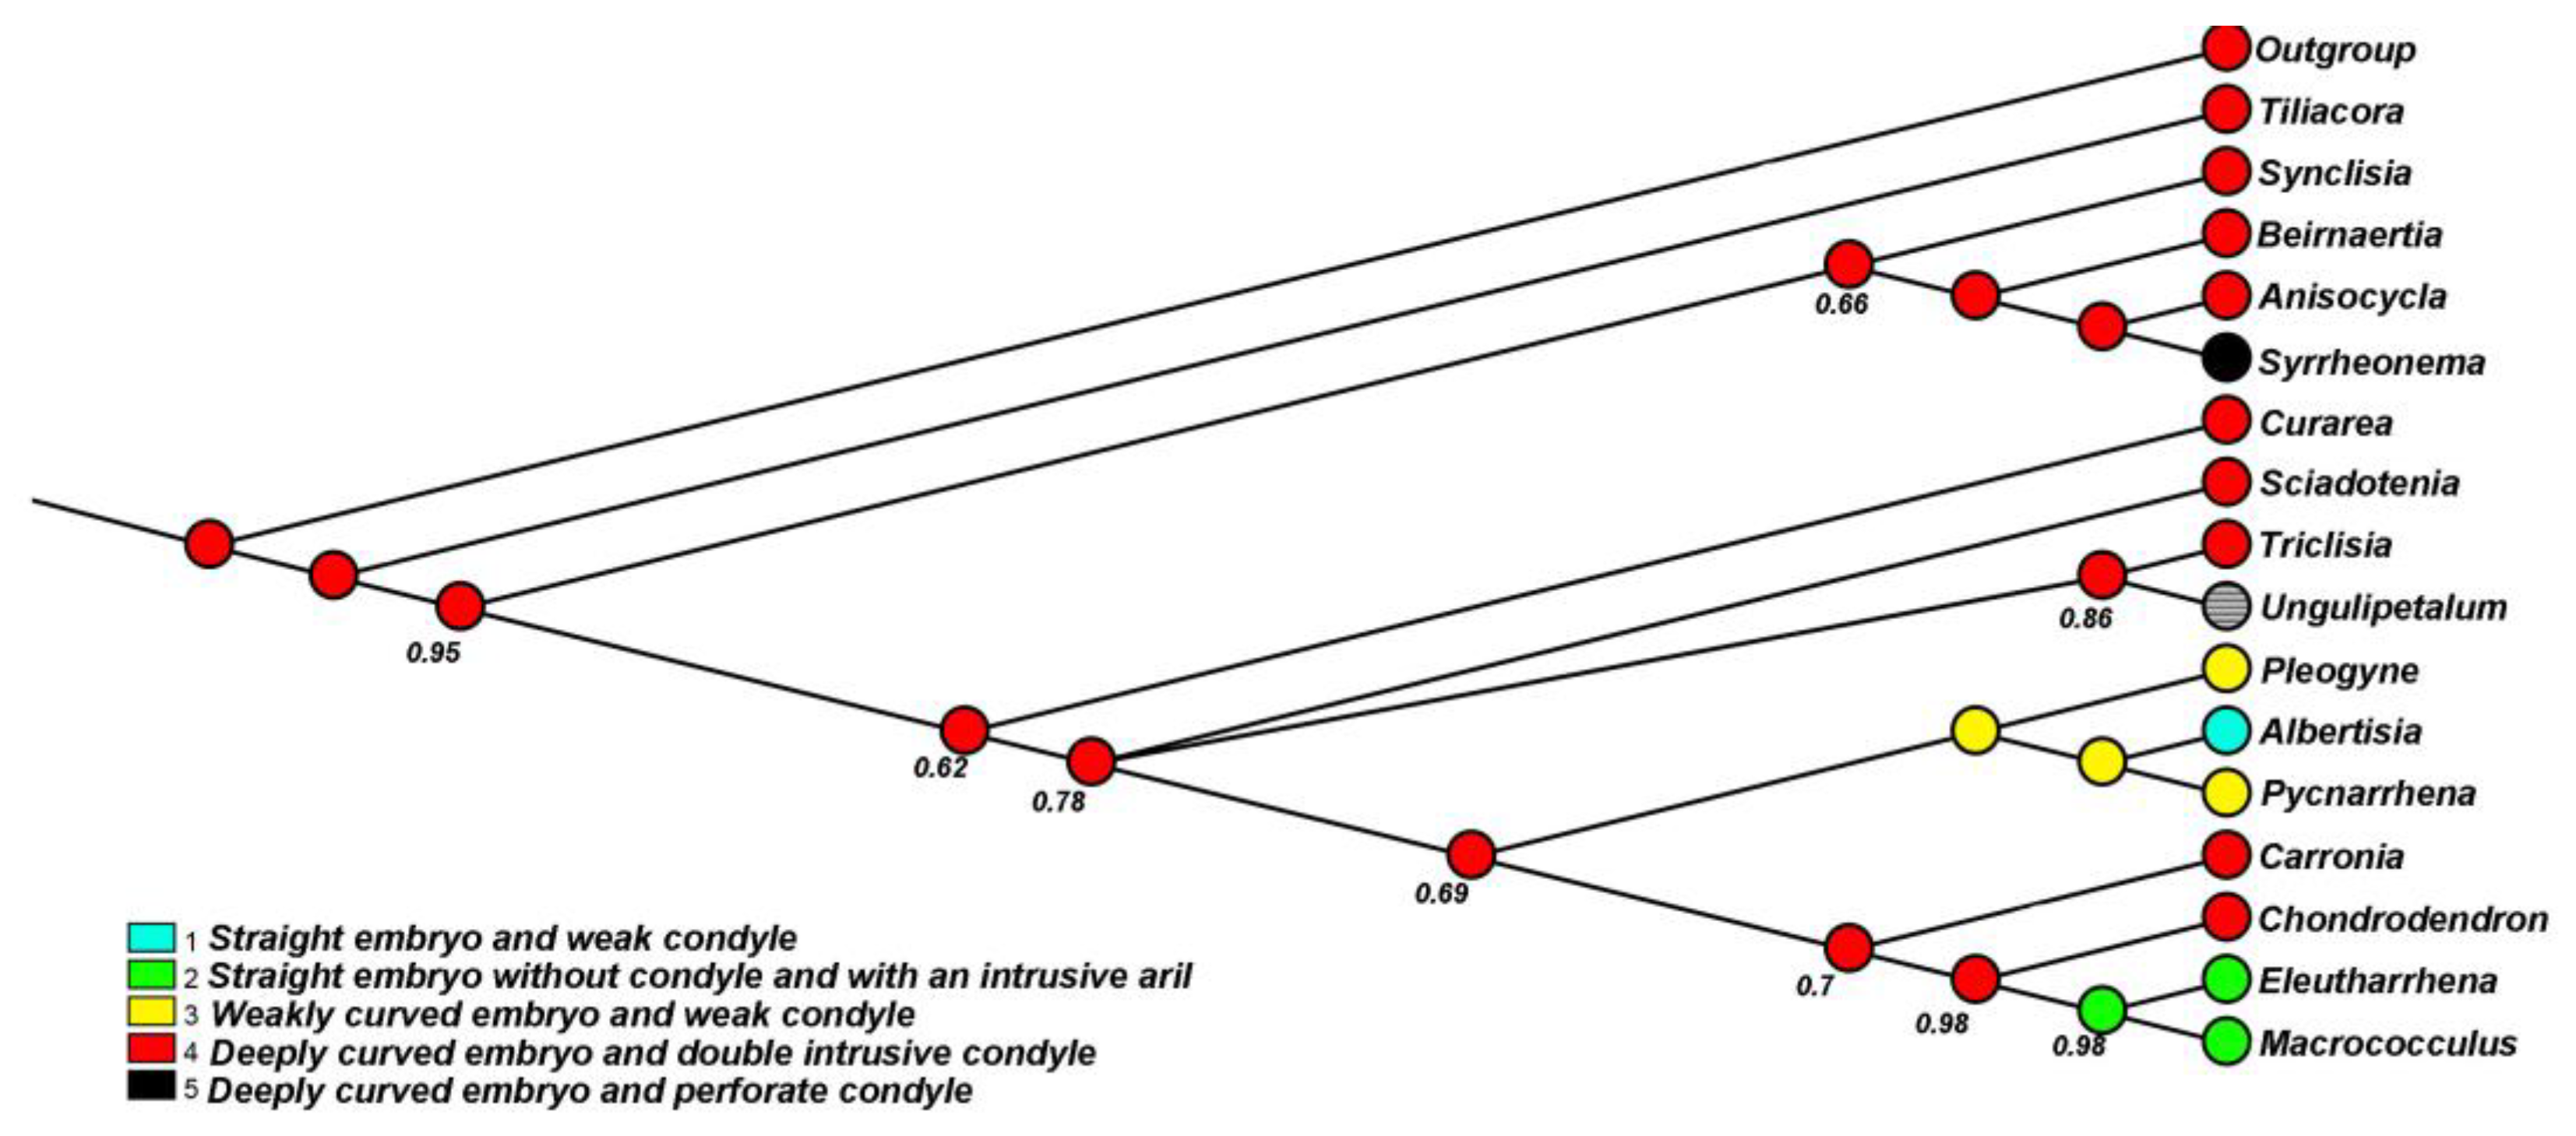
3.2. Phylogenetic Analyses
3.3. Dating Analyses
3.4. Ancestral Area Reconstruction of Eleutharrhena and Pycnarrhena
3.5. Population Genetic Diversity
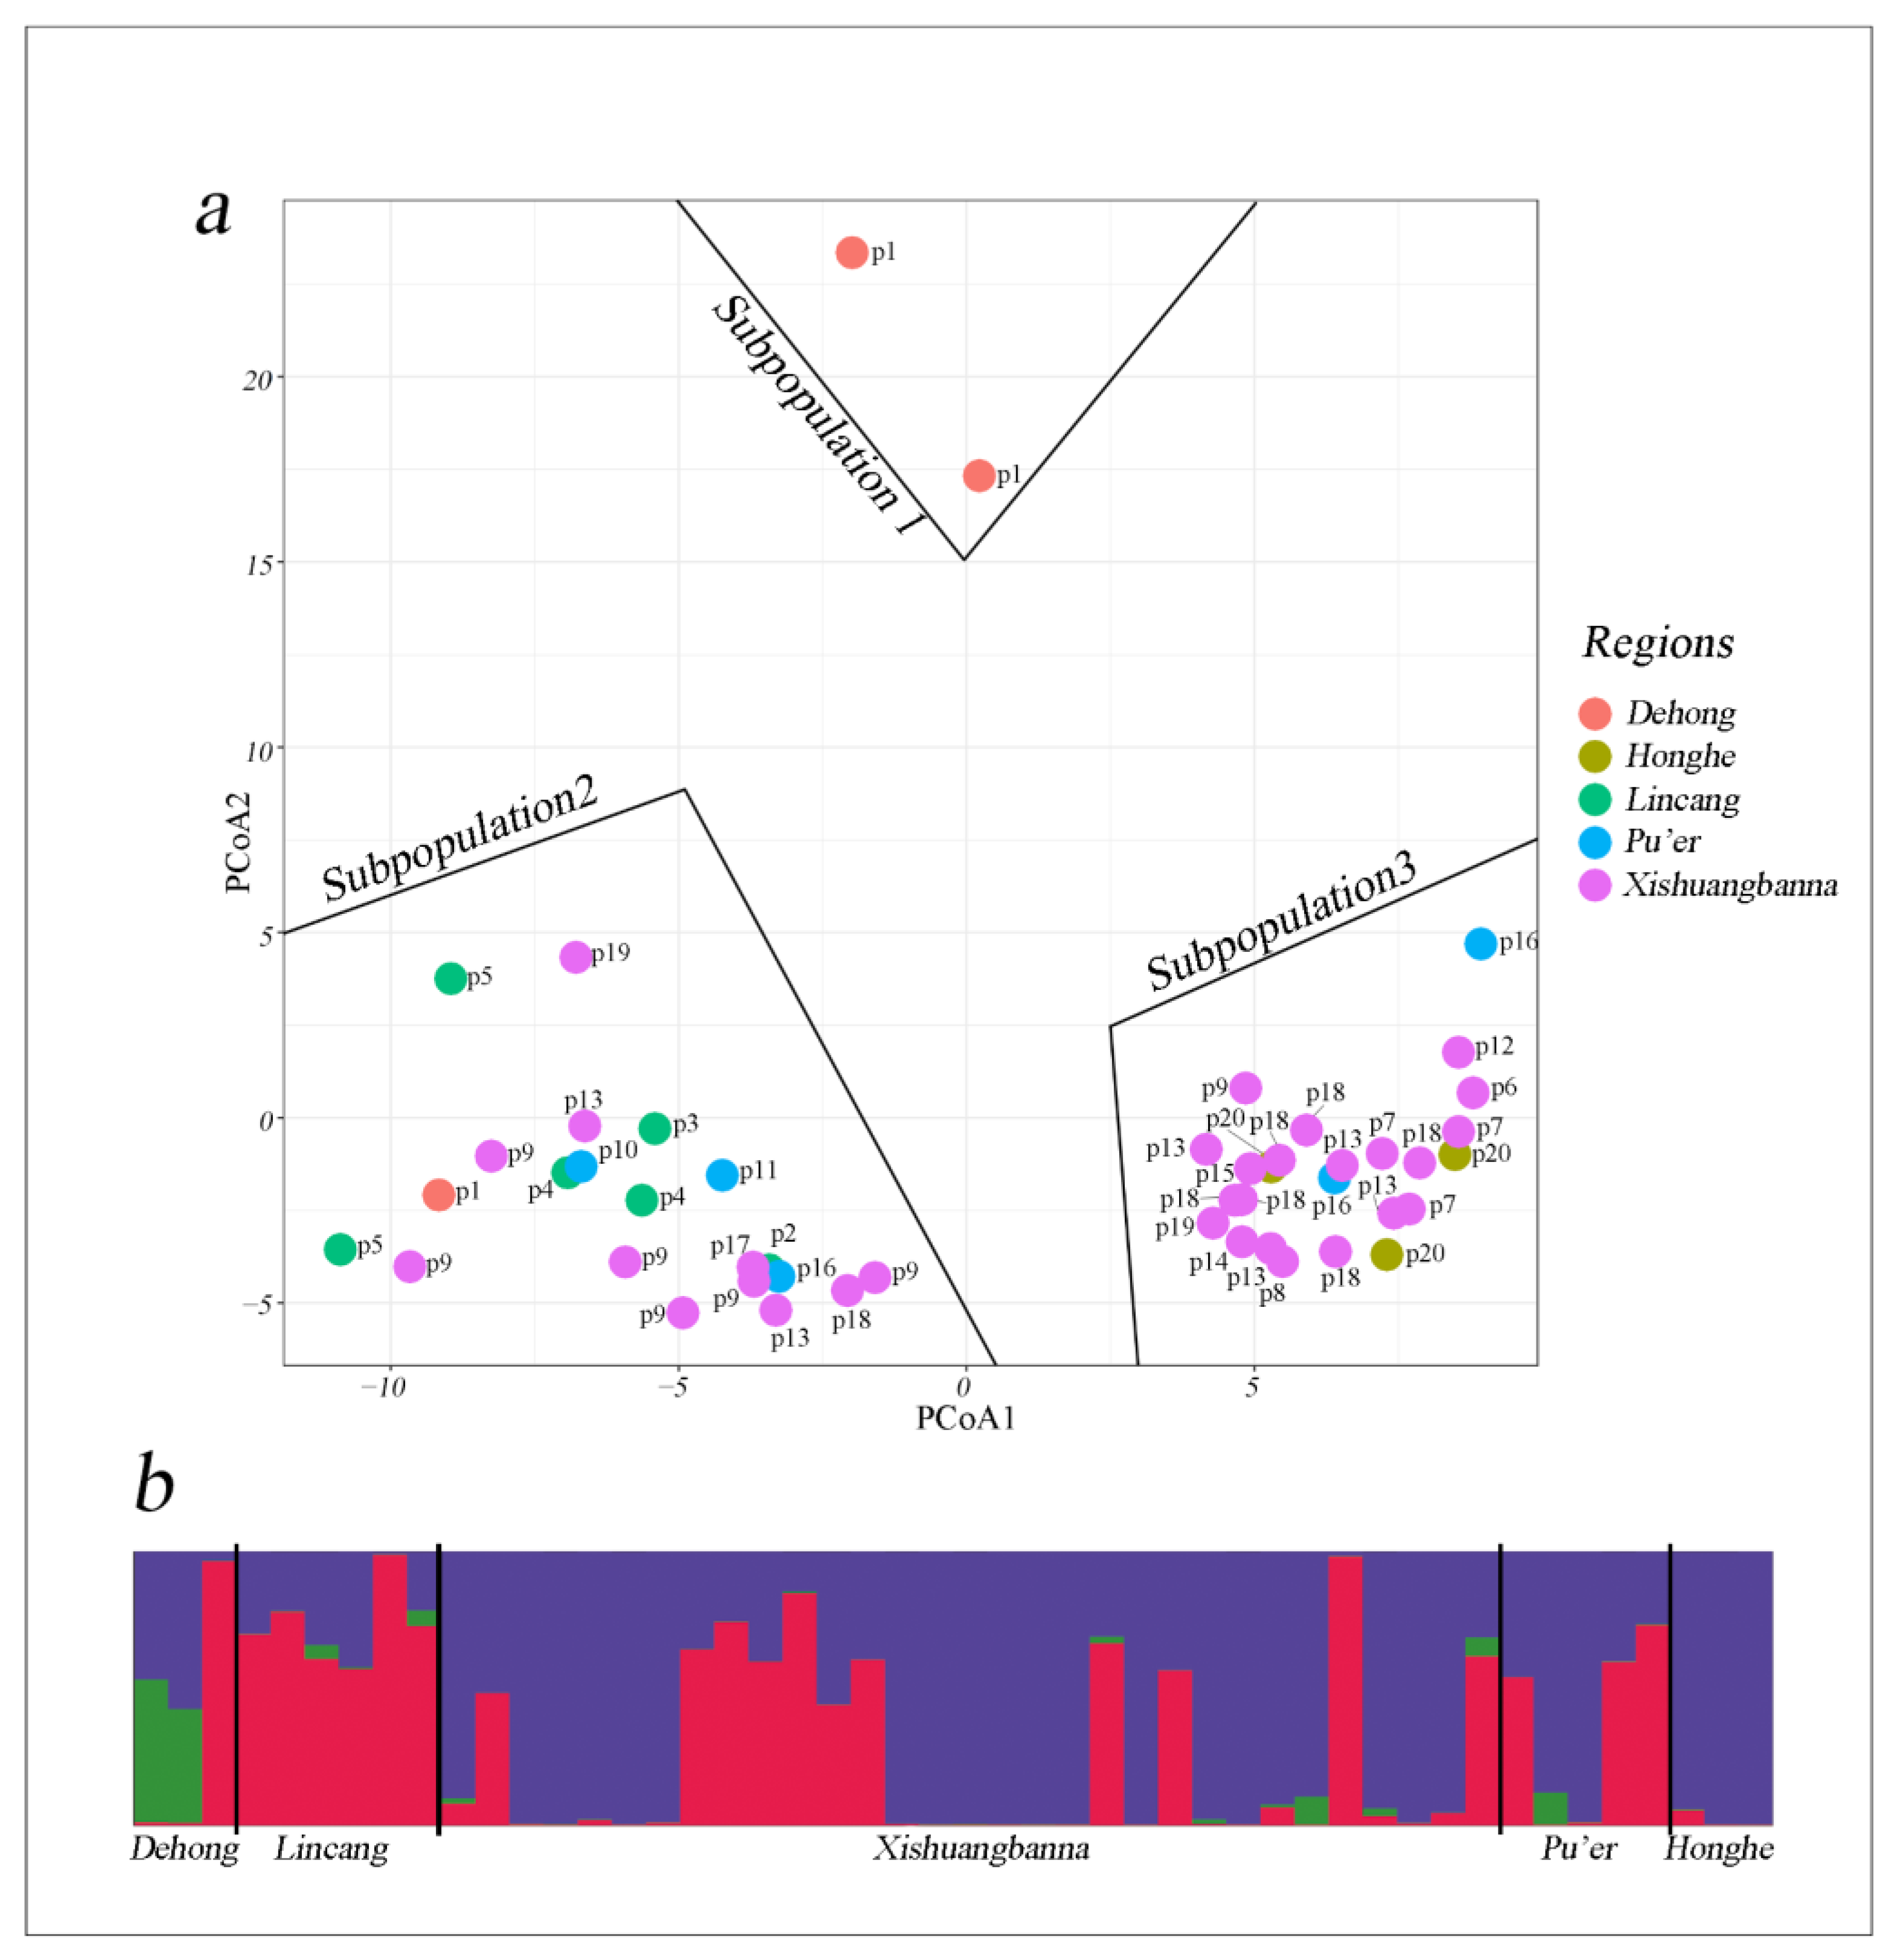
3.6. Cluster Analysis and Population Structure
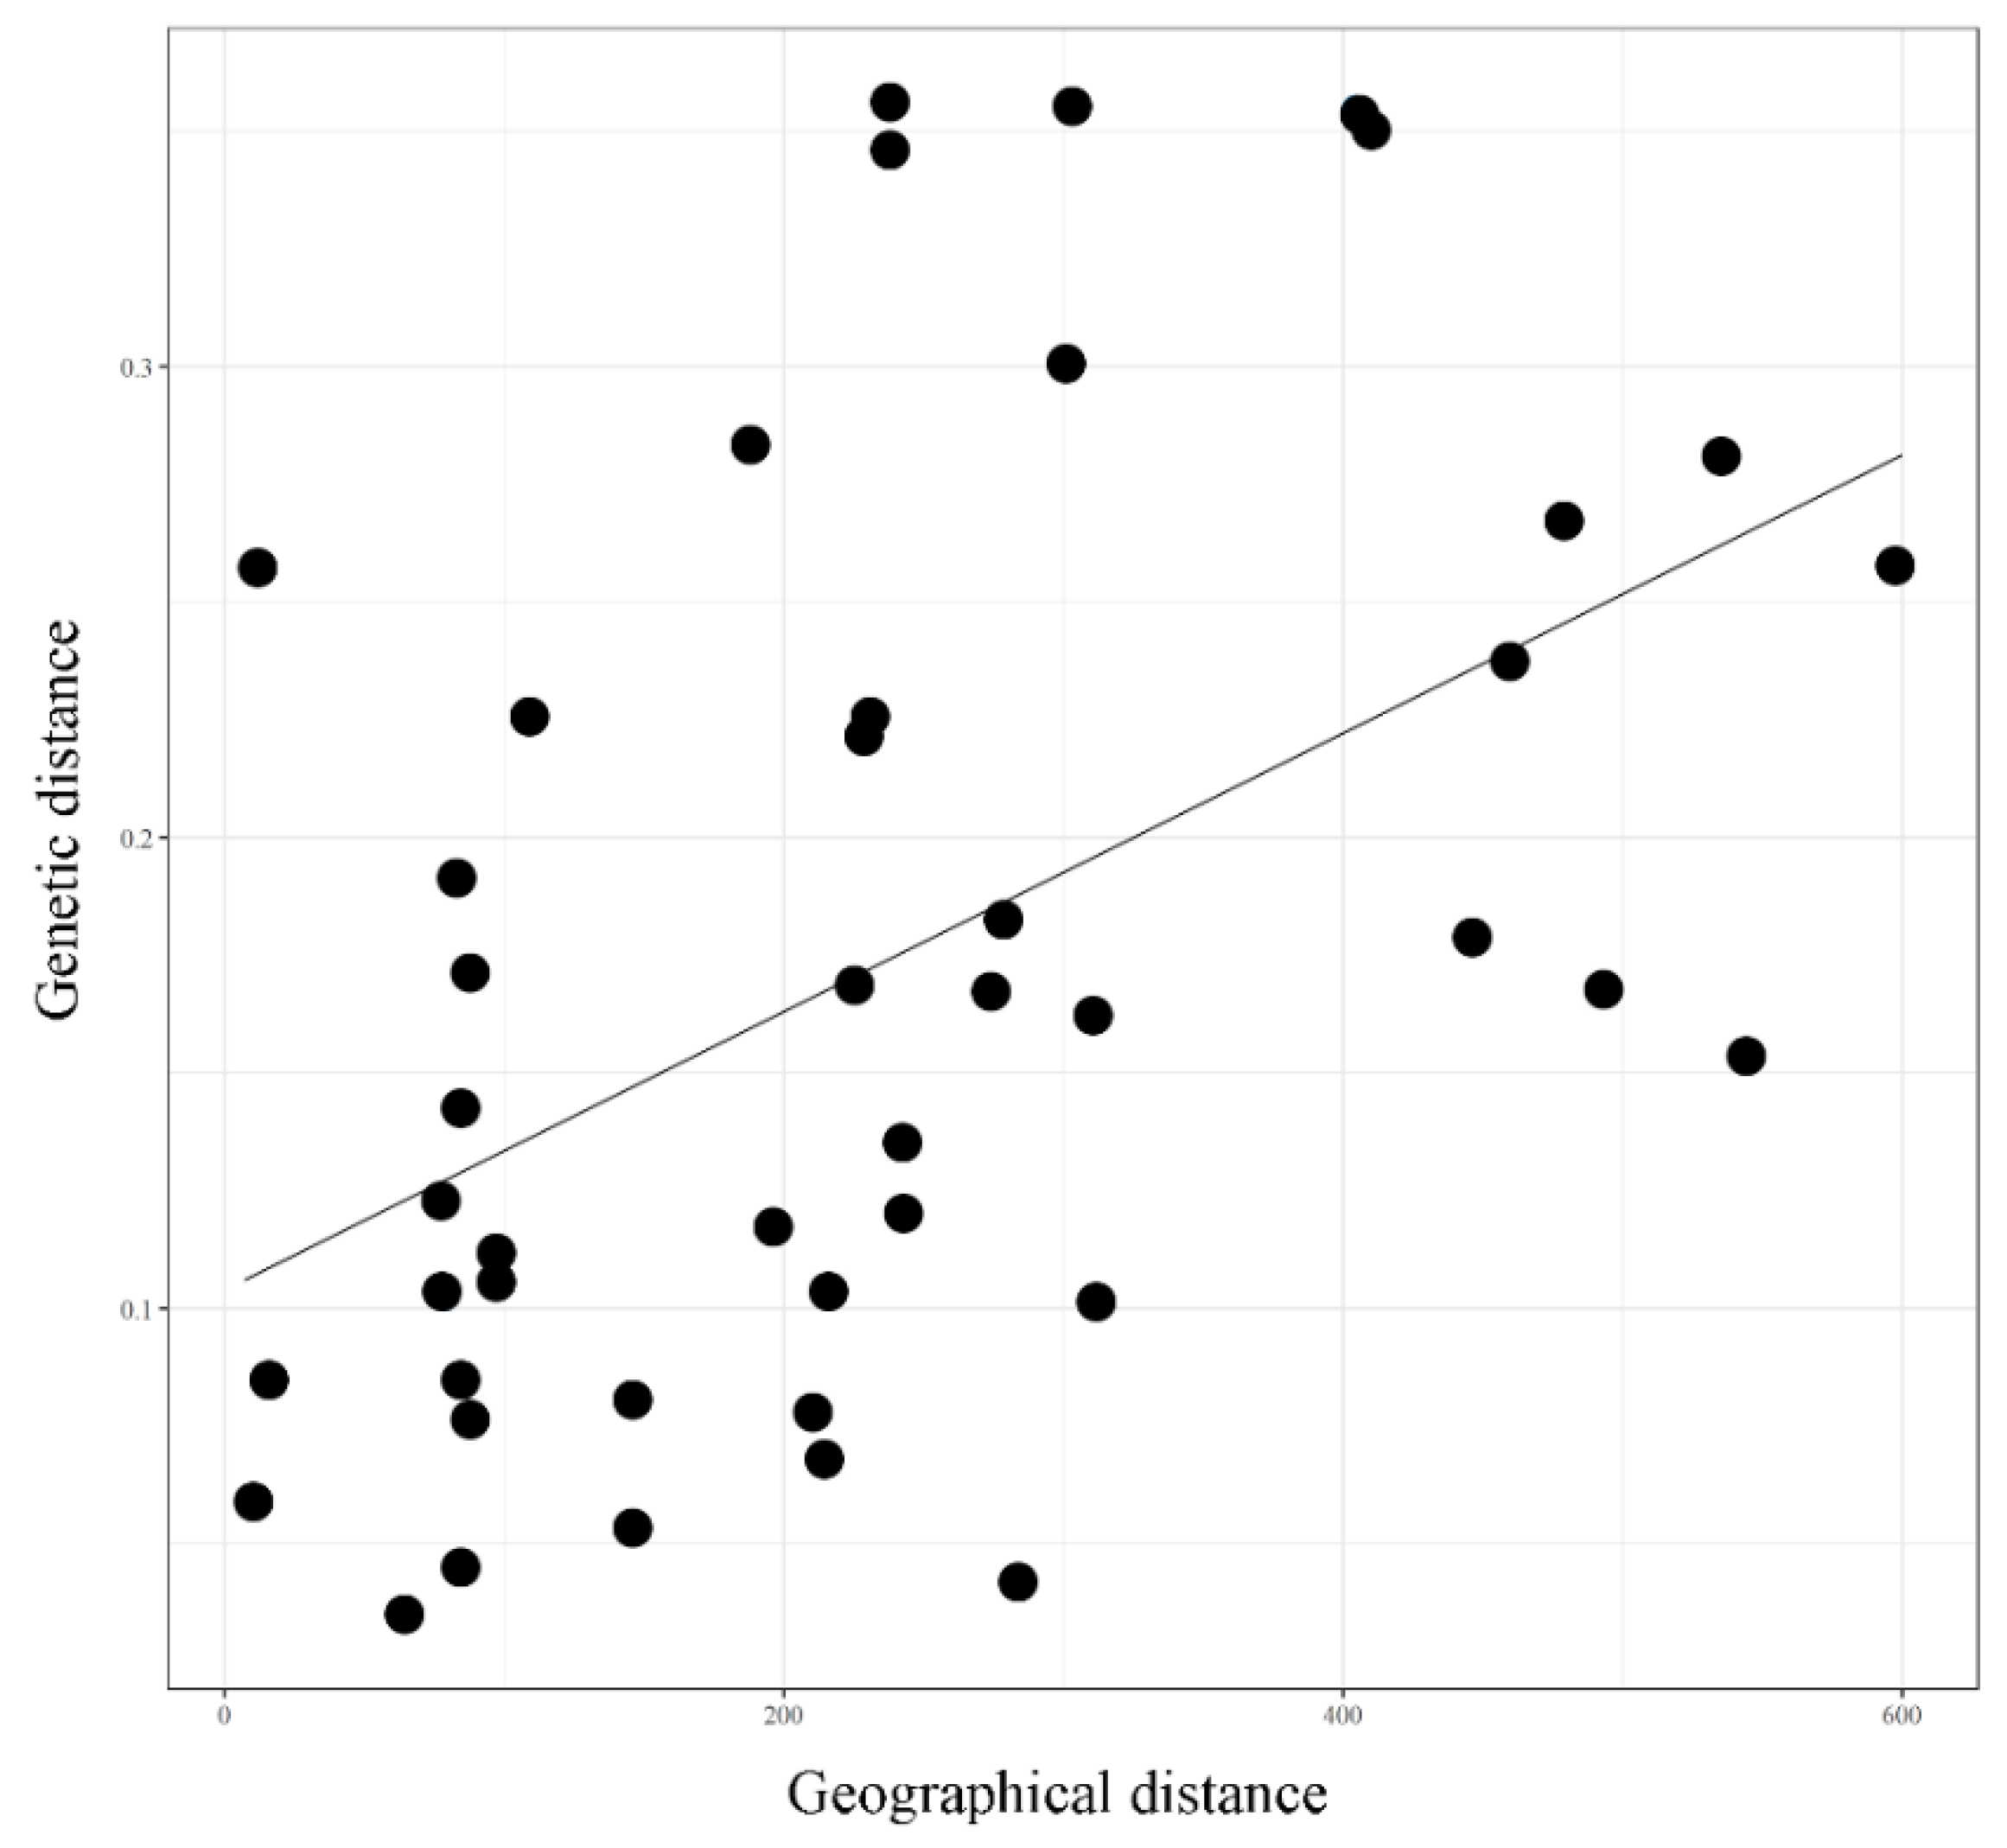
3.7. Analysis of Molecular Variance and Mantel’s Test
4. Discussion
4.1. Endocarp Morphology
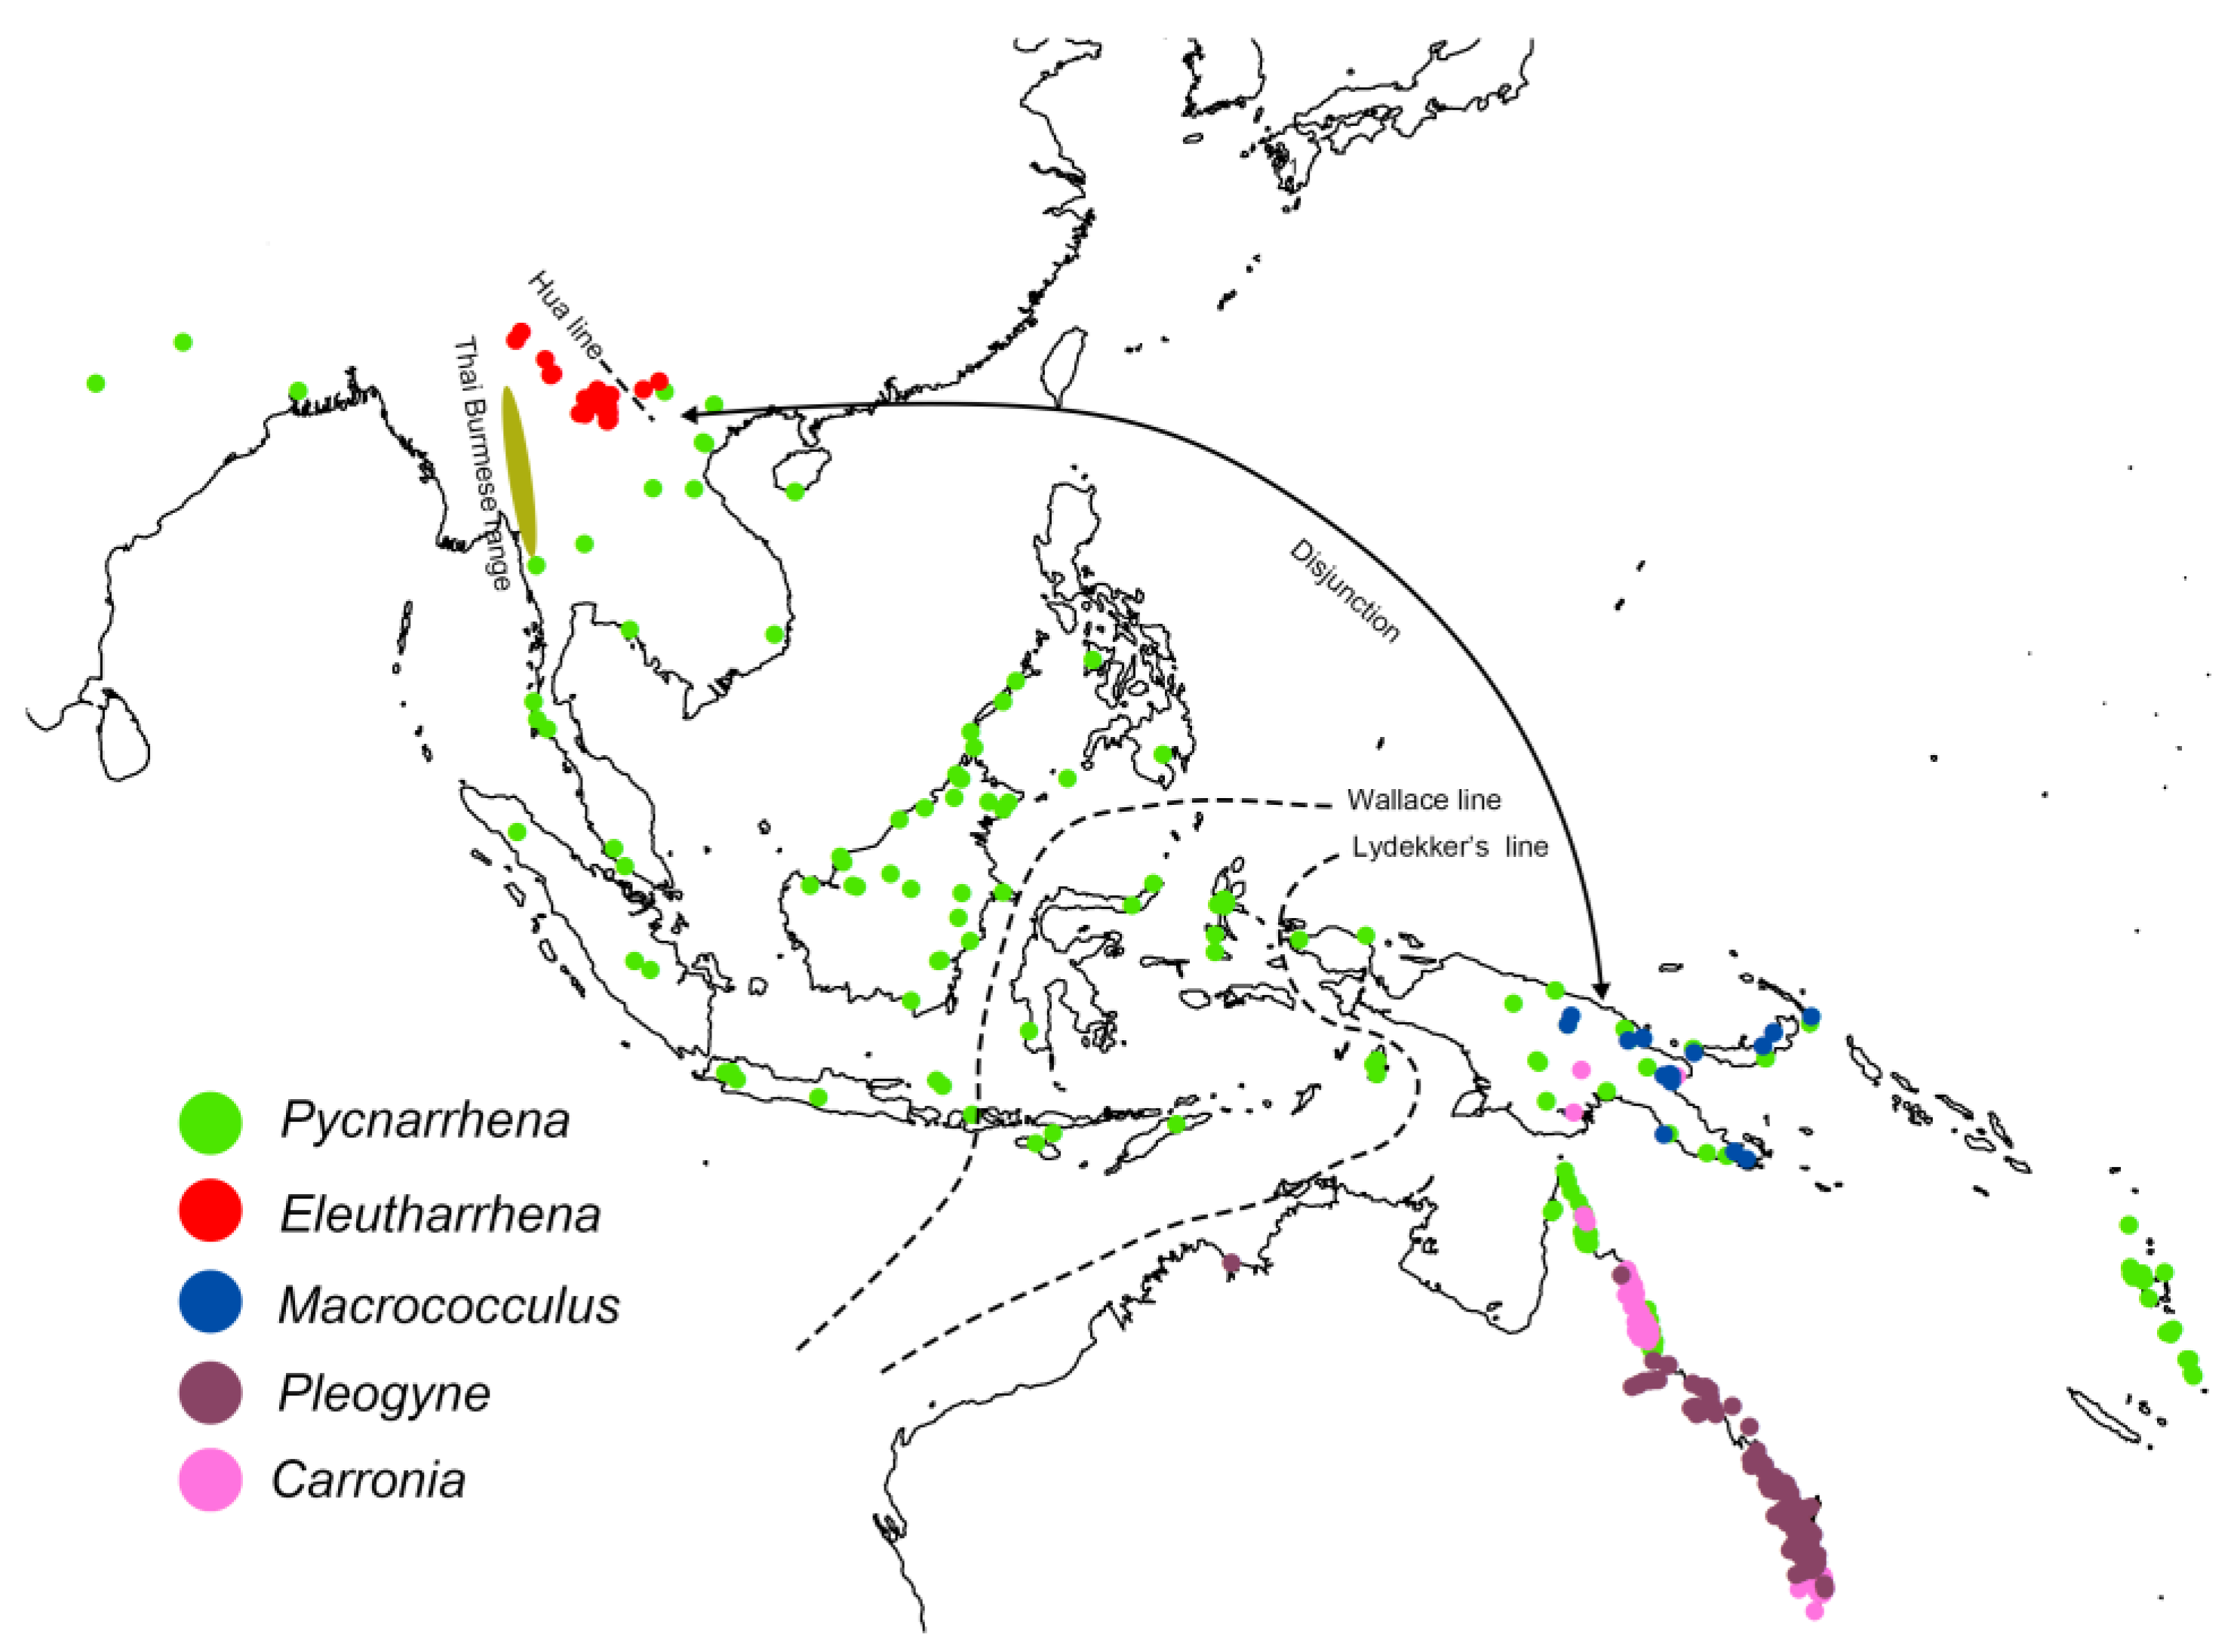
4.2. Tiliacoreae and Eleutharrhena Biogeography
4.3. Eleutharrhena Macrocarpa Population Structure
4.4. Evolutionary Distinctiveness
5. Conclusions
Author Contributions
Funding
Institutional Review Board Statement
Informed Consent Statement
Data Availability Statement
Acknowledgments
Conflicts of Interest
Appendix A

| No. | Morphological Characters | State 1 | State 2 | State 3 | State 4 | State 5 |
|---|---|---|---|---|---|---|
| 1 | Number of male sepals | 6 | 9 | 12 | >15 | - |
| 2 | Number of male petals | 0 | 3 | 6 | - | - |
| 3 | Number of stamens | 3 | 6 | 9 | >12 | - |
| 4 | Stamen fusion | Free | Basally fused | Fused | - | - |
| 5 | Anthers dehiscence | Transverse/oblique | Longitudinal | - | - | - |
| 6 | Connective | Absent | Present | - | - | - |
| 7 | Number of staminodes | 0 | 3 | 6 | - | - |
| 8 | Number of carpels | 3 | 6 | 9 | >12 | - |
| 9 | Condyle/seed | Absent/embryo straight or slightly curved | Absent/aril present, embryo straight | Weak/embryo slightly curved | double lameliform/embryo strongly curved | Perforate/embryo strongly curved |
| 10 | Endosperm | Absent | Present | - | - | - |
| 11 | Cauliflory | Yes | No | - | - | - |
| 12 | Pseudocorolla | Yes | No | - | - | - |
| 13 | Clustered stomata | Yes | No | - | - | - |
| 14 | Petals in female flower | Yes | No | - | - | - |
| 15 | Inflorescence | Cymose/fasciculate | Capituliform | Flowers single | - | - |
| 16 | Glands on petals | Yes | No | - | - | - |
| 17 | Coroniform sepals | Yes | No | - | - | - |
| Taxon, voucher, locality, rbcL, atpB, matK, ndhF, trnL-F, trnH-psbA, rps16, 26S rDNA, and ITS. |
| Albertisia laurifolia, Hong Y.P. 99371 (PE), Hainan, FJ626590, HQ260813, EF143849, JN051700, MW633412, MW633442, MW621979, EF143841; Albertisia porcata, McPherson 16678 (MO), Gabon, HQ260758, HQ260814, KX384047, EF624261, KX384110, MW633413, MW633443, MW621980, -; Anisocycla linearis, Hong-Wa et al. 466 (MO), Madagascar, HQ260759, HQ260816, JN051805, EF624263, JN051739, MW633414, MW633444, MW621981, MW621214; Beirnaertia cabindensis, Walters and Niangadouma 1267 (MO), Gabon, HQ260766, HQ260822, JN051811, EF624270, JN051745, MW633415, MW633445, MW621982, MW621215; Carronia protensa, van der Werff and Gray 17049 (MO), Australia, HQ260769, HQ260825, JN051815, EF624274, JN051749, MW633416, MW633446, MW621983, MW621216; Chondrodendron tomentosum, Ortiz et Vásquez 217 (AMAZ, MO), Peru, HQ260771, HQ260828, JN051818, EF624278, JN051752, MW633417, MW633447, KM364844, -; Curarea candicans, Torke 310 (MO), Guyana, HQ260776, HQ260832, JN051824, EF624288, JN051758, MW633418, MW633448, -, MW621217; Curarea cuatrecasasii, Ortiz and Aguilar 324 (INB, MO), Costa Rica, MW633353, MW633367, KX384061, EF624289, KX384124, MW633419, MW633449, -, MW621218; Curarea tecunarum, Ortiz and Vásquez 214 (AMAZ, MO), Peru, MW633354, MW633368, KX384062, EF624290, KX384125, MW633420, MW633450, -, MW621219; Curarea toxicofera, Ortiz 184 (AMAZ, MO), Peru, FJ026480, FJ026420, KX384063, EF624291, KX384126, -, -, -, -; Eleutharrhena macrocarpa CPG29442, CPG29442 (PE), Yunnan, MW633358, MW633371, MW633383, MW633394, MW633404, MW633424, MW633454, MW621986, MW621223; Eleutharrhena macrocarpa Shen J.Y. 201901, Shen J.Y. 201901 (HITBC), Yunnan, MW633357, MW633370, MW633382, MW633393, MW633403, MW633423, MW633453, MW621985, MW621222; Eleutharrhena macrocarpa SSJ, SSJ (HITBC), Yunnan, MZ502223 *, MZ502223 *, MZ502223 *, MZ502223 *, MZ502223 *, MZ502223 *, MZ502223 *, -, -; Eleutharrhena macrocarpa Zhou H.S. 4534, Zhou H.S. 4534 (HITBC, PE), Yunnan, MW633355, MW633369, MW633380, MW633391, MW633401, MW633421, MW633451, -, MW621220; Eleutharrhena macrocarpaZhou H.S. 8505, Zhou H.S. 8505 (HITBC, PE), Yunnan, MW633356, -, MW633381, MW633392, MW633402, MW633422, MW633452, MW621984, MW621221; Limacia blumei, F. Jacques 07 (P), cult. West Java, JN051683, JN051879, JN051836, EF624309, JN051770, -, -, -, -; Pycnarrhena celebica, F. Jacques 014 (P), cult. Bogor, FJ026503, FJ026443, JN051846, -, -, -, -, -, -; Pycnarrhena longiflora, F. Jacques 015 (P), cult. Bogor, EU526993, EU526965, JN051845, JN051716, JN051780, MW633425, MW633455, MW621987, MW621224; Pycnarrhena lucida, A.F.G. Kerr 17887 (P), Thailand, MW633359, MW633372, MW633384, MW633395, MW633405, -, MW633456, MW621988, MW621225; Pycnarrhena novoguineensis, Gray 8794 (MO), Australia, HQ260795, HQ260851, JN051847, EF624326, JN051782, MW633426, MW633457, MW621989, MW621226; Pycnarrhena ozantha, T. Haevermans 418 (P), New Caledonia, MW633360, MW633373, MW633385, MW633396, MW633406, -, MW633458, MW621990, MW621227; Pycnarrhena pleniflora H.S. 1961, Zhou H.S. 1961 (PE), cult. Xishuangbanna, MW633361, MW633374, MW633386, MW633397, MW633407, MW633427, MW633459, MW621991, MW621228; Pycnarrhena pleniflora Shen J.Y. 201801, Shen J.Y. 201801(HITBC), Yunnan, MW633362, MW633375, MW633387, MW633398, MW633408, MW633428, MW633460, MW621992, MW621229; Pycnarrhena pleniflora Shen J.Y. 201802, Shen J.Y. 201802 (HITBC), Yunnan, MW633363, MW633376, MW633388, MW633399, MW633409, MW633429, MW633461, MW621993, MW621230; Pycnarrhena tumefacta, CPG33074 (PE), Bogor, Indonesia, MW633365, MW633378, MW633390, MW633400, MW633411, MW633432, MW633464, MW621995, MW621232; Sciadotenia amazonica, Ortiz and Zárate 264 (AMAZ, MO), Peru, HQ260799, HQ260855, JN051851, EF624330, JN051786, MW633433, MW633465, MW621996, MW621233; Sciadotenia brachypoda, Ortiz and Farroñay 222 (AMAZ, MO), Peru, -, -, -, EF624331, -, -, -, -, -; Sciadotenia mathiasiana, Ortiz and al. 259 (AMAZ, MO), Peru, MW633366, MW633379, KX384078, EF624332, KX384142, MW633434, MW633466, -, MW621234; Sciadotenia toxifera, Ortiz and al. 231 (AMAZ, MO), Peru, HQ260800, HQ260856, KX384079, EF624333, KX384143, MW633435, MW633467, -, MW621235; Tiliacora acuminata, F. Jacques 11 (P), cult. West Java, JN051696, JN051895, JN051861, JN051730, JN051796, MW633436, MW633468, MW621997, MW621236; Tiliacora australiana, Gray 9132 (QRS), Australia, JN051697, JN051896, JN051862, JN051731, JN051797, MW633437, MW633469, MW621998, MW621237; Tiliacora funifera, D. Kenfack 2100 (MO), Ghana, FJ026512, FJ026452, JN051863, EF624340, JN051798, MW633438, MW633470, KM364880, MK288774; Tiliacora gabonensis, Walters and Niangadouma 1159 (MO), Gabon, JN051698, -, JN051864, EF624341, JN051799, -, MW633471, MW621999, MW621238; Triclisia dictyophylla, Kenfack and Zapfack 2038 (MO), Cameroon, HQ260810, HQ260866, JN051866, EF624344, JN051801, MW633439, MW633472, MW622000, MW621239; Triclisia subcordata, Kenfack2101 (MO), Ghana, HQ260811, HQ260867, JN051867, EF624345, JN051802, MW633440, MW633473, MW622001, MW621240. |
| Model | Number of Parameters | LnL | d | e | j | AIC | AICc | AIC Weight |
|---|---|---|---|---|---|---|---|---|
| DEC | 2 | −25.14 | 0.007 | 0 | 0 | 54.29 | 55.29 | 0.074 |
| DEC + J | 3 | −23.91 | 0.005 | 0 | 0.042 | 53.83 | 56.01 | 0.052 |
| DIVALIKE | 2 | −24.29 | 0.010 | 0 | 0 | 52.59 | 53.59 | 0.174 |
| DIVALIKE + J | 3 | −24.18 | 0.008 | 0 | 0.02 | 54.36 | 56.54 | 0.040 |
| BAYAREALIKE | 2 | −23.76 | 0.004 | 0.04 | 0 | 51.53 | 52.53 | 0.296 |
| BAYAREALIKE + J | 3 | −21.97 | 0.003 | 0 | 0.074 | 49.95 | 52.13 | 0.362 |
| Source | df | SS | MS | Est. Var. | % |
|---|---|---|---|---|---|
| Among populations | 9 | 852.278 | 94.698 | 10.873 | 17% |
| Within populations | 28 | 1528.143 | 54.577 | 54.577 | 83% |
| Total | 37 | 2380.421 | 65.449 | 100% |


References
- Lang, X.D.; Li, Z.H.; Liu, W.D.; Xu, C.H.; Su, J.R.; Li, S.F.; Wang, F.Z.; Huang, X.B. A new study report on the endangered plant Eleutharrhena macrocarpa (Diels) Forman, with extremely small populations. Acta Bot. Boreali-Occident. Sin. 2017, 37, 203–210. [Google Scholar]
- Ortiz, R.D.; Wang, W.; Jacques, F.M.B.; Chen, Z.D. Phylogeny and a revised tribal classification of Menispermaceae (moonseed family) based on molecular and morphological data. Taxon 2016, 65, 1288–1312. [Google Scholar] [CrossRef]
- Kessler, P. Menispermaceae. In The Families and Genera of Vascular Plants II. Flowering Plants: Dicotyledons; Kubitzki, K., Rohwer, J.G., Bittrich, V., Eds.; Springer: Berlin, Germany, 1993; pp. 402–418. [Google Scholar]
- Stevens, P. The families and Genera of Vascular Plants. Vol. 2. Flowering Plants· Dicotyledons: Magnoliid, Hamamelid and Caryophyllid Families; Springer: New York, NY, USA, 1994; pp. 1–663. [Google Scholar]
- Lian, L.; Shen, J.Y.; Ortiz, R.D.; Yu, S.X.; Chen, Z.D.; Wang, W. Phylogenetic analyses and modelling distributions guide conservation of a critically endangered liana species, Eleutharrhena macrocarpa (Menispermaceae). Taxon 2021, 70, 931–945. [Google Scholar] [CrossRef]
- Wefferling, K.M.; Hoot, S.B.; Neves, S.S. Phylogeny and fruit evolution in Menispermaceae. Am. J. Bot. 2013, 100, 883–905. [Google Scholar] [CrossRef]
- Ortiz, R.D. Seed diversity in Menispermaceae: Developmental anatomy and insights into the origin of the condyle. Int. J. Plant Sci. 2012, 173, 344–364. [Google Scholar] [CrossRef]
- Forman, L. The Menispermaceae of Malesia and adjacent areas: VI: Pycnarrhena, Macrococculus & Haematocarpus. Kew Bull. 1972, 26, 405–422. [Google Scholar]
- Forman, L.L. Menispermaceae. In Flora Malesiana; Van Steenis, C.G.G.J., de Wilde, W.J.J.O., Eds.; Martinus Nijhoff Publishers: London, United Kingdom, 1986; Volume 10, pp. 157–253. [Google Scholar]
- Wang, S.; Xie, Y. China Species Red List; Higher Education Press: Beijing, China, 2004; pp. 1–224. [Google Scholar]
- Yang, J.; Cai, L.; Liu, D.T.; Chen, G.; Gratzfeld, J.; Sun, W.B. China’s conservation program on Plant Species with Extremely Small Populations (PSESP): Progress and perspectives. Biol. Conserv. 2020, 244, 108535. [Google Scholar] [CrossRef]
- Hou, Z.Q.; Zhou, D.; Hou, S.N.; Ma, C.C.; Dai, J.; Xiao, Z.Q.; Du, F. Present situation of Eleutharrhena macrocarpa in China. Plant Divers. 2015, 37, 640–646. [Google Scholar]
- Wang, W.; Ortiz, R.D.C.; Jacques, F.M.B.; Xiang, X.G.; Li, H.L.; Lin, L.; Li, R.Q.; Liu, Y.; Soltis, P.S.; Soltis, D.E.; et al. Menispermaceae and the diversification of tropical rainforests near the Cretaceous-Paleogene boundary. New Phytol. 2012, 195, 470–478. [Google Scholar] [CrossRef]
- Hua, Z. Advances in biogeography of the tropical rain forest in southern Yunnan, southwestern China. Trop. Conserv. Sci. 2008, 1, 34–42. [Google Scholar] [CrossRef] [Green Version]
- Hua, Z. Geographical patterns of Yunnan seed plants may be influenced by the clockwise rotation of the Simao-Indochina geoblock. Front. Earth Sci. 2015, 3, 1–9. [Google Scholar]
- Zhao, Y.J.; Gong, X. Genetic divergence and phylogeographic history of two closely related species (Leucomeris decora and Nouelia insignis) across the’Tanaka Line’in Southwest China. BMC Evol. Biol. 2015, 15, 1–13. [Google Scholar] [CrossRef] [PubMed] [Green Version]
- Li, Y.; Zhai, S.N.; Qiu, Y.X.; Guo, Y.P.; Ge, X.J.; Comes, H.P. Glacial survival east and west of the ‘Mekong–Salween Divide’in the Himalaya–Hengduan Mountains region as revealed by AFLPs and cpDNA sequence variation in Sinopodophyllum hexandrum (Berberidaceae). Mol. Phylogenet. Evol. 2011, 59, 412–424. [Google Scholar] [CrossRef] [PubMed]
- He, Y.; Guo, C.; Zeng, X.; Yang, H.; Xiong, X.; Qiu, P. Genetic population variation and phylogeny of Sinomenium acutum (Menispermaceae) in subtropical China through chloroplast marker. bioRxiv 2018, 449900. [Google Scholar]
- Ma, Y.S.; Yu, H.; Li, Y.Y.; Yan, H.; Cheng, X. A study of genetic structure of Stephania yunnanensis (Menispermaceae) by DALP. Biochem. Genet. 2008, 46, 227–240. [Google Scholar] [CrossRef]
- Iloh, A.C.; Schmidt, M.; Muellner-Riehl, A.N.; Ogundipe, O.T.; Paule, J. Pleistocene refugia and genetic diversity patterns in West Africa: Insights from the liana Chasmanthera dependens (Menispermaceae). PLoS ONE 2017, 12, e0170511. [Google Scholar] [CrossRef]
- Lian, L.; Ortiz, R.D.; Jabbour, F.; Zhang, C.F.; Xiang, X.G.; Erst, A.S.; Gao, T.G.; Chen, Z.D.; Wang, W. Phylogeny and biogeography of Pachygoneae (Menispermaceae), with consideration of the boreotropical flora hypothesis and resurrection of the genera Cebatha and Nephroia. Mol. Phylogenet. Evol. 2020, 148, 106825. [Google Scholar] [CrossRef]
- Wang, W.; Ortiz, R.D.C.; Jacques, F.M.B.; Chung, S.W.; Liu, Y.; Xiang, X.G.; Chen, Z.D. New insights into the phylogeny of Burasaieae (Menispermaceae) with the recognition of a new genus and emphasis on the southern Taiwanese and mainland Chinese disjunction. Mol. Phylogenet. Evol. 2017, 109, 11–20. [Google Scholar] [CrossRef]
- Edgar, R.C. MUSCLE: Multiple sequence alignment with high accuracy and high throughput. Nucleic Acids Res. 2004, 32, 1792–1797. [Google Scholar] [CrossRef] [Green Version]
- Collard, B.C.Y.; Mackill, D.J. Start Codon Targeted (SCoT) polymorphism: A simple, novel DNA marker technique for generating gene-targeted markers in plants. Plant Mol. Biol. Rep. 2008, 27, 86–93. [Google Scholar] [CrossRef]
- Stamatakis, A. RAxML version 8: A tool for phylogenetic analysis and post-analysis of large phylogenies. Bioinformatics 2014, 30, 1312–1313. [Google Scholar] [CrossRef] [PubMed]
- Miller, M.A.; Pfeiffer, W.; Schwartz, T. The CIPRES science gateway: A community resource for phylogenetic analyses. In Proceedings of the the 2011 TeraGrid Conference: Extreme Digital Discovery, Salt Lake City, UT, USA, 18–21 July 2011; pp. 1–8. [Google Scholar]
- Ronquist, F.; Teslenko, M.; van der Mark, P.; Ayres, D.L.; Darling, A.; Hohna, S.; Larget, B.; Liu, L.; Suchard, M.A.; Huelsenbeck, J.P. MrBayes 3.2: Efficient Bayesian phylogenetic inference and model choice across a large model space. Syst. Biol. 2012, 61, 539–542. [Google Scholar] [CrossRef] [PubMed] [Green Version]
- Zhang, D.; Gao, F.L.; Jakovlic, I.; Zou, H.; Zhang, J.; Li, W.X.; Wang, G.T. PhyloSuite: An integrated and scalable desktop platform for streamlined molecular sequence data management and evolutionary phylogenetics studies. Mol. Ecol. Resour. 2020, 20, 348–355. [Google Scholar] [CrossRef]
- Lanfear, R.; Frandsen, P.B.; Wright, A.M.; Senfeld, T.; Calcott, B. PartitionFinder 2: New methods for selecting partitioned models of evolution for molecular and morphological phylogenetic analyses. Mol. Biol. Evol. 2017, 34, 772–773. [Google Scholar] [CrossRef] [PubMed] [Green Version]
- Bouckaert, R.; Heled, J.; Kühnert, D.; Vaughan, T.; Wu, C.-H.; Xie, D.; Suchard, M.A.; Rambaut, A.; Drummond, A.J. BEAST 2: A software platform for Bayesian evolutionary analysis. PLoS Comput. Biol. 2014, 10, e1003537. [Google Scholar] [CrossRef] [PubMed] [Green Version]
- Chesters, K.I. The miocene flora of Rusinga Island, Lake Victoria, Kenya. Palaeontogr. Abt. B. 1957, 30–71. [Google Scholar]
- Rambaut, A.; Drummond, A.J.; Xie, D.; Baele, G.; Suchard, M.A. Posterior summarization in Bayesian phylogenetics using Tracer 1.7. Syst. Biol. 2018, 67, 901–904. [Google Scholar] [CrossRef] [Green Version]
- Matzke, N.J. BioGeoBEARS: Biogeography with bayesian (and likelihood) evolutionary analysis in R scripts; University of California: Berkeley, SC, USA, 2013. [Google Scholar]
- Team, R. RStudio: Integrated development environment for R. Available online: http://www.rstudio.com/ (accessed on 10 September 2021).
- Yeh, F.C.; Yang, R.C.; Boyle, T.B.; Ye, Z.H.; Mao, J.X. POPGENE, the user-friendly shareware for population genetic analysis. J. Hered. 1997, 10, 295–301. [Google Scholar]
- Peakall, R.; Smouse, P.E. GenAlEx 6.5: Genetic analysis in Excel. Population genetic software for teaching and research-an update. Bioinformatics 2012, 28, 2537–2539. [Google Scholar] [CrossRef] [Green Version]
- Pritchard, J.K.; Stephens, M.; Donnelly, P. Inference of population structure using multilocus genotype data. Genetics 2000, 155, 945–959. [Google Scholar] [CrossRef]
- Falush, D.; Stephens, M.; Pritchard, J.K. Inference of population structure using multilocus genotype data: Dominant markers and null alleles. Mol. Ecol. Notes 2007, 7, 574–578. [Google Scholar] [CrossRef] [PubMed]
- Evanno, G.; Regnaut, S.; Goudet, J. Detecting the number of clusters of individuals using the software STRUCTURE: A simulation study. Mol. Ecol. 2005, 14, 2611–2620. [Google Scholar] [CrossRef] [PubMed] [Green Version]
- Earl, D.A.; vonHoldt, B.M. STRUCTURE HARVESTER: A website and program for visualizing STRUCTURE output and implementing the Evanno method. Conserv. Genet. Resour. 2011, 4, 359–361. [Google Scholar] [CrossRef]
- Jakobsson, M.; Rosenberg, N.A. CLUMPP: A cluster matching and permutation program for dealing with label switching and multimodality in analysis of population structure. Bioinformatics 2007, 23, 1801–1806. [Google Scholar] [CrossRef] [Green Version]
- Rosenberg, N.A. DISTRUCT: A program for the graphical display of population structure. Mol. Ecol. Notes 2004, 4, 137–138. [Google Scholar] [CrossRef]
- Assoumane, A.; Zoubeirou, A.M.; Rodier-Goud, M.; Favreau, B.; Bezançon, G.; Verhaegen, D. Highlighting the occurrence of tetraploidy in Acacia senegal (L.) Willd. and genetic variation patterns in its natural range revealed by DNA microsatellite markers. Tree Genet. Genomes 2013, 9, 93–106. [Google Scholar] [CrossRef]
- Teixeira, H.; Rodriguez-Echeverria, S.; Nabais, C. Genetic diversity and differentiation of Juniperus thurifera in Spain and Morocco as Determined by SSR. PloS ONE 2014, 9, e88996. [Google Scholar]
- Govindaraju, D.R. Relationship between dispersal ability and levels of gene flow in plants. Oikos 1988, 52, 31–35. [Google Scholar] [CrossRef]
- Nei, M. Analysis of gene diversity in subdivided populations. Proc. Natl. Acad. Sci. USA 1973, 70, 3321–3323. [Google Scholar] [CrossRef] [Green Version]
- Joshi, A. Morphology of Tinospora cordifolia, with some observations on the origin of the single integument, nature of synergidae, and affinities of the Menispermaceae. Am. J. Bot. 1939, 26, 433–439. [Google Scholar] [CrossRef]
- Davis, C.C.; Bell, C.D.; Mathews, S.; Donoghue, M.J. Laurasian migration explains Gondwanan disjunctions:Evidence from Malpighiaceae. Proc. Natl. Acad. Sci. USA 2002, 99, 6833–6837. [Google Scholar] [CrossRef] [PubMed] [Green Version]
- Morley, R.J. Assembly and division of the South and South-East Asian flora in relation to tectonics and climate change. J. Trop. Ecol. 2018, 34, 209–234. [Google Scholar] [CrossRef]
- Tsai, C.C.; Liao, P.C.; Ko, Y.Z.; Chen, C.H.; Chiang, Y.C. Phylogeny and historical biogeography of Paphiopedilum Pfitzer (Orchidaceae) based on nuclear and plastid DNA. Front. Plant Sci. 2020, 11, 126. [Google Scholar] [CrossRef] [PubMed] [Green Version]
- Wu, X.; Liu, X.; Kodrul, T.; Quan, C.; Jin, J. Dacrycarpus pattern shedding new light on the early floristic exchange between Asia and Australia. Natl. Sci. Rev. 2019, 6, 1086–1090. [Google Scholar] [CrossRef] [PubMed] [Green Version]
- Van Oosterzee, P. Where worlds collide: The Wallace Line; Cornell University Press: New York, NY, USA, 1997. [Google Scholar]
- Baveja, P.; Garg, K.M.; Chattopadhyay, B.; Sadanandan, K.R.; Prawiradilaga, D.M.; Yuda, P.; Lee, J.G.; Rheindt, F.E. Using historical genome-wide DNA to unravel the confused taxonomy in a songbird lineage that is extinct in the wild. Evol. Appl. 2021, 14, 698–709. [Google Scholar] [CrossRef]
- Klaus, S.; Morley, R.J.; Plath, M.; Zhang, Y.-P.; Li, J.-T. Biotic interchange between the Indian subcontinent and mainland Asia through time. Nat. Commun. 2016, 7, 12132. [Google Scholar] [CrossRef] [Green Version]
- Hina, F.; Yisilam, G.; Wang, S.; Li, P.; Fu, C. De novo transcriptome assembly, gene annotation and SSR marker development in the moon seed genus Menispermum (Menispermaceae). Front. Genet. 2020, 11, 380. [Google Scholar] [CrossRef]
- De Britto, A.J.; Raj, T.L.S.; Petchimuthu, K.; Kumar, P.B.J.R.; Sujin, R.M.; Dharmar, K. Inter population genetic variability in Tinospora cordifolia (Wild.) Miers ex Hook. F. & Thoms. (Menispermaceae), through RAPD marker. Sci. Acta Xaver. 2010, 1, 57–64. [Google Scholar]
- Godt, M.J.W.; Hamrick, J. Genetic structure of two endangered pitcher plants, Sarracenia jonesii and Sarracenia oreophila (Sarraceniaceae). Am. J. Bot. 1996, 83, 1016–1023. [Google Scholar] [CrossRef]
- Huang, Y.; Zhang, C.Q.; Li, D.Z. Low genetic diversity and high genetic differentiation in the critically endangered Omphalogramma souliei (Primulaceae): Implications for its conservation. J. Syst. Evol. 2009, 47, 103–109. [Google Scholar] [CrossRef]
- Song, S.; Shen, J.; Zhou, S.; Guo, X.; Zhao, J.; Shi, X.; Yu, Z.; Gong, Q.; You, S.; Landrein, S. Highlighting the plight of threatened lianas: Distribution, dynamics, and potential habitat areas of a critically endangered species. Glob. Ecol. Conserv. 2022, 36, e02130. [Google Scholar] [CrossRef]
- Capmourteres, V.; Anand, M. ’Conservation value’: A review of the concept and its quantification. Ecosphere 2016, 7, e01476. [Google Scholar] [CrossRef]


| Populations | Individuals | Na | Ne | H | I | PPL |
|---|---|---|---|---|---|---|
| P1 | 3 | 1.8217 | 1.5187 | 0.3062 | 0.4567 | 82.2% |
| P4 | 2 | 1.5539 | 1.3917 | 0.2294 | 0.335 | 55.4% |
| P5 | 2 | 1.6201 | 1.4385 | 0.2568 | 0.375 | 62.0% |
| P7 | 3 | 1.8267 | 1.4623 | 0.2866 | 0.4363 | 82.7% |
| P9 | 7 | 1.9349 | 1.4148 | 0.2612 | 0.4115 | 93.5% |
| P13 | 6 | 1.9487 | 1.4140 | 0.2618 | 0.4144 | 94.9% |
| P16 | 3 | 1.8468 | 1.483 | 0.297 | 0.4506 | 84.7% |
| P18 | 7 | 1.8968 | 1.3546 | 0.228 | 0.3663 | 89.7% |
| P19 | 2 | 1.6425 | 1.4543 | 0.2661 | 0.3885 | 64.3% |
| P20 | 3 | 1.8779 | 1.512 | 0.312 | 0.4715 | 87.8% |
Publisher’s Note: MDPI stays neutral with regard to jurisdictional claims in published maps and institutional affiliations. |
© 2022 by the authors. Licensee MDPI, Basel, Switzerland. This article is an open access article distributed under the terms and conditions of the Creative Commons Attribution (CC BY) license (https://creativecommons.org/licenses/by/4.0/).
Share and Cite
Song, S.; Shen, J.; Zhou, S.; Guo, X.; Zhao, J.; Shi, X.; Yu, Z.; Gong, Q.; You, S.; Landrein, S. Phylogeography and Population History of Eleutharrhena macrocarpa (Tiliacoreae, Menispermaceae) in Southeast Asia’s Most Northerly Rainforests. Diversity 2022, 14, 437. https://doi.org/10.3390/d14060437
Song S, Shen J, Zhou S, Guo X, Zhao J, Shi X, Yu Z, Gong Q, You S, Landrein S. Phylogeography and Population History of Eleutharrhena macrocarpa (Tiliacoreae, Menispermaceae) in Southeast Asia’s Most Northerly Rainforests. Diversity. 2022; 14(6):437. https://doi.org/10.3390/d14060437
Chicago/Turabian StyleSong, Shijie, Jianyong Shen, Shishun Zhou, Xianming Guo, Jinchao Zhao, Xinghui Shi, Zhiyong Yu, Qiangbang Gong, Shaohua You, and Sven Landrein. 2022. "Phylogeography and Population History of Eleutharrhena macrocarpa (Tiliacoreae, Menispermaceae) in Southeast Asia’s Most Northerly Rainforests" Diversity 14, no. 6: 437. https://doi.org/10.3390/d14060437