
Biogeography and Diversification of the Tropical and Subtropical Asian Genus Gastrochilus (Orchidaceae, Aeridinae)
by
Yang Li
1, 
Weitao Jin
1,
Liguo Zhang
1,
Peng Zhou
1,
Yan Luo
2,
Ziwei Zhu
3 and
Xiaoguo Xiang
1,* 1
Jiangxi Province Key Laboratory of Watershed Ecosystem Change and Biodiversity, Institute of Life Science, School of Life Sciences, Nanchang University, Nanchang 330031, China
2
Xishuangbanna Tropical Botanical Garden, Chinese Academy of Sciences, Mengla 650223, China
3
Jiangxi Academy of Forest, Nanchang 330013, China
*
Author to whom correspondence should be addressed.
Diversity 2022, 14(5), 396; https://doi.org/10.3390/d14050396
Submission received: 7 March 2022
/
Revised: 12 May 2022
/
Accepted: 14 May 2022
/
Published: 17 May 2022
(This article belongs to the Special Issue Ecology, Evolution and Diversity of Plants)
Abstract
:Tropical and subtropical Asia are major orchid diversity and endemism centers. However, the evolutionary dynamics of orchids in these areas remain poorly studied. Gastrochilus D. Don, a species-rich orchid genus from tropical and subtropical Asian forests, was employed to investigate the issue. We firstly used eight DNA regions to reconstruct the phylogeny and estimate the divergence times within Gastrochilus. We inferred the ancestral ranges and conducted a diversification analysis based on empirical and simulated data. Subsequently, we assessed the ancestral niche state and tested for phylogenetic signals in the evolution of niche conditions. Our results suggested that the most recent common ancestor of Gastrochilus occurred in the subtropical area of the East Asiatic region in the late Miocene (8.13 Ma). At least eight dispersal events and four vicariant events were inferred to explain the current distribution of Gastrochilus, associated with the global cooling from the Plio-Pleistocene. The genus experienced a slowly decreasing diversification rate since its origin, and no significant correlation between current niches and phylogenetic relatedness was observed. The diversification of Gastrochilus was attributed to accumulation through time, integrated with the intensification of the Asian Monsoon system during the Plio-Pleistocene, pollination, and epiphytism.
1. Introduction
Exploring the patterns of plant diversity today is a basic issue for biogeographers and evolutionists. To better understand the dynamics of plant diversity, it is vital to integrate the historical biogeography and the niche requirements of species [1]. Over the past two decades, the phylogenetic niche conservatism (PNC) and niche evolution (NE) hypotheses were proposed to account for species diversity [2,3]. PNC deems that most species tend to maintain their ancestral niches, survive in similar climatic environments, and differentiate in-situ [4]. Several studies have shown that the PNC hypothesis may explain the diversity of groups with different evolutionary histories [5,6,7,8]. For example, the diversity patterns of Zygophyllaceae at the global scale can be attributed to the strong phylogenetic conservatism in their precipitation-related niches [7]. In turn, NE posits that species may expand their niche breadth or occupy new conditions and can diversify in new habitats and climatic regimes [2]. For example, the diversity of Hakea (Proteaceae) in different geographic regions was explained by the frequency of evolutionary biome shifts [9]. Although there are many studies strongly supporting the role of PNC or NE in explaining clade diversification [4,7,9,10,11], several researchers suggested that there was no significant correlation between current niches and phylogenetic relatedness [12,13], especially the organisms in isolated habitats such as the birds in high-altitude regions [14], which implied that the species diversity was attributed to accumulation through time.
Tropical and subtropical Asia are major orchid diversity centers [15,16]. These regions are characterized by their high plant diversity and endemism [17,18] and have also been considered both a “Cradle” and a “Museum” for vascular plants since the Cretaceous [17,19,20]. During the Cenozoic, the Asian mainland experienced a series of complex geological and climate changes, such as the uplift of the Himalaya-Tibetan Plateau [21] and the establishment and intensification of the Asian monsoon [22]. The multistage uplifts of the Himalayas resulted in significant climate changes, new geophysical environments, novel ecological niches, and the formation of physical and physiological isolation barriers across the faunal and floral elements of Asia [23,24]. On the one hand, the uplift of the Himalayas provided many new niches and is attributed to organisms’ diversification [25]. On the other hand, the four periods of intensification of the East Asia Summer Monsoon (EASM) during the Cenozoic have possibly brought abundant rainfall [26] and are positively correlated with plant richness [27,28,29,30]. Therefore, the uplift of the Himalayas and the EASM produced more new niches and conditions for organisms and are proposed to explain biological diversification in East Asia [29,30,31].
Gastrochilus D. Don (1825) (Aeridinae, Vandeae, Epidendroideae, Orchidaceae) is an epiphytic orchid genus widely distributed in tropical and subtropical Asia [15,32]. Thanks to its high morphological diversity and brightly colored flowers, it has potential horticultural value [15]. Since the latest preliminary revision of Gastrochilus [32], nearly 20 new species have been found in south China (Chongqing, Yunnan, Taiwan), Vietnam, Myanmar, Nepal and India [33,34,35,36,37,38,39,40,41,42,43,44,45]. Additionally, Haraella Kudo and Luisiopsis C.S.Kumar and P.C.S.Kumar have been transferred to Gastrochilus [46,47]. Therefore, the genus Gastrochilus consists now of 69 species, of which many are narrow endemics, with a species diversity center in the South-East Asian archipelago [36,48,49]. Recently, Liu et al. [49] revealed that Gastrochilus is monophyletic and divided into five clades based on five DNA regions (ITS, matK, psbA-trnH, psbM-trnD, trnL-F) and inferred that pollination system shifts in Gastrochilus have occurred independently at least three times. Liu et al. [50] reconstructed the phylogenetic relationships within the Cleisostoma–Gastrochilus clades (Aeridinae) based on the complete chloroplast genome, strongly supporting the monophyly of Gastrochilus. However, the spatio-temporal evolution of the genus is still unclear.
In this study, our objectives are (1) to estimate divergence times within Gastrochilus using eight plastid and nuclear DNA regions, (2) to investigate the historical biogeography of Gastrochilus, and (3) to explore the factors that have led to its diversification.
2. Materials and Methods
2.1. Taxon Sampling and Molecular Data
In this study, we sampled 34 species of Gastrochilus, comprehensively covering the distribution range of this genus. Based on Pridgeon et al. [15] and Farminhão et al. [51], 18 species closely related to Gastrochilus from Aeridinae and four species from Angraecinae were used as outgroups. All sequence data were downloaded from the GenBank (https://www.ncbi.nlm.nih.gov/ (accessed on 19 December 2021)). The phylogenetic analysis of Epidendroideae showed that a proportion of potentially parsimony informative sites of the internal transcribed spacer (ITS) trnL-F, matK and rbcL were 64%, 28%, 28%, and 11%, respectively, and they showed their strong ability to resolve species relationships [52]. It has been suggested that the addition of non-coding chloroplast regions could provide higher relative variability in resolving species relationships [53,54]. A total of eight DNA markers were employed in this study, including one nuclear marker (ITS) and seven chloroplast DNA markers (atpH-I, matK, psbA-trnH, psbM-trnD, rbcL, trnL-F, and rps19-rpl22). Taxon information and GenBank accession numbers are listed in Table S1.
2.2. Phylogenetic Analysis
DNA sequences were aligned and subsequently manually adjusted in BioEdit [55]. Topological congruence between the chloroplast and nuclear data was evaluated using the incongruence length difference (ILD) test [56]. The partition homogeneity test for plastid DNA and ITS shows character incongruence (p = 0.01). Visual inspection indicates that there are very few ‘‘hard’’ conflicts between the plastid vs. ITS trees, and such conditions have been interpreted by Wendel and Doyle [57] as a soft incongruence, which might disappear with additional data. Gatesy et al. [58] demonstrated that concatenating truly incongruent data sets could still increase resolution and branch support. Therefore, we combined the datasets for subsequent analyses. All characters were unordered and had equal weight. Gaps were treated as missing data.
Three phylogenetic reconstruction methods were performed, including maximum parsimony (MP), maximum likelihood (ML), and Bayesian inference (BI). MP analyses were performed in PAUP* 4.0b10 [59]. Heuristic searches were conducted with 1000 replicates of random addition, in combination with tree-bisection-reconnection (TBR) branch-swapping, MulTrees in effect, and steepest descent off. Bootstrap support values were conducted with 1000 replicates with 10 random taxon additions and heuristic search options.
Based on the Akaike information criterion (AIC), the best-fit nucleotide substitution model of DNA regions was chosen using ModelTest v.3.7 [60]. ML analyses were conducted in RAxML v.8.4 [61]. We conducted a rapid bootstrap analysis (1000 replicates) and searched for the best-scoring ML tree simultaneously. BI analyses were performed in MrBayes v.3.2 [62]. Four Markov Chain Monte Carlo tests were run, sampling one tree every 1000 generations for 3,000,000 generations. Tracer v.1.5 was used to assess chain convergence and ensure that the effective sample sizes (ESS) are above 200 for all parameters [63]. Majority rule (>50%) consensus trees were constructed after removing the “burn-in” samples (the first 20% of the sampled trees).
2.3. Time Estimation
Firstly, the likelihood ratio test (LRT) [64] was conducted to determine whether the data evolved in a clock-like fashion. Log-likelihood ratios of the clock and non-clock model were compared. The degree of freedom is equivalent to the number of terminal taxa minus two, and significance was assessed by comparing two times the log-likelihood difference to a chi-square distribution [65]. The LRT test rejected a clock-like evolution (δ = 1363.8014, df = 54, p < 0.001), and therefore. we used a relaxed lognormal clock model to estimate the divergence in BEAST v.2.6.0 [66]. There is no Gastrochilus fossil nor any fossils of one of its close relatives in Aeridinae and Angraecinae; thus, two calibration points were set based on Givnish et al. [16,67]: (1) the split age of Aeridinae and Angraecinae (21.21 Ma) was used for the tree root age, and a prior normal distribution (SD = 3.05) for the calibration point was assigned following the suggestion of Ho [68]; (2) the crown age of Aeridinae was set to 16 Ma with a normal distribution (SD = 1.0). The speciation prior was set as YULE, and the substitution model of DNA regions was selected as the GTR+I+Γ model. Markov Chain Monte Carlo (MCMC) searches were run for 100,000,000 generations and sampled every 1000 generations. Convergence was assessed by Tracer v.1.5 [63], and the effective sampling size for all parameters was >200. The maximum clade credibility (MCC) tree was computed by TreeAnnotator v.1.7.4 [69].
2.4. Biogeographical Analyses
Based on the extant distribution of Gastrochilus and outgroups, four main regions were categorized based on Takhajan [70]: East Asiatic region (A), Indian region (B), Indo-Chinese region (C) and Malesian region (D). The ancestral range reconstruction was inferred using the Statistical Dispersal–Extinction–Cladogenesis (S-DEC) model, as implemented in RASP [71]. In S-DEC, it summarizes biogeographic reconstructions across all user-supplied trees. The DEC model is applied to each ultrametric tree within a posterior distribution resulting from a Bayesian phylogenetic analysis. Subsequently, we calculated the probability of an ancestral range x at node n on a summary tree [71]. The MCC tree obtained from BEAST was chosen as the summary tree. The random 1000 trees from BEAST trees after burn-in were input to estimate probabilities of ancestral range at each node.
2.5. Ancestral State Reconstruction and Correlates of Diversification
Ancestral state reconstruction was performed using the maximum likelihood method implemented in BayesTrait v.4.0 [72]. Information about species habitats was compiled from online databases (www.gbif.org (accessed on 23 January 2022); www.orchidspecies.com (accessed on 23 January 2022); www.africanorchids.dk (accessed on 6 March 2022); www.iplant.cn (accessed on 10 January 2022)), and the taxonomic literatures [32,33,34,35,36,37,38,39,40,41,42,43,44,45], and we defined two states: (1) tropical (state 0); (2) subtropical (state 1) (Table S2).
The binary state speciation and extinction model (BiSSE) was used to examine whether the climatic zone is directly correlated with differential rates of diversification implemented in DIVERSITREE 0.9-6 [73]. To correct for non-random, incomplete sampling, we specified sampling fractions, i.e., the proportion of species in tropical Asia and in subtropical Asia that are included in the tree.
2.6. Diversification Analysis
Birth–death likelihood (BDL) models were used to test the significance of heterogeneity or the consistency of the temporal diversification rate [74]. The model selection was based on the difference in the AIC scores between the best-fitting rate-constant and rate-variable models (∆AICRC). The calculations were performed using laser 2.3 [74].
To better understand diversification rates in Gastrochilus, we employed two methods to analyze rates. First, semi-logarithmic lineage-through-time (LTT) plots were constructed using the R package ape 2.5-1 [75]. The MCC tree was used to generate the tempo of diversification, and 1000 trees were sampled randomly from the converged BEAST trees to calculate a 95% credibility interval. Second, we used CLaDS (cladogenetic diversification rate shift model), a model-based approach to estimate speciation rates [76]. CLaDS applies a Bayesian approach to infer speciation rates along a phylogeny and assumes that rates change after every speciation event.
To evaluate the effect of the missing species, we add all 35 missing species randomly in the MCC tree in the R package ‘phytools’ 0.4-60 [77]. Then we carried out a diversification analysis in LTT and CLaDS.
2.7. Collection of Species Distribution Data and Environmental Variables
Distribution data of Gastrochilus were collected from online databases (the global biodiversity information facility, https://www.gbif.org/ (accessed on 23 January 2022)), herbaria (Herbarium, Institute of Botany, Academia Sinica (PE), and Herbarium of Jiangxi University (JXU)), and our fieldwork. These datasets were carefully assessed, and some erroneous records (i.e., occurrences in the oceans, ice sheets, and deserts), duplicates, and cultivation records were removed. Finally, a total of 262 unique distribution records from 33 species were used in this study (Table S3). We also collected 20 environmental variables including 19 bioclimatic variables and one topographical layer (elevation) (https://www.worldclim.org/data/worldclim21.html (accessed on 22 January 2022)) [78]. All environmental variables are at a resolution of 30 arc seconds. Mean values of the variables for each species were used in the further analysis.
2.8. Estimation of Evolutionary Rate in Niche Traits
To estimate the evolutionary rate of niche in Gastrochilus, we firstly ordinated all environmental variables and niche data using phylogenetic principal component analysis (PCA) implemented in R package phytools 0.7-70 [77] with the “phyl.pca” function. Then, we conducted complementary runs using the BAMM trait model on the first axis of the phylogenetic PCA of niche traits in BAMM 2.5.0 [79]. For niche rate, the MCMC was run for 10 million generations and sampled every 5000 generations. Prior values were selected using the “setBAMMpriors” function. Postrun analysis and visualization used the R package BAMMtools 2.17 [79]. The initial 25% of samples of the MCMC run were discarded as burn-in, and the remaining data were assessed for convergence using the CODA package [80] to ensure that the ESS values were above 200.
2.9. Detection of Phylogenetic Signals of Niche Traits
3. Results
3.1. Phylogenetic Relationships and Divergence Time Estimates within Gastrochilus
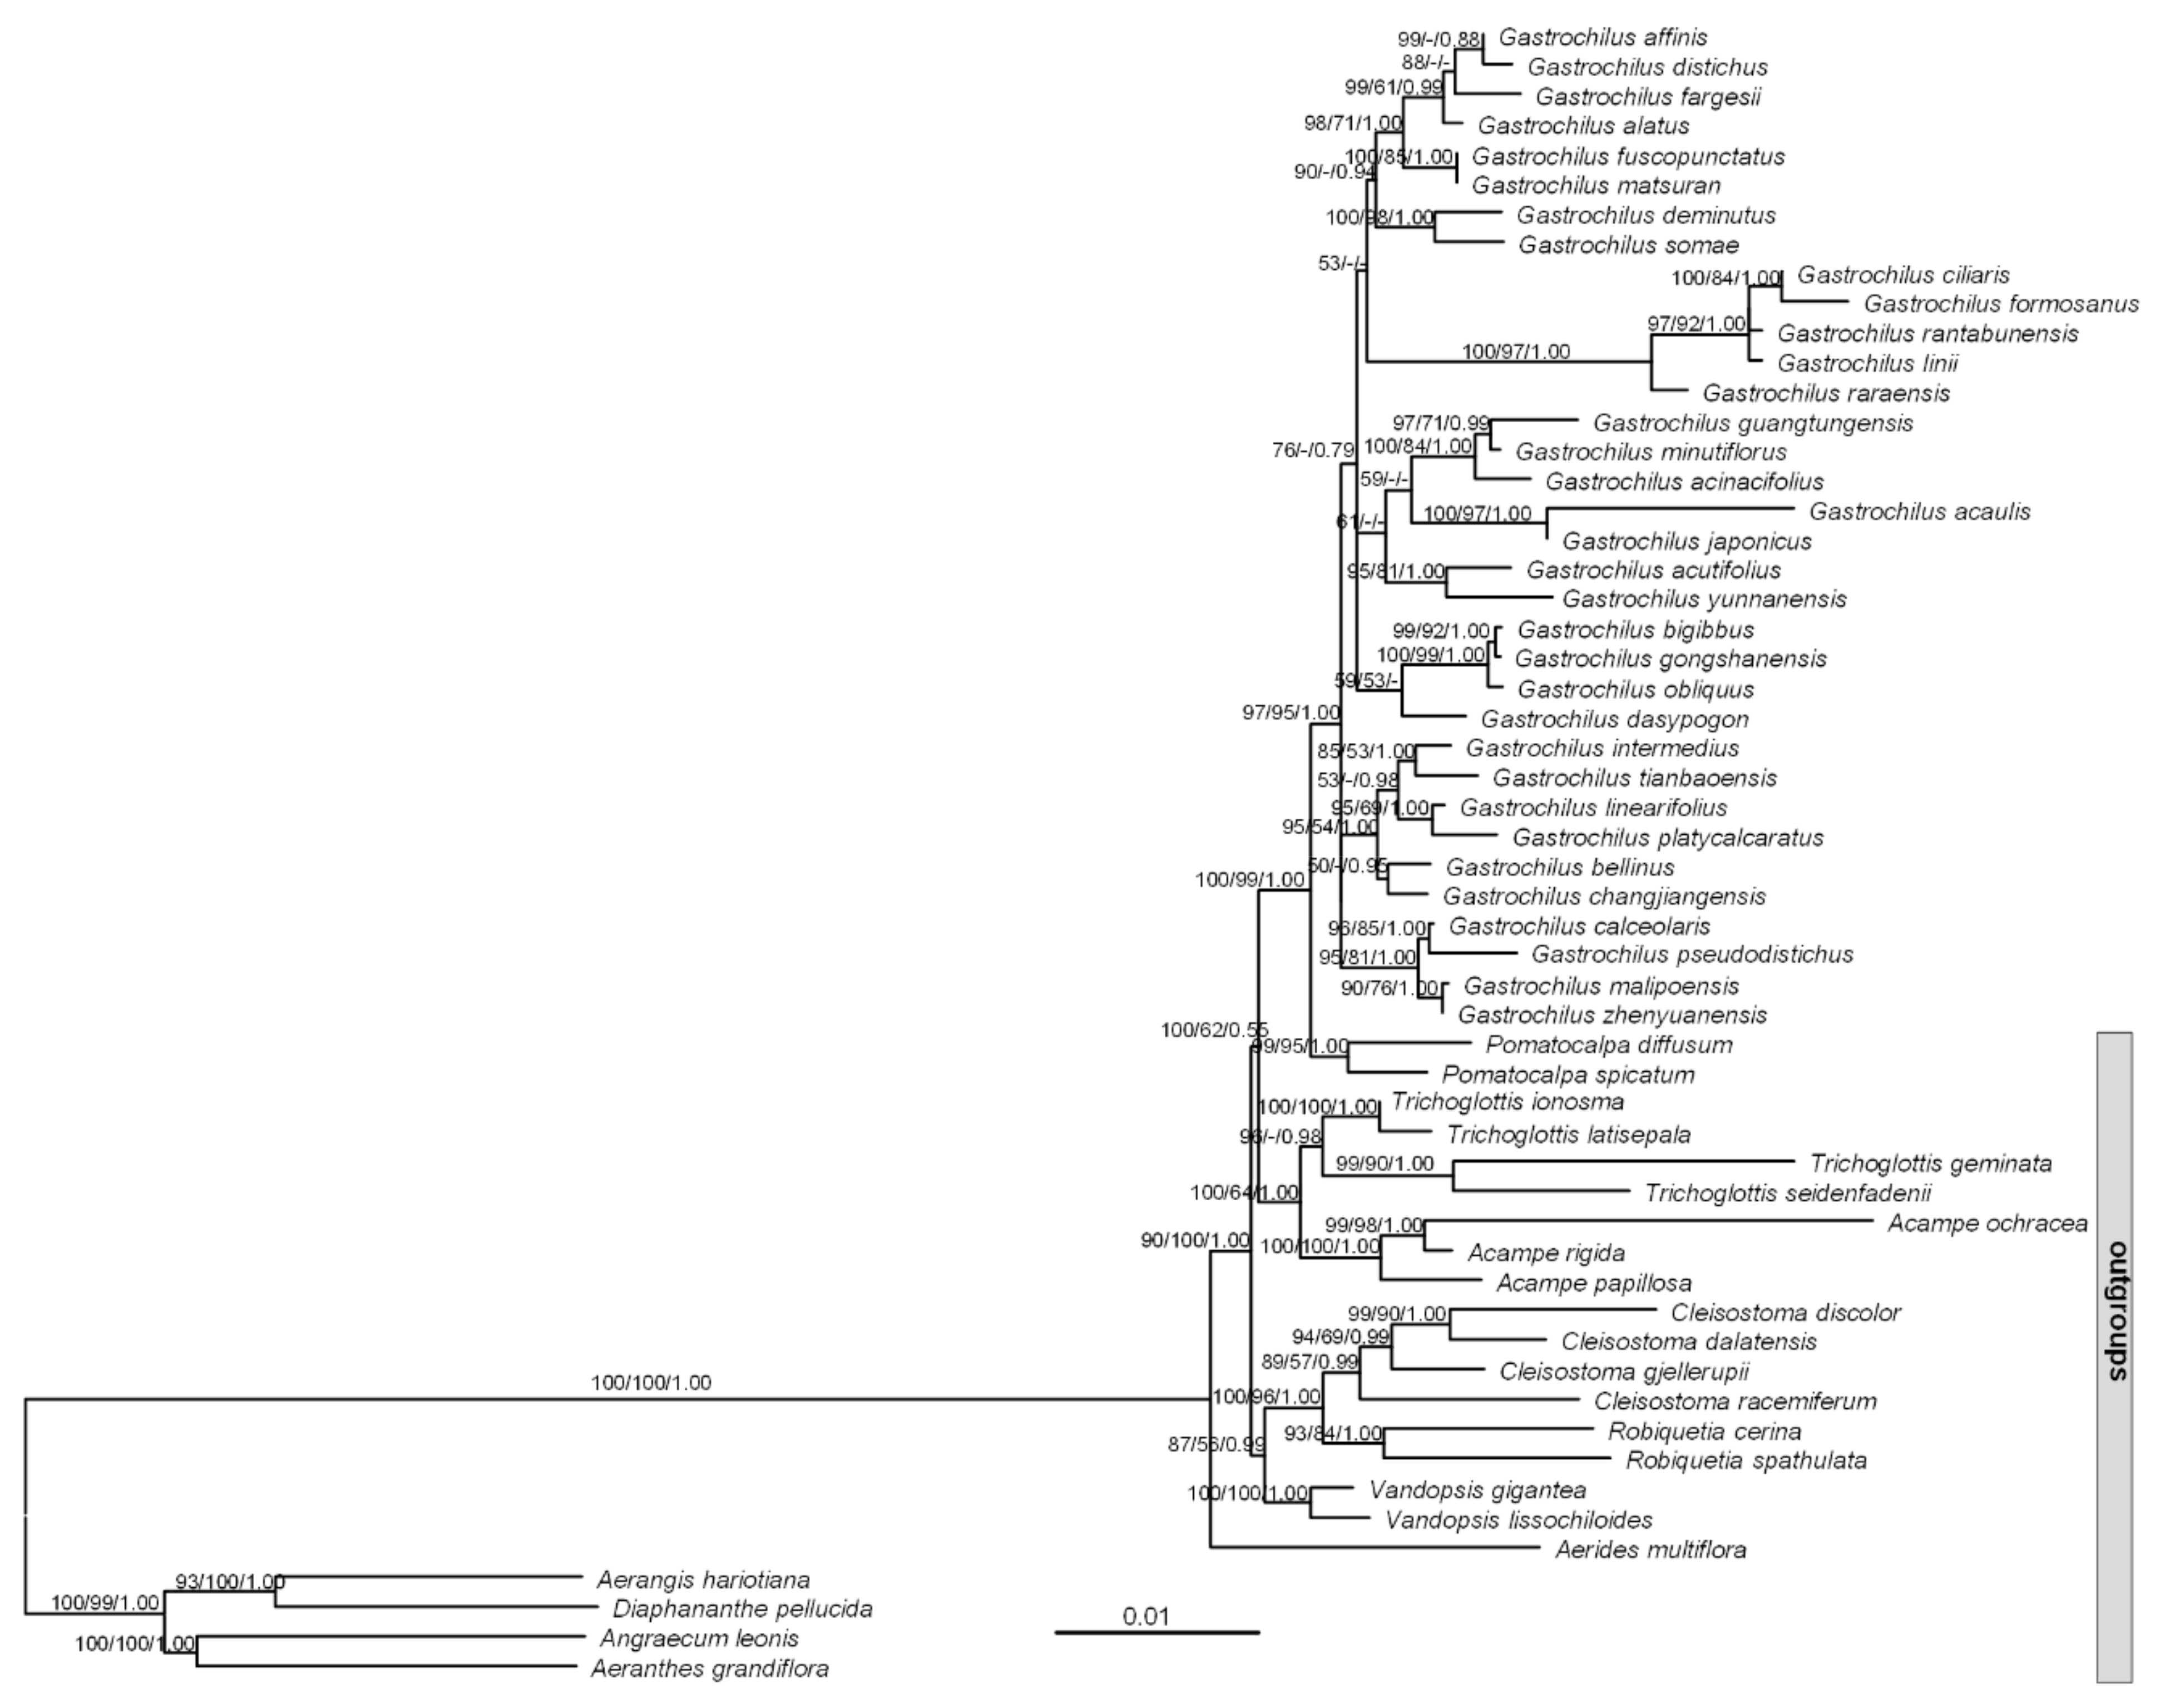
The total length of combined DNA sequences was 10,065 bp, of which 1351 characters were variable, and 551 characters were parsimony informative. The monophyly of Gastrochilus was strongly supported (BI-PP = 1.00, ML-BP = 97, MP-BS = 95; Figure 1). The inter-species relationships within Gastrochilus were supported by moderate to high supporting values, but the relationships among the main clades have not been resolved (Figure 1).
3.2. Ancestral Range Reconstruction
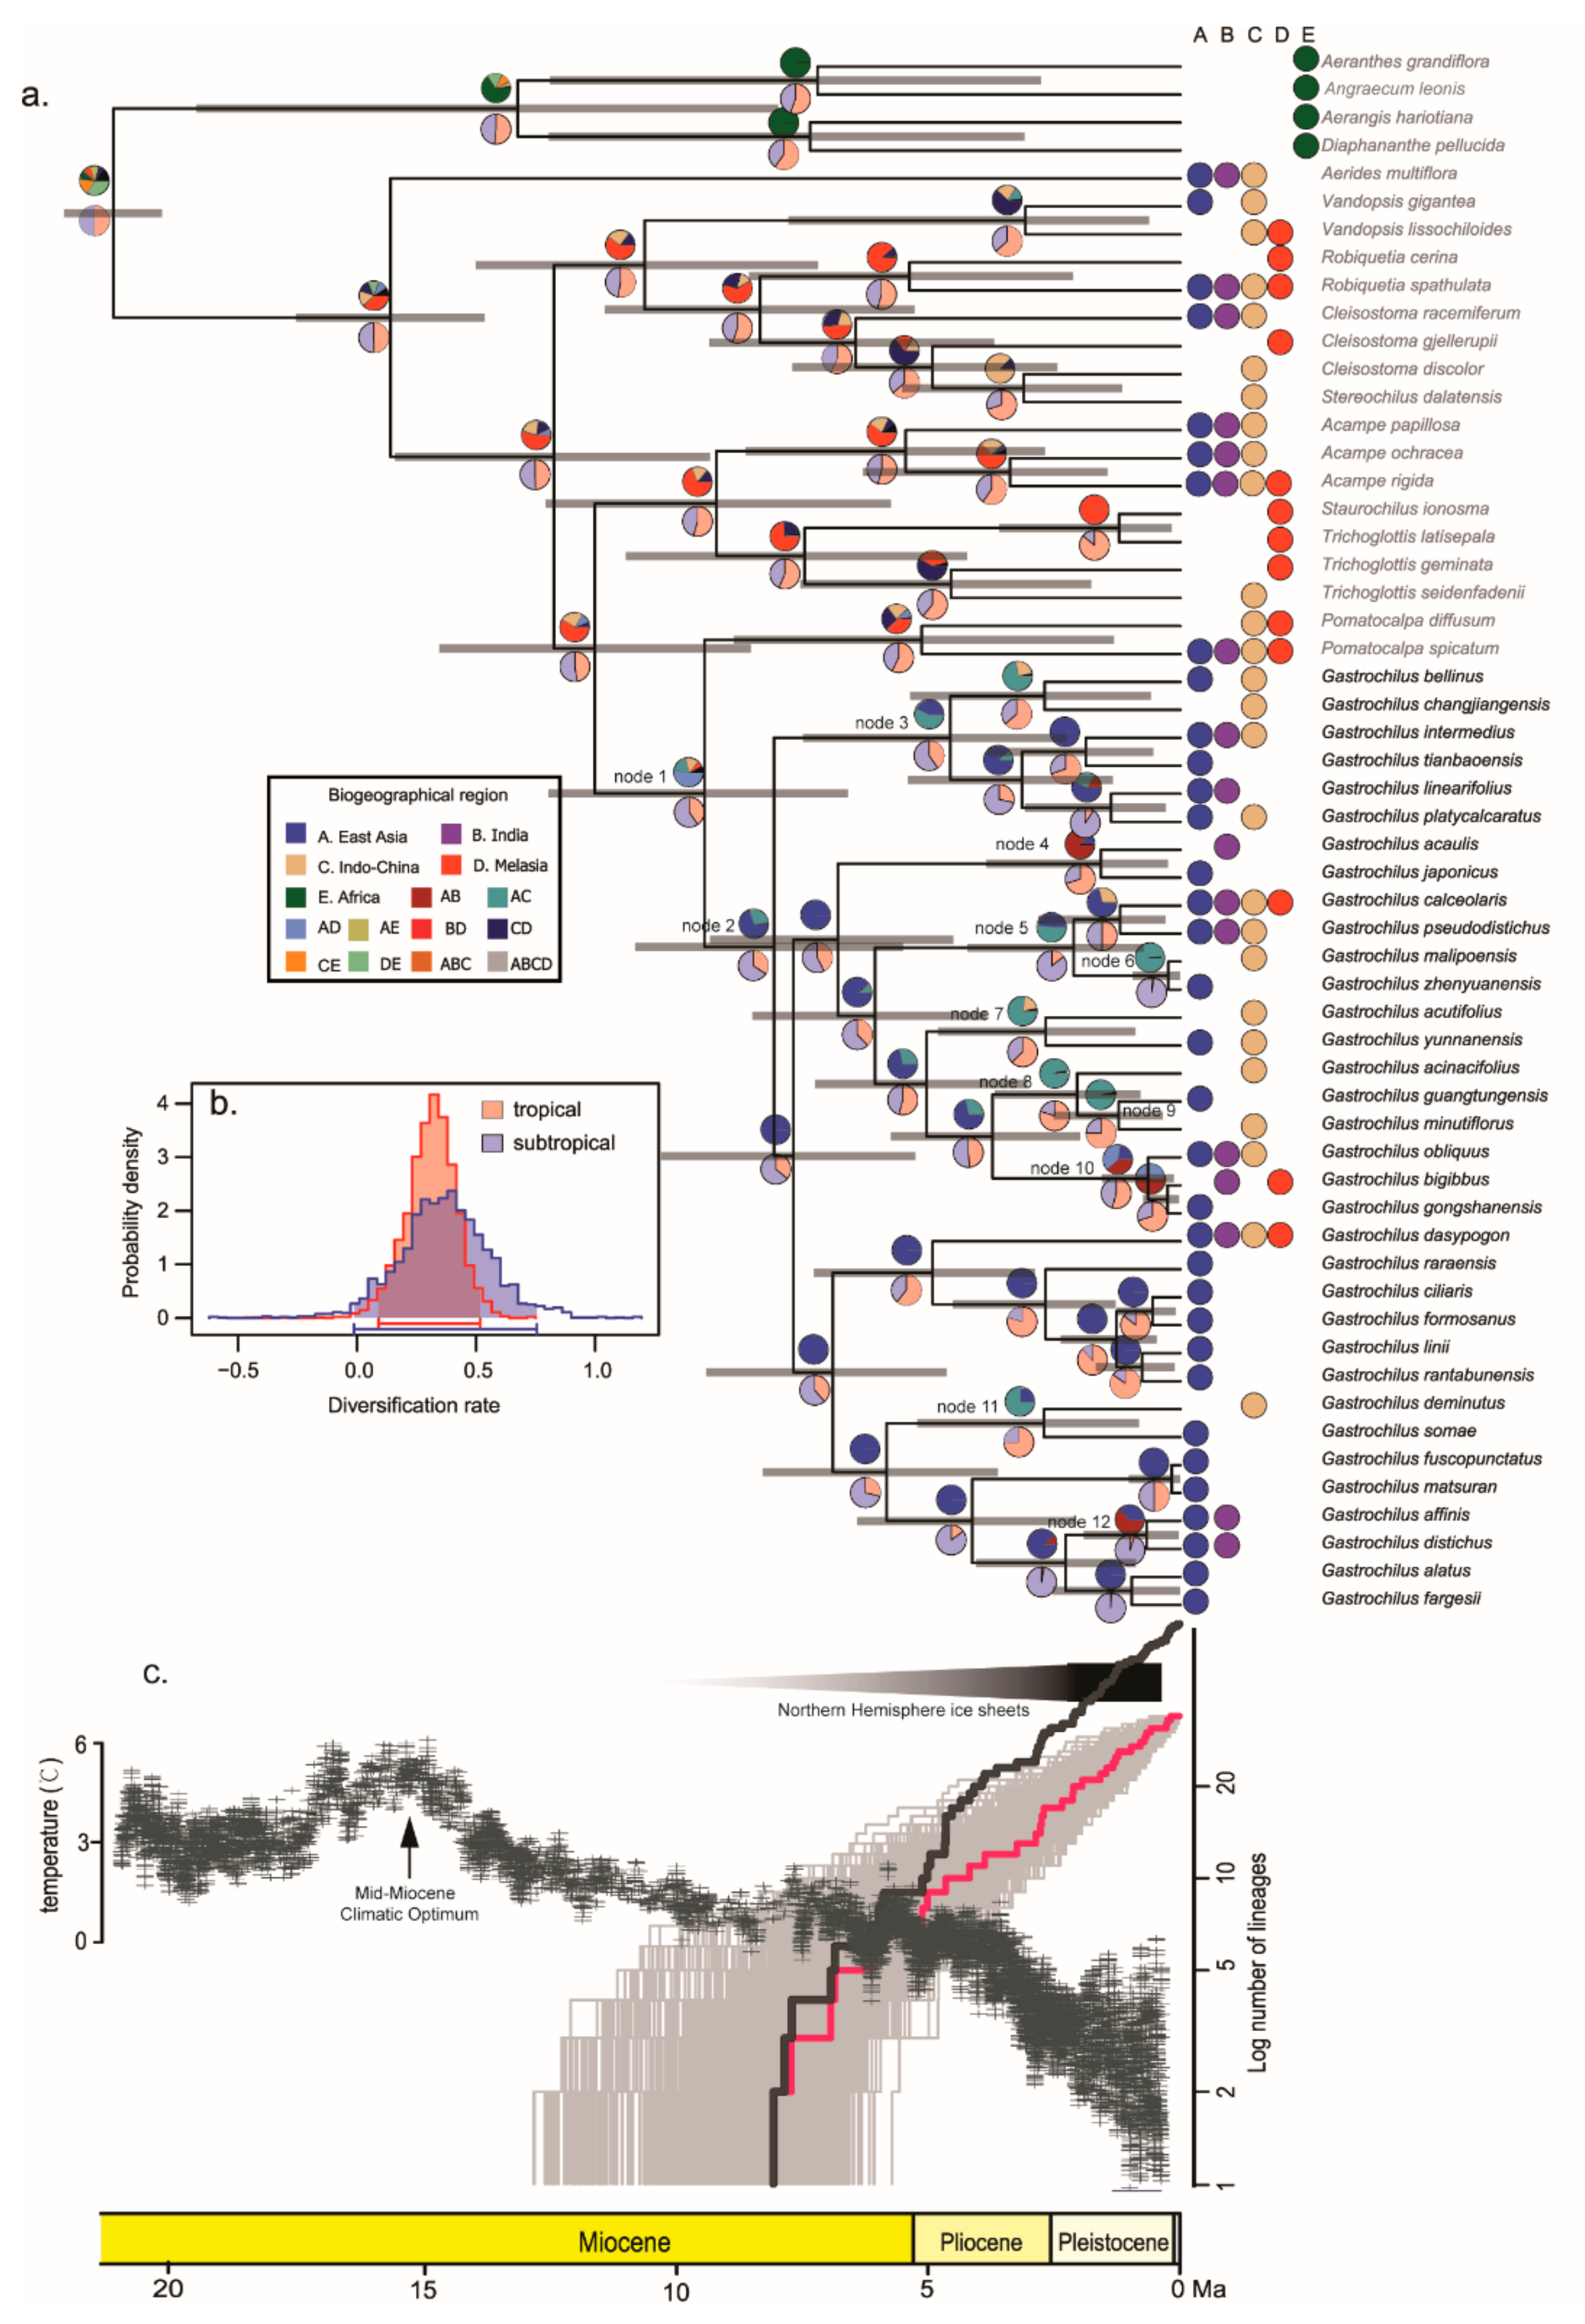
The ancestral area reconstruction of Gastrochilus based on S-DEC is shown in Figure 2a. The ancestral area of Gastrochilus is uncertain, although it probably originated in East Asia or Malesia (node 1). The range of the most recent common ancestor (MRCA) of the genus is inferred in East Asia (node 2). The current distribution of Gastrochilus is inferred to be the result of eight dispersal events and four vicariant events. There are three dispersal events from the East Asiatic region to the Indian region at 1.79 Ma (95% HPD: 0.25–3.86; node 4), 0.74 Ma (95% HPD: 0.13–1.56; node 10), and 0.80 Ma (95% HPD: 0.03–1.92; node 12), respectively. The remaining five dispersal events from the East Asiatic region to Indo-Chinese region happened at 4.70 Ma (95% HPD: 2.27–7.50; node 3), 2.29 Ma (95% HPD: 0.73–4.23; node 5), and 2.79 Ma (95% HPD: 0.89–4.81; node 7), 2.15 Ma (95% HPD: 0.79–3.68; node 8), and 2.86 Ma (95% HPD: 0.82–5.23; node 11), respectively. Additionally, there are three vicariant events that happened between East Asiatic and Indo-Chinese regions at 0.33 Ma (95% HPD: 0–0.95; node 6), 1.33 Ma (95% HPD: 0.35–2.52; node 9), and 2.86 Ma (95% HPD: 0.82–5.23; node 11), respectively. Only one diverged event occurred between East Asiatic and Indian regions (1.79 Ma, 95% HPD: 0.25–3.86; node 4).
3.3. Diversification of Gastrochilus
A positive ΔAICRC value suggests that the data are best approximated by a rate-variable model of diversification [74], so the BDL analysis rejected the null hypothesis of temporally homogeneous diversification rates within Gastrochilus (∆AICRC = 2.07). The BiSSE analysis indicated that the tropical Asian lineages and the subtropical Asian lineages presented the nearly same diversification rate (Figure 2b). The LTT plot showed that Gastrochilus exhibited a high rate of lineage accumulation since its divergence and then decreased slowly through time (Figure 2c, red line). Furthermore, the ClaDS showed there was no significant mean speciation rate shift during its evolutionary history, and the mean speciation rate decelerated very slowly from 8.13 Ma (95% HPD: 5.51–10.83) to the present (Figure 3c,d (green line)). The simulated analysis of LTT plots and CLaDS analysis also showed that the diversification rate and speciation rate increased at the early evolutionary stage and then decreased since the latest Miocene (Figure 2c (black line), Figure 3d (black line)), respectively.
3.4. Niche Evolution and Phylogenetic Signals
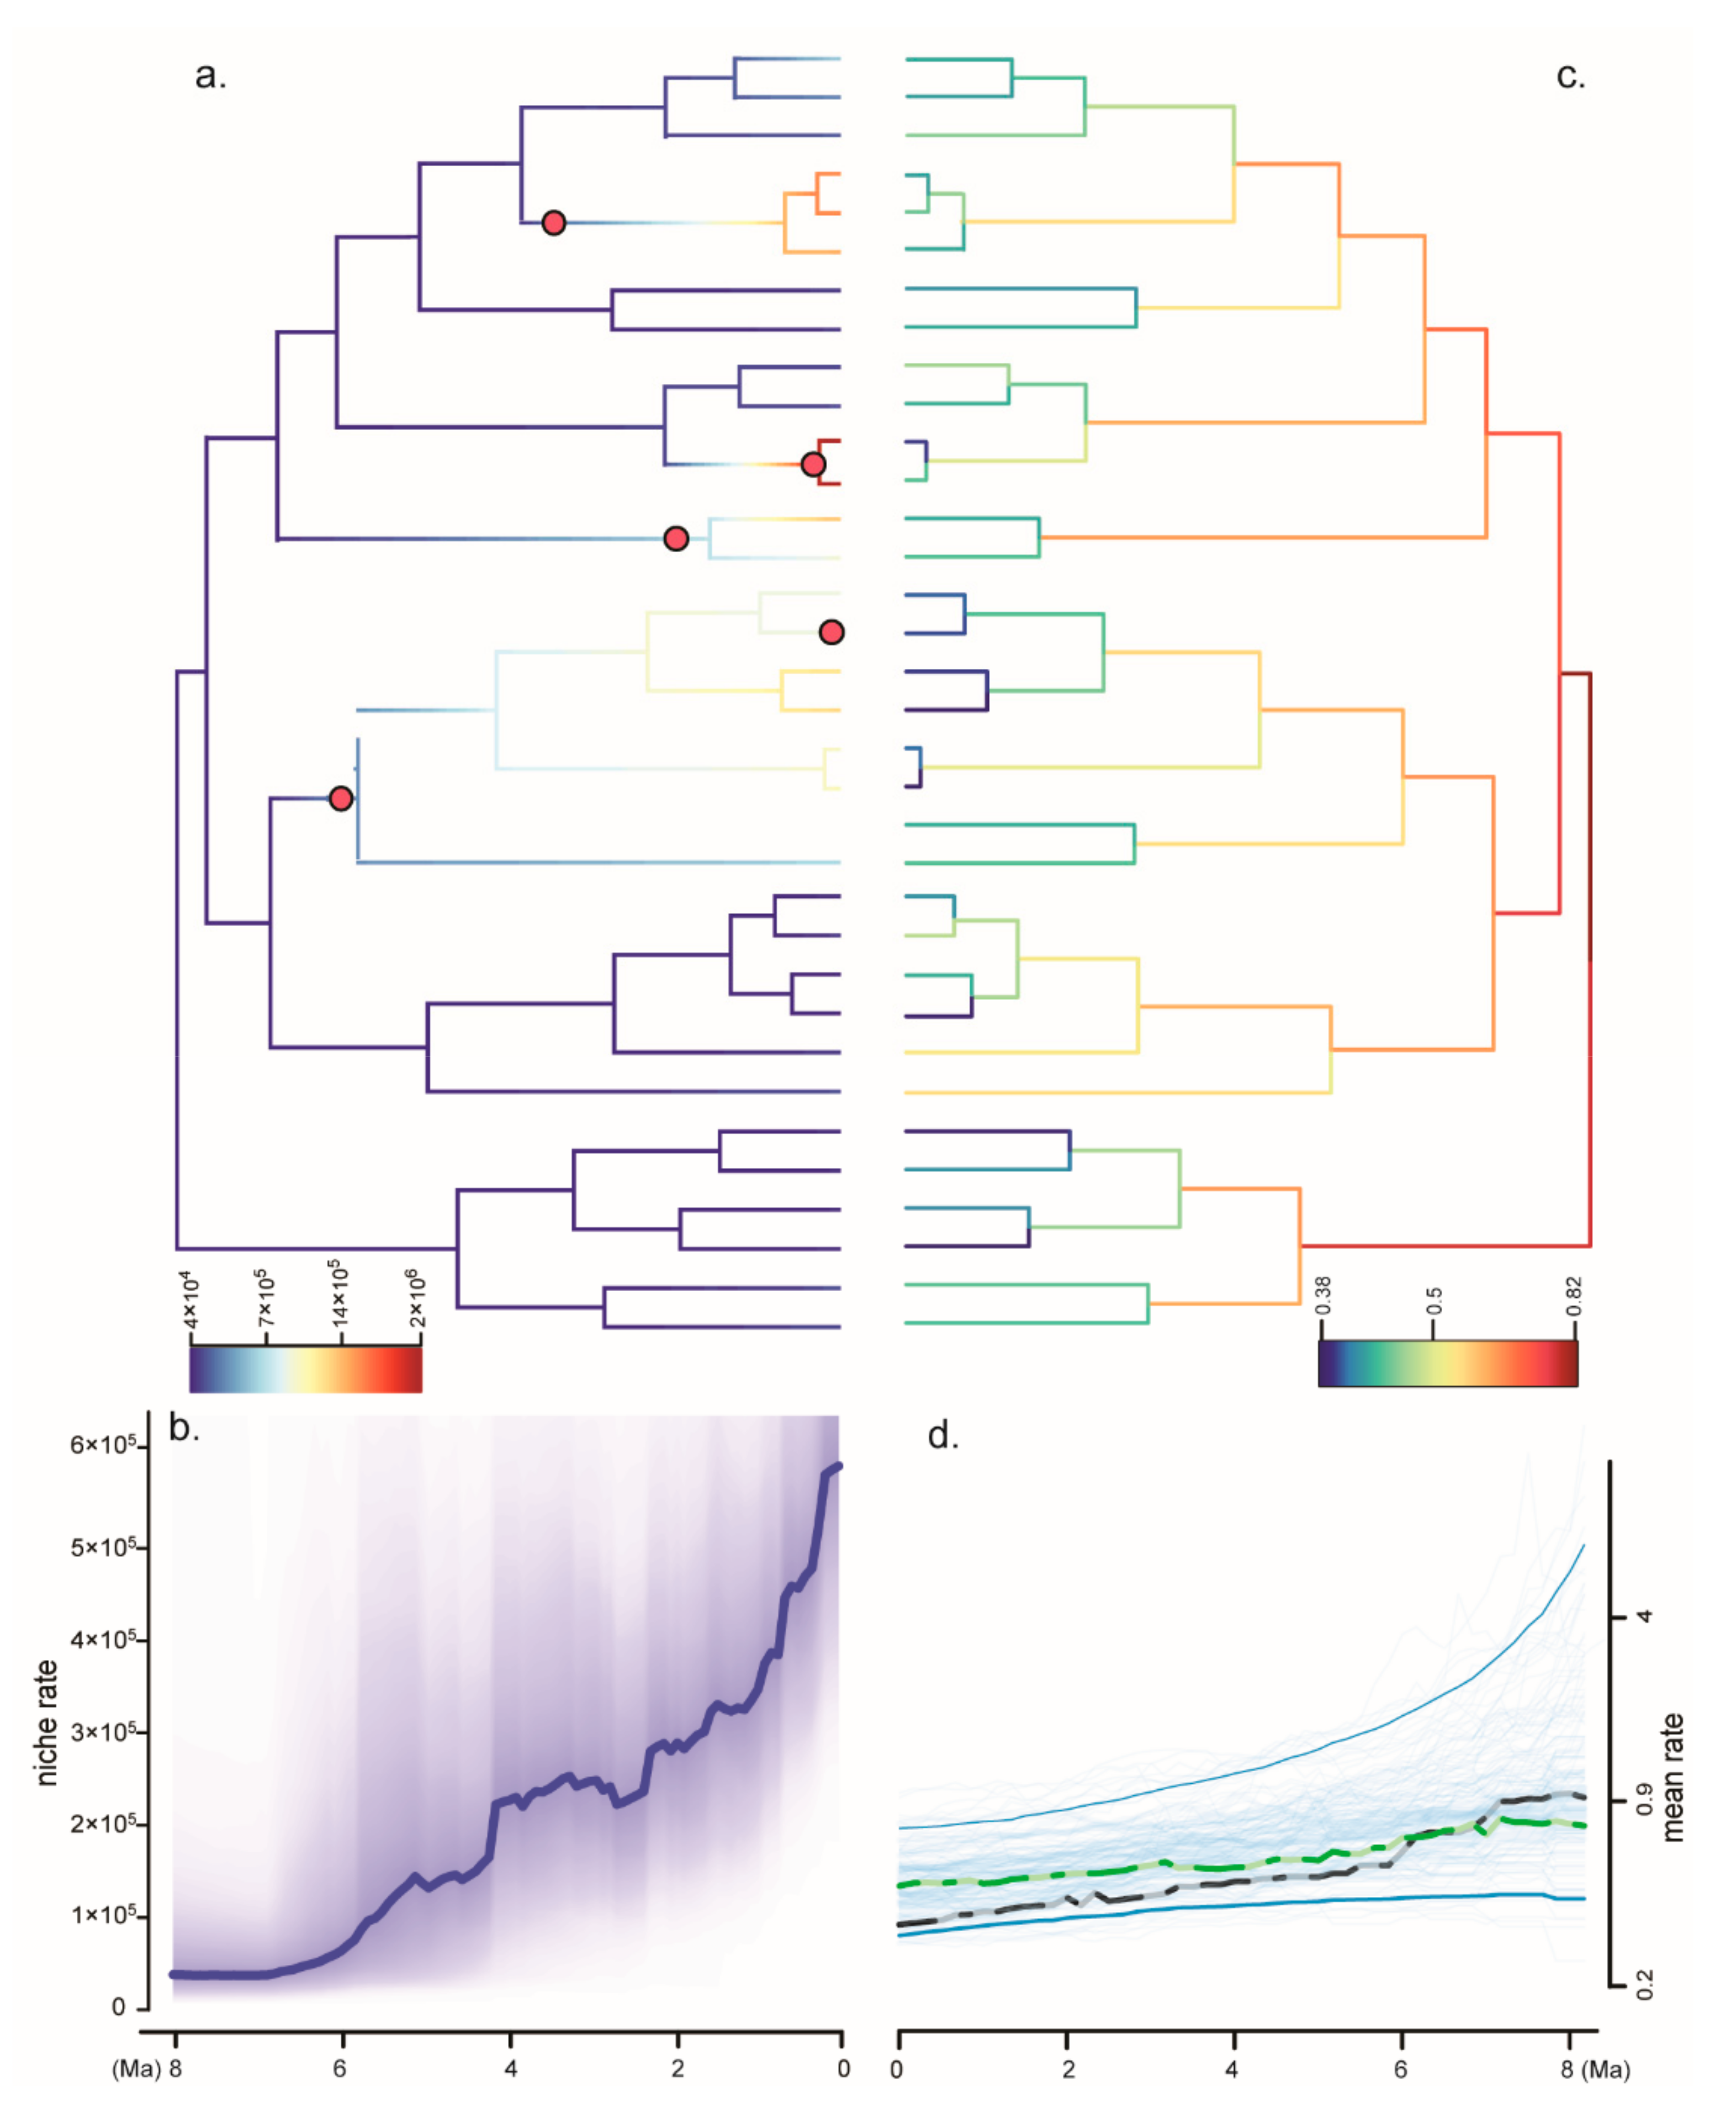
PC1 had a higher contribution from Bio12 (Annual precipitation), Bio16 (Precipitation of wettest quarter), elevation, Bio2 (Mean diurnal range), Bio18 (Precipitation of warmest quarter) and Bio13 (Precipitation of wettest month) (Table S4). Annual precipitation is the main influencing factor with a high PC1 loading value of about 0.88 (Table S4). Nine major shifts of the evolutionary rate of environmental factors were found in the genus Gastrochilus, six of which occurred in the last 2 Ma (Figure 3a). However, evolutionary rates of niche experienced a strong increase toward the present, beginning around the early Pliocene (Figure 3b). Notably, the annual precipitation seemed to play a key role in the rate shift of niche evolution (Table S4). The values of Blomberg’s K and Pagel’s λ are 0.175 and 0.023 with p > 0.05, respectively. This suggests that no significant phylogenetic signals were detected in the niche traits of Gastrochilus.
4. Discussion
4.1. Temporal and Spatial Mode of Gastrochilus
In the present study, our result strongly supported that Gastrochilus is monophyletic, which is consistent with the previous studies [49,50]. The S-DEC result inferred that the MRCA of Gastrochilus lived in the East Asiatic region (Figure 2a, node 2). The ancestor of Gastrochilus has migrated from the East Asiatic region to its adjacent regions (Indian region and Indo-Chinese region) since the early Pliocene at least eight times (Figure 2a). Following the middle Miocene climatic optimum at approximately 15 Mya, a period of global cooling began from ~11 Mya followed by the drastic temperature fluctuations during the Pliocene and Pleistocene [83]. The cooling climate caused many species to migrate southward or to lower altitudes [84,85,86], which also meant Gastrochilus dispersed from the East Asian region into the Indian and Indo-Chinese regions. However, it is well-known that the monsoon system (South Asian Summer Monsoon (SASM) and East Asian Summer Monsoon (EASM)) strengthened in the Asian mainland during the Miocene and Pliocene, especially between c. 15–4 Ma [87,88,89]. Recent studies reported that both South and East Asian Summer monsoons played a decisive role in the landscape evolution of the Himalayas and the adjoining areas in the Indo-Malayan Realm [90]. The intensifications of the EASM during the Late Cenozoic brought abundant rainfall and, therefore, significantly promoted the survival and differentiation of plants in tropical and subtropical Asian mainland [19,28,29,30,91]. During the dynamic evolutionary processes of Gastrochilus, five of eight migration events occurred from the East Asiatic region to Indo-Chinese region in the Pliocene to the early Pleistocene (4.70–2.15 Ma; Figure 2a, node 3, 5, 7, 8, 11), in agreement with the timing of the intensification of the EASM (3.6–2.6 Ma) [26] and SASM (3.57–2.78 Ma) [92]. Additionally, the other three events from the East Asiatic region to the Indian region happened during the late Pleistocene (1.79–0.74 Ma; Figure 2a, node 4, 10, 12), which is consistent with major changes in the monsoon cyclicity that occurred through the Mid-Pleistocene Transition between c. 1.25 and 0.7 Ma [89]. In addition, due to the drastic decline of temperature since the late Pliocene and the frequent temperature fluctuations during the Quaternary, the lineages of Gastrochilus experienced four vicariant events immediately (Figure 2a, node 4, 6, 9) or after dispersal events (Figure 2a, node 11). In general, the current distribution pattern of Gastrochilus does not appear to have occurred via long-distance dispersal. Rather, range expansions associated with a few vicariances are suggested here to explain this pattern.
4.2. Diversification and Niche Evolution of Gastrochilus
Our LTT plots indicate that the lineages of Gastrochilus had accumulated over its evolutionary time since it diverged from the sister groups (8.13 Ma, 95% HPD: 5.51–10.83; Figure 2c). The rate-through-time plots by CLaDS suggested that the mean speciation rates of Gastrochilus decreased slowly through its evolutionary history (Figure 3c,d). The diversification analyses of simulated data also indicated the same tendency of its evolutionary dynamics (Figure 2c and Figure 3d). The same diversification pattern has been detected in Cirrhopetalum alliance (Bulbophyllum, Orchidaceae) [93]. Since the late Pliocene, the global cooling has intensified [83,88], and it might have brought about the slow speciation rates of Gastrochilus.
Although there are nine significant niche shifts in the evolutionary history of Gastrochilus (Figure 3a), both the values of Blomberg’s K (0.75, p > 0.05) and Pagel’s λ (0.023, p > 0.05) inferred that there are no significant phylogenetic signals in the niche traits of Gastrochilus. Furthermore, both the lineages in tropical Asia and subtropical Asia demonstrated a similar diversification rate (Figure 2b), although more than 65% of currently recognized species are restricted to tropical Asia. Our results imply that the species diversity of Gastrochilus is explained by accumulation through time. This result is similar to the diversification pattern of Bulbophyllum in tropical and subtropical Asia, in which species richness is most likely the result of a time-for-speciation effect since the late Miocene [94]. Our environmental niche analyses demonstrated that annual precipitation is an important environmental variable determining the distribution of Gastrochilus (Table S4). Statistically, more than 70% of the extant diversity within this genus was generated in the late Pliocene and the Early Pleistocene (Figure 2a). The intensifications of the EASM during the Pliocene brought abundant rainfall to the tropical and subtropical Asian mainland and probably facilitated the diversification of Gastrochilus with numerous dust-like seeds. Moreover, Givnish et al. [16] proposed that the remarkable diversity of orchids is apparently driven in part by the acquisition of pollinia, epiphytism, tropical distributions, CAM photosynthesis, pollination syndromes, and life on extensive tropical cordilleras. They also pointed out that shifts in net diversification are scale-dependent, and multiple factors—several of them interconnected—have contributed to orchid diversification at the genus level. Liu et al. [49] showed that the presence of epichile hairs has switched many times in Gastrochilus, representing a character state evolving as an adaptation to bee pollination [95], and thus speculated that pollination system shifts occurred independently at least three times in Gastrochilus [49]. The pollination shifts in promoting speciation are recorded in Holcoglossum [96]. Furthermore, except for a few species growing on rocks (e.g., G. gongshanensis), the genus is mainly found on the tree trunks in rainforests, broadleaved forests, or coniferous forests (Table S2) [37,48,50]. In a word, the diversification of Gastrochilus is not only a result of the intensification of monsoons in the last c. 10 Ma but is also attributed to the integration of pollination syndromes and epiphytism.
Supplementary Materials
The following are available online at https://www.mdpi.com/article/10.3390/d14050396/s1, Table S1: The samples and GenBank accession numbers used in this study, Table S2: The distribution, climatic zone, phenology, and habitat of species in this study, Table S3: The species distribution data used in this study, Table S4: Niche PCA loadings.
Author Contributions
Y.L. (Yang Li), Z.Z. and X.X. designed the research. P.Z., Y.L. (Yan Luo), L.Z., W.J. and X.X. collected and performed analyses. W.J., X.X. and Z.Z. drafted the manuscript, W.J., X.X., Y.L. (Yang Li), Y.L. (Yan Luo), P.Z., L.Z. and Z.Z. revised the manuscript. All authors have read and agreed to the published version of the manuscript.
Funding
This research was funded by the National Natural Science Foundation of China–Yunnan Joint Fund Project (grant number: U1802242), the National Natural Science Foundation of China (grant numbers: 31670212, 31300181, and 32060056), and Guangxi Key Laboratory Construction Project (grant number: 19-185-7).
Institutional Review Board Statement
Not applicable.
Data Availability Statement
Not applicable.
Conflicts of Interest
The authors declare no conflict of interest.
References
- Smith, S.A.; Donoghue, M.J. Combining historical biogeography with niche modeling in the Caprifolium clade of Lonicera (Caprifoliaceae, Dipsacales). Syst. Biol. 2010, 59, 322–341. [Google Scholar] [CrossRef] [PubMed] [Green Version]
- Wiens, J.; Donoghue, M.J. Historical biogeography, ecology and species richness. Trends Ecol. Evol. 2004, 19, 639–644. [Google Scholar] [CrossRef] [PubMed]
- Donoghue, M.J.; Edwards, E.J. Biome shifts and niche evolution in plants. Annu. Rev. Ecol. Evol. Syst. 2014, 45, 547–572. [Google Scholar] [CrossRef] [Green Version]
- Wiens, J.; Ackerly, D.D.; Allen, A.P.; Anacker, B.L.; Buckley, L.B.; Cornell, H.V.; Damschen, E.I.; Davies, J.T.; Grytnes, A.; Harrison, S.P.; et al. Niche conservatism as an emerging principle in ecology and conservation biology. Ecol. Lett. 2010, 13, 1310–1324. [Google Scholar] [CrossRef]
- Couvreur, T.L.P.; Forest, F.; Baker, W.J. Origin and global diversification patterns of tropical rain forests: Inferences from a complete genus-level phylogeny of palms. BMC Biol. 2011, 9, 44. [Google Scholar] [CrossRef] [Green Version]
- Pyron, R.A.; Costa, G.C.; Patten, M.A.; Burbrink, F.T. Phylogenetic niche conservatism and the evolutionary basis of ecological speciation. Biol. Rev. 2015, 90, 1248–1262. [Google Scholar] [CrossRef]
- Wang, Q.; Wu, S.D.; Su, X.Y.; Zhang, L.J.; Xu, X.T.; Lyu, L.S.; Cai, H.Y.; Shrestha, N.; Liu, Y.P.; Wang, W.; et al. Niche conservatism and elevated diversification shape species diversity in drylands: Evidence from Zygophyllaceae. Proc. R. Soc. B 2018, 285, 20181742. [Google Scholar] [CrossRef] [Green Version]
- Gagnon, E.; Ringlberg, J.J.; Bruneau, A.; Bruneau, A.; Lewis, G.P.; Hughes, C. Global Succulent Biome phylogenetic conservatism across the pantropical Caesalpinia Group (Leguminosae). New Phytol. 2019, 222, 1994–2008. [Google Scholar] [CrossRef]
- Cardillo, M.; Weston, P.H.; Reynolds, Z.K.M.; Olde, P.M.; Mast, A.R.; Lemmon, E.M.; Lemmon, A.R.; Bromham, L. The phylogeny and biogeography of Hakea (Proteaceae) revealed the role of biome shifts in a continental plant radiation. Evolution 2017, 71, 1928–1943. [Google Scholar] [CrossRef]
- Crisp, M.D.; Arroyo, M.T.K.; Cook, L.G.; Gandolfo, M.A.; Jordan, G.J.; McGlone, M.S.; Weston, P.H.; Westoby, M.; Wilf, P.; Linder, H.P. Phylogenetic biome conservation on a global scale. Nature 2009, 458, 754–756. [Google Scholar] [CrossRef]
- Rice, A.; Smarda, P.; Novosolov, M. The global biogeography of polyploid plants. Nat. Ecol. Evol. 2019, 3, 265–273. [Google Scholar] [CrossRef]
- Losos, J.B. Phylogenetic niche conservatism, phylogenetic signal and the relationship between phylogenetic related and ecological similarity among species. Ecol. Lett. 2018, 11, 995–1107. [Google Scholar] [CrossRef]
- Liu, H.C.; Jacquemyn, H.; Chen, W.; Janssens, S.B.; He, X.Y.; Yu, S.; Huang, Y.Q. Niche evolution and historical biogeography of lady slipper orchids in North America and Eurasia. J. Biogeogr. 2020, 48, 2727–2741. [Google Scholar] [CrossRef]
- Rice, N.H.; Martınez-Meyer, E.; Peterson, T. Ecological niche differentiation in the Aphelocoma jays: A phylogenetic perspective. Biol. J. Linn. Soc. 2003, 80, 369–383. [Google Scholar] [CrossRef] [Green Version]
- Pridgeon, A.; Cribb, P.; Chase, M.; Rasmussen, F.N. Genera Orchidacearum: Epidendroideae (Part Three); Oxford University Press: New York, NY, USA, 2014. [Google Scholar]
- Givnish, T.J.; Spalink, D.; Ames, M.; Lyon, S.P.; Hunter, S.J.; Zuluaga, A.; Iles, W.J.D.; Clements, M.A.; Arroyo, M.T.K.; Leebens, M.J.; et al. Orchid phylogenomics and multiple drivers of their extraordinary diversification. Proc. R. Soc. B 2015, 282, 20151553. [Google Scholar] [CrossRef]
- Wen, J. Evolution of eastern Asian and eastern North American disjunct distributions in flowering plants. Annu. Rev. Ecol. Syst. 1999, 30, 421–455. [Google Scholar] [CrossRef]
- Wu, Z.Y.; Wu, S. A proposal for a new floristic kingdom (realm)—The East Asiatic Kingdom, its delineation and characteristics. In Floristic Characteristics and Diversity of East Asian Plants; Zhang, A.L., Wu, S.G., Eds.; Higher Education Press: Beijing, China; Springer Verlag Press: Berlin/Heidelberg, Germany, 1998; pp. 1–42. [Google Scholar]
- Lu, L.M.; Mao, L.F.; Yang, T.; Ye, J.F.; Liu, B.; Li, H.L.; Sun, M.; Miller, J.T.; Mathews, S.; Hu, H.H.; et al. Evolutionary history of the angiosperm flora of China. Nature 2018, 554, 234–238. [Google Scholar] [CrossRef]
- Mittermeier, R.A.; Fonseca, P.; Gil, R.; Hoffmann, M.; Pilgrim, J.; Brooks, T.; Mittermeier, C.G.; Lamoreux, J.; Fonseca, A.B.G. Hotspots Revisited: Earth’s Biologically Richest and Most Endangered Terrestrial Ecoregions; Cermex: Mexico City, Mexico, 2005. [Google Scholar]
- An, Z.S.; Kutzbach, J.E.; Prell, W.L.; Porter, W.L. Evolution of Asian monsoons and phased uplift of the Himalaya-Tibetan plateau since late Miocene times. Nature 2001, 411, 62–66. [Google Scholar]
- Sun, X.J.; Wang, P.X. How old is the Asian monsoon system? Palaeobotanical records from China. Palaeogeogr. Palaeoclimat. Palaeoecol. 2005, 222, 181–222. [Google Scholar] [CrossRef]
- Manish, K.; Pandit, M.K. Geophysical upheavals and evolutionary diversification of plant species in the Himalaya. Peer J. 2018, 6, e5919. [Google Scholar] [CrossRef]
- Pusok, A.E.; Stegman, D.R. The convergence history of India-Eurasia records multiple subduction dynamics processes. Sci. Adv. 2020, 6, eaaz8681. [Google Scholar] [CrossRef] [PubMed]
- Xing, Y.; Ree, R.H. Uplift-driven diversification in the Hengduan Mountains, a temperate biodiversity hotspot. Proc. Natl. Acad. Sci. USA 2017, 114, E3444–E3451. [Google Scholar] [CrossRef] [PubMed] [Green Version]
- An, Z.S. Late Cenozoic Climate Change in Asia: Loess, Monsoon and Monsoon-Arid Environment Evolution; Springer: Dordrecht, The Netherlands, 2014. [Google Scholar]
- Ashokan, A.; Xavier, A.; Suksathan, P.; Ardiyani, M.; Leong-Škorničková, J.; Newman, M.; Kress, W.J.; Gowda, V. Himalayan orogeny and monsoon intensification explain species diversification in an endemic ginger (Hedychium: Zingiberaceae) from the Indo-Malayan Realm. Mol. Phylogenet. Evol. 2022, 170, 107440. [Google Scholar] [CrossRef] [PubMed]
- Xiang, X.G.; Mi, X.C.; Zhou, H.L.; Li, J.W.; Chung, S.W.; Li, D.Z.; Huang, W.C.; Jin, W.T.; Li, Z.Y.; Huang, L.Q.; et al. Biogeogrpahical diversification of mainland Asian Dendrobium (Orchidaceae) and its implications for the historical dynamics of evergreen broad-leaved forests. J. Biogeogr. 2016, 43, 1310–1323. [Google Scholar] [CrossRef]
- Yu, X.Q.; Gao, L.M.; Soltis, D.E.; Soltis, P.S.; Yang, J.B.; Fang, L.; Yang, S.X.; Li, D.Z. Insights into the historical assembly of east Asian subtropical evergreen broadleaved forests revealed by the temporal history of the tea family. New Phytol. 2017, 215, 1235–1248. [Google Scholar] [CrossRef] [Green Version]
- Chen, X.H.; Xiang, K.L.; Lian, L.; Peng, H.W.; Erst, S.A.; Xiang, X.G.; Chen, Z.D.; Wang, W. Biogeographic diversification of Mahonia (Berberidaceae): Implications for the origin and evolution of East Asian subtropical evergreen broadleaved forests. Mol. Phylogenet. Evol. 2020, 151, 106910. [Google Scholar] [CrossRef]
- Li, X.Q.; Xiang, X.G.; Zhang, Q.; Jabbour, F.; Ortiz, R.D.C.; Erst, A.S.; Li, Z.Y.; Wang, W. Immigration dynamics of tropical and subtropical Southeast Asian limestone karst floras. Proc. R. Soc. B 2022, 289, 20211308. [Google Scholar] [CrossRef]
- Tsi, Z.H. A preliminary revision of Gastrochilus (Orchidaceae). Guihaia 1996, 16, 123–154. [Google Scholar]
- Yi, S.R.; Huang, Y.; Xiao, B.; Shen, M.L.; Li, J. Gastrochilus brevifimbriatus (Orchidaceae, Aeridinae), a New Species from Chongqing, China. Novon 2010, 20, 113–116. [Google Scholar]
- Kumar, P.; Gale, S.W.; Kocyan, A.; Fischer, G.A.; Averyanov, L.V.; Borosova, R.; Bhattacharjee, A.; Li, J.H.; Pang, K.S. Gastrochilus kadooriei (Orchidaceae), a new species from Hong Kong, with notes on allied taxa in section Microphyllae found in the region. Phytotaxa 2014, 164, 91–103. [Google Scholar] [CrossRef] [Green Version]
- Raskoti, B.B. A new species of Gastrochilus and new records for the orchids of Nepal. Phytotaxa 2015, 233, 179. [Google Scholar] [CrossRef]
- Averyanov, L.V.; Van, C.N.; Truong, V.B.; Maisak, T.; Luu, H.T.; Nguyen, K.S.; Diep, D.Q.; Hoang, T.; Tuan, N.H.; Chu, X.C.; et al. New orchids (Orchidaceae: Cymbidieae and Vandeae) in the Flora of Vietnam. Taiwania 2018, 63, 119–138. [Google Scholar]
- Hsu, T.C.; Hsieh, S.I.; Wu, J.H.; Hung, H.C. Gastrochilus deltoglossus (Orchidaceae: Epidendroideae: Vandeae: Aeridinae), a new species from Taiwan. Taiwania 2018, 63, 360–365. [Google Scholar]
- Rao, W.H.; Liu, Z.J.; Zhang, G.Q.; Chen, X.H.; Huang, J.; Chen, G.Z.; Chen, L.J. A new epiphytic species of Gastrochilus (Orchidaceae: Epidendroideae) from Yunnan, China. Phytotaxa 2019, 413, 296–300. [Google Scholar]
- Wu, X.F.; Ye, D.P.; Pan, B.; Lin, X.Q.; Jiang, H.; Liu, Q. Validation of Gastrochilus prionophyllus (Vandeae, Orchidaceae), a new species from Yunnan province, China. PhytoKeys 2019, 130, 161–169. [Google Scholar] [CrossRef]
- Liu, Q.; Tan, Y.H.; Gao, J.Y. A new species of Gastrochilus (Aeridinae, Vandeae, Orchidaceae) and a new record species from Yunnan, China. Phytotaxa 2016, 282, 66–70. [Google Scholar] [CrossRef]
- Liu, Q.; Gao, J.Y. Gastrochilus dulongjiangensis (Aeridinae, Vandeae, Epidendroideae, Orchidaceae), a new species from Yunnan province, China. Phytotaxa 2018, 340, 293–296. [Google Scholar] [CrossRef]
- Liu, Q.; Kumar, P.; Gao, J.Y. Notes on Gastrochilus gongshanensis (Orchidaceae). Kew Bull. 2019, 74, 21. [Google Scholar] [CrossRef]
- Liu, Q.; Zhou, S.S.; Li, R.; Tan, Y.H.; Zyaw, M.; Xing, X.K.; Gao, J.Y. Notes on the genus Gastrochilus (Orchidaceae) in Myanmar. PhytoKeys 2020, 138, 113–123. [Google Scholar] [CrossRef]
- Ormerod, P.; Kumar, C.S. A new Bhutanese Gastrochilus (Orchidaceae), and another transfer in Indian Cylindrolobus. Harv. Pap. Bot. 2020, 25, 125–127. [Google Scholar] [CrossRef]
- Li, J.W.; Ya, J.D.; Ye, D.P.; Liu, C.; Liu, Q.; Pan, R.; He, Z.X.; Pan, B.; Cai, J.; Lin, D.L.; et al. Taxonomy notes on Vandeae (Orchidaceae) from China: Five new species and two new records. Plant Diver. 2021, 43, 379–389. [Google Scholar] [CrossRef] [PubMed]
- Smith, J.J. Gastrochilus odoratus (Kudô) J.J. Smith. Bull. Jard. Bot. Buitenzorg 1937, 14, 168. [Google Scholar]
- Chase, M.W.; Cameron, K.M.; Freudenstein, J.V.; Pridgeon, A.M.; Salazar, G.; Berg, C.V.D.; Schuiteman, A. An updated classification of Orchidaceae. Bot. J. Linn. Soc. 2015, 177, 151–174. [Google Scholar] [CrossRef] [Green Version]
- Chen, S.C.; Tsi, Z.H.; Wood, J.J. Gastrochilus D. Don. In Flora of China Vol. 25 (Orchidaceae); Wu, Z.Y., Raven, P.H., Hong, D.Y., Eds.; Science Press: Beijing, China; Missouri Botanical Garden Press: St. Louis, MI, USA, 2009; pp. 491–498. [Google Scholar]
- Liu, Q.; Song, Y.; Jin, X.H.; Gao, J.Y. Phylogenetic relationships of Gastrochilus (Orchidaceae) based on nuclear and plastid DNA data. Bot. J. Linn. Soc. 2019, 189, 228–243. [Google Scholar] [CrossRef]
- Liu, D.K.; Tu, X.D.; Zhao, Z.; Zeng, M.Y.; Zhang, S.; Ma, L.; Zhang, G.Q.; Wang, M.M.; Liu, Z.J.; Lan, S.R.; et al. Plastid phylogenomic data yield new and robust insights into the phylogeny of Cleisostoma-Gastrochilus clades (Orchidaceae, Aeridinae). Mol. Phylogenet. Evol. 2020, 145, 10729. [Google Scholar] [CrossRef] [PubMed]
- Van den Berg, C.; Goldman, D.H.; Freudenstein, J.V.; Pridgeon, A.M.; Cameron, K.M.; Chase, M.W. An overview of the phylogenetic relationships within Epidendroideae inferred from multiple DNA regions and circumscription of Epidendreae and Arethuseae (Orchidaceae). Am. J. Bot. 2005, 92, 613–645. [Google Scholar] [CrossRef]
- Farminhão, J.N.M.; Verlynde, S.; Kaymak, E.; Droissart, V.; Simo-Droissart, M.; Collobert, G.; Martos, F.; Stévart, T. Rapid radiation of angraecoids (Orchidaceae, Angraecinae) in tropical Africa characterised by multiple karyotypic shifts under major environmental instability. Mol. Phylogenet. Evol. 2021, 159, 107105. [Google Scholar] [CrossRef]
- Shaw, J.; Lickey, E.B.; Beck, J.T.; Farmer, S.B.; Liu, W.S.; Miller, J.; Siripun, K.C.; Winder, C.T.; Schilling, E.E.; Small, R.L. The tortoise and the hare II: Relative utility of 21 noncoding chloroplast DNA sequences for phylogenetic analysis. Am. J. Bot. 2005, 92, 142–166. [Google Scholar] [CrossRef] [Green Version]
- Shaw, J.; Lickey, E.B.; Schilling, E.E.; Small, R.L. Comparison of whole chloroplast genome sequences to choose noncoding regions for phylogenetic studies in angiosperms: The tortoise and the hare III. Am. J. Bot. 2007, 94, 275–288. [Google Scholar] [CrossRef] [Green Version]
- Hall, T.A. BioEdit: A user-friendly biological sequence alignment editor and analysis program for Windows 95/98/NT. Nucl. Acids Symp. Ser. 1999, 41, 95–98. [Google Scholar]
- Farris, J.S.; Källersjö, M.; Kluge, A.G.; Bult, C. Testing significance of incongruence. Cladistics 1994, 10, 315–319. [Google Scholar] [CrossRef]
- Wendel, J.; Doyle, J. Phylogenetic incongruence, window into genome history and evolution. In Molecular Systematics of Plants II: DNA Sequencing; Soltis, D.E., Soltis, P.S., Doyle, J.J., Eds.; Kluwer Academic Publishing: Dordrecht, The Netherlands, 1998; pp. 265–296. [Google Scholar]
- Gatesy, J.; O’Grady, P.; Baker, R.H. Corroboration among data sets in simultaneous analysis, hidden support for phylogenetic relationships among higher level Artiodactyl taxa. Cladistics 1999, 15, 271–313. [Google Scholar] [CrossRef]
- Swofford, D.L. PAUP 4.0b10: Phylogenetic analysis using parsimony (and other methods); Sinauer: Sunderland, UK, 2002. [Google Scholar]
- Posada, D.; Crandall, K.A. Modeltest: Testing the model of DNA substitution. Bioinformatics 1998, 14, 817–818. [Google Scholar] [CrossRef] [Green Version]
- Stamatakis, A. RAxML version 8: A tool for phylogenetic analysis and post-analysis of large phylogenies. Bioinformatics 2014, 30, 1312–1313. [Google Scholar] [CrossRef]
- Ronquist, F.; Teslenko, M.; van der Mark, P.; Ayres, D.L.; Darling, A.; Höhna, S.; Larget, B.; Liu, L.; Suchard, M.A.; Huelsenbeck, J.P. MrBayes 3.2: Efficient Bayesian phylogenetic inference and model choice across a large model space. Syst. Biol. 2012, 61, 539–542. [Google Scholar] [CrossRef] [Green Version]
- Rambaut, A.; Drummond, A.J. Tracer v1.5 [online]. Available online: http://beast.bio.ed.ac.uk/Tracer (accessed on 30 November 2009).
- Felsenstein, J. Phylogenies from molecular sequences: Inference and reliability. Ann. Rev. Genet. 1988, 22, 521–565. [Google Scholar] [CrossRef]
- Sorhannus, U.; Bell, C.V. Testing for equality of molecular evolutionary rates: A comparison between a relative-rate test and a likelihood ratio test. Mol. Biol. Evol. 1999, 16, 849–855. [Google Scholar] [CrossRef] [Green Version]
- Bouckaert, R.; Heled, J.; Kühnert, D.; Vaughan, T.; Wu, C.H.; Xie, D.; Suchard, M.A.; Rambaut, A.; Drummond, A.J. BEAST 2: A Software platform for Bayesian evolutionary analysis. PLoS Comput. Biol. 2014, 10, e1003537. [Google Scholar] [CrossRef] [Green Version]
- Givnish, T.J.; Spalink, D.; Ames, M.; Lyon, A.P.; Hunter, S.J.; Zuluaga, A.; Doucette, A.A.; Caro, G.G.; McDaniel, J.; Clements, M.A.; et al. Orchid historical biogeography, diversification, Antarctica and the paradox of orchid dispersal. J. Biogeogr. 2016, 43, 1905–1916. [Google Scholar] [CrossRef]
- Ho, S.Y.W. Calibrating molecular estimates of substitution rates and divergence times in bird. J. Avian Biol. 2007, 38, 409–414. [Google Scholar] [CrossRef]
- Drummond, A.J.; Rambaut, A. BEAST: Bayesian evolutionary analysis by sampling trees. BMC Evol. Biol. 2007, 7, 214. [Google Scholar] [CrossRef] [Green Version]
- Takhtajan, A. Floristic Regions of the World; University of California Press: Berkeley, CA, USA; Los Angeles, CA, USA, 1986. [Google Scholar]
- Yu, Y.; Harris, A.J.; Blair, C.; He, X.J. RASP (Reconstruct Ancestral State in Phylogenies): A tool for historical biogeography. Mol. Phylogenet. Evol. 2015, 87, 46–49. [Google Scholar] [CrossRef]
- Pagel, M.; Meade, A. BayesTraits: Computer Program and Documentation Version 4.0. 2022. Available online: http://www.evolution.reading.ac.uk/BayesTraitsV4.0.0.html (accessed on 1 February 2022).
- FitzJohn, R.G. Diversitree: Comparative phylogenetic analyses of diversification in R. Mol. Phylogenet. Evol. 2012, 3, 1084–1092. [Google Scholar] [CrossRef]
- Rabosky, D.L. LASER: A maximum likelihood toolkit for detecting temporal shits in diversification rates from molecular phylogenies. Evol. Bioinform. Online 2006, 2, 257–260. [Google Scholar] [CrossRef] [Green Version]
- Paradis, E.; Claude, J.; Strimmer, K. APE: Analyses of phylogenetics and evolution in R language. Bioinformatics 2004, 20, 289–290. [Google Scholar] [CrossRef] [PubMed] [Green Version]
- Maliet, O.; Morlon, H. Fast and accurate estimation of species-specific diversification rates using data augmentation. Syst. Biol. 2022, 71, 353–366. [Google Scholar] [CrossRef] [PubMed]
- Revell, L.J. Phytools: An R package for phylogenetic comparative biology (and other things). Mol. Phylogenet. Evol. 2012, 3, 217–223. [Google Scholar] [CrossRef]
- Fick, S.E.; Hijmans, R.J. WorldClim 2: New 1-km spatial resolution climate surfaces for global land areas. Int. J. Climatol. 2017, 37, 4302–4315. [Google Scholar] [CrossRef]
- Rabosky, D.L.; Grundler, M.; Anderson, C.; Title, P.; Shi, J.J.; Brown, J.W.; Huang, H.; Larson, J.G.; Kembel, S. BAMMtools: An R package for the analysis of evolutionary dynamics on phylogenetic trees. Mol. Phylogenet. Evol. 2014, 5, 701–707. [Google Scholar] [CrossRef]
- Plummer, M.; Best, N.; Cowles, K.; Vines, K. CODA: Convergence diagnosis and output analysis for MCMC. R News 2006, 6, 7–11. [Google Scholar]
- Blomberg, S.P.; Garland, T.; Ives, A.R. Testing for phylogenetic signal in comparative data: Behavioral traits are more labile. Evolution 2003, 57, 717–745. [Google Scholar] [CrossRef]
- Pagel, M. Inferring the historical patterns of biological evolution. Nature 1999, 401, 877–884. [Google Scholar] [CrossRef]
- Zachos, J.C.; Dickens, G.R.; Zeebe, R.E. An early Cenozoic perspective on greenhouse warming and carbon-cycle dynamics. Nature 2008, 451, 279–283. [Google Scholar] [CrossRef]
- Zhang, J.B.; Li, R.Q.; Xiang, X.G.; Manchester, S.R.; Lin, L.; Wang, W.; Wen, J.; Chen, Z.D. Integrated fossil and molecular data reveal the biogeographic diversification of the eastern Asian-eastern North American disjunct hickory genus (Carya Nutt.). PLoS ONE 2013, 8, e70449. [Google Scholar] [CrossRef] [Green Version]
- Kou, Y.X.; Cheng, S.M.; Tian, S.; Li, B.; Fan, D.M.; Chen, Y.J.; Soltis, D.E.; Soltis, P.S.; Zhang, Z.Y. The antiquity of Cyclocarya paliurus (Juglandaceae) provides new insights into the evolution of relict plants in subtropical China since the late Tertiary Miocene. J. Biogeogr. 2016, 43, 351–360. [Google Scholar] [CrossRef]
- Ye, X.Y.; Ma, P.F.; Yang, G.Q.; Guo, C.; Zhang, Y.X.; Chen, Y.M.; Guo, Z.H.; Li, D.Z. Rapid diversification of alpine bamboos associated with the uplift of the Hengduan Mountains. J. Biogeogr. 2019, 46, 2678–2689. [Google Scholar] [CrossRef]
- Filipelli, G.M. Intensification of the Asian monsoon and a chemical weathering event in the late Miocene-early Pliocene: Implications for late Neogene climate change. Geology 1997, 25, 27–30. [Google Scholar] [CrossRef]
- Osborne, C.P. Atmosphere, ecology and evolution: What drove the Miocene expansion of C4 grasslands? J. Ecol. 2008, 96, 35–45. [Google Scholar] [CrossRef] [Green Version]
- Ding, W.N.; Ree, R.H.; Spicer, R.A.; Xing, Y.W. Ancient orogenic and monsoon-driven assembly of the world’s richest temperate alpine flora. Science 2020, 369, 578–581. [Google Scholar] [CrossRef]
- Spicer, R.A.; Yang, J.; Herman, A.B.; Kodrul, T.; Aleksandrova, G.; Maslova, N.; Spicer, T.E.V.; Ding, L.; Xu, Q.; Shukla, A.; et al. Paleogene monsoons across India and South China: Drivers of biotic change. Gondwana Res. 2017, 49, 350–363. [Google Scholar] [CrossRef] [Green Version]
- Chang, Z.; Xiao, J.; Lu, L.; Yao, H. Abrupt shifts in the Indian monsoon during the Pliocene marked by high-resolution terrestrial records from the Yuanmou Basin in southwest China. J. Asian Earth Sci. 2010, 37, 166–175. [Google Scholar] [CrossRef]
- Willeit, M.; Ganopolski, A.; Calov, R.; Brovkin, V. Mid-Pleistocene transition in glacial cycles explained by declining CO2 and regolith removal. Sci. Adv. 2019, 5, eaav7337. [Google Scholar] [CrossRef] [Green Version]
- Hu, A.Q.; Gale, S.W.; Liu, Z.J.; Fischer, G.A.; Saunders, R.M.K. Diversification slowdown in the Cirrhopetalum alliance (Bulbophyllum, Orchidaceae): Insights from the evolutionary dynamics of crassulacean acid metabolism. Front. Plant Sci. 2022, 13, 794171. [Google Scholar] [CrossRef]
- Gamisch, A.; Comes, H.P. Clade-age-dependent diversification under high species turnover shapes species richness disparities among tropical rainforest lineages of Bulbophyllum (Orchidaceae). BMC Evol. Biol. 2019, 19, 93. [Google Scholar] [CrossRef] [Green Version]
- Takamiya, T.; Wongsawad, P.; Sathapattayanon, A.; Tajima, N.; Suzuki, S.; Kitamura, S.; Shioda, N.; Handa, T.; Kitanaka, S.; Lijima, H.; et al. Molecular phylogenetics and character evolution of morphologically diverse groups, Dendrobium section Dendrobium and allies. AoB Plants 2014, 6, plu045. [Google Scholar] [CrossRef] [Green Version]
- Xiang, X.G.; Li, D.Z.; Jin, X.H.; Hu, H.; Zhou, H.L.; Jin, W.T.; Lai, Y.J. Monophyly or paraphyly– the taxonomy of Holcoglossum (Aeridinae: Orchidaceae). PLoS ONE 2012, 7, e52050. [Google Scholar] [CrossRef] [PubMed] [Green Version]
Figure 1.
Phylogenetic tree obtained by the maximum likelihood method of the combination of nuclear and plastid regions. Numbers above the branches indicate supported values (>50%) from maximum likelihood, maximum parsimony, and Bayesian Inference methods, respectively. Numbers at the nodes are bootstrap percentages and Bayesian posterior probabilities, respectively. A dash (-) indicates that a node is not supported in the analysis.

Figure 2.
(a) Ancestral range reconstruction of Gastrochilus based on the chronogram. The chronogram was generated in BEAST analysis. Grey bars show 95% highest posterior density intervals. Nodes of interest were numbered from 1 to 12. The pie charts above the branches represent the results of ancestral range reconstruction, and those under the branches represent the results of habitat reconstruction. (b) Habitat-dependent posterior probability distribution of net diversification rates from BiSSE analyses. (c) LTT plots of Gastrochilus for empirical data (pink line) and simulated data (black line), respectively. The depiction of temperature changes is modified from Zachos et al. [83].

Figure 3.
Niche analysis and diversification analysis of Gastrochilus. (a) Niche evolution and shift of Gastrochilus. (b) Niche rate during the evolutionary history of Gastrochilus. (c) Inferred lineage-specific speciation rates for Gastrochilus phylogeny. (d) Inferred mean speciation rate of Gastrochilus through time, with individual MCMC iterations (thin blue line), the 95% credibility interval for each time point (thick blue line), the mean rate for each time point (dotted green) of empirical data, and the mean rate for each time point (dotted black) of simulated data. The unit of the diversification rate is speciation events per million years; niche rates are unitless.

Publisher’s Note: MDPI stays neutral with regard to jurisdictional claims in published maps and institutional affiliations. |
© 2022 by the authors. Licensee MDPI, Basel, Switzerland. This article is an open access article distributed under the terms and conditions of the Creative Commons Attribution (CC BY) license (https://creativecommons.org/licenses/by/4.0/).
Share and Cite
MDPI and ACS Style
Li, Y.; Jin, W.; Zhang, L.; Zhou, P.; Luo, Y.; Zhu, Z.; Xiang, X. Biogeography and Diversification of the Tropical and Subtropical Asian Genus Gastrochilus (Orchidaceae, Aeridinae). Diversity 2022, 14, 396. https://doi.org/10.3390/d14050396
AMA Style
Li Y, Jin W, Zhang L, Zhou P, Luo Y, Zhu Z, Xiang X. Biogeography and Diversification of the Tropical and Subtropical Asian Genus Gastrochilus (Orchidaceae, Aeridinae). Diversity. 2022; 14(5):396. https://doi.org/10.3390/d14050396
Chicago/Turabian StyleLi, Yang, Weitao Jin, Liguo Zhang, Peng Zhou, Yan Luo, Ziwei Zhu, and Xiaoguo Xiang. 2022. "Biogeography and Diversification of the Tropical and Subtropical Asian Genus Gastrochilus (Orchidaceae, Aeridinae)" Diversity 14, no. 5: 396. https://doi.org/10.3390/d14050396
Note that from the first issue of 2016, this journal uses article numbers instead of page numbers. See further details here.