Article

Assessment of Climate Change and Land Use Effects on Water Lily (Nymphaea L.) Habitat Suitability in South America

1
Wuhan Botanical Garden, Chinese Academy of Sciences, Wuhan 430074, China
2
Center of Conservation Biology, Core Botanical Gardens, Chinese Academy of Sciences, Wuhan 430074, China
3
University of Chinese Academy of Sciences, Beijing 100049, China
4
Centre for Integrative Conservation, Xishuangbanna Tropical Botanical Garden, Chinese Academy of Sciences, Menglun 666303, China
5
School of Agriculture and Technical Studies, Lukenya University, Mtito Andei P.O. Box 90-90128, Kenya
6
School of Environmental Studies, Kenyatta University, Nairobi P.O. Box 43844-00100, Kenya
7
Sino-Africa Joint Research Center, Chinese Academy of Sciences, Wuhan 430074, China
*
Authors to whom correspondence should be addressed.
Diversity 2022, 14(10), 830; https://doi.org/10.3390/d14100830
Submission received: 5 September 2022 / Revised: 29 September 2022 / Accepted: 30 September 2022 / Published: 3 October 2022
(This article belongs to the Special Issue Ecology, Evolution and Diversity of Plants)

Abstract

:
Many aquatic species have restricted dispersal capabilities, making them the most vulnerable organisms to climate change and land use change patterns. These factors deplete Nymphaea species’ suitable habitats, threatening their populations and survival. In addition, the species are poorly documented, which may indicate how scarce they are or will become. Members of Nymphaea are ecologically important as well as having cultural and economic value, making them of conservation interest. Therefore, using the maximum entropy (MaxEnt) approach, climatic variables, land use, and presence points were modeled for seven Nymphaea species in South America, using three general circulation models (CCSM4, HADGEM2-AO, and MIROC5) and in two representative concentration pathways (RCPs 4.5 and 8.5) and two scenarios (2050 and 2070). Our results indicated that mean diurnal range (bio2), precipitation of the wettest month (bio13), temperature seasonality (bio15), and land use (dom_lu) were the main influencing factors. For all species, suitable areas were concentrated east of Brazil, and they were variable in northern parts of the continent. Besides, inconsistent expansion and contraction of suitable habitats were noticed among the species. For example, N. amazonum, N. rudgeana, and N. lasiophylla future habitat expansions declined and habitat contraction increased, while for N. ampla and N. jamesoniana, both future habitat expansion and contraction increased, and for N. pulchella and N. rudgeana it varied in the RCPs. Moreover, the largest projected suitable habitats were projected outside protected areas, characterized by high human impacts, despite our analysis indicating no significant change between protected and unprotected areas in suitable habitat change. Finally, understanding how climate change and land use affect species distribution is critical to developing conservation measures for aquatic species.

1. Introduction

Temperature and precipitation fluctuations have been reported in South America over the last decade [1]. For example, in Brazil, the temperature has increased by approximately 0.5 °C [2], while the mean temperature variability across the continent varied between 0.2 and 0.8 °C, with a projected increase of 1 to 4 °C by the end of the century [3]. The average precipitation is projected to increase in the southeast and decrease in other areas, especially between latitudes 5° and 20° south [1]. The effect of climate change on the continent is also seen in the rapid melting of glaciers, which is associated with changes in temperature and humidity [4,5]. As global warming continues to rise, species respond to climate change, causing increased shifts and redistributions in search of suitable habitats. Ultimately, this has an impact on conservation and management plans in maintaining biodiversity [6].
As the earth becomes much warmer, various land regions become drier, such as parts of the Amazon Forest in Brazil which are being replaced by non-forest environments [7]. Global warming is also linked to the increased savannah land in the Amazon and semi-arid areas northeast of Brazil, which are slowly transforming to deserts [8]. Besides climate warming, the increased human activities pose negative consequences for many parts of the region, such as the Caatinga biome east of Brazil [8]. As climate change affects species community assemblages, the direct effect of human activity in the ecosystem is loss of habitat, which is the primary loss of biodiversity [9]. The unprecedented population growth, urbanization, and need for sustainable food production are among the major humanized factors leading to ecosystem exploitation and loss of biodiversity. These activities also create large disruption to stream flow and wetlands, as well as influencing the hydrological events that lead to floods and droughts, which further threaten extinction of wetland ecosystems and their biodiversity.
The distribution of Nymphaea species is considered widespread worldwide [10], however in South America the distribution is poorly explored and documented. Their distribution is particularly prone to climate change and human activities, more so from the characteristic assemblages of the presence data. Most occurrence points were obtained from Brazil compared to the other states in the continent, which might signify inconsistent availability of the species or sampling in the most accessible areas [11]. Much of their restricted ranges threaten the species’ habitat suitability with a risk of decline or extinction. This may signify the loss of wild populations that play a key role not only scientifically or culturally but also ecologically in providing food, habitat, water sediments, and turbidity management, and as an indicator for a healthy wetland ecosystem [12,13]. Besides, other studies have indicated climate change to be of concern in aquatic species’ distribution [14,15,16]. Although human influence was not included in those studies, its impact, combined with climate change, poses an unlimited threat to biodiversity and habitat loss for the species [17]. For example, it is approximated that 15% (560,000 km2) of the forested area in Brazil has so far been lost to ranching and agriculture [18,19]. Considering the sensitivity of the species habitat environment and the species distribution data deficit, their vulnerability to climate change and human influence make them a great choice for this study.
The ecological niche models (ENMs) approach has been employed as a valuable tool for assessing the species habitat suitability [20], enabling insights for conservation measures. These models have been widely used to estimate potentially suitable habitats for a variety of species in temporal and spatial ranges using species occurrence records and environmental variables, in addition to species range shifts, habitat quality, habitat requirements, and to identify potential distribution regions for species. However, maximum entropy (MaxEnt) is much preferred for its ability to accommodate presence only data [21], it performs well and can work with small sample sets [22,23,24], and avoids commission errors when projecting species distribution [25], thus making it suitable in the assessment of aquatic organism-suitable habitats. It also performs well on both large and narrow geographical distribution scales, such as in the distribution of Ottelia and water lily species across Africa and Australia, respectively [14,15,16].
Using the MaxEnt modeling approach, we assessed the habitat distribution for seven Nymphaea species in South America. Our goals were to: (i) model and predict the current distributional range for Nymphaea species in South America, (ii) identify the environmental variables shaping the habitat and distribution of Nymphaea species, (iii) predict the future habitat suitability of the species, (iv) evaluate human effects on the distribution of the water lilies, and (v) predict the percentage threat of the water lilies’ suitable habitats by evaluating the habitat suitability under protected areas (PAs) and unprotected areas (un-PAs).

2. Materials and Methods

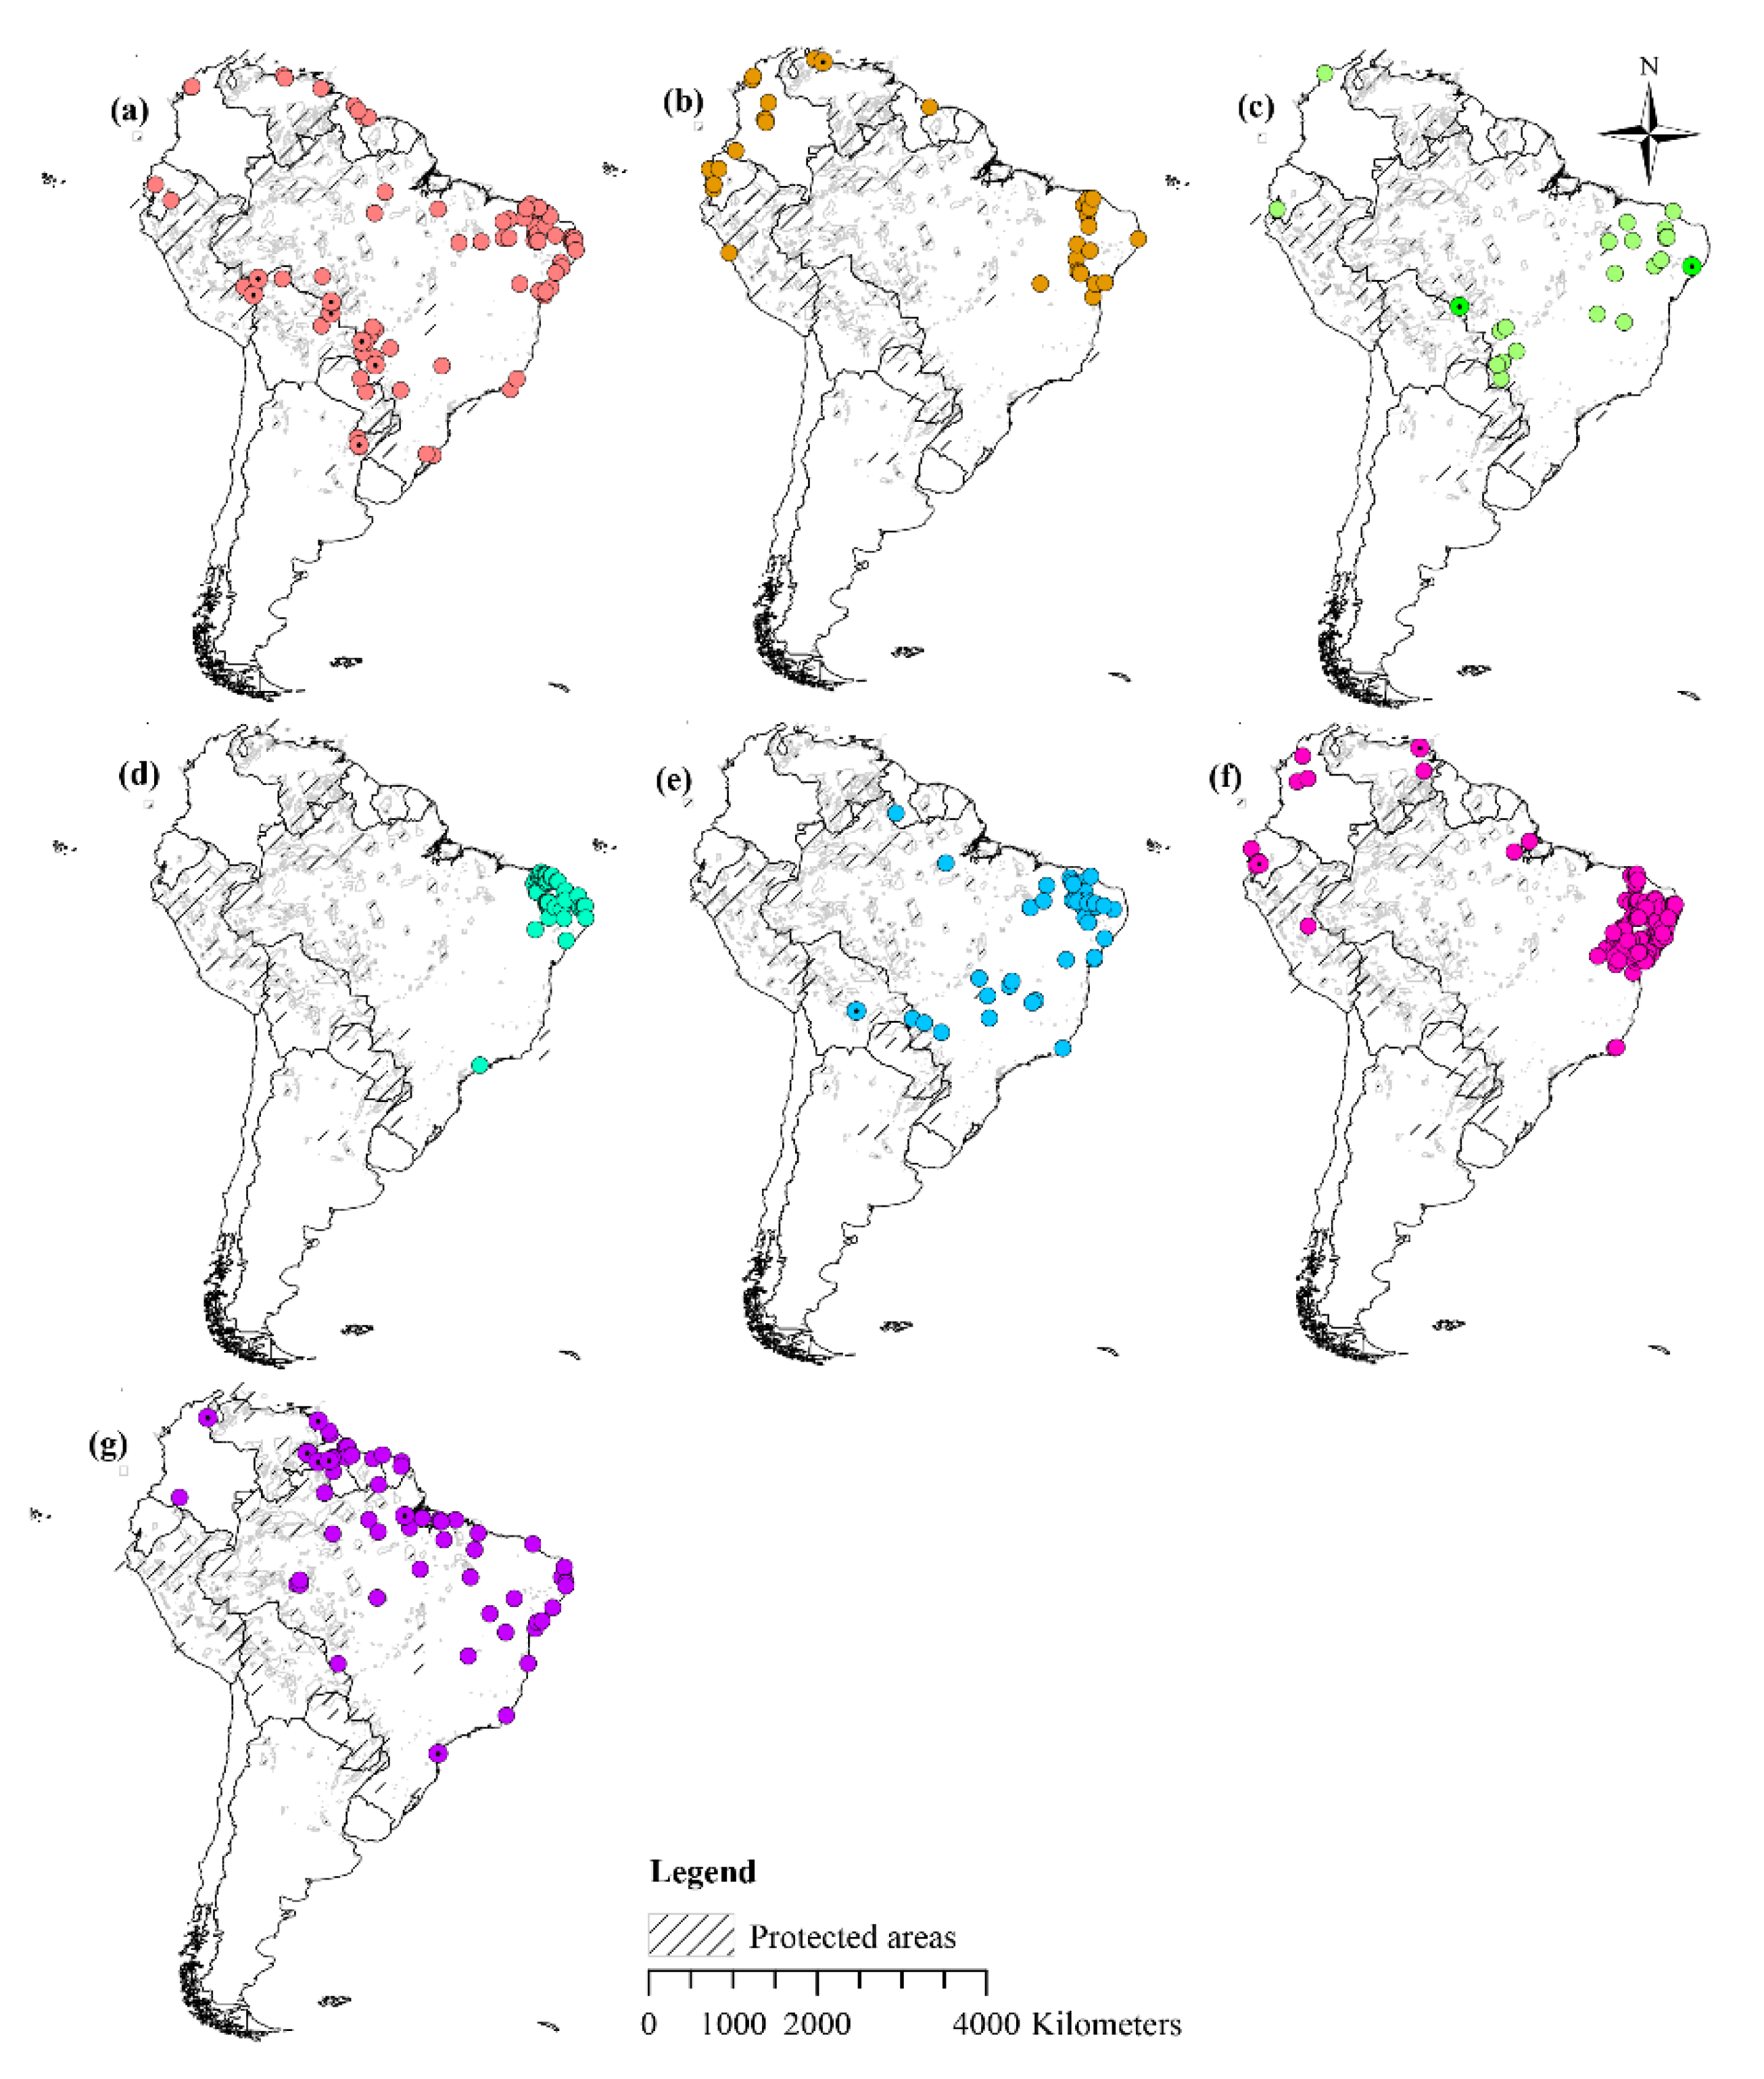
2.1. Species Occurrence Data

The species occurrence data for Nymphaea were obtained from the Global Biodiversity Information Facility using rgbif package in R (GBIF; https://www.gbif.org/, retrieved on 6 February 2022) and from [26,27]. The downloaded distribution localities were manually filtered to remove duplicate samples and coordinates with ambiguous geographic localities. Google Earth (https://earth.google.com, accessed on 7 February 2022) was used to examine the precision of the coordinates, and those with apparent errors in their geographic coordinates were eliminated. The remaining localities for each species were then rarefied to a spatial distance of 5 km between the points to reduce spatial autocorrelation. This analysis was implemented in R software with the package spThin [28]. The remaining points included N. amazonum Mart. and Zucc. (93), N. ampla (Salib.) DC. (32), N. jamesoniana Planch (23), N. lasiophylla Mart. and Zucc. (47), N. lingulata Wiersma (47), N. pulchella DC (138), and N. rudgeana G. Mey. (62) (Figure 1; Table S1).

2.2. Environmental Data

Nineteen bioclimatic variables spanning 1950–2000 were downloaded from WorldClim v1.4 (http://worldclim.org/version2, accessed on 10 April 2021 [29]) at a 2.5 arc-min spatial resolution. These variables define yearly climatic temperature and precipitation trends, as well as seasonality and extreme factors that could exert physiological limits on organisms and influence their geographic distribution. In addition, the land use variable was obtained from the Food and Agricultural Organization (https://www.fao.org/, accessed on: 16 June 2022) at a spatial resolution of 30 arc sec (1 km) and resampled to match the bioclimatic variables’ resolution in ArcGis 10.8 [30]. The variables were then masked to the M area of the BAM diagram [31] using South America’s freshwater ecoregions as the species’ accessible regions [32]. Bioclimatic variables bio8, bio9, bio18, and bio19 were omitted from further analysis as they are known to contain some artifacts and express unrealistic climatic changes between adjacent pixels, although the discontinuities in the variables may not have significant biological meaning [33,34]. Then, we performed the variance inflation factor (VIF: r = 0.7) in the usdm package in the R program to eliminate correlated variables [35] in 16 variables (Table S2). Three general climate models (GCMs): Community Climate System Model version 4 (CCSM4) [36], Hadley Centre Global Environment Model version AO (HADGEM2-AO), and the Model for Interdisciplinary Research on Climate (MIROC5), were selected for the future habitat suitability prediction as they are less biased and have been shown to produce good modeling results [16,22,37]. We selected two representative concentration pathways (RCPs), RCP 4.5 and RCP 8.5, in two scenarios (2050 and 2070) to represent medium- and high-emission scenarios consistent with the IPCC Fifth Assessment Report [3].

2.3. Model Parameterization and Calibration

The climatic niche of Nymphaea species was modeled using MaxEnt v.3.4.1. [38]. The model was built with default settings, except for 5000 iterations, 10 replications, cross-validated run-type, and 75% and 25% of occurrence data for training and testing of the model, respectively. To control over-fitting, regularization multiplier (rm) and feature classes were selected using ENMeval in R program in five feature classes (L, LQ, LQH, LQHP, LQHPT, being linear (L), quadratic (Q), hinge (H), product (P), and threshold (T)) at rm values of 0.5 to 4.0 at a 0.5 increment [39]. To evaluate the predictive performance of the models, we utilized the area under the curve of the receiver operating characteristic curve (ROC) [40].

2.4. Predicting Current and Future Range Shifts

Using a threshold criterion of maximum training sensitivity plus specificity (MTSS), the average ’Logistic’ outputs were converted to binary maps depicting climatic suitable and unsuitable areas. In this step, the continuous suitability outputs were changed to binary maps so that over 95% of the training occurrence data fell inside the suitable range. Finally, using the binary maps, current and future habitat suitability change were assessed using the SDM-Toolbox extension in ArcGis 10.8 [30,40,41]. The generated maps show habitat suitability changes in (i) stable, (ii) expansion, (iii) contraction, and (iv) unsuitable areas.

2.5. Species Conservation/Threat Area

To assess the current and future possible habitat threat to the species, a map of PAs was obtained from world protected planet (available at: https://www.protectedplanet.net/search?q=natura+2000, accessed on: 24 May 2022) and overlaid with the species’ occurrences to assess the percentage of populations inside PAs, the current distribution, and the future projection percentage change of suitable habitats inside and outside PAs. Further, the area of land use in both PAs and un-PAs was used to assess the likely influence of human activities in the species’ area of distribution.

3. Results

3.1. Variable Selection and Model Performance

After the correlation analyses, mean diurnal range (bio2), temperature seasonality (bio4), the maximum temperature of the wettest month (bio5), precipitation of the wettest month (bio13), precipitation seasonality (bio15), and Land use (dom_lu) were used in the model building. The selected variables had VIF values of less than three (Table 1). The ENMeval analysis predicted three feature classes (LQ, LQH, and LQHP) and rm values of 2–4 as the best parameters for the models (Table 2). Besides, the AUC values were above 0.8 in all projection scenarios (Table 3), demonstrating high model accuracy. This suggests that the produced models outperformed a random model (AUC = 0.5), indicating that the suitability of the models in the forecast for the distributions of these seven Nymphaea species was reliable. In addition, the mean training and testing AUC values had no significant difference and the standard deviation values were close to the probability distribution (Table S3).

3.2. Contribution of Variables

The percentage contributions of the bioclimatic variables to the final Nymphaea models are shown in Table 4. The best variables explaining the distribution of all Nymphaea species in all scenarios were bio2, bio13, dom_lu, and bio4. Bio2 had a limited contribution for N. jamesoniana. Bio4 indicated a greater contribution in the current projection compared to future, except for N. rudgeana and N. lasiophyla. Bio5 was the less contributing variable among the species in all scenarios except for N. amazonum and N. jamesoniana. Bio13 contributed greatly among the species in all scenarios except for N. rudgeana. Bio15 had much influence on the distribution of N. lasiophylla, N. lingulata, and N. rudgeana. Finally, dom_lu is of influence to all species’ suitable habitats.

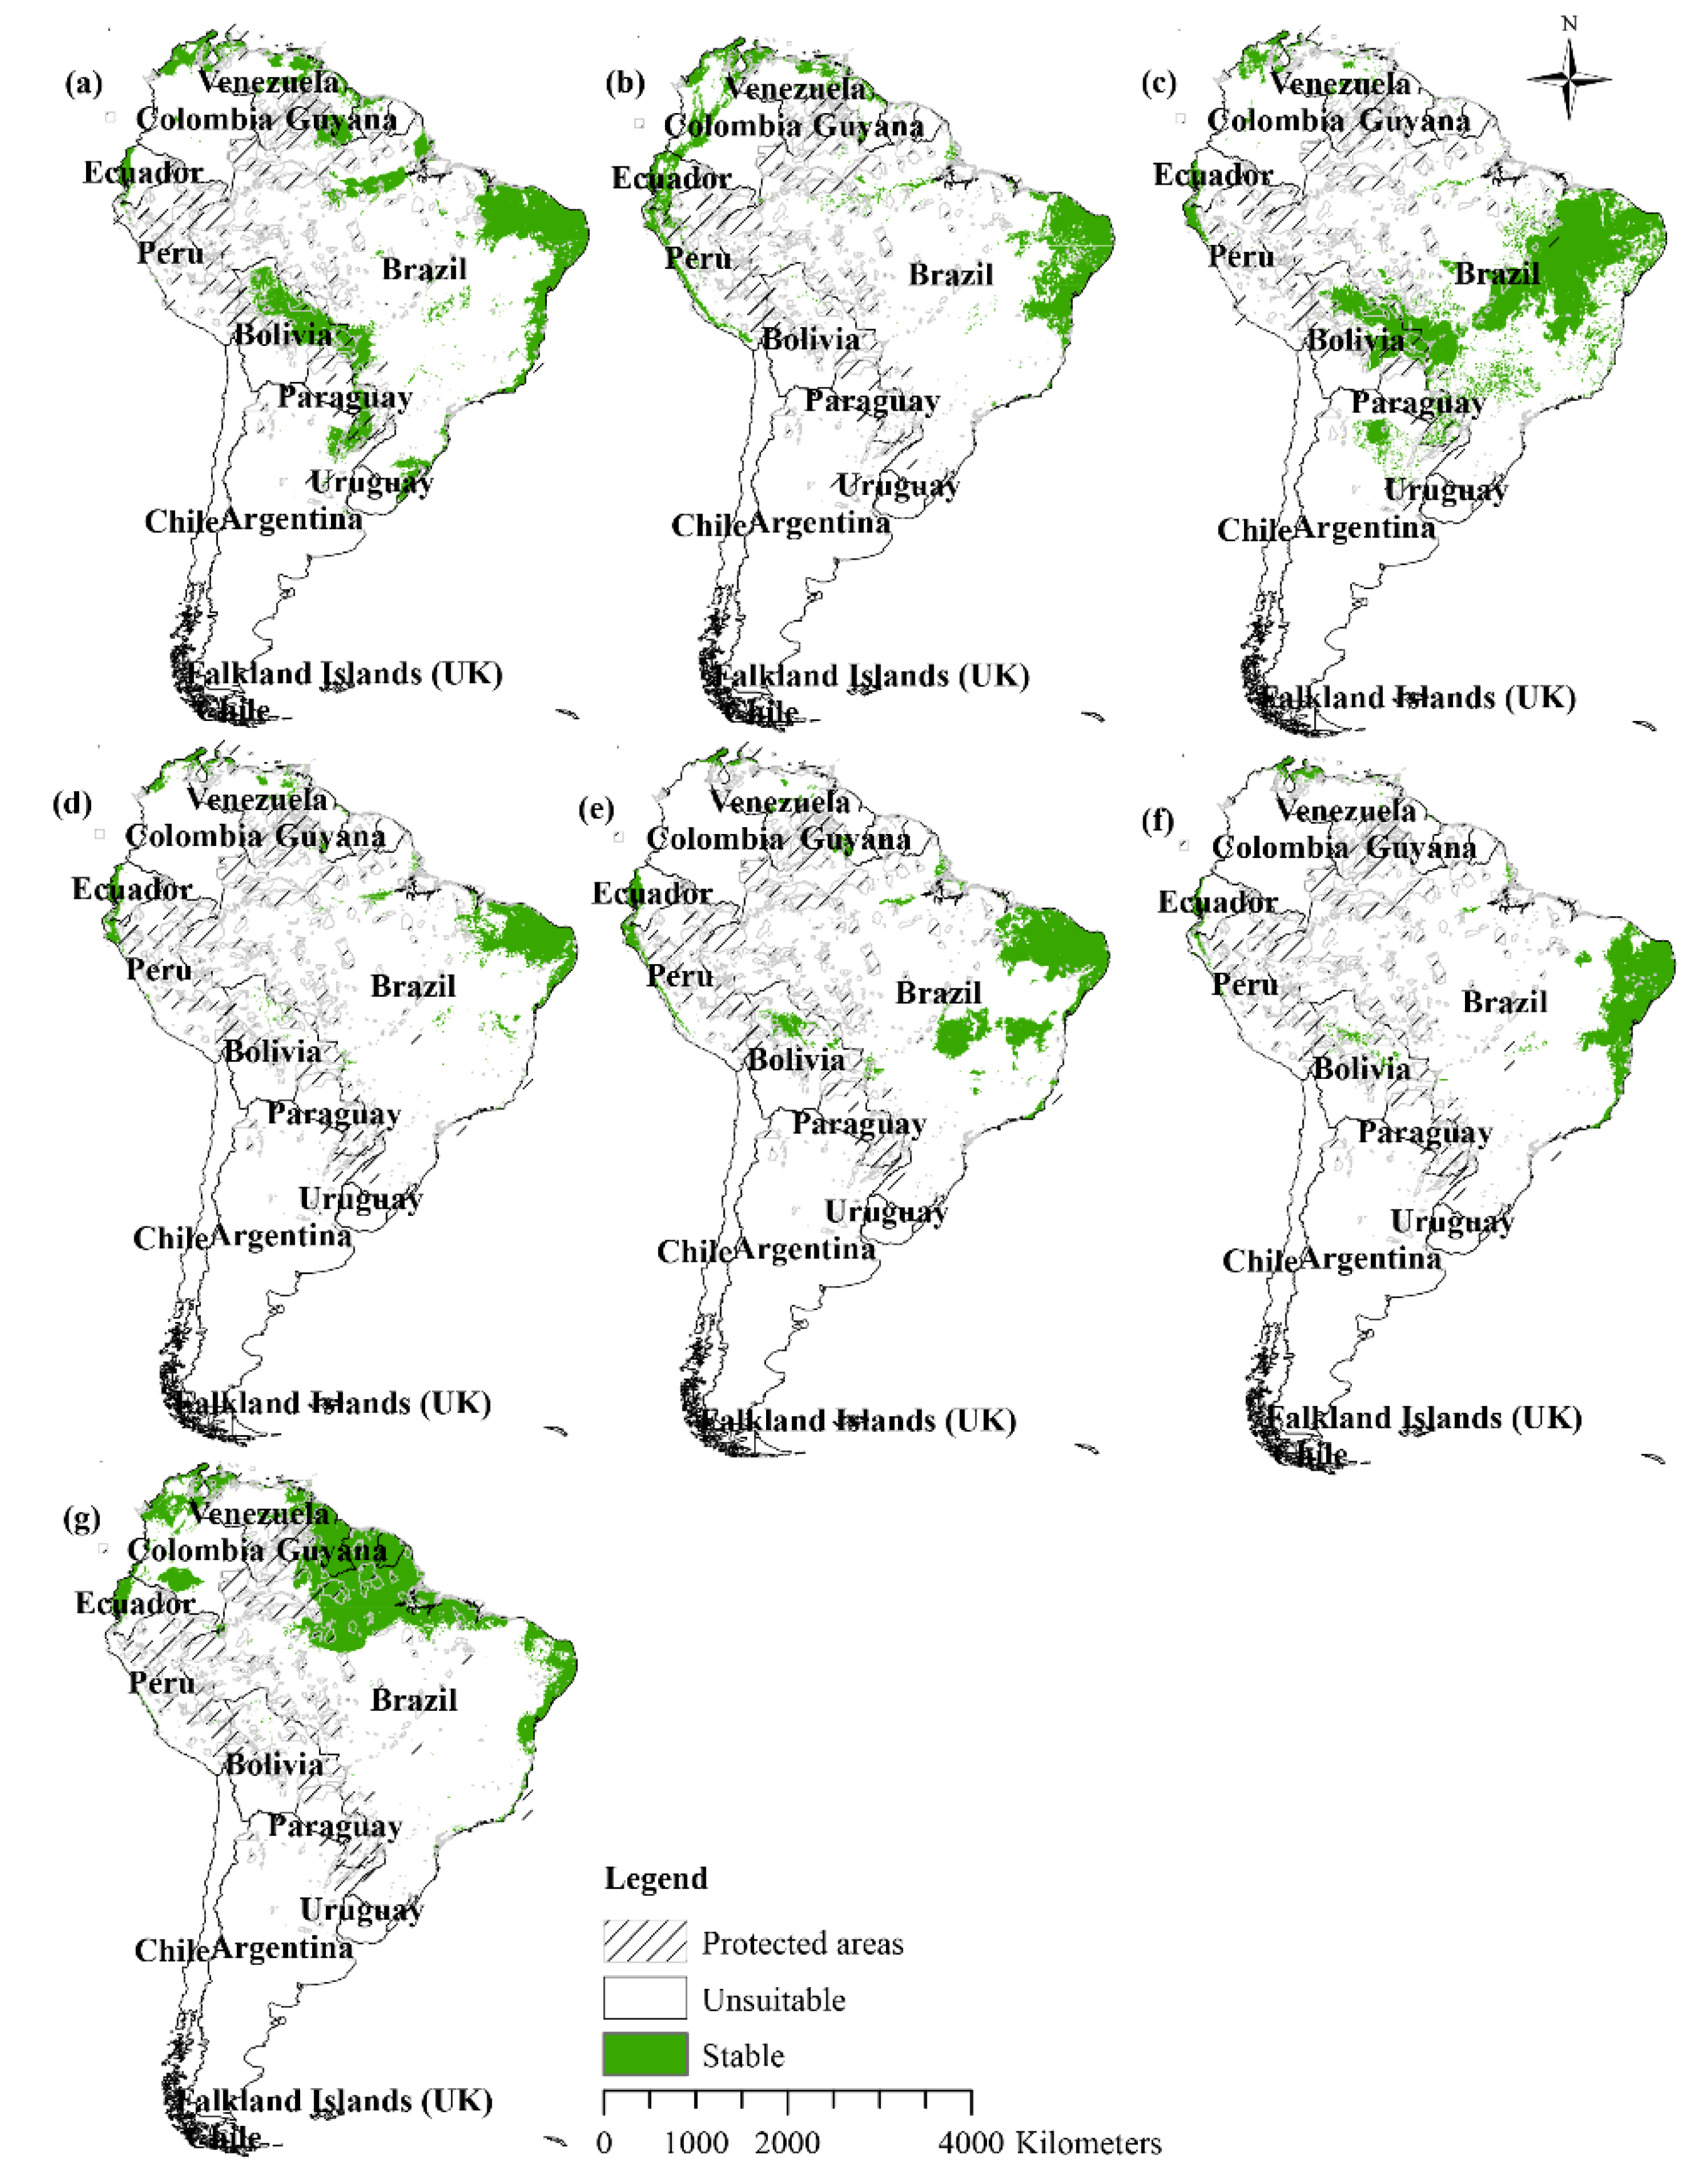
3.3. Current Potential Distribution

The sampling of occurrence points indicated that N. rudgeana (12.90%), N. amazonum (10.75%), and N. jamesoniana (8.70%) had the highest percentage of points within the protected area, followed by N. ampla (3.13%), N. lingulata (2.13%), and N. pulchella (1.45%), while for N. lasiophylla all points were outside the protected area. The projected distribution maps for the seven Nymphaea species indicate Brazil and particularly eastern regions, Venezuela, Colombia, Ecuador, Bolivia, Guyana, and Peru (Figure 2a–g), to contain suitable habitat areas for the species. Some species had partial distribution, such as N. ampla in Bolivia (Figure 2b), N. pulchella in Guyana (Figure 2f), and N. rudgeana in Bolivia and Peru (Figure 2g). Majority of the species were limited in distribution in states such as Argentina, Paraguay, Suriname, Chile, and Uruguay (Figure 2a–g). Generally, the eastern, northern parts, and some regions northwest of South America had the highest probabilities of suitable habitat, with certain regions in the central part of the continent also indicating potentially appropriate ranges. Among the seven water lily species, N. jamesoniana (2,790,903 km2), N. rudgeana (2,657,233 km2), and N. amazonum (2,339,884 km2) occupied the most ranges in current distribution, followed by N. ampla (1,558,143 km2), N. lingulata (1,341,940 km2), N. pulchella (907,696.1 km2), and N. lasiophylla (862,217 km2), respectively (Table 2).

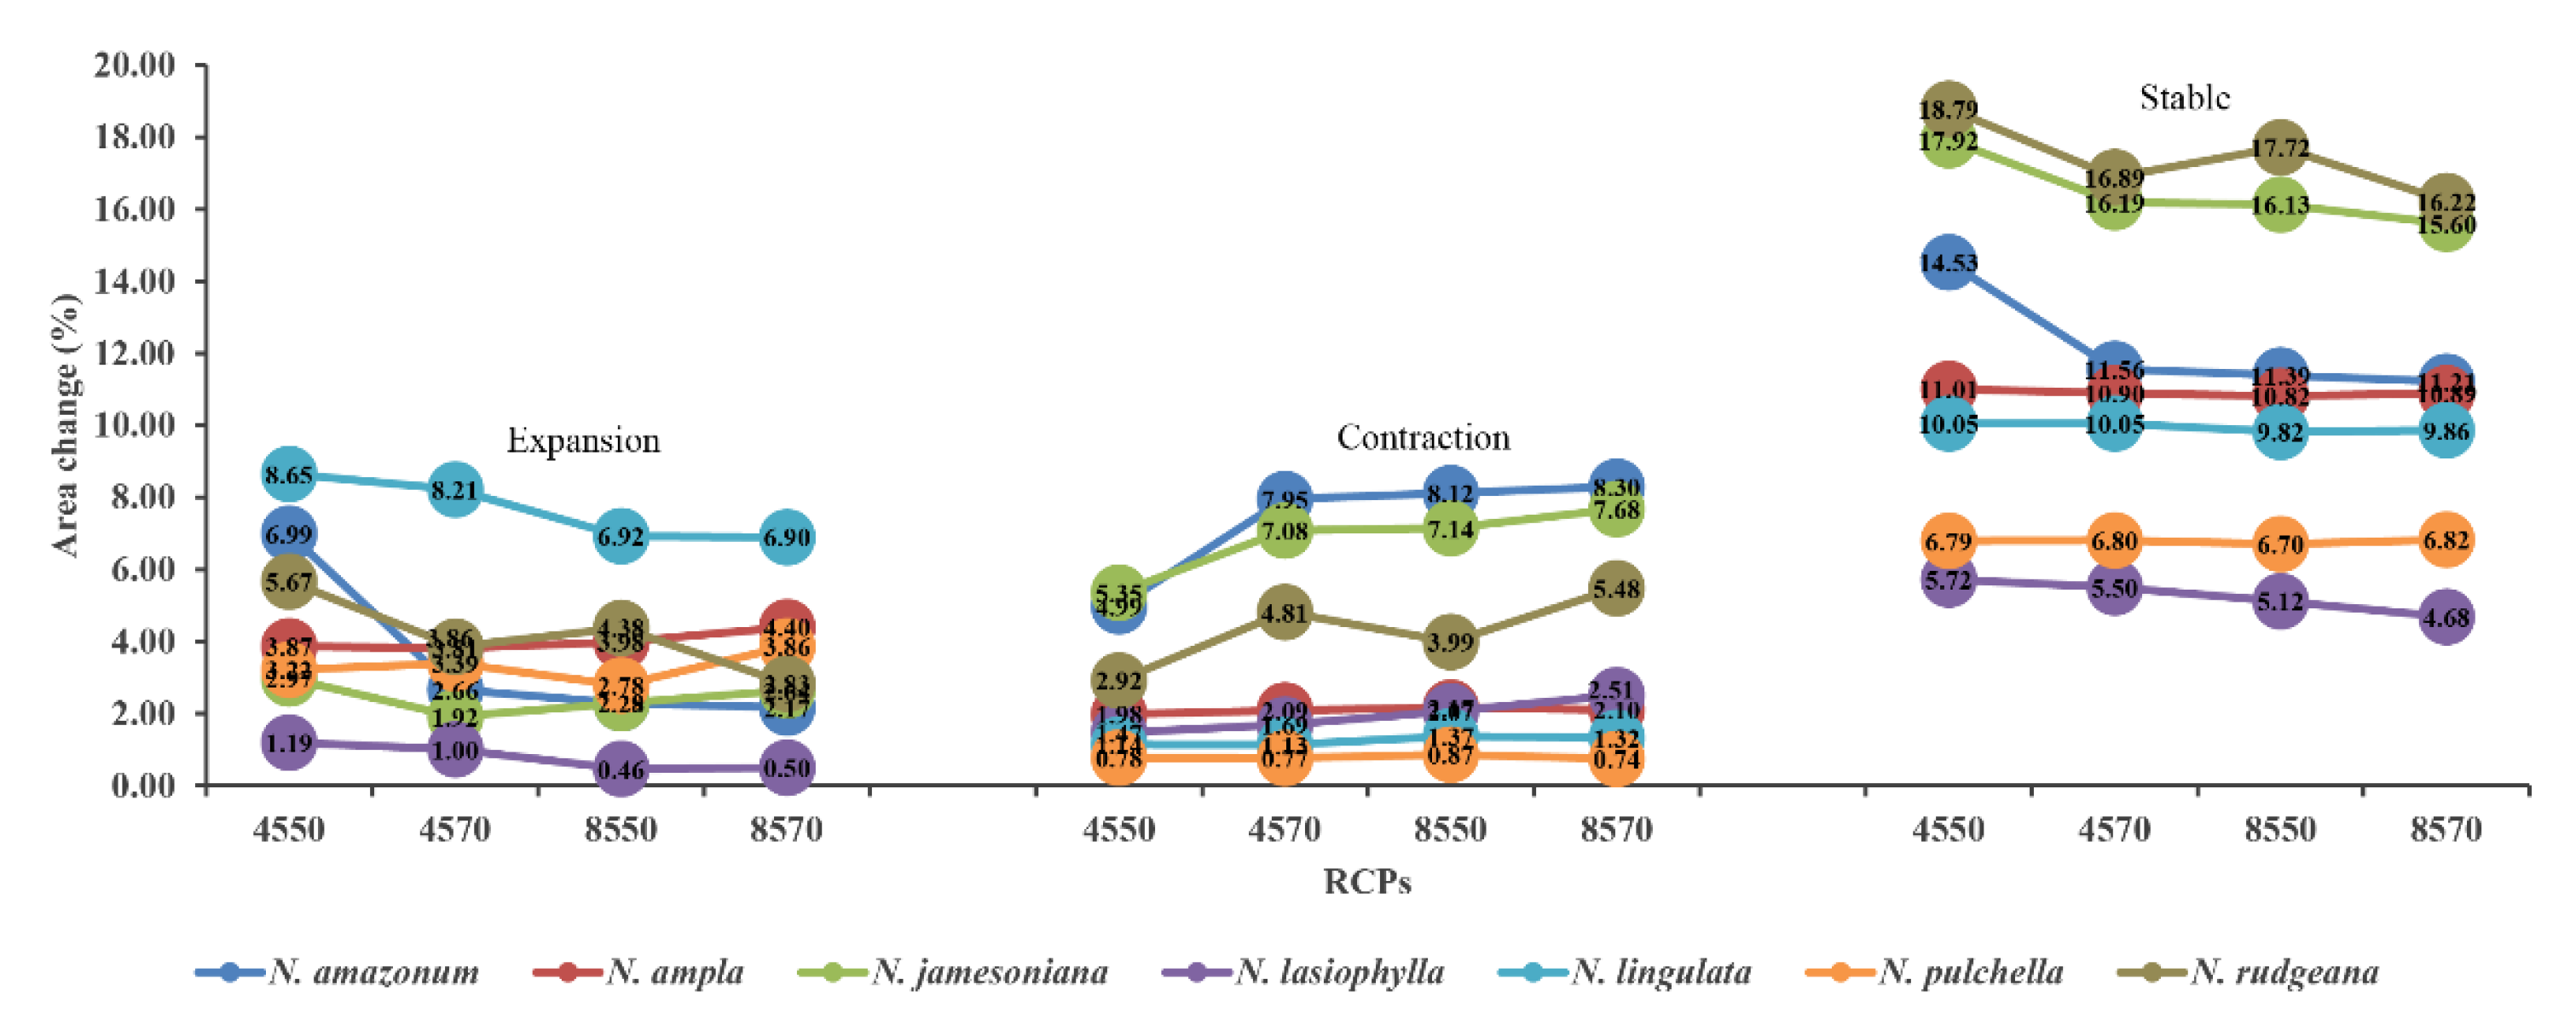
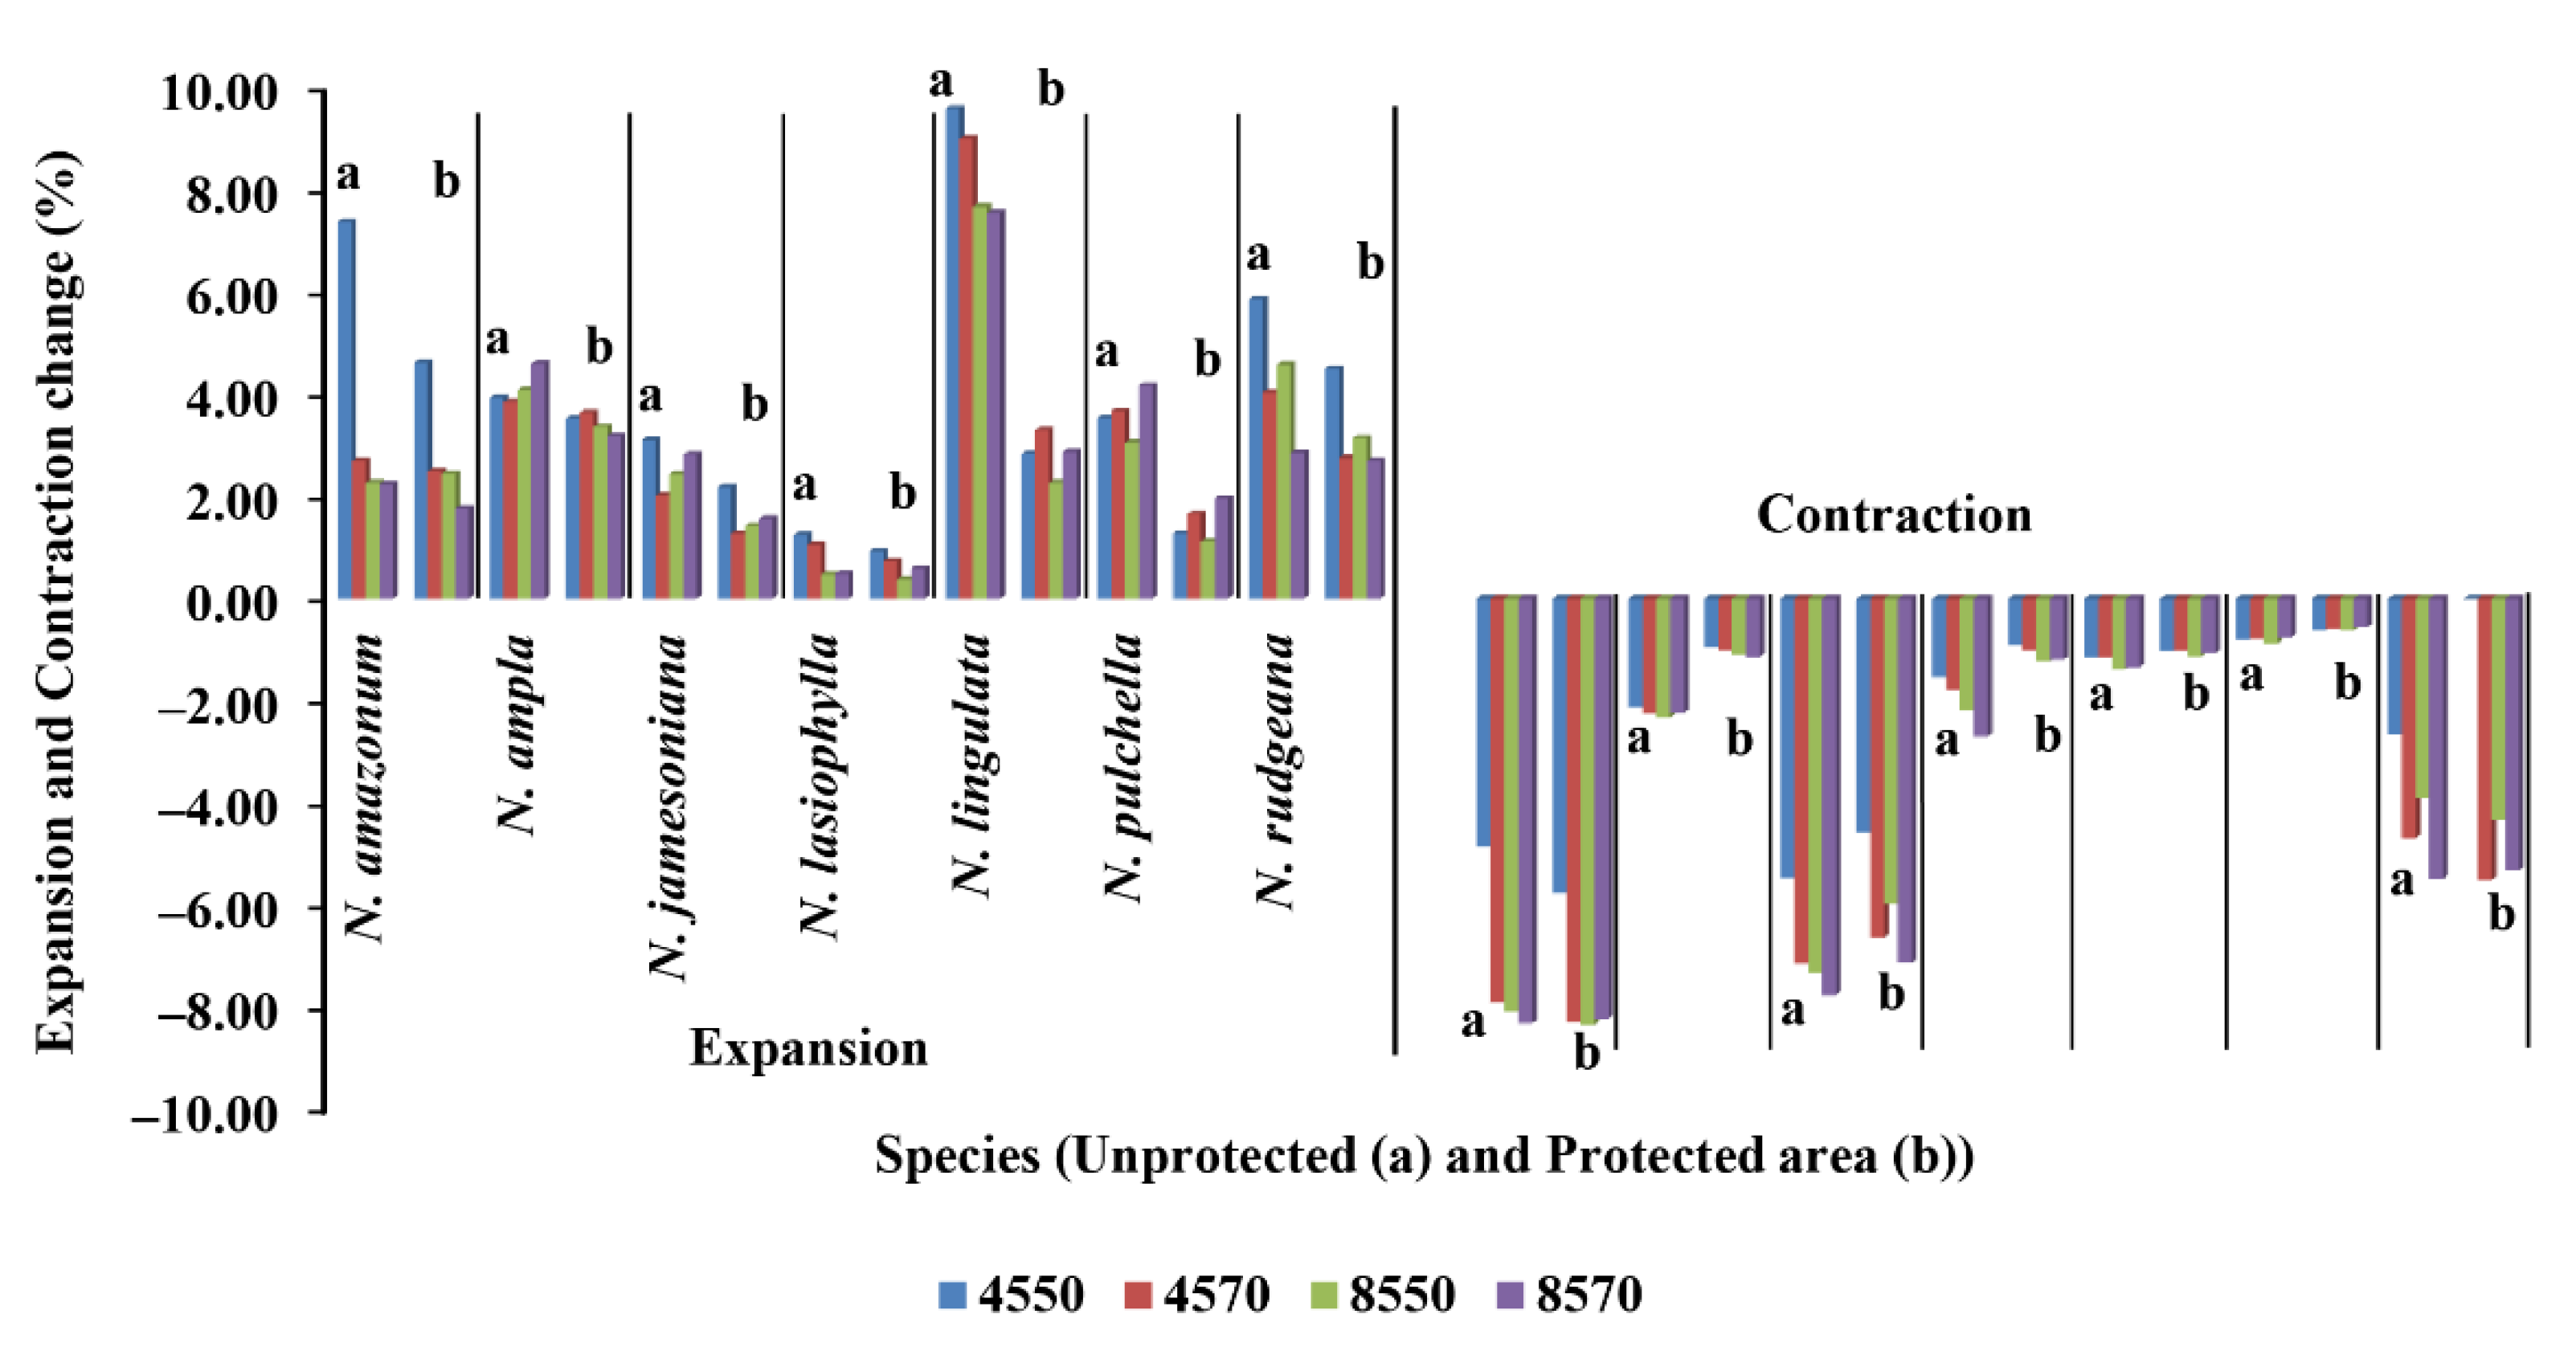
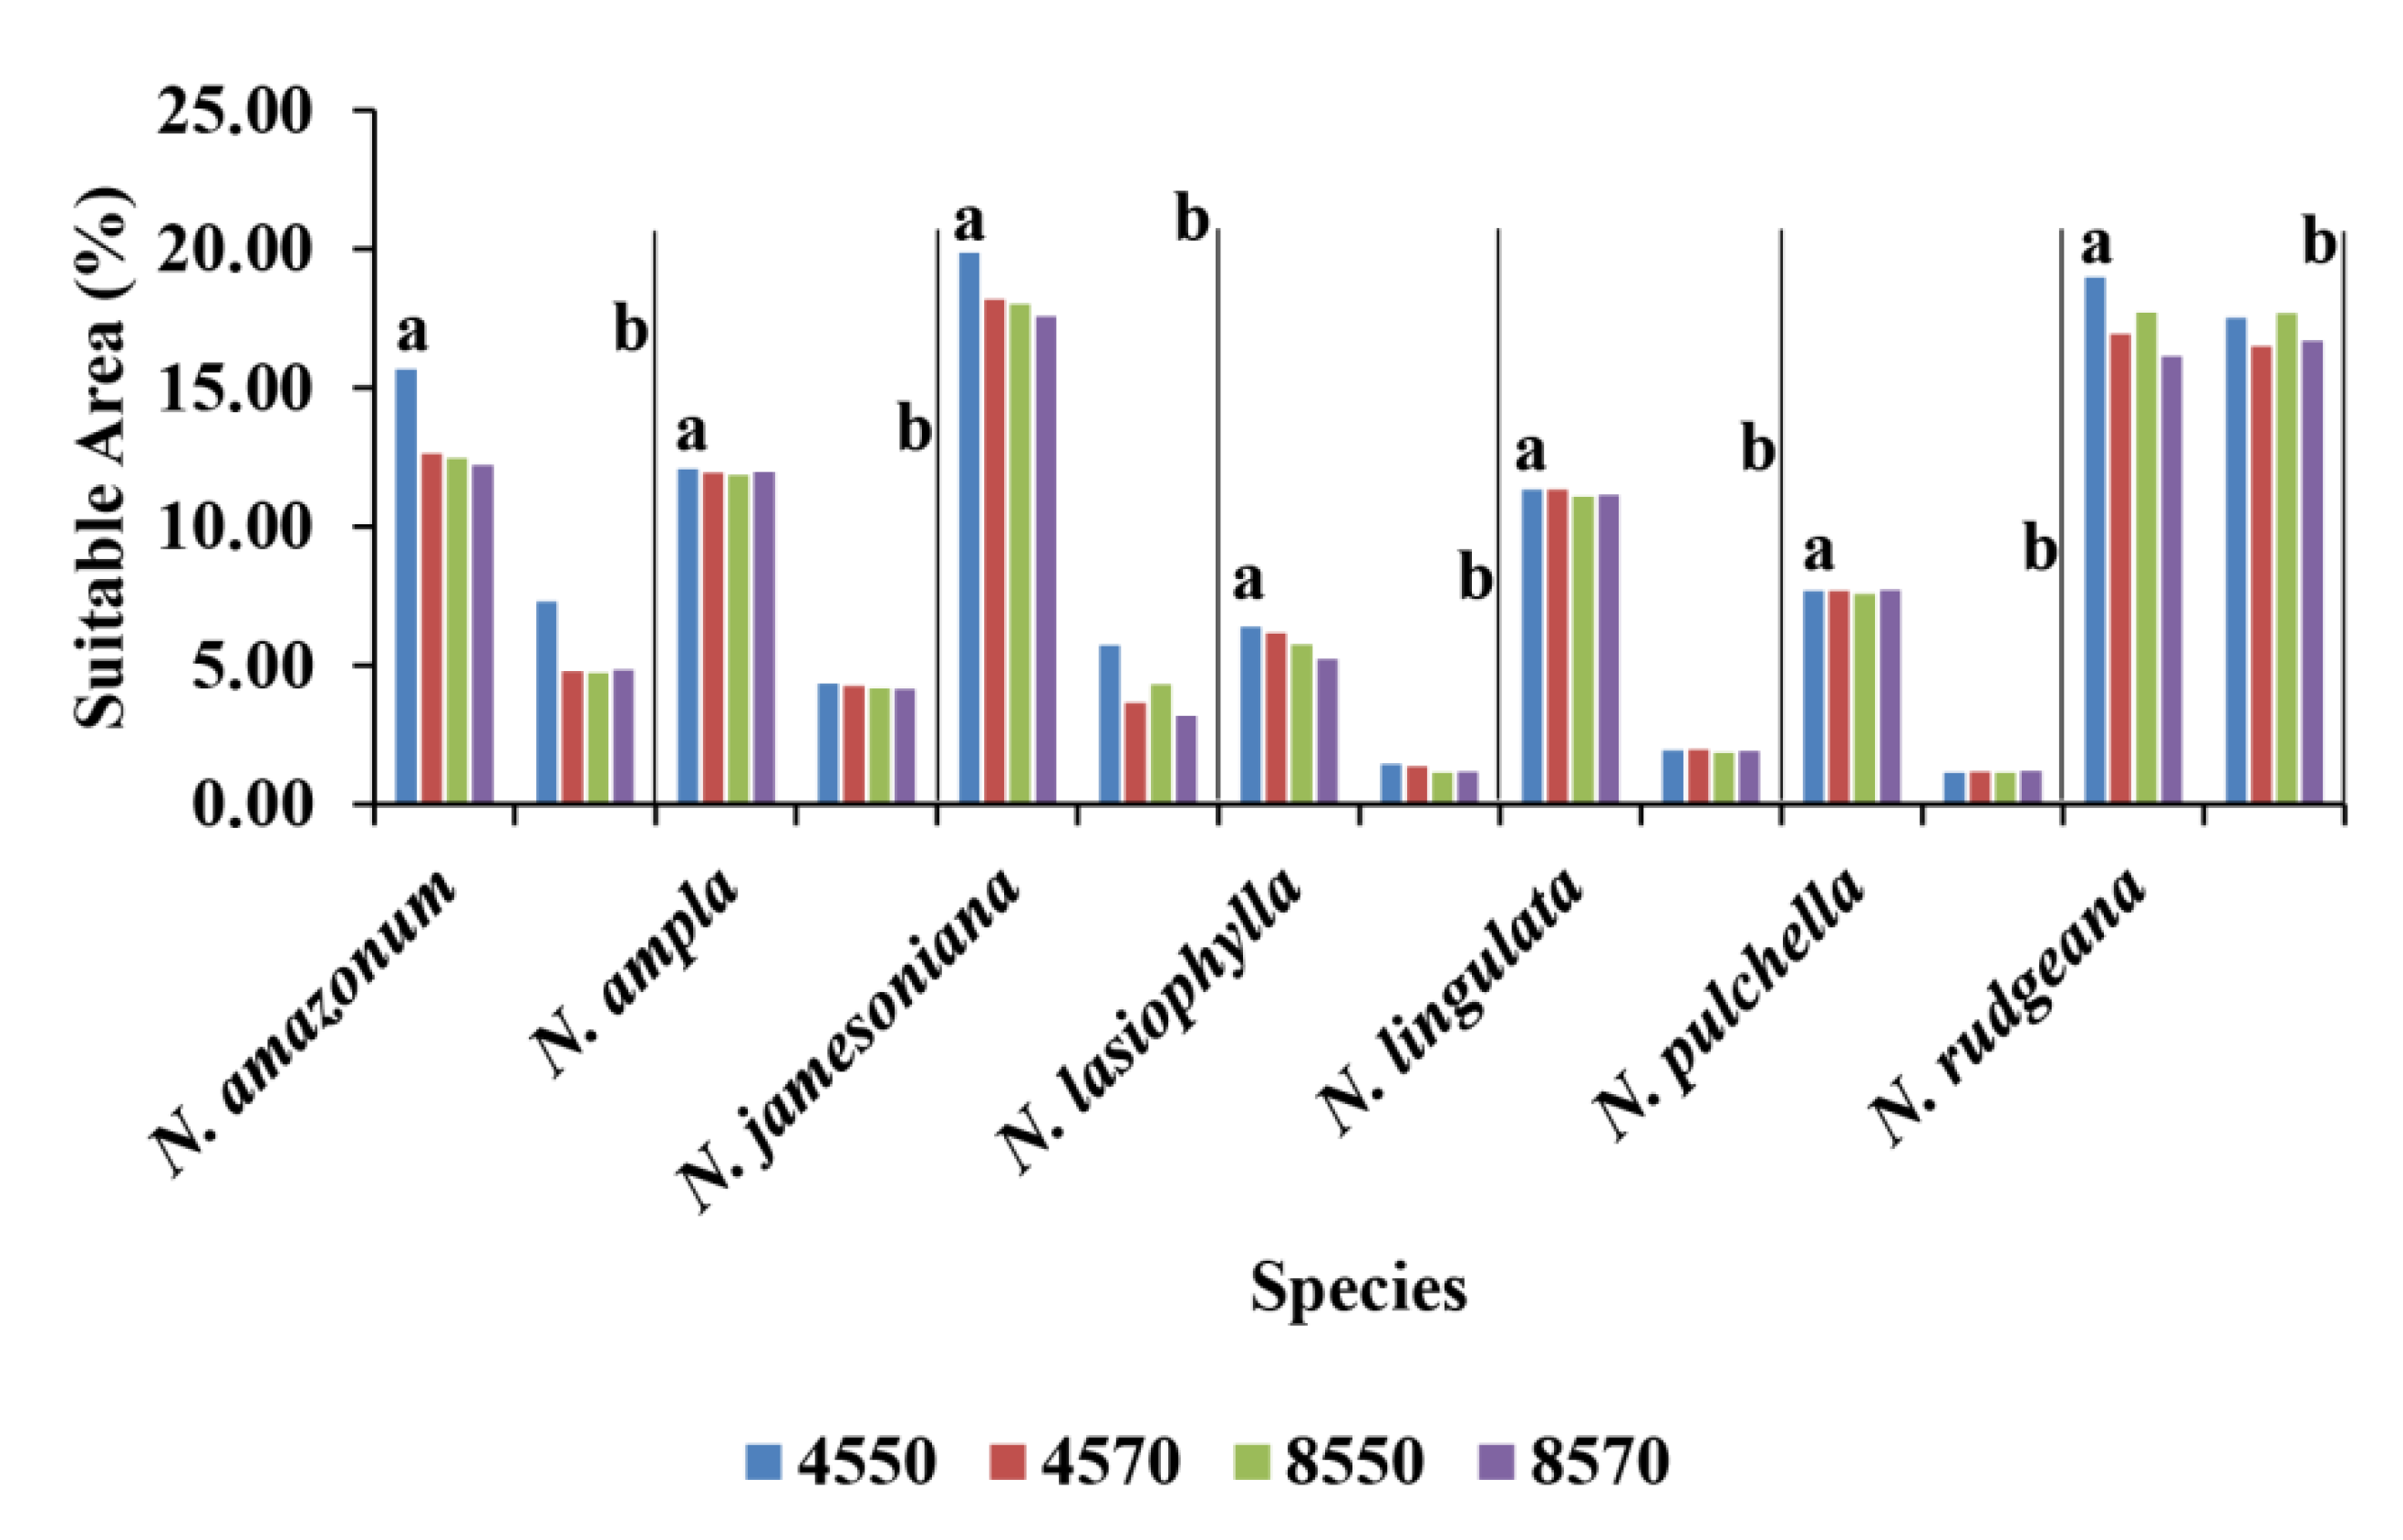
3.4. Future Distribution Changes

The assessment of the species’ future distribution is important for conservation measures. The projection change summary for the distribution changes is presented in Figure 3 (Table S4). The future projection for N. amazonum indicates increased habitat gain and major habitat loss of suitability in Bolivia in RCP 4.5 (2050). Further loss of habitat suitability is projected consecutively in RCP 4.5 (2070) and both RCP 8.5 scenarios, especially in Bolivia and in most parts north of the continent, such as Venezuela, Guyana, and Suriname (Figure S1). The projection of N. ampla indicates a persistent habitat increase in RCP 4.5 (2070) and in both RCP 8.5 scenarios compared to RCP 4.5 (2050). Most habitat gain is projected in Brazil, Venezuela, and Guyana, while most parts of Peru and northwest of the continent indicate habitat loss (Figure S2). Interestingly, N. ampla indicated increasing habitat expansion and loss in both RCP 4.5 scenarios and RCP 8.5 (2050), although habitat loss declined in RCP 8.5 (2070). The distribution of N. jamesoniana indicated greater changes in Brazil, Bolivia, Paraguay, and Argentina. These regions experience greater habitat loss compared to RCP 4.5 (2050), especially Brazil and Bolivia (Figure S3). However, in both RCP 8.5 scenarios, some regions in Brazil and Peru experienced an increase of suitable habitats, although habitat loss was increasing (Figure 3 and Figure S3). The expansion ranges for N. lasiophylla in RCP 4.5 are lost in future scenarios of RCP 8.5, especially in Brazil and Guyana (Figure S4). N. lasiophylla indicated reduced habitat gain and increased habitat loss (Figure 3). N. lingulata was indicated to have the highest habitat gain in RCP 4.5 (2050) compared to all other species. Its expansion ranges are projected to contract in RCP 4.5 (2070) and both RCP 8.5 scenarios, especially in Brazil and Bolivia, which are characterized by continuous habitat loss (Figure 3 and Figure S5). The projection of N. pulchella indicated greater habitat loss in Bolivia, Ecuador, and northeast of Brazil in both RCPs 4.5 and 8.5 (2050) (Figure S6). Although the expansion ranges are not obviously visible in the maps compared to the other species, Figure 3 indicates habitat gain in RCPs 4.5 and 8.5 of scenario 2070 compared to 2050. In scenario 2050 for both RCPs, N. rudgeana was projected to have a greater habitat increase compared to scenario 2070 for both RCPs (Figure 3). Many of the changes are noticed in central Brazil, Colombia, and Venezuela, with habitat expansion declining and habitat loss increasing (Figure S7). In extreme conditions of RCP 8.5 (2070), expansion ranges reduced greatly with increasing contractions (Figure 3).
Generally, the species varied considerably in suitable habitat expansion compared to the contraction trend. Species such as N. ampla, N. lasiophylla, N. lingulata, and N. pulchella indicated an almost similar trend in habitat loss and the stable environment, although for N. lasiophylla the stable environment experienced shrinkage (Figure 3). The loss of suitable habitat expansion, stable environment, and the increase in contraction in the suitable ranges is a call for alarm when it comes to species’ conservation. This loss is not only experienced by N. lasiophylla but also N. amazonum and N. rudgeana in RCP 8.5 (2070). N. jamesoniana indicates increased habitat expansions and contraction, and loss of stable environment, which indicate possible shifting to new areas. Lastly, many contractions occur in the most central parts of the continent compared to the coastlines, where many habitat growths and stable habitats are projected. These regions are therefore important in providing shifting ranges for suitable habitats.

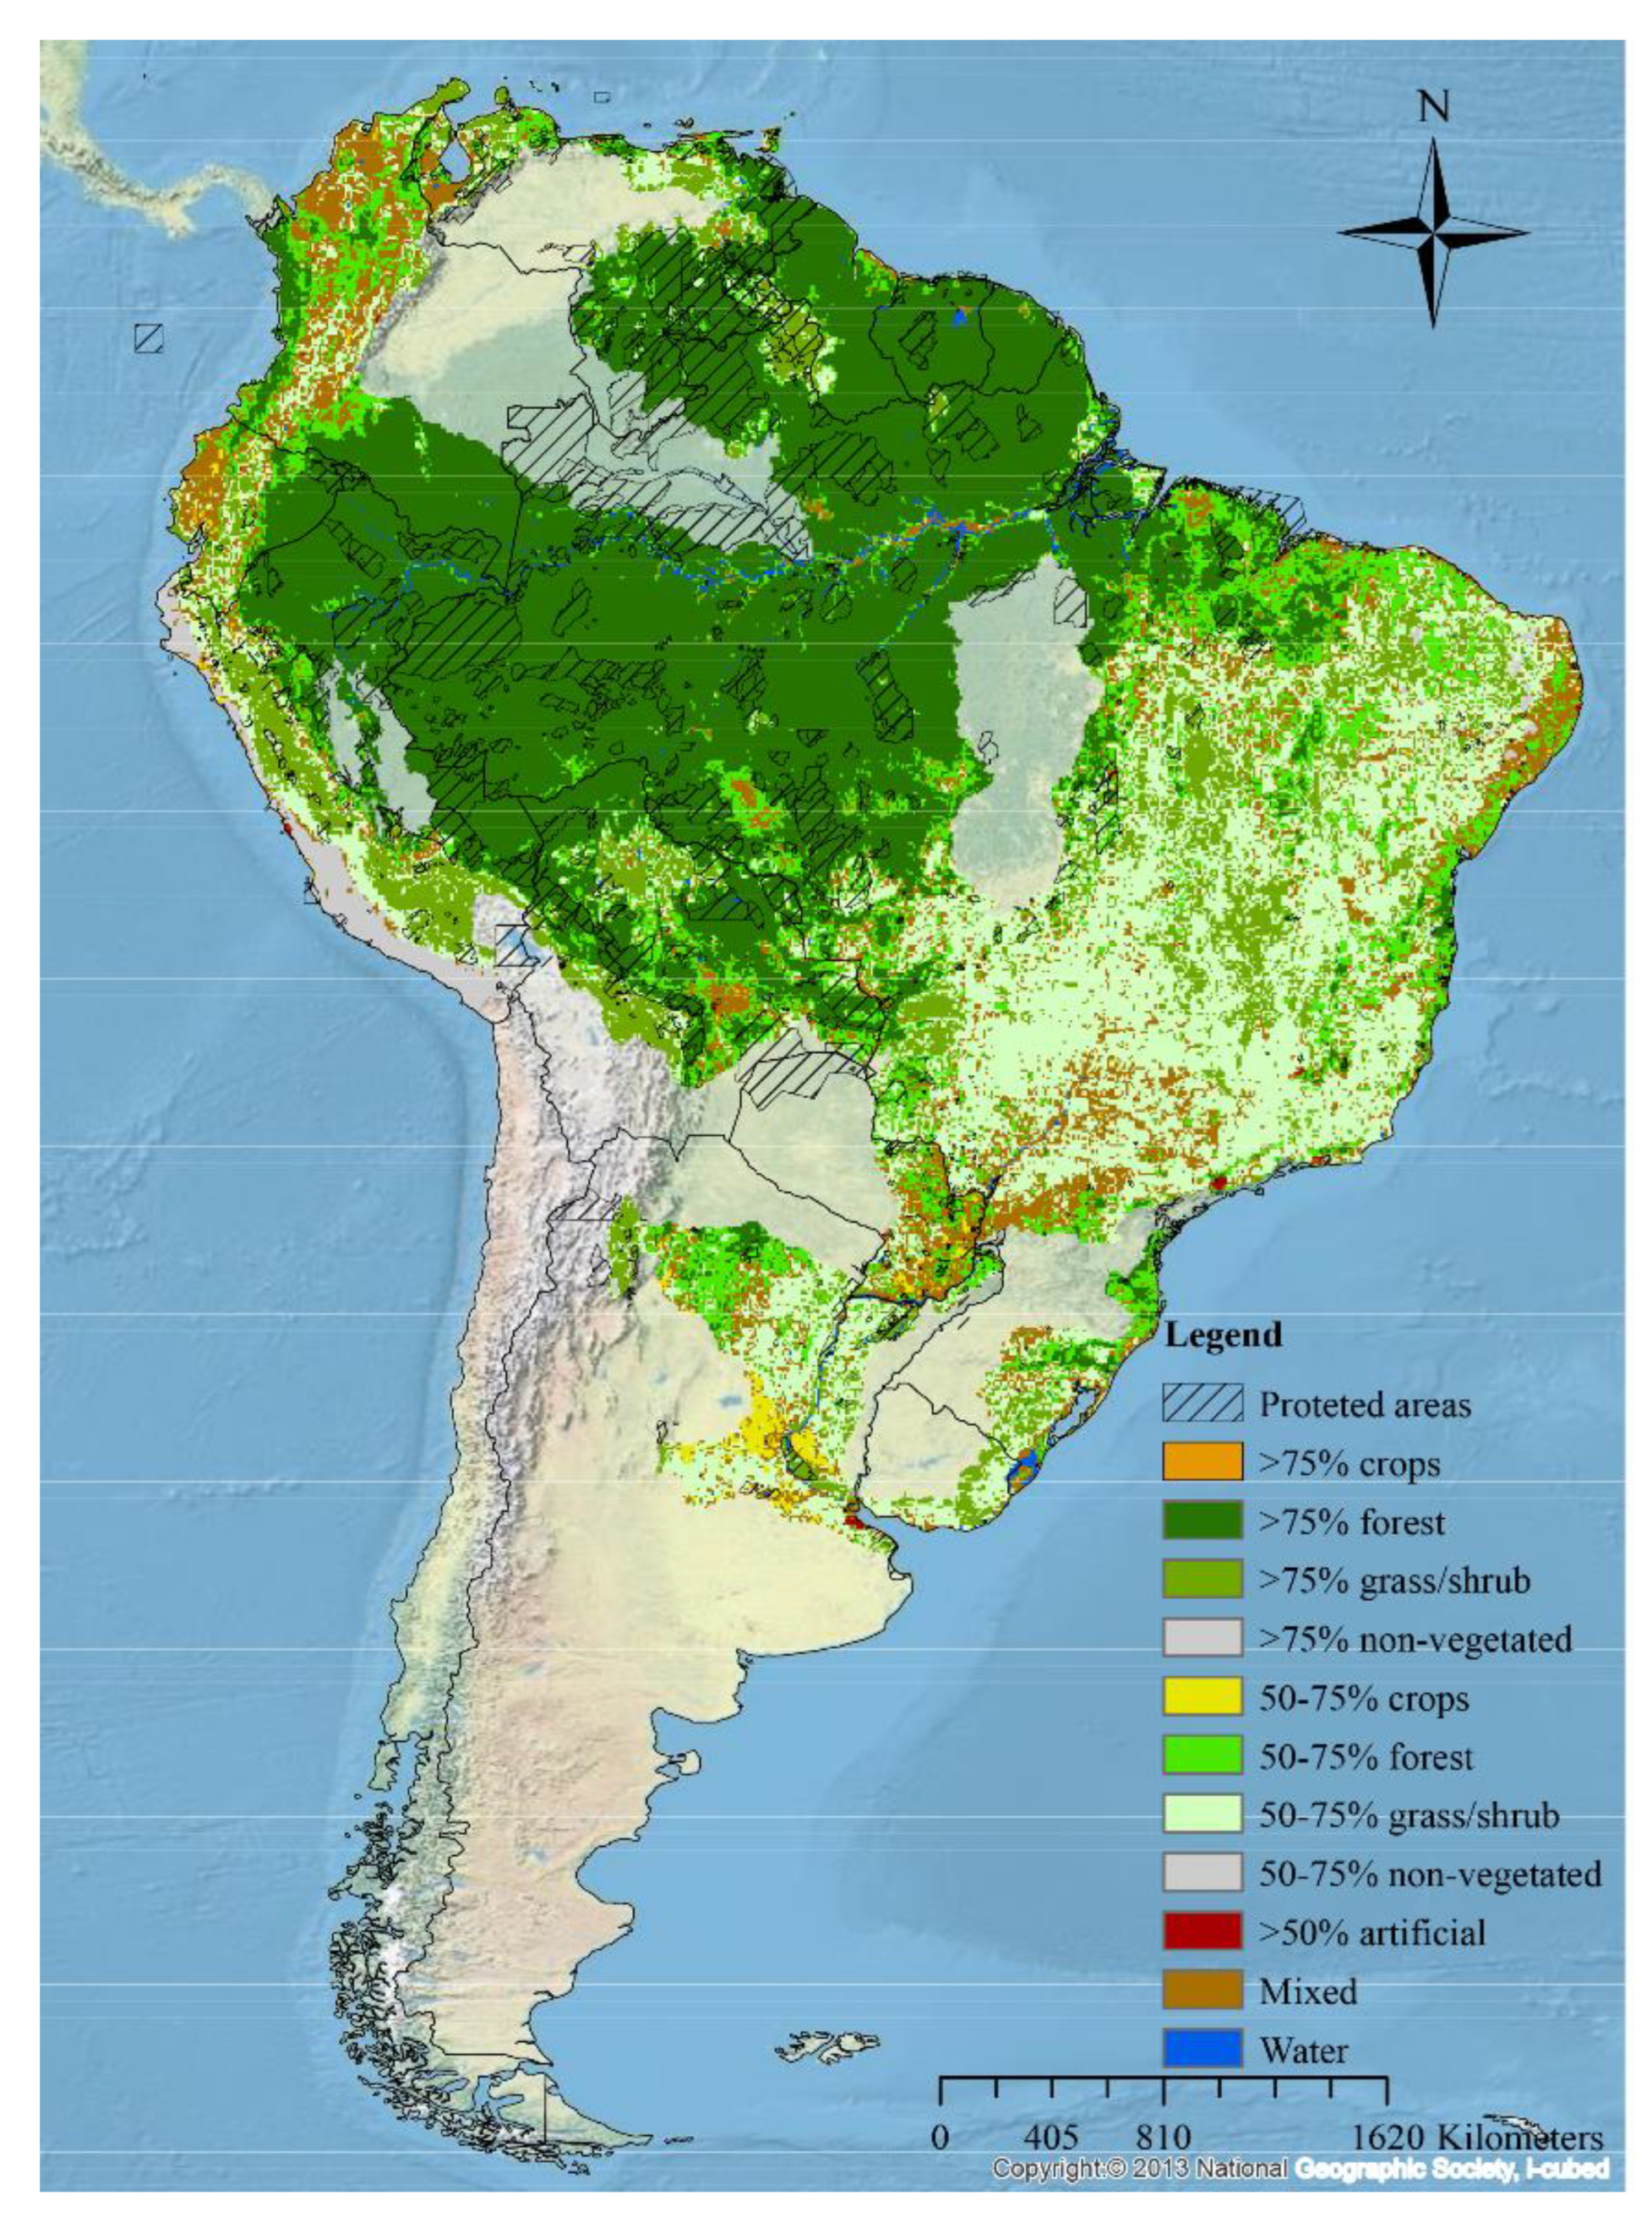
3.5. Land Use and the Distribution of Water Lilies

The species-accessible area (M) for land use is projected in Figure 4. Most parts of the distribution regions remain unprotected, and this exposes them to human influence and degradation, more so the eastern parts of the continent (Table S5, Figure 4). Much influence is projected in the north, northwest, central, east, and southeast parts of the continent according to the species-accessible area. Most of the areas are characterized by low land cover of between 50% and 75% (Figure 4). Land use was among the main contributing factors for the water lily species’ distribution (Table 4). The current projection (Figure 2) and the future projections indicate that large areas of suitable habitats are projected outside PAs, areas acquired by accessible area classifications minus protected area classifications. The areas are characterized by grasslands or shrub areas, crop land areas, and areas composed of mixed activities (Figures S1–S7). Although large areas are covered by forests, especially in Brazil, crops, non-vegetation, and mixed activity areas are of significant influence to the continent (Table S5). Besides PAs playing a key role in the conservation and management of natural resources, they are limited in size compared to the un-PAs (Figure 5; Table S6) and therefore they can sometimes fail in ensuring sustainable refuge and survival for species under threat of extinction, especially when it is out of human control. In this case, the projection of the water lily species indicates an almost similar trend in expansion and contraction in both un-PAs and PAs, with the exception of N. lingulata which has higher expansion in un-PAs compared to PAs (Figure 5). Besides, Brazil, Ecuador, Colombia, Venezuela, and Bolivia are among the states with great habitat suitability and among those influenced by land use, more specifically Bolivia and Brazil, where many of the projected areas are declining. Besides, the stable environment had no significant change between un-PAs and PAs (Figure 6). The un-PAs had much of the stable area among the species, except for N. rudgeana, for which in both areas the stable environment was almost the same (Figure 6).

4. Discussion

This study developed a set of potential ecological niche models for the Nymphaea species to examine their distribution patterns across South America. We used species occurrence data and bioclimatic variables to simulate species’ ecological niches. These factors have been proven fundamental for MaxEnt modeling [38]. As a result of the variable selection procedure, the VIF values were less than three, indicating less collinearity [42]. The rm values in the selected feature classes were higher compared to the MaxEnt default rm of one, thus highly minimizing the overfitting of the models [43]. The mean AUC values obtained from the MaxEnt models reflected the common values expected for fairly fitted models (Table 2) and were not significantly different from previous studies, and were thus considered descriptive [16,24,44].
In this study, temperature and precipitation variables (bio2, bio13, and bio15) influenced Nymphaea species’ distribution in South America similarly to the African Nymphaea species [16]. For instance, bio2 was predicted as the primary temperature variable with the greatest impact in all the studied Nymphaea species except N. jamesoniana in South America. The mean diurnal range (bio2) indicates the variation in temperature over a day, and the temperature changes may have a significant impact on plant growth, especially photosynthesis and respiration of the plant, contributing to nutrient buildup [45]. Bio4 and bio15 mediate species’ suitable distribution by forcing them to shift between favorable seasons. In this case, the species are likely to shift to regions experiencing less dry seasons and cooler temperatures [46]. Unlike bio13, which provides a more conducive environment by increasing precipitation that replenishes the isolated habitats such as ponds and increasing surface runoff, bio5 increases evaporation and transpiration, which significantly affect the plants and their environment by causing dryness. As a result, the plants are forced to seek suitable locations. Lastly, land use directly declines species’ habitats depending on the magnitude of land use.
The current projected distribution of the Nymphaea species revealed areas of high environmental suitability that corresponded to the observed records. This might indicate that ecological niches are defined by variables affecting the distribution and abundance of resources on which they rely on [47]. Nevertheless, due to continuous habitat destruction on the continent, the projected suitable habitat areas may over-represent habitat suitability where Nymphaea species habitats no longer exist or their habitats are under the extreme pressure of sustaining them, such as in the northeast of Brazil where human influence is high [8]. Greater changes in habitat suitability were noticed in the future distribution of N. amazonum, N. jamesoniana, and N. rudgeana, which may have been caused by the reduced moisture, increasing aridity in multiple locations, and precipitation variability [48]. Such situations are propagated by temperature increases, especially in the warm months, which increase evaporation and dryness; for example, the contribution of bio5 for N. amazonum and N. jamesoniana distribution. As global temperatures rise, the threat of heat stress increases, possibly causing a decrease in species-suitable habitats and richness [3,49]. The rise in temperature may push the species to adjust in habitat-suitable areas, thus causing geographical shifts [50].
Although the environmental requirements for the Nymphaea species slightly differed, these species utilized similar habitats in the northeastern parts of the continent. Moreover, it is proposed that in most wetland ecosystems, aquatic species are sympatric [11]. Similarly, in the South American freshwater ecoregions, such relationships between Nymphaea species have been documented [47,51]. Furthermore, Nymphaea species would display niche partitioning and geographic segregation in South America [52].
The protected areas (PAs) act as shelter for species’ survival in this human-dominated world [53]. Species take refuge in the uninfluenced ecosystems, thus ensuring their survival. Although the regions hold biodiversity and conservation value, they are also under extreme pressure from the growing human populations and need for development resources [54]. Nonetheless, with the high magnitude of global warming, protected areas also face adversities in conservation, resulting in declining habitat suitability and vegetation shifts [55]. In this study, a similar change in habitat suitability was observed between PAs and un-PAs in habitat suitability. This could imply a declining capability of PAs to provide a safe refuge for species with declining habitats [56,57]. The only hope with this kind of projection is that the declining habitats in PAs will happen slower and more visibly compared to the non-PAs due to regulated human impacts. However, it is a wakeup call for conservation managers to rethink on the impact of PAs on some species as climate change will cut across all environments.
Surprisingly, the Amazon ecosystem was thought to provide the most suitable habitat for the Nymphaea species, however the species’ limited distribution in the area was linked to the increasing climatic events such as drought and numerous floods which destroy the species’ habitat [2]. Besides, the Amazon’s humid environment may not be suitable for numerous growth of the water lily species compared to the savannah areas, where the habitat has been favored [15]. Since habitat suitability distribution in the Amazon might be controlled by many factors, we leave it as an open gap for further studies involving field surveys which can provide the absent data that are capable of improving our model in confirming the water lily species’ distribution in the region. Unlike the PAs, much distribution is projected in human-disturbed environments, especially in some parts of the Amazon, which could support the hypothesis that deforestation reduces evapotranspiration and increases stream flow [58]. In addition, human influence through land use changes may have a significant impact on land water resources by affecting the mechanisms at which latent heat flux, surface runoff, discharge from the rivers, and regional and continental precipitation patterns occur [59].
In conclusion, this study provided insight on the implications of climate change and land use effects in assessing the potential habitat suitability for the Nymphaea species as the main factors influencing aquatic ecosystems and biodiversity. The study is important for the conservation and management of these species, which are scientifically and ecologically important. The loss of suitable habitat areas always raises concern for possible changes, leading to the reduction of species’ populations that may result in species being threatened or becoming extinct [60]. As PAs face increased protection and conservation crises, it is high time for the conservationists to turn to and engage the local indigenous people, civil societies, and private sectors in biodiversity conservation and management [61]. Such measures have been implemented in states such as Bolivia, Peru, Guyana, and other areas outside South America, and they may be of higher significance in the conservation of the South American wetland ecosystem and biodiversity [62].

Supplementary Materials

The following supporting information can be downloaded at: https://www.mdpi.com/article/10.3390/d14100830/s1, Figures S1–S7: The projected distribution change for the seven Nymphaea species for the future projection scenarios. (Figure S1) N. amazonum, (Figure S2) N. ampla, (Figure S3) N. jamesoniana, (Figure S4) N. lasiophylla, (Figure S5) N. lingulata, (Figure S6) N. pulchella, and (Figure S7) N. rudgeana. Table S1: The occurrence points for the seven water lily (Nymphaea) species used for this study. Table S2: The sixteen variables used for correlation in variance inflation factor (VIF). Table S3: Training (75%) and testing (25%) AUC values and their standard deviation values for the Nymphaea species’ distribution suitability using the maximum training sensitivity plus specificity logistic threshold (MTSS). The AUC values describe the fitness of the model in predicting the species’ distribution. Table S4: Distribution change obtained by comparing binary changes between the current and future potential distribution for the seven water lily species (Nymphaea) in South America. Table S5: Projected area size between protected areas and unprotected areas for the seven Nymphaea species’ accessible areas in South America. Table S6: Distribution change obtained by comparing binary changes between the current and future potential distribution for the seven water lily species (Nymphaea) in protected areas of South America.

Author Contributions

J.M.N.: conceptualization, investigation, formal analysis, writing—original draft; B.K.N.: formal analysis, writing—review and editing; V.M.M.: conceptualization, writing—review and editing; J.K.K.: writing—review and editing; Q.-F.W.: resources, funding acquisition; C.P. and J.-M.C.: conceptualization, resources, supervision; Z.-Z.L.: supervision, writing—review and editing. All authors have read and agreed to the published version of the manuscript.

Funding

This work was supported by grants from the National Natural Science Foundation of China, China (No. 32070231), and CAS-TWAS President’s Ph.D. Fellowship Program University of the Chinese Academy of Sciences, China.

Institutional Review Board Statement

Not applicable.

Data Availability Statement

All data presented in this study are available in the article and in the Supplementary Materials.

Conflicts of Interest

The authors declare no conflict of interest.

References

  1. Chou, S.C.; Lyra, A.; Mourão, C.; Dereczynski, C.; Pilotto, I.; Gomes, J.; Bustamante, J.; Tavares, P.; Silva, A.; Rodrigues, D. Assessment of climate change over South America under RCP 4.5 and 8.5 downscaling scenarios. Am. J. Clim. Chang. 2014, 3, 512. [Google Scholar] [CrossRef] [Green Version]
  2. Marengo, J.; Nobre, C.; Tomasella, J.; Cardoso, M.; Oyama, M. Hydro-climatic and ecological behaviour of the drought of Amazonia in 2005. Philos. Trans. R. Soc. Lond. B Proc. Biol. Sci. 2008, 363, 1773–1778. [Google Scholar] [CrossRef] [PubMed] [Green Version]
  3. Rowbotham, J. Intergovernmental Panel on Climate Change Fifth Assessment Report: Review of Working Group I Contribution. 2014. Available online: https://publications.parliament.uk/ (accessed on 16 June 2022).
  4. Leiva, J. Assessment of climate change impacts on the water resources at the northern oases of Mendoza province, Argentina. In Global Change in Mountain Regions; Price, M.F., Ed.; Sapiens Publishing: Kirkmahoe, UK, 2006; pp. 81–83. [Google Scholar]
  5. Vuille, M.; Bradley, R.S.; Werner, M.; Keimig, F. 20th century climate change in the tropical Andes: Observations and model results. In Climate Variability and Change in High Elevation Regions: Past, Present & Future; Springer: Berlin/Heidelberg, Germany, 2003; pp. 75–99. [Google Scholar]
  6. Crimmins, S.M.; Dobrowski, S.Z.; Greenberg, J.A.; Abatzoglou, J.T.; Mynsberge, A.R. Changes in climatic water balance drive downhill shifts in plant species’ optimum elevations. Science 2011, 331, 324–327. [Google Scholar] [CrossRef] [PubMed]
  7. Cook, K.H.; Vizy, E.K. Effects of twenty-first-century climate change on the Amazon rain forest. J. Clim. 2008, 21, 542–560. [Google Scholar] [CrossRef]
  8. Franchito, S.H.; Fernandez, J.P.R.; Pareja, D. Surrogate climate change scenario and projections with a regional climate model: Impact on the aridity in South America. Am. J. Clim. Chang. 2014, 3, 474. [Google Scholar] [CrossRef] [Green Version]
  9. Sala, O.E.; Stuart Chapin, F.; Armesto, J.J.; Berlow, E.; Bloomfield, J.; Dirzo, R.; Huber-Sanwald, E.; Huenneke, L.F.; Jackson, R.B.; Kinzig, A. Global biodiversity scenarios for the year 2100. Science 2000, 287, 1770–1774. [Google Scholar] [CrossRef] [PubMed]
  10. Borsch, T.; Hilu, K.W.; Wiersema, J.H.; Löhne, C.; Barthlott, W.; Wilde, V. Phylogeny of Nymphaea (Nymphaeaceae): Evidence from substitutions and microstructural changes in the chloroplast trnT-trnF region. Int. J. Plant Sci. 2007, 168, 639–671. [Google Scholar] [CrossRef] [Green Version]
  11. Murphy, K.; Efremov, A.; Davidson, T.A.; Molina-Navarro, E.; Fidanza, K.; Betiol, T.C.C.; Chambers, P.; Grimaldo, J.T.; Martins, S.V.; Springuel, I. World distribution, diversity and endemism of aquatic macrophytes. Aquat. Bot. 2019, 158, 103127. [Google Scholar] [CrossRef]
  12. Dalziell, E.L.; Lewandrowski, W.; Merritt, D.J. Increased salinity reduces seed germination and impacts upon seedling development in Nymphaea L. (Nymphaeaceae) from northern Australia’s freshwater wetlands. Aquat. Bot. 2020, 165, 103235. [Google Scholar] [CrossRef]
  13. Parveen, S.; Singh, N.; Adit, A.; Kumaria, S.; Tandon, R.; Agarwal, M.; Jagannath, A.; Goel, S. Contrasting reproductive strategies of two Nymphaea species affect existing natural genetic diversity as assessed by microsatellite markers: Implications for conservation and wetlands restoration. Front. Plant Sci. 2022, 13, 773572. [Google Scholar] [CrossRef]
  14. Ngarega, B.K.; Nzei, J.M.; Saina, J.K.; Halmy, M.W.A.; Chen, J.-M.; Li, Z.-Z. Mapping the habitat suitability of Ottelia species in Africa. Plant Divers. 2022. [Google Scholar] [CrossRef]
  15. Nzei, J.M.; Mwanzia, V.M.; Ngarega, B.K.; Musili, P.M.; Wang, Q.-F.; Chen, J.-M.; Li, Z.-Z. Ecological Niche Modeling of water Lily (Nymphaea L.) species in Australia under climate change to ascertain habitat suitability for conservation measures. Plants 2022, 11, 1874. [Google Scholar] [CrossRef] [PubMed]
  16. Nzei, J.M.; Ngarega, B.K.; Mwanzia, V.M.; Musili, P.M.; Wang, Q.-F.; Chen, J.-M. The past, current, and future distribution modeling of four water lilies (Nymphaea) in Africa indicates varying suitable habitats and distribution in climate change. Aquat. Bot. 2021, 173, 103416. [Google Scholar] [CrossRef]
  17. Willis, S.G.; Hole, D.G.; Collingham, Y.C.; Hilton, G.; Rahbek, C.; Huntley, B. Assessing the impacts of future climate change on protected area networks: A method to simulate individual species’ responses. Environ. Manag. 2009, 43, 836–845. [Google Scholar] [CrossRef] [PubMed]
  18. Macedo, M.N.; DeFries, R.S.; Morton, D.C.; Stickler, C.M.; Galford, G.L.; Shimabukuro, Y.E. Decoupling of deforestation and soy production in the southern Amazon during the late 2000s. PNAS 2012, 109, 1341–1346. [Google Scholar] [CrossRef] [PubMed] [Green Version]
  19. Morton, D.C.; DeFries, R.S.; Shimabukuro, Y.E.; Anderson, L.O.; Arai, E.; del Bon Espirito-Santo, F.; Freitas, R.; Morisette, J. Cropland expansion changes deforestation dynamics in the southern Brazilian Amazon. PNAS 2006, 103, 14637–14641. [Google Scholar] [CrossRef] [Green Version]
  20. Papeş, M.; Gaubert, P. Modelling ecological niches from low numbers of occurrences: Assessment of the conservation status of poorly known viverrids (Mammalia, Carnivora) across two continents. Divers. Distrib. 2007, 13, 890–902. [Google Scholar] [CrossRef]
  21. Elith, J.; Graham, C.H.; Anderson, R.P.; Dudík, M.; Ferrier, S.; Guisan, A.; Hijmans, R.J.; Huettmann, F.; Leathwick, J.R.; Lehmann, A. Novel methods improve prediction of species’ distributions from occurrence data. Ecography 2006, 29, 129–151. [Google Scholar] [CrossRef] [Green Version]
  22. Ngarega, B.K.; Masocha, V.F.; Schneider, H. Forecasting the effects of bioclimatic characteristics and climate change on the potential distribution of Colophospermum mopane in southern Africa using Maximum Entropy (Maxent). Ecol. Inform. 2021, 65, 101419. [Google Scholar] [CrossRef]
  23. Phillips, S.J.; Elith, J. On estimating probability of presence from use availability or presence background data. Ecology 2013, 94, 1409–1419. [Google Scholar] [CrossRef]
  24. Wan, J.-N.; Mbari, N.J.; Wang, S.-W.; Liu, B.; Mwangi, B.N.; Rasoarahona, J.R.; Xin, H.-P.; Zhou, Y.-D.; Wang, Q.-F. Modeling impacts of climate change on the potential distribution of six endemic baobab species in Madagascar. Plant Divers. 2021, 43, 117–124. [Google Scholar] [CrossRef] [PubMed]
  25. Townsend Peterson, A.; Papeş, M.; Eaton, M. Transferability and model evaluation in ecological niche modeling: A comparison of GARP and Maxent. Ecography 2007, 30, 550–560. [Google Scholar] [CrossRef]
  26. De Lima, C.T.; Guilietti, A.M. Nymphaea vanildae (Nymphaeaceae): A new species from the Caatinga in Brazil. Phytotaxa 2013, 134, 42–48. [Google Scholar] [CrossRef] [Green Version]
  27. de Lima, C.T.; Machado, I.C.; Giulietti, A.M. Nymphaeaceae of Brasil. SITIENTIBUS Série Ciências Biológicas 2021, 21. [Google Scholar] [CrossRef]
  28. Aiello-Lammens, M.E.; Boria, R.A.; Radosavljevic, A.; Vilela, B.; Anderson, R.P. spThin: An R package for spatial thinning of species occurrence records for use in ecological niche models. Ecography 2015, 38, 541–545. [Google Scholar] [CrossRef]
  29. Fick, S.E.; Hijmans, R.J. WorldClim 2: New 1-km spatial resolution climate surfaces for global land areas. Int. J. Climatol. 2017, 37, 4302–4315. [Google Scholar] [CrossRef]
  30. Esri, R. ArcGIS Desktop: Release 10; Environmental Systems Research Institute: Redlands, CA, USA, 2011. [Google Scholar]
  31. Barve, N.; Barve, V.; Jiménez-Valverde, A.; Lira-Noriega, A.; Maher, S.P.; Peterson, A.T.; Soberón, J.; Villalobos, F. The crucial role of the accessible area in ecological niche modeling and species distribution modeling. Ecol. Model. 2011, 222, 1810–1819. [Google Scholar] [CrossRef]
  32. Soberon, J.; Peterson, A.T. Interpretation of models of fundamental ecological niches and species’ distributional areas. Biodivers. Inform. 2005. [Google Scholar] [CrossRef] [Green Version]
  33. Escobar, L.E.; Medina-Vogel, G.; Peterson, A.T. Potential for spread of the white-nose fungus (Pseudogymnoascus destructans) in the Americas: Use of Maxent and NicheA to assure strict model transference. Geospat. Health 2014, 9, 221–229. [Google Scholar] [CrossRef]
  34. Booth, T.H. Checking bioclimatic variables that combine temperature and precipitation data before their use in species distribution models. Austral Ecol. 2022. [Google Scholar] [CrossRef]
  35. Team, R.C. A Language and Environment for Statistical Computing; R Foundation for Statistical Computing: Vienna, Austria, 2014; Available online: www.r-project.org (accessed on 14 February 2019).
  36. Gent, P.R.; Danabasoglu, G.; Donner, L.J.; Holland, M.M.; Hunke, E.C.; Jayne, S.R.; Lawrence, D.M.; Neale, R.B.; Rasch, P.J.; Vertenstein, M. The community climate system model version 4. J. Clim. 2011, 24, 4973–4991. [Google Scholar] [CrossRef] [Green Version]
  37. McSweeney, C.; Jones, R.; Lee, R.W.; Rowell, D. Selecting CMIP5 GCMs for downscaling over multiple regions. Clim. Dyn. 2014, 44, 3237–3260. [Google Scholar] [CrossRef] [Green Version]
  38. Phillips, S.J.; Anderson, R.P.; Schapire, R.E. Maximum entropy modeling of species geographic distributions. Ecol. Model. 2006, 190, 231–259. [Google Scholar] [CrossRef] [Green Version]
  39. Muscarella, R.; Galante, P.J.; Soley-Guardia, M.; Boria, R.A.; Kass, J.M.; Uriarte, M.; Anderson, R.P. ENM eval: An R package for conducting spatially independent evaluations and estimating optimal model complexity for Maxent ecological niche models. Methods Ecol. Evol. 2014, 5, 1198–1205. [Google Scholar] [CrossRef] [Green Version]
  40. Phillips, S.J.; Dudík, M.; Schapire, R. Maxent Software for Modeling Species Niches and Distributions (Version 3.4.1). Available online: http.biodiversityinformatics.amnh.org/open_source/Maxent/ (accessed on 31 July 2017).
  41. Brown, J.L. SDM toolbox: A python-based GIS toolkit for landscape genetic, biogeographic and species distribution model analyses. Methods Ecol. Evol. 2014, 5, 694–700. [Google Scholar] [CrossRef]
  42. Merow, C.; Smith, M.J.; Silander Jr, J.A. A practical guide to MaxEnt for modeling species’ distributions: What it does, and why inputs and settings matter. Ecography 2013, 36, 1058–1069. [Google Scholar] [CrossRef]
  43. Deka, M.A.; Morshed, N. Mapping disease transmission risk of Nipah virus in South and Southeast Asia. Trop. Med. Infect. Dis. 2018, 3, 57. [Google Scholar] [CrossRef] [Green Version]
  44. Zhao, D.; He, H.S.; Wang, W.J.; Wang, L.; Du, H.; Liu, K.; Zong, S. Predicting wetland distribution changes under climate change and human activities in a mid-and high-latitude region. Sustainability 2018, 10, 863. [Google Scholar] [CrossRef] [Green Version]
  45. Bachman, G.R.; McMahon, M.J. Day and Night Temperature Differential (DIF) or the absence of far-red light alters cell elongation in celebrity white ‘Petunia. J. Am. Soc. Hortic. Sci. 2006, 131, 309–312. [Google Scholar] [CrossRef] [Green Version]
  46. Deb, J.C.; Phinn, S.; Butt, N.; McAlpine, C.A. The impact of climate change on the distribution of two threatened Dipterocarp trees. Ecol. Evol. 2017, 7, 2238–2248. [Google Scholar] [CrossRef]
  47. Löhne, C.; Yoo, M.-J.; Borsch, T.; Wiersema, J.; Wilde, V.; Bell, C.D.; Barthlott, W.; Soltis, D.E.; Soltis, P.S. Biogeography of Nymphaeales: Extant patterns and historical events. Taxon 2008, 57, 1123–1146. [Google Scholar] [CrossRef]
  48. Deininger, M.; Ward, B.M.; Novello, V.F.; Cruz, F.W. Late quaternary variations in the South American monsoon system as inferred by speleothems new perspectives using the SISAL database. Quaternary 2019, 2, 6. [Google Scholar] [CrossRef] [Green Version]
  49. Corlett, R.T. Impacts of warming on tropical lowland rainforests. Trends Ecol. Evol. 2011, 26, 606–613. [Google Scholar] [CrossRef] [PubMed]
  50. Hewitt, G.M. Genetic consequences of climatic oscillations in the Quaternary. Philos. Trans. R. Soc. Lond. B Proc. Biol. Sci. 2004, 359, 183–195. [Google Scholar] [CrossRef] [PubMed] [Green Version]
  51. Ritter, N.P.; Crow, G.E.; Wiersema, J.H. Nymphaea (Nymphaeaceae) in Bolivia: Notes on several species, three new country records, and a key to species. Rhodora 2001, 103, 326–331. [Google Scholar]
  52. de Sousa, D.; Matias, L.Q. Synopsis of genus Nymphaea L. (Nymphaeaceae) in state of Ceará. Rev. Caatinga 2012, 25, 72–78. [Google Scholar]
  53. Langdon, J.G.; Lawler, J.J. Assessing the impacts of projected climate change on biodiversity in the protected areas of western North America. Ecosphere 2015, 6, 1–14. [Google Scholar] [CrossRef]
  54. Thompson, J.; Peepre, J. Economic Benefits of Protected Areas to Community and Tourism 2014, pp. 1–39. Available online: http://nbsapforum.net/sites/default/files/Economic%20Benefits%20of%20Protected%20Areas.pdf (accessed on 18 June 2022).
  55. Rowland, E.L.; Fresco, N.; Reid, D.; Cooke, H.A. Examining climate-biome (“cliome”) shifts for Yukon and its protected areas. Glob. Ecol. Conserv. 2016, 8, 1–17. [Google Scholar] [CrossRef] [Green Version]
  56. Hannah, L.; Midgley, G.; Andelman, S.; Araújo, M.; Hughes, G.; Martinez-Meyer, E.; Pearson, R.; Williams, P. Protected area needs in a changing climate. Front. Ecol. Environ. 2007, 5, 131–138. [Google Scholar] [CrossRef] [Green Version]
  57. Hole, D.G.; Willis, S.G.; Pain, D.J.; Fishpool, L.D.; Butchart, S.H.; Collingham, Y.C.; Rahbek, C.; Huntley, B. Projected impacts of climate change on a continent wide protected area network. Ecol. Lett. 2009, 12, 420–431. [Google Scholar] [CrossRef]
  58. Scanlon, B.R.; Jolly, I.; Sophocleous, M.; Zhang, L. Global impacts of conversions from natural to agricultural ecosystems on water resources: Quantity versus quality. Water Resour. Res. 2007, 43. [Google Scholar] [CrossRef] [Green Version]
  59. Coe, M.T.; Costa, M.H.; Soares-Filho, B.S. The influence of historical and potential future deforestation on the stream flow of the Amazon river land surface processes and atmospheric feedbacks. J. Hydrol. 2009, 369, 165–174. [Google Scholar] [CrossRef]
  60. Urban, M.C. Accelerating extinction risk from climate change. Science 2015, 348, 571–573. [Google Scholar] [CrossRef] [PubMed] [Green Version]
  61. Butchart, S.H.; Clarke, M.; Smith, R.J.; Sykes, R.E.; Scharlemann, J.P.; Harfoot, M.; Buchanan, G.M.; Angulo, A.; Balmford, A.; Bertzky, B. Shortfalls and solutions for meeting national and global conservation area targets. Conserv. Lett. 2015, 8, 329–337. [Google Scholar] [CrossRef]
  62. Ellison, K. Renting Biodiversity: The conservation concessions approach: With all the money we spend making conservation pay for itself, we could just pay for conservation. Conserv. Pract. 2003, 4, 20–29. [Google Scholar] [CrossRef]
Figure 1. Occurrence points for the seven water lily (Nymphaea) species in South America: (a) N. amazonum, (b) N. ampla, (c) N. jamesoniana, (d) N. lasiophylla, (e) N. lingulata, (f) N. pulchella, and (g) N. rudgeana. The points marked with a black dot inside indicate occurrence points within protected areas.
Diversity 14 00830 g001
Figure 2. The current distribution of the seven Nymphaea species in South America: (a) N. amazonum, (b) N. ampla, (c) N. jamesoniana, (d) N. lasiophylla, (e) N. lingulata, (f) N. pulchella, and (g) N. rudgeana.
Diversity 14 00830 g002
Figure 3. Future distribution changes in expansion (habitat gain), contraction (habitat loss), and stable environment among the seven Nymphaea species.
Diversity 14 00830 g003
Figure 4. Land use characteristics in South America within the water lily (Nymphaea)-accessible area (M), indicating the land use category in protected and unprotected areas.
Diversity 14 00830 g004
Figure 5. Comparison of habitat suitability change for the water lily species within unprotected areas (a) and protected areas (b). Change area is represented in percentage, expansion in positive values, and contraction in negative values.
Diversity 14 00830 g005
Figure 6. Comparison of the stable habitat change for the water lily species within unprotected areas (a) and protected areas (b). Change area is represented in percentage.
Diversity 14 00830 g006
Table 1. Climatic variables retained after correlation analysis using variance inflation factors (VIF).
Variable No.Bioclimatic VariableCodeVIF
1Mean diurnal range (mean of monthly (max temp – min temp))bio21.7436
2Temperature seasonality (standard deviation × 100)bio41.9289
3Maximum temperature of the warmest monthbio51.1728
4Precipitation of the wettest monthbio131.8567
5Precipitation seasonality (coefficient of variation)bio151.4996
6Land use coverdom_lu1.2866
Table 2. Feature classes selected for the modeling of the Nymphaea species in South America. The abbreviations represent linear (L), quadratic (Q), hinge (H), and product (P) at varying regularization multiplier (rm) values.
SpeciesFeatures Classrm ValueCurrent Habitat Suitability (km2)
N. amazonumLQHP3.52,339,884
N. amplaLQ2.51,558,143
N. jamesonianaLQH42,790,903
N. lasiophylaLQH2862,217
N. lingulataLQH41,341,940
N. pulchellaLQH4907,696.1
N. rudgeanaLQH3.52,657,233
Table 3. The area under the curve (AUC) and standard deviation values for the seven Nymphaea species distribution models in two representative concentration pathways (RCPs 4.5 and 8.5) and two scenarios (2050 and 2070).
RCP 4.5RCP 8.5
SpeciesCurrent2050207020502070
N. amazonum0.847 ± 0.0750.808 ± 0.1160.803 ± 0.1180.815 ± 0.1150.811 ± 0.111
N. ampla0.878 ± 0.0810.887 ± 0.0890.889 ± 0.0900.891 ± 0.0840.879 ± 0.085
N. jamesoniana0.842 ± 0.0830.859 ± 0.0860.848 ± 0.0960.848 ± 0.0900.848 ± 0.094
N. lasiophylla0.963 ± 0.0360.954 ± 0.0450.951 ± 0.0490.953 ± 0.0480.958 ± 0.035
N. lingulata0.902 ± 0.0360.890 ± 0.0740.889 ± 0.0750.891 ± 0.0780.882 ± 0.087
N. pulchella0.927 ± 0.0250.936 ± 0.0220.935 ± 0.0210.938 ± 0.0210.933 ± 0.023
N. rudgeana0.814 ± 0.0860.794 ± 0.0830.800 ± 0.0890.796 ± 0.0890.806 ± 0.090
Table 4. The mean relative contribution for the six bioclimatic variables used for the habitat suitability modeling of the water lily species in South America in two representative concentration pathways (RCPs 4.5 and 8.5) and two scenarios (2050 and 2070).
RCP 4.5RCP 8.5
SpeciesVariableCurrent2050207020502070
N. amazonumbio232.628.329.832.530.0
bio417.63.33.33.42.7
bio516.115.311.612.212.0
bio139.519.518.820.420.6
bio154.39.812.710.411.3
dom_lu20.023.723.921.223.3
N. amplabio223.535.335.740.237.5
bio417.813.513.812.215.2
bio50.01.61.62.33.8
bio1325.820.320.215.915.9
bio158.310.59.511.28.6
dom_lu24.618.919.218.119.2
N. jamesonianabio20.00.30.40.20.6
bio418.66.46.83.94.5
bio529.116.614.312.68.9
bio132.820.917.022.721.1
bio1519.321.323.523.225.1
dom_lu30.334.438.037.539.9
N. lasiophyllabio224.927.326.630.531.1
bio40.20.80.90.30.6
bio50.90.30.51.12.3
bio137.410.37.17.57.1
bio1558.252.956.253.050.9
dom_lu8.48.38.67.78.0
N. lingulatabio219.420.621.623.023.0
bio49.84.94.14.93.3
bio54.93.83.11.81.2
bio131.86.96.26.05.7
bio1543.041.042.540.542.2
dom_lu21.122.722.523.824.6
N. pulchellabio227.527.929.931.730.5
bio438.619.517.918.616.3
bio52.52.93.64.06.0
bio134.623.321.120.620.7
bio151.22.22.21.81.9
dom_lu25.624.425.223.424.6
N. rudgeanabio270.066.761.162.360.1
bio46.910.39.48.611.6
bio51.20.30.20.30.1
bio130.40.10.10.20.6
bio1512.710.716.516.015.4
dom_lu8.811.812.712.612.2
Publisher’s Note: MDPI stays neutral with regard to jurisdictional claims in published maps and institutional affiliations.

