
Measuring the Impact of Conservation: The Growing Importance of Monitoring Fauna, Flora and Funga

 , , , , ,
  , , and
Abstract
:1. Introduction
2. Biodiversity Data, Data Users and Data Use
2.1. Types of Data
- The state of biodiversity, such as trends in species presence and distribution, species abundance and population density, species conservation status, habitat extent and quality. Essential biodiversity variables or EBVs [26] have also been proposed in the following categories: genetic composition, species populations, species traits, community composition, ecosystem functioning, and ecosystem structure.
- The values of nature and its contribution to people, including biophysical, monetary and socio-cultural types of data, are needed to assess human livelihoods and wellbeing, and to measure nature’s instrumental, intrinsic or relational values [27].
- The threats and pressures on biodiversity and the drivers behind them, including anthropogenic impacts, especially industrial and agricultural activity, institutional and governance systems that drive pressures [28], and the effects of climate change and land-use change on habitats and species [29,30].
- The level and success of actions, policies, strategies and responses to address threats and pressures, especially those relating to the protection, restoration, management and sustainable use of biodiversity, including relevant data on business efforts to mitigate the impacts of their operations and supply chains.
2.2. Types of Data Users and Their Uses for Data
- Monitoring wolves in Switzerland. One specific example that illustrates the data and user types highlighted in Figure 1 is the Swiss wolf programme [58]. The target for the information need is the protection and management of the grey wolf (Canis lupus) population in Switzerland. The data type is individual wolf presence. Data are collected by local government (cantonal) environment agencies, co-ordinated by the in-state foundation KORA [59]. The data user is the Swiss Federal Office for the Environment in the federal government. Data are in turn used by regional government environment bodies to make decisions on wolf conservation and management and the mitigation of human–wildlife conflict. Data are also used by academic and NGO partners to produce research and monitoring outputs. The data enablers for this system include non-invasive methods of data collection (genetic sampling and camera trapping), and the capacity and expertise of (1) a research lab in the University of Lausanne [60] which analyses samples using modern genetic techniques [61], (2) KORA for capacity building, co-ordination of data collection and data management, and (3) local government staff for sample collection. The federal government’s willingness to provide financial resources for data collection and to use the data in decision-making are also key enablers.
- Using Key Biodiversity Area (KBA) Data for business planning. Key Biodiversity Areas (KBAs) are sites contributing significantly to the global persistence of biodiversity [62]. A number of development banks, including the World Bank, the International Finance Corporation, the European Investment Bank and the European Bank for Reconstruction and Development, have incorporated KBAs into their environmental safeguard policies, performance standards and guidance. This means that the location of KBAs and the species for which they are identified are considered when deciding whether development projects should proceed, and with what design requirements, to minimise environmental risks. For example, the International Finance Corporation’s Performance Standard 6 (PS6) requires projects in ‘Critical Habitat’ to achieve a net gain in biodiversity. Critical Habitat is identified according to five criteria similar to those used for identifying KBAs [63,64]. PS6 has become recognised as international best practice for biodiversity management and is increasingly used throughout the finance and private sector. Data are essential for the identification of KBAs and Critical Habitats.
- Using arthropod data for island species conservation. The LIFE-BEETLES project [65] aims to improve the population size, distribution area and conservation status of three endemic beetle species in the Azores. As part of the project, an ongoing monitoring project aims to quantify an Index of Biodiversity Integrity or IBI [66]. This index, that is based on several community ecology indices, has to be delivered to a governmental stakeholder (Minister of Environment) on an annual basis to track progress and make appropriate management decisions. Arthropods are sampled using standardised techniques including pitfall [66], canopy tree beating [67] and SLAM traps [68]. Decisions made include where to tackle invasive alien plant species and where to protect and restore habitats.
- Using mammal data to make protected areas management decisions. In the Udzungwa Mountains, an area in Tanzania of exceptional conservation importance, long-term monitoring of primates and other terrestrial mammals show how open-ended wildlife monitoring can serve to evaluate the impact on wildlife of various management efforts. Examples of data use include: assessing park management decisions such as banning firewood collection [69]; understanding how contrasting management regimes in similar habitats impacts wildlife [70]; assessing species recovery following an increase in ground patrols (F. Rovero, unpubl.). Such work is being replicated in Shai Hills in Ghana by the IUCN SSC Species Monitoring Specialist Group, the Centre for Biodiversity Conservation Research and the Wildlife Division [71]. The camera-trapping protocol for monitoring terrestrial mammals originates from the pan-tropical TEAM Network [72]. This is, in turn, part of Wildlife Insights, a global platform for sharing camera trapping for wildlife conservation [73].
- Using citizen science bird data to identify suitable areas for wind farms. Identification of areas with migration flyways and high concentrations of endangered or endemic species is important for governments when approving large-scale infrastructure developments, such as wind farms in southern South America. Available data from citizen science platforms such as eBird [74] offer large-scale data at low cost. So far, migration pathways have been identified for a range of species (e.g., hooded grebe Podiceps gallardoi (Critically Endangered) and magellanic plover Pluvianellus socialis (Near Threatened)) and different types of important areas (e.g., national and provincial protected reserves), both by non-profit conservation institutions and by energy production companies. Furthermore, the Secretary of Environment of Santa Cruz Province in Austral Patagonia is now focusing its efforts on improving the results and developing more detailed maps by using multiple citizen science databases covering not only birds but other taxa.
- Company use of data for sustainability reporting. Mining company BHP uses biodiversity data both to set targets and track and monitor the performance of biodiversity on and near its operational sites. In the sustainability section of their 2021 annual report [75], BHP sets five-year marine and terrestrial biodiversity targets, and highlights the value of water conservation, biodiversity and reforestation in its products and services. The company monitors its biodiversity risks in terms of freshwater withdrawals, operations near protected or high biodiversity value areas, the number of IUCN Red List species on or near its sites that are Critically Endangered, Endangered or Vulnerable, and migratory and endemic species. BHP uses these data to make investment decisions for environmental protection and restoration, and also for scientific publications and thought-leadership articles. The company also uses the information to capture the co-benefits of nature as climate change mitigation and carbon storage solutions, particularly in the context of wetland, coastal and marine ecosystems.
3. Ongoing Challenges with Biodiversity Monitoring and Data Availability
3.1. Biases and Gaps in Biodiversity Research and Data
3.2. Inadequate Data Availability, Sharing, Quality and Usability
3.3. Technical and Financial Capacity Gaps for Data Collection, Analysis and Use, Especially in New Technologies and Key Disciplines
3.4. Root Causes and Interlinkages between Challenges
- Reporting to the Convention on Biological Diversity. Many countries fail to use data to report on their contributions to CBD reports. For example, a widespread paucity of data is a recurring theme in African national reports to the CBD [6]. Many African countries conduct regular wildlife surveys, yet the resultant data are rarely analysed and presented in a form that could be used by decision makers [190]. Only 36% of Fourth National CBD Reports contained data [15]. A review of a representative sample of 21 of the Fifth National CBD Reports found 11 with inadequate data, compounded by the fact some countries had no defined national indicators [16].
- Red Listing of poorly known species Lack of data means the conservation status cannot be determined for many species. In the latest IUCN Red List [91], 20,469 of the 147,517 species assessed (13.9%) were Data Deficient. Even for many species not considered Data Deficient (such as many African small mammals), the information needed for Red List assessments is often incomplete [7]. There are an estimated 11,846 species of fungi in Australia [191] yet only 39 species have been assessed for the IUCN Red List [91]; no fungi have been listed at a federal level and less than a hundred listed at state levels.
- Reporting to the FAO on fisheries. Countries provide data on industrial fisheries landings to the FAO. However, these records underestimate catch as they exclude bycatch, recreational and subsistence fishing and fail to estimate illegal, unreported and unregulated catches [192]. These partial data mask the actual scale of fisheries declines and hinder effective management to halt and reverse these trends.
- National data management–Indonesia. In Indonesia, as with many high-biodiversity countries, there is no clear centralised and standardised biodiversity database, as different government agencies are assigned to manage different biodiversity data [193,194]. For example: the Ministry of Environment and Forestry manages the database of terrestrial wildlife, forest, and mangroves; the Ministry of Marine Affairs and Fisheries manages the database of marine wildlife and economically important fish species; the national research agency manages the database of coral reefs and seagrass. This makes it difficult to carry out large-scale monitoring of coastal ecosystems that may have all these components, as the different agencies may use different units of measurement and different monitoring methods, and some agencies may be more reluctant to share data than others. The government in Indonesia is implementing a one map policy to address some of these issues [195], but data quality and standardisation is still a challenge. At the moment there is a budding initiative led by the Indonesian Biodiversity Consortium (KOBI) that is made up of academics, NGOs, and civil society groups aimed at establishing a national biodiversity index for Indonesia to help compile these data and work on standardising them, and bridging communication between the different stakeholders. However, this initiative is still in its infancy [196].
- Business disclosures on biodiversity. As summarised by Stephenson & Walls [17], accurate, reliable and timely data are essential for corporate biodiversity governance. Nevertheless, companies face challenges accessing existing data or collecting new data, especially spatial (geo-referenced) data that links activities to specific sites, supply chains, species and habitats. This may be the main reason that only 3-12% of European and US companies report anything on biodiversity [197,198]. Even where companies do report on nature in some way, the information is often not specific, measurable, or time-bound, making it difficult to determine business impacts [199]. This is compounded by the fact many business-specific biodiversity indicators rely on secondary data and modelling rather than direct measurement, using assumptions that may not be accurate [37].
4. Solutions Needed
4.1. Build Capacity Where It Is Most Needed
- NBSAP Forum and Global Biodiversity Information Facility. There is support from the NBSAP Forum [209] for countries developing and using indicators to measure delivery of their national goals and contribution to global goals. This support will need to be expanded when the indicator list is finalised for the post-2020 global biodiversity framework. Initiatives under the Global Biodiversity Information Facility-GBIF are helping countries build capacity to acquire data by creating networks of data holders and users and digitising and mobilising existing data from natural history collections and surveys [210]. This work has underlined the importance of increased technical capacity and information resources to assist data mobilisation [6].
- Developing island monitoring systems. Two key examples of successful capacity building for a range of stakeholders at a regional scale is BIOTA CANARIES [211] and the AZORESBIOPORTAL [212]. Starting in 2006, both systems provide the detailed distribution of terrestrial and marine biotas of the Canary and Azores archipelagos, respectively. Both projects support research, but particularly local stakeholders (from governments to civil society to businesses), to enable them to make informed decisions on conservation planning and management. Training sessions on the use of these biodiversity portals and their associated tools allowed the enhancement of biodiversity data collection and monitoring by park rangers.
- Establishing national bird monitoring schemes in Africa. The Royal Society for the Protection of Birds and BirdLife International worked with partners in Botswana, Kenya and Uganda to establish national bird population monitoring schemes. These were based on citizen science approaches used in Europe that are capable of monitoring population trends in common and widespread species. Challenges encountered included recruiting, training and retaining volunteer surveyors, and securing long-term funding [213]. However, with technical support and modest investment, meaningful biodiversity indicators can be generated and used in African countries. Sustained resourcing for the existing schemes, and replication elsewhere, would be a cost-effective way to improve our understanding of biodiversity trends and measure progress towards environmental goals.
- Sino BON: China Biodiversity Observation and Research Network. The construction of Sino Bon by the Chinese Academy of Sciences started in 2013. The network focuses on monitoring the mid- and long-term population trends of key species in typical regions. Sino BON provides biodiversity data for supporting China to fulfil its commitment to the Convention on Biological Diversity. The network consists of ten sub-networks that are devoted to monitoring mammals, birds, amphibians, freshwater fishes, insects, soil animals, forest plants, grassland and desert plants, tree canopy and soil microorganism diversities. So far, the network covers 30 main sites and 60 affiliated sites all over China [214]. Optimising the monitoring network to cover more key biodiversity spots and facilitating the data sharing will be important to increase the programme’s impact.
4.2. Monitor Less Charismatic Species
4.3. Facilitate the Use of Appropriate Technologies to Improve Data Collection
4.4. Enhance Adoption of Best Practices in Data Collection, Sharing and Use
- Use standardised methodologies, following established protocols.
- Integrate satellite-based and ground-based remote sensing methods with in situ observations.
- Choose appropriate statistical approaches to allow correct inferences about change, including independent sampling and random transect selection.
- Account for differing detectability of different species in different habitats, using appropriate software as necessary (e.g., DISTANCE for distance sampling, PRESENCE for occupancy, SPECRICH for species richness).
- Choose appropriate monitoring frequencies based on the target species. Note that “for a rare species it is more efficient to survey more sampling units less intensively, while for a common species fewer sampling units should be surveyed more intensively” [260]
- Apply adaptive monitoring, improving indicators as necessary and altering methods or the timing of data collection to take account of lessons learned as the monitoring work advances.
- Ensure monitoring is applied for a long enough period of time to see long-term change in the indicators.
- Ensure that the most effective detection methods are used.
4.5. Make Data More Openly and Freely Available
4.6. Provide and Disseminate Guidelines and Tools and Share Lessons in Their Use
4.7. Increase Corporate Sector Engagement in Biodiversity Monitoring
4.8. Engage More People in Biodiversity Data Collection
4.9. Make and Sell the Case for Monitoring and a Results-Based Management Culture
- Inter-relationships between taxa. The health of most trees and shrubs is dependent on biotrophic relationships with mycorrhizal and endophytic fungi. These relationships increase plant nutrition and health through increased disease resistance, drought tolerance and reduced predation [353,354]. In turn, some fungi are dependent on mammals for their dispersal and so fungal and floral survival is linked to these mammals. For example, Australia has the highest rate of mammal extinctions of any continent [355]. Many of the extinctions have been small ground-dwelling marsupials, so called ‘ecosystem engineers’, including bettongs, potoroos and bandicoots [356], whose digging contributes to decreased flammability and increased nutrient cycling and seedling growth [357]. In addition, since these marsupials are adapted to eat fungi, particularly truffle-like fungi, they play a key role in dispersing fungal spores. The conservation of fungal specialists is therefore imperative to maintaining ectomycorrhizal fungal diversity and healthy plant–mycorrhizal relationships [358]. If land managers better understood the beneficial relationships between plants, fungi and mammals, and the threats they face, they might be more motivated to monitor them.
- The importance for ecosystem services. Cardoso et al. [8] noted: “Describing and understanding the roles and ecosystem services provided by different species could help linking invertebrate conservation with human well-being. This link is critical for increasing the public, political and even scientific support for invertebrate conservation… Only by preserving all species and guaranteeing interactions and ecosystem services may we reach the goal of overall biodiversity conservation.” Data on pollinating insects has already demonstrated their value to humans through the ecosystems services they provide and the importance of their conservation. While crops dependent on pollinators such as insects contribute to 35 per cent of global crop production volume, in Europe alone populations are declining for 37 per cent of bees and 31 per cent of butterflies [318]. Poorly studied cetaceans also play key roles in their ecosystems that have implications for overall ocean productivity, as well as potentially for carbon storage and sequestration. These roles include “effects on ocean productivity from moving oceanic organic matter and nutrients vertically in the water column and horizontally from foraging grounds to nutrient poor, low latitude feeding grounds, a local increase of primary production through contribution to marine biogeochemical cycles, and predator-prey relationships” [8].
- Potential commercial value. Understanding a broader selection of taxa will help identify opportunities for discovery of novel bioactive compounds for use in areas such as nutraceuticals, pharmaceuticals, and bioremediation. Approximately 53% of all approved anti-tumour drugs are either natural products or directly derived therefrom [359]. Naturally derived compounds also account for significant proportions of approved anti-microbial, anti-fungal and anti-viral pharmaceuticals.
5. Conclusions
Author Contributions
Funding
Institutional Review Board Statement
Informed Consent Statement
Acknowledgments
Conflicts of Interest
References
- Borges, P.A.; Cardoso, P.; Kreft, H.; Whittaker, R.J.; Fattorini, S.; Emerson, B.C.; Gil, A.; Gillespie, R.G.; Matthews, T.J.; Santos, A.; et al. Global Island Monitoring Scheme (GIMS): A proposal for the long-term coordinated survey and monitoring of native island forest biota. Biodivers. Conserv. 2018, 27, 2567–2586. [Google Scholar] [CrossRef]
- Stephenson, P.J. The Holy Grail of biodiversity conservation management: Monitoring impact in projects and project portfolios. Perspect. Ecol. Conserv. 2019, 17, 182–192. [Google Scholar] [CrossRef]
- Dinerstein, E.; Joshi, A.R.; Vynne, C.; Lee, A.T.; Pharand-Deschênes, F.; França, M.; Fernando, S.; Birch, T.; Burkart, K.; Asner, G.P.; et al. A “Global Safety Net” to reverse biodiversity loss and stabilize Earth’s climate. Sci. Adv. 2020, 6, eabb2824. [Google Scholar] [CrossRef] [PubMed]
- Nesshöver, C.; Livoreil, B.; Schindler, S.; Vandewalle, M. Challenges and solutions for networking knowledge holders and better informing decision-making on biodiversity and ecosystem services. Biodivers. Conserv. 2016, 25, 1207–1214. [Google Scholar] [CrossRef]
- Kissling, W.D.; Ahumada, J.A.; Bowser, A.; Fernandez, M.; Fernández, N.; García, E.A.; Guralnick, R.P.; Isaac, N.J.; Kelling, S.; Los, W.; et al. Building essential biodiversity variables (EBVs) of species distribution and abundance at a global scale. Biol. Rev. 2018, 93, 600–625. [Google Scholar] [CrossRef]
- Stephenson, P.J.; Bowles-Newark, N.; Regan, E.; Stanwell-Smith, D.; Diagana, M.; Hoft, R.; Abarchi, H.; Abrahamse, T.; Akello, C.; Allison, H.; et al. Unblocking the flow of biodiversity data for decision-making in Africa. Biol. Conserv. 2017, 213, 335–340. [Google Scholar] [CrossRef]
- Stephenson, P.J.; Bakarr, M.; Bowles-Newark, N.; Kleinschroth, F.; Mapendembe, A.; Ntiamoa-Baidu, Y.; Obura, D.; Ratsifandrihamana, N.; Simaika, J.; Sitati, N.; et al. Conservation science in Africa: Mainstreaming biodiversity information into decision-making. In Closing the Knowledge-Implementation Gap in Conservation Science; Wildlife Research Monograph Number, 4; Ferreira, C.C., Klütsch, C.F.C., Eds.; Springer: New York, NY, USA, 2021; pp. 287–321. [Google Scholar]
- Cardoso, P.; Erwin, T.L.; Borges, P.A.; New, T.R. The seven impediments in invertebrate conservation and how to overcome them. Biol. Conserv. 2011, 144, 2647–2655. [Google Scholar] [CrossRef]
- McRae, L.; Deinet, S.; Freeman, R. The diversity-weighted Living Planet Index: Controlling for taxonomic bias in a global biodiversity indicator. PLoS ONE 2017, 12, e0169156. [Google Scholar] [CrossRef]
- Belle, C.C.; Stoeckle, B.C.; Geist, J. Taxonomic and geographical representation of freshwater environmental DNA research in aquatic conservation. Aquat. Conserv. Mar. Freshw. Ecosyst. 2019, 29, 1996–2009. [Google Scholar] [CrossRef]
- Wearn, O.R.; Glover-Kapfer, P. Snap happy: Camera traps are an effective sampling tool when compared with alternative methods. R. Soc. Open Sci. 2019, 6, 181748. [Google Scholar] [CrossRef] [Green Version]
- Rocha-Ortega, M.; Rodriguez, P.; Córdoba-Aguilar, A. Geographical, temporal and taxonomic biases in insect GBIF data on biodiversity and extinction. Ecol. Entomol. 2021, 46, 718–728. [Google Scholar] [CrossRef]
- Pauly, D. Anecdotes and shifting baseline syndrome of fisheries. Trends Ecol. Evol. 1995, 10, 430. [Google Scholar] [CrossRef]
- Australian Government 2022. Australia State of the Environment 2021. Available online: https://soe.dcceew.gov.au/ (accessed on 20 July 2022).
- Bubb, P. Scaling up or down? Linking global and national biodiversity indicators and reporting. In Biodiversity Monitoring and Conservation: Bridging the Gap between Global Commitment and Local Action; Collen, B., Pettorelli, N., Baillie, J., Durant, S., Eds.; Wiley-Blackwell and the Zoological Society of London: London, UK, 2013; pp. 402–420. [Google Scholar]
- Koh, N.S.; Ituarte-Lima, C.; Hahn, T. Mind the compliance gap: How insights from international human rights mechanisms can help to implement the Convention on Biological Diversity. Transnatl. Environ. Law 2022, 11, 39–67. [Google Scholar] [CrossRef]
- Stephenson, P.J.; Walls, J. A new biodiversity paradigm for business. Amplify 2022, 35, 6–14. Available online: https://www.cutter.com/article/new-biodiversity-paradigm-business (accessed on 15 August 2022).
- Kurth, T.; Wübbels, G.; Portafaix, A.; Meyer Zum Felde, A.; Zielcke, S. The Biodiversity Crisis is a Business Crisis; Boston Consulting Group: Boston, MA, USA, 2021. [Google Scholar]
- Costanza, R.; deGroot, R.; Sutton, P.; van der Ploeg, S.; Anderson, S.J.; Kubiszewski, I.; Farber, S.; Turner, R.K. Changes in the global value of ecosystem services. Glob. Clim. Change 2014, 26, 152–158. [Google Scholar] [CrossRef]
- Howes, M.J.; Quave, C.L.; Collemare, J.; Tatsis, E.C.; Twilley, D.; Lulekal, E.; Farlow, A.; Li, L.; Cazar, M.E.; Leaman, D.J.; et al. Molecules from nature: Reconciling biodiversity conservation and global healthcare imperatives for sustainable use of medicinal plants and fungi. Plants People Planet 2020, 2, 463–481. [Google Scholar] [CrossRef]
- WTTC—World Travel and Tourism Council. The Economic Impact of Global Wildlife Tourism; WTTC: London, UK, 2019; Available online: https://wttc.org/Portals/0/Documents/Reports/2019/Sustainable%20Growth-Economic%20Impact%20of%20Global%20Wildlife%20Tourism-Aug%202019.pdf (accessed on 1 August 2022).
- PWC & WWF. Nature is Too Big to Fail. Biodiversity: The Next Frontier in Financial Risk Management. PWC & WWF, 2020. Available online: https://www.pwc.ch/en/publications/2020/nature-is-too-big-to-fail.pdf (accessed on 12 August 2022).
- Xu, H.; Cao, Y.; Yu, D.; Cao, M.; He, Y.; Gill, M.; Pereira, H.M. Ensuring effective implementation of the post-2020 global biodiversity targets. Nat. Ecol. Evol. 2021, 5, 411–418. [Google Scholar] [CrossRef] [PubMed]
- CBD. Recommendation Adopted by the Subsidiary Body on Scientific, Technical and Technological Advice 24/2. Proposed monitoring framework for the post-2020 global biodiversity framework. In Proceedings of the CBD/SBSTTA/REC/24/2, Geneva, Switzerland, 14–29 March 2022. [Google Scholar]
- Addison, P.F.E.; Carbone, G.; McCormick, N. The Development and Use of Biodiversity Indicators in Business: An Overview; IUCN: Gland, Switzerland, 2018.
- Pereira, H.M.; Ferrier, S.; Walters, M.; Geller, G.N.; Jongman, R.H.; Scholes, R.J.; Bruford, M.W.; Brummitt, N.; Butchart, S.H.; Cardoso, A.C.; et al. Essential biodiversity variables. Science 2013, 339, 277–278. [Google Scholar] [CrossRef] [PubMed]
- IPBES. Contrasting Approaches to Values and Valuation. Available online: https://ipbes.net/contrasting-approaches-values-valuation (accessed on 16 August 2022).
- Mastrángelo, M.E.; Pérez-Harguindeguy, N.; Enrico, L.; Bennett, E.; Lavorel, S.; Cumming, G.S.; Abeygunawardane, D.; Amarilla, L.D.; Burkhard, B.; Egoh, B.N.; et al. Key knowledge gaps to achieve global sustainability goals. Nat. Sustain. 2019, 2, 1115–1121. [Google Scholar] [CrossRef]
- Rumpf, S.B.; Gravey, M.; Brönnimann, O.; Luoto, M.; Cianfrani, C.; Mariethoz, G.; Guisan, A. From white to green: Snow cover loss and increased vegetation productivity in the European Alps. Science 2022, 376, 1119–1122. [Google Scholar] [CrossRef]
- Van Vilet, J. Direct and indirect loss of natural area from urban expansion. Nat. Sustain. 2019, 2, 755–763. [Google Scholar] [CrossRef]
- Sparks, T.H.; Butchart, S.H.; Balmford, A.; Bennun, L.; Stanwell-Smith, D.; Walpole, M.; Bates, N.R.; Bomhard, B.; Buchanan, G.M.; Chenery, A.M.; et al. Linked indicator sets for addressing biodiversity loss. Oryx 2011, 45, 411–419. [Google Scholar] [CrossRef]
- Secretariat of the Convention on Biological Diversity. Global Biodiversity Outlook 4; Secretariat of the Convention on Biological Diversity: Montreal, QC, Canada, 2014.
- Tittensor, D.P.; Walpole, M.; Hill, S.L.; Boyce, D.G.; Britten, G.L.; Burgess, N.D.; Butchart, S.H.; Leadley, P.W.; Regan, E.C.; Alkemade, R.; et al. A mid-term analysis of progress toward international biodiversity targets. Science 2014, 346, 241–244. [Google Scholar] [CrossRef] [PubMed]
- Stephenson, P.J.; Burgess, N.D.; Jungmann, L.; Loh, J.; O’Connor, S.; Oldfield, T.; Reidhead, W.; Shapiro, A. Overcoming the challenges to conservation monitoring: Integrating data from in-situ reporting and global data sets to measure impact and performance. Biodiversity 2015, 16, 68–85. [Google Scholar] [CrossRef]
- Ruggiero, M.A.; Gordon, D.P.; Orrell, T.M.; Bailly, N.; Bourgoin, T.; Brusca, R.C.; Cavalier-Smith, T.; Guiry, M.D.; Kirk, P.M. A Higher Level Classification of All Living Organisms. PLoS ONE 2015, 10, e0119248. [Google Scholar] [CrossRef]
- Larsen, B.B.; Miller, E.C.; Rhodes, M.K.; Wiens, J.J. Inordinate fondness multiplied and redistributed: The number of species on Earth and the new pie of life. Q. Rev. Biol. 2017, 92, 229–265. [Google Scholar] [CrossRef]
- Stephenson, P.J.; Carbone, G. Guidelines for Planning and Monitoring Corporate Biodiversity Performance; IUCN: Gland, Switzerland, 2021. [CrossRef]
- Miller, B.J. Why unprecedented bird flu outbreaks sweeping the world are concerning scientists. Nature 2022, 606, 18–19. [Google Scholar] [CrossRef]
- Williams, D.R.; Rondini, C.; Tilman, D. Global protected areas seem insufficient to safeguard half of the world’s mammals from human-induced extinction. Proc. Nat. Acad. Sci. USA 2022, 119, e2200118119. [Google Scholar] [CrossRef]
- Gray, M.; Kalpers, J. Ranger based monitoring in the Virunga-Bwindi region of East-Central Africa: A simple data collection tool for park management. Biodiv. Conserv 2005, 14, 2723–2741. [Google Scholar] [CrossRef]
- Mubalama, L.; Bashige, E. Caught in the crossfire: The forest elephant and law enforcement in a region of political instability, eastern Democratic Republic of Congo. Pachyderm 2006, 40, 69–79. [Google Scholar]
- Fancy, S.G.; Gross, J.E.; Carter, S.L. Monitoring the condition of natural resources in US national parks. Environ. Monit. Assess. 2009, 151, 161–174. [Google Scholar] [CrossRef] [PubMed]
- Mubalama, L. Monitoring Law Enforcement Effort and Illegal Activity Selected Protected Areas: Implications for Management and Conservation, Democratic Republic of Congo. Ph.D. Thesis, University of Ghent, Ghent, Belgium, 2010; 374p. [Google Scholar]
- Wright, E.F.; Bellingham, P.J.; Richardson, S.J.; McKay, M.; MacLeod, C.J.; McGlone, M.S. How to get a national biodiversity monitoring programme off the ground: Lessons from New Zealand. Parks 2020, 26, 67. [Google Scholar] [CrossRef]
- IUCN & WCPA (World Commission on Protected Areas). IUCN Green List of Protected and Conserved Areas: Standard, Version 1.1; IUCN: Gland, Switzerland, 2017.
- Conservation Measures Partnership. Conservation Measures Partnership’s (CMP) Conservation Actions Classification Version 2. CMP, 2016. Available online: https://docs.google.com/spreadsheets/d/1i25GTaEA80HwMvsTiYkdOoXRPWiVPZ5l6KioWx9g2zM/edit#gid=874211847 (accessed on 20 July 2022).
- Mapfumo, P.; Mtambanengwe, F.; Chikowo, R. Building on indigenous knowledge to strengthen the capacity of smallholder farming communities to adapt to climate change and variability in southern Africa. Clim. Dev. 2016, 8, 72–82. [Google Scholar] [CrossRef]
- Lukhele-Olorunju, P.; Gwandure, C. Women and indigenous knowledge systems in rural subsistence farming: The case of climate change in Africa. Afr. Insight 2018, 47, 59–71. [Google Scholar]
- Rocliffe, S.; Peabody, S.; Samoilys, M.; Hawkins, J.P. Towards a network of locally managed marine areas (LMMAs) in the Western Indian Ocean. PLoS ONE 2014, 9, e103000. [Google Scholar] [CrossRef]
- Breckwoldt, A.; Seidel, H. The need to know what to manage—Community-based marine resource monitoring in Fiji. Curr. Opin. Environ. Sustain. 2012, 4, 331–337. [Google Scholar] [CrossRef]
- Panwar, R.; Ober, H.; Pinkse, J. The uncomfortable relationship between business and biodiversity: Advancing research on business strategies for biodiversity protection. Bus. Strategy Environ. 2022. [Google Scholar] [CrossRef]
- Shukla, M.; Tiwari, M.K. Big-data analytics framework for incorporating smallholders in sustainable palm oil production. Prod. Plan. Control 2017, 28, 1365–1377. [Google Scholar] [CrossRef]
- FAO Fisheries and Resources Monitoring System. Available online: http://firms.fao.org/firms/en (accessed on 1 August 2022).
- MSC Marine Stewardship Council Standard. Available online: https://www.msc.org/standards-and-certification/fisheries-standard (accessed on 10 August 2022).
- Antoncic, M. Why sustainability? Because risk evolves and risk management should too. J. Risk Manag. Financ. Inst. 2019, 12, 206–216. [Google Scholar]
- Fauser, D.V.; Ute, S. Risk mitigation of corporate social performance in US class action lawsuits. Financ. Anal. J. 2021, 77, 43–65. [Google Scholar] [CrossRef]
- Koh, N.S.; Hahn, T.; Boonstra, W.J. How much of a market is involved in a biodiversity offset? A typology of biodiversity offset policies. J. Environ. Manag. 2019, 232, 679–691. [Google Scholar] [CrossRef] [PubMed]
- OFEV—Office Federal de Environnement. Plan Loup. OFEV: Bern, Switzerland, 2016. Available online: https://www.bafu.admin.ch/bafu/fr/home/themes/biodiversite/info-specialistes/protection-et-conservation-des-especes/grands-predateurs/le-loup.html (accessed on 1 August 2022).
- KORA Website. Available online: https://www.kora.ch/en/ (accessed on 10 August 2022).
- UNIL—University of Lausanne Website. Available online: https://www.unil.ch/lbc/en/home.html (accessed on 10 August 2022).
- Dufresnes, C.; Remollino, N.; Stoffel, C.; Manz, R.; Weber, J.M.; Fumagalli, L. Two decades of non-invasive genetic monitoring of the grey wolves recolonizing the Alps support very limited dog introgression. Sci. Rep. 2019, 9, 148. [Google Scholar] [CrossRef] [PubMed]
- IUCN. A Global Standard for the Identification of Key Biodiversity Areas, Version 1.0; IUCN: Gland, Switzerland, 2016.
- Martin, C.S.; Tolley, M.J.; Farmer, E.; Mcowen, C.J.; Geffert, J.L.; Scharlemann, J.P.W.; Thomas, H.L.; van Bochove, J.H.; Stanwell-Smith, D.; Hutton, J.M.; et al. A global map to aid the identification and screening of critical habitat for marine industries. Mar. Policy 2015, 53, 45–53. [Google Scholar] [CrossRef]
- Brauneder, K.M.; Montes, C.; Blyth, S.; Bennun, L.; Butchart, S.H.; Hoffmann, M.; Burgess, N.D.; Cuttelod, A.; Jones, M.I.; Kapos, V.; et al. Global screening for Critical Habitat in the terrestrial realm. PLoS ONE 2018, 13, e0193102. [Google Scholar] [CrossRef]
- LIFE BEETLES. Available online: https://www.lifebeetlesazores.com/en/ (accessed on 10 August 2022).
- Cardoso, P.; Borges, P.A.V.; Gaspar, C. Biotic integrity of the arthropod communities in the natural forests of Azores. Biodivers. Conserv. 2007, 16, 2883–2901. [Google Scholar] [CrossRef]
- Gaspar, C.; Gaston, K.J.; Borges, P.A.V.; Cardoso, P. Selection of priority areas for arthropod conservation in the Azores archipelago. J. Insect Conserv. 2021, 15, 671–684. [Google Scholar] [CrossRef]
- Costa, R.; Borges, P.A.V. SLAM Project—Long term ecological study of the impacts of climate change in the natural forest of Azores: I—the spiders from native forests of Terceira and Pico Islands (2012–2019). Biodivers. Data J. 2021, 9, e69924. [Google Scholar] [CrossRef]
- Oberosler, V.; Tenan, S.; Zipkin, E.; Rovero, F. When parks work: Effect of anthropogenic disturbance on occupancy of tropical forest mammals. Ecol. Evol. 2020, 10, 3881–3894. [Google Scholar] [CrossRef]
- Oberosler, V.; Tenan, S.; Zipkin, E.F.; Rovero, F. Poor management in protected areas is associated with lowered tropical mammal diversity. Anim. Conserv. 2020, 23, 171–181. [Google Scholar] [CrossRef]
- Stephenson, P.J. Advances in species monitoring for conservation. In IUCN Species Survival Commission Quarterly Report, June 2021; IUCN SSC: Gland, Switzerland, 2021; pp. 19–23. Available online: https://www.iucn.org/sites/dev/files/iucn_ssc_quarterly_report_june2021_web.pdf (accessed on 10 August 2022).
- Rovero, F.; Ahumada, J. The Tropical Ecology, Assessment and Monitoring (TEAM) Network: An early warning system for tropical rain forests. Sci. Total Environ. 2017, 574, 914–923. [Google Scholar] [CrossRef]
- Ahumada, J.A.; Fegraus, E.; Birch, T.; Flores, N.; Kays, R.; O’Brien, T.G.; Palmer, J.; Schuttler, S.; Zhao, J.Y.; Jetz, W.; et al. Wildlife insights: A platform to maximize the potential of camera trap and other passive sensor wildlife data for the planet. Environ. Conserv. 2020, 47, 1–6. [Google Scholar] [CrossRef]
- Cornell Lab of Ornithology. eBird. Available online: www.ebird.org (accessed on 2 August 2022).
- BHP. Annual Report. Available online: https://www.bhp.com/-/media/documents/investors/annual-reports/2021/210914_bhpannualreport2021.pdf#page=34 (accessed on 10 August 2022).
- Segan, D.B.; Bottrill, M.C.; Baxter, P.W.J.; Possingham, H.P. Using conservation evidence to guide management. Conserv. Biol. 2011, 25, 200–202. [Google Scholar] [CrossRef]
- Brooks, T.M.; Butchart, S.H.; Cox, N.A.; Heath, M.; Hilton-Taylor, C.; Hoffmann, M.; Kingston, N.; Rodríguez, J.P.; Stuart, S.N.; Smart, J. Harnessing biodiversity and conservation knowledge products to track the Aichi Targets and Sustainable Development Goals. Biodiversity 2015, 16, 157–174. [Google Scholar] [CrossRef] [Green Version]
- Di Marco, M.; Chapman, S.; Althor, G.; Kearney, S.; Besancon, C.; Butt, N.; Maina, J.M.; Possingham, H.P.; von Bieberstein, K.R.; Venter, O.; et al. Changing trends and persisting biases in three decades of conservation science. Glob. Ecol. Conserv. 2017, 10, 32–42. [Google Scholar] [CrossRef]
- Amano, T.; Sutherland, W.J. Four barriers to the global understanding of biodiversity conservation: Wealth, language, geographical location and security. Proc. R. Soc. B Biol. Sci. 2013, 280, 20122649. [Google Scholar] [CrossRef]
- Pimm, S.; Raven, P.; Peterson, A.; Şekercioğlu, Ç.H.; Ehrlich, P.R. Human impacts on the rates of recent, present, and future bird extinctions. Proc. Natl. Acad. Sci. USA 2006, 103, 10941–10946. [Google Scholar] [CrossRef]
- Titley, M.A.; Snaddon, J.L.; Turner, E.C. Scientific research on animal biodiversity is systematically biased towards vertebrates and temperate regions. PLoS ONE 2017, 12, e0189577. [Google Scholar] [CrossRef]
- Moussy, C.; Burfield, I.J.; Stephenson, P.J.; Newton, A.F.; Butchart, S.H.; Sutherland, W.J.; Gregory, R.D.; McRae, L.; Bubb, P.; Roesler, I.; et al. A quantitative global review of species population monitoring. Conserv. Biol. 2022, 36, e13721. [Google Scholar] [CrossRef]
- Meyer, C.; Kreft, H.; Guralnick, R.; Jetz, W. Global priorities for an effective information basis of biodiversity distributions. Nat. Commun. 2015, 6, 8221. [Google Scholar] [CrossRef]
- Velasco, D.; García-Llorente, M.; Alonso, B.; Dolera, A.; Palomo, I.; Iniesta-Arandia, I.; Martín-López, B. Biodiversity conservation research challenges in the 21st century: A review of publishing trends in 2000 and 2011. Environ. Sci. Policy 2015, 54, 90–96. [Google Scholar] [CrossRef]
- Stephenson, P.J. A global effort to improve species monitoring for conservation. Oryx 2018, 52, 412–413. [Google Scholar] [CrossRef]
- Meyer, C.; Weigelt, P.; Kreft, H. Multidimensional biases, gaps and uncertainties in global plant occurrence information. Ecol. Lett. 2016, 19, 992–1006. [Google Scholar] [CrossRef] [PubMed]
- Bonnet, X.; Shine, R.; Lourdais, O. Taxonomic chauvinism. Trends Ecol. Evol. 2002, 17, 1–3. [Google Scholar] [CrossRef]
- Clark, J.A.; May, R.M. Taxonomic bias in conservation research. Science 2002, 297, 191–192. [Google Scholar] [CrossRef] [PubMed]
- Leather, S.R. Taxonomic chauvinism threatens the future of entomology. Biologist 2009, 56, 10–13. [Google Scholar]
- Fazey, I.; Fischer, J.; Lindenmayer, D.B. What do conservation biologists publish? Biol. Conserv. 2005, 124, 63–73. [Google Scholar] [CrossRef]
- IUCN. The IUCN Red List of Threatened Species. Version 2022-1. IUCN, 2022. Available online: https://www.iucnredlist.org (accessed on 20 July 2022).
- May, T.W.; McMullan-Fisher, S.J. Don’t be afraid of the F-word: Prospects for integrating fungi into biodiversity monitoring. Proc. R. Soc. Vic. 2012, 124, 79–90. [Google Scholar] [CrossRef]
- Richardson, A.J.; Poloczanska, E.S. Under-resourced, under threat. Science 2008, 320, 1294. [Google Scholar] [CrossRef]
- Kindsvater, H.K.; Dulvy, N.K.; Horswill, C.; Juan-Jordá, M.J.; Mangel, M.; Matthiopoulos, J. Overcoming the data crisis in biodiversity conservation. Trends Ecol. Evol. 2018, 33, 676–688. [Google Scholar] [CrossRef]
- Conde, D.A.; Staerk, J.; Colchero, F.; da Silva, R.; Schöley, J.; Baden, H.M.; Jouvet, L.; Fa, J.E.; Syed, H.; Jongejans, E.; et al. Data gaps and opportunities for comparative and conservation biology. Proc. Natl. Acad. Sci. USA 2019, 116, 9658–9664. [Google Scholar] [CrossRef]
- Gu, W.; Swihart, R.K. Absent or undetected? Effects of non-detection of species occurrence on wildlife–habitat models. Biol. Conserv. 2004, 116, 195–203. [Google Scholar] [CrossRef]
- Sousa-Silva, R.; Alves, P.; Honrado, J.; Lomba, A. Improving the assessment and reporting on rare and endangered species through species distribution models. Glob. Ecol. Conserv. 2014, 2, 226–237. [Google Scholar] [CrossRef]
- Scheele, B.C.; Legge, S.; Armstrong, D.P.; Copley, P.; Robinson, N.; Southwell, D.; Westgate, M.; Lindenmayer, D. How to improve threatened species management: An Australian perspective. J. Environ. Manag. 2018, 223, 668–675. [Google Scholar] [CrossRef] [PubMed]
- Stephenson, P.J.; Ntiamoa-Baidu, Y.; Simaika, J.P. The use of traditional and modern tools for monitoring wetlands biodiversity in Africa: Challenges and opportunities. Front. Environ. Sci. 2020, 8, 61. [Google Scholar] [CrossRef]
- Vierod, A.D.; Guinotte, J.M.; Davies, A.J. Predicting the distribution of vulnerable marine ecosystems in the deep sea using presence-background models. Deep Sea Res. Part II Top. Stud. Oceanogr. 2014, 99, 6–18. [Google Scholar] [CrossRef]
- Boakes, E.H.; Fuller, R.A.; McGowan, P.J.K.; Mace, G.M. Uncertainty in identifying local extinctions: The distribution of missing data and its effects on biodiversity measures. Biol. Lett. 2016, 12, 20150824. [Google Scholar] [CrossRef]
- Letessier, T.B.; Bouchet, P.J.; Meeuwig, J.J. Sampling mobile oceanic fishes and sharks: Implications for fisheries and conservation planning. Biol. Rev. 2017, 92, 627–646. [Google Scholar] [CrossRef]
- Levin, L.A.; Bett, B.J.; Gates, A.R.; Heimback, P.; Howe, B.M.; Janssen, F.; McCurdy, A.; Ruhl, H.A.; Snelgrove, P.; Stocks, K.I.; et al. Global Observing Needs in the Deep Ocean. Front. Mar. Sci. 2019, 6, 241. [Google Scholar] [CrossRef]
- Marselle, M.R.; Lindley, S.J.; Cook, P.A.; Bonn, A. Biodiversity and Health in the Urban Environment. Curr. Environ. Health Rep. 2021, 8, 146–156. [Google Scholar] [CrossRef]
- Li, E.; Parker, S.S.; Pauly, G.B.; Randall, J.M.; Brown, B.V.; Cohen, B.S. An Urban Biodiversity Assessment Framework That Combines an Urban Habitat Classification Scheme and Citizen Science Data. Front. Ecol. Evol. 2019, 7, 277. [Google Scholar] [CrossRef]
- Bellon, A.M. Does animal charisma influence conservation funding for vertebrate species under the US Endangered Species Act? Environ. Econ. Policy Stud. 2019, 21, 399–411. [Google Scholar] [CrossRef]
- Troudet, J.; Grandcolas, P.; Blin, A.; Vignes-Lebbe, R.; Legendre, F. Taxonomic bias in biodiversity data and societal preferences. Sci. Rep. 2017, 7, 9132. [Google Scholar] [CrossRef] [PubMed]
- Colléony, A.; Clayton, S.; Couvet, D.; Saint Jalme, M.; Prévot, A.C. Human preferences for species conservation: Animal charisma trumps endangered status. Biol. Conserv. 2017, 206, 263–269. [Google Scholar] [CrossRef]
- Krause, M.; Robinson, K. Charismatic species and beyond: How cultural schemas and organisational routines shape conservation. Conserv. Soc. 2017, 15, 313–321. [Google Scholar] [CrossRef]
- Albert, C.; Luque, G.M.; Courchamp, F. The twenty most charismatic species. PLoS ONE 2018, 13, e0199149. [Google Scholar] [CrossRef] [PubMed]
- World Bank. Banking on Protected Areas. Promoting Sustainable Area Tourism to Benefit Local Economies; International Bank for Reconstruction and Development, The World Bank: Washington, DC, USA, 2021. [Google Scholar]
- McMullan-Fisher, S.J.; Kirkpatrick, J.B.; May, T.W.; Pharo, E.J. Surrogates for macrofungi and mosses in reservation planning. Conserv. Biol. 2010, 24, 730–736. [Google Scholar] [CrossRef]
- Stephenson, P.J.; Brooks, T.; Butchart, S.; Fegraus, E.; Geller, G.; Hoft, R.; Hutton, J.; Kingston, N.; Long, B.; McRae, L. Priorities for big biodiversity data. Front. Ecol. Environ. 2017, 15, 124–125. [Google Scholar] [CrossRef]
- Antonelli, A.; Fry, C.; Smith, R.J.; Simmonds, M.S.J.; Kersey, P.J.; Pritchard, H.W.; Abbo, M.S.; Acedo, C.; Adams, J.; Ainsworth, A.M.; et al. State of the World’s Plants and Fungi. Ph.D. Thesis, Royal Botanic Gardens, Kew, Richmond, UK, 2020. [Google Scholar] [CrossRef]
- Hochkirch, A.; Samways, M.J.; Gerlach, J.; Böhm, M.; Williams, P.; Cardoso, P.; Cumberlidge, N.; Stephenson, P.J.; Seddon, M.B.; Clausnitzer, V.; et al. A strategy for the next decade to address data deficiency in neglected biodiversity. Conserv. Biol. 2021, 35, 502–509. [Google Scholar] [CrossRef]
- Akçakaya, H.R.; Rodrigues, A.S.; Keith, D.A.; Milner-Gulland, E.J.; Sanderson, E.W.; Hedges, S.; Mallon, D.P.; Grace, M.K.; Long, B.; Meijaard, E.; et al. Assessing ecological function in the context of species recovery. Conserv. Biol. 2020, 34, 561–571. [Google Scholar] [CrossRef]
- Meeuwig, J.J.; Thompson, C.D.; Forrest, J.A.; Christ, H.J.; Letessier, T.B.; Meeuwig, D.J. Pulling Back the Blue Curtain: A Pelagic Monitoring Program for the Blue Belt. Front. Mar. Sci. 2021, 8, 649123. [Google Scholar] [CrossRef]
- IUCN-CEM. The IUCN Red List of Ecosystems. Version 2022-1. IUCN/CEM, 2022. Available online: http://iucnrle.org (accessed on 10 August 2022).
- Ward, T.J. Barriers to biodiversity conservation in marine fishery certification. Fish Fish. 2008, 9, 169–177. [Google Scholar] [CrossRef]
- Marselis, S.M.; Keil, P.; Chase, J.M.; Dubayah, R. The use of GEDI canopy structure for explaining variation in tree species richness in natural forests. Environ. Res. Lett. 2022, 17, 045003. [Google Scholar] [CrossRef]
- Petrou, Z.I.; Manakos, I.; Stathaki, T. Remote sensing for biodiversity monitoring: A review of methods for biodiversity indicator extraction and assessment of progress towards international targets. Biodivers. Conserv. 2015, 24, 2333–2363. [Google Scholar] [CrossRef]
- Proença, V.; Martin, L.J.; Pereira, H.M.; Fernandez, M.; McRae, L.; Belnap, J.; Böhm, M.; Brummitt, N.; García-Moreno, J.; Gregory, R.D.; et al. Global biodiversity monitoring: From data sources to essential biodiversity variables. Biol. Conserv. 2017, 213, 256–263. [Google Scholar] [CrossRef]
- Mairota, P.; Cafarelli, B.; Didham, R.K.; Lovergine, F.P.; Lucas, R.M.; Nagendra, H.; Rocchini, D.; Tarantino, C. Challenges and opportunities in harnessing satellite remote-sensing for biodiversity monitoring. Ecol. Inform. 2015, 30, 207–214. [Google Scholar] [CrossRef]
- Tewksbury, J.J.; Anderson, J.G.; Bakker, J.D.; Billo, T.J.; Dunwiddie, P.W.; Groom, M.J.; Hampton, S.E.; Herman, S.G.; Levey, D.J.; Machnicki, N.J.; et al. Natural history’s place in science and society. BioScience 2014, 64, 300–310. [Google Scholar] [CrossRef]
- Giangrande, A. Biodiversity, conservation, and the ‘Taxonomic impediment’. Aquat. Conserv. Mar. Freshw. Ecosyst. 2003, 13, 451–459. [Google Scholar] [CrossRef]
- Engel, M.S.; Ceríaco, L.M.; Daniel, G.M.; Dellapé, P.M.; Löbl, I.; Marinov, M.; Reis, R.E.; Young, M.T.; Dubois, A.; Agarwal, I.; et al. The taxonomic impediment: A shortage of taxonomists, not the lack of technical approaches. Zool. J. Linn. Soc. 2021, 193, 381–387. [Google Scholar] [CrossRef]
- Cavender-Bares, J.; Gamon, J.A.; Townsend, P.A. Remote Sensing of Plant Biodiversity; Springer Nature: Berlin/Heidelberg, Germany, 2020; p. 581. [Google Scholar]
- iNaturalist. Available online: https://www.inaturalist.org/ (accessed on 10 August 2022).
- Pecl, G.T.; Stuart-Smith, J.; Walsh, P.; Bray, D.J.; Kusetic, M.; Burgess, M.; Frusher, S.D.; Gledhill, D.C.; George, O.; Jackson, G.; et al. Redmap Australia: Challenges and successes with a large-scale citizen science-based approach to ecological monitoring and community engagement on climate change. Front. Mar. Sci. 2019, 6, 349. [Google Scholar] [CrossRef]
- Chadès, I.; McDonald-Madden, E.; McCarthy, M.A.; Wintle, B.; Linkie, M.; Possingham, H.P. When to stop managing or surveying cryptic threatened species. Proc. Natl. Acad. Sci. USA 2008, 105, 13936–13940. [Google Scholar] [CrossRef]
- Kennedy, S.; Fuchs, M.; van Ingen, W.; Schoenmaker, D. A resilience approach to corporate biodiversity impact measurement. Bus. Strategy Environ. 2022. [Google Scholar] [CrossRef]
- Bingham, H.; Weatherdon, L.; Despot-Belmonte, K.; Wetzel, F.; Martin, C. The biodiversity informatics landscape: Elements, connections and opportunities. Res. Ideas Outcomes 2017, 3, e14059. [Google Scholar] [CrossRef]
- Han, X.; Smyth, R.L.; Young, B.E.; Brooks, T.M.; Sánchez de Lozada, A.; Bubb, P.; Butchart, S.H.; Larsen, F.W.; Hamilton, H.; Hansen, M.C.; et al. A biodiversity indicators dashboard: Addressing challenges to monitoring progress towards the Aichi biodiversity targets using disaggregated global data. PLoS ONE 2014, 9, e112046. [Google Scholar] [CrossRef] [Green Version]
- UN Environment. Global Environment Outlook—GEO-6: Healthy Planet, Healthy People; UNEP: Nairobi, Kenya, 2019. [Google Scholar] [CrossRef]
- Cazalis, V.; Di Marco, M.; Butchart, S.H.; Akçakaya, H.R.; González-Suárez, M.; Meyer, C.; Clausnitzer, V.; Böhm, M.; Zizka, A.; Cardoso, P.; et al. Bridging the research-implementation gap in IUCN Red List assessments. Trends Ecol. Evol. 2022, 37, 359–370. [Google Scholar] [CrossRef] [PubMed]
- McNie, E.C. Reconciling the supply of scientific information with user demands: An analysis of the problem and review of the literature. Environ. Sci. Policy 2007, 10, 17–38. [Google Scholar] [CrossRef]
- Vanhove, M.P.; Rochette, A.J.; de Bisthoven, L.J. Joining science and policy in capacity development for monitoring progress towards the Aichi Biodiversity Targets in the global South. Ecol. Indic. 2017, 73, 694–697. [Google Scholar] [CrossRef]
- Wilkinson, M.D.; Dumontier, M.; Aalbersberg, I.J.; Appleton, G.; Axton, M.; Baak, A.; Blomberg, N.; Boiten, J.W.; da Silva Santos, L.B.; Bourne, P.E.; et al. The FAIR Guiding Principles for scientific data management and stewardship. Sci. Data 2016, 3, 160018. [Google Scholar] [CrossRef]
- Stephenson, P.J.; Stengel, C. An inventory of biodiversity data sources for conservation monitoring. PLoS ONE 2020, 15, e0242923. [Google Scholar] [CrossRef]
- Ferreira, C.C.; Stephenson, P.J.; Gill, M.; Regan, E.C. Biodiversity Monitoring and the Role of Scientists in the Twenty-first Century. In Closing the Knowledge-Implementation Gap in Conservation Science; Springer: Cham, Switzerland, 2021; pp. 25–50. [Google Scholar]
- Global Reporting Initiative (GRI). GRI 304: Biodiversity 2016; GRI: Amsterdam, The Netherlands, 2018. [Google Scholar]
- iCare Product Biodiversity Footprint. Available online: http://www.productbiodiversityfootprint.com/ (accessed on 4 August 2022).
- Sobkowiak, M. The making of imperfect indicators for biodiversity: A case study of UK biodiversity performance measurement. Bus. Strategy Environ. 2022. [Google Scholar] [CrossRef]
- Brownlie, S.; von Hase, A.; Botha, M.; Manuel, J.; Balmforth, Z.; Jenner, N. Biodiversity offsets in South Africa–challenges and potential solutions. Impact Assess. Proj. Apprais. 2017, 35, 248–256. [Google Scholar] [CrossRef]
- Nyiawung, R.A.; Raj, A.; Foley, P. Marine Stewardship Council sustainability certification in developing countries: Certifiability and beyond in Kerala, India and the Gambia, West Africa. Mar. Policy 2021, 129, 104526. [Google Scholar] [CrossRef]
- Yevide, A.S.; Wu, B.; Khan, A.S.; Zeng, Y.; Liu, J. Bibliometric analysis of ecosystem monitoring-related research in Africa: Implications for ecological stewardship and scientific collaboration. Int. J. Sustain. Dev. World Ecol. 2016, 23, 412–422. [Google Scholar] [CrossRef]
- Cresswell, W. The continuing lack of ornithological research capacity in almost all of West Africa. Ostrich 2018, 89, 123–129. [Google Scholar] [CrossRef]
- IPBES. Summary for Policymakers of the Regional Assessment Report on Biodiversity and Ecosystem Services for Europe and Central Asia of the Intergovernmental Science-Policy Platform on Biodiversity and Ecosystem Services; IPBES Secretariat: Bonn, Germany, 2018. [Google Scholar]
- Martin, L.J.; Blossey, B.; Ellis, E. Mapping where ecologists work: Biases in the global distribution of terrestrial ecological observations. Front. Ecol. Environ. 2012, 10, 195–201. [Google Scholar] [CrossRef]
- Thapa, I.; Butchart, S.H.; Gurung, H.; Stattersfield, A.J.; Thomas, D.H.; Birch, J.C. Using information on ecosystem services in Nepal to inform biodiversity conservation and local to national decision-making. Oryx 2016, 50, 147–155. [Google Scholar] [CrossRef]
- Thomsen, P.F.; Willerslev, E. Environmental DNA—An emerging tool in conservation for monitoring past and present biodiversity. Biol. Conserv. 2015, 183, 4–18. [Google Scholar] [CrossRef]
- NZEPA. Wai Tuwhero o te Taiao—Open Waters Aotearoa. Available online: https://www.epa.govt.nz/community-involvement/open-waters-aotearoa/ (accessed on 10 August 2022).
- Staehr, P.A.; Dahl, K.; Buur, H.; Göke, C.; Sapkota, R.; Winding, A.; Panova, M.; Obst, M.; Sundberg, P. Environmental DNA monitoring of biodiversity hotspots in Danish marine waters. Front. Mar. Sci. 2022, 8, 800474. [Google Scholar] [CrossRef]
- Taberlet, P.; Bonin, A.; Zinger, L.; Coissac, E. Environmental DNA: For Biodiversity Research and Monitoring; Oxford University Press: Oxford, UK, 2018. [Google Scholar] [CrossRef]
- Nordstrom, B.; Mitchell, N.; Byrne, M.; Jarman, S. A review of applications of environmental DNA for reptile conservation and management. Ecol. Evol. 2022, 12, e8995. [Google Scholar] [CrossRef]
- McElroy, M.E.; Dressler, T.L.; Titcomb, G.C.; Wilson, E.A.; Deiner, K.; Dudley, T.L.; Eliason, E.J.; Evans, N.T.; Gaines, S.D.; Lafferty, K.D.; et al. Calibrating environmental DNA metabarcoding to conventional surveys for measuring fish species richness. Front. Ecol. Evol. 2020, 8, 276. [Google Scholar] [CrossRef]
- Hoffmann, C.; Schubert, G.; Calvignac-Spencer, S. Aquatic biodiversity assessment for the lazy. Mol. Ecol. 2016, 25, 846–848. [Google Scholar] [CrossRef]
- Schenekar, T. The current state of eDNA research in freshwater ecosystems: Are we shifting from the developmental phase to standard application in biomonitoring? Hydrobiologia 2022, 1–20. [Google Scholar] [CrossRef]
- Huerlimann, R.; Cooper, M.K.; Edmunds, R.C.; Villacorta-Rath, C.; Le Port, A.; Robson, H.L.; Strugnell, J.M.; Burrows, D.; Jerry, D.R. Enhancing tropical conservation and ecology research with aquatic environmental DNA methods: An introduction for non-environmental DNA specialists. Anim. Conserv. 2020, 23, 632–645. [Google Scholar] [CrossRef]
- CBD. Report of the Open-Ended Working Group on The Post-2020 Global Biodiversity Framework on Its Third Meeting (Part I). In Proceedings of the CBD/WG2020/3/5, Online, 23 August–3 September 2021. [Google Scholar]
- Wilhelm, T.A.; Sheppard, C.R.; Sheppard, A.L.; Gaymer, C.F.; Parks, J.; Wagner, D.; Lewis, N.A. Large marine protected areas–advantages and challenges of going big. Aquat. Conserv. Mar. Freshw. Ecosyst. 2014, 24, 24–30. [Google Scholar] [CrossRef]
- Wagner, D. (Ed.) Big Ocean—A shared research agenda for Large-Scale Marine Protected Areas. In Prepared by Big Ocean Planning Team in Collaboration with the Papahānaumokuākea Marine National Monument & UNESCO World Heritage Site (PMNM); NOAA Office of National Marine Sanctuaries: Silver Spring, MD, USA, 2013. [Google Scholar]
- Maxwell, S.M.; Ban, N.C.; Morgan, L.E. Pragmatic approaches for effective management of pelagic marine protected areas. Endanger. Species Res. 2014, 26, 59–74. [Google Scholar] [CrossRef]
- Secades, C.; O’Connor, B.; Brown, C.; Walpole, M. Earth observation for biodiversity monitoring: A review of current approaches and future opportunities for tracking progress towards the Aichi Biodiversity Targets. In CBD technical series No. 72.; Secretariat of the Convention on Biological Diversity: Montreal, QC, Canada, 2014. [Google Scholar]
- Turner, W.; Rondinini, C.; Pettorelli, N.; Mora, B.; Leidner, A.K.; Szantoi, Z.; Buchanan, G.; Dech, S.; Dwyer, J.; Herold, M.; et al. Free and open-access satellite data are key to biodiversity conservation. Biol. Conserv. 2015, 182, 173–176. [Google Scholar] [CrossRef]
- Bertzky, M.; Stoll-Kleemann, S. Multi-level discrepancies with sharing data on protected areas: What we have and what we need for the global village. J. Environ. Manag. 2009, 90, 8–24. [Google Scholar] [CrossRef]
- Tenopir, C.; Allard, S.; Douglass, K.; Aydinoglu, A.U.; Wu, L.; Read, E.; Manoff, M.; Frame, M. Data sharing by scientists: Practices and perceptions. PLoS ONE 2011, 6, e21101. [Google Scholar] [CrossRef]
- Roy, D.P.; Ju, J.; Mbow, C.; Frost, P.; Loveland, T. Accessing free Landsat data via the Internet: Africa’s challenge. Remote Sens. Lett. 2010, 1, 111–117. [Google Scholar] [CrossRef]
- Beresford, A.E.; Eshiamwata, G.W.; Donald, P.F.; Balmford, A.; Bertzky, B.; Brink, A.B.; Fishpool, L.D.; Mayaux, P.; Phalan, B.; Simonetti, D.; et al. Protection reduces loss of natural land-cover at sites of conservation importance across Africa. PLoS ONE 2013, 8, e65370. [Google Scholar] [CrossRef]
- Waeber, P.O.; Wilmé, L.; Mercier, J.R.; Camara, C.; Lowry, P.P. How effective have thirty years of internationally driven conservation and development efforts been in Madagascar? PLoS ONE 2016, 11, e0161115. [Google Scholar] [CrossRef]
- Hickish, R.; Hodgetts, T.; Johnson, P.J.; Sillero-Zubiri, C.; Tockner, K.; Macdonald, D.W. Effects of publication bias on conservation planning. Conserv. Biol. 2019, 33, 1151–1163. [Google Scholar] [CrossRef] [PubMed] [Green Version]
- Thompson, K.L.; Lantz, T.; Ban, N. A review of Indigenous knowledge and participation in environmental monitoring. Ecol. Soc. 2020, 25, 10. [Google Scholar] [CrossRef]
- Ens, E.; Reyes-García, V.; Asselin, H.; Hsu, M.; Reimerson, E.; Reihana, K.; Sithole, B.; Shen, X.; Cavanagh, V.; Adams, M. Recognition of Indigenous Ecological Knowledge Systems in Conservation and Their Role to Narrow the Knowledge-Implementation Gap. In Closing the Knowledge-Implementation Gap in Conservation Science; Ferreira, C.C., Klütsch, C.F.C., Eds.; Springer: New York, NY, USA, 2021; pp. 109–139. [Google Scholar]
- Hoffman, A.J. Business education as if people and the planet really matter. Strateg. Organ. 2021, 19, 513–525. [Google Scholar] [CrossRef]
- Roos, J. The renaissance we need in business education. Harv. Bus. Rev. 2014, 2, 1–3. [Google Scholar]
- Pick, J.B. (Ed.) Geographic Information Systems in Business; IGI Global: Hershey, PA, USA, 2005. [Google Scholar]
- Meeks, W.L.; Dasgupta, S. Geospatial information utility: An estimation of the relevance of geospatial information to users. Decision Support Systems 2004, 38, 47–63. [Google Scholar] [CrossRef]
- Stem, C.; Margoluis, R.; Salafsky, N.; Brown, M. Monitoring and evaluation in conservation: A review of trends and approaches. Conserv. Biol. 2005, 19, 295–309. [Google Scholar] [CrossRef]
- Lindenmayer, D.B.; Likens, G.E. Adaptive monitoring: A new paradigm for long-term research and monitoring. Trends Ecol. Evol. 2009, 24, 482–486. [Google Scholar] [CrossRef]
- Stephenson, P.J.; Ntiamoa-Baidu, Y. Conservation planning for a widespread, threatened species: WWF and the African elephant Loxodonta africana. Oryx 2010, 44, 194–204. [Google Scholar] [CrossRef]
- Sutherland, W.J.; Adams, W.M.; Aronson, R.B.; Aveling, R.; Blackburn, T.M.; Broad, S.; Ceballos, G.; Côté, I.M.; Cowling, R.M.; Da Fonseca, G.A.; et al. One hundred questions of importance to the conservation of global biological diversity. Conserv. Biol. 2009, 23, 557–567. [Google Scholar] [CrossRef]
- Nichols, J.D.; Williams, B.K. Monitoring for conservation. Trends Ecol. Evol. 2006, 21, 668–673. [Google Scholar] [CrossRef]
- Gibbons, D.W.; Wilson, J.D.; Green, R.E. Using conservation science to solve conservation problems. J. Appl. Ecol. 2011, 48, 505–508. [Google Scholar] [CrossRef]
- Walpole, M.; Almond, R.E.; Besançon, C.; Butchart, S.H.; Campbell-Lendrum, D.; Carr, G.M.; Collen, B.; Collette, L.; Davidson, N.C.; Dulloo, E.; et al. Tracking progress toward the 2010 biodiversity target and beyond. Science 2009, 325, 1503–1504. [Google Scholar] [CrossRef] [PubMed]
- Redford, K.; Taber, A. Writing the wrongs: Developing a safe-fail culture in conservation. Conserv. Biol. 2000, 14, 1567–1568. [Google Scholar]
- Dickson, I.; Butchart, S.H.; Catalano, A.; Gibbons, D.; Jones, J.P.; Lee-Brooks, K.; Oldfield, T.; Noble, D.; Paterson, S.; Roy, S.; et al. Introducing a common taxonomy to support learning from failure in conservation. Conserv. Biol. 2022. [Google Scholar] [CrossRef]
- Stephenson, P.J. A Review of Biodiversity Data Needs and Monitoring Protocols for the Offshore Wind Energy Sector in the Baltic Sea and North Sea; Renewables Grid Initiative: Berlin, Germany, 2021. [Google Scholar]
- Overbeek, G.; Harms, B.; Van den Burg, S. Biodiversity and the corporate social responsibility agenda. J. Sustain. Dev. 2013, 6, 1–11. [Google Scholar] [CrossRef]
- Wagner, M. Business, biodiversity and ecosystem services: Evidence from large-scale survey data. Bus. Strategy Environ. 2022. [Google Scholar] [CrossRef]
- Bubb, P.; Chenery, A.; Herkenrath, P.; Kapos, V.; Mapendembe, A.; Walpole, M. National Indicators, Monitoring and Reporting for the Strategic Plan for Biodiversity 2011–2020: A Review of Experience and Recommendations in Support of the CBD ad hoc Technical Expert Group (AHTEG) on Indicators for the Strategic Plan 2011–2020; UNEP-WCMC: Cambridge, UK, 2011. [Google Scholar]
- Chapman, A.D. Numbers of Living Species in Australia and the World; Department of Environment, Water, Heritage and the Arts: Parkes, Australia, 2009.
- Pauly, D.; Zeller, D. Catch reconstructions reveal that global marine fisheries catches are higher than reported and declining. Nat. Commun. 2016, 7, 10244. [Google Scholar] [CrossRef]
- Ika. Indonesia Belum Miliki Indeks Biodiversitas Nasional [Indonesia Does Not Yet Have a National Biodiversity Index]. Yogyakarta: Universitas Gadjah Mada; [updated 2020 Nov 24; cited 2022 July 28]. Available online: https://www.ugm.ac.id/id/berita/20405-indonesia-belum-miliki-indeks-biodiversitas-nasional (accessed on 15 August 2022). (In Indonesian).
- Assidiq, H.; Al Mukarramah, N.H.; Bachril, S.N. Threats to the sustainability of biodiversity in Indonesia by the utilization of forest areas for national strategic projects: A normative review. In IOP Conference Series: Earth and Environmental Science; IOP Publishing: Bristol, UK, 2021; Volume 886, p. 012071. [Google Scholar]
- Nurwadjedi, N.; Hartini, S.; Rosalina, L. Developing one map of national marine resources of Indonesia. IOP Conf. Ser. Earth Environ. Sci. 2018, 162, 012028. [Google Scholar] [CrossRef]
- Ika. KOBI-WWF Indonesia Susun Protokol Data Indeks Biodiversitas Indonesia [KOBI-WWF Indonesia Develops Data Protocol for Indonesia’s Biodiversity Index] [Internet]. Yogyakarta: Universitas Gadjah Mada; [updated 2021 Nov 02; cited 2022 Jul 28]. Available online: https://www.ugm.ac.id/id/berita/21892-kobi-wwf-indonesia-susun-protokol-data-indeks-biodiversitas-indonesia (accessed on 15 August 2022). (In Indonesian).
- Haque, F.; Jones, M.J. European firms’ corporate biodiversity disclosures and board gender diversity from 2002–2016. Br. Account. Rev. 2020, 52, 100893. [Google Scholar] [CrossRef]
- Carvajal, M.; Nadeem, M.; Zaman, R. Biodiversity disclosure, sustainable development and environmental initiatives: Does board gender diversity matter? Bus. Strategy Environ. 2022, 31, 969–987. [Google Scholar] [CrossRef]
- Addison, P.F.E.; Bull, J.W.; Milner-Gulland, E.J. Using conservation science to advance corporate biodiversity accountability. Conserv. Biol. 2019, 33, 307–318. [Google Scholar] [CrossRef] [PubMed]
- ESA. EO Training & Education. Available online: https://eo4society.esa.int/training-education/ (accessed on 10 August 2022).
- NASA. Applied Remote Sensing Training Program—ARSET. Available online: https://appliedsciences.nasa.gov/what-we-do/capacity-building/arset (accessed on 10 August 2022).
- Dong, R.; Tang, M.; Zhou, K.; Li, S.; Wu, G. Study on the modified quadrat sampling method for urban ecosystem network monitoring. Int. J. Sustain. Dev. World Ecol. 2013, 20, 210–215. [Google Scholar] [CrossRef]
- Brazel, A.J.; Heisler, G.M. Climatology at Urban Long-Term Ecological Research Sites: Baltimore Ecosystem Study and Central Arizona–Phoenix. Geogr. Compass 2009, 3, 22–44. [Google Scholar] [CrossRef]
- Schmeller, D.S.; Böhm, M.; Arvanitidis, C.; Barber-Meyer, S.; Brummitt, N.; Chandler, M.; Chatzinikolaou, E.; Costello, M.J.; Ding, H.; García-Moreno, J.; et al. Building capacity in biodiversity monitoring at the global scale. Biodivers. Conserv. 2017, 26, 2765–2790. [Google Scholar] [CrossRef]
- Gazzo, A. Why Biodiversity May Be More Important to Your Business than You Realize. Available online: https://www.ey.com/en_gl/assurance/why-biodiversity-may-be-more-important-to-your-business-than-you-realize (accessed on 1 August 2022).
- Duffy, J.E.; Amaral-Zettler, L.A.; Fautin, D.G.; Paulay, G.; Rynearson, T.A.; Sosik, H.M.; Stachowicz, J.J. Envisioning a marine biodiversity observation network. Bioscience 2013, 63, 350–361. [Google Scholar] [CrossRef]
- Wetzel, F.T.; Saarenmaa, H.; Regan, E.; Martin, C.S.; Mergen, P.; Smirnova, L.; Tuama, É.Ó.; García Camacho, F.A.; Hoffmann, A.; Vohland, K.; et al. The roles and contributions of Biodiversity Observation Networks (BONs) in better tracking progress to 2020 biodiversity targets: A European case study. Biodiversity 2015, 16, 137–149. [Google Scholar] [CrossRef]
- Schmeller, D.S.; Arvanitidis, C.; Böhm, M.; Brummitt, N.; Chatzinikolaou, E.; Costello, M.J.; Ding, H.; Gill, M.J.; Haase, P.; Julliard, R.; et al. Case studies of capacity building for biodiversity monitoring. In The GEO Handbook on Biodiversity Observation Networks; Springer: Cham, Switzerland, 2017; pp. 309–326. [Google Scholar]
- NBSAP Forum. Available online: https://nbsapforum.net/forum (accessed on 1 August 2022).
- GBIF. Establishing an Effective GBIF Participant Node: Concepts and General Considerations. GBIF Secretariat: Copenhagen, Denmark, 2015. Available online: http://www.gbif.org/resources/9035 (accessed on 2 August 2022).
- BIOTA CANARIES. Available online: https://www.biodiversidadcanarias.es/biota/ (accessed on 10 August 2022).
- Borges, P.A.; Gabriel, R.; Arroz, A.M.; Costa, A.N.; Cunha, R.T.; Silva, L.; Mendonca, E.; Martins, A.M.; Reis, F.; Cardoso, P. The Azorean Biodiversity Portal: An internet database for regional biodiversity outreach. Syst. Biodivers. 2010, 8, 423–434. [Google Scholar] [CrossRef]
- Wotton, S.R.; Eaton, M.A.; Sheehan, D.; Munyekenye, F.B.; Burfield, I.J.; Butchart, S.H.; Moleofi, K.; Nalwanga-Wabwire, D.; Pomeroy, D.; Senyatso, K.J.; et al. Developing biodiversity indicators for African birds. Oryx 2020, 54, 62–73. [Google Scholar] [CrossRef]
- Feng, X.; Mi, X.; Xiao, Z.; Cao, L.; Wu, H.; Ma, K. Overview of Chinese Biodiversity Observation Network (SinoBON). Bull. Chin. Acad. Sci. 2019, 34, 6. (In Chinese) [Google Scholar] [CrossRef]
- Stephenson, P.J.; Soarimalala, V.; Goodman, S.M.; Nicoll, M.E.; Andrianjakarivelo, V.; Everson, K.M.; Hoffmann, M.; Jenkins, P.D.; Olson, L.E.; Raheriarisena, M.; et al. Review of the status and conservation of tenrecs (Mammalia: Afrotheria: Tenrecidae). Oryx 2021, 55, 13–22. [Google Scholar] [CrossRef]
- Scotson, L.; Johnston, L.R.; Iannarilli, F.; Wearn, O.R.; Mohd-Azlan, J.; Wong, W.M.; Gray, T.N.; Dinata, Y.; Suzuki, A.; Willard, C.E.; et al. Best practices and software for the management and sharing of camera trap data for small and large scales studies. Remote Sens. Ecol. Conserv. 2017, 3, 158–172. [Google Scholar] [CrossRef]
- Williams, K.S.; Pitman, R.T.; Mann, G.K.; Whittington-Jones, G.; Comley, J.; Williams, S.T.; Hill, R.A.; Balme, G.A.; Parker, D.M. Utilizing bycatch camera-trap data for broad-scale occupancy and conservation: A case study of the brown hyaena Parahyaena brunnea. Oryx 2021, 55, 216–226. [Google Scholar] [CrossRef]
- Kennerley, R.J.; Lacher, T.E., Jr.; Mason, V.; McCay, S.; Roach, N.; Stephenson, P.J.; Superina, M.; Young, R.P. Conservation priorities and actions for the Orders Cingulata, Pilosa, Afrosoricida, Macroscelidea, Eulipotyphla, Dermoptera and Scandentia. In Handbook of the Mammals of the World; Wilson, D.E., Mittermeier, R.A., Eds.; Insectivores, Sloths and Colugos; Lynx Edicions: Barcelona, Spain, 2018; Volume 8, pp. 15–27. [Google Scholar]
- Shokri, M.R.; Gladstone, W.; Jelbart, J. The effectiveness of seahorses and pipefish (Pisces: Syngnathidae) as a flagship group to evaluate the conservation value of estuarine seagrass beds. Aquat. Conserv. Mar. Freshw. Ecosyst. 2009, 19, 588–595. [Google Scholar] [CrossRef]
- Borges, P.A.; Rigal, F.; Ros-Prieto, A.; Cardoso, P. Increase of insular exotic arthropod diversity is a fundamental dimension of the current biodiversity crisis. Insect Conserv. Divers. 2020, 13, 508–518. [Google Scholar] [CrossRef]
- Ferrante, M.; Lamelas-López, L.; Nunes, R.; Monjardino, P.; Lopes, D.J.H.; Soares, A.O.; Lövei, G.L.; Borges, P.A.V. A simultaneous assessment of multiple ecosystem services and disservices in vineyards and orchards on Terceira Island, Azores. Agric. Ecosyst. Environ. 2022, 330, 107909. [Google Scholar] [CrossRef]
- Srivathsan, A.; Lee, L.; Katoh, K.; Hartop, E.; Kutty, S.N.; Wong, J.; Yeo, D.; Meier, R. ONTbarcoder and MinION barcodes aid biodiversity discovery and identification by everyone, for everyone. BMC Biol. 2021, 19, 217. [Google Scholar] [CrossRef]
- Mora, C.; Tittensor, D.P.; Adl, S.; Simpson, A.G.B.; Worm, B. How many species are there on Earth and in the ocean? PLoS Biol. 2011, 9, e1001127. [Google Scholar] [CrossRef]
- Pimm, S.L.; Joppa, L.N. How many plant species are there, where are they, and at what rate are they going extinct? Ann. Mo. Bot. Gard. 2015, 100, 170–176. [Google Scholar] [CrossRef]
- Wang, K.; Kirk, P.M.; Yao, Y.-J. Development trends in taxonomy, with special reference to fungi. J. Syst. Evol. 2020, 58, 406–412. [Google Scholar] [CrossRef]
- Borgelt, J.; Dorber, M.; Høiberg, M.A.; Verones, F. More than half of data deficient species predicted to be threatened by extinction. Commun. Biol. 2022, 5, 679. [Google Scholar] [CrossRef]
- Ruppert, K.M.; Kline, R.J.; Rahman, M.S. Past, present, and future perspectives of environmental DNA (eDNA) metabarcoding: A systematic review in methods, monitoring, and applications of global eDNA. Glob. Ecol. Conserv. 2019, 17, e00547. [Google Scholar] [CrossRef]
- Stephenson, P.J. Technological advances in biodiversity monitoring: Applicability, opportunities and challenges. Curr. Opin. Environ. Sustain. 2020, 45, 36–41. [Google Scholar] [CrossRef]
- Zwerts, J.A.; Stephenson, P.J.; Maisels, F.; Rowcliffe, M.; Astaras, C.; Jansen, P.A.; van Der Waarde, J.; Sterck, L.E.; Verweij, P.A.; Bruce, T.; et al. Methods for wildlife monitoring in tropical forests: Comparing human observations, camera traps, and passive acoustic sensors. Conserv. Sci. Pract. 2021, 3, e568. [Google Scholar] [CrossRef]
- Mas-Carrió, E.; Schneider, J.; Nasanbat, B.; Ravchig, S.; Buxton, M.; Nyamukondiwa, C.; Stoffel, C.; Augugliaro, C.; Ceacero, F.; Taberlet, P.; et al. Assessing environmental DNA metabarcoding and camera trap surveys as complementary tools for biomonitoring of remote desert water bodies. Environ. DNA 2022, 4, 580–595. [Google Scholar] [CrossRef]
- Sanguinetti, M.; Guidi, C.; Kulikovskiy, V.; Taiuti, M.G. Real-time continuous acoustic monitoring of marine mammals in the Mediterranean Sea. J. Mar. Sci. Eng. 2021, 9, 1389. [Google Scholar] [CrossRef]
- NOAA. Available online: https://www.fisheries.noaa.gov/alaska/marine-mammal-protection/passive-acoustic-monitoring-marine-mammals-alaska (accessed on 10 August 2022).
- IMOS. Integrated Marine Observing System. Available online: https://imos.org.au/ (accessed on 1 July 2022).
- Whytock, R.C.; Świeżewski, J.; Zwerts, J.A.; Bara-Słupski, T.; Koumba Pambo, A.F.; Rogala, M.; Bahaa-el-din, L.; Boekee, K.; Brittain, S.; Cardoso, A.W.; et al. Robust ecological analysis of camera trap data labelled by a machine learning model. Methods Ecol. Evol. 2021, 12, 1080–1092. [Google Scholar] [CrossRef]
- Villon, S.; Mouillot, D.; Chaumont, M.; Darling, E.S.; Subsol, G.; Claverie, T.; Villéger, S. A deep learning method for accurate and fast identification of coral reef fishes in underwater images. Ecol. Inform. 2018, 48, 238–244. [Google Scholar] [CrossRef]
- ReefCloud. Available online: https://reefcloud.ai/ (accessed on 5 August 2022).
- Falzon, G.; Lawson, C.; Cheung, K.W.; Vernes, K.; Ballard, G.A.; Fleming, P.J.; Glen, A.S.; Milne, H.; Mather-Zardain, A.; Meek, P.D. ClassifyMe: A field-scouting software for the identification of wildlife in camera trap images. Animals 2020, 10, 58. [Google Scholar] [CrossRef]
- Rovero, F.; Kays, R. Camera trapping for conservation. In Conservation Technology; Wich, S.A., Piel, A.K., Eds.; Oxford University Press: Oxford, UK, 2021; pp. 79–101. [Google Scholar]
- Xing, D.; Yang, J.; Jin, J.; Luo, X. Potential of plant identification apps in urban forestry studies in China: Comparison of recognition accuracy and user experience of five apps. J. For. Res. 2021, 32, 1889–1897. [Google Scholar] [CrossRef]
- Van Klink, R.; August, T.; Bas, Y.; Bodesheim, P.; Bonn, A.; Fossøy, F.; Høye, T.T.; Jongejans, E.; Menz, M.H.; Miraldo, A.; et al. Emerging technologies revolutionise insect ecology and monitoring. Trends Ecol. Evol. 2022, 37, 872–885. [Google Scholar] [CrossRef]
- Nespresso. When is Birdsong the Sound of Sustainability? Available online: https://www.sustainability.nespresso.com/birdsong-sound-of-sustainability (accessed on 10 August 2022).
- IOGP. Environmental Genomics Research Joint Industry Programme. Available online: https://www.iogp-edna.org/about-us (accessed on 15 July 2022).
- Alexander, J.B.; Marnane, M.J.; Elsdon, T.S.; Bunce, M.; Songploy, S.; Sitaworawet, P.; Harvey, E.S. Complementary molecular and visual sampling of fish on oil and gas platforms provides superior biodiversity characterisation. Mar. Environ. Res. 2022, 179, 105692. [Google Scholar] [CrossRef] [PubMed]
- Connolly, R.M.; Jinks, K.I.; Shand, A.; Taylor, M.D.; Gaston, T.F.; Becker, A.; Jinks, E.L. Out of the shadows: Automatic fish detection from acoustic cameras. Aquat. Ecol. 2022, 1–2. [Google Scholar] [CrossRef]
- Unilever. Sustainable Sourcing. Forest Footprint Report: Aceh, Indonesia Case Study. 2021. Available online: https://www.unilever.com/files/92ui5egz/production/6967d544f6e440f5ab61102387b9ca13edb8993f.pdf (accessed on 20 July 2022).
- Stephenson, P.J. Monitoring should not be a barrier to conservation success: A response to Sanders et al. Oryx 2021, 55, 656. [Google Scholar] [CrossRef]
- Navarro, L.M.; Fernández, N.; Guerra, C.; Guralnick, R.; Kissling, W.D.; Londoño, M.C.; Muller-Karger, F.; Turak, E.; Balvanera, P.; Costello, M.J.; et al. Monitoring biodiversity change through effective global coordination. Curr. Opin. Environ. Sustain. 2017, 29, 158–169. [Google Scholar] [CrossRef]
- Muller-Karger, F.E.; Miloslavich, P.; Bax, N.J.; Simmons, S.; Costello, M.J.; Sousa Pinto, I.; Canonico, G.; Turner, W.; Gill, M.; Montes, E.; et al. Advancing marine biological observations and data requirements of the complementary essential ocean variables (EOVs) and essential biodiversity variables (EBVs) frameworks. Front. Mar. Sci. 2018, 5, 211. [Google Scholar] [CrossRef]
- Crees, J.J.; Collins, A.C.; Stephenson, P.J.; Meredith, H.M.; Young, R.P.; Howe, C.; Price, M.R.; Turvey, S.T. A comparative approach to assess drivers of success in mammalian conservation recovery programs. Conserv. Biol. 2016, 30, 694–705. [Google Scholar] [CrossRef]
- Conservation Measures Partnership. Open Standards for the Practice of Conservation. Version 4; CMP: Bethesda, MD, USA, 2020; Available online: https://conservationstandards.org/download-cs/#downloadcs (accessed on 20 July 2022).
- Detoeuf, D.; Wieland, M.; Wilkie, D. Guide2.0 to the Modified Basic Necessities Survey: Why and How to Conduct Digital-Based BNS in Conservation Landscapes; WCS: New York, NY, USA, 2018; Available online: https://global.wcs.org/Resources/Publications/Publications-Search-II/ctl/view/mid/13340/pubid/DMX3838500000.aspx (accessed on 20 July 2022).
- Grosh, M.; Glewwe, P. (Eds.) Designing Household Survey Questionnaires for Developing Countries; World Bank: Washington, DC, USA, 2000; Available online: https://openknowledge.worldbank.org/handle/10986/25338 (accessed on 20 July 2022).
- Danielsen, F.; Skutsch, M.; Burgess, N.D.; Jensen, P.M.; Andrianandrasana, H.; Karky, B.; Lewis, R.; Lovett, J.C.; Massao, J.; Ngaga, Y.; et al. At the heart of REDD+: A role for local people in monitoring forests? Conserv. Lett. 2011, 4, 158–167. [Google Scholar] [CrossRef]
- Mant, R.; Swan, S.; Bertzky, M.; Miles, L. Participatory Biodiversity Monitoring: Considerations for National REDD+ Programmes; UNEP-WCMC: Cambridge, UK; SNV REDD+: Ho Chi Minh City, Vietnam, 2013. [Google Scholar]
- Gilchrist, G.; Mallory, M.; Merkel, F. Can local ecological knowledge contribute to wildlife management? Case studies of migratory birds. Ecol. Soc. 2005, 10, 20. [Google Scholar] [CrossRef]
- Van der Hoeven, C.A.; de Boer, W.F.; Prins, H.H. Pooling local expert opinions for estimating mammal densities in tropical rainforests. J. Nat. Conserv. 2004, 12, 193–204. [Google Scholar] [CrossRef]
- Schewe, R.L.; Hoffman, D.; Witt, J.; Shoup, B.; Freeman, M. Citizen-science and participatory research as a means to improve stakeholder engagement in resource management: A case study of Vietnamese American Fishers on the US Gulf Coast. Environ. Manag. 2020, 65, 74–87. [Google Scholar] [CrossRef]
- Ahmad, A.; Gary, D.; Putra, W.; Sagita, N.; Adirahmanta, S.N.; Miller, A.E. Leveraging local knowledge to estimate wildlife densities in Bornean tropical rainforests. Wildl. Biol. 2021, 2021, 1–15. [Google Scholar] [CrossRef]
- Jones, J.P.; Collen, B.; Atkinson, G.; Baxter, P.W.; Bubb, P.; Illian, J.B.; Katzner, T.E.; Keane, A.; Loh, J.; Mcdonald-Madden, E.V.E.; et al. The why, what, and how of global biodiversity indicators beyond the 2010 target. Conserv. Biol. 2011, 25, 450–457. [Google Scholar] [CrossRef] [PubMed]
- MacKenzie, D.I.; Royle, J.A. Designing occupancy studies: General advice and allocating survey effort. J. Appl. Ecol. 2005, 42, 1105–1114. [Google Scholar] [CrossRef]
- Gertler, P.J.; Martinez, S.; Premand, P.; Rawlings, L.B.; Vermeersch, C.M. Impact Evaluation in Practice, 2nd ed.; The World Bank: Washington, DC, USA, 2016. [Google Scholar]
- Pynegar, E.; Gibbons, J.; Asquith, N.; Jones, J. What role should randomized control trials play in providing the evidence base for conservation? Oryx 2021, 55, 235–244. [Google Scholar] [CrossRef]
- Wauchope, H.S.; Amano, T.; Geldmann, J.; Johnston, A.; Simmons, B.I.; Sutherland, W.J.; Jones, J.P. Evaluating impact using time-series data. Trends Ecol. Evol. 2021, 36, 196–205. [Google Scholar] [CrossRef]
- USAID & Wildlife Conservation Society. Technical Manual 4: Household Surveys—A Tool for Conservation Design, Action and Monitoring. New York, NY, USA. 2007. Available online: http://s3.amazonaws.com/WCSResources/file_20110518_073650_Manual_HouseholdSurveys_CxUCh.pdf (accessed on 20 July 2022).
- Chavan, V.S.; Ingwersen, P. Towards a data publishing framework for primary biodiversity data: Challenges and potentials for the biodiversity informatics community. BMC Bioinform. 2009, 10, S2. [Google Scholar] [CrossRef]
- Thessen, A.E.; Patterson, D.J. Data issues in the life sciences. ZooKeys 2011, 150, 15–51. [Google Scholar] [CrossRef]
- Costello, M.J.; Michener, W.K.; Gahegan, M.; Zhang, Z.Q.; Bourne, P.E. Biodiversity data should be published, cited, and peer reviewed. Trends Ecol. Evol. 2013, 28, 454–461. [Google Scholar] [CrossRef]
- Costello, M.J. Motivating online publication of data. BioScience 2009, 59, 418–427. [Google Scholar] [CrossRef]
- Living Planet Index. Available online: https://www.livingplanetindex.org/home/index (accessed on 10 August 2022).
- GBIF—Global Biodiversity Information Facility. Available online: https://www.gbif.org/ (accessed on 1 August 2022).
- TurtleNet. Available online: https://apps.information.qld.gov.au/TurtleDistribution/ (accessed on 1 August 2022).
- Chavan, V.; Penev, L. The data paper: A mechanism to incentivize data publishing in biodiversity science. BMC Bioinform. 2011, 12, S2. [Google Scholar] [CrossRef]
- Chapman, A.; Belbin, L.; Zermoglio, P.; Wieczorek, J.; Morris, P.; Nicholls, M.; Rees, E.R.; Veiga, A.K.; Thompson, A.; Saraiva, A.M.; et al. Developing standards for improved data quality and for selecting fit for use biodiversity data. Biodivers. Inf. Sci. Stand. 2020, 4, e50889. [Google Scholar] [CrossRef]
- Moudry, V.; Devillers, R. Quality and usability challenges of global marine biodiversity databases: An example for marine mammal data. Ecol. Inform. 2020, 56, 101051. [Google Scholar] [CrossRef]
- Pensoft. Available online: https://bdj.pensoft.net/topical_collection/58/ (accessed on 5 August 2022).
- Schneider, A.; Friedl, M.A.; McIver, D.K.; Woodcock, C.E. Mapping urban areas by fusing multiple sources of coarse resolution remotely sensed data. Photogramm. Eng. Remote Sens. 2003, 69, 1377–1386. [Google Scholar] [CrossRef]
- Coastwatch. Available online: Coastwatch.noaa.gov (accessed on 5 August 2022).
- Kassahun, A.; Athanasiadis, I.N.; Rizzoli, A.E.; Krause, A.; Scholten, H.; Makowski, M.; Beulens, A.J. Towards a service-oriented e-infrastructure for multidisciplinary environmental research. In Proceedings of the 2010 International Congress on Environmental Modelling and Software Modelling for Environment’s Sake, Fifth Biennial Meeting, Ottawa, ON, Canada, 5–8 July 2010; p. S21-06. [Google Scholar]
- Sequeira, A.M.; O’Toole, M.; Keates, T.R.; McDonnell, L.H.; Braun, C.D.; Hoenner, X.; Jaine, F.R.; Jonsen, I.D.; Newman, P.; Pye, J.; et al. A standardisation framework for bio-logging data to advance ecological research and conservation. Methods Ecol. Evol. 2021, 12, 996–1007. [Google Scholar] [CrossRef]
- Zhu, Z.; Wulder, M.A.; Roy, D.P.; Woodcock, C.E.; Hansen, M.C.; Radeloff, V.C.; Healey, S.P.; Schaaf, C.; Hostert, P.; Strobl, P.; et al. Benefits of the free and open Landsat data policy. Remote Sens. Environ. 2019, 224, 382–385. [Google Scholar] [CrossRef]
- European Commission. H2020 Programme Guidelines on FAIR Data Management in Horizon 2020 EC Directorate-General for Research & Innovation. 2016. Available online: https://ec.europa.eu/research/participants/data/ref/h2020/grants_manual/hi/oa_pilot/h2020-hi-oa-data-mgt_en.pdf (accessed on 10 August 2022).
- Stall, S.; Yarmey, L.; Cutcher-Gershenfeld, J.; Hanson, B.; Lehnert, K.; Nosek, B.; Parsons, M.; Robinson, E.; Wyborn, L. Make scientific data FAIR. Nature 2019, 570, 27–29. [Google Scholar] [CrossRef]
- Juffe-Bignoli, D.; Brooks, T.M.; Butchart, S.H.; Jenkins, R.B.; Boe, K.; Hoffmann, M.; Angulo, A.; Bachman, S.; Böhm, M.; Brummitt, N.; et al. Assessing the cost of global biodiversity and conservation knowledge. PLoS ONE 2016, 11, e0160640. [Google Scholar] [CrossRef]
- Bennun, L.; Regan, E.C.; Bird, J.; van Bochove, J.W.; Katariya, V.; Livingstone, S.; Mitchell, R.; Savy, C.; Starkey, M.; Temple, H.; et al. The value of the IUCN Red List for business decision-making. Conserv. Lett. 2018, 11, e12353. [Google Scholar] [CrossRef]
- Dickson, I.M.; Butchart, S.H.M.; Dauncey, V.; Hughes, J.; Jefferson, R.; Merriman, J.C.; Munroe, R.; Pearce-Higgins, J.P.; Stephenson, P.J.; Sutherland, W.J.; et al. PRISM—Toolkit for Evaluating the Outcomes and Impacts of Small/Medium-Sized Conservation Projects, Version 1; Cambridge Conservation Initiative: Cambridge, UK, 2017; Available online: https://conservationstandards.org/wp-content/uploads/sites/3/2020/10/PRISM-Evaluation-Toolkit-V1.pdf (accessed on 1 August 2022).
- GCOS. Monitoring Principles. Available online: https://gcos.wmo.int/en/essential-climate-variables/about/gcos-monitoring-principles (accessed on 1 August 2022).
- Walters, M.; Scholes, R.J. The GEO Handbook on Biodiversity Observation Networks; Springer Nature: Cham, Switzerland, 2017. [Google Scholar]
- Sutherland, W.J. (Ed.) Ecological Census Techniques, 2nd ed.; Cambridge University Press: Cambridge, UK, 2006. [Google Scholar]
- Gitzen, R.A.; Millspaugh, J.J.; Cooper, A.B.; Licht, D.S. (Eds.) Design and Analysis of Long-Term Ecological Monitoring Studies; Cambridge University Press: Cambridge, UK, 2012. [Google Scholar]
- Mueller, G.M.; Bills, G.F.; Foster, M.S. Biodiversity of Fungi: Inventory and Monitoring Methods; Elsevier Academic Press: San Diego, CA, USA, 2004. [Google Scholar]
- Woodall, L.C.; Andradi-Brown, D.A.; Brierley, A.S.; Clark, M.R.; Connelly, D.; Hall, R.A.; Howell, K.L.; Huvenne, V.A.; Linse, K.; Ross, R.E.; et al. A multidisciplinary approach for generating globally consistent data on mesophotic, deep-pelagic, and bathyal biological communities. Oceanography 2018, 31, 76–89. [Google Scholar] [CrossRef]
- Bouchet, P.; Phillips, C.; Huang, Z.; Meeuwig, J.; Foster, S.; Przeslawski, R. Comparative Assessment of Pelagic Sampling Methods used in Marine Monitoring. Report to the National Environmental Science Programme, Marine Biodiversity Hub. 2018. Available online: https://pelagic-bruvs-field-manual.github.io/ (accessed on 20 July 2022).
- SMART. Available online: https://smartconservationtools.org/ (accessed on 10 August 2022).
- Capitals Coalition Natural Capital Protocol-Biodiversity Guidance & Navigation Tool. Available online: https://capitalscoalition.org/wp-content/uploads/2020/10/Biodiversity-Guidance_COMBINED_single-page.pdf (accessed on 10 August 2022).
- SBTN. Science-Based Targets for Nature Initial Guidance for Business. Science-Based Targets Network. 2020. Available online: https://sciencebasedtargetsnetwork.org/wp-content/uploads/2020/09/SBTN-initial-guidance-for-business.pdf (accessed on 15 July 2022).
- Endangered Wildlife Trust. The Biological Diversity Protocol (BD Protocol). National Biodiversity and Business Network—South Africa. 2020. Available online: https://www.nbbnbdp.org/uploads/1/3/1/4/131498886/biological_diversity_protocol__bd_protocol_.pdf (accessed on 20 July 2022).
- Stephenson, P.J.; Reidhead, W. Portfolio management: Measuring short and long-term results in WWF. In Project Management Best Practices: Achieving Global Excellence, 4th ed.; Kerzner, H.R., Ed.; Wiley & Sons: Hoboken, NJ, USA, 2018; pp. 535–538. [Google Scholar]
- Salafsky, N.; Boshoven, J.; Burivalova, Z.; Dubois, N.S.; Gomez, A.; Johnson, A.; Lee, A.; Margoluis, R.; Morrison, J.; Muir, M.; et al. Defining and using evidence in conservation practice. Conserv. Sci. Pract. 2019, 1, e27. [Google Scholar] [CrossRef]
- WWF Chile. Guide for Planning and Management of Marine Protected Areas with Participation of Local and/or Indigenous Communities Based on Conservation Standards. WWF-Chile: Valdivia, Chile, 2020. Available online: https://wwflac.awsassets.panda.org/downloads/guide_for_planning_and_managing.pdf (accessed on 15 July 2022).
- Salafsky, N.; Margoluis, R.A. Pathways to Success: Taking Conservation to Scale in Complex Systems; Island Press: Washington, DC, USA, 2021. [Google Scholar]
- Badalotti, A.; van Galen, L.; Vié, J.C.; Stephenson, P.J. Improving the monitoring of conservation programmes: Lessons from a grant-making initiative for threatened species. Oryx 2022, 56, 288–294. [Google Scholar] [CrossRef]
- Conservation Standards Resource Library. Available online: https://conservationstandards.org/resources/ (accessed on 2 August 2022).
- Conservation Evidence. Available online: https://www.conservationevidence.com/ (accessed on 2 August 2022).
- Environmental Evidence Library of Evidence Syntheses. Available online: https://environmentalevidence.org/completed-reviews/ (accessed on 1 August 2022).
- Tethys. WREN Knowledge Database. Available online: https://tethys.pnnl.gov/about-wren (accessed on 2 August 2022).
- Crown Estate. Marine Data Exchange. Available online: https://www.marinedataexchange.co.uk/ (accessed on 1 August 2022).
- McKinnon, M.C.; Cheng, S.H.; Dupre, S.; Edmond, J.; Garside, R.; Glew, L.; Holland, M.B.; Levine, E.; Masuda, Y.J.; Miller, D.C.; et al. What are the effects of nature conservation on human well-being? A systematic map of empirical evidence from developing countries. Environ. Evid. 2016, 5, 8. [Google Scholar] [CrossRef]
- Young, R.P.; Hudson, M.A.; Terry, A.M.R.; Jones, C.G.; Lewis, R.E.; Tatayah, V.; Zuël, N.; Butchart, S.H.M. Accounting for conservation: Using the IUCN Red List Index to evaluate the impact of a conservation organisation. Biol. Conserv. 2014, 180, 84–96. [Google Scholar] [CrossRef]
- IUCN SSC. Species Monitoring Specialist Group: Database of Biodiversity Data Sources for Conservation Monitoring. Available online: https://www.speciesmonitoring.org/data-sources.html (accessed on 2 August 2022).
- IUCN SSC. Species Monitoring Specialist Group: Global Database of Species Population Monitoring Schemes. Available online: https://www.speciesmonitoring.org/schemes.html (accessed on 2 August 2022).
- IUCN SSC. Species Monitoring Specialist Group: Monitoring Tools: A Selection of Manuals, Guidelines and Methods Reviews. Available online: https://www.speciesmonitoring.org/guidelines-and-tools.html (accessed on 2 August 2022).
- IUCN SSC. Conservation Planning Specialist Group: Science-Based Tools. Available online: https://www.cpsg.org/our-approach/science-based-tools (accessed on 2 August 2022).
- IUCN SSC. Marine Turtle Specialist Group: Research and Management Techniques. Available online: https://www.iucn-mtsg.org/techniques-manual-english (accessed on 2 August 2022).
- Kühl, H.; Maisels, F.; Ancrenaz, M.; Williamson, E.A. Best Practice Guidelines for Surveys and Monitoring of Great Ape Populations; IUCN SSC Primate Specialist Group: Gland, Switzerland, 2008. [Google Scholar]
- IUCN SSC. Seahorse, Pipefish & Seadragon Specialist Group. Available online: https://www.iucn-seahorse.org/ (accessed on 2 August 2022).
- TNFD. Nature-Related Risk & Opportunity Management and Disclosure Framework. Available online: https://framework.tnfd.global/ (accessed on 15 August 2022).
- Carvalho, S.H.C.D.; Cojoianu, T.; Ascui, F. From impacts to dependencies: A first global assessment of corporate biodiversity risk exposure and responses. Bus. Strategy Environ. 2022. [Google Scholar] [CrossRef]
- IPBES. The Assessment Report of the Intergovernmental Science-Policy Platform on Biodiversity and Ecosystem Services on Pollinators, Pollination and Food Production; Potts, S.G., Imperatriz-Fonseca, V.L., Ngo, H.T., Eds.; Secretariat of the Intergovernmental Science-Policy Platform on Biodiversity and Ecosystem Services: Bonn, Germany, 2016.
- Klein, A.M.; Steffan–Dewenter, I.; Tscharntke, T. Fruit set of highland coffee increases with the diversity of pollinating bees. Proc. R. Soc. Lond. Ser. B Biol. Sci. 2003, 270, 955–961. [Google Scholar] [CrossRef]
- Delmas, M.A.; Gergaud, O. Sustainable practices and product quality: Is there value in eco-label certification? The case of wine. Ecol. Econ. 2021, 183, 106953. [Google Scholar] [CrossRef]
- Van der Lugt, P.P.; van de Wijs, C.; Petrovics, D. Carrots & Sticks. Sustainability Reporting Policy: Global Trends in Disclosure as the ESG Agenda Goes Mainstream; Global Reporting Initiative (GRI): Amsterdam, Netherlands; University of Stellenbosch Business School: Cape Town, South Africa, 2020. [Google Scholar]
- Smith, T.; Holmes, G.; Paavola, J. Social Underpinnings of Ecological Knowledge: Business Perceptions of Biodiversity as Social Learning. Organ. Environ. 2020, 33, 175–194. [Google Scholar] [CrossRef]
- Arauco. Available online: https://www.arauco.cl/sostenibilidad/investigacion/ (accessed on 10 August 2022).
- Atkins, J.; Atkins, B.; Maroun, W.; Barone, E.; Gozman, D. Conservation through Conversation? Therapeutic Engagement on Biodiversity and Extinction between NGOs and Companies. Bus. Strategy Environ. 2021. [Google Scholar] [CrossRef]
- Puppim de Oliveira, J.A.; Mukhi, U.; Quental, C.; de Oliveira Cerqueira Fontes, P.J. Connecting businesses and biodiversity conservation through community organizing: The case of babassu breaker women in Brazil. Bus. Strategy Environ. 2022, 31, 2618–2634. [Google Scholar] [CrossRef]
- Act4Nature. Available online: http://www.act4nature.com/ (accessed on 10 August 2022).
- WBSCD. Forest Solutions Group. Available online: https://www.wbcsd.org/Sector-Projects/Forest-Solutions-Group (accessed on 10 August 2022).
- Roberts, L.; Hassan, A.; Elamer, A.; Nandy, M. Biodiversity and extinction accounting for sustainable development: A systematic literature review and future research directions. Bus. Strategy Environ. 2021, 30, 705–720. [Google Scholar] [CrossRef]
- Boiral, O. Accounting for the unaccountable: Biodiversity reporting and impression management. J. Bus. Ethics 2016, 135, 751–768. [Google Scholar] [CrossRef]
- Addison, P.F.E.; Stephenson, P.J.; Bull, J.W.; Carbone, G.; Burgman, M.; Burgass, M.J.; Gerber, L.R.; Howard, P.; McCormick, N.; McRae, L.; et al. Bringing sustainability to life: A framework to guide biodiversity indicator development for business performance management. Bus. Strategy Environ. 2020, 29, 3303–3313. [Google Scholar] [CrossRef]
- Braschler, B.; Mahood, K.; Karenyi, N.; Gaston, K.J.; Chown, S.L. Realizing a synergy between research and education: How participation in ant monitoring helps raise biodiversity awareness in a resource-poor country. J. Insect Conserv. 2010, 14, 19–30. [Google Scholar] [CrossRef]
- Schuttler, S.G.; Sears, R.S.; Orendain, I.; Khot, R.; Rubenstein, D.; Rubenstein, N.; Dunn, R.R.; Baird, E.; Kandros, K.; O’Brien, T.; et al. Citizen science in schools: Students collect valuable mammal data for science, conservation, and community engagement. Bioscience 2019, 69, 69–79. [Google Scholar] [CrossRef]
- Bonney, R.; Shirk, J.L.; Phillips, T.B.; Wiggins, A.; Ballard, H.L.; Miller-Rushing, A.J.; Parrish, J.K. Next steps for citizen science. Science 2014, 343, 1436–1437. [Google Scholar] [CrossRef]
- Kühl, H.S.; Bowler, D.E.; Bösch, L.; Bruelheide, H.; Dauber, J.; Eichenberg, D.; Eisenhauer, N.; Fernández, N.; Guerra, C.A.; Henle, K.; et al. Effective biodiversity monitoring needs a culture of integration. One Earth 2020, 3, 462–474. [Google Scholar] [CrossRef]
- Vianna, G.M.; Meekan, M.G.; Bornovski, T.H.; Meeuwig, J.J. Acoustic telemetry validates a citizen science approach for monitoring sharks on coral reefs. PLoS ONE 2014, 9, e95565. [Google Scholar] [CrossRef]
- Swanson, A.; Kosmala, M.; Lintott, C.; Simpson, R.; Smith, A.; Packer, C. Snapshot Serengeti, high-frequency annotated camera trap images of 40 mammalian species in an African savanna. Sci. Data 2015, 2, 150026. [Google Scholar] [CrossRef]
- Sugai, L.S.; Silva, T.S.; Ribeiro, J.W., Jr.; Llusia, D. Terrestrial passive acoustic monitoring: Review and perspectives. BioScience 2019, 69, 15–25. [Google Scholar] [CrossRef]
- Bohmann, K.; Evans, A.; Gilbert, M.T.P.; Carvalho, G.R.; Creer, S.; Knapp, M.; Douglas, W.Y.; De Bruyn, M. Environmental DNA for wildlife biology and biodiversity monitoring. Trends Ecol. Evol. 2014, 29, 358–367. [Google Scholar] [CrossRef]
- Janzen, D.H.; Hallwachs, W.; Jimenez, J.; Gámez, R. The role of the parataxonomists, inventory managers and taxonomists in Costa Rica’s national biodiversity inventory. In Biodiversity Prospecting; Reid, W.V., Laird, S.A., Eds.; World Resources Institute: Washington, DC, USA, 1993; pp. 223–254. [Google Scholar]
- Olsen, J.M.F. Sustainable development: A new challenge for Costa Rica. SAIS Rev. (1989–2003) 1996, 16, 187–202. [Google Scholar] [CrossRef]
- Campbell, L.M. Conservation narratives in Costa Rica: Conflict and co-existence. Dev. Chang. 2002, 33, 29–56. [Google Scholar] [CrossRef]
- Avalos, G. Still Searching the Rich Coast: Biodiversity of Costa Rica, Numbers, Processes, Patterns, and Challenges. In Global Biodiversity; Apple Academic Press: Palm Bay, FL, USA, 2018; pp. 101–135. [Google Scholar]
- Janzen, D.H.; Hallwachs, W. Joining inventory by parataxonomists with DNA barcoding of a large complex tropical conserved wildland in northwestern Costa Rica. PLoS ONE 2011, 6, e18123. [Google Scholar] [CrossRef] [PubMed] [Green Version]
- Pocock, M.J.; Roy, H.E.; August, T.; Kuria, A.; Barasa, F.; Bett, J.; Githiru, M.; Kairo, J.; Kimani, J.; Kinuthia, W.; et al. Developing the global potential of citizen science: Assessing opportunities that benefit people, society and the environment in East Africa. J. Appl. Ecol. 2019, 56, 274–281. [Google Scholar] [CrossRef]
- Department of Biodiversity, Conservation & Attractions. Monitoring: North West Shelf Flatback Turtle Conservation Program. Available online: https://flatbacks.dbca.wa.gov.au/program-activities/monitoring (accessed on 1 August 2022).
- Danielsen, F.; Jensen, A.E.; Alviola, P.A.; Balete, D.S.; Mendoza, M.; Tagtag, A.; Custodio, C.; Enghoff, M. Does monitoring matter? A quantitative assessment of management decisions from locally-based monitoring of protected areas. Biodivers. Conserv. 2005, 14, 2633–2652. [Google Scholar] [CrossRef]
- NeMO-Net. Available online: http://nemonet.info/ (accessed on 10 August 2022).
- Dicks, L.V.; Walsh, J.C.; Sutherland, W.J. Organising evidence for environmental management decisions: A ‘4S’hierarchy. Trends Ecol. Evol. 2014, 29, 607–613. [Google Scholar] [CrossRef] [PubMed]
- Mayne, J. Challenges and lessons in implementing results-based management. Evaluation 2007, 13, 87–109. [Google Scholar] [CrossRef]
- Kuhar, F.; Furci, G.; Drechsler-Santos, E.R.; Pfister, D.H. Delimitation of Funga as a valid term for the diversity of fungal communities: The Fauna, Flora & Funga proposal (FF&F). IMA Fungus 2018, 9, A71–A74. [Google Scholar]
- IUCN. IUCN SSC Acceptance of Fauna Flora Funga; IUCN: Gland, Switzerland, 2021. Available online: https://www.iucn.org/commissions/species-survivalcommission/about/ssc-committees/fungalconservation-committee (accessed on 15 July 2022).
- Oyanedel, R.; Hinsley, A.; Dentinger, B.T.; Milner-Gulland, E.J.; Furci, G. A way forward for wild fungi in international sustainability policy. Conserv. Lett. 2022, 15, e12882. [Google Scholar] [CrossRef]
- Brundrett, M.C. Understanding the roles of multifunctional mycorrhizal and endophytic fungi. In Microbial Root Endophytes; Springer: Berlin/Heidelberg, Germany, 2006; pp. 281–298. [Google Scholar]
- Suz, L.M.; Sarasan, V.; Wearn, J.A.; Bidartondo, M.I.; Hodkinson, T.R.; Kowal j Murphy, B.R.; Rodriguez, R.J.; Gange, A. Positive plant-fungal interactions. In State of the World’s Fungi; Willis, K.J., Ed.; Royal Botanic Gardens, Kew: Richmond, UK, 2018; pp. 32–39. [Google Scholar]
- Woinarski, J.C.; Burbidge, A.A.; Harrison, P.L. Ongoing unraveling of a continental fauna: Decline and extinction of Australian mammals since European settlement. Proc. Natl. Acad. Sci. USA 2015, 112, 4531–4540. [Google Scholar] [CrossRef]
- Nuske, S.J.; Vernes, K.; May, T.W.; Claridge, A.W.; Congdon, B.C.; Krockenberger, A.; Abell, S.E. Redundancy among mammalian fungal dispersers and the importance of declining specialists. Fungal Ecol. 2017, 27, 1–13. [Google Scholar] [CrossRef]
- Dundas, S.J.; Hopkins, A.J.; Ruthrof, K.X.; Tay, N.E.; Burgess, T.I.; Hardy, G.E.; Fleming, P.A. Digging mammals contribute to rhizosphere fungal community composition and seedling growth. Biodivers. Conserv. 2018, 27, 3071–3086. [Google Scholar] [CrossRef]
- Nuske, S.J.; Anslan, S.; Tedersoo, L.; Bonner, M.T.; Congdon, B.C.; Abell, S.E. The endangered northern bettong, Bettongia tropica, performs a unique and potentially irreplaceable dispersal function for ectomycorrhizal truffle fungi. Mol. Ecol. 2018, 27, 4960–4971. [Google Scholar] [CrossRef] [PubMed]
- Newman, D.J.; Cragg, G.M. Natural products as sources of new drugs over the nearly four decades from 01.1981 to 09/2019. J. Nat. Prod. 2020, 83, 770–803. [Google Scholar] [CrossRef] [Green Version]
- Pereira, H.M.; Belnap, J.; Brummitt, N.; Collen, B.; Ding, H.; Gonzalez-Espinosa, M.; Gregory, R.D.; Honrado, J.; Jongman, R.H.; Julliard, R.; et al. Global biodiversity monitoring. Front. Ecol. Environ. 2010, 8, 459–460. [Google Scholar] [CrossRef]
- ZSL. Edge of Existence Programme. Available online: https://www.edgeofexistence.org/ (accessed on 4 August 2022).
- McCook, L.J.; Ayling, T.; Cappo, M.; Choat, J.H.; Evans, R.D.; De Freitas, D.M.; Heupel, M.; Hughes, T.P.; Jones, G.P.; Mapstone, B.; et al. Adaptive management of the Great Barrier Reef: A globally significant demonstration of the benefits of networks of marine reserves. Proc. Natl. Acad. Sci. USA 2010, 107, 18278–18285. [Google Scholar] [CrossRef]
- Barley, S.C.; Meeuwig, J.J. The power and the pitfalls of large-scale, unreplicated natural experiments. Ecosystems 2017, 20, 331–339. [Google Scholar] [CrossRef]
- Visconti, P.; Butchart, S.H.; Brooks, T.M.; Langhammer, P.F.; Marnewick, D.; Vergara, S.; Yanosky, A.; Watson, J.E. Protected area targets post-2020. Science 2019, 364, 239–241. [Google Scholar] [CrossRef]
- Woodley, S.; Locke, H.; Laffoley, D.; MacKinnon, K.; Sandwith, T.; Smart, J. A review of evidence for area-based conservation targets for the post-2020 global biodiversity framework. Parks 2019, 25, 31–46. [Google Scholar] [CrossRef]
- Akçakaya, H.R.; Bennett, E.L.; Brooks, T.M.; Grace, M.K.; Heath, A.; Hedges, S.; Hilton-Taylor, C.; Hoffmann, M.; Keith, D.A.; Long, B.; et al. Quantifying species recovery and conservation success to develop an IUCN Green List of Species. Conserv. Biol. 2018, 32, 1128–1138. [Google Scholar] [CrossRef]
- Sanders, M.J.; Miller, L.; Bhagwat, S.A.; Rogers, A. Conservation conversations: A typology of barriers to conservation success. Oryx 2021, 55, 245–254. [Google Scholar] [CrossRef]
- IUCN. Global Standard for Nature-Based Solutions. A User-Friendly Framework for the Verification, Design and Scaling up of NbS, 1st ed.; IUCN: Gland, Switzerland, 2020.
- Tucker, G.; Bubb, P.; de Heer, M.; Miles, L.; Lawrence, A.; van Rijsoort, J.; Bajracharya, S.B.; Nepal, R.C.; Sherchan, R.; Chapagain, N.R. Guidelines for Biodiversity Assessment and Monitoring for Protected Areas; The King Mahendra Trust for Nature Conservation Nepal: Kathmandu, Nepal; UNEP-WCMC: Cambridge, UK, 2005. [Google Scholar]
- NORDECO & DENR. Biodiversity Monitoring System Manual for Protected Areas, 2nd ed.; DENR: Manila, Philippines; NORDECO: Copenhagen, Denmark, 2001.
- ICMBio. 2016. Available online: https://www.icmbio.gov.br/portal/monitoramento-2016/programas-de-monitoramento-da-biodiversidade-em-ucs (accessed on 4 August 2022).
- Van Swaay, C.; Regan, E.; Ling, M.; Bozhinovska, E.; Fernandez, M.; Marini-Filho, O.J.; Huertas, B.; Phon, C.K.; Korösi, A.; Meerman, J.; et al. Guidelines for standardised global butterfly monitoring. Group on Earth Observations Biodiversity Observation Network, Leipzig, Germany. GEO BON Tech. Ser. 2015, 1, 32. [Google Scholar]
- Ferrante, M.; Lo Cacciato, A.; Lövei, G.L. Quantifying predation pressure along an urbanisation gradient in Denmark using artificial caterpillars. Eur. J. Entomol. 2014, 111, 649–654. [Google Scholar] [CrossRef] [Green Version]
- Instant Wild. Available online: www.instantwild.zsl.org (accessed on 10 August 2022).


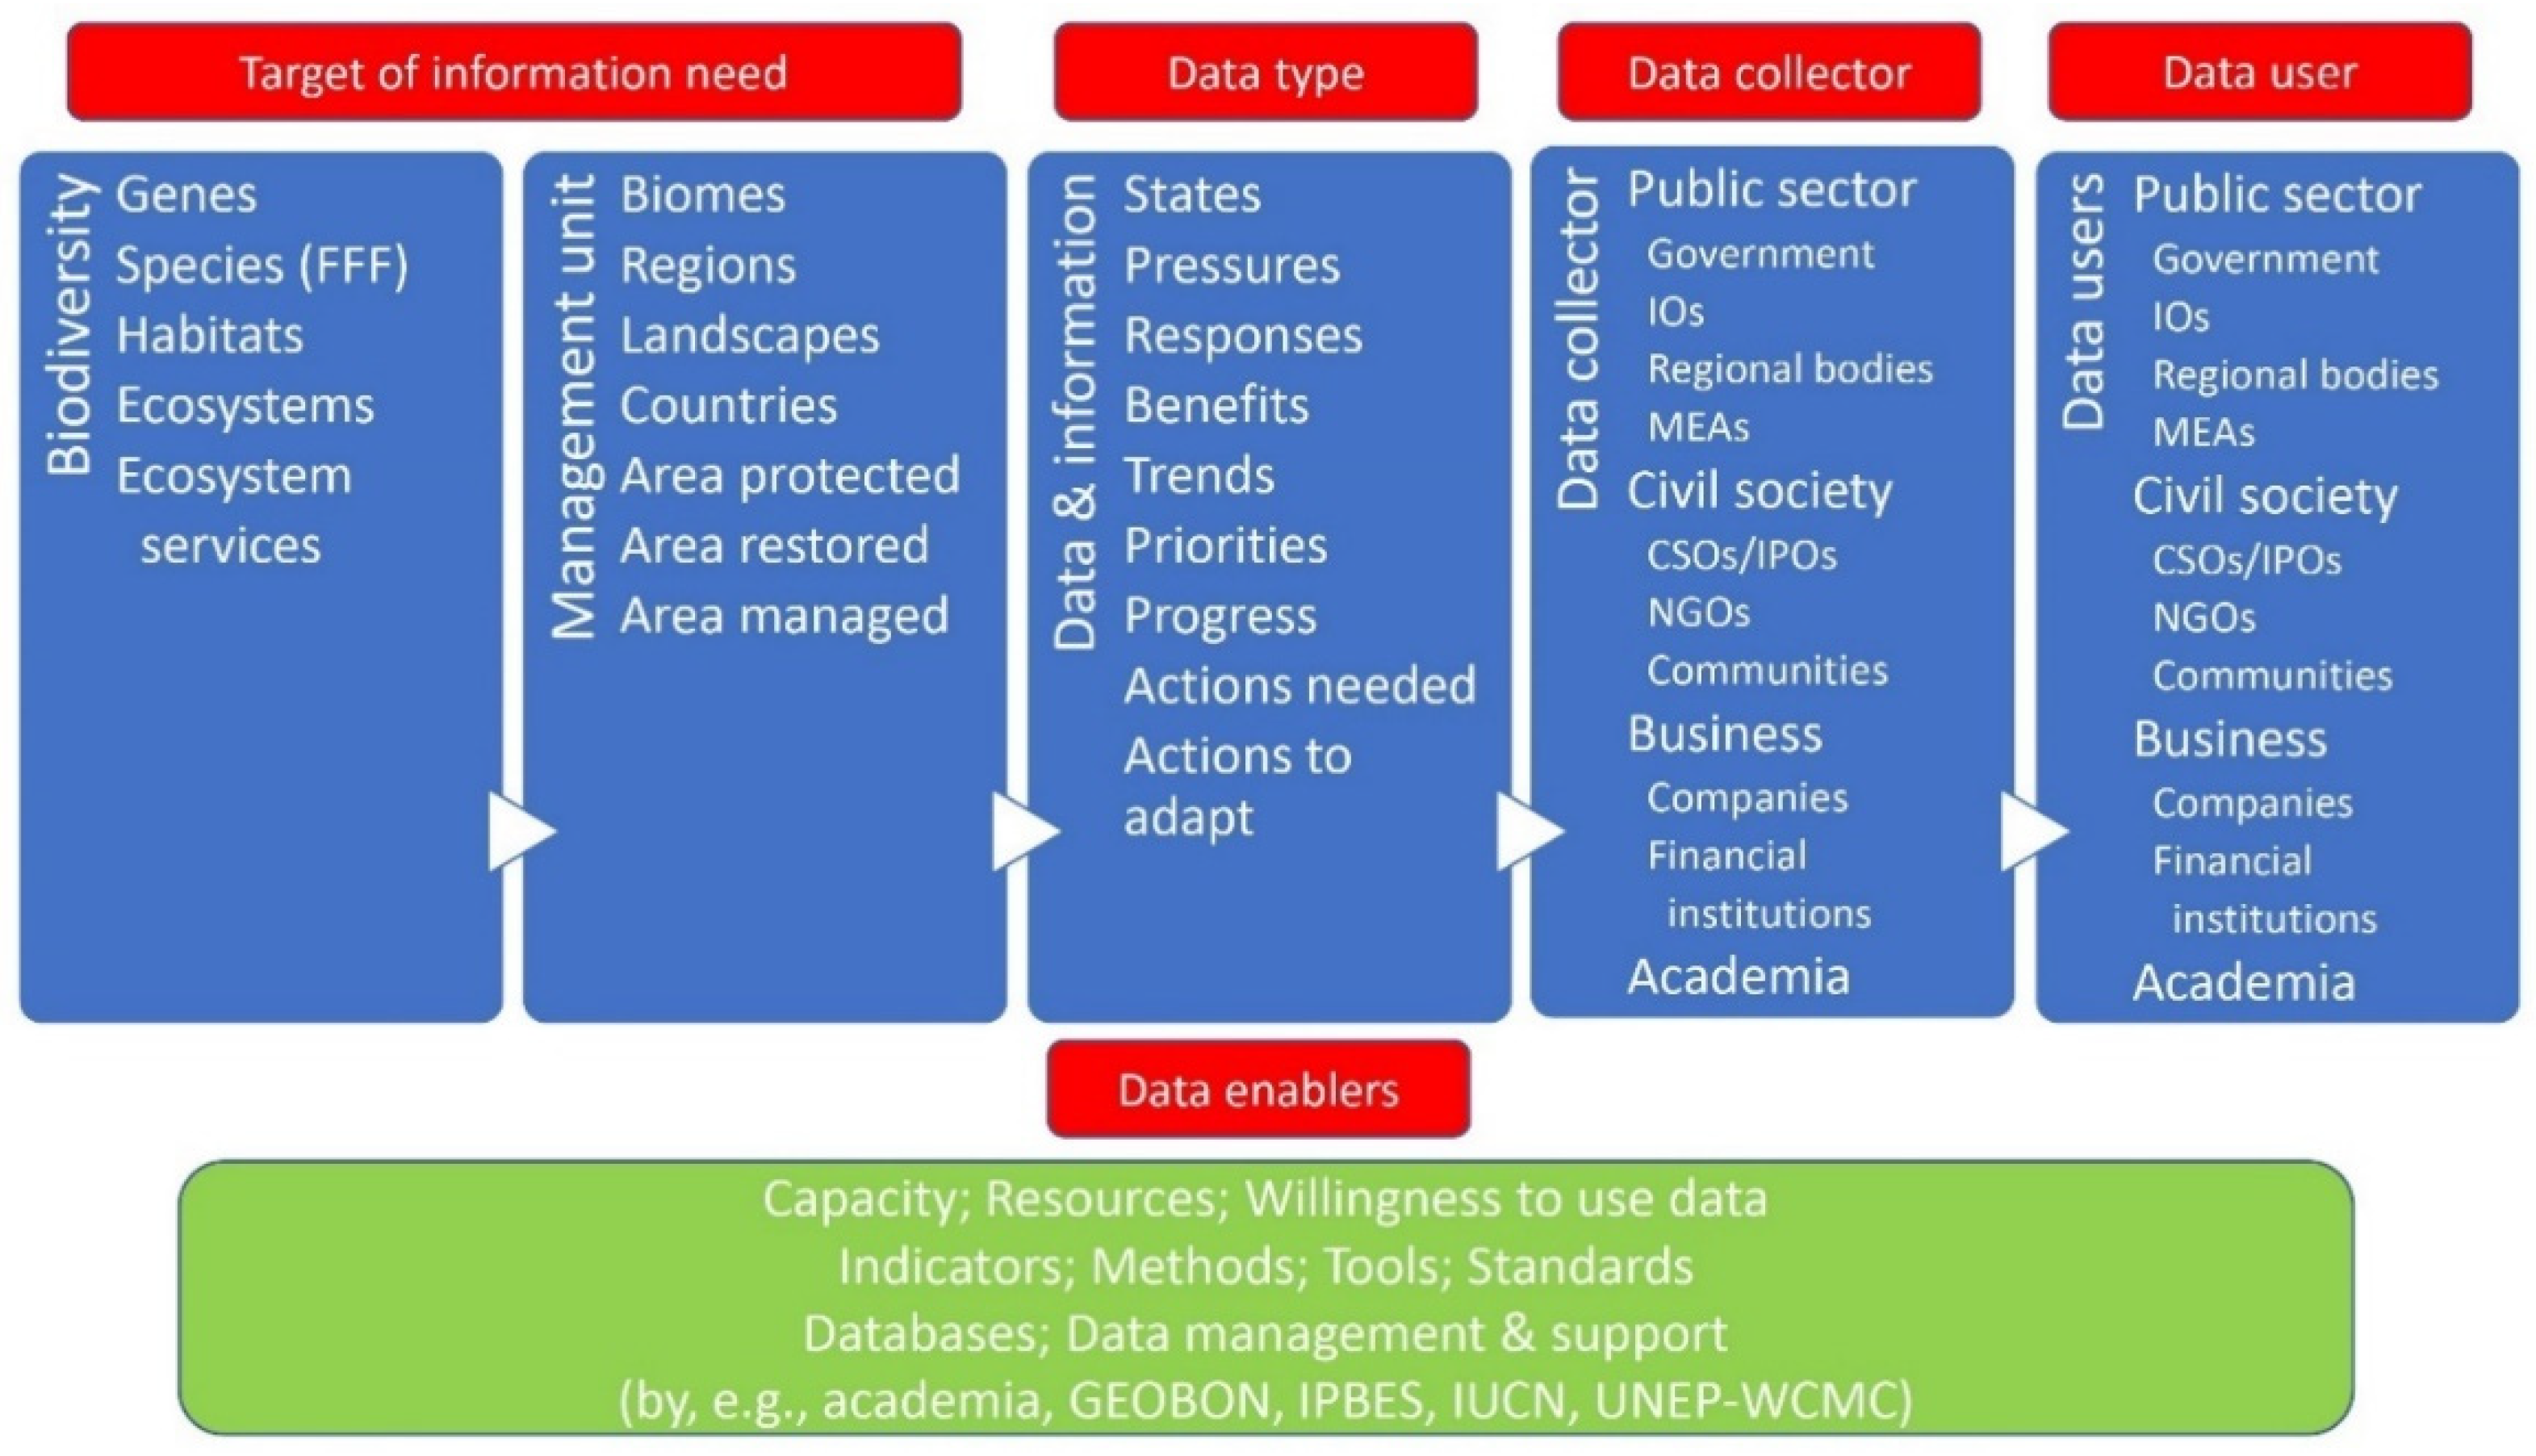
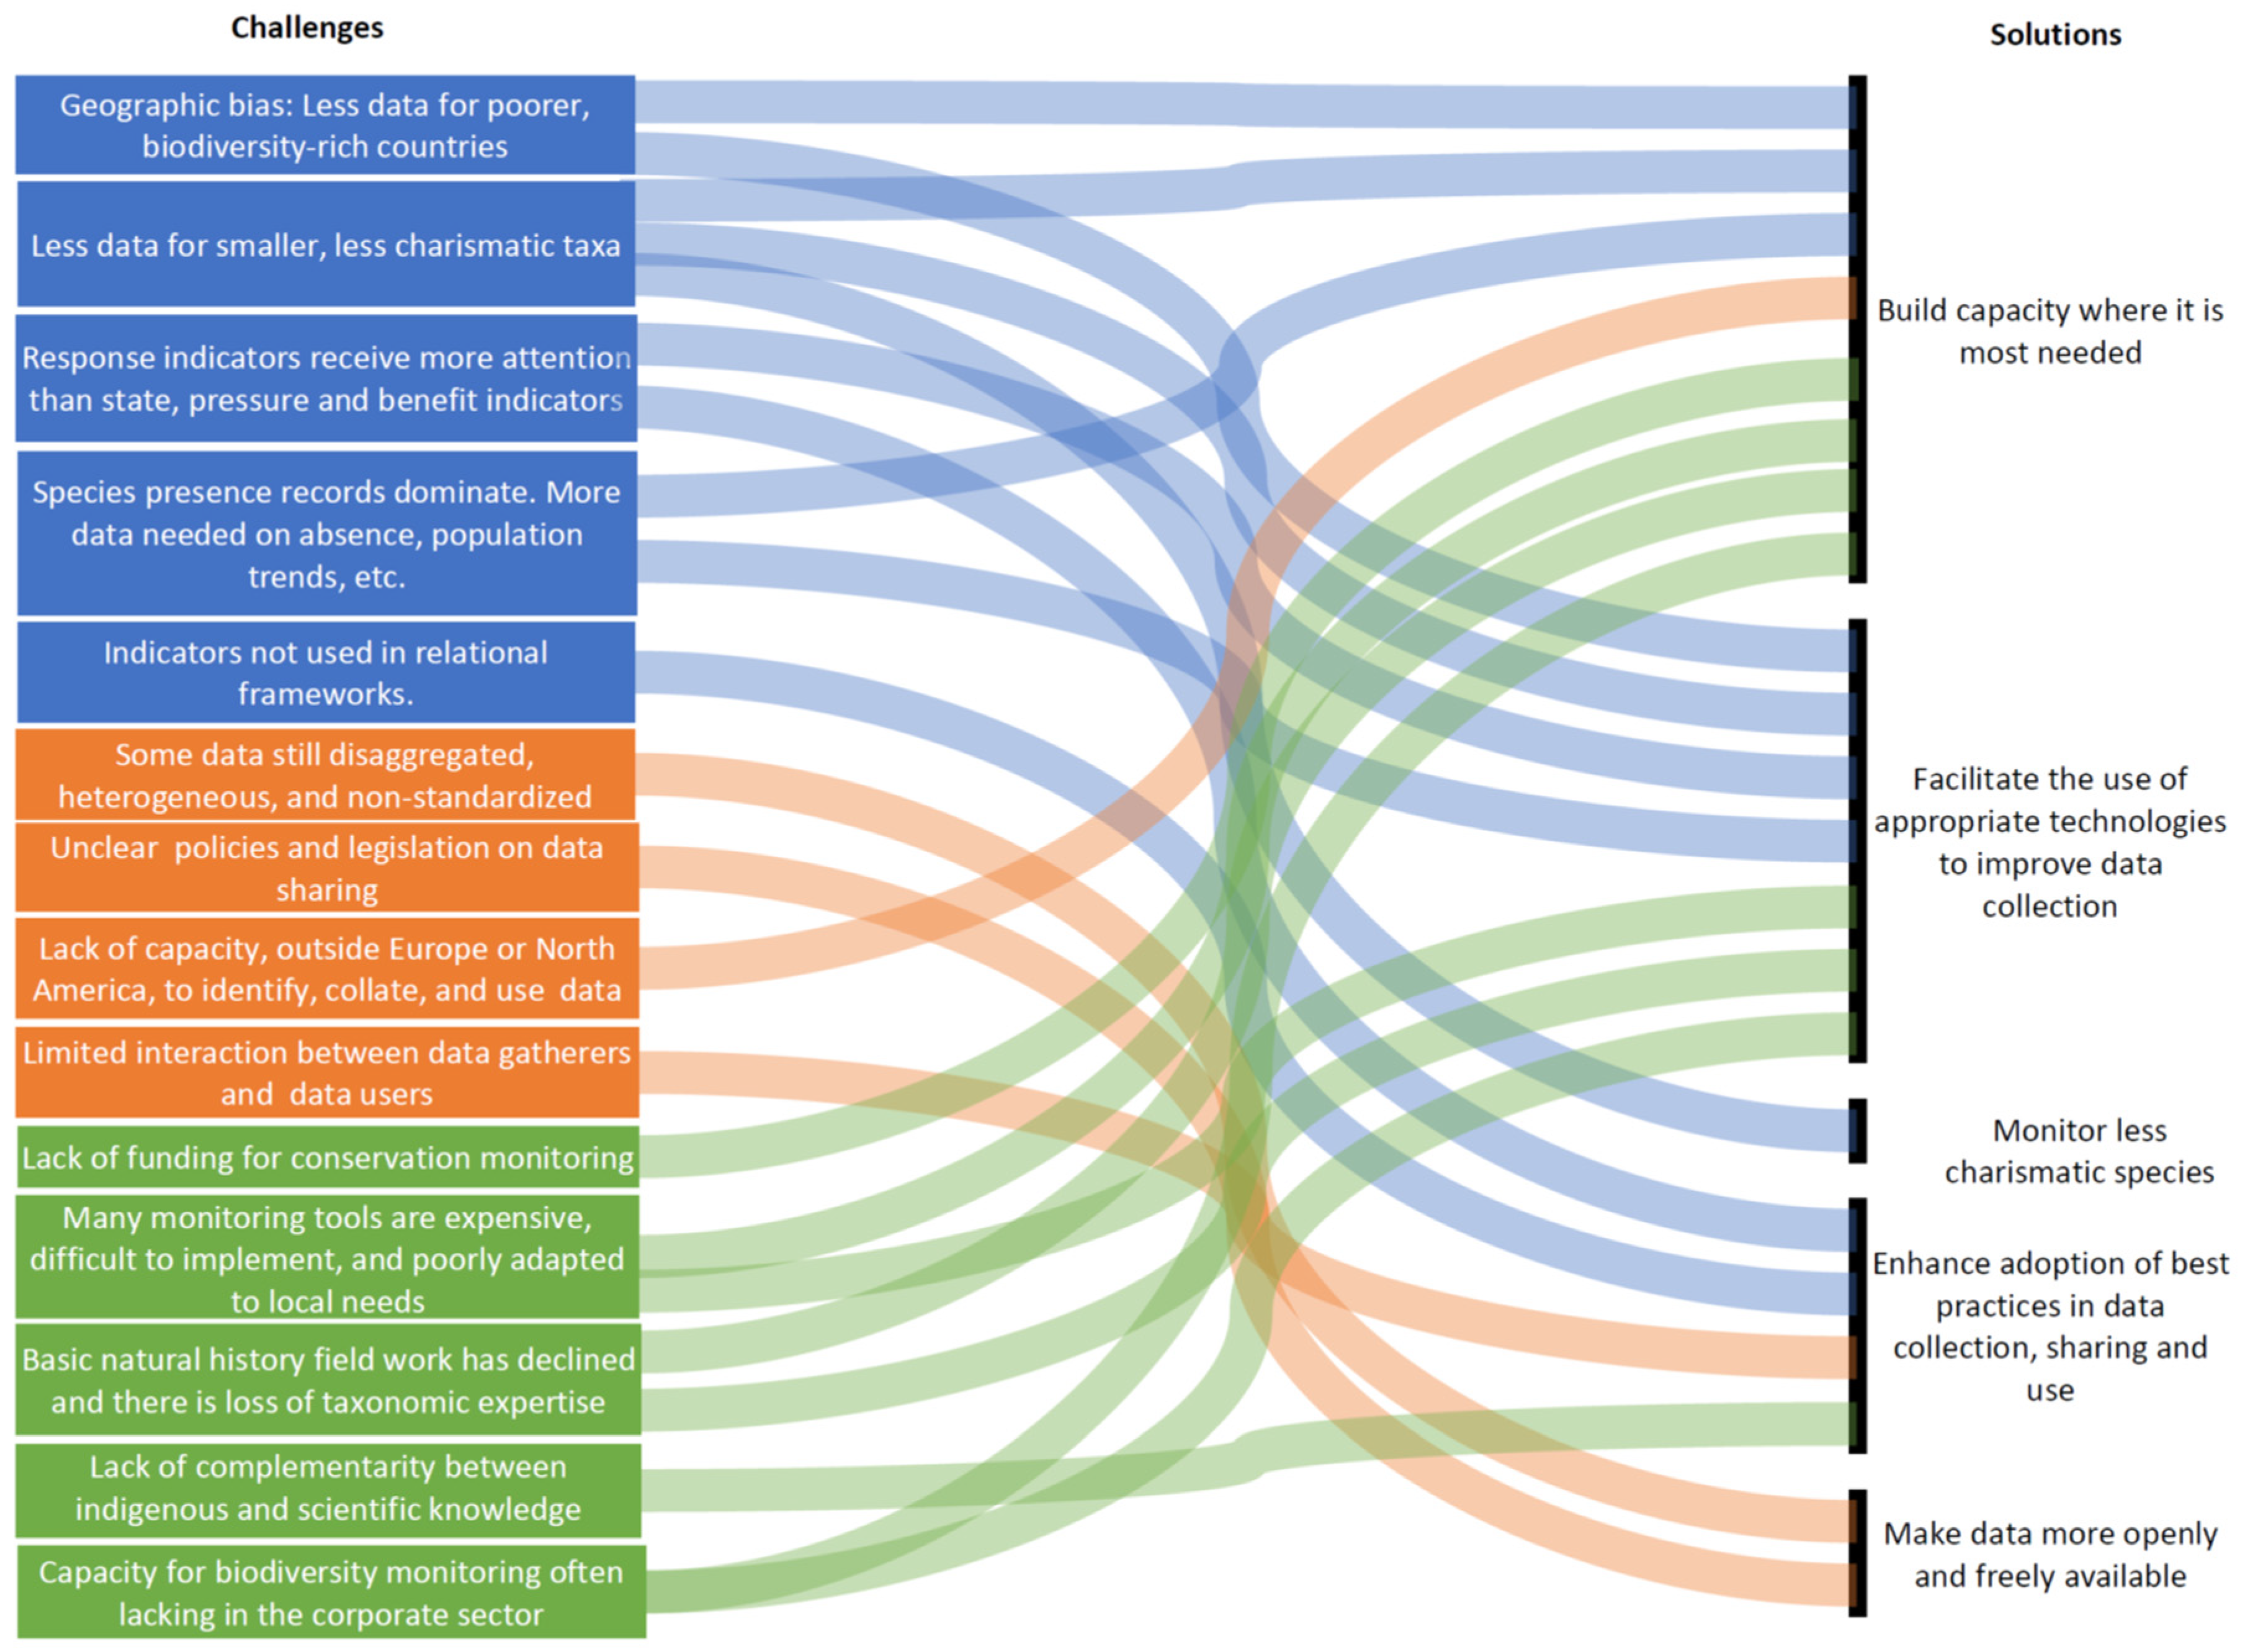
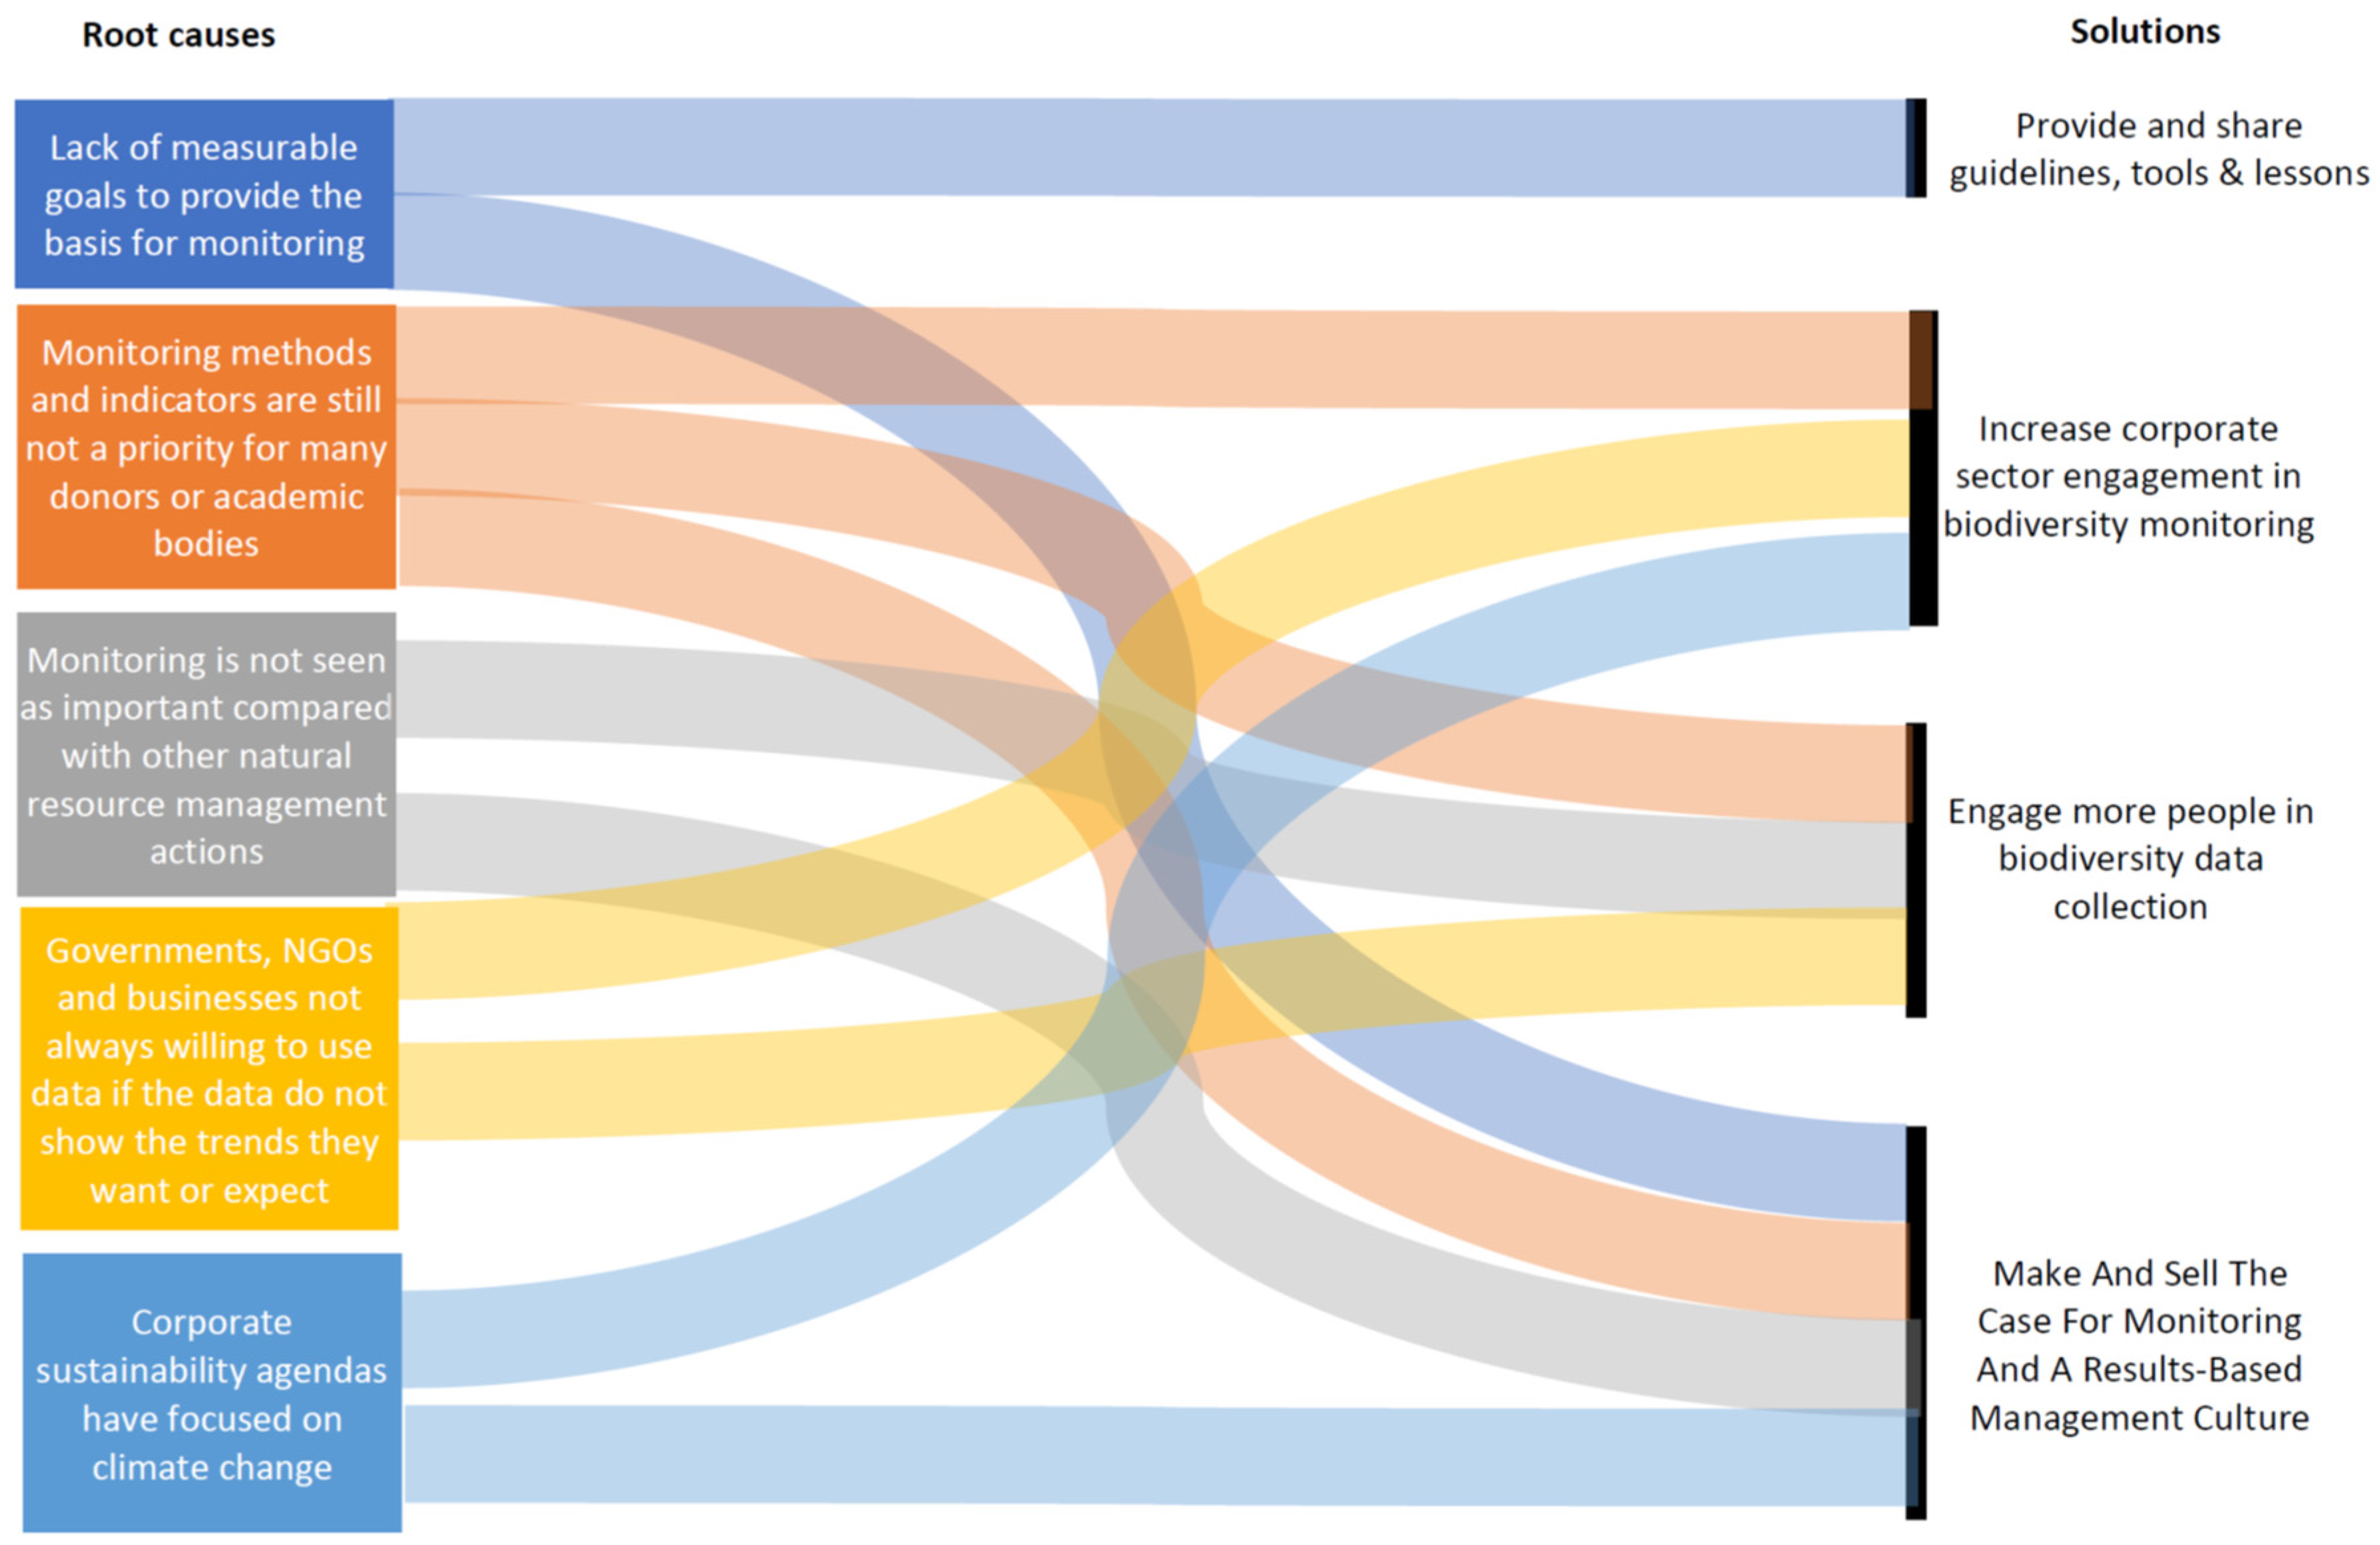
| Guideline/Tool | Lead Agency | Reference |
|---|---|---|
| Conservation Standards | Conservation Measures Partnership | CMP [250] 1 |
| PRISM–Toolkit for evaluating the outcomes and impacts of small/medium-sized conservation projects | Cambridge Conservation Initiative | Dickson et al. [285] |
| GCOS Monitoring Principles | GCOS–Global Climate Observing System | GCOS [286] |
| GEO Handbook on Biodiversity Observation Networks | GEOBON-Group on Earth Observations Biodiversity Observation Network | Walters & Scholes [287] |
| Ecological Census Techniques | University of Cambridge | Sutherland [288] |
| Design and Analysis of Long-Term Ecological Monitoring Studies | University of Cambridge | Gitzen & Millspaugh [289] |
| Fungi inventory and monitoring methods | Various | Mueller et al. [290] |
| General Ocean Survey and Sampling Iterative Protocol (GOSSIP) | Nekton and others | Woodall et al. [291] |
| NESP guidelines for BRUVS sampling | National Environmental Science Program-Australia | Bouchet et al. [292] |
| Spatial Monitoring and Reporting Tool (SMART) | SMART Partnership | SMART [293] |
| Guide2.0 to the Modified Basic Necessities Survey | Wildlife Conservation Society & USAID | Detoeuf et al. [251] |
| Natural Capital Protocol-Biodiversity Guidance & Navigation Tool | Capitals Coalition | Capitals Coalition [294] |
| Guidelines for Planning & Monitoring Corporate Biodiversity Performance | IUCN | Stephenson & Carbone [37] |
| Science-based Targets for Nature Initial Guidance for Business | Science-based Targets Network | SBTN [295] |
| Biological Diversity Protocol | Biodiversity Disclosure Project hosted by Endangered Wildlife Trust | Endangered Wildlife Trust [296] |
| Myth/Excuse | Reality |
|---|---|
| Monitoring wastes limited conservation resources | Monitoring in parallel with conservation efforts demonstrates what works and what needs changing, thereby ensuring conservation resources are not wasted on ineffective actions. |
| Available monitoring and data management methods are inadequate | There is an abundance of guidance on monitoring methods and tools to collect data (see the earlier sections of this paper). There are also comprehensive standard data management systems (e.g., Darwin Core; Ecological Metadata Language-EML) that facilitate pooling of data, as well as computer assisted algorithms and systems for data cleaning. |
| Impacts (changes in biodiversity state) are too difficult to measure | In small, short-term projects, outcomes measured by a change in pressure may be adequate, but most projects should be able to monitor changes in biodiversity state if an adequate proportion of the budget is set aside for data collection. |
| You cannot attribute your impact so why bother measuring it | Attribution should be considered “an aspiration not a hindrance” [2]. There are three main ways of dealing with it: you can provide evidence of the impact of your actions by demonstrating what happened where conservation was not applied (using counterfactuals); by relating your results to a theory of change you can show that what was expected to happen is happening, and make assumptions about the impact of your actions; if you look at similar projects applying similar strategies and demonstrating similar results, you can infer the impact of your actions. |
| Change does not happen fast enough to detect | Ensure monitoring systems are planned to take account of the questions asked and the time required. If the project lasts less than 3 years, monitoring may be better focused on outcomes and outputs. However, at least some change will be measurable in a project’s lifespan. |
| Long-term monitoring is too expensive | This does not need to be the case. There are more and more initiatives for frugal monitoring, especially using open access technology and data. Monitoring also does not have to cover everything at once-there is value in using an incremental approach when developing long-term monitoring, starting with the taxa of highest priority for data users. |
| Monitoring is not material to business | Without using appropriate measures for monitoring, businesses are missing key data to assess their materiality and impacts on nature. Partnerships and data sharing can help reduce costs and result in better materiality assessments. |
| Addressing climate change is more urgent than addressing biodiversity loss | Climate change and biodiversity loss are interlinked and mutually reinforcing; climate change causes species and habitat loss and species and habitat loss exacerbates climate change. Both processes threaten all life on Earth and the ecosystems services we all depend on. Therefore, they need to be tackled together and monitored. Nature-based solutions [368] are critical to fighting climate change. |
Publisher’s Note: MDPI stays neutral with regard to jurisdictional claims in published maps and institutional affiliations. |
© 2022 by the authors. Licensee MDPI, Basel, Switzerland. This article is an open access article distributed under the terms and conditions of the Creative Commons Attribution (CC BY) license (https://creativecommons.org/licenses/by/4.0/).
Share and Cite
Stephenson, P.J.; Londoño-Murcia, M.C.; Borges, P.A.V.; Claassens, L.; Frisch-Nwakanma, H.; Ling, N.; McMullan-Fisher, S.; Meeuwig, J.J.; Unter, K.M.M.; Walls, J.L.; et al. Measuring the Impact of Conservation: The Growing Importance of Monitoring Fauna, Flora and Funga. Diversity 2022, 14, 824. https://doi.org/10.3390/d14100824
Stephenson PJ, Londoño-Murcia MC, Borges PAV, Claassens L, Frisch-Nwakanma H, Ling N, McMullan-Fisher S, Meeuwig JJ, Unter KMM, Walls JL, et al. Measuring the Impact of Conservation: The Growing Importance of Monitoring Fauna, Flora and Funga. Diversity. 2022; 14(10):824. https://doi.org/10.3390/d14100824
Chicago/Turabian StyleStephenson, P. J., Maria Cecilia Londoño-Murcia, Paulo A. V. Borges, Louw Claassens, Heidrun Frisch-Nwakanma, Nicholas Ling, Sapphire McMullan-Fisher, Jessica J. Meeuwig, Kerrigan Marie Machado Unter, Judith L. Walls, and et al. 2022. "Measuring the Impact of Conservation: The Growing Importance of Monitoring Fauna, Flora and Funga" Diversity 14, no. 10: 824. https://doi.org/10.3390/d14100824