Article

Shedding Light on the Dark Ages: Sketching Potential Trade Relationships in Early Medieval Romania through Mitochondrial DNA Analysis of Sheep Remains

1
Doctoral School of Agricultural Engineering Sciences, University of Agricultural Sciences and Veterinary Medicine, 400372 Cluj-Napoca, Romania
2
Molecular Biology Center, Interdisciplinary Research Institute on Bio-Nano-Sciences, Babeș-Bolyai University, 400271 Cluj-Napoca, Romania
3
Department of Molecular Biology and Biotechnology, Faculty of Biology and Geology, Babeș-Bolyai University, 400006 Cluj-Napoca, Romania
4
Department of Chemistry, Babeș-Bolyai University, 11 Arany Janos Street, 400028 Cluj-Napoca, Romania
5
Department of Chemistry and Chemical Engineering, Hungarian Line of Study, Babeș-Bolyai University, 11 Arany János Street, 400028 Cluj-Napoca, Romania
6
Institute of Research-Development-Innovation in Applied Natural Sciences, Babeș-Bolyai University, Fantanele 30, 400294 Cluj-Napoca, Romania
7
Department of Applied Nuclear Physics, “Horia Hulubei” National Institute of Physics and Nuclear Engineering (IFIN-HH), 30 Reactorului Street, 077125 Magurele, Romania
8
Brukenthal National Museum, Piata Mare 5 Street, 550163 Sibiu, Romania
9
Department of History, Heritage and Protestant Theology, Lucian Blaga University of Sibiu, B-dul Victoriei nr. 5-7 Street, 550024 Sibiu, Romania
10
Institute of Social Sciences and Humanities, Romanian Academy, B-dul Victoriei nr 40 Street, 550024 Sibiu, Romania
11
Department of Research-Development and Projects, Museum of National History and Archeology, Piața Ovidiu nr. 12 Street, 900745 Constanța, Romania
12
Department of Chemistry and Biochemistry, University of Agricultural Sciences and Veterinary Medicine, 400372 Cluj-Napoca, Romania
*
Authors to whom correspondence should be addressed.
Diversity 2021, 13(5), 208; https://doi.org/10.3390/d13050208
Submission received: 23 April 2021 / Revised: 11 May 2021 / Accepted: 11 May 2021 / Published: 13 May 2021

Abstract

:
Southeast Europe has played an important role in shaping the genetic diversity of sheep due to its proximity to the Danubian route of transport from the Near East into Europe, as well as its possible role as a post-domestication migration network and long tradition of sheep breeding. The history of Romania and, in particular, the historical province of Dobruja, located on the shore of the Black Sea, has been influenced by its geographical position at the intersection between the great powers of the Near East and mainland Europe, with the Middle Ages being an especially animated time in terms of trade, migration, and conflict. In this study, we analyzed the mitochondrial control region of five sheep originating from the Capidava archaeological site (Dobruja, Southeast Romania), radiocarbon dated to the Early Middle Ages (5–10th century AD), in order to better understand the genetic diversity of local sheep populations and human practices in relation to this particular livestock species. The analyses illustrate high haplotype diversity in local medieval sheep, as well as possible genetic continuity in the region. A higher tendency for North to South interaction, rather than East to West, is apparent, together with a lack of interaction along the Asian route. Continuous interaction between the First Bulgarian Empire, which occupied Dobruja starting with the 7th century AD, and the Byzantine Empire is indicated. These results might suggest expanding trade in Southeast Romania in the Early Middle Ages.

1. Introduction

Sheep (Ovis aries) were domesticated approximately 11,000 years ago in the Fertile Crescent region [1] and are classified into five mitochondrial DNA (mtDNA) haplogroups (A, B, C, D, E) that diverge phylogenetically and probably descend from multiple wild Moufloniformic populations [2,3,4]. From the Near East, where they were first domesticated, they did not spread across Europe in a single migration episode, but rather in multiple, separate migration events related to human movements [5]. Three main colonization routes can be traced in Europe following domestication: the Mediterranean route, the Danubian route, and the Northern European route [6,7,8,9].
As a consequence of livestock migration routes into Europe, as well as of the long history of sheep breeding in the region, Southeast Europe was found to be a genetic diversity hotspot [10,11,12,13,14,15] and may have served as a post-domestication migration node [15]. As such, detailed knowledge of the genetic background of local sheep can be useful in guiding conservation efforts and tracing genetic resources [16,17].
The genetic make-up of sheep populations is defined by a complex history due to a continuous domestication process, shaped by introgression from wild species, strong gene flow mediated by human migrations, as well as trade and artificial selection practices [15,18,19,20,21]. Therefore, the resulting genetic background will be a reflection of the culture manipulating it [22].
Mitochondrial DNA, a useful tool for tracing maternal origins and revealing the migration patterns of humans and the domestic animals they brought with them [16], has proved to be a suitable genetic marker for understanding the genetic history of sheep. Studies focused on ancient sheep mtDNA hypervariable region (HVR), particularly from the Copper Age [23] and Bronze Age [24,25,26,27,28,29] have assisted in unfolding the origin of domestic lineages in China, Russia, Turkey, the Alps, and Estonia, while those that discuss sequences dated to the Iron Age, Medieval, and Post Medieval Times have illustrated different selection and trade practices. For example, modern selective breeding practices did not change the haplogroup distribution of Italian sheep already established in the Middle Ages [30], while extensive research in the Northern European region has shown genetic continuity in Estonia for the past three millennia [28], no sign of population replacement in Finland since the Iron Age [8], as well as signs of expanding trade in the Middle Ages and strong artificial selection in the Modern Era [22,28,29]. Unfortunately, studies that aim to illustrate sheep mitochondrial genetic variation across different historical periods and in comparison to modern sheep, have so far been restricted to these few geographical areas.
The present paper is focused on investigating the mitochondrial genetic diversity of a small group of sheep consisting of five individuals originating from Early Middle Ages Dobruja (Capidava, Southeast Romania, 5th–10th centuries AD), a region underrepresented in published literature but of great importance both in terms of historical ties [31] and sheep genetic diversity [10,11,12,13,14,15]. Given the period of intense raids and increasing trade in the region throughout the 5th–6th century, as well as the rising power of the First Bulgarian Empire, which occupied Dobruja from the late 7th century and its documented ambivalent relationship with the Byzantine Empire-alternating between times of peace, alliance and lucrative trade and times of war [31]—this paper also aims to reveal the genetic relationships between the Capidava cohort and other published ancient and modern sequences.

2. Materials and Methods

2.1. Sample Collection, Archaeological Context, and Radiocarbon Dating

The samples (Ovis_Cap) consisted of a total of 7 sheep mandibles with embedded teeth found in the archaeological fill excavated from the Capidava archaeological site in South-East Romania during the campaigns of 2010–2014, representing the entire ovine material found in that respective fill. Initial morphological inspection indicated that the remains belonged to domestic sheep, and prior to DNA and collagen extraction, the bones were safely stored in a dedicated storage room.
The archaeological campaigns focused on the retrieval of human skeletal remains led to the recovery of individuals dated through grave goods, funerary rites, and radiocarbon analysis as part of a 10th century AD, probably Christian, population [32,33]. However, the same clear stratigraphic context could not be inferred for the livestock remains uncovered, and, as such, radiocarbon dating was performed for all 7 Ovis_Cap samples.
Prior to collagen extraction, the bone was tested by elemental analysis on a Thermo Scientific FlashEA 1112 Series Elemental Analyzer to determine if the samples were suited for Accelerator Mass Spectrometry (AMS) dating. Generally, a ratio of C:N ranging from 2.9–3.5 was considered appropriate, according to Harvey et al. 2016 [34].
Bone collagen extraction was performed using an adapted acid-alkaline-acid technique, according to [35,36]. The bone was ground to a powder and homogenized using liquid nitrogen. About 0.7–1.2 g of bone powder was transferred to 15 mL tubes, 10 mL of 1N HCl were added, and the samples were let to rest for 30 min. The samples were centrifuged for 5 min at 3000 rpm, and the supernatant was removed. Next, the samples were brought to pH 7 by washing with distilled water (DW). The washed pellet was resuspended in 7 mL of 0.1% NaOH for 30 min, and then the samples were centrifuged for 7 min at 3000 rpm and the supernatant removed. Next, the samples were brought to pH 7 by washing with DW. Atmospheric CO2 absorbed during alkali treatment was removed by adding 7 mL of 1N HCl for 30 min and centrifuging 3 min at 3000 rpm to facilitate sedimentation. The pellet was washed until the supernatant reached pH 3. A few milliliters of solution were left over the pellet and gelatinization was accomplished by incubating the samples at pH 3, 56 °C, for 16 h. Following gelatinization, the samples were centrifuged at 2500 rpm for 3 min for better separation, filtered with 45–90 µm Ezee-filters (Elkay, Hampshire, UK) to remove insoluble residue, and lastly ultrafiltered by centrifuging in Vivaspin 15 30 KDa MWCO ultrafilters (Sartorious, Epsom, UK), until ~0.5–1 mL volume remained in the ultrafilter.
The radiocarbon measurements were carried out at the 1 MV AMS facility at the RoAMS laboratory from IFIN-HH [37].
Collagen was kept at −4 °C before being freeze-dried at −45 °C overnight. After this, step samples were weighed into tin capsules and burned in an Elemental Analyzer (EA, varioMicro Cube, Elementar, Langenselbold, Germany). The resulting CO2 from sample combustion was adsorbed on the zeolite trap of the Automated Graphitization Equipment (AGE, ETH Zurich, Switzerland). Finally, the pure CO2 was thermally released into an AGE reactor with an iron catalyst on the bottom, where it was reduced to graphite in the presence of excess hydrogen. The final product was represented by a homogeneous mixture of carbon and iron. The entire process was controlled by the PC software Lab VIEW [38]. In the end, all of the prepared targets, containing approximately 1 mg of C and 5 mg of Fe, were pressed in Al cathodes and inserted in the negative ion source carousel.
The samples were measured together with the standard and blank materials for 50 min, consisting of 10 individual measurements divided into 10 blocks of 30 s each. Oxalic acid II (OXII [39]) was used as the modern standard, obtaining 134.076 ± 0.607 pMC (determined as the average and standard deviation of 5 cathodes). Anthracite coal was used as a chemical blank from which resulted the process background of 0.267 ± 0.038 pMC, corresponding to a radiocarbon age of 47.659 ± 1222 yr BP.
Data analysis and radiocarbon ages calculation were performed using the BATS software, developed at ETH Zurich [40].
Conversions from radiocarbon ages (yr BP) to calendar ages (yr calBP) were made using OxCal version 4.4 with IntCal20 [41,42] and were quoted as cal. AD.

2.2. DNA Extraction, PCR Amplification and mtDNA Sequencing

All steps were performed in sterile laboratory environments dedicated to ancient DNA research at the Institute for Interdisciplinary Research in Bio-Nano-Sciences, “Babeș-Bolyai” University, Romania, following standard guidelines and proper workflow protocols [43]. During the entire DNA extraction procedure, care was taken to minimize contamination from external DNA sources. Firstly, teeth were physically extracted from mandibles, their external layer was mechanically removed using a dental drill and were UV-irradiated for 40 min to eliminate surface contaminants. Next, the dentin powder was obtained using sterile dental drills. Approximately 30 mg of dentin powder was obtained for each sample.
The decalcification and enzymatic digestion procedure involved adding over the obtained powder 1 mL of Digestion Solution (EDTA 0.5M pH 8, SDS 0.5%, TRIS-HCl 50 mM, pH 8) and 5 µL of Proteinase K (Jena Bioscience, Jena, Germany) at a final concentration of 0.1 mg/mL and incubating that overnight (approximately 16 h), with agitation, at 56 °C [44]. Following its preparation, the Digestion Solution was subjected to UV light treatment for 45 min, as were all other solutions made in-house [45].
DNA extraction was performed using an adapted protocol consisting of 2 main steps. It combined a silica-based column extraction step [46] with the washing, drying, and elution steps according to the Nucleospin Tissue DNA extraction Kit (Macherey-Nagel, Düren, Germany).
During the first step, the samples were centrifuged for 5 min at 2000× g, transferred to a clean 2 mL tube and then centrifuged again for 5 min at 2400× g. The supernatant was divided into ~200 µL aliquotes (in 2 mL tubes) and 5 volumes (~1 mL) of Binding Buffer (Guanidine hydrochloride 5 M, Isopropanol 40%, Tween 20 Df = 10 × 0.05%, deionized water) were added. Approximately 750 µL of the resulted sample were added to a silica-based column and the samples were centrifuged for 1 min at 2400× g. The flowthrough was discarded and this process was repeated until the entire volume of the sample had been loaded.
Next, the samples were washed with Washing Buffers BW and B5, dried and eluted according to the instructions provided in the Nucleospin Tissue DNA extraction Kit (Macherey-Nagel, Düren, Germany).
Negative extraction and amplification controls were performed for every sample to screen for potential contamination.
A 598 base pairs (bp) sequence of the Ovis aries mtDNA hypervariable region was targeted ([GenBank: NC001941] positions 15,978–16,501) using a set of 5 overlapping primers as described by [8], but using adjusted annealing temperatures. In order to test for the presence of the Y-chromosome single nucleotide polymorphism (SNP) marker, a part of the 5′-promoter region of the SRY gene was also analyzed—a 130-bp sequence, spanning positions 58–178 of the Ovis aries Y-chromosome [GenBank: AY604734] [8].
The following optimized PCR reaction setup led to appropriate results: 25 µL total reaction volume, 1× PCR Buffer, 2.5 mM MgCl2, 0.2 mM dNTPs (Bioline, Meridian Bioscience, Memphis, USA), 0.5 pM of forward and reverse Primers, 0.5 µg/µL BSA, and 1.25 units/reaction MangoTaq Polymerase (Bioline, Meridian Bioscience, Memphis, USA). PCR parameters were: 95 °C for 5 min (initial denaturation), followed by 40 cycles of 95 °C for 30 s (denaturing), 55–57 °C for 30 s (annealing, depending on primer set), 72 °C for 30 s (extension) and a final extension for 5 min at 72 °C.
Successfully amplified target sequences were cloned (6 clones/PCR product) using the pJET1.2/blunt cloning kit (Thermo Fisher Scientific, Waltham, MA, USA). DNA sequences were obtained by Sanger sequencing (Macrogen Europe, Amsterdam, The Netherlands), and the resulting consensus sequences were deposited under GenBank Accession Numbers MW928520-MW928524.

2.3. Sequence and Population Genetics Analyses

In order to analyze the degree of mtDNA variation of the Capidava cohort, comprising of 5 samples, a summary statistic analysis was performed on a 529 bp region (positions 16027–16556), namely the number of segregating sites (S), number of haplotypes (h), haplotype diversity (Hd), nucleotide diversity (π), and average number of nucleotide differences (k). To better understand the result in a broader geographical and historical context, we performed the same analysis on 18 more sets, comprising 3 to 7 sequences of approximately 530 bp in length originating from the same country and historical period, from a compiled database of sequences deposited in international repositories. The results of the nucleotide diversity values were plotted against the haplotype diversity values. The detailed results of the summary statistics and sequences employed in the analysis are available in Table S1.
Using a comparative dataset of ancient [8,27,28,30], modern [3,8,47,48,49,50], and reference sequences [4,49] previously deposited in international databases (Table S2), the following analyses were performed:
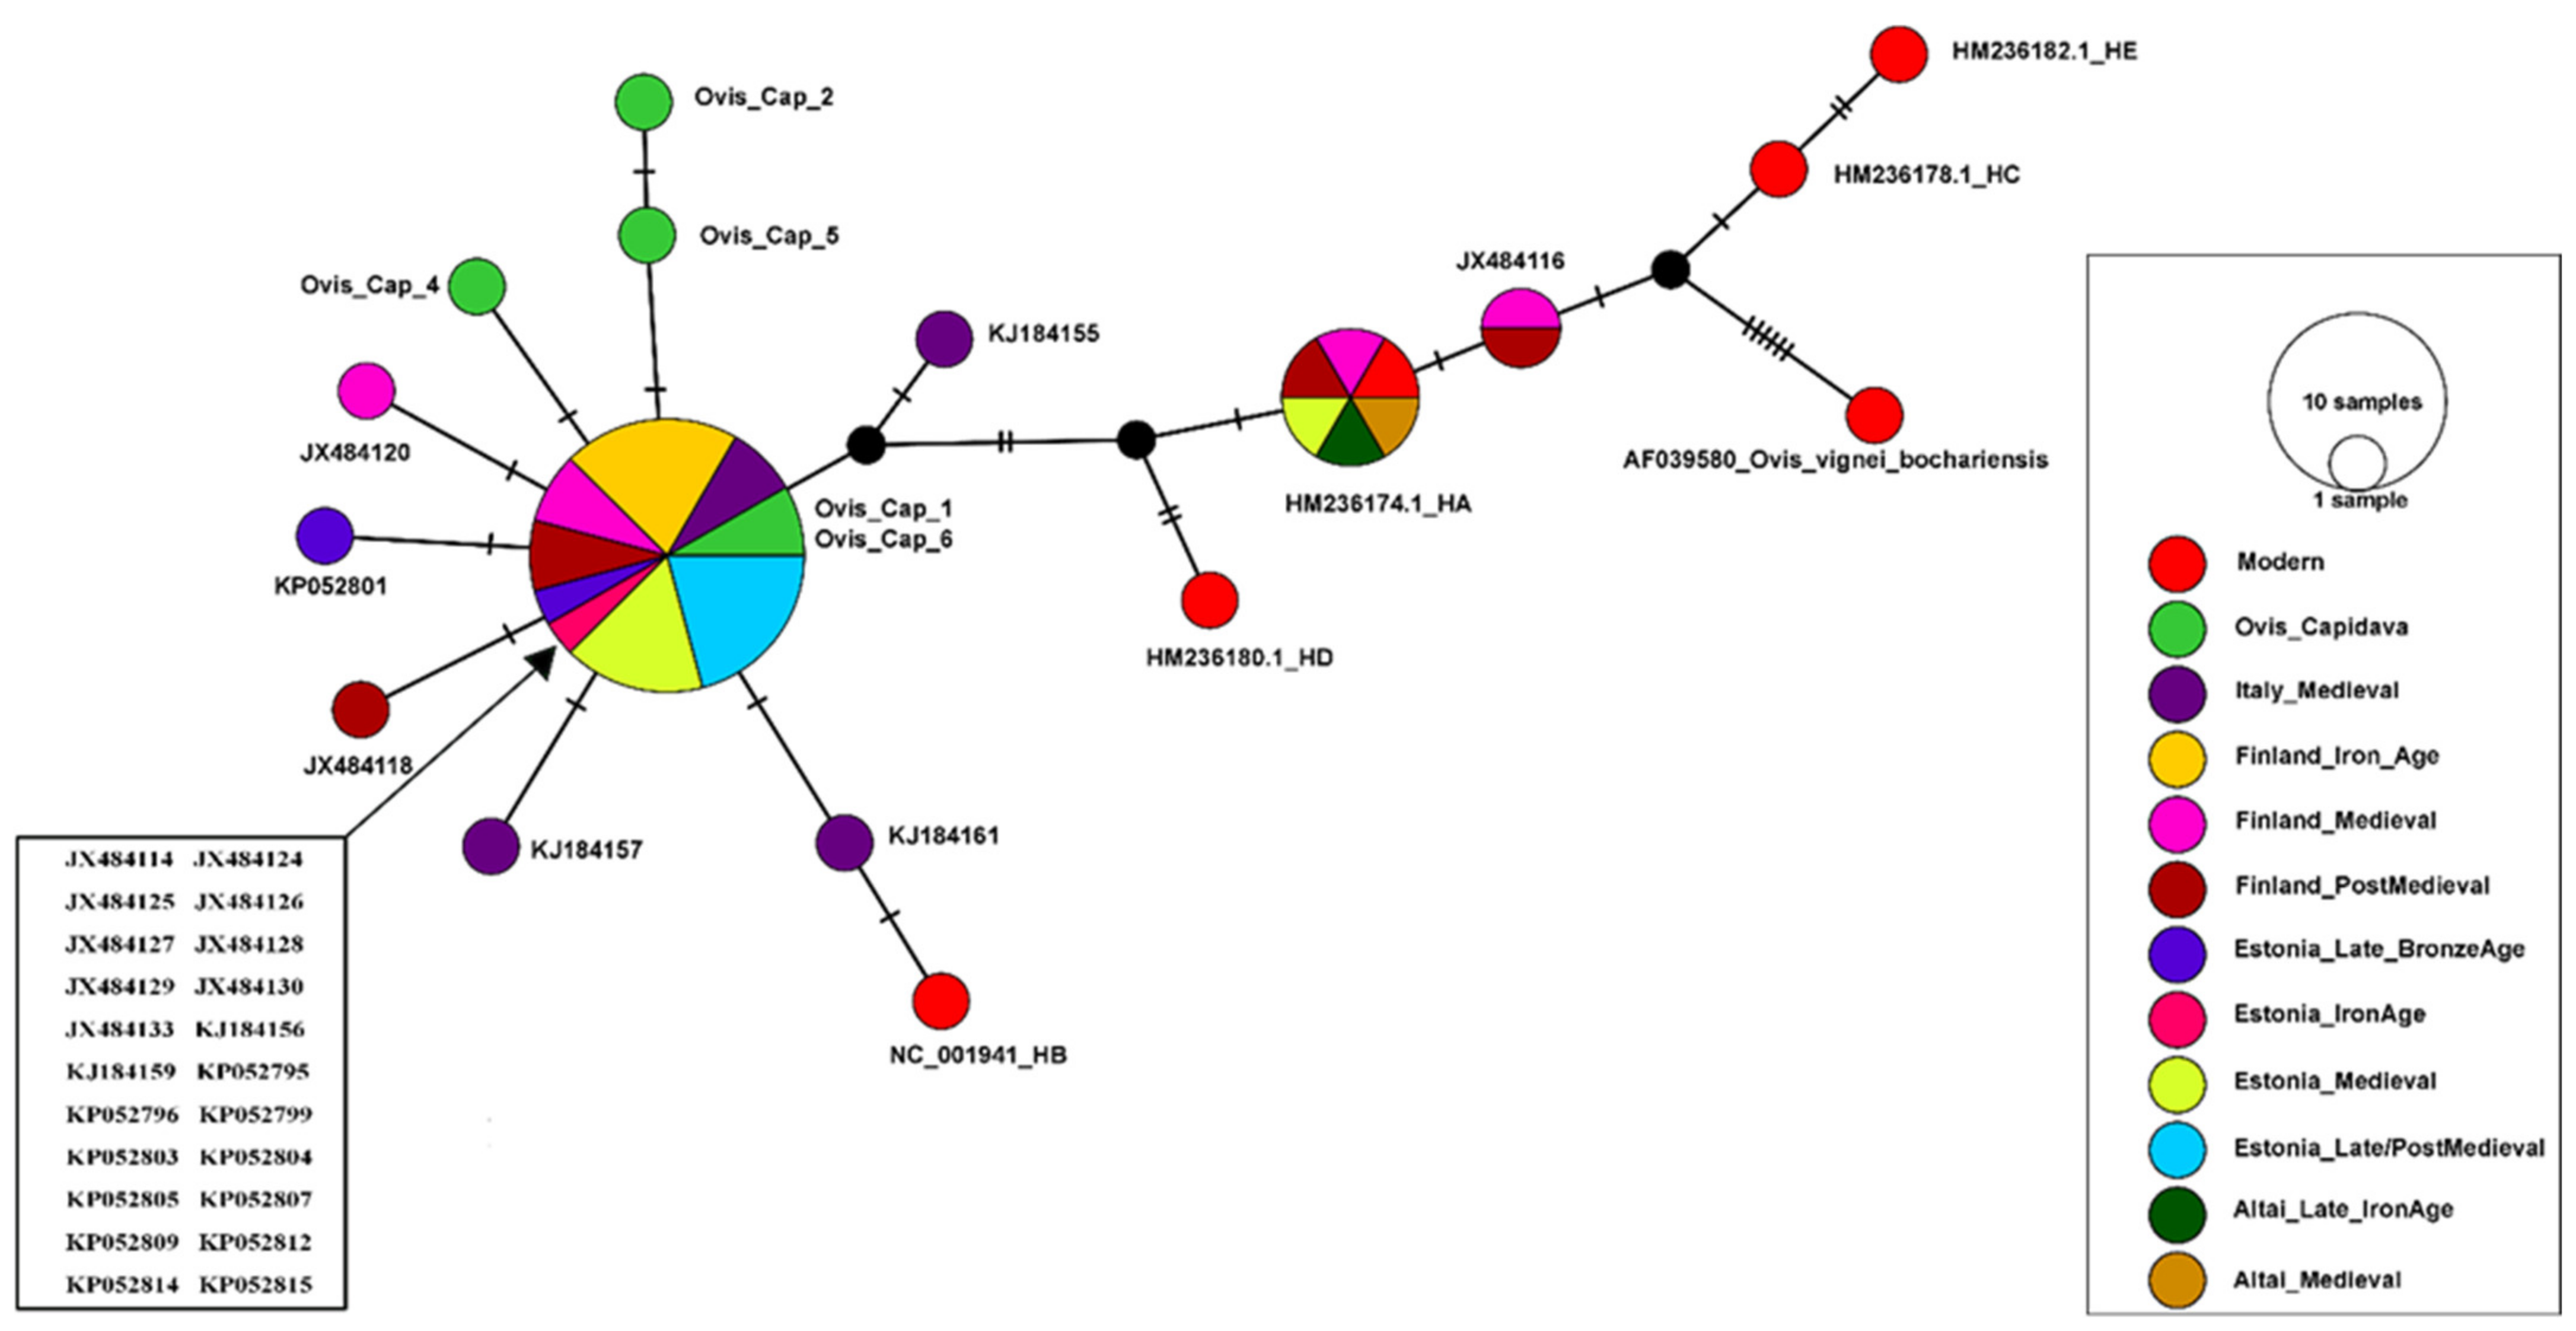
  • In order to investigate the genetic relationship between the Capidava cohort and other ancient sequences representative for different geographic regions and historical periods, as well as to estimate the degree of admixture and determine potential trade routes and migration patterns, a Median Joining Network [51] was constructed and pairwise genetic distances were calculated using the Ovis_Cap sequences and 41 sequences available in the international databases (GenBank Acc. No. available in Table S2). All sequences were aligned and trimmed a 304 bp region between the nucleotide positions 16099 to 16402 (NC_001941) to allow for a homogenous set.
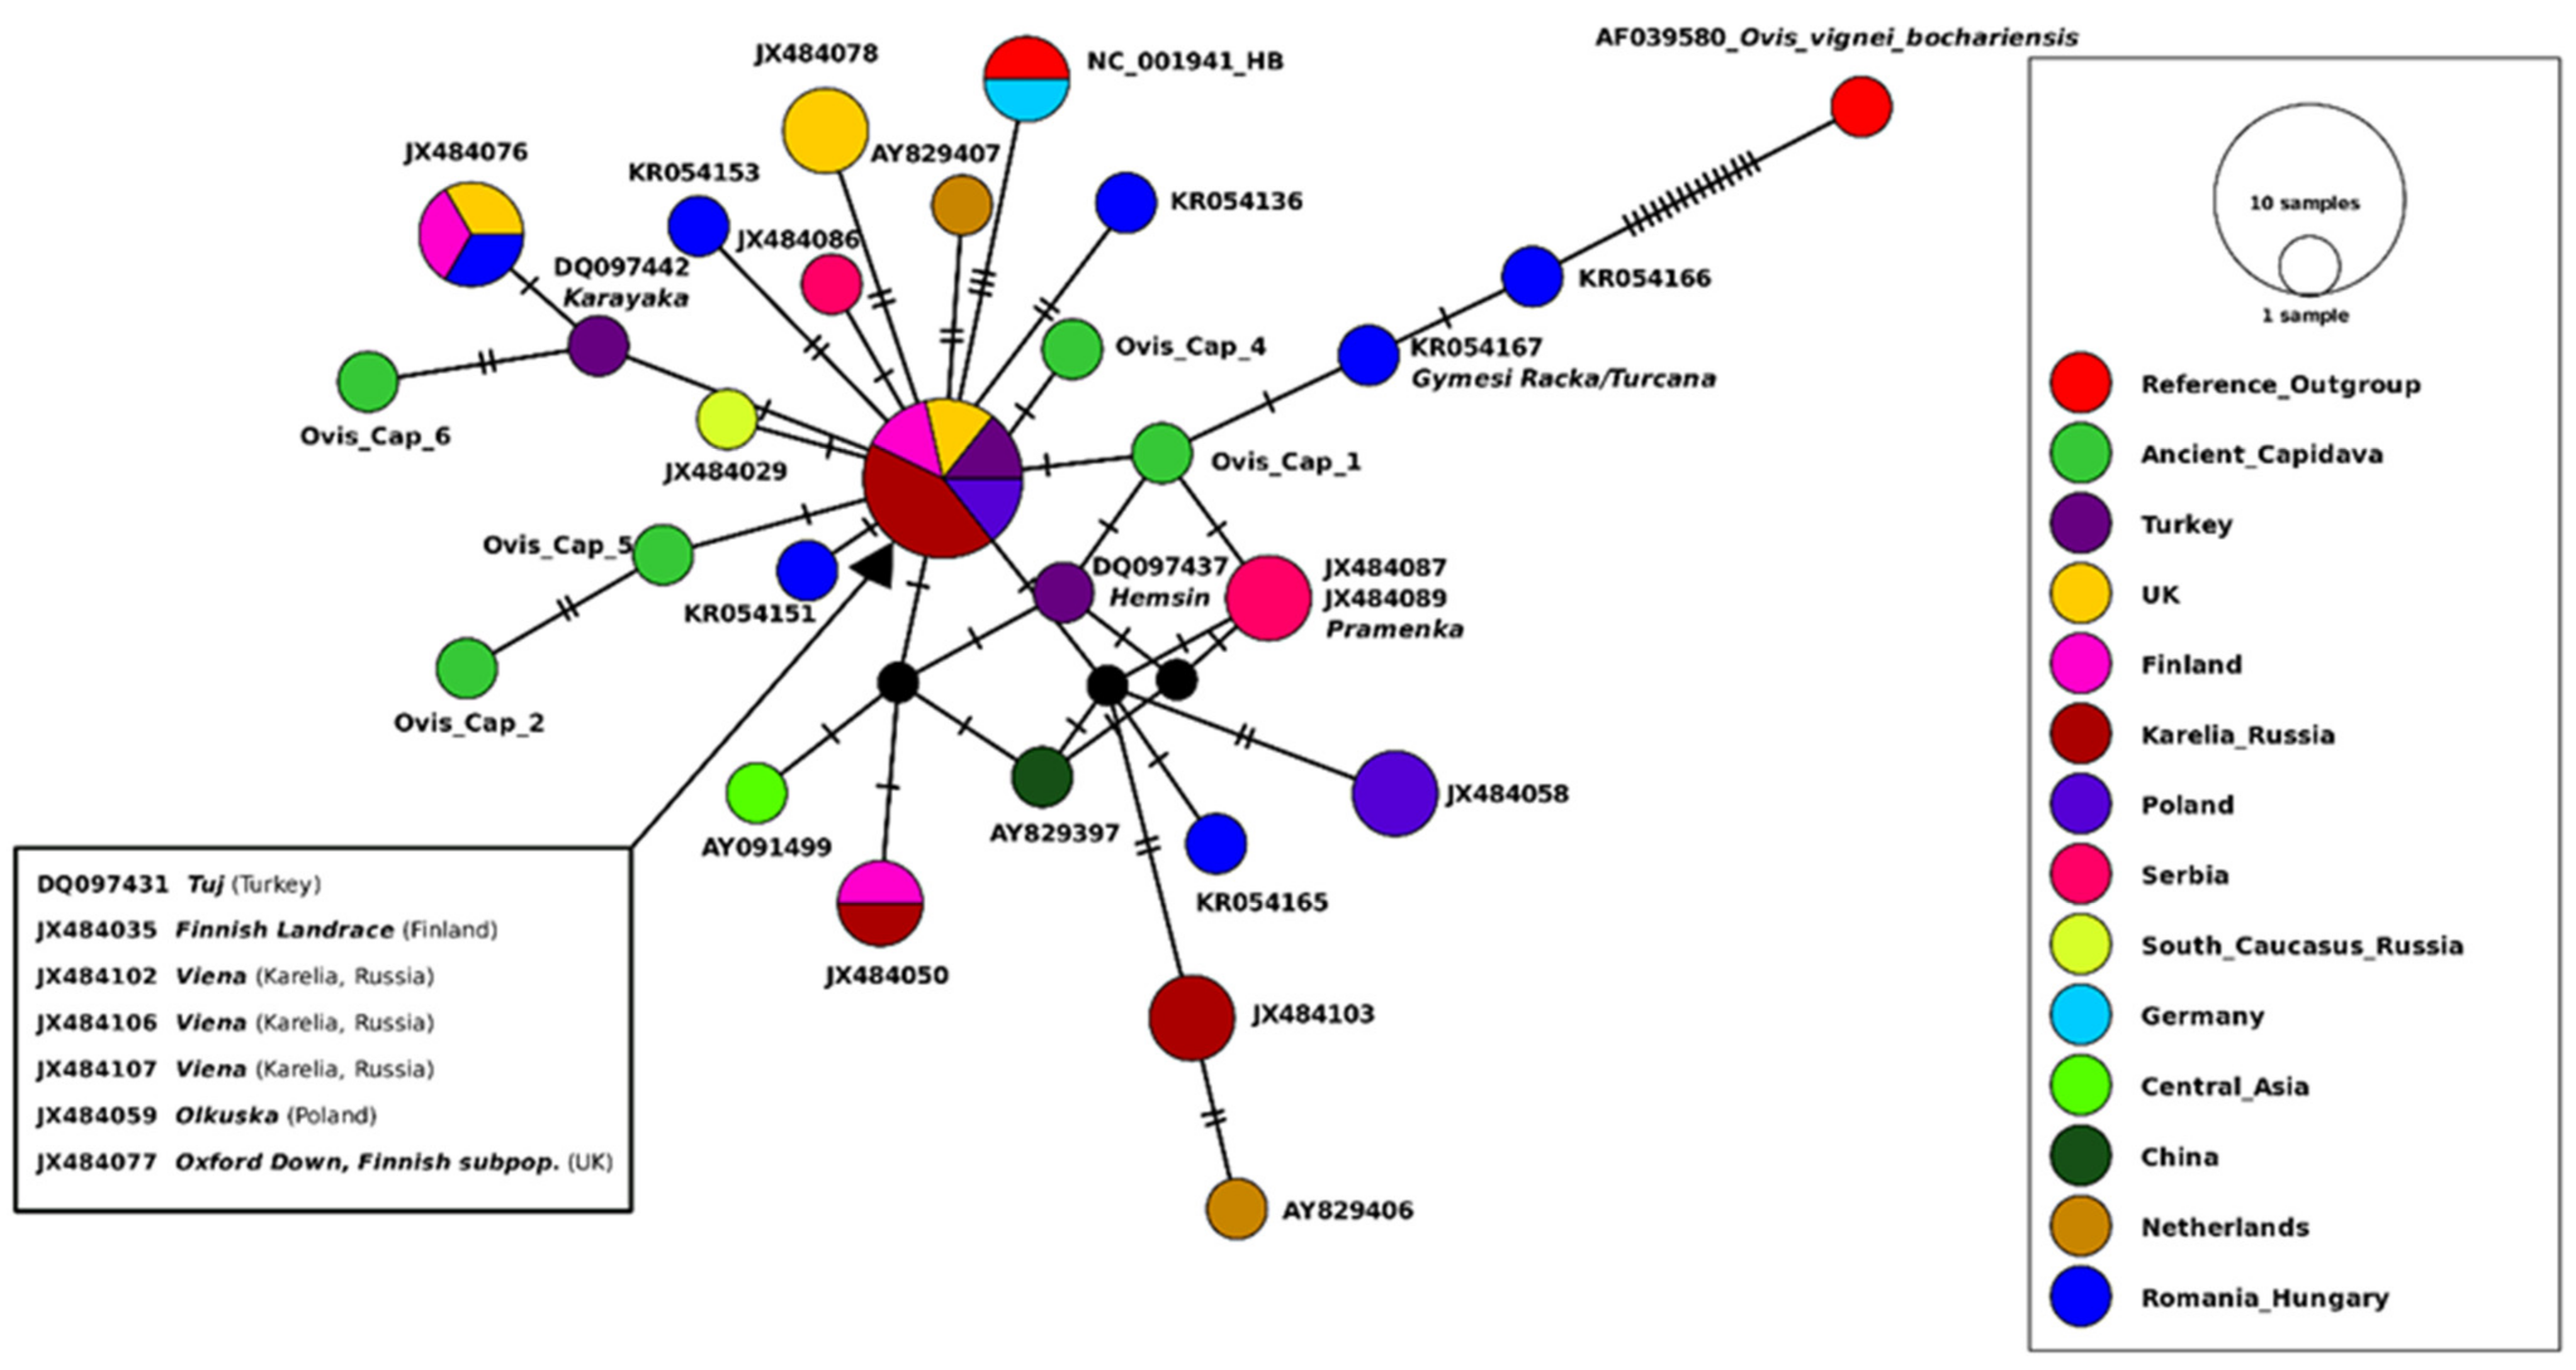
  • To estimate the degree of genetic continuity and similarity to modern-day breeds, a Median Joining Network [51] was constructed, and pairwise genetic distances were calculated on the Ovis_Cap sequences and 37 and 59 sequences, respectively, representing a variety of breeds originating from different countries (GenBank Acc. No. available in Table S2). All sequences were aligned and trimmed to a 474 bp region, between the nucleotide positions 16027 to 16500 (NC_001941).
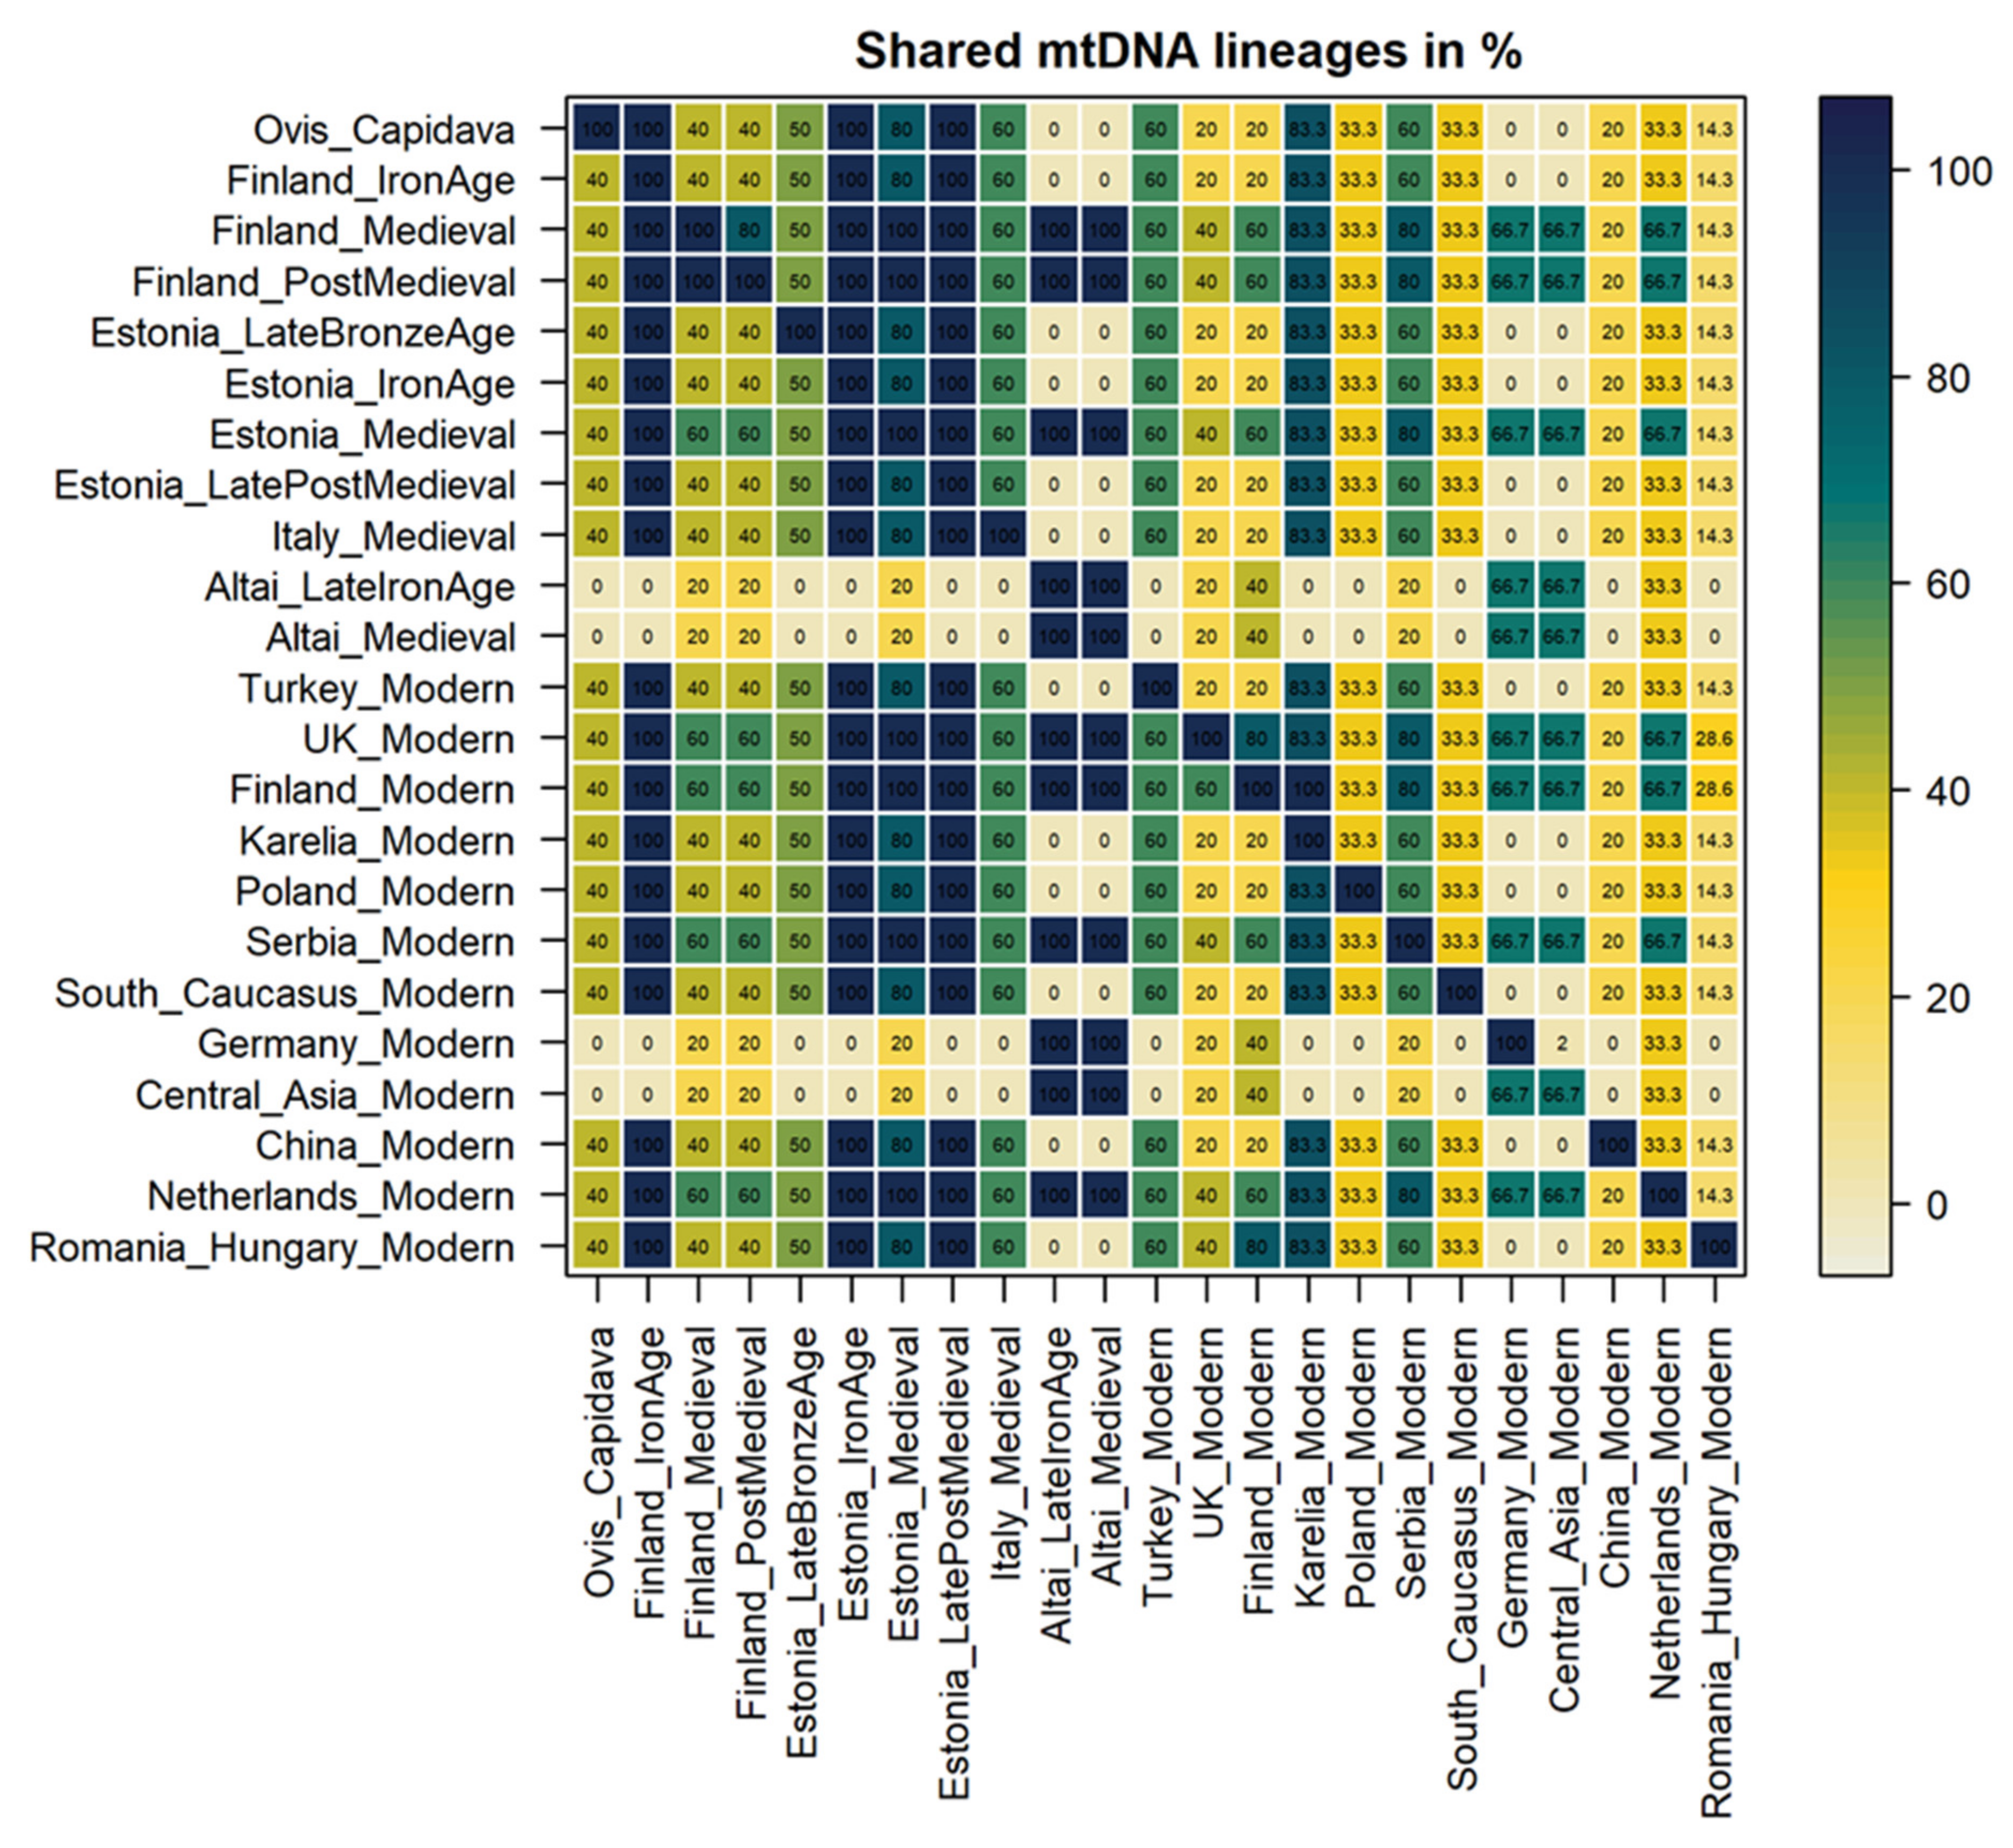
  • As a means to analyze whether the Capidava cohort shared a higher percentage of haplotypes with the ancient or modern data set, a shared haplotype analysis (SHA) was performed by counting the absolute and relative number of shared haplotypes between the Ovis_Cap sequences and 88 other sequences, combining the previously defined ancient and modern data sets (GenBank Acc. No. available in Table S2). All sequences were trimmed to a 304 bp region, between the nucleotide positions 16092 to 16396 (NC_001941).
Median-joining networks [51] were constructed using PopArt v. 1.7. [52] with ε = 0. Pairwise genetic differences (Fst) were determined, and the shared haplotype analysis was performed in the Arlequin v. 3.5.2. software [53]. The model parameters used for pairwise genetic distance calculation and shared haplotype analysis were determined using the jModelTest 2 software [54,55]. For both the ancient and modern datasets used for comparative analysis, as well as for the combined ancient and modern set, the resulting model was Kimura 2-parameter [56] with a Gamma-value of 0.032. Heatmaps of pairwise genetic differences, shared haplotypes, as well as the scatterplot of haplotype and nucleotide diversity of the comparative dataset were visualized using the Rmcdr, lattice, grid, and RColorBrewer packages of the R v. 4.0.3 statistical environment [57]. Geographical visualization of pairwise genetic differences was achieved using the QGIS v. 3.16 software [58].

3. Results

3.1. Radiocarbon Dating, PCR Amplification and Identified SNPs

All seven samples, previously determined to be suited for AMS analysis, were successfully radiocarbon-dated. Genetic analysis was successful for five out of the seven samples. The entire mtDNA target sequence (598 bp) was reconstructed for one sample, whereas for four other samples, a slightly shorter (529 bp) but still informative HVR fragment was obtained. Amplification of the 130 bp region of the 5′-promoter of the SRY gene was inconclusive, as was the amplification of mtDNA from the oldest sample (Ovis_Cap_7) and one of the samples originating from the 5th–6th century AD (Ovis_Cap_3).
Sequence analysis led to the identification of five different unique mitochondrial haplotypes and by comparing them to the reference sequence (NC_001941), 13 polymorphic sites were found, both indicators of a diverse cohort. Besides mutational motifs, the alignment of multiple clones from the same PCR product generally showed the presence of miscoding lesions, mostly in the form of C–T and G–A transitions, which occur due to post-mortem DNA damage, pattern representative of ancient sequences [59]. For all of the samples processed, both the negative extraction and amplification controls were clean, further supporting the authenticity of the results. Data concerning PCR amplification results, identified SNPs, as well as radiocarbon dating results for each sample, are presented in Table 1.

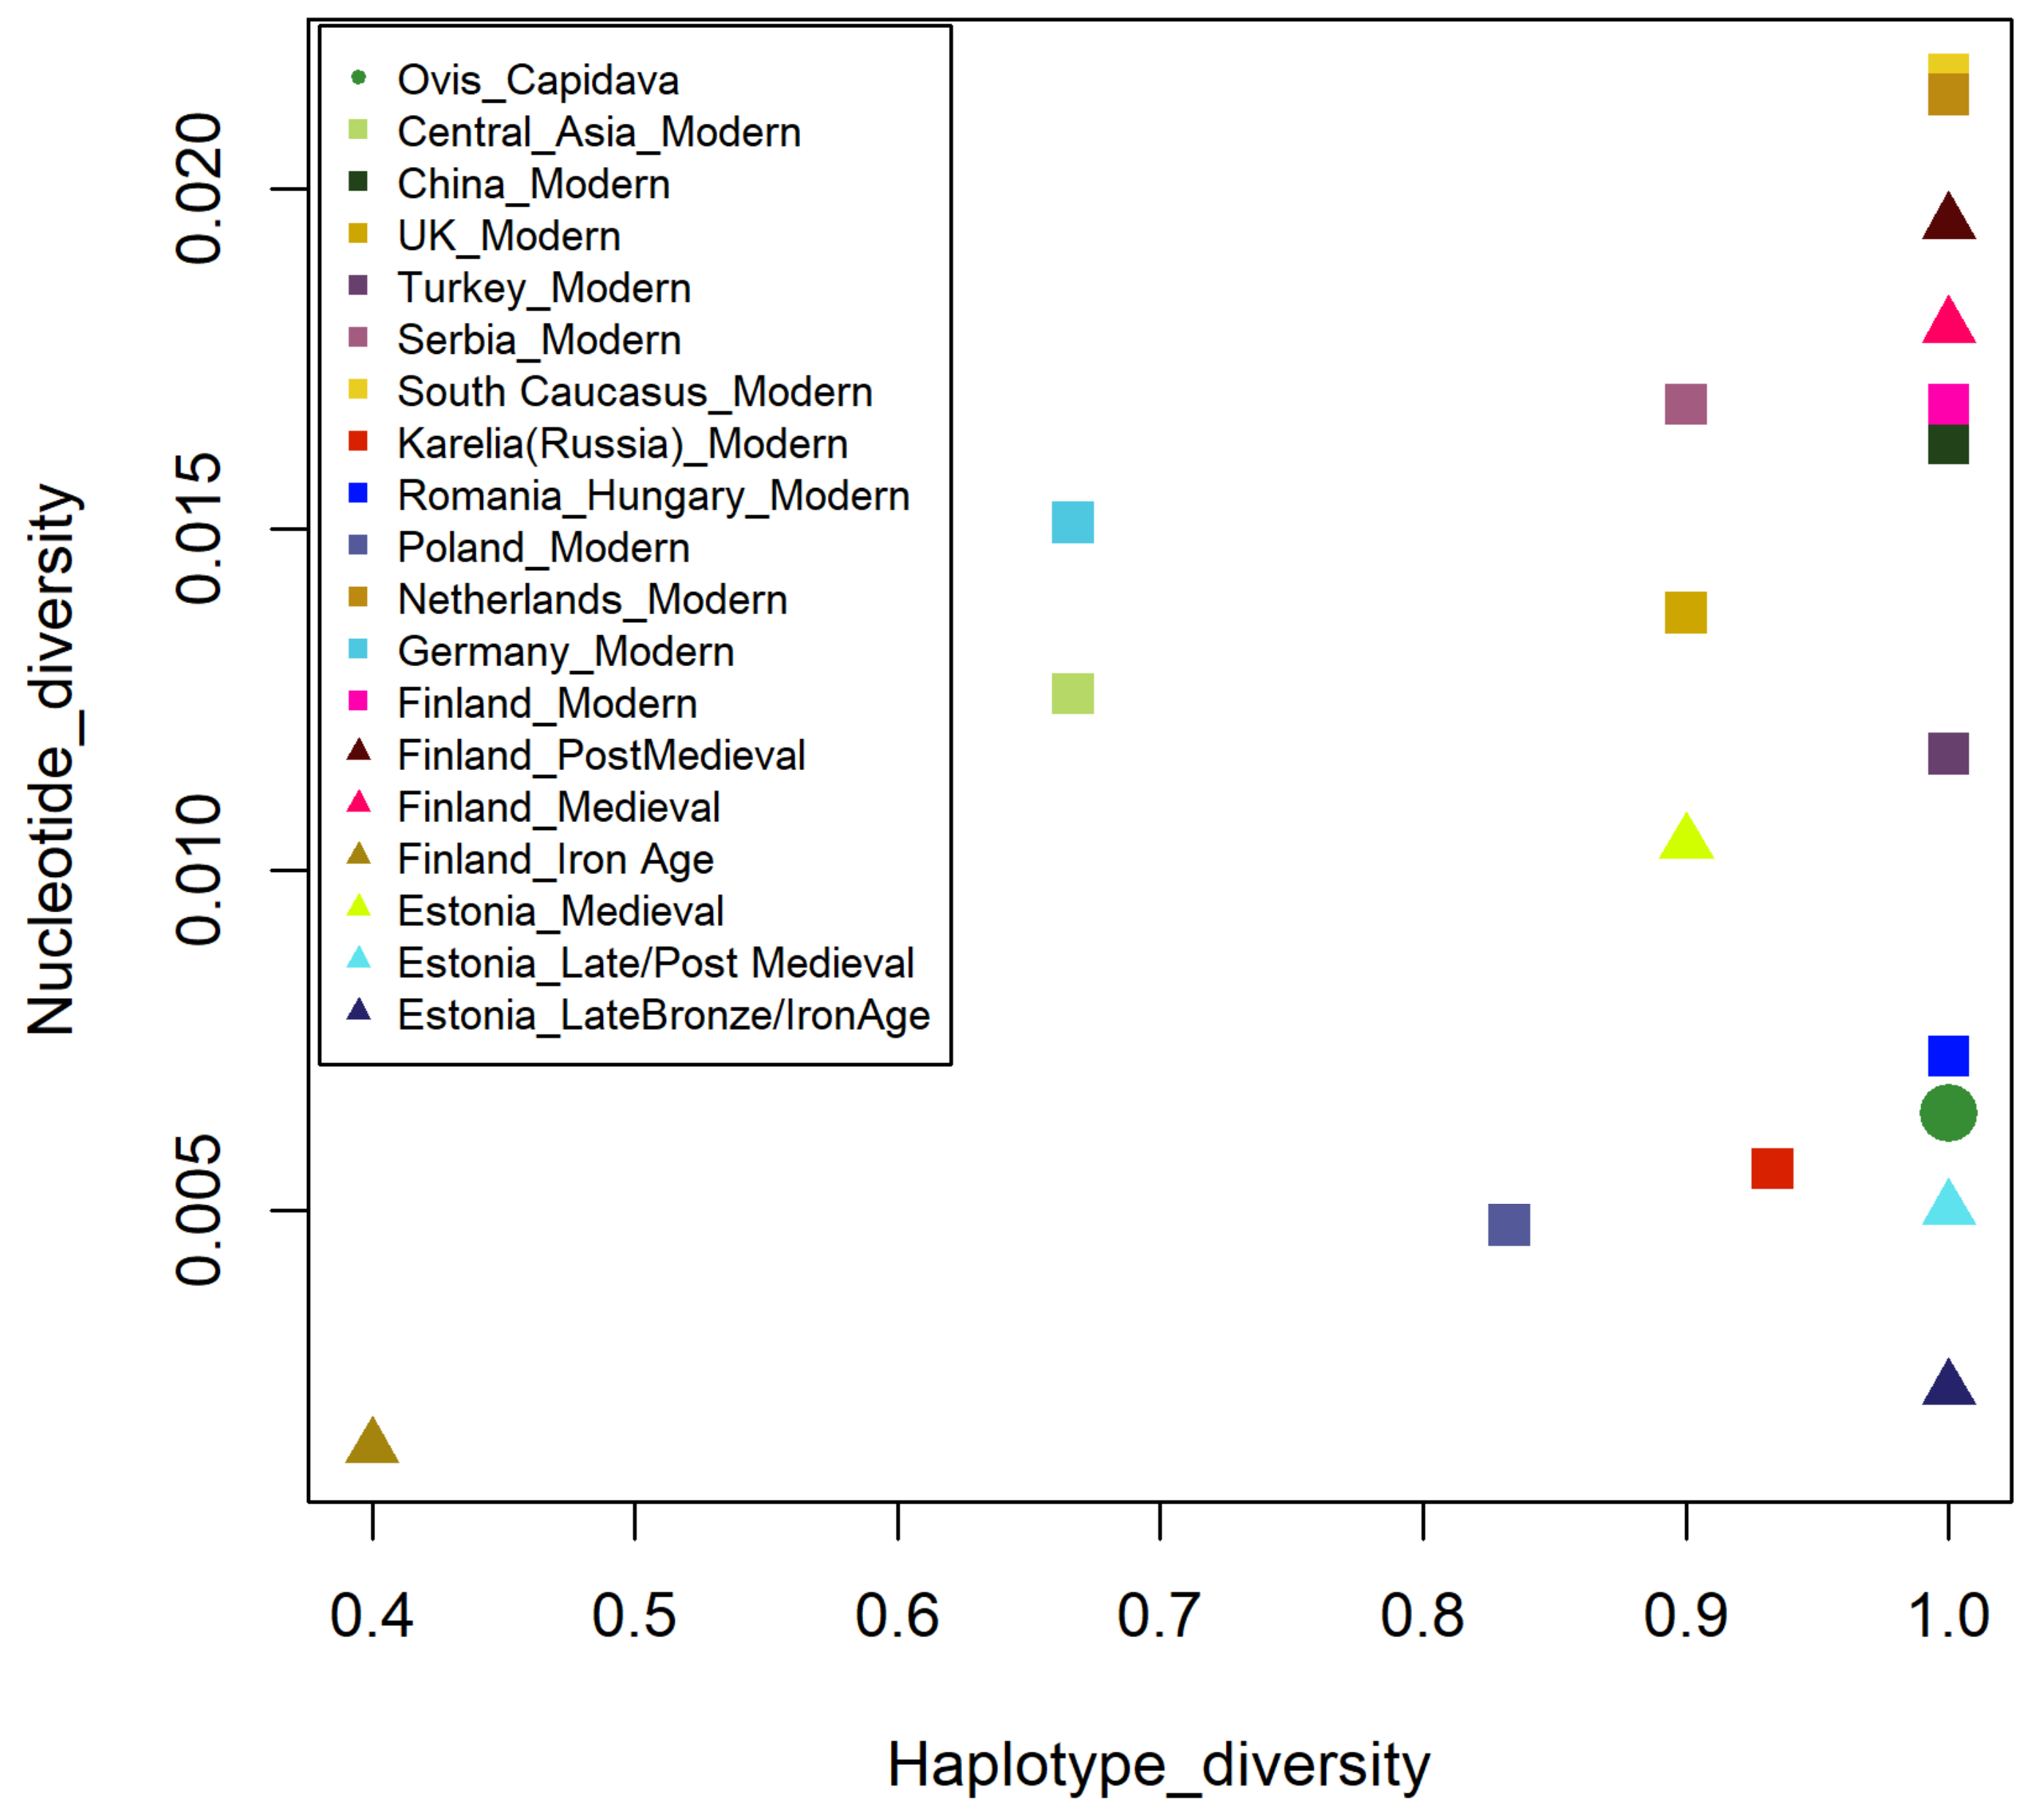
3.2. Summary Statistics Analysis

Due to the small sample sizes of the 18 compiled sequence sets (chosen as such in order to eliminate potential bias), the majority of sample sets have a haplotype diversity value of 1, however certain clusters can be distinguished based on the combined values of Hd and π (Figure 1). The nucleotide diversity value of the Capidava cohort was relatively low compared to the modern sequence sets and the Medieval and Post Medieval Finnish sequences, however, it was higher than that of the Estonian sequences originating from both the Late Bronze/ Iron Age and Late to Post Medieval times, as well as the Finnish Iron Age set. The Capidava sample set has a Hd value of 1 and a π value of 0.00644, thus forming a cluster with the modern set from Romania and Hungary, the modern set from the region of Karelia and the Estonian sequences of Late to Post Medieval times.
These results served as a first indication of similarity between the Capidava cohort and historical Nordic sequences, as well as potential genetic continuity in the current territory of Romania.

3.3. Capidava Sheep Compared to Ancient Cohorts

3.3.1. Haplotype Similarity Analysis

The level of haplotype similarity between the sequences was assessed by performing a Median Joining Network (Figure 2). The result illustrates the fact that the entire Capidava cohort belongs to Haplogroup B, in accordance with the reported geographical distribution of haplogroups [9,18,21,24], and has a higher degree of haplotype similarity with sequences from Northern Europe, namely Finland and Estonia. There was no specific grouping according to historical era in this case, with the Ovis_Cap sequences showing haplotype similarity with Finnish and Estonian sequences from the Late Bronze Age to Post Medieval periods. A lower degree of similarity was indicated between the Capidava cohort and the Medieval Italian dataset, with only 2 out of the 5 sequences sharing the same haplotype for the analyzed region. The group that displayed the lowest similarity was the one representative of the Altai region, with sequences forming part of the Haplogroup A cluster.
While Ovis_Cap_1 and Ovis_Cap_6 have the same haplotype as 22 other sequences present in the database, Ovis_Cap_4, Ovis_Cap_5, and Ovis_Cap_2 have unique haplotypes, residing one and two mutation steps away from the main haplotype, respectively.

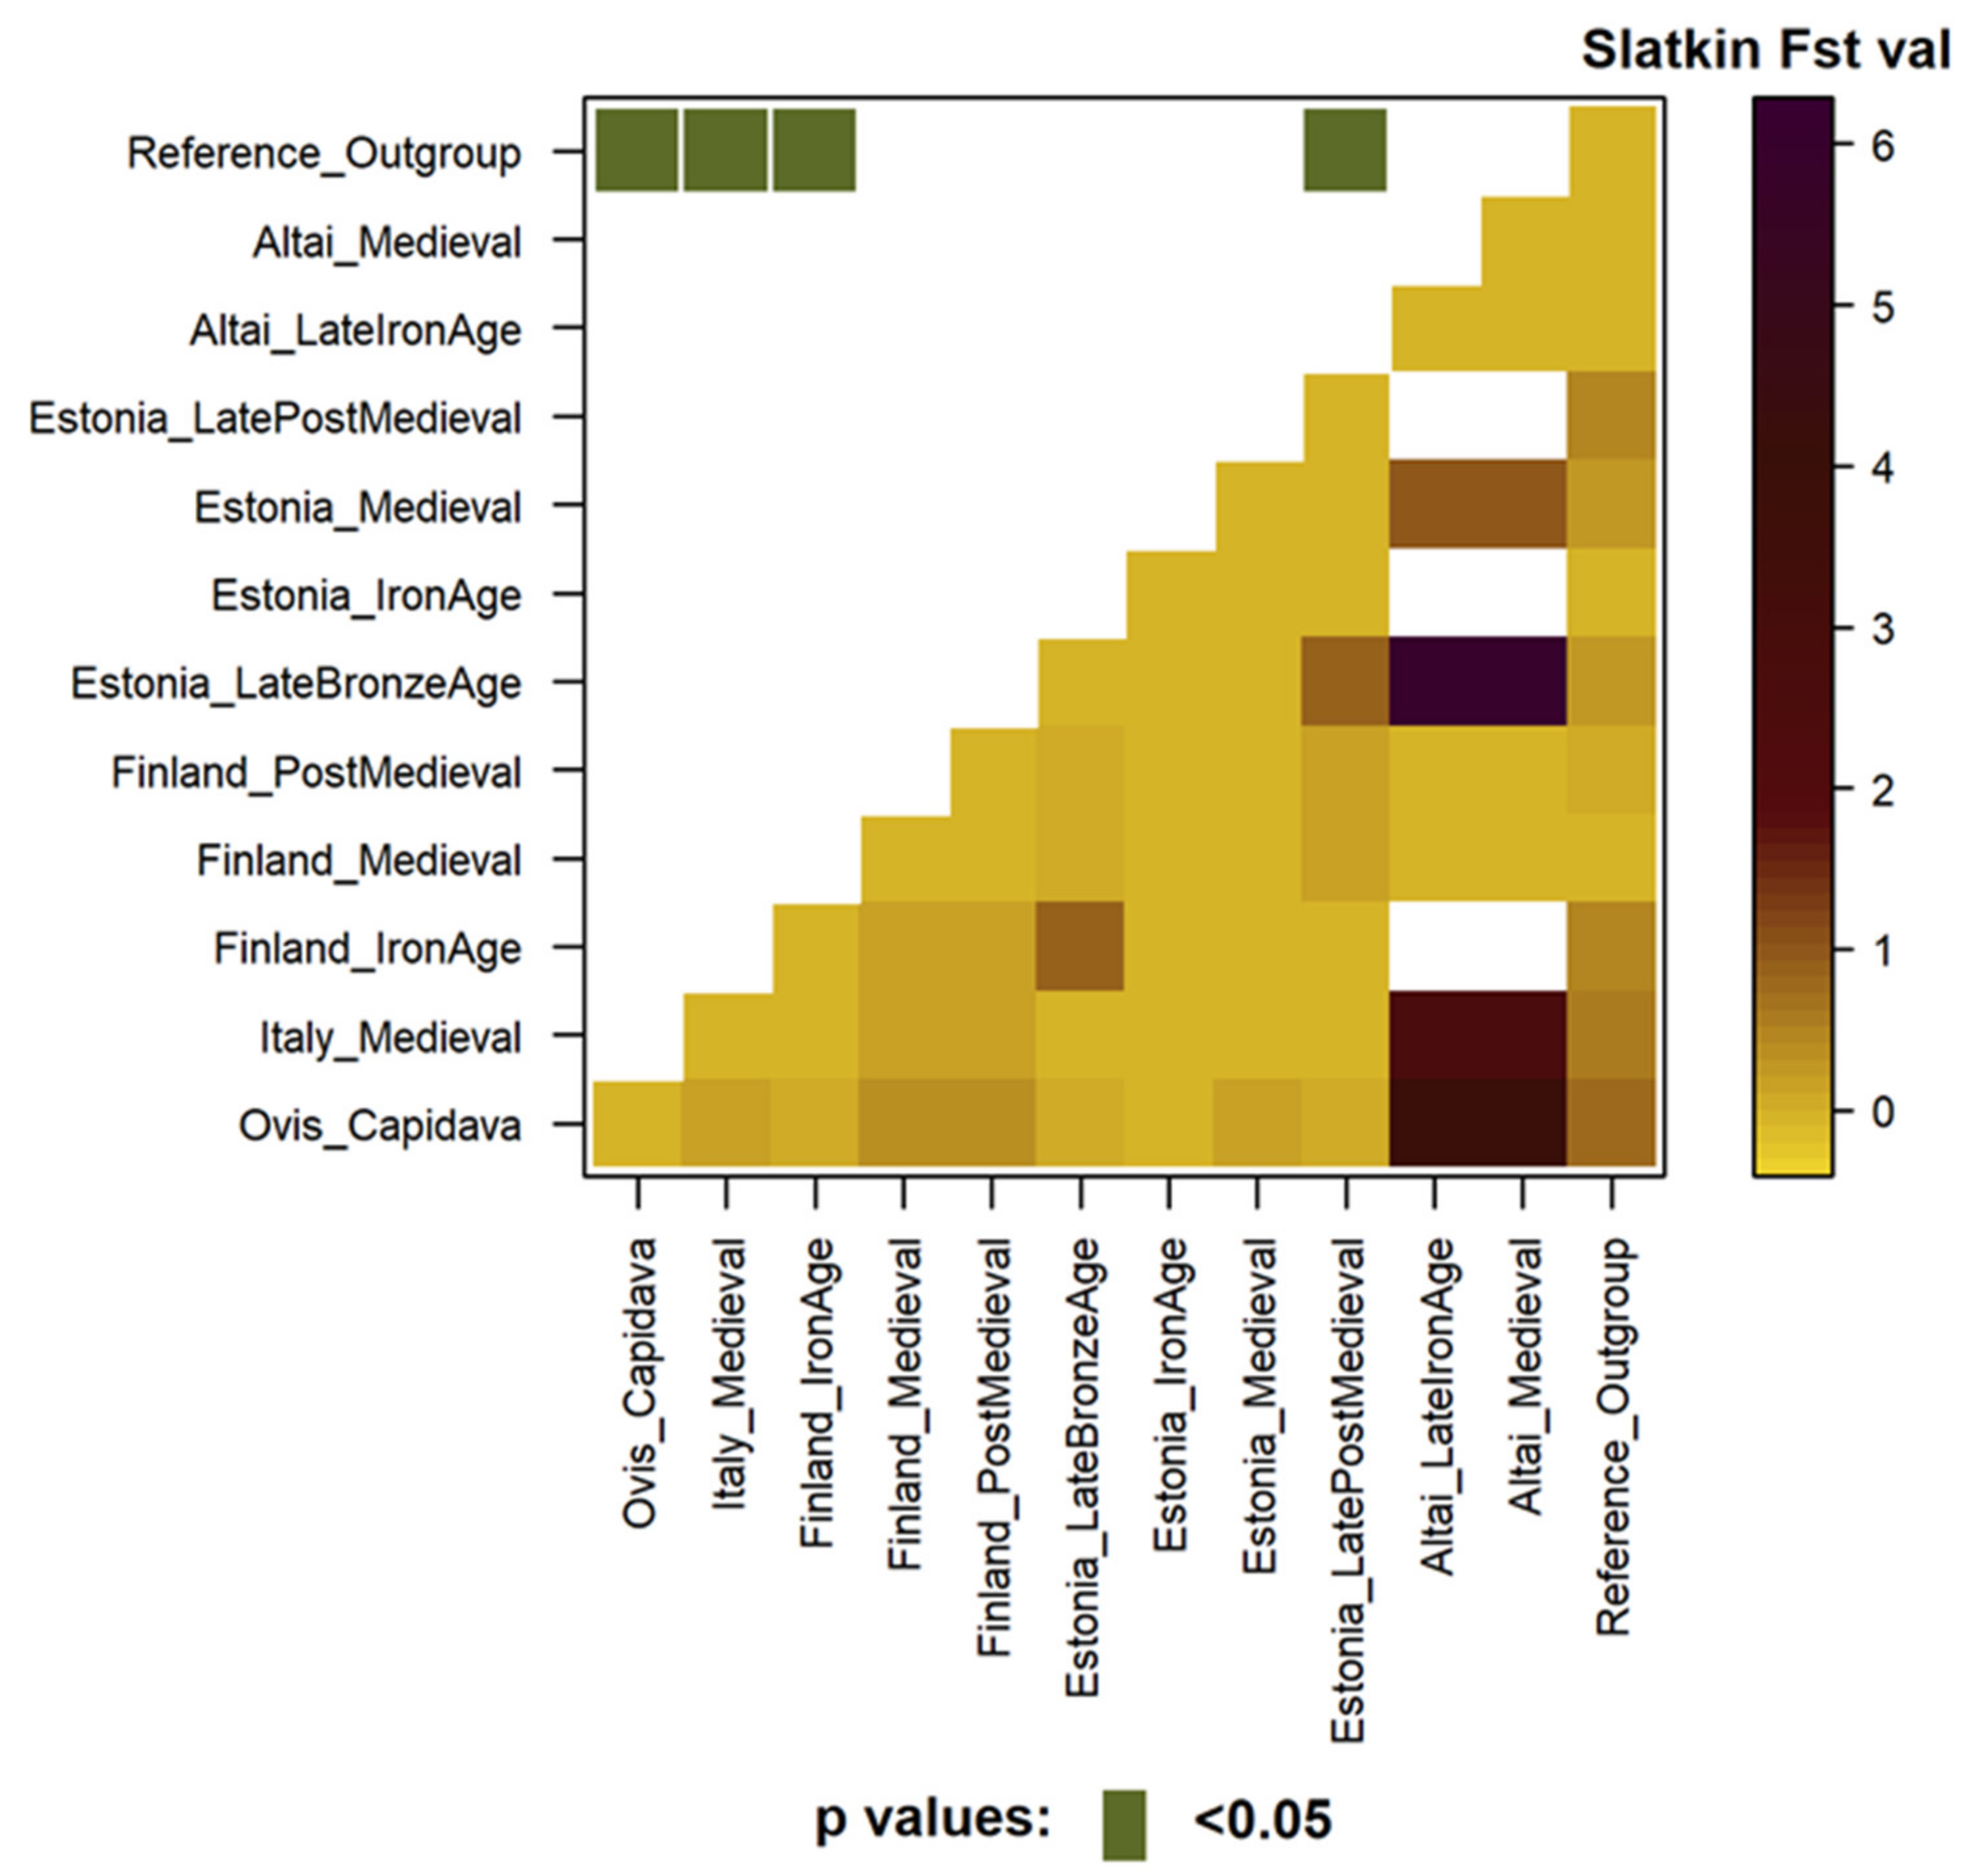
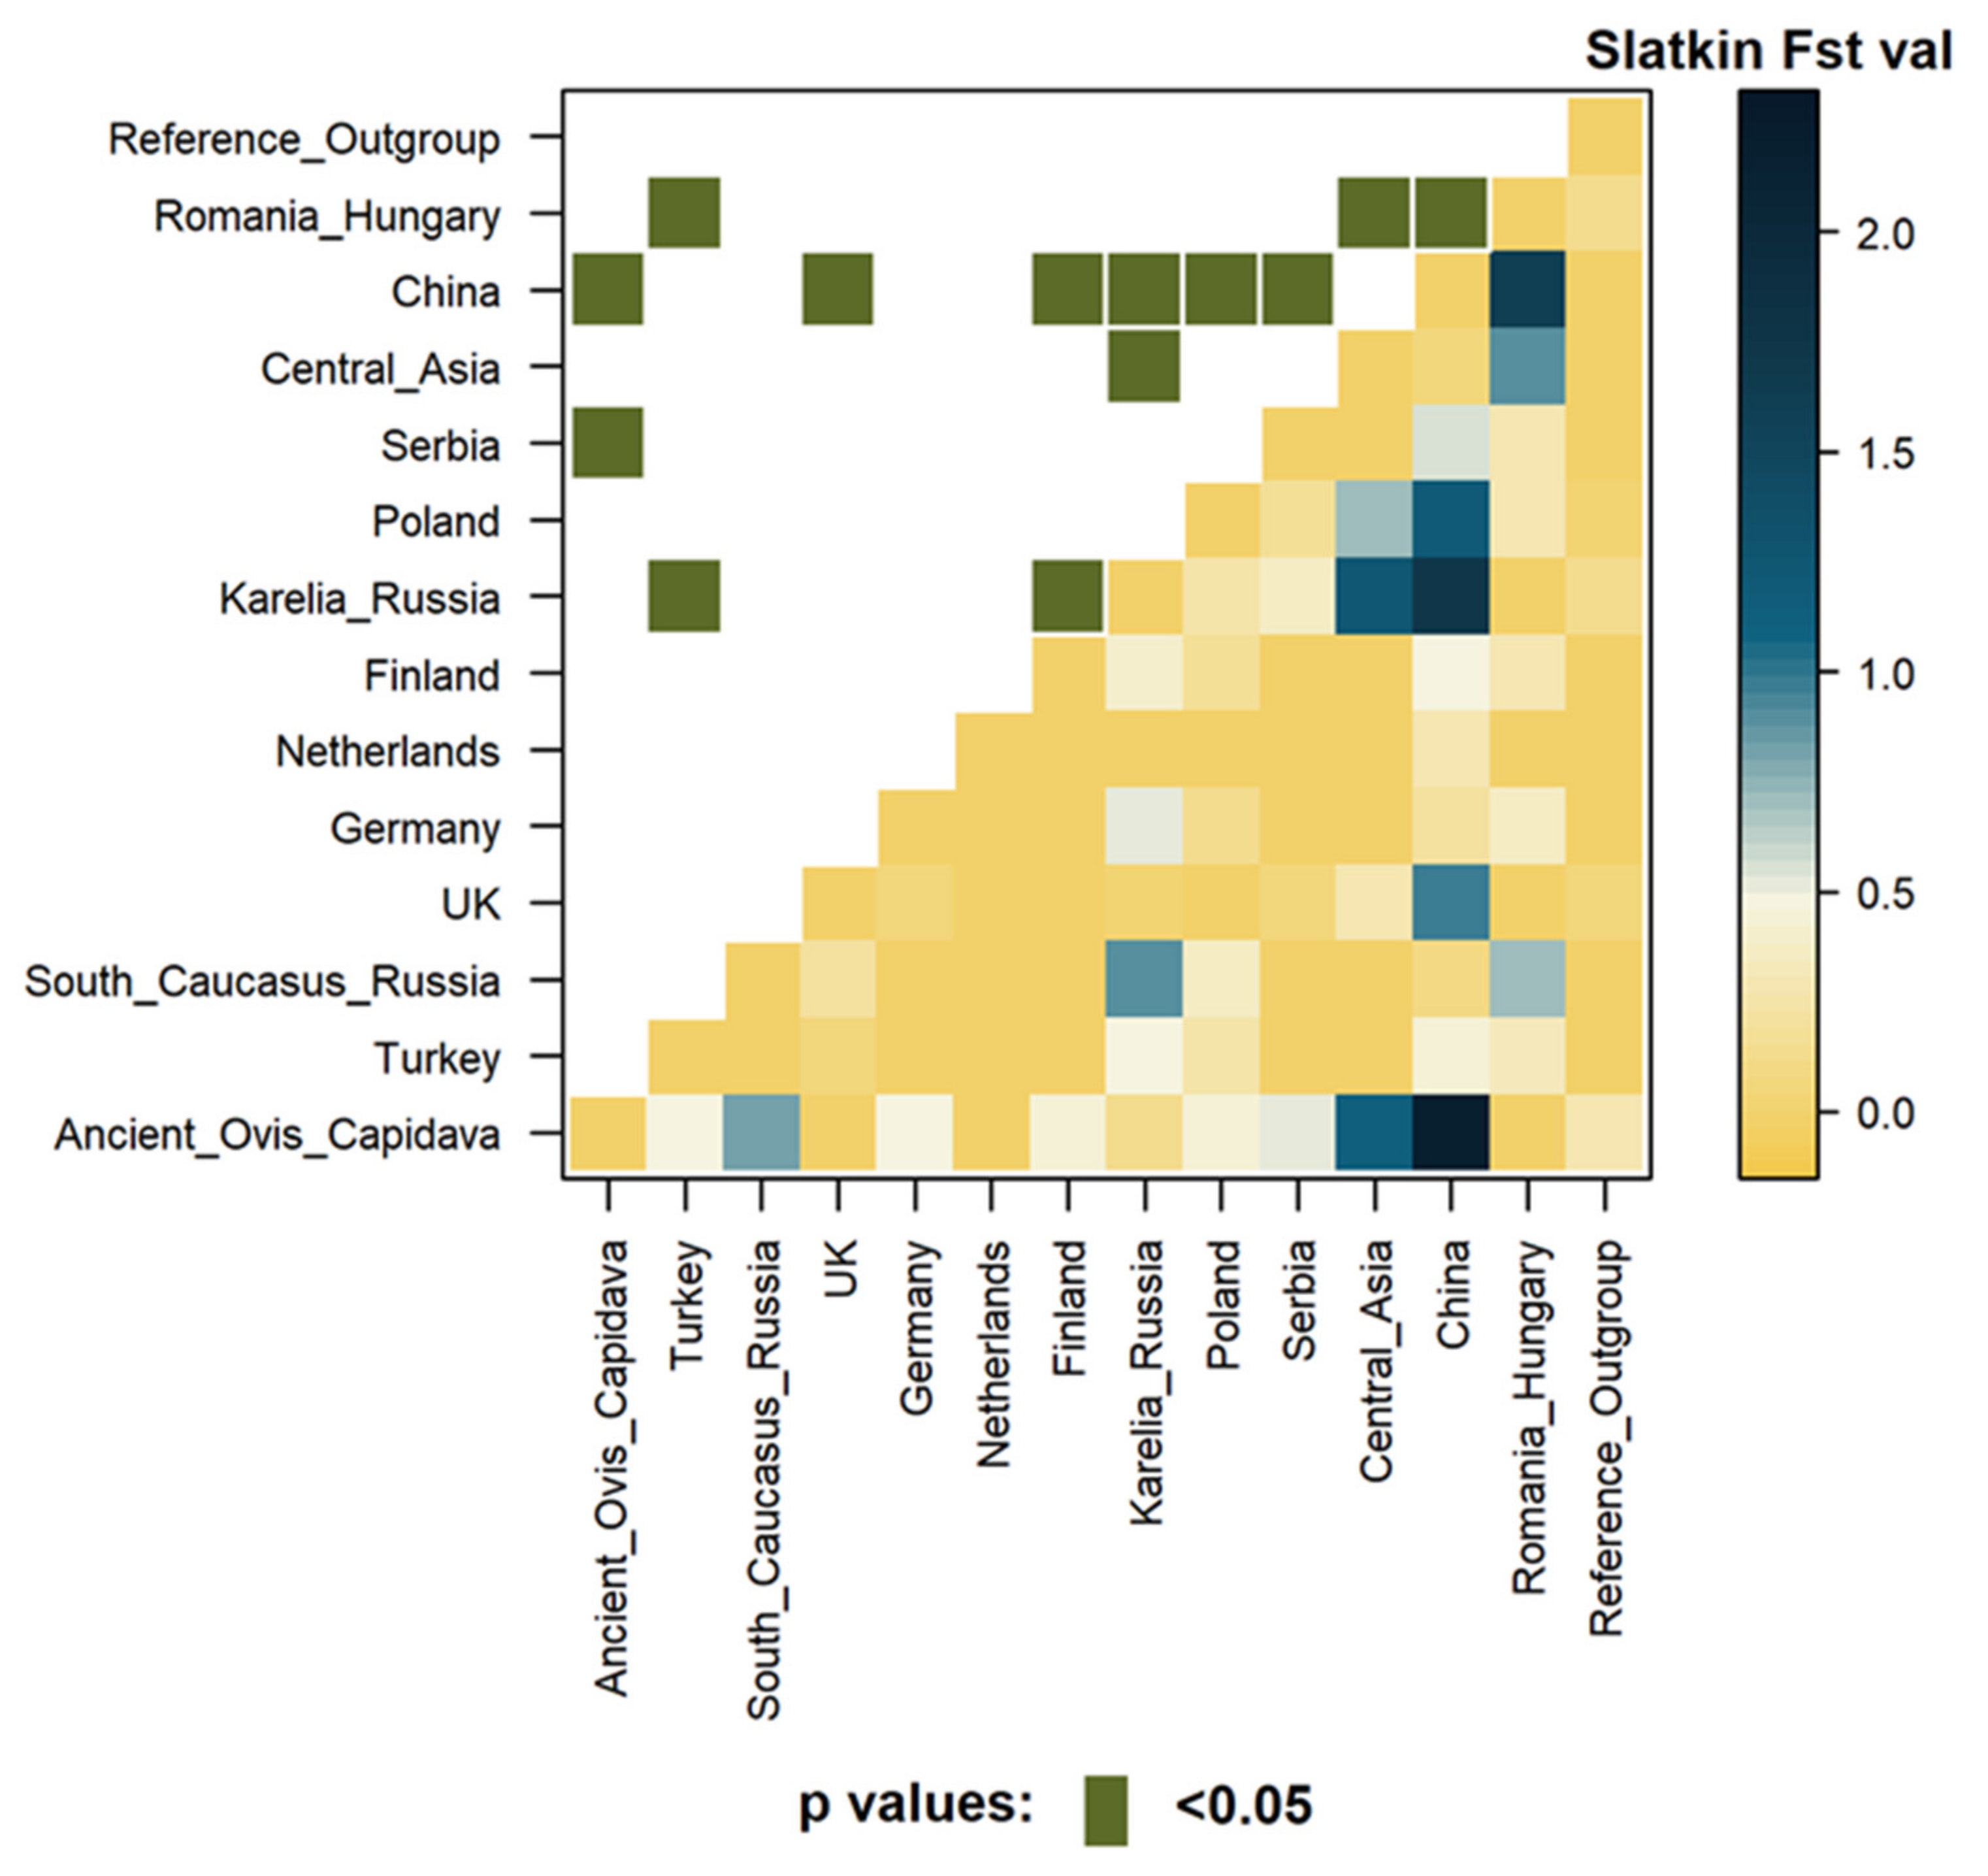
3.3.2. Genetic Distance Estimates

Pairwise genetic distances were calculated in order to estimate the degree of admixture between the sequences, and the results of Slatkin’s linearized Fst were displayed in heatmap form, with the lowest value indicating the shortest genetic distance (Figure 3). The exact Slatkin’s Fst values and their corresponding p-values are available in Table S3. The results of the pairwise genetic distances calculations were in agreement with those of the MJ Network and allowed for differentiation according to the historical period. As such, the closest sequence set to the Capidava cohort was that representative of the Estonian Iron Age (Slatkin’s Fst = 0), followed by the Estonian Late Bronze Age set (Slatkin’s Fst = 0.05265). The Finnish Iron Age set and the Estonian Late and Post Medieval set (Stalkin’s Fst = 0.0944) displayed a level of admixture similar to that of the Italian Medieval set (Stalkin’s Fst = 0.10663). The Estonian Medieval, Finnish Medieval, and Finnish Post Medieval sets showed the greatest genetic distance to the Capidava cohort out of the Northern European sequence sets, while the Altai populations’ position as the most genetically distant was clearly indicated.

3.4. Capidava Sheep Compared to Modern Populations

3.4.1. Haplotype Similarity Analysis

The degree of haplotype similarity between the populations was assessed through a Median Joining Network (Figure 4). For this analysis, only the haplogroup B sequences (37) of the data sets were chosen in order to better illustrate the position of the Capidava set compared to modern sequences belonging to the same haplogroup and facilitate result visualization. The MJ Network containing both the haplogroup B and haplogroup A sequences was, however, available as Figure S1.
The first important aspect illustrated by the network was the fact that all five Ovis_Cap sequences were at least one mutation step away from all of the modern sequences, sharing no identical haplotypes with current breeds. Thus, the resulting network position was representative of an ancient, diverse cohort.
Moreover, the Capidava sheep display similarity with breeds from Romania and Hungary, Turkey, the UK, Poland, the Russian province of Karelia and Finland, in accordance with the results of the ancient dataset analysis and further suggesting possible genetic continuity in the region of Romania. As such, Ovis_Cap_6 has two additional polymorphisms compared to the Turkish breed Karayaka, Ovis_Cap_4 and Ovis_Cap_5 were one mutation step away from the main haplotype shared by the Turkish Tuj, Finnish Landrace, British Oxford Down (Finnish subpopulation), Polish Olkuska and the Karelian Viena breed. Ovis_Cap_1 had one additional polymorphism compared to the Turkish Hemsin and Serbian Pramenka breeds, as well as to the main haplotype and the Gyimesi Racka/Turcana breed of Romanian and Hungarian origin. Ovis_Cap_2 lies two mutation steps away from Ovis_Cap_5.

3.4.2. Genetic Distance Estimates with Focus on Different Geographic Regions

While the MJ Network illustrates the level of haplotype similarity between the Capidava sequences and individual breeds, the results of the pairwise genetic distance analysis offer a broader picture of the degree of genetic distance, with values indicating closeness to a population of diverse breeds from a particular geographic region. The exact Slatkin’s linearized Fst values and their corresponding p-values are available in Table S4. Below, in Figure 5, they are displayed in heatmap form, with the lowest value indicating the shortest genetic distance. Overall, they illustrate which countries have modern sheep populations that more closely resemble the Capidava population.
As such, the results show that the populations from Romania and Hungary, the UK, and the Netherlands were the closest to the Capidava cohort (Slatkin’s Fst = 0), followed closely by the Karelian population (Slatkin’s Fst = 0.14991). The Turkish, Finnish, Polish, and German populations displayed similar degrees of genetic distance, with values ranging from 0.4 to 0.5, while the Chinese and Central Asian populations showed the highest degree of genetic distance.
Interestingly, there was a relatively high level of genetic distance between the Capidava and South Caucasus populations, which may not have been expected given the regions’ geographical proximity and access to the Black Sea. However, a comparable pattern was revealed by [11], who showed, based on nuclear markers, that the Caucasian Bozakh breed did not cluster with the Southern European Zackel breeds.

3.5. Analysis of Shared Haplotypes between the Capidava, Ancient, and Modern Datasets

When comparing the relative degree of haplotype sharing between the Capidava, ancient and modern datasets, a clear distinction can be made, with the ancient sets displaying higher levels of haplotype sharing with the Capidava set. The results of the relative number of shared haplotypes are presented below (Figure 6), in heatmap form, while the absolute numbers are given in Table S5.
Out of the ancient sequences, a historical, as well as a geographical distinction, can again be made, with the Finnish Iron Age, Estonian Iron Age, and Estonian Late and Post Medieval sequences showing the highest level of haplotype sharing, followed by the Estonian Medieval set (80%) and only then by the Italian Medieval set (60%). These results reinforced the similarity between the Ovis_Cap and Nordic, over Italian, sequences, but provide a different angle regarding which Nordic group shows the closest genetic affinity to the Capidava cohort than the results of the pairwise genetic difference analysis.
Out of the modern sequences, the results of the MJ Network (Figure 4) were supported, with the Karelian, Turkish, and Serbian sets displaying the highest level of haplotype sharing. Interestingly, the Romanian/Hungarian set showed one of the lowest levels of haplotype sharing (14.3%). What was also noteworthy was the fact that the Karelian set shared a higher percentage of its haplotypes with the Capidava set (83.3%) than the Estonian Medieval set.
When referring strictly to the Capidava cohort, 3 out of the 5 Capidava haplotypes, meaning 60%, were specific to the cohort, further indicating a diverse set which, while showing similarity to other cohorts, maintained a degree of uniqueness.

4. Discussion

Taken together, these results illustrate the relationship between the Capidava group and other sequences representative for different geographic regions and historical periods, providing insight into the degree of admixture and serving as a starting point for further investigation into potential trade routes and migration patterns.
As such, when compared to other ancient datasets, the Capidava sequences show the highest affinity to Nordic sequences. Similar patterns were identified in a previous study of mtDNA variation in ancient Finnish sheep, which showed close genetic connections with Southern and Eastern European breeds [8]. However, no clear, universal distinction between historical periods can be made, which may be a consequence of the observed continuity and consistency of genetic diversity through time in maternal lineages in the region [8,28].
The fact that the Capidava cohort is more tightly associated to Nordic, rather than Italian and shows no affinity to Altai sequences, indicates a possible tendency for North to South sheep trade and migration routes, rather than East to West (Figure 7). Yet, given the limitations of using a small sample size and only a partial mtDNA marker, this can only be treated as a hypothesis and would need to be further confirmed through genome-wide assessments performed on larger sample sizes.
Next, despite the fact that the Altai sheep populations are rather diverse, possibly due to strong cultural interactions in the region [27], the high degree of genetic distance between the Capidava and Altai populations serves as a prospective indicator of a lack of interaction along the Asian route at that time. Again, however, a potential Asian interaction may not have been revealed in this context due to the low number of ancient Ovis samples.
The results of the comparison with modern sequences facilitate the depiction of a slightly clearer image. The affinity of the Capidava group towards Nordic sequences is visible in the modern Finnish sequences as well, while the observed high level of genetic similarity with the sequences from the province of Karelia, in the Russian Federation, is in accordance with previous findings regarding the historical genetic influence of Russian breeds in those originating from Northern Europe [8,9]. Our findings are different than those of [11] in regards to the genetic affinity between Nordic and Southeast European breeds, however, this might be a consequence of the different genetic markers used. Nuclear SNPs reflect biparental ancestry and have higher resolution, while mitochondrial DNA only reflects maternal ancestry. As such, one possible explanation is that the close genetic distance and haplotype similarity between the Ovis_Cap samples and Nordic sequences might be the result of gene flow focused on ewes.
Another notable similarity is the one between the Capidava cohort and modern Turkish breeds, previously shown to have weak genetic structure, possibly as a consequence of intense human-mediated gene flow [60], and high haplotype diversity [2,26]. The entire cohort displays genetic similarity to the modern Turkish breeds, with Ovis_Cap_5 (9th–10th century AD) behaving no differently from three of the other samples (8th–9th century AD). The four samples originating from the 8th–10th century AD have one or two additional polymorphisms than the Turkish breeds. Ovis_Cap_2, however, dated to 5th–6th century AD, lies further away. Since the Ovis_Cap samples span the period between the 5th and 10th century AD, these results need to be analyzed from the perspective of Dobruja’s relationship with various invading nomadic tribes, as well as with the Byzantine Empire, which at the time occupied territory belonging to modern-day Turkey. The 5th–6th century saw Dobruja under loose Byzantine control, plagued by invasions from tribes such as the Slavs and Avars, but also the site of blooming trade, particularly in the 6th century [31]. The historical province became part of the First Bulgarian Empire at the end of the 7th century AD [31] and this occupation appears to be visible in the Capidava cohort as well. The four samples dated to the time of the Empire, which had strong ties to the Byzantines, show higher similarity to native Turkish breeds than Ovis_Cap_2, which is highly polymorphic but less similar to the Turkish sequences. While the historical record portrays the relationship between the Bulgarian and Byzantine Empires as complex and alternating between periods of alliance and war [31], our results indicate the possibility of a simpler, more constant dynamic for the everyday man, with no significant changes in local trade relationships for the last two centuries of the millennium. However, the skewed representation of time periods, with three Ovis_Cap samples originating from the 8th–9th century and only one originating from the 9th–10th century, could be hiding potential changes as a result of the tumultuous relationship between the two empires.
The results of the comparison with the modern Chinese sequences complete those of the comparison with the ancient Altai sequences and support the hypothesized lack of interaction along the Asian route, with the Chinese dataset showing the highest level of genetic distance out of the modern datasets. Moreover, 4 out of the 5 Chinese breeds analyzed, namely Tong, Small Tail Han, Hu, and Mongolian, originated from Mongolian sheep [61] (cited by [25]), [62], and, when combined with the geographical position of the Altai mountains at the border between Siberia, Mongolia and China, a distinct absence of Mongolian influence in Capidava sheep can be noted. This corresponds with the dating results, which place the Capidava samples centuries before the Mongol Invasion of Europe [31].
Another noteworthy aspect is the fact that the change in local occupation is visible in the Capidava cohort, with the Ovis_Cap_2 sample being more genetically distant from the modern breeds and ancient sequences than the rest of the Capidava samples. The Ovis_Cap samples originating from two different time frames during the Bulgarian occupation (8–9th and 9–10th AD) behave as part of the same, albeit diverse, group, and no difference in genetic closeness to both modern and ancient sequences can be observed. Ovis_Cap_5, even though it originates from a later period, shows the same pattern of affinity to ancient Nordic and modern Finnish, Turkish, Russian, and Polish as the other three sequences, which could indicate no major changes in the genetic make-up of local sheep at that time.
In order to further assess the possibility of genetic continuity in the region, the Ovis_Cap sequences were compared with sequences originating from both Romania and Hungary and belonging to the Gyimesi Racka and Turcana populations, considered to be one transboundary breed according to genetic data [47]. The sequences used for comparison belong to highly diverse populations of one of the most abundant and genetically diverse breed groups in Europe, the South-East European Zackel, namely the Pramenka subgroup [10,14,47]. In this case, the combined results of the MJ Network, pairwise genetic distance analysis and shared haplotype analysis paint an interesting picture. While the MJ Network shows no identical haplotypes between the ancient and modern populations, the ancient haplotype Ovis_Cap_1 has only one and two additional polymorphisms from two of the modern sequences, respectively. The results of the SHA indicate a similar tendency, with only 14.3% of the modern haplotypes being shared with the ancient population. The results of the pairwise genetic distance analysis, however, show that the Capidava cohort is closest to the Romanian/Hungarian dataset out of the modern datasets. As such, the absence of Ovis_Cap haplotypes in modern populations could suggest their possible loss due to artificial selection [8], while the close genetic distance between the ancient and modern datasets could suggest the fact that the process of artificial selection was based on local sheep populations.

5. Conclusions

This study provides new insight into the genetic history of sheep in Southeast Romania and facilitates the understanding of trade practices in Early Medieval Dobruja. The increased haplotype diversity of the Capidava cohort, coupled with a variable affinity towards sequences originating from different geographic regions, serve as a potential indicator of expanding sheep trade in Southeast Romania at that time.
The results of the comparisons with previously deposited ancient and modern sequences indicate a higher tendency for North to South sheep exchange, rather than East to West and serve as a potential confirmation of the documented lucrative trade between the First Bulgarian Empire and the Byzantine Empire. The samples cluster according to historical context, with the Bulgarian occupation being visible in the cohort.
The four samples dated to the 8th–10th century AD behave like one diverse cohort with no change in the way they cluster according to the period of origin (8–9th vs. 9–10th century AD), which indicates no significant changes in the genetic make-up of local sheep at that time. The comparison with modern Romanian/Hungarian sequences suggests that, while certain haplotypes may have been lost in time due to artificial selection, this process may have been based on ancient, local, populations.
However, as a consequence of the small size and the use of only a partial mtDNA marker, our study represents only a small part of the picture and can only put forward hypotheses regarding livestock treatment in historical Romania. Further research concerning larger sample sizes and spanning a larger time frame is needed in order to complete the picture of Romanian medieval trade practices.

Supplementary Materials

The following are available online at https://www.mdpi.com/article/10.3390/d13050208/s1, Table S1: Summary statistics, detailed results, and sequences sets used; Table S2: GenBank Accession Numbers of sequences used in comparative analyses (ancient/modern/reference); Table S3: Slatkin’s linearized Fst values and corresponding p-values for the ancient dataset; Table S4: Slatkin’s linearized Fst values and corresponding p-values for the modern dataset; Table S5: Shared haplotype analysis results; Figure S1: Median Joining Network of the entire modern dataset.

Author Contributions

Conceptualization, A.A., I.R. and B.K.; methodology, A.A., I.R., C.Z.-T. and B.K.; validation, I.R., C.M. and B.K.; formal analysis A.A., I.R., C.Z.-T., E.G., D.P. and O.G.; investigation, A.A., C.M., C.Z.-T., E.G., D.P. and O.G.; resources, I.R., D.P., O.G., C.U., Z.K.P., C.D., V.B. and B.K.; data curation, A.A. and I.R.; writing—original draft preparation, A.A.; writing—review and editing, I.R., C.M., C.Z.-T., E.G., D.P., O.G., C.U., Z.K.P., C.D., V.B., A.P. and B.K.; visualization, A.A. and I.R.; supervision, A.P. and B.K.; project administration, I.R. and B.K.; funding acquisition, A.A., I.R. and B.K. All authors have read and agreed to the published version of the manuscript.

Funding

AMS measurements have been performed at 1 MV Tandetron™ accelerator from “Horia Hulubei” National Institute for Physics and Nuclear Engineering (IFIN-HH) and were supported by the Romanian Government Programme through the National Programme for Installations of National Interest (IOSIN) and two authors (O.G. and D.P.) were supported from the Nucleus programme PN 19 06 02 02. I.R. was supported by Entrepreneurship for innovation through doctoral and postdoctoral research project, POCU/380/6/13/123886, co-financed by the European Social Fund, through the Operational Program for Human Capital 2014–2020. B.K. was supported by the Romanian Ministry of Research, Innovation and Digitization, CNCS/CCCDI–UEFISCDI, project number PN-III-P4-ID-PCE-2020-0518, within PNCDI III.

Institutional Review Board Statement

Not applicable.

Informed Consent Statement

Not applicable.

Data Availability Statement

The mtDNA sequences presented in this study were submitted to GenBank (https://www.ncbi.nlm.nih.gov/genbank/) under the accession numbers MW928520-MW928524. All other relevant data are within the paper and its Supplementary Materials.

Acknowledgments

This study has been supported by the College for Advanced Performance Studies, Babeș-Bolyai University, Cluj-Napoca, Romania.

Conflicts of Interest

The authors declare no conflict of interest.

References

  1. Zeder, M.A. Domestication and early agriculture in the Mediterranean Basin: Origins, diffusion, and impact. Proc. Natl. Acad. Sci. USA 2008, 105, 11597–11604. [Google Scholar] [CrossRef] [Green Version]
  2. Meadows, J.R.; Cemal, I.; Karaca, O.; Gootwine, E.; Kijas, J.W. Five ovine mitochondrial lineages identified from sheep breeds of the near east. Genetics 2007, 175, 1371–1379. [Google Scholar] [CrossRef] [PubMed] [Green Version]
  3. Hiendleder, S.; Kaupe, B.; Wassmuth, R.; Janke, A. Molecular analysis of wild and domestic sheep questions current nomenclature and provides evidence for domestication from two different subspecies. Proc. R. Soc. B Biol. Sci. 2002, 269, 893–904. [Google Scholar] [CrossRef] [Green Version]
  4. Hiendleder, S.; Lewalski, H.; Wassmuth, R.; Janke, A. The complete mitochondrial DNA sequence of the domestic sheep (Ovis aries) and comparison with the other major ovine haplotype. J. Mol. Evol. 1998, 47, 441–448. [Google Scholar] [CrossRef]
  5. Chessa, B.; Pereira, F.; Arnaud, F.; Amorim, A.; Goyache, F.; Mainland, I.; Kao, R.R.; Pemberton, J.M.; Beraldi, D.; Stear, M.J.; et al. Revealing the history of sheep domestication using retrovirus integrations. Science 2009, 324, 532–536. [Google Scholar] [CrossRef] [PubMed] [Green Version]
  6. Zilhão, J. Radiocarbon evidence for maritime pioneer colonization at the origins of farming in west Mediterranean Europe. Proc. Natl. Acad. Sci. USA 2001, 98, 14180–14185. [Google Scholar] [CrossRef] [Green Version]
  7. Ryder, M. Sheep. In Evolution of Domesticated Animals; Mason, I.L., Ed.; Longman: London, UK; New York, NY, USA, 1984; Volume 1, pp. 63–85. [Google Scholar]
  8. Niemi, M.; Bläuer, A.; Iso-Touru, T.; Nyström, V.; Harjula, J.; Taavitsainen, J.P.; Storå, J.; Lidén, K.; Kantanen, J. Mitochondrial DNA and Y-chromosomal diversity in ancient populations of domestic sheep (Ovis aries) in Finland: Comparison with contemporary sheep breeds. Genet. Sel. Evol. 2013, 45, 2. [Google Scholar] [CrossRef] [PubMed] [Green Version]
  9. Tapio, M.; Marzanov, N.; Ozerov, M.; Ćinkulov, M.; Gonzarenko, G.; Kiselyova, T.; Murawski, M.; Viinalass, H.; Kantanen, J. Sheep mitochondrial DNA variation in European, Caucasian, and Central Asian areas. Mol. Biol. Evol. 2006, 23, 1776–1783. [Google Scholar] [CrossRef] [PubMed]
  10. Ćinkulov, M.; Popovski, Z.; Porcu, K.; Tanaskovska, B.; Hodžić, A.; Bytyqi, H.; Mehmeti, H.; Margeta, V.; Djedović, R.; Hoda, A.; et al. Genetic diversity and structure of the West Balkan Pramenka sheep types as revealed by microsatellite and mitochondrial DNA analysis. J. Anim. Breed. Genet. 2008, 215, 417–426. [Google Scholar] [CrossRef]
  11. Tapio, M.; Ozerov, M.; Tapio, I.; Toro, M.A.; Marzanov, N.; Ćinkulov, M.; Goncharenko, G.; Kiselyova, T.; Murawski, M.; Kantanen, J. Microsatellite-based genetic diversity and population structure of domestic sheep in northern Eurasia. BMC Genet. 2010, 11, 76. [Google Scholar] [CrossRef] [PubMed] [Green Version]
  12. Handley, L.L.; Byrne, K.; Santucci, F.; Townsend, S.; Taylor, M.; Bruford, M.W.; Hewitt, G.M. Genetic structure of European sheep breeds. Heredity 2007, 99, 620–631. [Google Scholar] [CrossRef] [PubMed] [Green Version]
  13. Pariset, L.; Mariotti, M.; Gargani, M.; Joost, S.; Negrini, R.; Perez, T.; Bruford, M.; Ajmone Marsan, P.; Valentini, A. Genetic diversity of sheep breeds from Albania, Greece, and Italy assessed by mitochondrial DNA and nuclear polymorphisms (SNPs). Sci. World J. 2011, 11, 41–59. [Google Scholar] [CrossRef] [PubMed] [Green Version]
  14. Peter, C.; Bruford, M.; Perez, T.; Dalamitra, S.; Hewitt, G.; Erhardt, G. Genetic diversity and subdivision of 57 European and Middle-Eastern sheep breeds. Anim. Genet. 2007, 38, 37–44. [Google Scholar] [CrossRef]
  15. Ciani, E.; Mastrangelo, S.; Da Silva, A.; Marroni, F.; Ferenčaković, M.; Ajmone-Marsan, P.; Baird, H.; Barbato, M.; Colli, L.; Delvento, C.; et al. On the origin of European sheep as revealed by the diversity of the Balkan breeds and by optimizing population-genetic analysis tools. Genet. Sel. Evol. 2020, 52, 1–14. [Google Scholar] [CrossRef]
  16. Bruford, M.W.; Bradley, D.G.; Luikart, G. DNA markers reveal the complexity of livestock domestication. Nat. Rev. Genet. 2003, 4, 900–910. [Google Scholar] [CrossRef] [PubMed]
  17. Taberlet, P.; Valentini, A.; Rezaei, H.R.; Naderi, S.; Pompanon, F.; Negrini, R.; Ajmone-Marsan, P. Are cattle, sheep, and goats endangered species? Mol. Ecol. 2008, 17, 275–284. [Google Scholar] [CrossRef]
  18. Chen, S.Y.; Duan, Z.Y.; Sha, T.; Xiangyu, J.; Wu, S.F.; Zhang, Y.P. Origin, genetic diversity, and population structure of Chinese domestic sheep. Gene 2006, 376, 216–223. [Google Scholar] [CrossRef] [PubMed]
  19. Zhao, E.; Yu, Q.; Zhang, N.; Kong, D.; Zhao, Y. Mitochondrial DNA diversity and the origin of Chinese indigenous sheep. Trop. Anim. Health Prod. 2013, 45, 1715–1722. [Google Scholar] [CrossRef] [PubMed]
  20. Kijas, J.W.; Lenstra, J.A.; Hayes, B.; Boitard, S.; Neto, L.R.P.; San Cristobal, M.; Servin, B.; McCulloch, R.; Whan, V.; Gietzen, K.; et al. Genome-wide analysis of the world’s sheep breeds reveals high levels of historic mixture and strong recent selection. PLoS Biol. 2012, 10, e1001258. [Google Scholar] [CrossRef] [Green Version]
  21. Meadows, J.R.S.; Li, K.; Kantanen, J.; Tapio, M.; Sipos, W.; Pardeshi, V.; Gupta, V.; Calvo, J.H.; Whan, V.; Norris, B.; et al. Mitochondrial sequence reveals high levels of gene flow between breeds of domestic sheep from Asia and Europe. J. Hered. 2005, 96, 494–501. [Google Scholar] [CrossRef] [Green Version]
  22. Niemi, M.; Sajantila, A.; Ahola, V.; Vilkki, J. Sheep and cattle population dynamics based on ancient and modern DNA reflects key events in the human history of the North-East Baltic Sea Region. J. Archaeol. Sci. Rep. 2018, 18, 169–173. [Google Scholar] [CrossRef]
  23. Olivieri, C.; Ermini, L.; Rizzi, E.; Corti, G.; Luciani, S.; Marota, I.; De Bellis, G.; Rollo, F. Phylogenetic position of a copper age sheep (Ovis aries) mitochondrial DNA. PLoS ONE 2012, 7, e33792. [Google Scholar] [CrossRef] [Green Version]
  24. Cai, D.; Tang, Z.; Yu, H.; Han, L.; Ren, X.; Zhao, X.; Zhu, H.; Zhou, H. Early history of Chinese domestic sheep indicated by ancient DNA analysis of Bronze Age individuals. J. Archaeol. Sci. 2011, 38, 896–902. [Google Scholar] [CrossRef]
  25. Cai, D.W.; Han, L.; Zhang, X.L.; Zhou, H.; Zhu, H. DNA analysis of archaeological sheep remains from China. J. Archaeol. Sci. 2007, 34, 1347–1355. [Google Scholar] [CrossRef]
  26. Demirci, S.; Baştanlar, E.K.; Dağtaş, N.D.; Pişkin, E.; Engin, A.; Özer, F.; Yüncü, E.; Doğan, Ş.A.; Togan, I. Mitochondrial DNA diversity of modern, ancient and wild sheep (Ovis gmelinii anatolica) from Turkey: New insights on the evolutionary history of sheep. PLoS ONE 2013, 8, e81952. [Google Scholar] [CrossRef] [PubMed] [Green Version]
  27. Dymova, M.A.; Zadorozhny, A.V.; Mishukova, O.V.; Khrapov, E.A.; Druzhkova, A.S.; Trifonov, V.A.; Kichigin, I.G.; Tishkin, A.A.; Grushin, S.P.; Filipenko, M.L. Mitochondrial DNA analysis of ancient sheep from Altai. Anim Genet. 2017, 48, 615–618. [Google Scholar] [CrossRef] [PubMed]
  28. Rannamäe, E.; Lõugas, L.; Speller, C.F.; Valk, H.; Maldre, L.; Wilczyński, J.; Mikhailov, A.; Saarma, U. Three thousand years of continuity in the maternal lineages of ancient sheep (Ovis aries) in Estonia. PLoS ONE 2016, 11, e0163676. [Google Scholar] [CrossRef]
  29. Rannamäe, E.; Lõugas, L.; Niemi, M.; Kantanen, J.; Maldre, L.; Kadõrova, N.; Saarma, U. Maternal and paternal genetic diversity of ancient sheep in Estonia from the Late Bronze Age to the post-medieval period and comparison with other regions in Eurasia. Anim. Genet. 2015, 47, 208–218. [Google Scholar] [CrossRef] [PubMed]
  30. Gabbianelli, F.; Gargani, M.; Pariset, L.; Mariotti, M.; Alhaique, F.; De Minicis, E.; Barelli, L.; Ciammetti, E.; Redi, F.; Valentini, A. Mitochondrial DNA analysis of medieval sheep (Ovis aries) in central Italy reveals the predominance of haplogroup B already in the Middle Ages. Anim. Genet. 2015, 46, 329–332. [Google Scholar] [CrossRef]
  31. Curta, F.; Stephenson, P. Southeastern Europe in the Middle Ages 500–1250; Cambridge University Press: Cambridge, UK, 2006. [Google Scholar]
  32. Rusu, I.; Modi, A.; Vai, S.; Pilli, E.; Mircea, C.; Radu, C.; Urduzia, C.; Pinter, Z.K.; Bodolică, V.; Dobrinescu, C.; et al. Maternal DNA lineages at the gate of Europe in the 10th century AD. PLoS ONE 2018, 13, e0193578. [Google Scholar] [CrossRef] [PubMed] [Green Version]
  33. Pinter, Z.K.; Dobrinescu, C.I.; Dragotă, A.; Kelemen, B. Preliminary Research in Capidava Medieval Necropolis (Topalu com., Constanţa County). Pontica 2011, 44, 387–400. [Google Scholar]
  34. Harvey, V.L.; Egerton, V.M.; Chamberlain, A.T.; Manning, P.L.; Buckley, M. Collagen Fingerprinting: A new screening technique for radiocarbon dating ancient bone. PLoS ONE 2016, 11, e0150650. [Google Scholar] [CrossRef] [PubMed] [Green Version]
  35. Brock, F.; Geoghegan, V.; Thomas, B.; Jurkschat, K.; Higham, T.F.G. Analysis of bone “collagen” extraction products for radiocarbon dating. Radiocarbon 2013, 55, 445–463. [Google Scholar] [CrossRef] [Green Version]
  36. Yizhaq, M.; Mintz, G.; Cohen, I.; Khalaily, H.; Weiner, S.; Boaretto, E. Quality controlled radiocarbon dating of bones and charcoal from the early pre-pottery neolithic β (ppnb) of Motza (Israel). Radiocarbon 2005, 47, 193–206. [Google Scholar] [CrossRef] [Green Version]
  37. Stan-Sion, C.; Enachescu, M.; Ghita, D.G.; Calinescu, C.I.; Petre, A.; Mosu, D.V.; Klein, M. A new AMS facility based on a Cockcroft-Walton type 1 MV tandetron at IFIN-HH Magurele, Romania. Nuclear Instrum. Methods Phys. Res. Sect. B Beam Interact. Mater. Atoms. 2014, 319, 117–122. [Google Scholar] [CrossRef]
  38. Wacker, L.; Němec, M.; Bourquin, J. A revolutionary graphitisation system: Fully automated, compact and simple. Nuclear Instrum. Methods Phys. Res. Sect. B Beam Interact. Mater. Atoms. 2010, 268, 931–934. [Google Scholar] [CrossRef]
  39. 4990C NS. International Standard Reference Material for Contemporary Carbon-14, NIST: USA.
  40. Wacker, L.; Christl, M.; Synal, H.A. Bats: A new tool for AMS data reduction. Nuclear Instrum. Methods Phys. Res. B. 2010, 268, 976–979. [Google Scholar] [CrossRef]
  41. Bronk Ramsey, C. Analysis of chronological information and radiocarbon calibration: The program OxCal. Archaeol. Comput. Newsl. 1994, 41, 11–16. [Google Scholar]
  42. Reimer, P.J.; Austin, W.E.; Bard, E.; Bayliss, A.; Blackwell, P.G.; Ramsey, C.B.; Butzin, M.; Cheng, H.; Edwards, R.L.; Friedrich, M.; et al. The IntCal20 Northern Hemisphere Radiocarbon Age Calibration Curve (0–55 cal kBP). Radiocarbon 2020, 62, 725–757. [Google Scholar] [CrossRef]
  43. Yang, D.Y.; Eng, B.; Waye, J.S.; Dudar, J.C.; Saunders, S.R. Technical Note: Improved DNA Extraction from Ancient Bones Using Silica-Based Spin Columns. Am. J. Phys. Anthropol. 1998, 105, 539–543. [Google Scholar] [CrossRef]
  44. Hervella, M.; Izagirre, N.; Alonso, S.; Fregel, R.; Alonso, A.; Cabrera, V.M.; de la Rúa, C. Ancient DNA from hunter-gatherer and farmer groups from Northern Spain supports a random dispersion model for the Neolithic expansion into Europe. PLoS ONE 2012, 7, e34417. [Google Scholar] [CrossRef]
  45. Rohland, N.; Glocke, I.; Aximu-Petri, A.; Meyer, M. Extraction of highly degraded DNA from ancient bones, teeth and sediments for high-throughput sequencing. Nat. Protoc. 2018, 13, 2447–2461. [Google Scholar] [CrossRef]
  46. Dabney, J.; Knapp, M.; Glocke, I.; Gansauge, M.T.; Weihmann, A.; Nickel, B.; Valdiosera, C.; García, N.; Pääbo, S.; Arsuaga, J.L.; et al. Complete mitochondrial genome sequence of a Middle Pleistocene cave bear reconstructed from ultrashort DNA fragments. Proc. Natl. Acad. Sci. USA 2013, 110, 15758–15763. [Google Scholar] [CrossRef] [PubMed] [Green Version]
  47. Kusza, S.; Zakar, E.; Budai, C.; Cziszter, L.T.; Padeanu, I.; Gavojdian, D. Mitochondrial DNA variability in Gyimesi Racka and Turcana sheep breeds. Acta Biochim. Pol. 2015, 62, 273–280. [Google Scholar] [CrossRef] [PubMed]
  48. Guo, J.; Du, L.X.; Ma, Y.H.; Guan, W.J.; Li, H.B.; Zhao, Q.J.; Li, X.; Rao, S.Q. A novel maternal lineage revealed in sheep (Ovis aries). Anim. Genet. 2005, 36, 331–336. [Google Scholar] [CrossRef]
  49. Meadows, J.R.S.; Hiendleder, S.; Kijas, J.W. Haplogroup relationships between domestic and wild sheep resolved using a mitogenome panel. Heredity 2011, 106, 700–706. [Google Scholar] [CrossRef] [Green Version]
  50. Pedrosa, S.; Uzun, M.; Arranz, J.J.; Gutiérrez-Gil, B.; San Primitivo, F.; Bayón, Y. Evidence of three maternal lineages in near eastern sheep supporting multiple domestication events. Proc. R. Soc. B Biol. Sci. 2005, 272, 2211–2217. [Google Scholar] [CrossRef] [Green Version]
  51. Bandelt, H.J.; Forster, P.; Röhl, A. Median-joining networks for inferring intraspecific phylogenies. Mol. Biol. Evol. 1999, 16, 37–48. [Google Scholar] [CrossRef] [PubMed]
  52. Leigh, J.; Bryant, D. PopART: Full-feature software for haplotype network construction. Methods Ecol. Evol. 2015, 6, 1110–1116. [Google Scholar] [CrossRef]
  53. Excoffier, L.; Lischer, H.E. Arlequin suite ver 3.5: A new series of programs to perform population genetics analyses under Linux and Windows. Mol. Ecol. Resour. 2010, 10, 564–567. [Google Scholar] [CrossRef]
  54. Darriba, D.; Taboada, G.L.; Doallo, R.; Posada, D.J. jModelTest 2: More models, new heuristics and high-performance computing. Nat. Methods 2012, 9, 772. [Google Scholar] [CrossRef] [Green Version]
  55. Guindon, S.; Gascuel, O. A Simple, Fast, and Accurate Algorithm to Estimate Large Phylogenies by Maximum Likelihood. Syst. Biol. 2003, 52, 696–704. [Google Scholar] [CrossRef] [PubMed] [Green Version]
  56. Kimura, M. A simple method for estimating evolutionary rates of base substitutions through comparative studies of nucleotide sequences. J. Mol. Evol. 1980, 16, 111–120. [Google Scholar] [CrossRef]
  57. R.C. Team. R: A Language and Environment for Statistical Computing; R Foundation for Statistical Computing: Vienna, Austria, 2020. [Google Scholar]
  58. Association. Q. QGIS Geographic Information System. QGIS.org. 2020. Available online: http://www.qgis.org (accessed on 15 December 2020).
  59. Fulton, T.L. Setting up an Ancient DNA Laboratory. In Ancient DNA Methods and Protocols; Shapiro, B., Hofreiter, M., Eds.; Humana Press: Totowa, NJ, USA, 2009. [Google Scholar]
  60. Oner, Y.; Calvo, J.H.; Elmaci, C. Investigation of the genetic diversity among native Turkish sheep breeds using mtDNA polymorphisms. Trop. Anim. Health Prod. 2013, 45, 947–951. [Google Scholar] [CrossRef] [PubMed]
  61. Luo, Y.Z.; Batsuuri, L.; Badamdorj, D.; Olivier, H.; Han, J.L. Origin and genetic diversity of Mongolian and Chinese sheep using mitochondrial DNA D-loop sequences. Acta Genet. Sin. 2005, 32, 1256–1265. [Google Scholar] [PubMed]
  62. Zhao, Y.; Zhao, E.; Zhang, N.; Duan, C. Mitochondrial DNA diversity, origin, and phylogenic relationships of three Chinese large-fat-tailed sheep breeds. Trop. Anim. Health Prod. 2011, 43, 1405–1410. [Google Scholar] [CrossRef] [PubMed]
Figure 1. Scatterplot graph of haplotype and nucleotide diversities, comparing the Capidava cohort with modern and historical sequence sets.
Diversity 13 00208 g001
Figure 2. MJ Network illustrating the position of the Capidava cohort relative to the five Ovis aries haplogroup reference sequences and 41 ancient sequences grouped according to geographical origin and historical period, performed on a 304 bp region, nucleotide positions 16099 to 16402 (NC_001941). Node size is proportional to the number of sequences, as indicated in the figure legend. Cross lines represent the number of mutations. Branch length is not relevant.
Diversity 13 00208 g002
Figure 3. Heatmap displaying the genetic distances between the Capidava population and 41 ancient sequences grouped according to geographical origin and historical period. Slatkin’s Fst values ranging from 0 to 6 are color-coded, with yellow shades indicating low genetic distance and red and purple shades indicating high genetic distance. Blank squares indicate inconclusive results. The analysis was performed on a 304 bp region, nucleotide positions 16099 to 16402 (NC_001941).
Diversity 13 00208 g003
Figure 4. Median Joining Network illustrating the degree of haplotype similarity between the Capidava cohort and 37 sequences representing various modern breeds originating from different countries. The analysis was performed on a 474 bp region, nucleotide positions 16027 to 16500 (NC_001941). Node size is proportional to the number of sequences, as indicated in the figure legend. Cross lines represent the number of mutations. Branch length is not relevant.
Diversity 13 00208 g004
Figure 5. Heatmap displaying the genetic distances between the Capidava population and 59 modern sequences grouped according to country of origin. Slatkin’s Fst values ranging from 0 to 2 are color-coded, with yellow shades indicating low genetic distance and blue shades indicating high genetic distance. The analysis was performed on a 474 bp region, nucleotide positions 16027 to 16500 (NC_001941).
Diversity 13 00208 g005
Figure 6. Heatmap of shared haplotype analysis between the Capidava population and 88 ancient and modern sequences grouped according to country of origin and historical period, based on the relative (%) number of shared haplotypes. The analysis was performed on a 304 bp region, nucleotide positions 16092 to 16396 (NC_001941).
Diversity 13 00208 g006
Figure 7. Geographic visualization of pairwise genetic differences between the Capidava cohort and the ancient sequences sets, displayed as Slatkin’s linearized Fst values, in heatmap form.
Diversity 13 00208 g007
Table 1. Radiocarbon dating, informative DNA sequence length, and SNP positions for the Capidava cohort. Blank areas denote a lack of information.
SampleAge
(Cal. AD)
Amplified
Fragment
Length
Variable Position
1599316042160481612816208162931634316343.11634716440164721648416496
NC_001941 CTTCAAT-CTTCT
Ovis_Cap_1771–899 AD598 bpTCTTAACCCT-CT
Ovis_Cap_2418–550 AD529 bp TTTGGCCCT-TT
Ovis_Cap_3424–564 AD
Ovis_Cap_4771–885 AD529 bp TTTAACCTT-CT
Ovis_Cap_5870–991 AD529 bpTTTGACCCT-CT
Ovis_Cap_6771–884 AD529 bpTCTAACCCC-CC
Ovis_Cap_7271–351 AD
Publisher’s Note: MDPI stays neutral with regard to jurisdictional claims in published maps and institutional affiliations.

