
The Diversity and Community Assembly Process of Wetland Plants from Lakeshores on the Qinghai-Tibetan Plateau
by
 ,
,
Shasha Cui
1,2,3,†, 
Jian Ouyang
1,2,3,4,†,
Yu Lu
1,5,
Wenzhi Liu
1,
Wenyang Li
1,
Guihua Liu
1,* and
Wen Zhou
1,* 1
CAS Key Laboratory of Aquatic Botany and Watershed Ecology, Wuhan Botanical Garden, Chinese Academy of Sciences, Wuhan 430074, China
2
Research Center for Ecology and Environment of Qinghai-Tibetan Plateau, Tibet University, Lhasa 850000, China
3
College of Science, Tibet University, Lhasa 850000, China
4
Hubei Provincial Academy of Eco-Environmental Sciences, Wuhan 430072, China
5
College of Forestry, Jiangxi Agricultural University, Nanchang 330045, China
*
Authors to whom correspondence should be addressed.
†
The first two authors contributed equally to this work.
Diversity 2021, 13(12), 685; https://doi.org/10.3390/d13120685
Submission received: 11 November 2021
/
Revised: 18 December 2021
/
Accepted: 19 December 2021
/
Published: 20 December 2021
(This article belongs to the Special Issue Women’s Special Issue Series: Diversity)
Abstract
:Unravelling the patterns, potential processes and mechanisms underlying biodiversity has always been a crucial issue in community ecology. It is also a necessary first step for any conservation and restoration to better adapt fragile ecosystems to a changing climate. However, little is known regarding the structure and maintenance of plant communities in typical high-altitude wetlands. Here, we made a comprehensive analysis of the diversity and composition of wetland plant communities based on the distribution of plants near the shorelines of 19 lakes across the Qinghai-Tibetan Plateau. The latitude, mean annual temperature (MAT) and mean annual precipitation (MAP), along with the edaphic properties, were the dominant predictors affecting the taxonomic and phylogenetic α-diversity. Besides diversification, ecological drift, mixing with weak dispersal and weak selection shaped the community composition of wetland plants in our study. The latitude and MAP predictors, although modest, showed an impact on the community structure.
1. Introduction
Biodiversity is the total diversity of life within a biological system, which includes the variation among genes, species and functional traits [1,2]. Understanding the current biodiversity helps us to predict its likely response to a changing environment, and in addition, determine strategies for effective conservation and sustainable use [1,3]. Biodiversity is complex and multidimensional in nature, given it results from multiple levels of community organization. The most widely used measure is taxonomic diversity, such as species richness. When this index is used alone, however, it will miss some information for diversity in the community [2]. Several studies have indicated that phylogenetic diversity combines information from both ecology and evolutionary history, hence better represents the ecological variation in functional traits [4,5,6,7]. Consequently, simultaneous consideration of taxonomic (a surrogate for genetic), functional (based on ecological roles) and structural (based on species abundance) diversity is necessarily required [2,5].
Although diversity patterns are increasingly well documented, determining the potential processes and mechanisms of their maintenance constitutes one of the most important challenges to ecologists [1,8]. It has been generally accepted that the composition of local plant communities arises from the combined effects of evolutionary and ecological processes [9,10]. In general, the mechanisms that contribute to the composition and diversity within species are referred to as evolutionary processes. They include four fundamental classes: mutation, selection, gene flow, and genetic drift [11]. In contrast, the mechanisms governing the composition and diversity among species are ecological processes, including diversification/speciation, selection, dispersal and ecological drift [12]. These four classes unite deterministic (e.g., selection) and stochastic (e.g., drift) processes (diversification and dispersal involve both) based on the niche and neutral perspectives [11,13], although is also proposed in the microbial community, following from fundamental principles in the community ecology. In fact, increasing numbers of researchers have provided evidence that both deterministic and stochastic processes are supposed to jointly structure the community assembly. Consequently, the central debate has been transferred to the relative contribution of the neutral and deterministic processes in community composition and maintaining [14,15,16].
It is generally believed that the patterns of plant composition and diversity depend on evolutionary, geospatial and ecological factors, as well as on human disturbance [17]. Over large areas, species richness and diversity are known to co-vary with climate, typically being lower at high latitudes and higher towards the equator [18,19]. This might be because climate determines water availability, ambient energy levels, and habitat heterogeneity [20,21], which were reported as the most important predictors for vascular plant richness at the global scale [22]. However, the mechanisms connecting these factors to species composition and diversity are still debated [20,23]; this may reflect the observation that the dependence of biodiversity on predictors is not always linear and the contribution of some predictors varies by region [17,24]. Given the typically remote location and difficult access of high-altitude wetlands, the aquatic plants there are seldom included in these studies, and the few available often provide opposite trends [25]. For instance, Crow [26] reported that aquatic plants in numerous tropical aquatic habitats in Costa Rica had a low level of diversity, while a higher level was observed at warm temperature latitudes and a surprisingly high level at cold temperature latitudes in North America. Even though our understanding of the species composition and diversity patterns in the terrestrial ecosystem is improving considerably, few studies are available for wetland plants, especially at high altitudes.
The Qinghai-Tibetan Plateau (QTP) is the largest high-altitude wetland region on the earth, and one of the most sensitive regions to changing environments [16,27]. Given the rapid and continuous speciation and diversification of plants caused by relatively rapid and uniform geological uplift, and a lesser influence by human activities, the QTP is an appropriate and unique region to detect the potential processes and mechanisms underlying biodiversity [28]. The aims of the present study were (1) to evaluate the relative importance of geographical and environmental factors in taxonomic and phylogenetic diversity of alpine wetlands, and (2) to reveal the potential process for the wetland plants community assembly. We carried out a large-scale survey of the plant community composition and edaphic properties for 19 nature wetlands across the QTP and proposed to test the following two hypotheses: (1) the patterns and the predictors of taxonomic and phylogenetic diversity are consistent in different communities, and (2) both spatial and environmental factors are collaboratively responsible for the community assembly. We expected that a combination of taxonomic and phylogenetic information would give us a more comprehensive understanding of the mechanisms underlying the structure and maintenance of biodiversity, and further would facilitate the management and restoration of the high-altitude wetland plant communities.
2. Materials and Methods
2.1. Vegetation Survey and Sample Collection
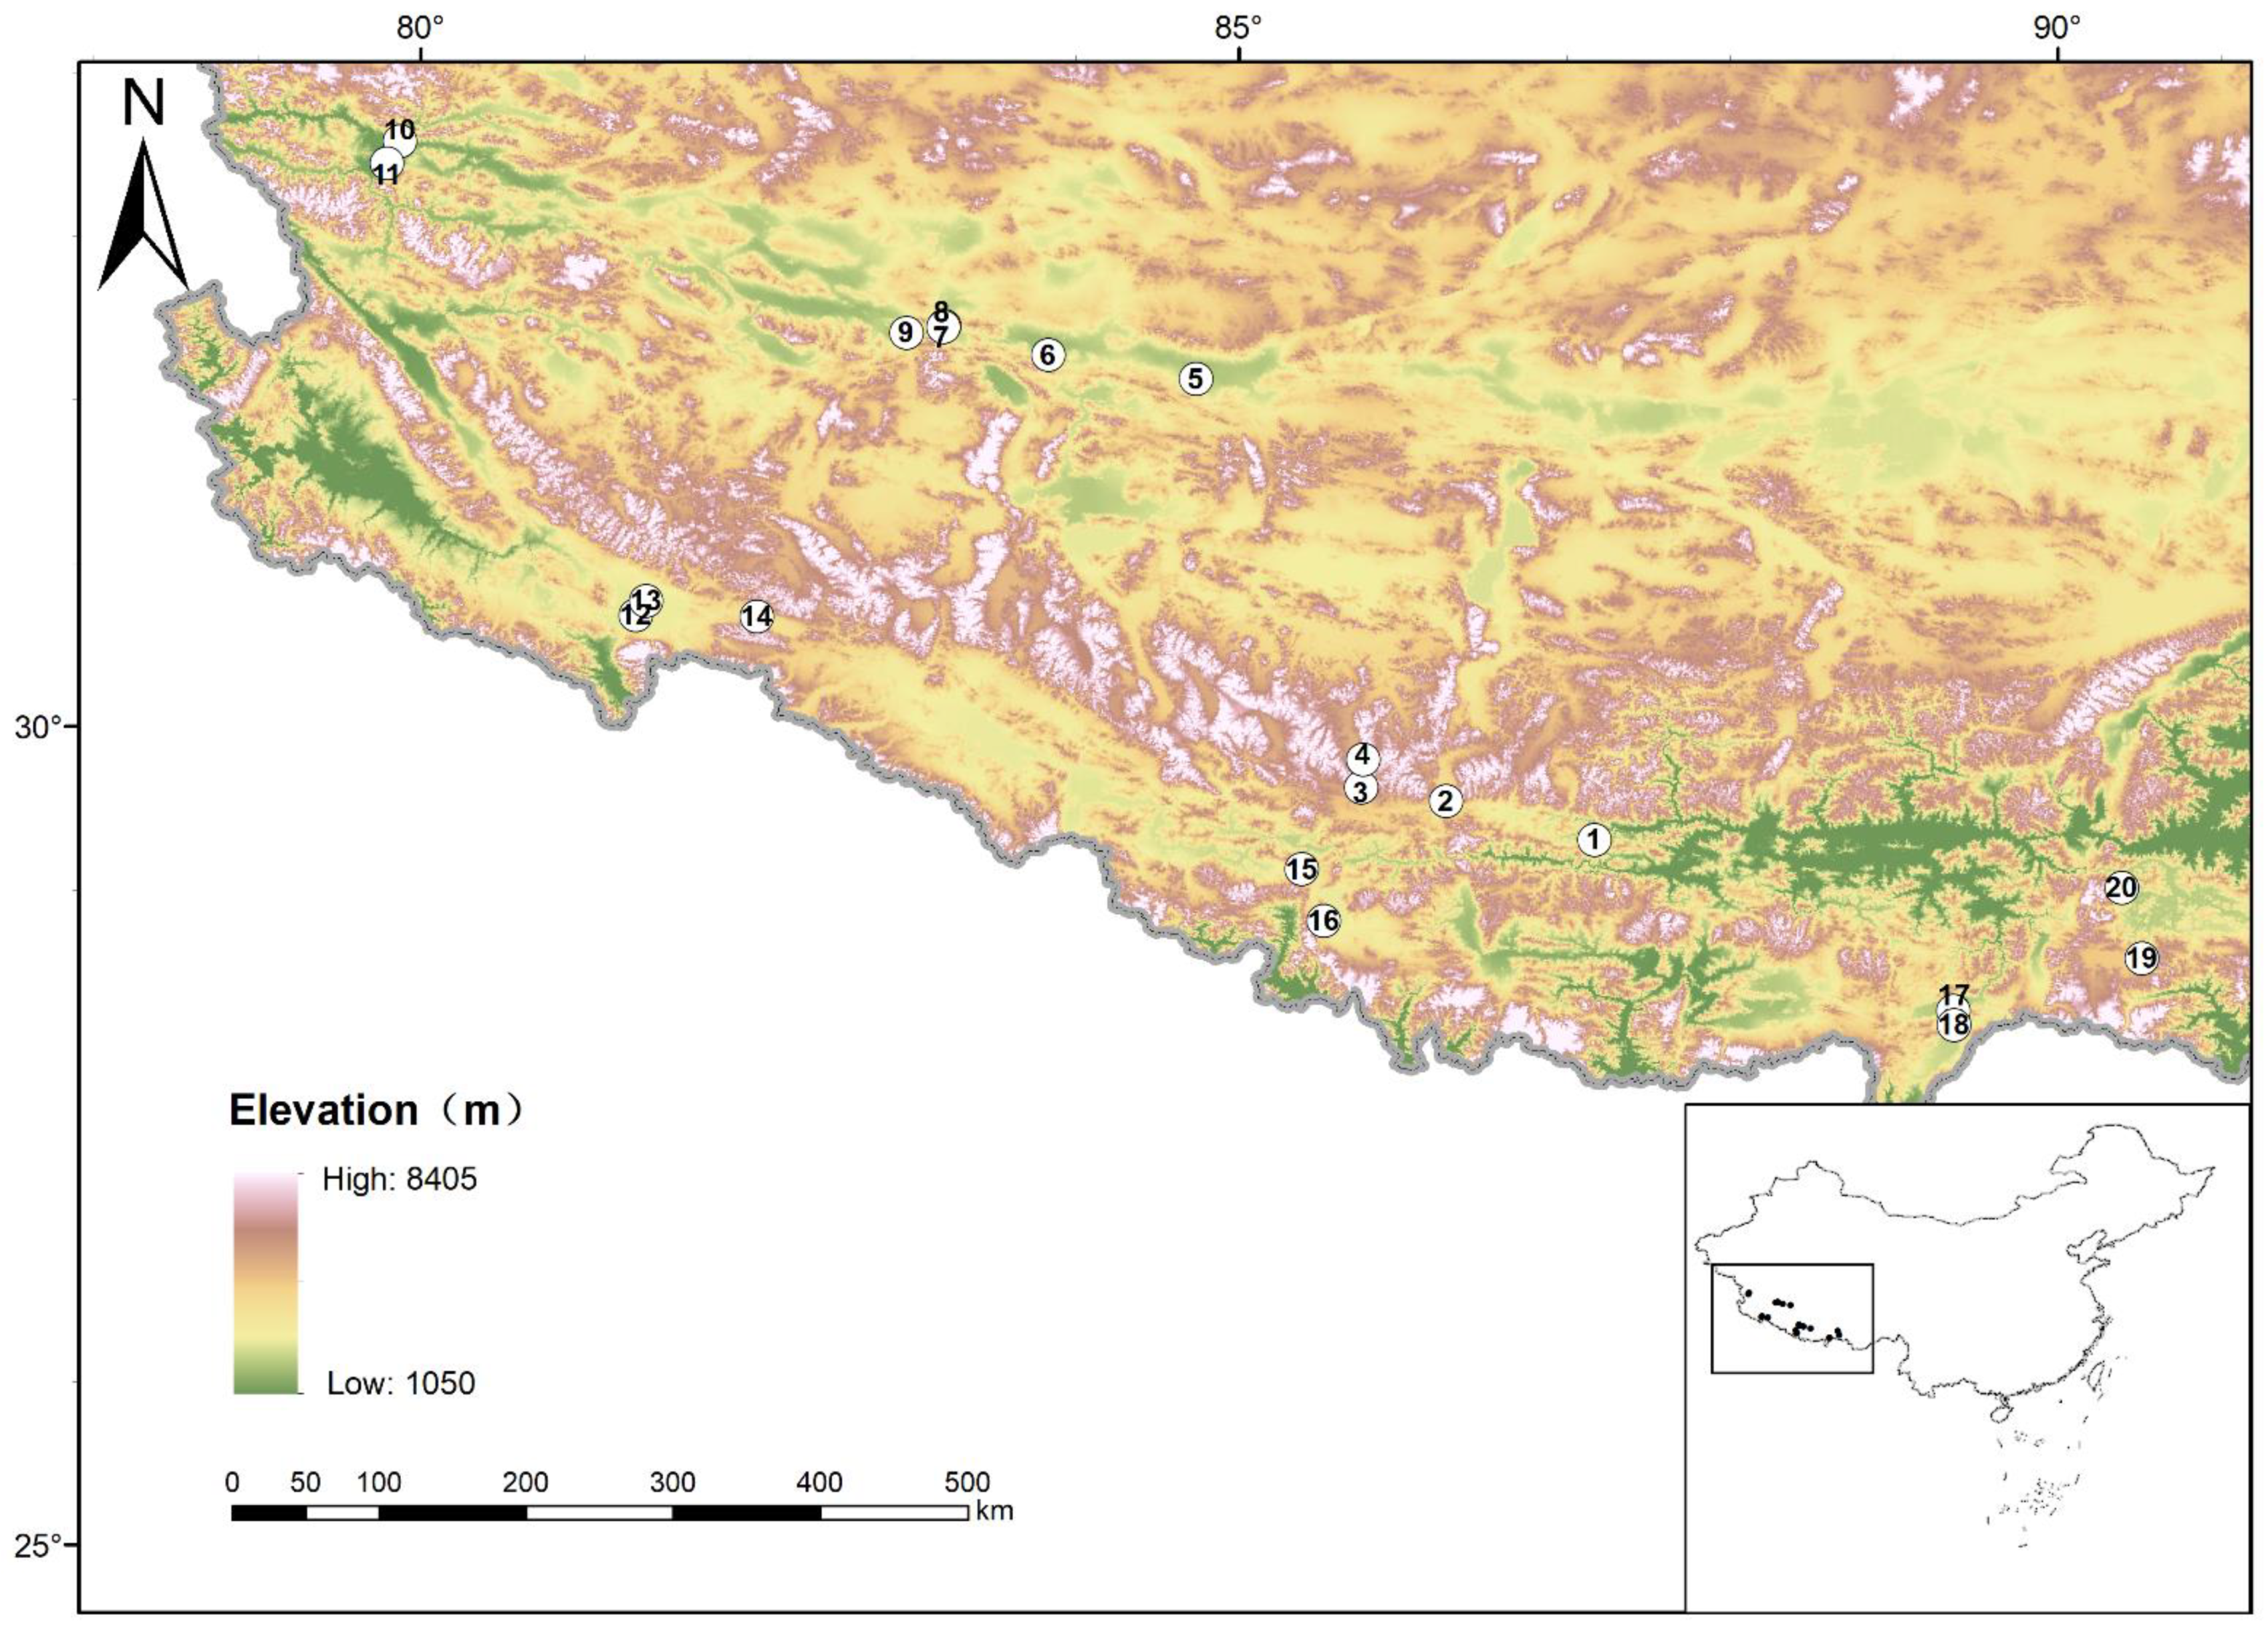
This study was conducted in the Qinghai-Tibetan Plateau in China, and the study area extended northwest-southeast across the plateau. The average altitude of our study area is higher than 4500 m above sea level, and the latitude lies between 28.18 and 33.58° N. The mean annual temperature ranges from −3.09 to 3.66 °C, and the mean annual precipitation from 45.49 to 314.15 mm. Most herbaceous plants sprout in May and senesce in September on the QTP, and the plant coverage and biomass peak in late July and early August in the middle of the plant growing season [29]. Given the main objective of this study was to reveal the overall pattern of diversity and community assembly, we selected 20 sites from 19 lakeshores in our study area in early August of 2018 (Figure 1, Table S1). At each site, a 25 m × 25 m plot on the lakeshore was selected based on information for the most representative vegetative communities in the study site and the site’s accessibility. Three subplots (1 m × 1 m) were randomly established within a plot, and all vascular plant species were recorded. The species richness for each subplot was estimated as the total number of recorded vascular plant species and the coverages were estimated visually [16].
Surface soils (0–5 cm) on each lakeshore were sampled with a 5 cm diameter hand corer. Three soil cores were randomly collected within each subplot. After removing the plant residues and gravels, the nine soil samples from the three subplots were mixed to form a composite sample, and then were stored at approximately 5 °C until laboratory analysis.
2.2. Measurements of Environmental Factors
At each sampling site, the longitude, latitude and elevation were recorded using a global positioning system (Unistrong, Beijing, China). The mean annual temperature (MAT), mean annual precipitation (MAP) and diurnal temperature range (DTR) at each site were extracted, using the interpolation method [30], from the climate dataset of the Chinese ecosystem research network (CERN, http://www.cern.ac.cn, accessed on 26 September 2019).
The soil samples were shade dried until they had a constant weight, then were passed through a 2 mm sieve, and the <2 mm fractions were stored until analysis. After soil solutions (1:5 w/v soil to water ratio) were shaken well and left to stand for 30 min, the pH was determined using a glass electrode with a pH probe (FE 20, Mettler Toledo, Switzerland). The values of soil total carbon (TC), total organic carbon (TOC) and total nitrogen (TN) were measured with an elemental analyser (Vario TOC cube, Hanau, Germany). Inorganic carbon was removed by acidification with hydrochloric acid prior to TOC measurements. Soil total phosphorus (TP) was measured by the molybdenum blue method with a spectrophotometer (Shimadzu, Tokyo, Japan) after digestion by perchloric acid and sulfuric acid. The type of soil was determined by measuring the size of soil granules (using a laser particle analyser, Mastersizer 2000), adopting the International Society of Soil Science (ISSS) standard.
2.3. Data Analysis
All species we investigated were identified using the database The Plant List (http://www.theplantlist.org, accessed on 12 October 2018) and iPlant (http://www.iplant.cn, accessed on 12 October 2018), as well as the detailed descriptions in the Flora of China (http://www.efloras.org/flora_page.aspx?flora_id=2 accessed on 12 October 2018). The species names were checked against The Plant List (http://www.theplantlist.org, accessed on 17 October 2018), and family and genus assignments were based on the Angiosperm Phylogeny Group III classification (Angiosperm Phylogeny Group, 2009) [31]. Then, a phylogenetic tree was generated using Phylomatic v.3 (http://phylodiversity.net/phylomatic/, accessed on 9 November 2018) [32]. Phylomatic matches taxa in the input list (with family and genus information) to the most resolved positions possible in a mega-tree. Here, we used the “zanne2014”, a mega-tree of angiosperms with calibrated branch lengths. [33].
Species alpha diversity for each site, expressed as plant richness and the Shannon–Wiener index, was calculated with the vegan package. These diversity indices indicate both abundance and evenness of the species present [34]. We used Faith’s phylogenetic diversity (hereafter termed Faith’s PD or PD for short) to evaluate the total evolutionary history of the species in an assemblage [35,36]; the root of the phylogenetic tree was not included when measuring this. PD calculates the sum of the evolutionary distances among taxa in a community [35] and represents the phylogenetic α-diversity. Also, we calculated the Net Relatedness Index (NRI) and the Nearest Taxon Index (NTI), which compare the phylogenetic diversity in the data set to a null model, to reveal either phylogenetic overdispersion (co-occurring species more distantly related than expected by chance) or phylogenetic aggregation (co-occurred species more closely related than expected by chance) [37,38,39]. Given the correlation between the geospatial and the climatic factors, and the collinearity among particular environmental variables, we used the varclus function with Hmisc package to estimate the redundancy of the variables before analyses. The variables with higher correlation (Spearman’s ρ2 > 0.8) were excluded [40]. Here, TOC was removed (Figure S1) and three groups of variables were retained: (1) spatial variables (latitude and longitude), (2) edaphic properties (soil TC, TN, TP, pH and soil types), and (3) climatic variables (MAT, MAP and DTR). To evaluate the contributions of geographic and environmental variables to taxonomic and phylogenetic alpha diversity, we used stepwise multiple regression to identify the most influential variables, and quantified the relative effects of the parameter estimates for each variable that was included in the final best-fitting model.
The community assembly processes for wetland plants in this study were estimated based on a null model analysis, the Mantel test and variation partitioning analysis [13,41,42]. Briefly, the variation, or turnover, is first measured with null-model-based phylogenetic and taxonomic beta diversity metrics (β-nearest taxon index:βNTI, β-net relatedness index: βNRI, and Bray-Curtis-based Raup-Crick index: RCbray) using the picante package of R. Where the absolute βNTI or βNRI values are > 2, the deterministic processes structure the community composition, with phylogenetically more similar (homogeneous selection, βNTI or βNRTI values < −2), or phylogenetically less similar (heterogeneous selection, βNTI or βRTI values > +2). Subsequently, RCbray is used to further distinguish homogenizing dispersal (more similar in taxonomy, RCBray values < −0.95) and dispersal limitation (less taxonomic similar, RCbray values > 0.95) with an absolute βNTI or βNRI values < 2 (stochastic pattern). Whereas, if absolute βNTI or βNRI values are < 2, and absolute RCbray values are < 0.95, the community assembly was treated as an “undominated” pattern, that is, no single process drove the variation in the community composition [42,43]. The Mantel test with 999 permutations was used to investigate the relationships between sample ordination on taxonomic (Bray–Curtis distance) and geographic distance and environmental similarity (Euclidean distance) [16]. The variation partitioning analysis (VPA) is widely used in ecological research to evaluate the relative contribution of the pure effects of geospatial variables (the effects of potential dispersal limitation) and the pure effects of environmental factors (deterministic process) [44,45,46]. Non-metric multidimensional scaling (NMDS) ordination was performed based on unweighted Unifrac distances by using the GUniFrac and the vegan package to visualize the similarity of community structure among study sites. All statistical analyses and graphs were performed using R (4.1.0).
3. Results
3.1. Wetland Plants of the Lakeshore across the QTP
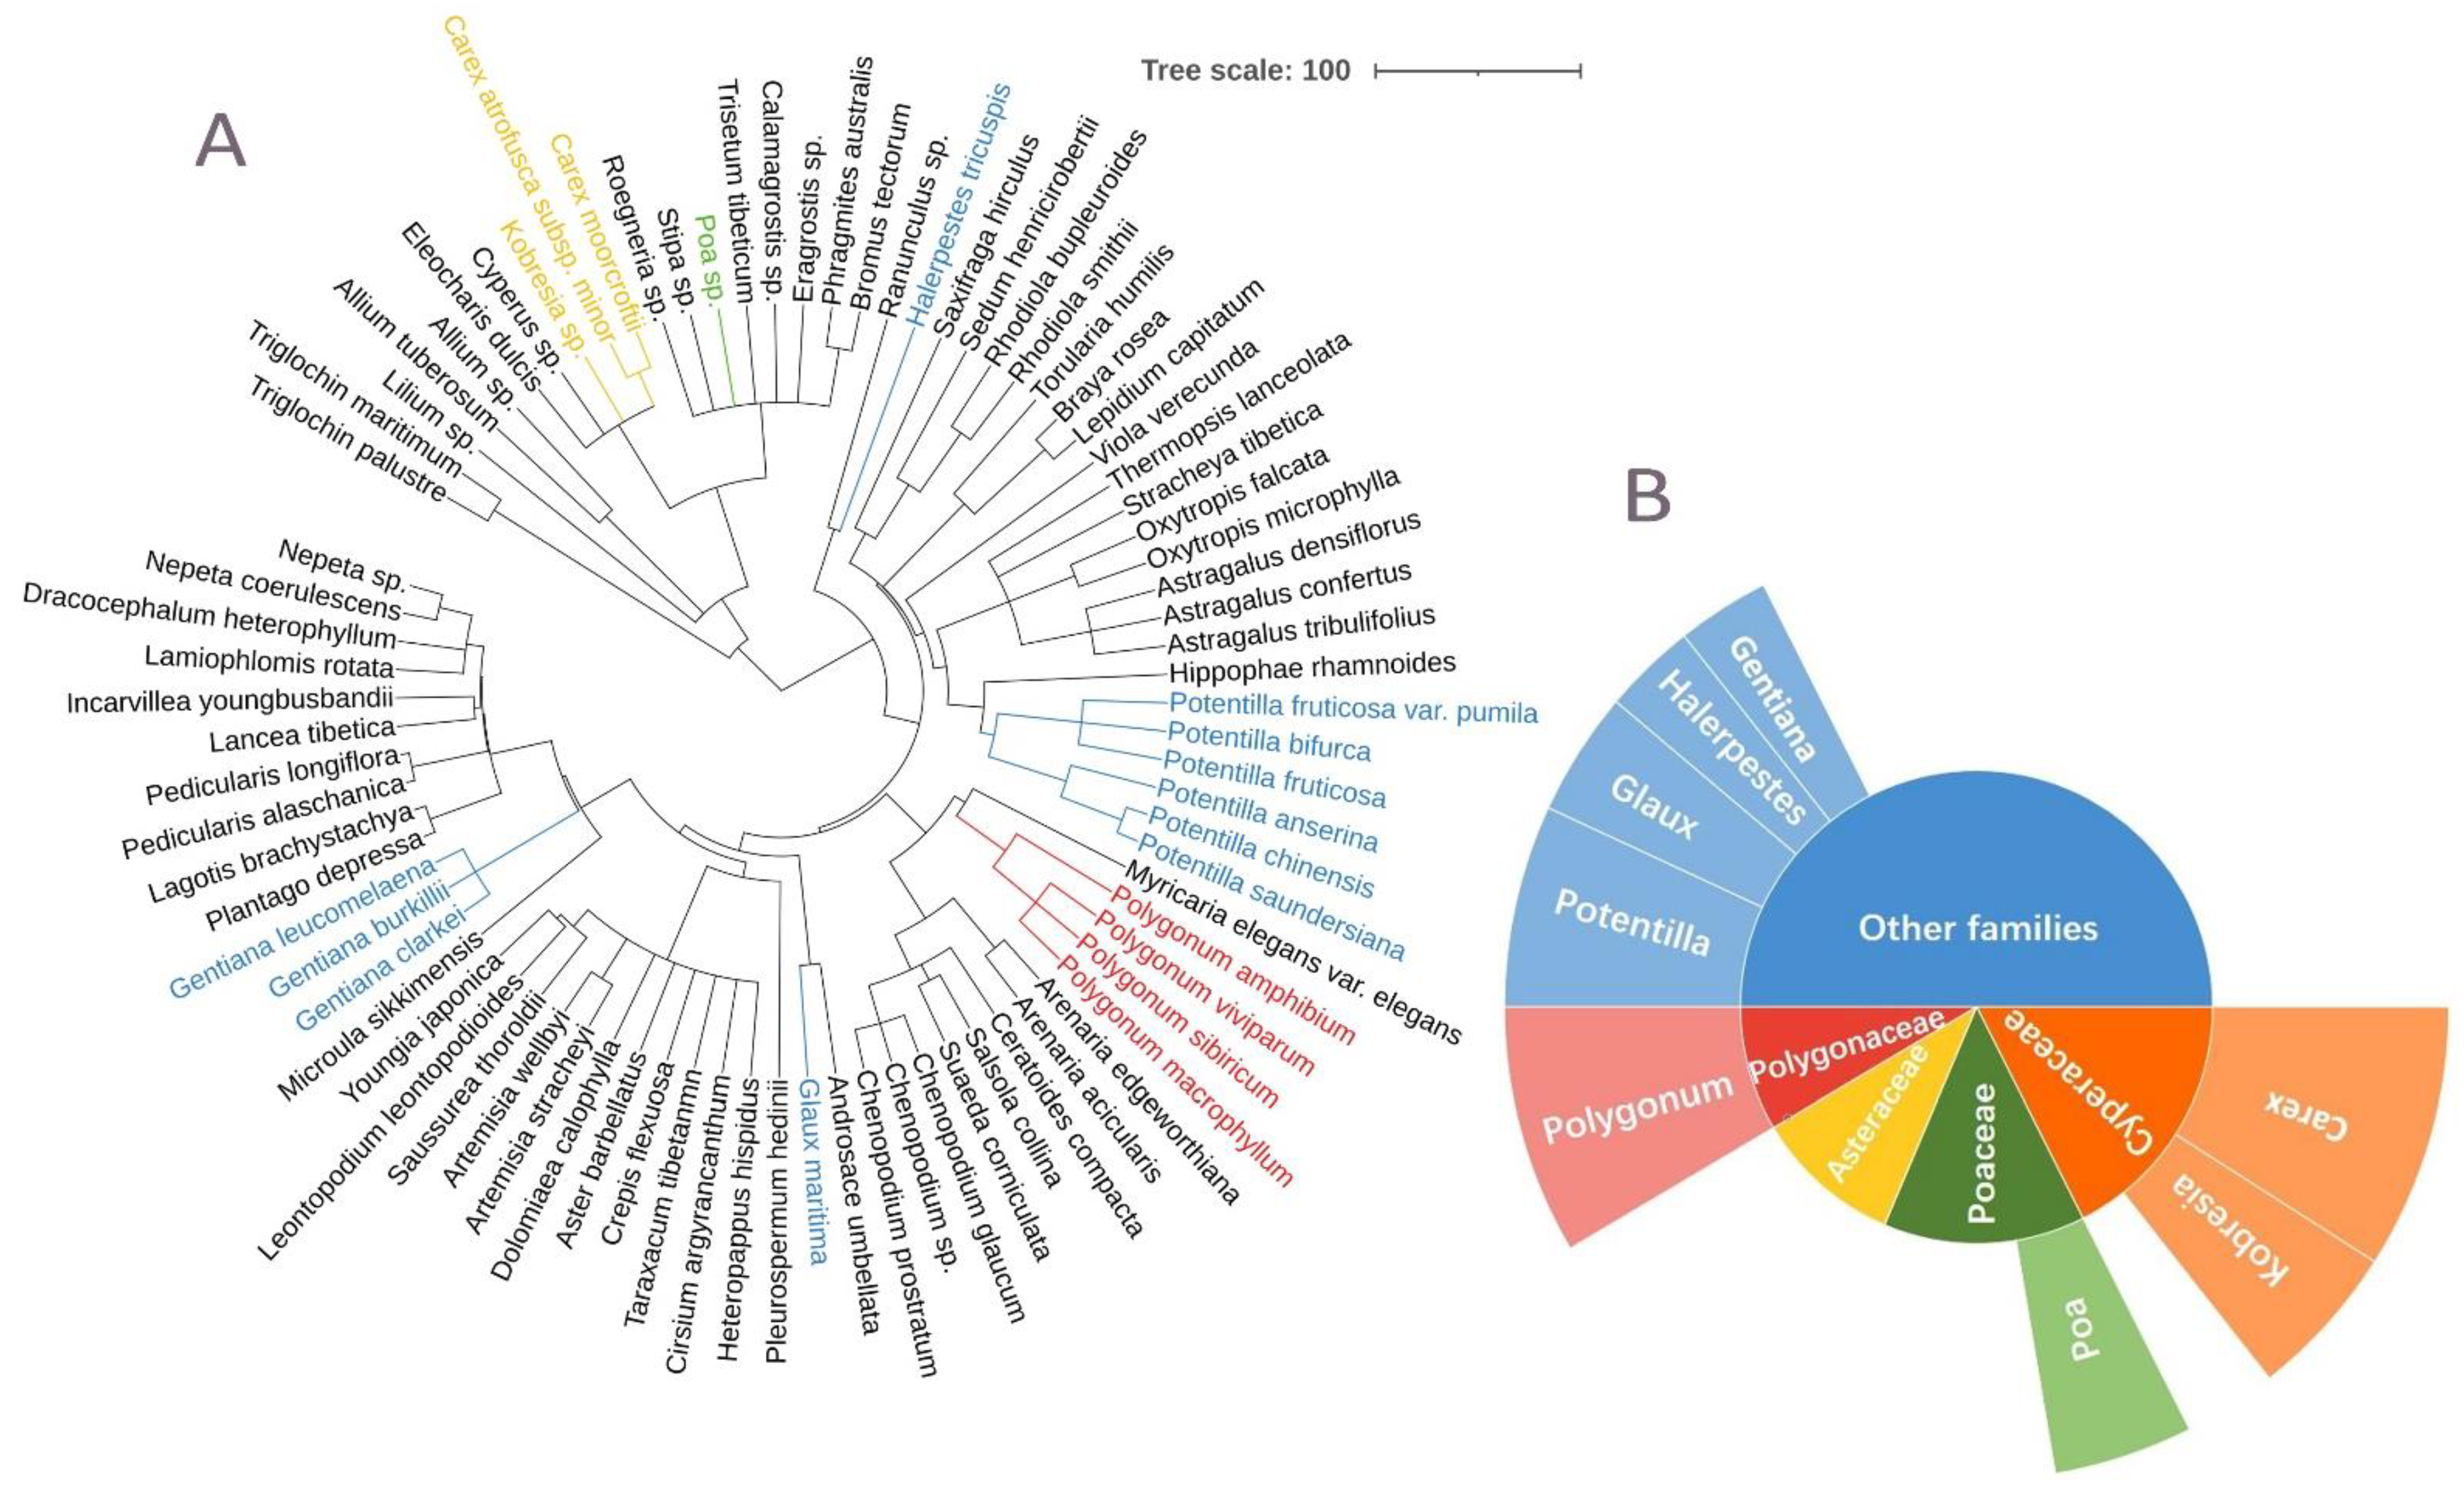
In total, we observed 84 species of vascular plants in the 20 investigated sites, representing 56 genera from 27 families (Figure 2A). In general, Cyperaceae was the most common family in the sites, with the highest relative frequency of 17.6%, followed by Poaceae with 13.8%, Asteraceae with 10.1%, and Polygonaceae with 8.5%, which together accounted for half the total relative frequency of all plants. Including Rosaceae, Fabaceae, Amaranthaceae, and Primulaceae, these eight families together comprised over 70% of the accumulated relative frequency (Figure 2B). Considering the most species-rich families represented, Asteraceae was dominant with 12 of the total plant species identified in our study, followed by Poaceae with eight species and Fabaceae with six species. In addition, most experimental plots in this study were dominated by Carex, Polygonum, Potentilla, and Kobresia, which accounted approximately 1/3 of the accumulated relative frequency, with each genus frequency over 10 (Figure 2B).
3.2. Geospatial and Environmental Drivers of the Taxonomic and Phylogenetic Alpha Diversity
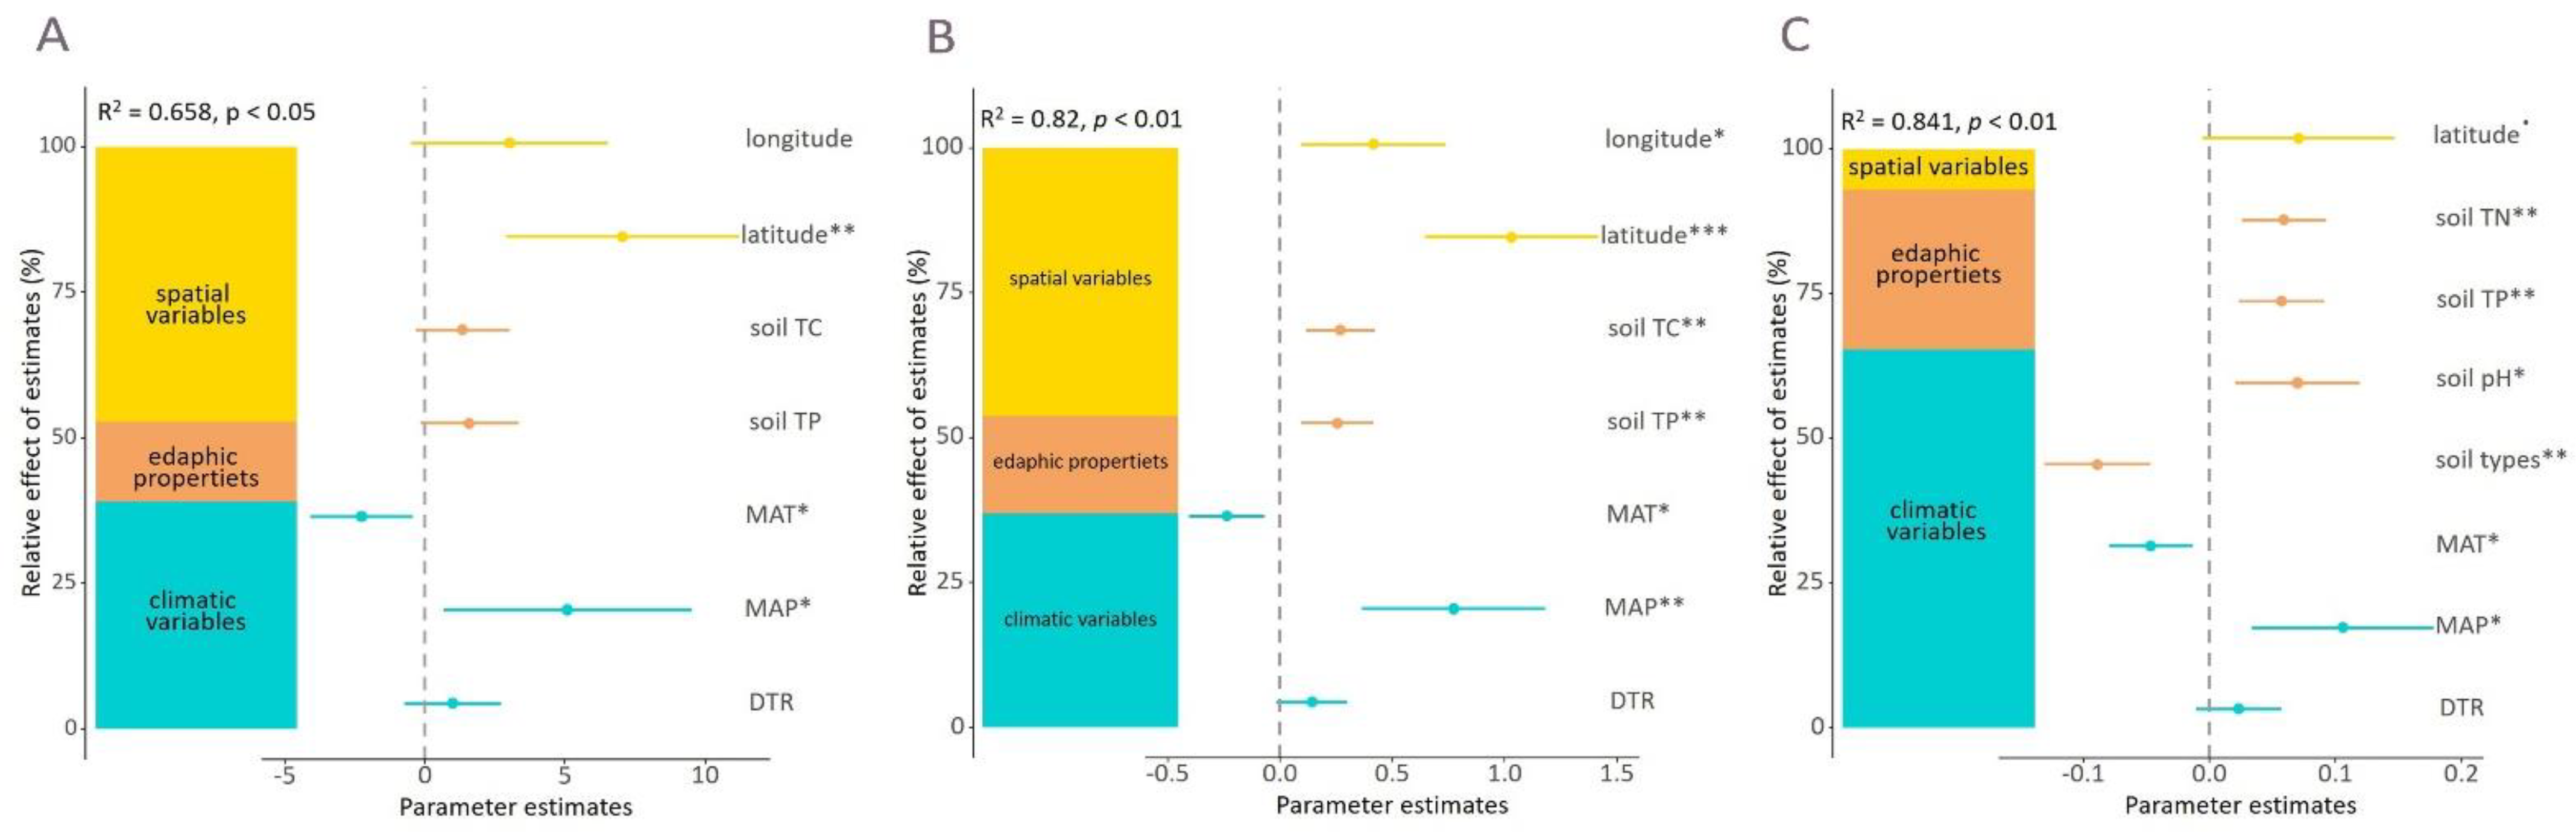
In this study, species richness estimated per site ranged from 2 to 20 species, with a mean of 9.6 ± 0.97 (mean ± SE). The final best-fitting model of stepwise multiple regression explained a high proportion of the variance in taxonomic alpha diversity, the R square values of richness, Shannon–Wiener and Pielou indices were 0.66, 0.82, and 0.84, respectively. In general, the patterns of drivers of species richness and Shannon–Wiener index were similar (Figure 3A,B): the geospatial variables explained approximately half of the variance (47.2% and 46.3%, respectively), the climatic factors explained over 1/3 of the variance (39.1% and 36.9%, respectively), and the edaphic variables were only responsible for about 15% of the explained variables (13.7% and 16.8%, respectively). In contrast, the evenness indicator, the Pielou index, presented another pattern: the climatic factors were the main drivers, which contributed to 65.3% of the variance, the variables of geography and soil explained 7.1% and 27.6%, respectively (Figure 3C). Specifically, latitude, MAT and MAP were the crucial predictors for taxonomic alpha diversity, along with edaphic nutrient, pH and soil types.
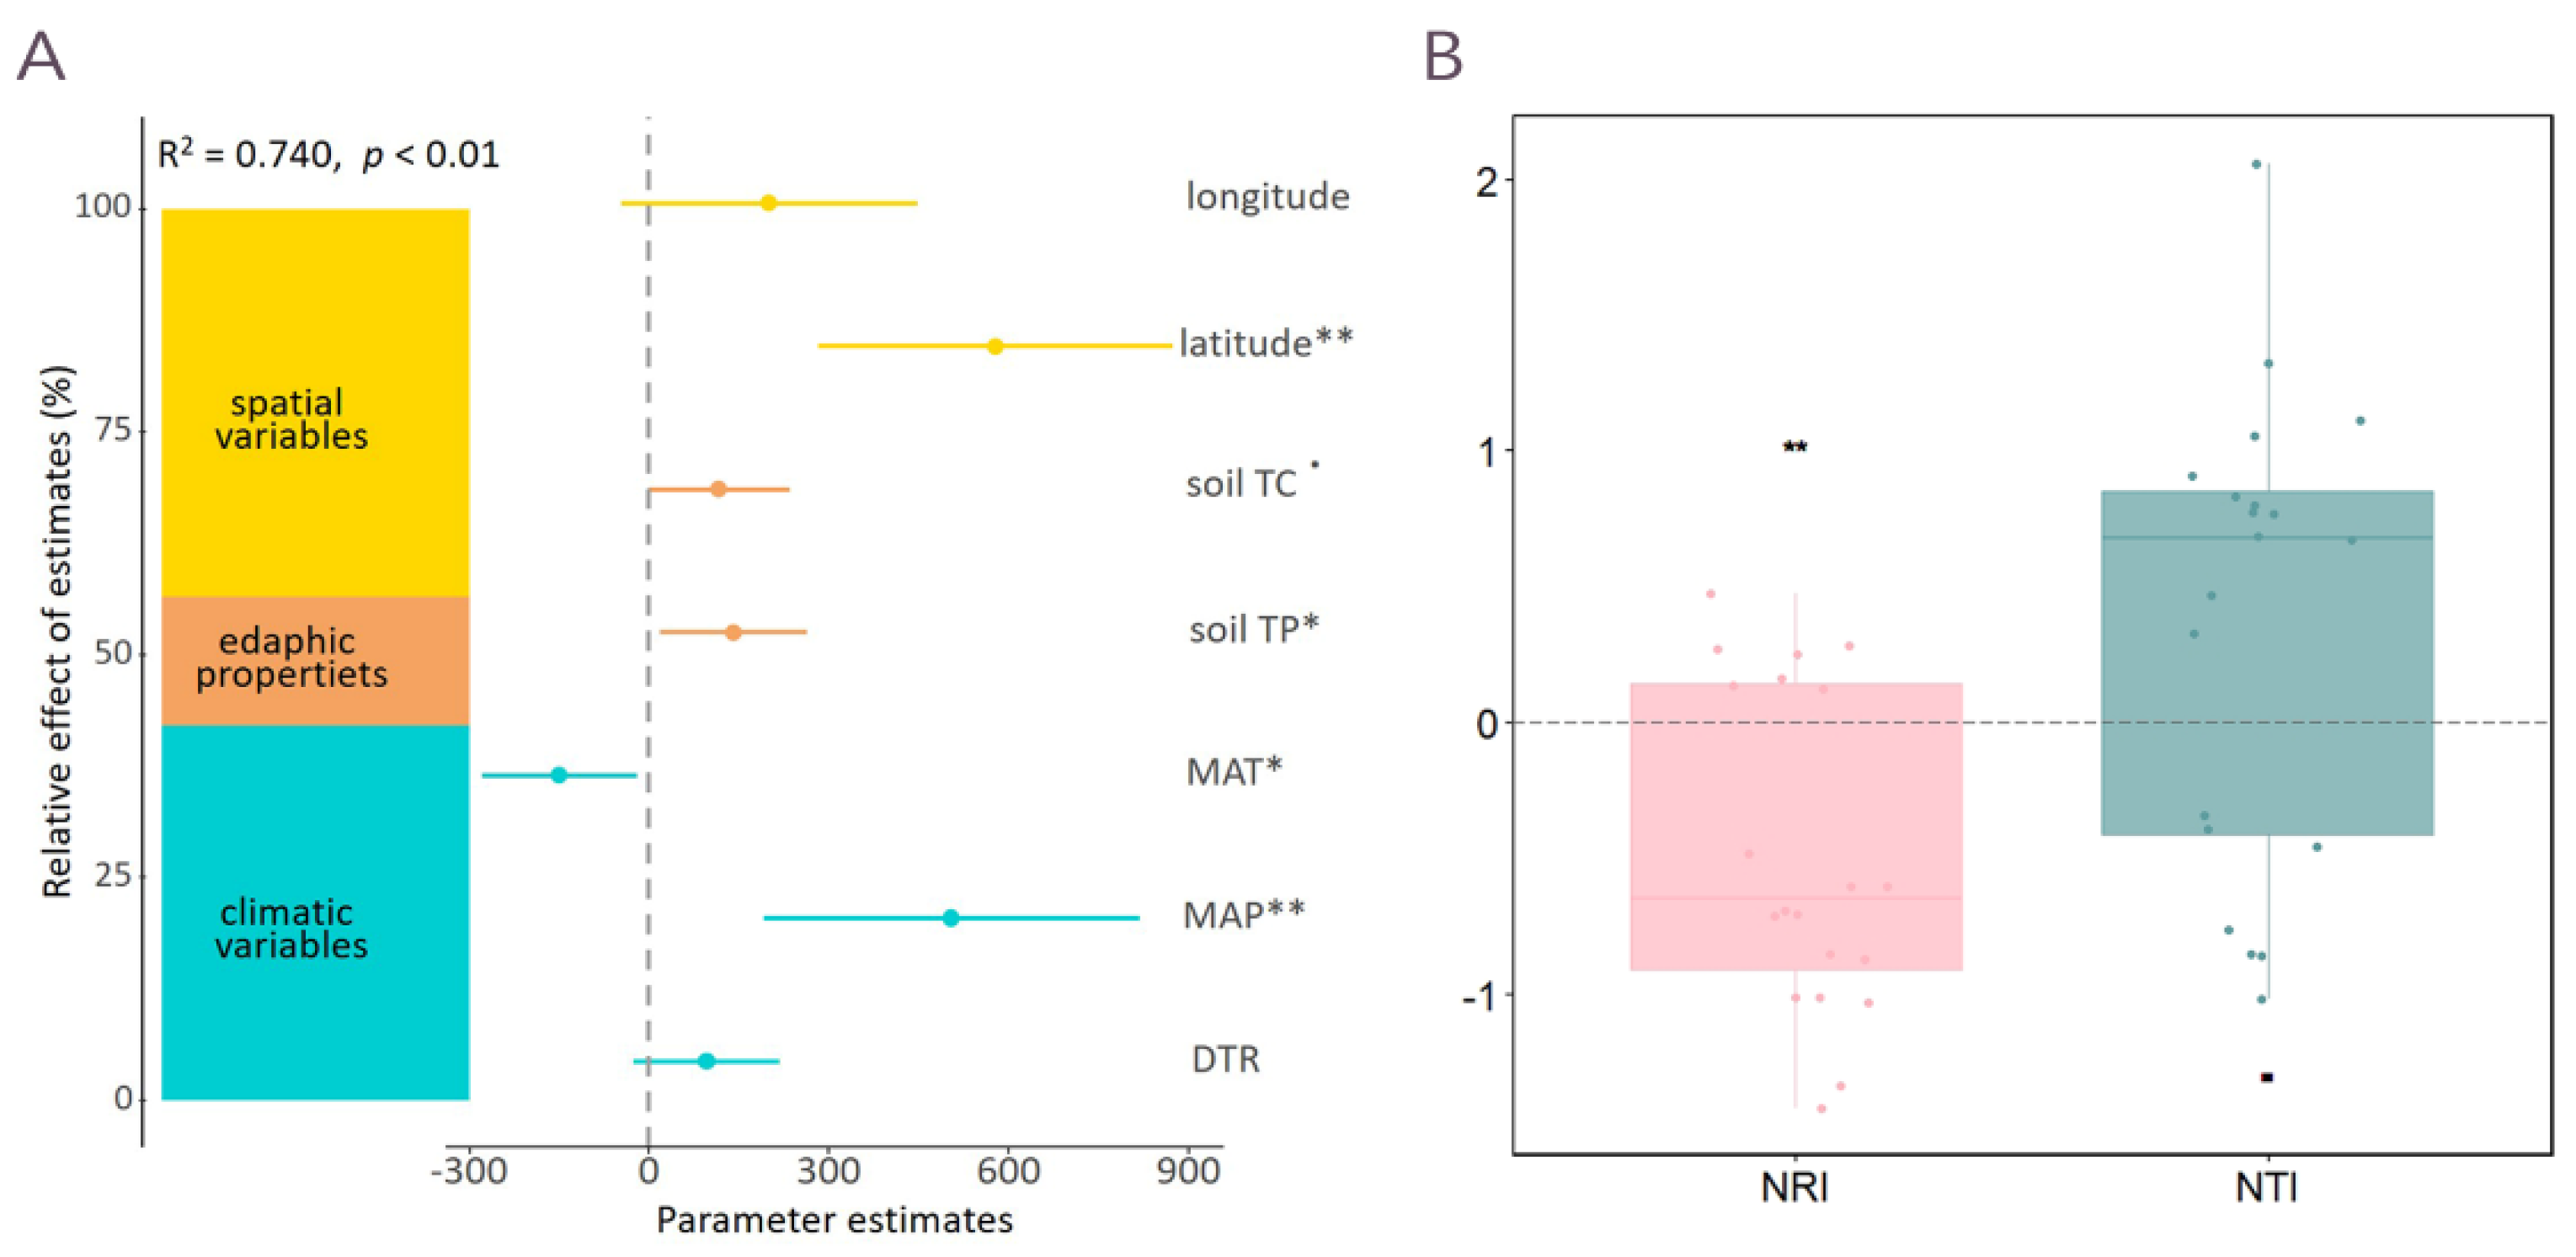
Pearson correlation and linear regression analyses revealed that PD is significantly related to taxonomic richness, while there is still reasonable scatter (r = 0.979, p < 0.001; Figure S1). Similarly, stepwise multiple regression revealed that large proportions of the variation in phylogeneticα-diversity were explained by geospatial (43.6%) and climatic (42.0%) variables, while latitude, MAT, MAP, and the soil TP were significant predictors (Figure 4A).
We found the two phylogenetic relatedness indices, NRI and NTI, exhibited different patterns. The mean values of the NRI and NTI were −0.483 and 0.355, respectively (Figure 4B), which indicated the phylogenetic dispersion based on the mean pairwise divergence time among co-occurring species, while the phylogenetic clustering was based on the mean of the divergence times between each species and its closest co-occurring relative. But neither of the absolute values of NRI and NTI was higher than 1.96, which showed the tendency of clustering or divergence was not significant.
3.3. Potential Community Assembly Process of the Wetland Plants
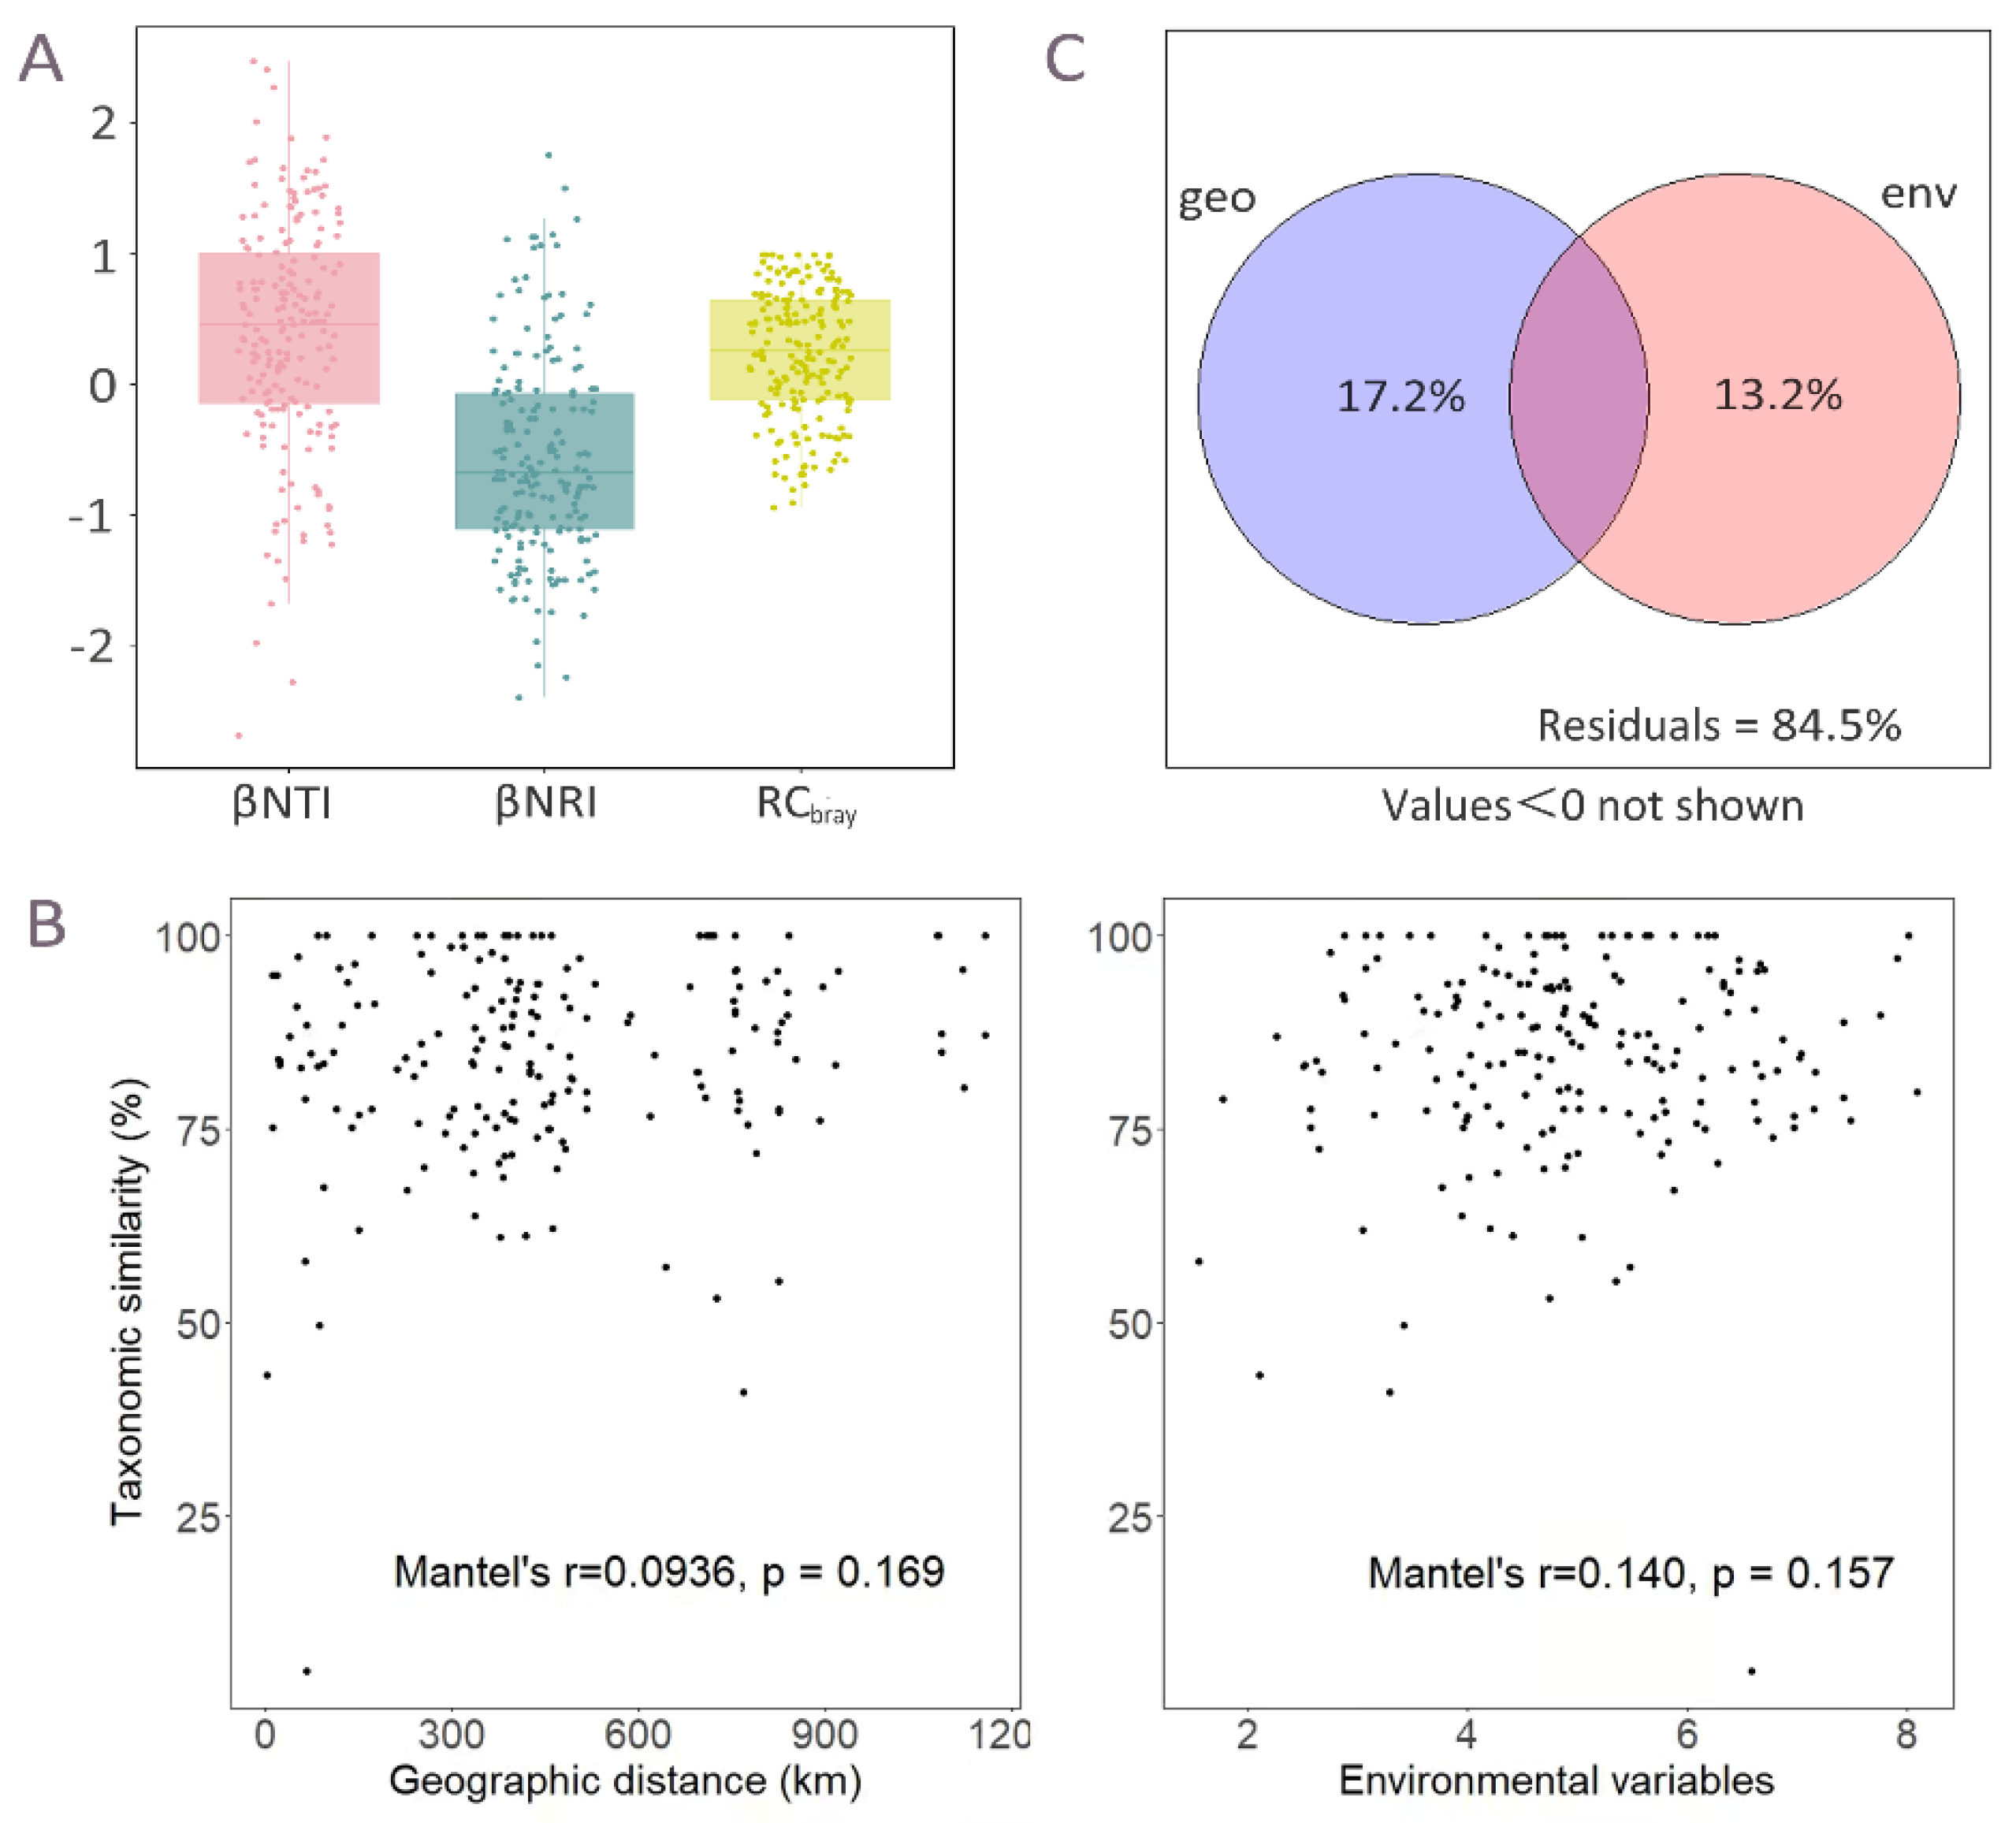
To estimate the potential community assembly process for the wetland plants in the Qinghai–Tibetan Plateau, we measured the phylogenetic and taxonomic β-diversity metric. We found both the means of absolute βNRI and absolute βNTI values in our study were below 2, and the absolute RCbray value was < 0.95 (Figure 5A). These results suggested that neither dispersal nor selection strongly drives the between-site community composition differences. The Mantel test further validated this finding that neither taxonomic nor phylogenetic β-diversity were significantly correlated with either geographic distance or environmental variables (Figure 5B and Figure S2). To make the drivers of community species assembly more comparable, variation partitioning analysis was also employed. The pure geospatial and environmental variables could only explain 17.2% and 13.2% of taxonomic similarity, respectively (Figure 5C), while they explained 33.1% and 24.0% of phylogenetic similarity, respectively (Figure S3). In total, the selection was too weak and dispersal rates are not extreme enough for either process to drive the patterns of taxonomic and phylogenetic similarity between sites. The NMDS of taxonomic composition did not reveal a clear separation, but we found significant correlations between the second axis of NMDS and latitude, as well as MAP (Table 1), which indicated that the geographic and environmental variables, despite being modest, were playing a role in governing community structure of the wetland plants.
4. Discussion
Using the distribution of plants near the shoreline of 19 lakes, we drew a comprehensive picture of the abundance, diversity and composition of wetland plants on the highest plateau on the Earth. The distributions of the submerged aquatic plants are very limited in lakes of the QTP, partly because that most of the lakes on the QTP are deep-water lakes, although the records are not complete. For instance, the maximal and mean depths of Lake Bangongcuo in our study are 41.3 m and approximately 22 m, respectively. The vegetation included hygrophilous plants and non-obligate aquatic plants, such as some species from Carex, Polygonum, Asteraceae and Poaceae, which spread along the shoreline of lakes. Our results are consistent with the surveys of high-altitude wetlands of the Hindu Kush–Himalayan (HKH) region of northern Pakistan [47], which also belongs to the HKH mountain region of South Asia. In agreement with the pattern of vascular plants on the QTP reported by Yan et al. [28], and given our investigation sites were located on the northwest to the southeast part of the plateau as well as at high-latitude, we found that the mean of species richness was only approximately ten. Besides, we observed a strong correlation between species richness (SR) and phylogenetic diversity (Faith’s PD), which is consistent with previous studies on woody plants in China [48], vascular plants in dry sandy heathlands [49], and shrubs in Mediterranean-type regions [50]. This congruency might be the product of evolution and ecological processes—the highly symmetrical phylogenies, lower species richness and high spatial autocorrelation all result in the strong SR-PD correlation [51].
Intriguingly, the net relatedness index indicated that 13 of 20 communities had phylogenetic dispersion, while conversely, the nearest taxon index exhibited clustering at 13 sites in the 20 communities. The phylogenetic patterns at different depths of evolution history might account for this inconsistency [52]. NRI represents an overall pattern of structuring across the phylogenetic tree, while NTI is more focused on the tips of the tree [53]. Consequently, NTI indicated greater power to test for even dispersal because of less similarity. In the present study, the value of NTI on average had stronger genetical clustering than NRI values, which is consistent with the coastal dune plant communities across the globe [39], indicating the existence of recent diversification within regions. The neotectonic movements and glaciation of the QTP have probably promoted the speciation and diversification of original groups [54]. Meanwhile, a few closely-related lineages remained due to having similar adaptative traits, such as cold-tolerance, leading to the observed phylogenetic aggregation [55]. Additionally, the wetland plant communities studied here were established along the shoreline of lakes, or at the land-water transitional zone, and so might be structured by habitat filtering as well as competitive exclusion [37].
Quantifying stochasticity and determinism in governing community assembly is important but difficult [56]. Here, the community assembly process of the wetland plants on the QTP was clarified in three contexts: the null-model-based phylogenetic and taxonomic diversity metrics [56], the correlations between taxonomic/phylogenetic diversity and geospatial and environmental factors [46,57], and the components of geography and environment contributed to the similarity of community structure among sites [58]. Based on the performance of these three contexts, we inferred that stochastic and deterministic processes only played modest roles in the community structure of wetland plants. It was treated as an “undominated” fraction, which mostly consists of weak dispersal, weak selection, diversification, and drift [42], but unfortunately, there are no solutions for further partition at the moment, because these terms are generally not directly measurable in community ecology [13].
It is generally accepted that dispersal is not an unambiguous stochastic or deterministic process, because dispersal depends on both stochastic (e.g., the population size) and deterministic factors (e.g., the new habitat conditions) [13,59,60]. The relatively low abundance populations and harsh conditions on the QTP, thus, will have effects on dispersal to some extent, which might result in a modest rate of dispersal. As to weakening the forces of selection, the dormancy is a general factor (e.g., Nemergut et al., [61] mentioned this for the microbial community). Also in plant communities, theoretically, the germination of alpine species in the QTP should be restricted to a certain period to avoid hostile environmental conditions to increase chances of successful establishment and reproductive growth [62], leading to weaker selection and higher stochastic colonization. Moreover, the environmental heterogeneity always reduces the efficacy of selection, hence, expanding the opportunities for co-occurrence of plants from different genera or families [57,63,64]. Although it is weak (r < 0.1), we observed a significant correlation between environmental similarity and geographic distance (Figure S4). Besides the limited force of selection, the weak selection could also arise from the selective forces counteracting each other [13]. For instance, alpine species on the QTP have large and showy bracts for improving their reproductive success and avoiding the stress of frequent violent winds, and small and hairy floss-covered leaves for protection against excessive solar radiation and low temperature [65,66]. Theory in population genetics reveals that small populations in fragmental ecosystems are most prone to diversification (e.g., the evolutionary process of producing new genetic variation) and ecological drift (e.g., the random changes governed by demographic stochasticity) [67,68,69]. This might be the reason that variation partitioning analysis provides limited inference—the ecological drift and diversification were treated as parts of “residuals” (unexplained variation) relative to geospatial and environmental components [68].
Importantly, although environmental and geospatial factors were supposed to play modest roles in wetland plant community structure, both strongly drive the taxonomic and phylogenetic α-diversity. The patterns of contribution for the species richness and Shannon–Wiener index were a little different from that of Pielou’s evenness (Figure 3). This distinction between the diversity indices might be caused by the different concerns of these estimators. The Pielou’s evenness is independent of the number of species, but depends solely on the distribution of individuals in the communities or habitats [70]. Overall, latitude, MAT and MAP had the most crucial effects on species richness, evenness and phylogenetic diversity (Figure 3 and Figure 4A). The reduction in plant richness and diversity indices with latitude corresponds to the pattern from previous research on the QTP [71], however, the species numbers were far fewer than those on other mountainous regions of the world [72]. This might be the consequence of the combined effects of low temperature and precipitation intensity on the QTP [71]. Zhang et al. [73] also indicated that both MAT and MAP influenced species richness and phylogenetic diversity of alpine steppe plants on the QTP. In line with this, several studies found that precipitation was a primary contributor to species richness [74,75]. Similarly, the research in the Tabu River basin of Inner Mongolia has revealed that the heterogeneity of MAT and MAP were the strongest predictors of alpha diversity patterns [76]. This might be due to the relatively dry and cold climate characteristics and the vegetation dependence on water availability. A very recent study from four lakes on the QTP indicated that the soil water content was the dominant factor affecting the distributions of wetland herbs in the lake-terrestrial ecotone [77]. Another study on five alpine wetlands on the QTP using remote sensing also proved that both temperature and precipitation were the key factors influencing wetland vegetation in this region [78]. In addition, the combined data for climate and vegetation confirmed that the water resource of the lacustrine wetland (Mapam Yumco, also an investigated lake in our study, site 13) was dependent on precipitation [78]. In line with this, we speculated that the dependence of water availability was affected by MAP and MAT, because the precipitation could contribute to increasing the soil water contents directly. Besides, the MAT and MAP would drive the plant composition by influencing the fluvial dynamics, because the main sources of water in the investigated lakes were surface runoff, rainfall-runoff, and glacier runoff (Table S1). Even expanding to the global scale, the climatic variables related to water availability indicated a tight synchronization with the richness of alpine ecosystems [79]. In addition, we found that some microenvironmental factors, such as soil nutrients and edaphic properties, were also major determinants of plant diversity (Figure 3B,C and Figure 4A), which is consistent with other research [74,77,80]. Given the high altitude results in low temperatures, the QTP is characterized as a fragile ecosystem under extreme conditions with slow nutrient cycles and low utilization rates caused by the restricted activities of soil microbiomes [81,82]. Hence, the growth and distribution of plants were to some extent limited by nutrient availability.
5. Conclusions
Unravelling the patterns, processes and mechanisms underlying diversity has been received a large amount of attention in community ecology. However, there is limited information regarding plant communities in high-altitude wetland ecosystems. This study attempted to provide insights into the diversity and the community assemble process of wetland plants on the QTP and reveal the predictors. Here, we showed that latitude and MAP had a strong impact on both the taxonomic and the phylogenetic α-diversities in the plants. Meanwhile, edaphic properties also showed promise for understanding the sources of the α-diversity patterns. Our results highlight that the species and phylogenetic similarity between sites were less geospatially and environmentally constrained. The approach our study used provided a modest statistical estimation of the assembly process, because of the indirect measurability of those “undominated” parties. In addition, a large percentage of the variance remained unexplained, partly because other important factors might have been excluded from our variables, but partly because ecological drift was always mixed with weak dispersal and selection [13]. Further research should be conducted to separate the effects of ecology drift and diversification in the “undominated” fraction, given the complex, fragile but important ecosystem of the QTP.
Supplementary Materials
The following are available online https://www.mdpi.com/article/10.3390/d13120685/s1, Figure S1. Cluster analysis of the measured geospatial and environmental variables. The analysis was performed and plotted using varclus in Hmisc package. lon, longitude; lat, latitude; TC, total carbon in soil; TOC, total organic carbon; TN, total nitrogen in soil; TP, total phosphorus in soil; pH, pH value of soil; Sty, soil type; MAT, mean annual temperature; MAP, mean annual precipitation; DTR, diurnal temperature range. Figure S2. Relationship between the taxonomic diversity (species richness) and phylogenetic diversity (Faith’s PD). Figure S3. Relationships between the phylogenetic Bray–Curtis similarity and the Euclidean distance of geographic distance, environmental factors. A and B are based on βNRI and βNTI, respectively. Figure S4. Variation partitioning showing the contribution of geospatial factors (geo) and environmental variables (env) to the variation of phylogenetic beta-diversity. Latitude and longitude were used as geospatial factors, climatic (mean annual temperature, mean annual precipitation, and diurnal temperature range) and edaphic (total carbon, nitrogen and phosphorus contents in soil, soil pH and soil type) variables were as environmental factors. Figure S5. Relationship between the Euclidean distance of environmental factors and geographic distance. Table S1. Terrain properties and input characteristics of 19 lakes.
Author Contributions
Data curation, S.C., J.O. and Y.L.; formal analysis, J.O. and W.Z.; funding acquisition, W.L. (Wenzhi Liu) and G.L.; investigation, J.O., W.L. (Wenyang Li) and W.Z.; methodology, J.O. and W.Z.; supervision, W.L. (Wenzhi Liu) and G.L.; visualization, S.C. and W.Z.; writing—original draft, W.Z.; writing—review and editing, G.L. and W.Z. All authors have read and agreed to the published version of the manuscript.
Funding
This work was supported by the National Science and Technology Fundamental Resources Investigation Program of China (2019FY100603).
Institutional Review Board Statement
Not applicable.
Data Availability Statement
No new data were created or analyzed in this study. Data sharing is not applicable to this article.
Acknowledgments
The authors would like to thank Lu Bei, Jiang Xiaoliang, He Gang, Deng Danli and Pan Yongtai for their assistances with the field sampling and laboratory analyses.
Conflicts of Interest
The authors declare no conflict of interest.
References
- Gaston, K.J. Global patterns in biodiversity. Nature 2000, 405, 220–227. [Google Scholar] [CrossRef]
- Lyashevska, O.; Farnsworth, K.D. How many dimensions of biodiversity do we need? Ecol. Indic. 2012, 18, 485–492. [Google Scholar] [CrossRef]
- Cardinale, B.J.; Duffy, J.E.; Gonzalez, A.; Hooper, D.U.; Perrings, C.; Venail, P.; Narwani, A.; Mace, G.M.; Tilman, D.; Wardle, D.A.; et al. Biodiversity loss and its impact on humanity. Nature 2012, 486, 59–67. [Google Scholar] [CrossRef]
- Pavoine, S.; Bonsall, M. Measuring biodiversity to explain community assembly: A unified approach. Biol. Rev. 2011, 86, 792–812. [Google Scholar] [CrossRef] [PubMed]
- Swenson, N.G. The role of evolutionary processes in producing biodiversity patterns, and the interrelationships between taxonomic, functional and phylogenetic biodiversity. Am. J. Bot. 2011, 98, 472–480. [Google Scholar] [CrossRef] [Green Version]
- Srivastava, D.S.; Cadotte, M.W.; MacDonald, A.A.M.; Marushia, R.G.; Mirotchnick, N. Phylogenetic diversity and the functioning of ecosystems. Ecol. Lett. 2012, 15, 637–648. [Google Scholar] [CrossRef] [PubMed]
- Peralta, G.; Frost, C.M.; Didham, R.K.; Varsani, A.; Tylianakis, J. Phylogenetic diversity and co-evolutionary signals among trophic levels change across a habitat edge. J. Anim. Ecol. 2015, 84, 364–372. [Google Scholar] [CrossRef]
- Rands, M.R.W.; Adams, W.M.; Bennun, L.; Butchart, S.H.M.; Clements, A.; Coomes, D.; Entwistle, A.; Hodge, I.; Kapos, V.; Scharlemann, J.P.W.; et al. Biodiversity conservation: Challenges beyond 2010. Science 2010, 329, 1298–1303. [Google Scholar] [CrossRef] [Green Version]
- Urban, M.C.; Leibold, M.A.; Amarasekare, P.; De Meester, L.; Gomulkiewicz, R.; Hochberg, M.E.; Klausmeier, C.A.; Loeuille, N.; de Mazancourt, C.; Norberg, J. The evolutionary ecology of metacommunities. Trends Ecol. Evol. 2008, 23, 311–317. [Google Scholar] [CrossRef] [PubMed]
- Vanoverbeke, J.; Urban, M.C.; De Meester, L. Community assembly is a race between immigration and adaptation: Eco-evolutionary interactions across spatial scales. Ecography 2015, 39, 858–870. [Google Scholar] [CrossRef]
- Hanson, C.A.; Fuhrman, J.; Horner-Devine, C.; Martiny, J. Beyond biogeographic patterns: Processes shaping the microbial landscape. Nat. Rev. Microbiol. 2012, 10, 497–506. [Google Scholar] [CrossRef] [PubMed]
- Vellend, M. Conceptual Synthesis in Community Ecology. Q. Rev. Biol. 2010, 85, 183–206. [Google Scholar] [CrossRef] [PubMed] [Green Version]
- Zhou, J.; Ning, D. Stochastic community assembly: Does it matter in microbial ecology? Microbiol. Mol. Biol. Rev. 2017, 81, e00002–e00017. [Google Scholar] [CrossRef] [PubMed] [Green Version]
- Ellwood, M.D.; Manica, A.; Foster, W.A. Stochastic and deterministic processes jointly structure tropical arthropod communities. Ecol. Lett. 2009, 12, 277–284. [Google Scholar] [CrossRef] [PubMed]
- Yang, Z.; Guo, H.; Zhang, J.; Du, G. Stochastic and deterministic processes together determine alpine meadow plant community composition on the Tibetan Plateau. Oecologia 2013, 171, 495–504. [Google Scholar] [CrossRef] [PubMed]
- Zhou, W.; Jiang, X.; Ouyang, J.; Lu, B.; Liu, W.; Liu, G. Environmental factors, more than spatial distance, explain community structure of soil ammonia-oxidizers in wetlands on the Qinghai—Tibetan Plateau. Microorganisms 2020, 8, 933–949. [Google Scholar]
- Möls, T.; Vellak, K.; Vellak, A.; Ingerpuu, N. Global gradients in moss and vascular plant diversity. Biodivers. Conserv. 2013, 22, 1537–1551. [Google Scholar] [CrossRef]
- Qian, H.; Song, J.-S.; Krestov, P.; Guo, Q.; Wu, Z.; Shen, X.; Guo, X. Large-scale phytogeographical patterns in East Asia in relation to latitudinal and climatic gradients. J. Biogeogr. 2003, 30, 129–141. [Google Scholar] [CrossRef] [Green Version]
- Field, R.; Hawkins, B.A.; Cornell, H.V.; Currie, D.J.; Diniz-Filho, J.A.; Guégan, J.-F.; Kaufman, D.M.; Kerr, J.T.; Mittelbach, G.G.; Oberdorff, T.; et al. Spatial species-richness gradients across scales: A meta-analysis. J. Biogeogr. 2009, 36, 132–147. [Google Scholar] [CrossRef]
- Hawkins, B.A.; Field, R.; Cornell, H.V.; Currie, D.J.; Guégan, J.-F.; Kaufman, D.M.; Kerr, J.T.; Mittelbach, G.G.; Oberdorff, T.; O’Brien, E.M.; et al. Energy, water, and broad-scale geographic patterns of species richness. Ecology 2003, 84, 3105–3117. [Google Scholar] [CrossRef] [Green Version]
- Baudena, M.; Sánchez, A.; Georg, C.-P.; Ruiz-Benito, P.; Rodríguez, M.Á.; Zavala, M.A.; Rietkerk, M. Revealing patterns of local species richness along environmental gradients with a novel network tool. Sci. Rep. 2015, 5, 11561–11575. [Google Scholar] [CrossRef] [PubMed] [Green Version]
- Whittaker, R.J.; Nogués-Bravo, D.; Araújo, M.B. Geographical gradients of species richness: A test of the water-energy conjecture of Hawkins et al. (2003) using European data for five taxa. Glob. Ecol. Biogeogr. 2007, 16, 76–89. [Google Scholar] [CrossRef]
- Allen, P.A.; Brown, J.H.; Gillooly, J.F. Global biodiversity, biochemical kinetics, and the energetic-equivalence rule. Science 2002, 297, 1545–1548. [Google Scholar] [CrossRef]
- Kreft, H.; Jetz, W. Global patterns and determinants of vascular plant diversity. Proc. Natl. Acad. Sci. USA 2007, 104, 5925–5930. [Google Scholar] [CrossRef] [Green Version]
- Chappuis, E.; Ballesteros, E.; Gacia, E. Distribution and richness of aquatic plants across Europe and Mediterranean countries: Patterns, environmental driving factors and comparison with total plant richness. J. Veg. Sci. 2012, 23, 985–997. [Google Scholar] [CrossRef]
- Crow, G.E. Species diversity in aquatic angiosperms: Latitudinal patterns. Aquat. Bot. 1993, 44, 229–258. [Google Scholar] [CrossRef]
- Yao, T.; Thompson, L.; Yang, W.; Yu, W.; Gao, Y.; Guo, X.; Yang, X.; Duan, K.; Zhao, H.; Xu, B.; et al. Different glacier status with atmospheric circulations in Tibetan Plateau and surroundings. Nat. Clim. Chang. 2012, 2, 663–667. [Google Scholar] [CrossRef]
- Yan, Y.; Yang, X.; Tang, Z. Patterns of species diversity and phylogenetic structure of vascular plants on the Qinghai-Tibetan Plateau. Ecol. Evol. 2013, 3, 4584–4595. [Google Scholar] [CrossRef] [PubMed]
- Ma, W.H.; He, J.S.; Yang, Y.H.; Wang, X.P.; Liang, C.Z.; Anwar, M.; Zeng, H.; Fang, J.Y.; Schmid, B. Environmental factors covary with plant diversity-productivity relationships among Chinese grassland sites. Glob. Ecol. Biogeogr. 2010, 19, 233–243. [Google Scholar] [CrossRef]
- Hijmans, R.J.; Cameron, S.E.; Parra, J.L.; Jones, P.G.; Jarvis, A. Very high resolution interpolated climate surfaces for global land areas. Int. J. Climatol. 2005, 25, 1965–1978. [Google Scholar] [CrossRef]
- The Angiosperm Phylogeny Group. An update of the angiosperm phylogeny group classification for the orders and families of flowering plants: APG iii. Bot. J. Linn. Soc. 2009, 161, 105–121. [Google Scholar] [CrossRef] [Green Version]
- Webb, C.O.; Ackerly, D.D.; Kembel, S.W. Phylocom: Software for the analysis of phylogenetic community structure and trait evolution. Bioinformatics 2008, 24, 2098–2100. [Google Scholar] [CrossRef] [PubMed] [Green Version]
- Zanne, A.E.; Tank, D.C.; Cornwell, W.; Eastman, J.M.; Smith, S.; Fitzjohn, R.G.; McGlinn, D.J.; O’Meara, B.; Moles, A.; Reich, P.; et al. Three keys to the radiation of angiosperms into freezing environments. Nature 2014, 506, 89–92. [Google Scholar] [CrossRef] [PubMed]
- Gorelick, R. Combining richness and abundance into a single diversity index using matrix analogues of Shannon’s and Simpson’s indices. Ecography 2006, 29, 525–530. [Google Scholar] [CrossRef]
- Faith, D.P. Conservation evaluation and phylogenetic diversity. Biol. Conserv. 1992, 61, 1–10. [Google Scholar] [CrossRef]
- Kling, M.M.; Mishler, B.D.; Thornhill, A.; Baldwin, B.G.; Ackerly, D. Facets of phylodiversity: Evolutionary diversification, divergence and survival as conservation targets. Philos. Trans. R. Soc. B Biol. Sci. 2019, 374, 20170397. [Google Scholar] [CrossRef] [Green Version]
- Webb, C.O.; Ackerly, D.D.; McPeek, M.A.; Donoghue, M.J. Phylogenies and Community Ecology. Annu. Rev. Ecol. Syst. 2002, 33, 475–505. [Google Scholar] [CrossRef] [Green Version]
- Cavender-Bares, J.; Ackerly, D.D.; Baum, D.A.; Bazzaz, F.A. Phylogenetic Overdispersion in Floridian Oak Communities. Am. Nat. 2004, 163, 823–843. [Google Scholar] [CrossRef] [PubMed]
- Brunbjerg, A.K.; Cavender-Bares, J.; Eiserhardt, W.; Ejrnæs, R.; Aarssen, L.W.; Buckley, H.; Forey, E.; Jansen, F.; Kattge, J.; Lane, C.; et al. Multi-scale phylogenetic structure in coastal dune plant communities across the globe. J. Plant Ecol. 2014, 7, 101–114. [Google Scholar] [CrossRef]
- Huang, M.K.; Chai, L.W.; Jiang, D.L.; Zhang, M.J.; Jia, W.Q.; Huang, Y.; Zhou, J.Z. Dissovled organic matter (DOM) quality drives biogeographic patterns of soil bacterial communities and their association networks in semi-arid regions. FEMS Microbiol. Ecol. 2021, 97, fiab083. [Google Scholar] [CrossRef]
- Stegen, J.; Lin, X.; Fredrickson, J.K.; Chen, X.; Kennedy, D.; Murray, C.J.; Rockhold, M.L.; Konopka, A. Quantifying community assembly processes and identifying features that impose them. ISME J. 2013, 7, 2069–2079. [Google Scholar] [CrossRef]
- Stegen, J.C.; Lin, X.; Fredrickson, J.K.; Konopka, A.E. Estimating and mapping ecological processes influencing microbial community assembly. Front. Microbiol. 2015, 6, 370–384. [Google Scholar] [CrossRef] [Green Version]
- Feng, Y.; Chen, R.; Stegen, J.C.; Guo, Z.; Zhang, J.; Li, Z.; Lin, X. Two key features influencing community assembly processes at regional scale: Initial state and degree of change in environmental conditions. Mol. Ecol. 2018, 27, 5238–5251. [Google Scholar] [CrossRef]
- van Breugel, M.; Craven, D.; Lai, H.R.; Baillon, M.; Turner, B.L.; Hall, J.S. Soil nutrients and dispersal limitation shape compositional variation in secondary tropical forests across multiple scales. J. Ecol. 2019, 107, 566–581. [Google Scholar] [CrossRef]
- Gad, M.; Hou, L.; Li, J.; Wu, Y.; Rashid, A.; Chen, N.; Hu, A. Distinct mechanisms underlying the assembly of microeukaryotic generalists and specialists in an anthropogenically impacted river. Sci. Total Environ. 2020, 748, 141434. [Google Scholar] [CrossRef] [PubMed]
- Shi, W.; Wang, Y.; Xiang, W.; Li, X.; Cao, K. Environmental filtering and dispersal limitation jointly shaped the taxonomic and phylogenetic beta diversity of natural forests in southern China. Ecol. Evol. 2021, 11, 8783–8794. [Google Scholar] [CrossRef] [PubMed]
- Khan, H.; Baig, S. High altitude wetlands of the HKH region of northern Pakistan—Status of current knowledge, challenges and research opportunities. Wetlands 2017, 37, 371–380. [Google Scholar] [CrossRef]
- Cai, H.; Lyu, L.; Shrestha, N.; Tang, Z.; Su, X.; Xu, X.; Dimitrov, D.; Wang, Z. Geographical patterns in phylogenetic diversity of Chinese woody plants and its application for conservation planning. Divers. Distrib. 2021, 27, 179–194. [Google Scholar] [CrossRef]
- Geedicke, I.; Schultz, M.; Rudolph, B.; Oldeland, J. Phylogenetic clustering found in lichen but not in plant communities in European heathlands. Community Ecol. 2016, 17, 216–224. [Google Scholar] [CrossRef] [Green Version]
- Morlon, H.; Schwilk, D.W.; Bryant, J.A.; Marquet, P.A.; Rebelo, A.G.; Tauss, C.; Bohannan, B.J.M.; Green, J.L. Spatial patterns of phylogenetic diversity. Ecol. Lett. 2011, 14, 141–149. [Google Scholar] [CrossRef] [Green Version]
- Tucker, C.M.; Cadotte, M.W. Unifying measures of biodiversity: Understanding when richness and phylogenetic diversity should be congruent. Divers. Distrib. 2013, 19, 845–854. [Google Scholar] [CrossRef]
- Qian, H.; Sandel, B. Phylogenetic relatedness of native and exotic plants along climate gradients in California, USA. Divers. Distrib. 2017, 23, 1323–1333. [Google Scholar] [CrossRef] [Green Version]
- Kraft, N.J.; Cornwell, W.K.; Webb, C.O.; Ackerly, D.D. Trait evolution, community assembly, and the phylogenetic structure of ecological communities. Am. Nat. 2007, 170, 271–283. [Google Scholar] [CrossRef] [PubMed]
- Huang, J.H.; Huang, J.H.; Lu, X.H.; Ma, K.P. Diversity distribution patterns of Chinese endemic seed plant species and their implications for conservation planning. Sci. Rep. 2016, 6, 33913. [Google Scholar] [CrossRef] [Green Version]
- Ricklefs, R.E. Evolutionary diversification and the origin of the diversity—Environment relationship. Ecology 2006, 87, S3–S13. [Google Scholar] [CrossRef]
- Ning, D.; Deng, Y.; Tiedje, J.M.; Zhou, J. A general framework for quantitatively assessing ecological stochasticity. Proc. Natl. Acad. Sci. USA 2019, 116, 16892–16898. [Google Scholar] [CrossRef] [Green Version]
- Jiang, L.; Lv, G.; Gong, Y.; Li, Y.; Wang, H.; Wu, D. Characteristics and driving mechanisms of species beta diversity in desert plant communities. PLoS ONE 2021, 16, e0245249. [Google Scholar] [CrossRef] [PubMed]
- Legendre, P.; Mi, X.; Ren, H.; Ma, K.; Yu, M.; Sun, I.-F.; He, F. Partitioning beta diversity in a subtropical broad-leaved forest of China. Ecology 2009, 90, 663–674. [Google Scholar] [CrossRef] [Green Version]
- Vellend, M.; Srivastava, D.S.; Anderson, K.M.; Brown, C.D.; Jankowski, J.E.; Kleynhans, E.J.; Kraft, N.; Letaw, A.D.; Macdonald, A.A.M.; Maclean, J.E.; et al. Assessing the relative importance of neutral stochasticity in ecological communities. Oikos 2014, 123, 1420–1430. [Google Scholar] [CrossRef]
- Lowe, W.H.; McPeek, M.A. Is dispersal neutral? Trends Ecol. Evol. 2014, 29, 444–450. [Google Scholar] [CrossRef]
- Nemergut, D.R.; Schmidt, S.K.; Fukami, T.; O’Neill, S.P.; Bilinski, T.M.; Stanish, L.F.; Knelman, J.E.; Darcy, J.L.; Lynch, R.C.; Wickey, P.; et al. Patterns and Processes of Microbial Community Assembly. Microbiol. Mol. Biol. Rev. 2013, 77, 342–356. [Google Scholar] [CrossRef] [Green Version]
- Finch-Savage, W.E.; Leubner-Metzger, G. Seed dormancy and the control of germination. New Phytol. 2006, 171, 501–523. [Google Scholar] [CrossRef]
- Jabot, F.; Chave, J. Analyzing Tropical Forest Tree Species Abundance Distributions Using a Nonneutral Model and through Approximate Bayesian Inference. Am. Nat. 2011, 178, E37–E47. [Google Scholar] [CrossRef]
- Gralka, M.; Hallatschek, O. Environmental heterogeneity can tip the population genetics of range expansions. eLife 2019, 8, e44359. [Google Scholar] [CrossRef]
- Sun, H.; Niu, Y.; Chen, Y.-S.; Song, B.; Liu, C.-Q.; Peng, D.-L.; Chen, J.-G.; Yang, Y. Survival and reproduction of plant species in the Qinghai-Tibet Plateau. J. Syst. Evol. 2014, 52, 378–396. [Google Scholar] [CrossRef] [Green Version]
- Little, L.; Eidesen, P.B.; Müller, E.; Dickinson, K.J.M.; Lord, J.M. Leaf and floral heating in cold climates: Do sub-antarctic megaherbs resemble tropical alpine giants? Polar Res. 2016, 35, 26030. [Google Scholar] [CrossRef] [Green Version]
- Morlon, H. Phylogenetic approaches for studying diversification. Ecol. Lett. 2014, 17, 508–525. [Google Scholar] [CrossRef] [PubMed]
- Gilbert, B.; Levine, J.M. Ecological drift and the distribution of species diversity. Proc. R. Soc. B Boil. Sci. 2017, 284, 20170507. [Google Scholar] [CrossRef]
- Siqueira, T.; Saito, V.; Bini, L.M.; Melo, A.S.; Petsch, D.K.; Landeiro, V.L.; Tolonen, K.T.; Jyrkänkallio-Mikkola, J.; Soininen, J.; Heino, J. Community size can affect the signals of ecological drift and niche selection on biodiversity. Ecology 2020, 101, e03014. [Google Scholar] [CrossRef] [Green Version]
- Mouillot, D.; Leprêtre, A. A comparison of species diversity estimators. Res. Popul. Ecol. 1999, 41, 203–215. [Google Scholar]
- Wang, W.; Wang, Q.; Li, S.; Wang, G. Distribution and Species Diversity of Plant Communities along Transect on the Northeastern Tibetan Plateau. Biodivers. Conserv. 2006, 15, 1811–1828. [Google Scholar] [CrossRef]
- Pauli, H.; Gottfried, M.; Dullinger, S.; Abdaladze, O.; Akhalkatsi, M.; Alonso, J.L.B.; Coldea, G.; Dick, J.; Erschbamer, B.; Calzado, R.F.; et al. Recent Plant Diversity Changes on Europe’s Mountain Summits. Science 2012, 336, 353–355. [Google Scholar] [CrossRef] [Green Version]
- Zhang, C.; Zhou, H.; Ma, Z. Phylogenetic structure of alpine steppe plant communities along a precipitation and temperature gradient on the Tibetan Plateau. Glob. Ecol. Conserv. 2020, 24, e01379. [Google Scholar] [CrossRef]
- Cuesta, F.; Muriel, P.; Llambí, L.D.; Halloy, S.; Aguirre, N.; Beck, S.; Carilla, J.; Meneses, R.I.; Cuello, S.; Grau, A.; et al. Latitudinal and altitudinal patterns of plant community diversity on mountain summits across the tropical Andes. Ecography 2017, 40, 1381–1394. [Google Scholar] [CrossRef]
- Lamprecht, A.; Pauli, H.; Calzado, M.R.F.; Lorite, J.; Mesa, J.M.; Steinbauer, K.; Winkler, M. Changes in plant diversity in a water-limited and isolated high-mountain range (Sierra Nevada, Spain). Alp. Bot. 2021, 131, 27–39. [Google Scholar] [CrossRef]
- Liu, Q.; Buyantuev, A.; Wu, J.; Niu, J.; Yu, D.; Zhang, Q. Intensive land-use drives regional-scale homogenization of plant communities. Sci. Total Environ. 2018, 644, 806–814. [Google Scholar] [CrossRef]
- Zheng, P.R.; Li, C.H.; Ye, C.; Wang, H.; Wei, W.W.; Zheng, Y.; Zheng, X.Y. Factors Driving Wetland Herbs Distribution Range of Lake-Terrestrial Ecotone in Tibet, China. Paper Presented at Research Square. Available online: https://www.researchsquare.com/article/rs-1078363/v1 (accessed on 13 November 2021).
- Wang, R.; He, M.; Niu, Z. Responses of Alpine Wetlands to Climate Changes on the Qinghai-Tibetan Plateau Based on Remote Sensing. Chin. Geogr. Sci. 2020, 30, 189–201. [Google Scholar] [CrossRef]
- Cavieres, L.A.; Brooker, R.W.; Butterfield, B.J.; Cook, B.J.; Kikvidze, Z.; Lortie, C.; Michalet, R.; Pugnaire, F.I.; Schöb, C.; Xiao, S.; et al. Facilitative plant interactions and climate simultaneously drive alpine plant diversity. Ecol. Lett. 2014, 17, 193–202. [Google Scholar] [CrossRef]
- Hulshof, C.M.; Spasojevic, M.J. The edaphic control of plant diversity. Glob. Ecol. Biogeogr. 2020, 29, 1634–1650. [Google Scholar] [CrossRef]
- Davidson, E.A.; Janssens, I.A. Temperature sensitivity of soil carbon decomposition and feedbacks to climate change. Nature 2006, 440, 165–173. [Google Scholar] [CrossRef]
- Mipam, T.D.; Chen, S.; Liu, J.; Miehe, G.; Tian, L. Short-term yak-grazing alters plant-soil stoichiometric relations in an alpine meadow on the eastern Tibetan Plateau. Plant Soil 2019, 458, 125–137. [Google Scholar] [CrossRef] [Green Version]
Figure 1.
Location of the 20 sites on the Qinghai-Tibetan Plateau that were investigated and sampled in this study. The inset map in the bottom right corner shows the study area on a map of China.
Figure 1.
Location of the 20 sites on the Qinghai-Tibetan Plateau that were investigated and sampled in this study. The inset map in the bottom right corner shows the study area on a map of China.

Figure 2.
The phylogenetic distribution of all plants in this study (A) and the dominant families (the accumulated relative frequency is 50%) and genus (the accumulated relative frequency is approximately 1/3, (B)). The colour scheme used for species in (A) matches taxa shown in (B).
Figure 2.
The phylogenetic distribution of all plants in this study (A) and the dominant families (the accumulated relative frequency is 50%) and genus (the accumulated relative frequency is approximately 1/3, (B)). The colour scheme used for species in (A) matches taxa shown in (B).

Figure 3.
Effect of geospatial and environmental predictors on the taxonomic alpha diversity: richness (A), Shannon–Wiener index (B), and Pielou’s evenness (C). For each of the three indices, the average parameter estimates (standardized regression coefficients) of model predictors are presented on the left panels, and the associated 95% confidence intervals and relative importance of each factor are presented on the right panels. The relative contributions of each group of predictors are expressed as the percentage of explained variance. The p value of each predictor is given as: . p < 0.1; * p < 0.05; ** p < 0.01; *** p < 0.001. Abbreviations: soil TC: total carbon in soil; soil TN: total nitrogen in soil; soil TP: total phosphorus in soil; MAT: mean annual temperature; MAP: mean annual precipitation; DTR: diurnal temperature range.

Figure 4.
Effect of geospatial and environmental predictors on the phylogenetic diversity (Faith’s PD) (A, see Figure 3 for interpretation) and the Net Relatedness Index (NRI) and the Nearest Taxon Index (NTI) values are expressed as boxplot (B). The p value of each predictor is given as: ** p < 0.01, * p < 0.05, · 0.05 < p < 0.1. Significant differences between mean NRI and NTI values from zero are indicated as: ** p < 0.01, · 0.05 < p < 0.1.

Figure 5.
(A) βNRI, βNTI, and RCbray values are depicted in box plots. (B) Relationships between wetland plants communities (taxonomic Bray–Curtis similarity) and the Euclidean distance of geographic distance, environmental factors. The Mantel test was used to examine the correlations between the pairwise Bray–Curtis similarity and pairwise differences in geographic distance/environmental factors. (C) Variation partitioning showing the contribution of spatial factors (geo) and environmental variables (env) to the variation of taxonomic beta-diversity.


Table 1.
Spearman correlation coefficients between the geospatial/environmental predictors and the first two axes of NMDS.
Table 1.
Spearman correlation coefficients between the geospatial/environmental predictors and the first two axes of NMDS.
| NMDS1 | NMDS2 | |||
|---|---|---|---|---|
| Adjust R2 | p | Adjust R2 | p | |
| lat | −0.052 | 0.821 | 0.267 | 0.012 |
| lon | −0.046 | 0.682 | 0.139 | 0.059 |
| TC | −0.054 | 0.881 | 0.063 | 0.148 |
| TN | −0.041 | 0.618 | −0.048 | 0.726 |
| TP | −0.024 | 0.466 | −0.045 | 0.669 |
| pH | −0.044 | 0.664 | 0.045 | 0.186 |
| Sty | −0.045 | 0.678 | −0.056 | 0.999 |
| MAT | −0.048 | 0.727 | 0.025 | 0.239 |
| MAP | 0.034 | 0.212 | 0.162 | 0.044 |
| DTR | −0.032 | 0.533 | 0.098 | 0.097 |
Note: significant relationships are presented in bold. Abbreviations: lat: latitude; lon: longitude; TC: total carbon in soil; TN: total nitrogen in soil; TP: total phosphorus in soil; pH: pH value of soil; Sty: soil types; MAT: mean annual temperature; MAP: mean annual precipitation; DTR: diurnal temperature range.
Publisher’s Note: MDPI stays neutral with regard to jurisdictional claims in published maps and institutional affiliations. |
© 2021 by the authors. Licensee MDPI, Basel, Switzerland. This article is an open access article distributed under the terms and conditions of the Creative Commons Attribution (CC BY) license (https://creativecommons.org/licenses/by/4.0/).
Share and Cite
MDPI and ACS Style
Cui, S.; Ouyang, J.; Lu, Y.; Liu, W.; Li, W.; Liu, G.; Zhou, W. The Diversity and Community Assembly Process of Wetland Plants from Lakeshores on the Qinghai-Tibetan Plateau. Diversity 2021, 13, 685. https://doi.org/10.3390/d13120685
AMA Style
Cui S, Ouyang J, Lu Y, Liu W, Li W, Liu G, Zhou W. The Diversity and Community Assembly Process of Wetland Plants from Lakeshores on the Qinghai-Tibetan Plateau. Diversity. 2021; 13(12):685. https://doi.org/10.3390/d13120685
Chicago/Turabian StyleCui, Shasha, Jian Ouyang, Yu Lu, Wenzhi Liu, Wenyang Li, Guihua Liu, and Wen Zhou. 2021. "The Diversity and Community Assembly Process of Wetland Plants from Lakeshores on the Qinghai-Tibetan Plateau" Diversity 13, no. 12: 685. https://doi.org/10.3390/d13120685
Note that from the first issue of 2016, this journal uses article numbers instead of page numbers. See further details here.