
Mutation Hotspots Found in Bladder Cancer Aid Prediction of Carcinogenic Risk in Normal Urothelium
 , and
, and 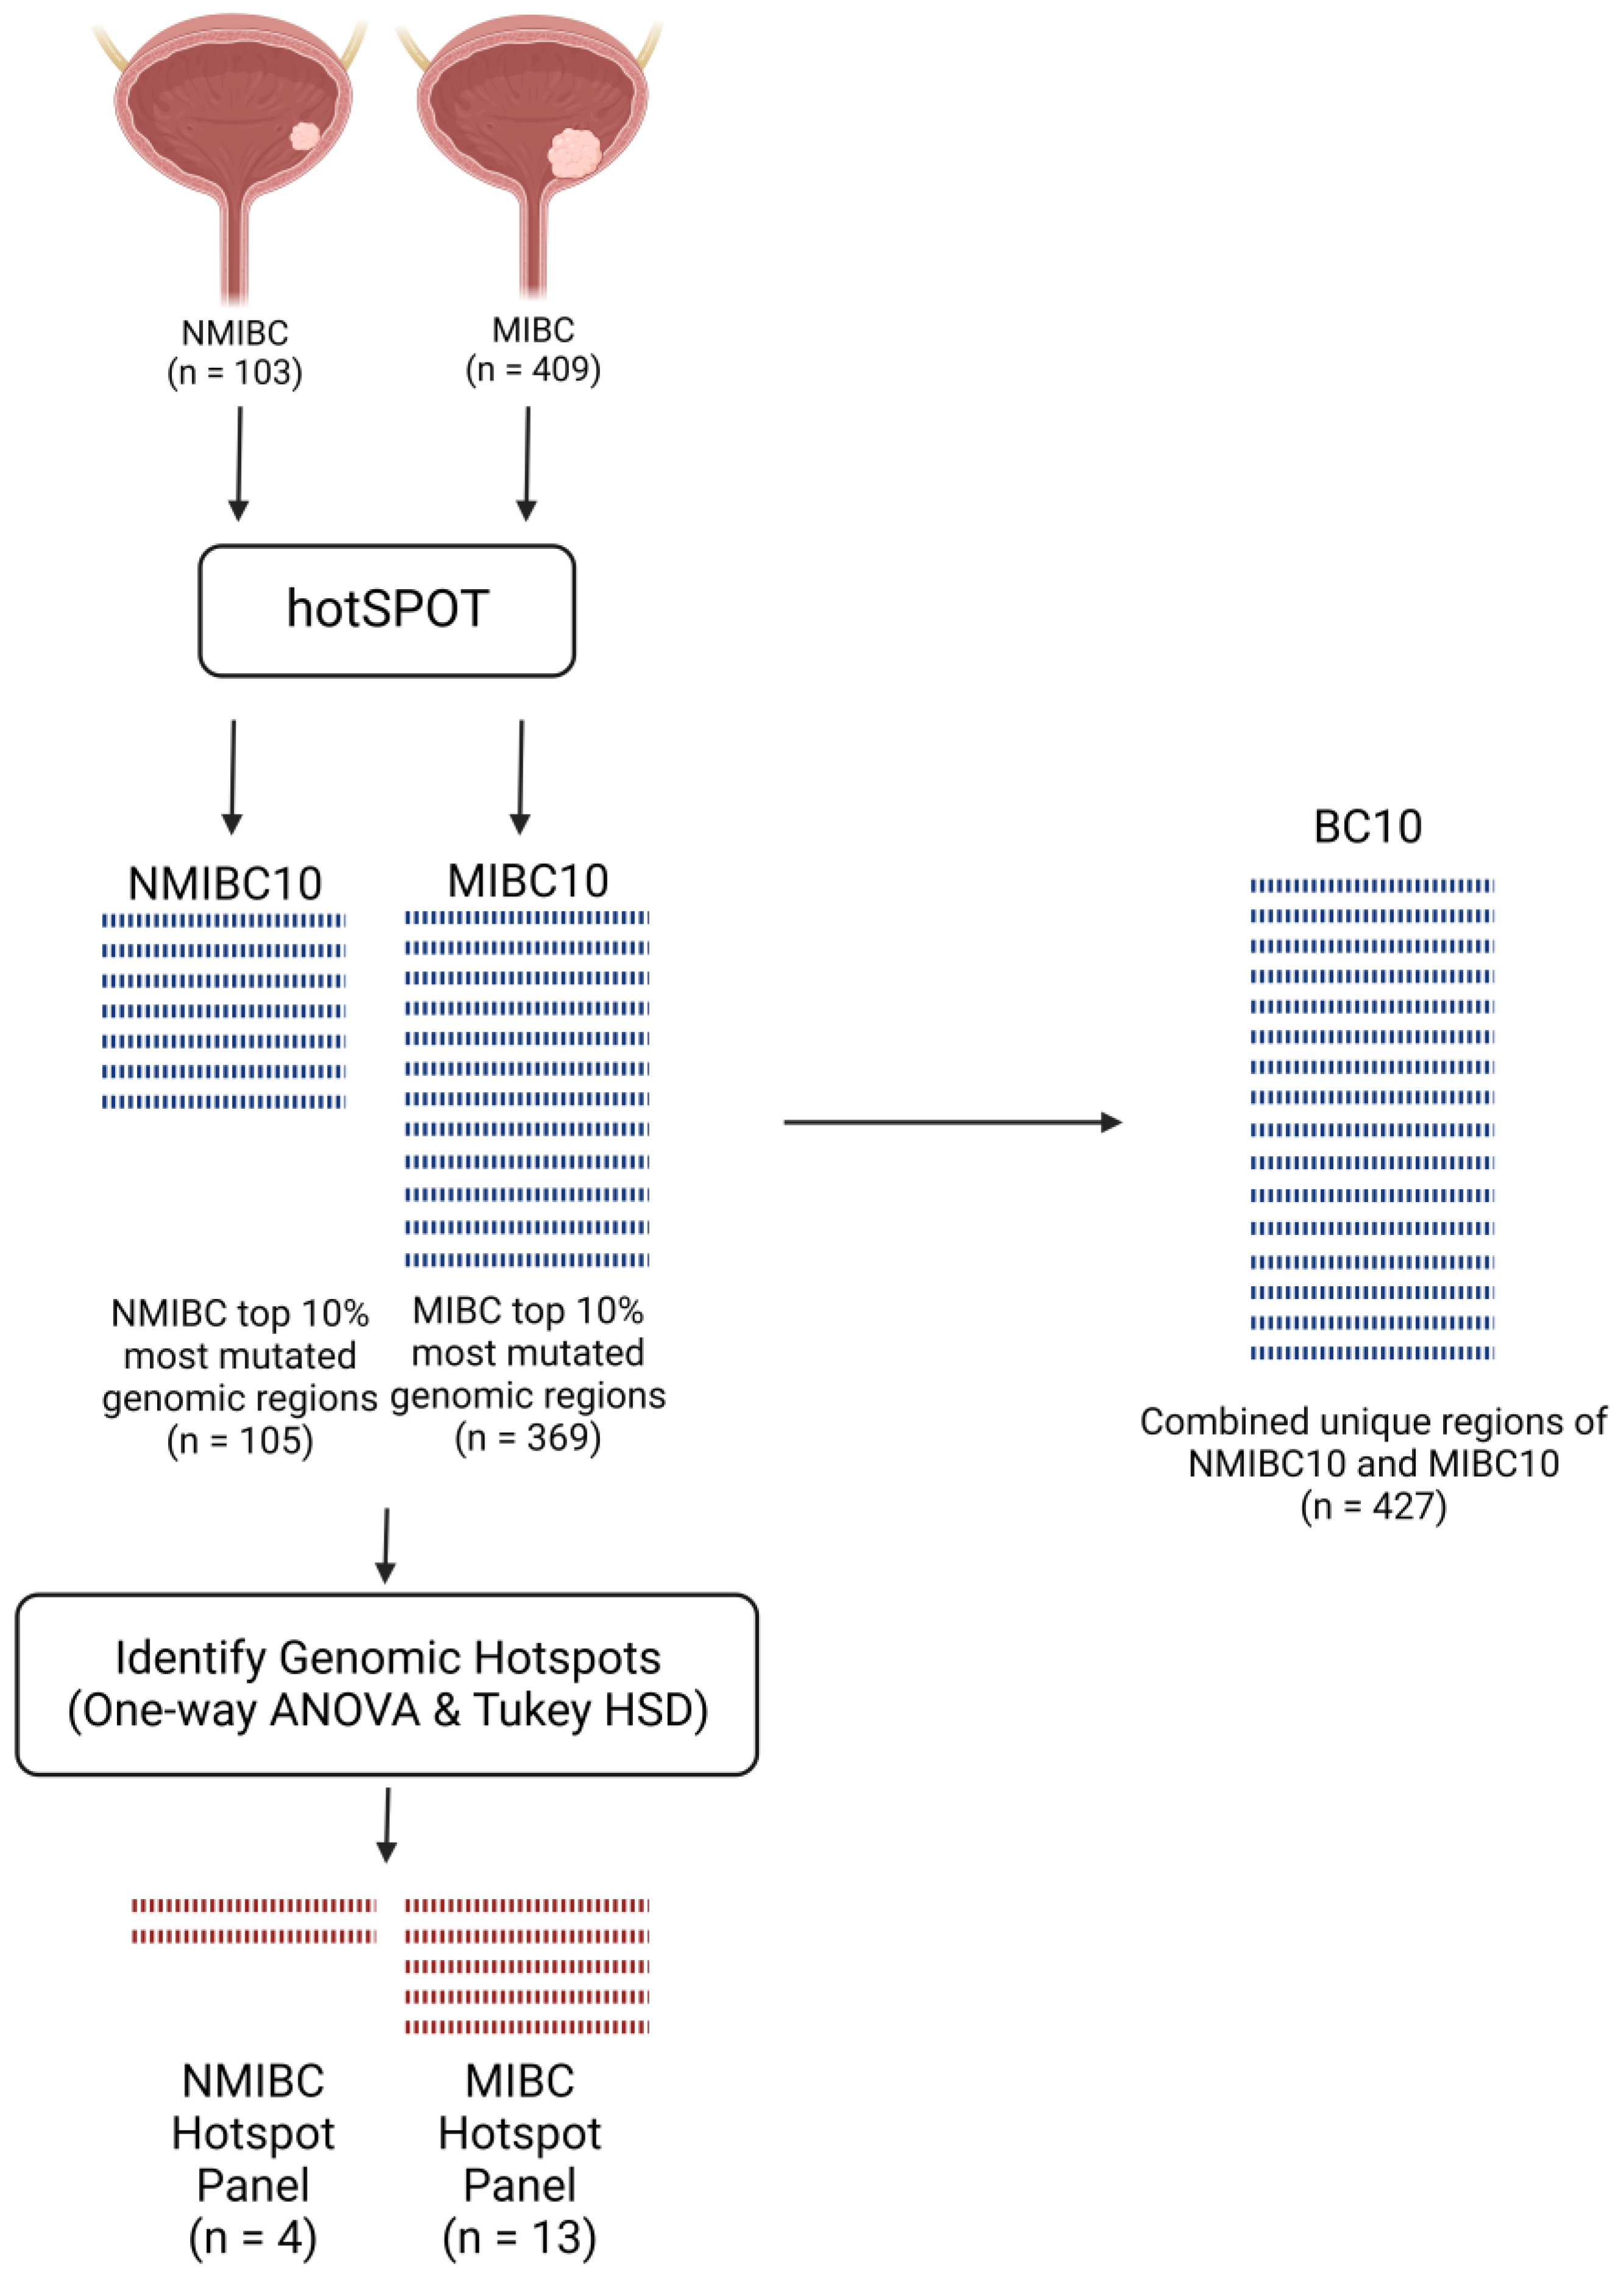
Abstract
:1. Introduction
2. Results
2.1. Overlap between Highly Mutated Genomic Regions in MIBC and NMIBC
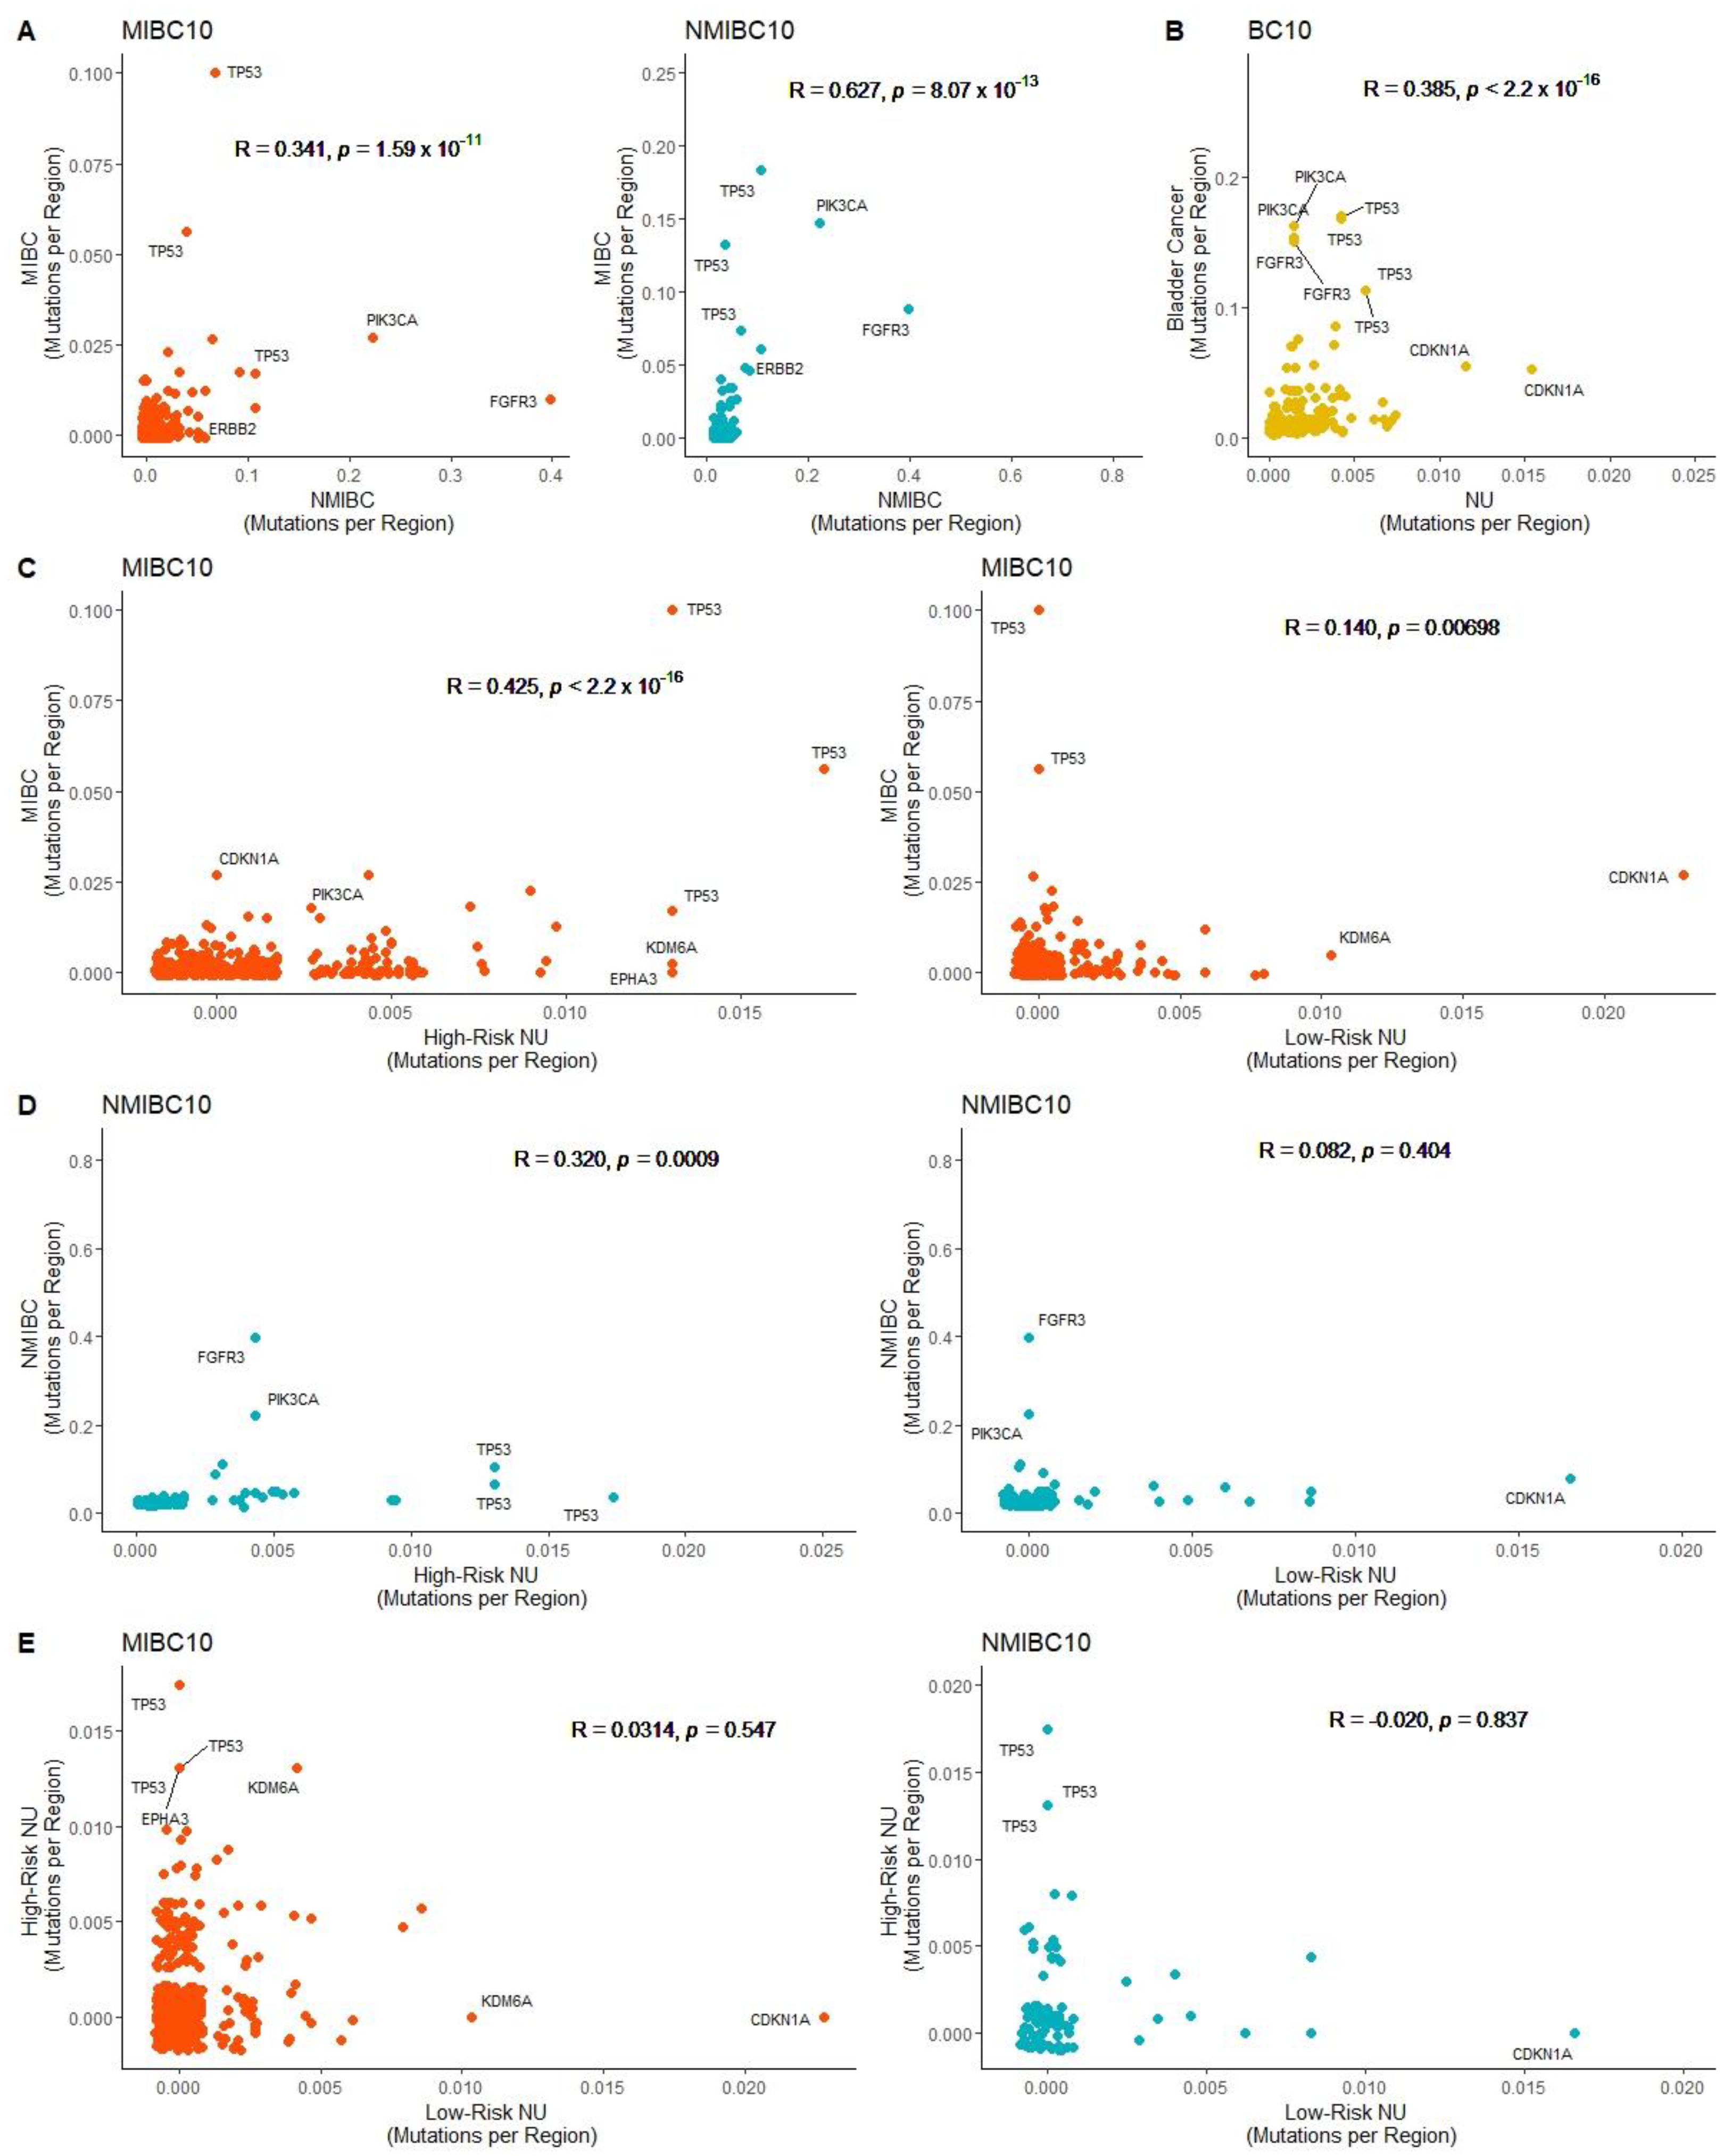
2.2. Correlation of Mutated Genomic Regions in Bladder Cancer and Normal Urothelium
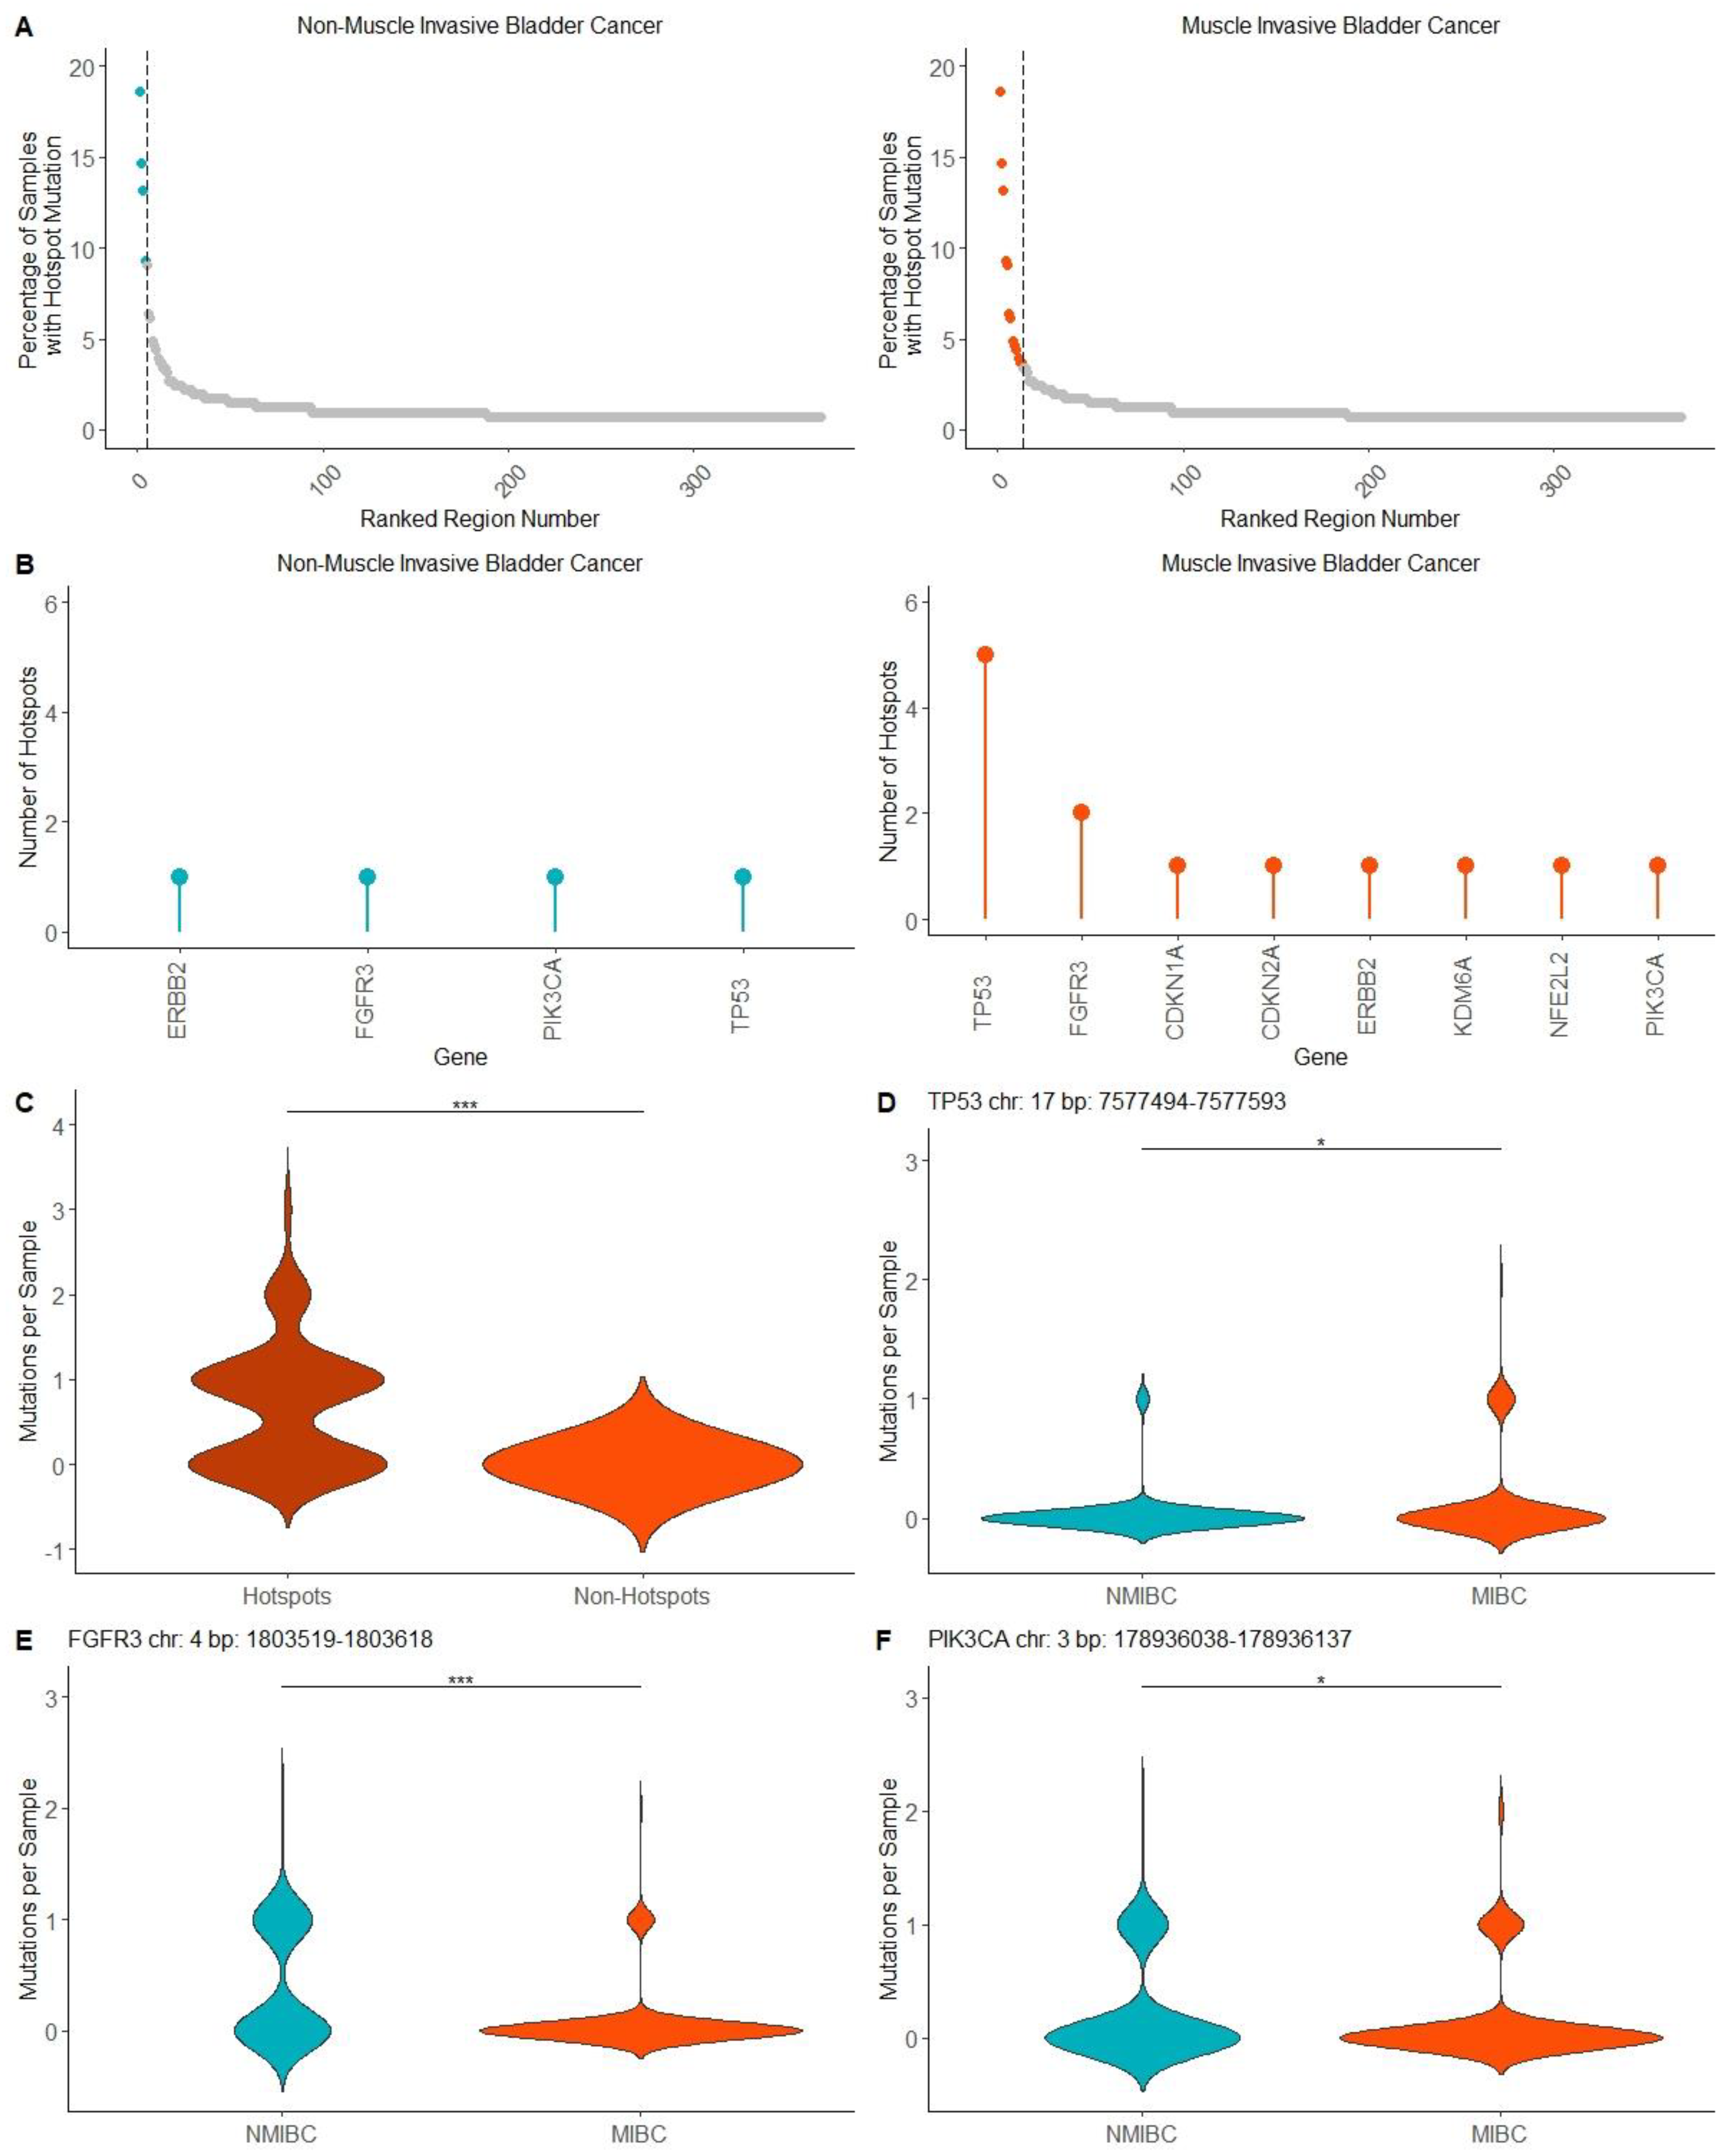
2.3. Mutation Hotspots in MIBC and NMIBC
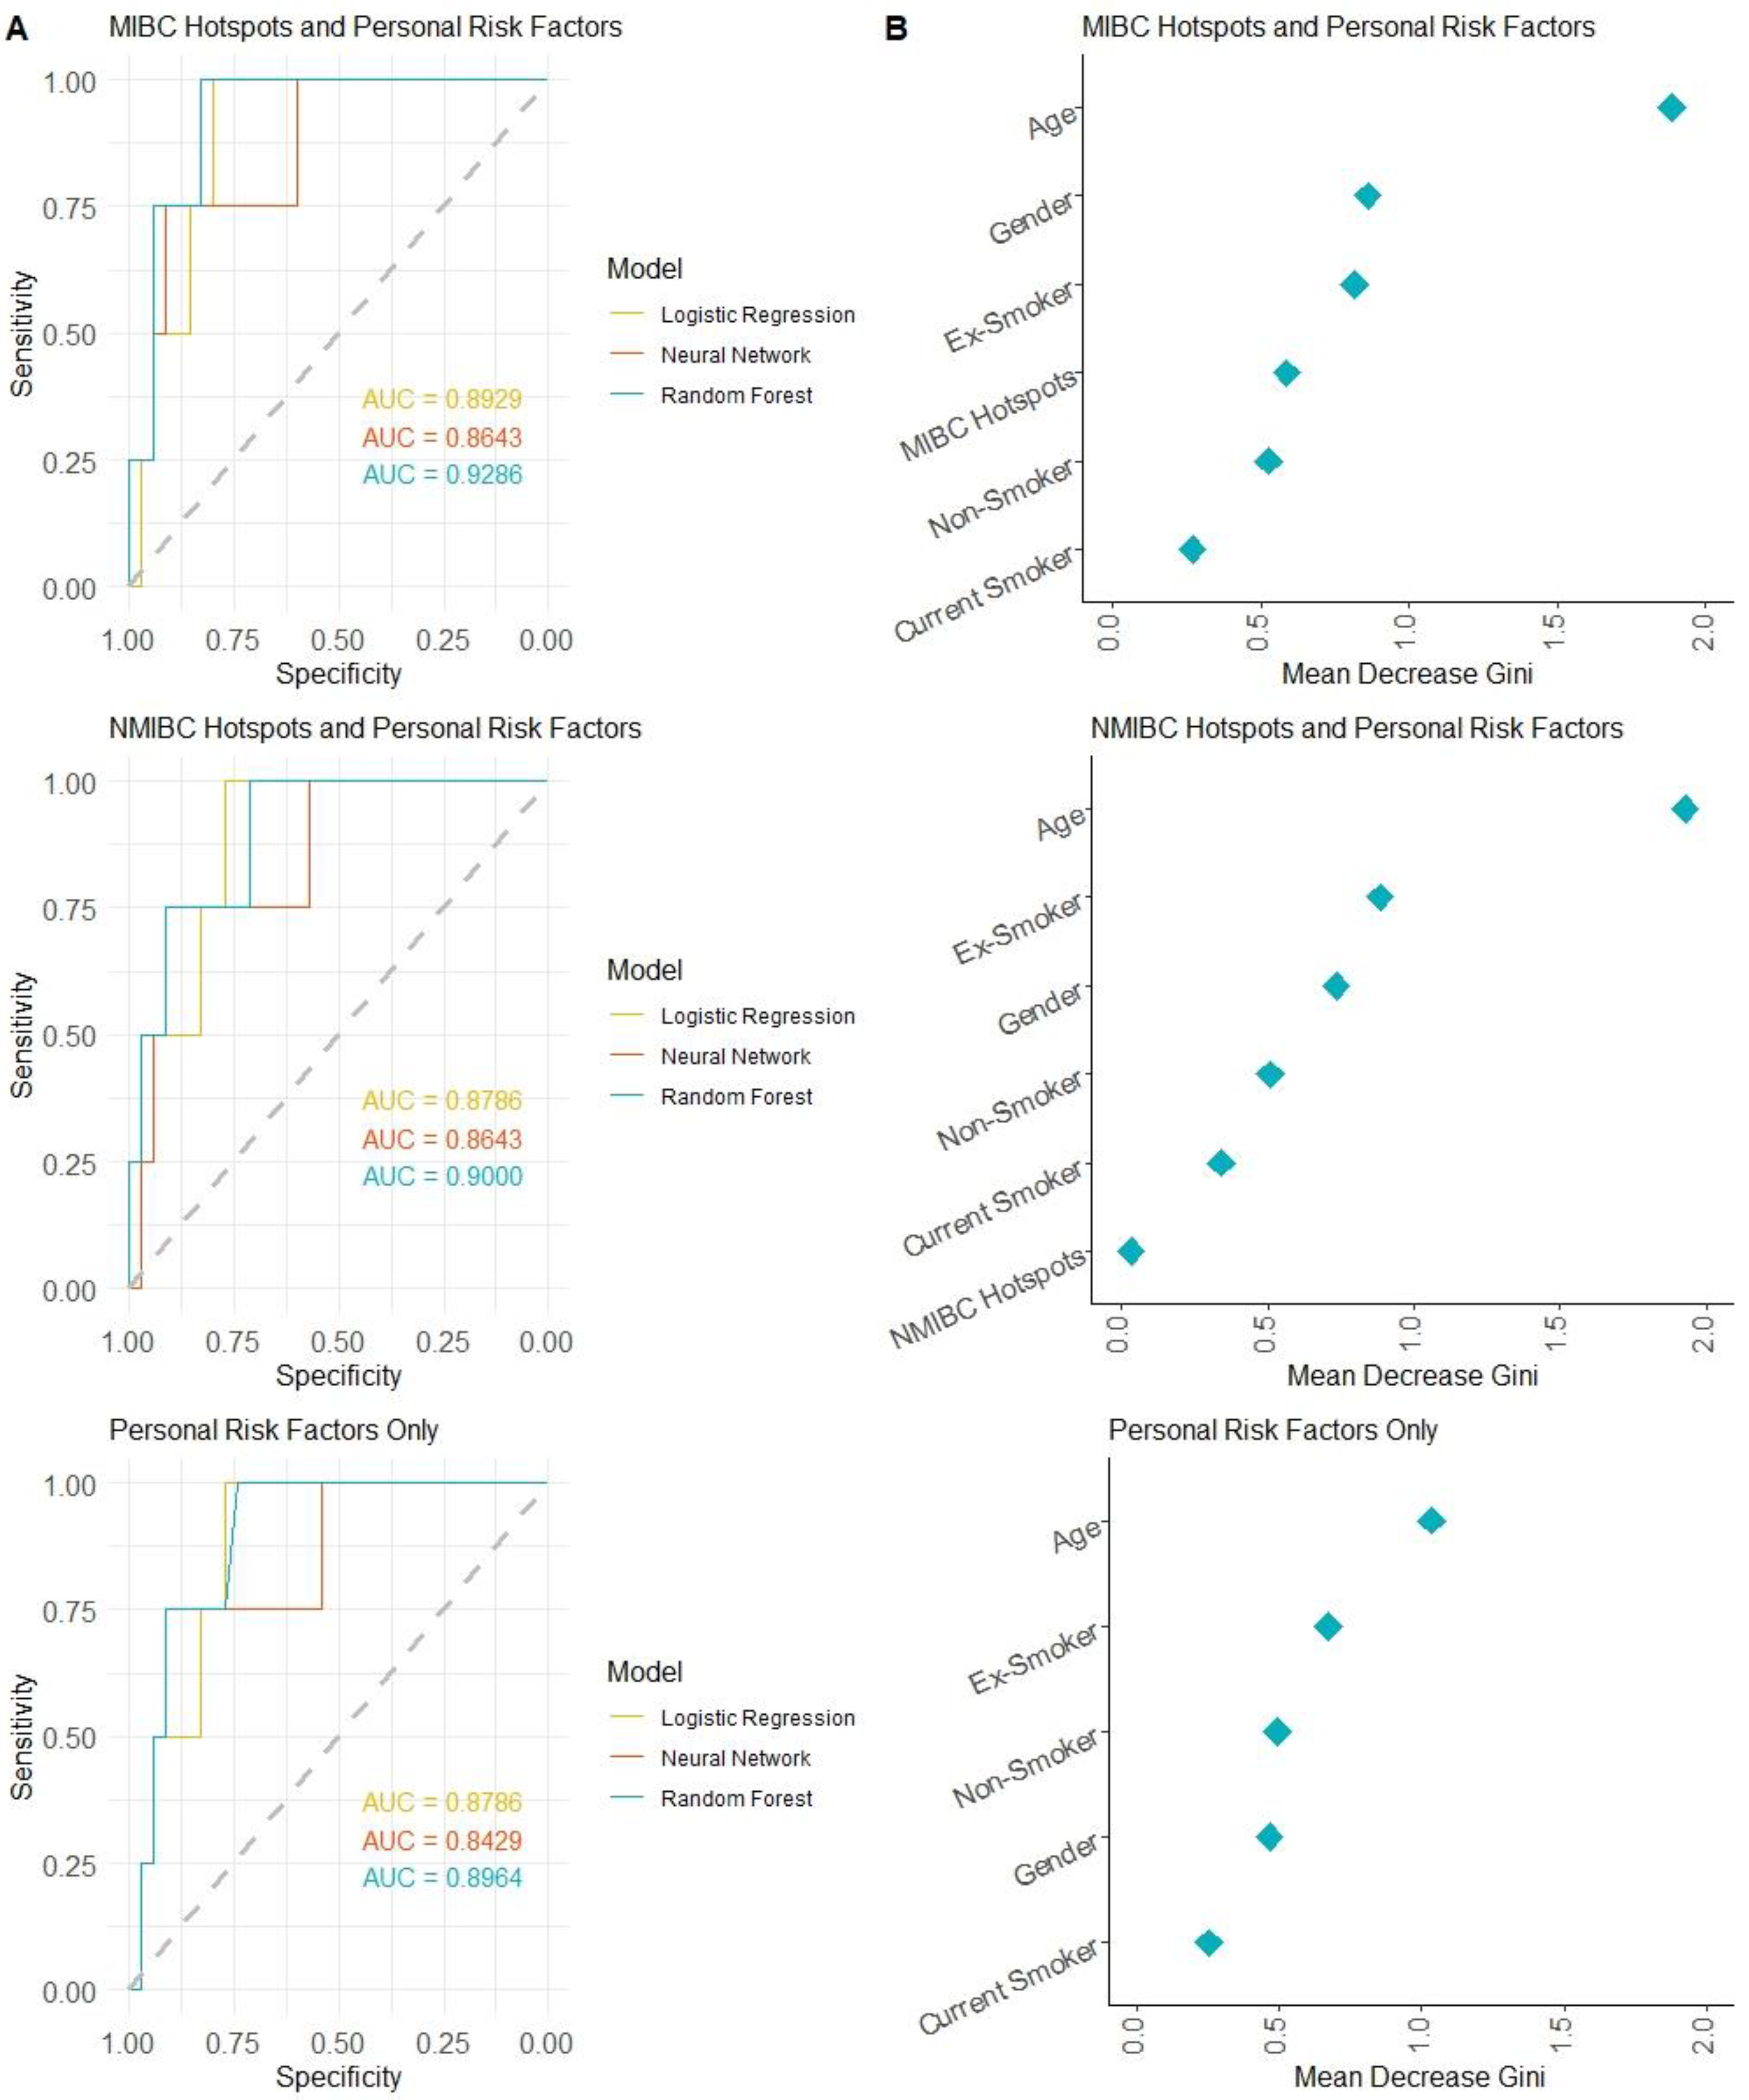
2.4. Machine Learning Approach to Predicting Bladder Cancer Risk in Normal Urothelium Using Mutation Hotspots
3. Discussion
4. Materials and Methods
4.1. Datasets
4.2. Development of Hotspot Panels
4.3. Analysis in R
5. Conclusions
Supplementary Materials
Author Contributions
Funding
Institutional Review Board Statement
Informed Consent Statement
Data Availability Statement
Acknowledgments
Conflicts of Interest
References
- National Cancer Institute: Surveillance, Epidemiology and End Results Program. Cancer Stat Facts: Bladder Cancer. Available online: https://seer.cancer.gov/statfacts/html/urinb.html (accessed on 22 April 2023).
- Lenis, A.T.; Lec, P.M.; Chamie, K.; Mshs, M.D. Bladder Cancer: A Review. JAMA 2020, 324, 1980–1991. [Google Scholar] [CrossRef] [PubMed]
- Mossanen, M.; Wang, Y.; Szymaniak, J.; Tan, W.S.; Huynh, M.J.; Preston, M.A.; Trinh, Q.D.; Sonpavde, G.; Kibel, A.S.; Chang, S.L. Evaluating the cost of surveillance for non-muscle-invasive bladder cancer: An analysis based on risk categories. World J. Urol. 2019, 37, 2059–2065. [Google Scholar] [CrossRef]
- Crabb, S.J.; Douglas, J. The latest treatment options for bladder cancer. Br. Med. Bull. 2018, 128, 85–95. [Google Scholar] [CrossRef]
- Patel, V.G.; Oh, W.K.; Galsky, M.D. Treatment of muscle-invasive and advanced bladder cancer in 2020. CA Cancer J. Clin. 2020, 70, 404–423. [Google Scholar] [CrossRef] [PubMed]
- Fankhauser, C.D.; Mostafid, H. Prevention of bladder cancer incidence and recurrence: Nutrition and lifestyle. Curr. Opin. Urol. 2018, 28, 88–92. [Google Scholar] [CrossRef]
- Shariat, S.F.; Sfakianos, J.P.; Droller, M.J.; Karakiewicz, P.I.; Meryn, S.; Bochner, B.H. The effect of age and gender on bladder cancer: A critical review of the literature. BJU Int. 2010, 105, 300–308. [Google Scholar] [CrossRef]
- Martincorena, I. Somatic mutation and clonal expansions in human tissues. Genome Med. 2019, 11, 35. [Google Scholar] [CrossRef]
- Lawson, A.R.J.; Abascal, F.; Coorens, T.H.H.; Hooks, Y.; O’Neill, L.; Latimer, C.; Raine, K.; Sanders, M.A.; Warren, A.Y.; Mahbubani, K.T.A.; et al. Extensive heterogeneity in somatic mutation and selection in the human bladder. Science 2020, 370, 75–82. [Google Scholar] [CrossRef]
- Li, R.; Du, Y.; Chen, Z.; Xu, D.; Lin, T.; Jin, S.; Wang, G.; Liu, Z.; Lu, M.; Chen, X.; et al. Macroscopic somatic clonal expansion in morphologically normal human urothelium. Science 2020, 370, 82–89. [Google Scholar] [CrossRef]
- Chan, K.; Gordenin, D.A. Clusters of Multiple Mutations: Incidence and Molecular Mechanisms. Annu. Rev. Genet. 2015, 49, 243–267. [Google Scholar] [CrossRef]
- Juul, R.I.; Nielsen, M.M.; Juul, M.; Feuerbach, L.; Pedersen, J.S. The landscape and driver potential of site-specific hotspots across cancer genomes. NPJ Genom. Med. 2021, 6, 33. [Google Scholar] [CrossRef] [PubMed]
- Long, X.; Xue, H. Genetic-variant hotspots and hotspot clusters in the human genome facilitating adaptation while increasing instability. Hum. Genom. 2021, 15, 19. [Google Scholar] [CrossRef]
- Hayashi, Y.; Fujita, K.; Matsuzaki, K.; Eich, M.L.; Tomiyama, E.; Matsushita, M.; Koh, Y.; Nakano, K.; Wang, C.; Ishizuya, Y.; et al. Clinical Significance of Hotspot Mutation Analysis of Urinary Cell-Free DNA in Urothelial Bladder Cancer. Front. Oncol. 2020, 10, 755. [Google Scholar] [CrossRef]
- Sjodahl, G.; Eriksson, P.; Patschan, O.; Marzouka, N.A.; Jakobsson, L.; Bernardo, C.; Lovgren, K.; Chebil, G.; Zwarthoff, E.; Liedberg, F.; et al. Molecular changes during progression from nonmuscle invasive to advanced urothelial carcinoma. Int. J. Cancer 2020, 146, 2636–2647. [Google Scholar] [CrossRef]
- Weyerer, V.; Eckstein, M.; Strissel, P.L.; Wullweber, A.; Lange, F.; Togel, L.; Geppert, C.I.; Sikic, D.; Taubert, H.; Wach, S.; et al. TERT Promoter Mutation Analysis of Whole-Organ Mapping Bladder Cancers. Genes 2021, 12, 230. [Google Scholar] [CrossRef] [PubMed]
- Hovelson, D.H.; Udager, A.M.; McDaniel, A.S.; Grivas, P.; Palmbos, P.; Tamura, S.; Lazo de la Vega, L.; Palapattu, G.; Veeneman, B.; El-Sawy, L.; et al. Targeted DNA and RNA Sequencing of Paired Urothelial and Squamous Bladder Cancers Reveals Discordant Genomic and Transcriptomic Events and Unique Therapeutic Implications. Eur. Urol. 2018, 74, 741–753. [Google Scholar] [CrossRef]
- Shi, M.J.; Meng, X.Y.; Fontugne, J.; Chen, C.L.; Radvanyi, F.; Bernard-Pierrot, I. Identification of new driver and passenger mutations within APOBEC-induced hotspot mutations in bladder cancer. Genome Med. 2020, 12, 85. [Google Scholar] [CrossRef]
- Wei, L.; Christensen, S.R.; Fitzgerald, M.E.; Graham, J.; Hutson, N.D.; Zhang, C.; Huang, Z.; Hu, Q.; Zhan, F.; Xie, J.; et al. Ultradeep sequencing differentiates patterns of skin clonal mutations associated with sun-exposure status and skin cancer burden. Sci. Adv. 2021, 7, eabd7703. [Google Scholar] [CrossRef]
- Grant, S.R.; Rosario, S.R.; Patentreger, A.D.; Shary, N.; Fitzgerald, M.E.; Singh, P.K.; Foster, B.A.; Huss, W.J.; Wei, L.; Paragh, G. HotSPOT: A Computational Tool to Design Targeted Sequencing Panels to Assess Early Photocarcinogenesis. Cancers 2023, 15, 1612. [Google Scholar] [CrossRef]
- Pietzak, E.J.; Bagrodia, A.; Cha, E.K.; Drill, E.N.; Iyer, G.; Isharwal, S.; Ostrovnaya, I.; Baez, P.; Li, Q.; Berger, M.F.; et al. Next-generation Sequencing of Nonmuscle Invasive Bladder Cancer Reveals Potential Biomarkers and Rational Therapeutic Targets. Eur. Urol. 2017, 72, 952–959. [Google Scholar] [CrossRef] [PubMed]
- Robertson, A.G.; Kim, J.; Al-Ahmadie, H.; Bellmunt, J.; Guo, G.; Cherniack, A.D.; Hinoue, T.; Laird, P.W.; Hoadley, K.A.; Akbani, R.; et al. Comprehensive Molecular Characterization of Muscle-Invasive Bladder Cancer. Cell 2017, 171, 540–556.e525. [Google Scholar] [CrossRef]
- Cheng, D.T.; Mitchell, T.N.; Zehir, A.; Shah, R.H.; Benayed, R.; Syed, A.; Chandramohan, R.; Liu, Z.Y.; Won, H.H.; Scott, S.N.; et al. Memorial Sloan Kettering-Integrated Mutation Profiling of Actionable Cancer Targets (MSK-IMPACT): A Hybridization Capture-Based Next-Generation Sequencing Clinical Assay for Solid Tumor Molecular Oncology. J. Mol. Diagn. 2015, 17, 251–264. [Google Scholar] [CrossRef]
- Ghosh, D.; Cabrera, J. Enriched Random Forest for High Dimensional Genomic Data. IEEE/ACM Trans. Comput. Biol. Bioinform. 2022, 19, 2817–2828. [Google Scholar] [CrossRef] [PubMed]
- Tran, K.A.; Kondrashova, O.; Bradley, A.; Williams, E.D.; Pearson, J.V.; Waddell, N. Deep learning in cancer diagnosis, prognosis and treatment selection. Genome Med. 2021, 13, 152. [Google Scholar] [CrossRef] [PubMed]
- Kennedy, S.R.; Zhang, Y.; Risques, R.A. Cancer-Associated Mutations but No Cancer: Insights into the Early Steps of Carcinogenesis and Implications for Early Cancer Detection. Trends Cancer 2019, 5, 531–540. [Google Scholar] [CrossRef]
- Risques, R.A.; Kennedy, S.R. Aging and the rise of somatic cancer-associated mutations in normal tissues. PLoS Genet. 2018, 14, e1007108. [Google Scholar] [CrossRef] [PubMed]
- Liu, H.P.; Jia, W.; Kadeerhan, G.; Xue, B.; Guo, W.; Niu, L.; Wang, X.; Wu, X.; Li, H.; Tian, J.; et al. Individualized prognosis stratification in muscle invasive bladder cancer: A pairwise TP53-derived transcriptome signature. Transl. Oncol. 2023, 29, 101629. [Google Scholar] [CrossRef]
- Esrig, D.; Elmajian, D.; Groshen, S.; Freeman, J.A.; Stein, J.P.; Chen, S.C.; Nichols, P.W.; Skinner, D.G.; Jones, P.A.; Cote, R.J. Accumulation of nuclear p53 and tumor progression in bladder cancer. N. Engl. J. Med. 1994, 331, 1259–1264. [Google Scholar] [CrossRef] [PubMed]
- Acha-Sagredo, A.; Ganguli, P.; Ciccarelli, F.D. Somatic variation in normal tissues: Friend or foe of cancer early detection? Ann. Oncol. 2022, 33, 1239–1249. [Google Scholar] [CrossRef]
- Martincorena, I.; Fowler, J.C.; Wabik, A.; Lawson, A.R.J.; Abascal, F.; Hall, M.W.J.; Cagan, A.; Murai, K.; Mahbubani, K.; Stratton, M.R.; et al. Somatic mutant clones colonize the human esophagus with age. Science 2018, 362, 911–917. [Google Scholar] [CrossRef]
- Koutros, S.; Rao, N.; Moore, L.E.; Nickerson, M.L.; Lee, D.; Zhu, B.; Pardo, L.A.; Baris, D.; Schwenn, M.; Johnson, A.; et al. Targeted Deep Sequencing of Bladder Tumors Reveals Novel Associations between Cancer Gene Mutations and Mutational Signatures with Major Risk Factors. Clin. Cancer Res. 2021, 27, 3725–3733. [Google Scholar] [CrossRef]
- Cancer Genome Atlas Research Network. Comprehensive molecular characterization of urothelial bladder carcinoma. Nature 2014, 507, 315–322. [Google Scholar] [CrossRef] [PubMed]
- Hayashi, Y.; Fujita, K.; Sakai, K.; Adomi, S.; Banno, E.; Nojima, S.; Tomiyama, E.; Matsushita, M.; Kato, T.; Hatano, K.; et al. Targeted-sequence of normal urothelium and tumor of patients with non-muscle invasive bladder cancer. Sci. Rep. 2022, 12, 16642. [Google Scholar] [CrossRef]
- Meeks, J.J.; Carneiro, B.A.; Pai, S.G.; Oberlin, D.T.; Rademaker, A.; Fedorchak, K.; Balasubramanian, S.; Elvin, J.; Beaubier, N.; Giles, F.J. Genomic characterization of high-risk non-muscle invasive bladder cancer. Oncotarget 2016, 7, 75176–75184. [Google Scholar] [CrossRef] [PubMed]
- Robertson, H.; Dinkova-Kostova, A.T.; Hayes, J.D. NRF2 and the Ambiguous Consequences of Its Activation during Initiation and the Subsequent Stages of Tumourigenesis. Cancers 2020, 12, 3609. [Google Scholar] [CrossRef] [PubMed]
- Hernández, S.; López-Knowles, E.; Lloreta, J.; Kogevinas, M.; Amorós, A.; Tardón, A.; Carrato, A.; Serra, C.; Malats, N.; Real, F.X. Prospective study of FGFR3 mutations as a prognostic factor in nonmuscle invasive urothelial bladder carcinomas. J. Clin. Oncol. 2006, 24, 3664–3671. [Google Scholar] [CrossRef]
- Tomlinson, D.; Baldo, O.; Harnden, P.; Knowles, M. FGFR3 protein expression and its relationship to mutation status and prognostic variables in bladder cancer. J. Pathol. 2007, 213, 91–98. [Google Scholar] [CrossRef]
- Weickhardt, A.J.; Lau, D.K.; Hodgson-Garms, M.; Lavis, A.; Jenkins, L.J.; Vukelic, N.; Ioannidis, P.; Luk, I.Y.; Mariadason, J.M. Dual targeting of FGFR3 and ERBB3 enhances the efficacy of FGFR inhibitors in FGFR3 fusion-driven bladder cancer. BMC Cancer 2022, 22, 478. [Google Scholar] [CrossRef]
- Dueñas, M.; Martínez-Fernández, M.; García-Escudero, R.; Villacampa, F.; Marqués, M.; Saiz-Ladera, C.; Duarte, J.; Martínez, V.; Gómez, M.J.; Martín, M.L.; et al. PIK3CA gene alterations in bladder cancer are frequent and associate with reduced recurrence in non-muscle invasive tumors. Mol. Carcinog. 2015, 54, 566–576. [Google Scholar] [CrossRef]
- Murai, K.; Dentro, S.; Ong, S.H.; Sood, R.; Fernandez-Antoran, D.; Herms, A.; Kostiou, V.; Abnizova, I.; Hall, B.A.; Gerstung, M.; et al. p53 mutation in normal esophagus promotes multiple stages of carcinogenesis but is constrained by clonal competition. Nat. Commun. 2022, 13, 6206. [Google Scholar] [CrossRef]
- Curigliano, G.; Zhang, Y.J.; Wang, L.Y.; Flamini, G.; Alcini, A.; Ratto, C.; Giustacchini, M.; Alcini, E.; Cittadini, A.; Santella, R.M. Immunohistochemical quantitation of 4-aminobiphenyl-DNA adducts and p53 nuclear overexpression in T1 bladder cancer of smokers and nonsmokers. Carcinogenesis 1996, 17, 911–916. [Google Scholar] [CrossRef] [PubMed]
- Gasper, A.V.; Al-Janobi, A.; Smith, J.A.; Bacon, J.R.; Fortun, P.; Atherton, C.; Taylor, M.A.; Hawkey, C.J.; Barrett, D.A.; Mithen, R.F. Glutathione S-transferase M1 polymorphism and metabolism of sulforaphane from standard and high-glucosinolate broccoli. Am. J. Clin. Nutr. 2005, 82, 1283–1291. [Google Scholar] [CrossRef]
- Piacentini, S.; Polimanti, R.; Porreca, F.; Martinez-Labarga, C.; De Stefano, G.F.; Fuciarelli, M. GSTT1 and GSTM1 gene polymorphisms in European and African populations. Mol. Biol. Rep. 2011, 38, 1225–1230. [Google Scholar] [CrossRef]
- Kakiuchi, N.; Ogawa, S. Clonal expansion in non-cancer tissues. Nat. Rev. Cancer 2021, 21, 239–256. [Google Scholar] [CrossRef]
- Strandgaard, T.; Nordentoft, I.; Lamy, P.; Christensen, E.; Thomsen, M.B.H.; Jensen, J.B.; Dyrskjøt, L. Mutational Analysis of Field Cancerization in Bladder Cancer. Bladder Cancer 2020, 6, 253–264. [Google Scholar] [CrossRef]
- Zhao, H.; Lin, J.; Grossman, H.B.; Hernandez, L.M.; Dinney, C.P.; Wu, X. Dietary isothiocyanates, GSTM1, GSTT1, NAT2 polymorphisms and bladder cancer risk. Int. J. Cancer 2007, 120, 2208–2213. [Google Scholar] [CrossRef] [PubMed]
- Tang, L.; Zirpoli, G.R.; Guru, K.; Moysich, K.B.; Zhang, Y.; Ambrosone, C.B.; McCann, S.E. Intake of cruciferous vegetables modifies bladder cancer survival. Cancer Epidemiol. Biomark. Prev. 2010, 19, 1806–1811. [Google Scholar] [CrossRef]
- R Core Team. R: A Language and Environment for Statistical Computing, version 4.1.1; R Foundation for Statistical Computing: Vienna, Austria, 2021. [Google Scholar]
- Brown, C. Hash: Full Feature Implementation of Hash/Associated Arrays/Dictionaries, version 2.2.6.1; R Foundation for Statistical Computing: Vienna, Austria, 2019. [Google Scholar]
- Ren, K. rlist: A Toolbox for Non-Tabular Data Manipulation, version 0.4.6.2; R Foundation for Statistical Computing: Vienna, Austria, 2021. [Google Scholar]
- Bengtsson, H.R. utils: Various Programming Utilities, version 2.11.0; R Foundation for Statistical Computing: Vienna, Austria, 2021. [Google Scholar]
- Wickham, H. ggplot2: Elegant Graphics for Data Analysis; Springer: New York, NY, USA, 2016. [Google Scholar]
- Kassambara, A. ggpubr: ‘ggplot2’ Based Publication Ready Plots, version 0.4.0; R Foundation for Statistical Computing: Vienna, Austria, 2020. [Google Scholar]
- Constantin, A.-E.; Patil, I. {ggsignif}: R Package for Displaying Significance Brackets for {’ggplot2’}; R Foundation for Statistical Computing: Vienna, Austria, 2021. [Google Scholar]
- Slowikowski, K. ggrepel: Automatically Position Non-Overlapping Text Labels with ’ggplot2’, version 0.9.1; R Foundation for Statistical Computing: Vienna, Austria, 2021. [Google Scholar]
- Kuhn, M. caret: Classification and Regression Training, version 6.0-90; R Foundation for Statistical Computing: Vienna, Austria, 2021. [Google Scholar]
- Friedman, J.; Hastie, T.; Tibshirani, R. Regularization Paths for Generalized Linear Models via Coordinate Descent. J. Stat. Softw. 2010, 33, 1. [Google Scholar] [CrossRef]
- Fritsch, S.; Guenther, F.; Wright, M.N. neuralnet: Training of Neural Networks, version 1.44.2; R Foundation for Statistical Computing: Vienna, Austria, 2019. [Google Scholar]
- Liaw, A.; Wiener, M. Classification and Regression by randomForest; Northwestern University: Evanston, IL, USA, 2002. [Google Scholar]
- Robin, X.; Turck, N.; Hainard, A.; Tiberti, N.; Lisacek, F.; Sanchez, J.-C.; Muller, M. pROC: An open-source package for R and S+ to analyze and compare ROC curves. BMC Bioinform. 2011, 12, 77. [Google Scholar] [CrossRef]


Disclaimer/Publisher’s Note: The statements, opinions and data contained in all publications are solely those of the individual author(s) and contributor(s) and not of MDPI and/or the editor(s). MDPI and/or the editor(s) disclaim responsibility for any injury to people or property resulting from any ideas, methods, instructions or products referred to in the content. |
© 2023 by the authors. Licensee MDPI, Basel, Switzerland. This article is an open access article distributed under the terms and conditions of the Creative Commons Attribution (CC BY) license (https://creativecommons.org/licenses/by/4.0/).
Share and Cite
Grant, S.R.; Tang, L.; Wei, L.; Foster, B.A.; Paragh, G.; Huss, W.J. Mutation Hotspots Found in Bladder Cancer Aid Prediction of Carcinogenic Risk in Normal Urothelium. Int. J. Mol. Sci. 2023, 24, 7852. https://doi.org/10.3390/ijms24097852
Grant SR, Tang L, Wei L, Foster BA, Paragh G, Huss WJ. Mutation Hotspots Found in Bladder Cancer Aid Prediction of Carcinogenic Risk in Normal Urothelium. International Journal of Molecular Sciences. 2023; 24(9):7852. https://doi.org/10.3390/ijms24097852
Chicago/Turabian StyleGrant, Sydney R., Li Tang, Lei Wei, Barbara A. Foster, Gyorgy Paragh, and Wendy J. Huss. 2023. "Mutation Hotspots Found in Bladder Cancer Aid Prediction of Carcinogenic Risk in Normal Urothelium" International Journal of Molecular Sciences 24, no. 9: 7852. https://doi.org/10.3390/ijms24097852