Article

Exploring the Conformational Equilibrium of Mefenamic Acid Released from Silica Aerogels via NMR Analysis

1
G.A. Krestov Institute of Solution Chemistry, Russian Academy of Sciences, Ivanovo 153045, Russia
2
Institute of Chemistry, Saint Petersburg State University, Saint Petersburg 198504, Russia
3
Molecular Physical-Chemistry R&D Unit, Department of Chemistry, University of Coimbra, 3004-535 Coimbra, Portugal
*
Author to whom correspondence should be addressed.
Int. J. Mol. Sci. 2023, 24(8), 6882; https://doi.org/10.3390/ijms24086882
Submission received: 9 March 2023 / Revised: 4 April 2023 / Accepted: 6 April 2023 / Published: 7 April 2023
(This article belongs to the Special Issue Advances in NMR Spectroscopy for Bioactive Small Molecules)

Abstract

:
This study examines the influence of mefenamic acid on the physical and chemical properties of silica aerogels, as well as its effect on the sorption characteristics of the composite material. Solid state magic angle spinning nuclear magnetic resonance (MAS NMR) and high-pressure 13C NMR kinetic studies were conducted to identify the presence of mefenamic acid and measure the kinetic rates of CO2 sorption. Additionally, a high-pressure T1–T2 relaxation-relaxation correlation spectroscopy (RRCOSY) study was conducted to estimate the relative amount of mefenamic acid in the aerogel’s pores, and a high-pressure nuclear Overhauser effect spectoscopy (NOESY) study was conducted to investigate the conformational preference of mefenamic acid released from the aerogel. The results indicate that mefenamic acid is affected by the chemical environment of the aerogel, altering the ratio of mefenamic acid conformers from 75% to 25% in its absence to 22% to 78% in the presence of aerogel.

1. Introduction

Pharmaceutical industries today face the major challenge of delivering poorly soluble drugs and increasing their bioavailability. Two critical aspects of drug development are determining the ideal dosage and creating effective formulations for controlled release [1,2]. Recently, several researchers have proposed various methods based on supercritical fluid technology, such as micronization [3]; the creation of multicomponent crystals [4,5]; microencapsulation [6]; impregnation [7]; adsorbing drugs onto porous carriers [8]; and co-precipitation [9] to address the issue of low dissolution rate. The dissolution rate of drugs is increased by adsorption in an amorphous state [3]. Researchers have noted that the efficiency of such drugs remains unchanged during storage [4,5,6,7]. Singh N. et al. have shown that due to high surface area, silica aerogels (AG) are an effective carrier material for poorly water-soluble drugs [8]. The results show [9] that tetraethyl orthosilicate (TEOS) [10]-doped aerogel had significantly better morphology, structure, and characteristics than the non-TEOS aerogel. It had a higher surface area (264 m2/g vs. 220 m2/g), larger pore size (8.7 nm vs. 8.3 nm), higher pore volume (0.56 cm3/g vs. 0.48 cm3/g), and greater porosity (74.9% vs. 69.8%) [9]. These results demonstrate that TEOS-doped aerogel is a better material for applications involving the adsorption of drugs into silica aerogel. Giray S. and Ulker Z. et al. showed that this method of drug delivery reduces the side effects and increases the bioavailability of the drug, especially for poorly soluble drugs [11,12]. One of these compounds is mefenamic acid (MFA) which, due to several restrictions, is not recommended for use as a non-steroidal anti-inflammatory drug [13,14,15]. Therefore, Tan F. et al. searched for ways to improve the form of mefenamic acid in order to repurpose it as a drug and to give developed or forgotten drugs, such as mefenamic acid, a chance to enter a new therapy field [16]. Wang W.H. and co-authors have studied the drug as a treatment for various conditions, including breast cancer, rheumatoid arthritis, and inflammatory bowel disease [17].
Polymorphs of mefenamic acid can be prepared using various techniques, such as solvent evaporation, sublimation, and recrystallization. Additionally, mefenamic acid could be micronized through mechanical milling, supercritical fluid processing, and high-pressure homogenization. Furthermore, spray-drying, melt-extrusion, and supercritical fluid impregnation can be used for loading matrices with mefenamic acid. Each approach has advantages and disadvantages, and the most appropriate method should be chosen based on the desired product characteristics.
Recent studies by Singh N. and Tkalec G. [8,18] have indicated that silica aerogels could be viable for drug delivery systems [19,20]. Researchers investigated the silica aerogels impregnated with the number of active pharmaceutical ingredients (API) by conducting adsorption experiments. The bioavailability of API loaded into silica aerogels was found to be higher than that of pure API [21]. Additionally, silica aerogels have low-cost, non-toxic properties and are non-irritants on the skin and mucous membranes, making them an ideal carrier material for transdermal drug delivery. In this work, high-pressure NMR spectroscopy is proposed for further studies to explore the potential of TEOS-doped silica aerogel as a mefenamic acid delivery system, understanding the process of aerogel impregnation and control of drug form by obtaining information on the aerogel’s preferred conformers and sorption characteristics after impregnation. The used methods include 13C, NOESY and RRCOSY NMR in supercritical carbon dioxide and solid state 29Si, 1H, 13C (CP) MAS NMR.

2. Results and Discussion

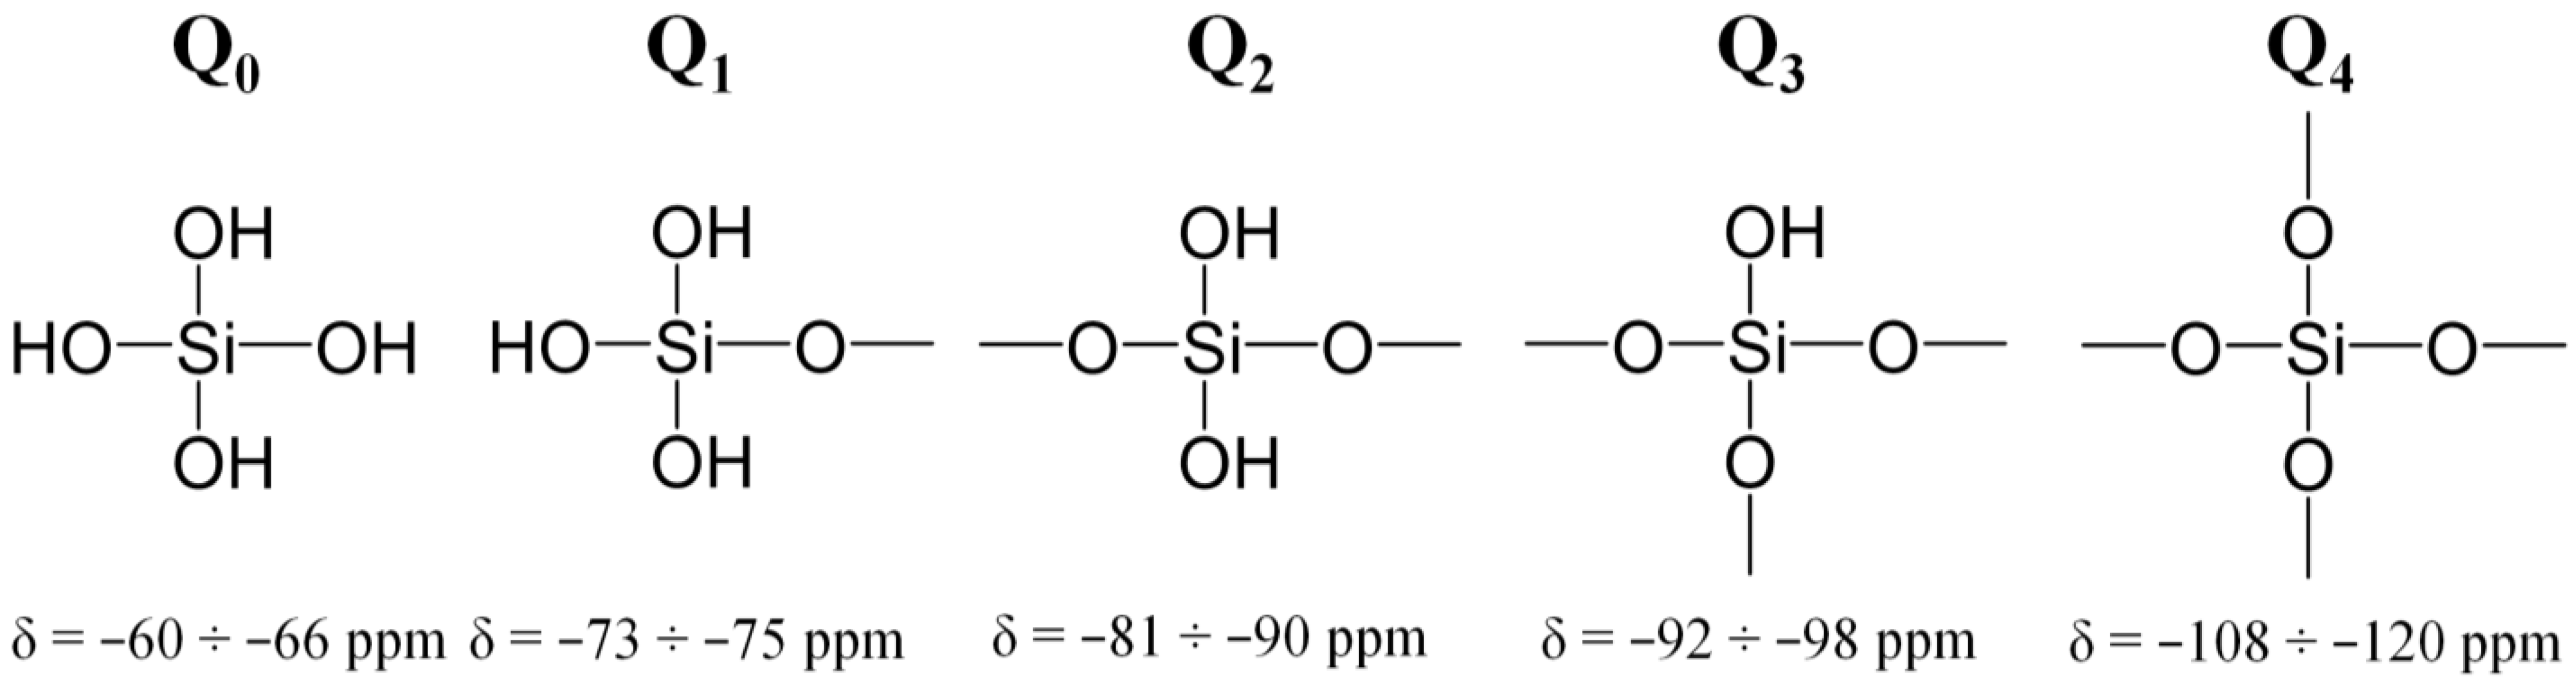
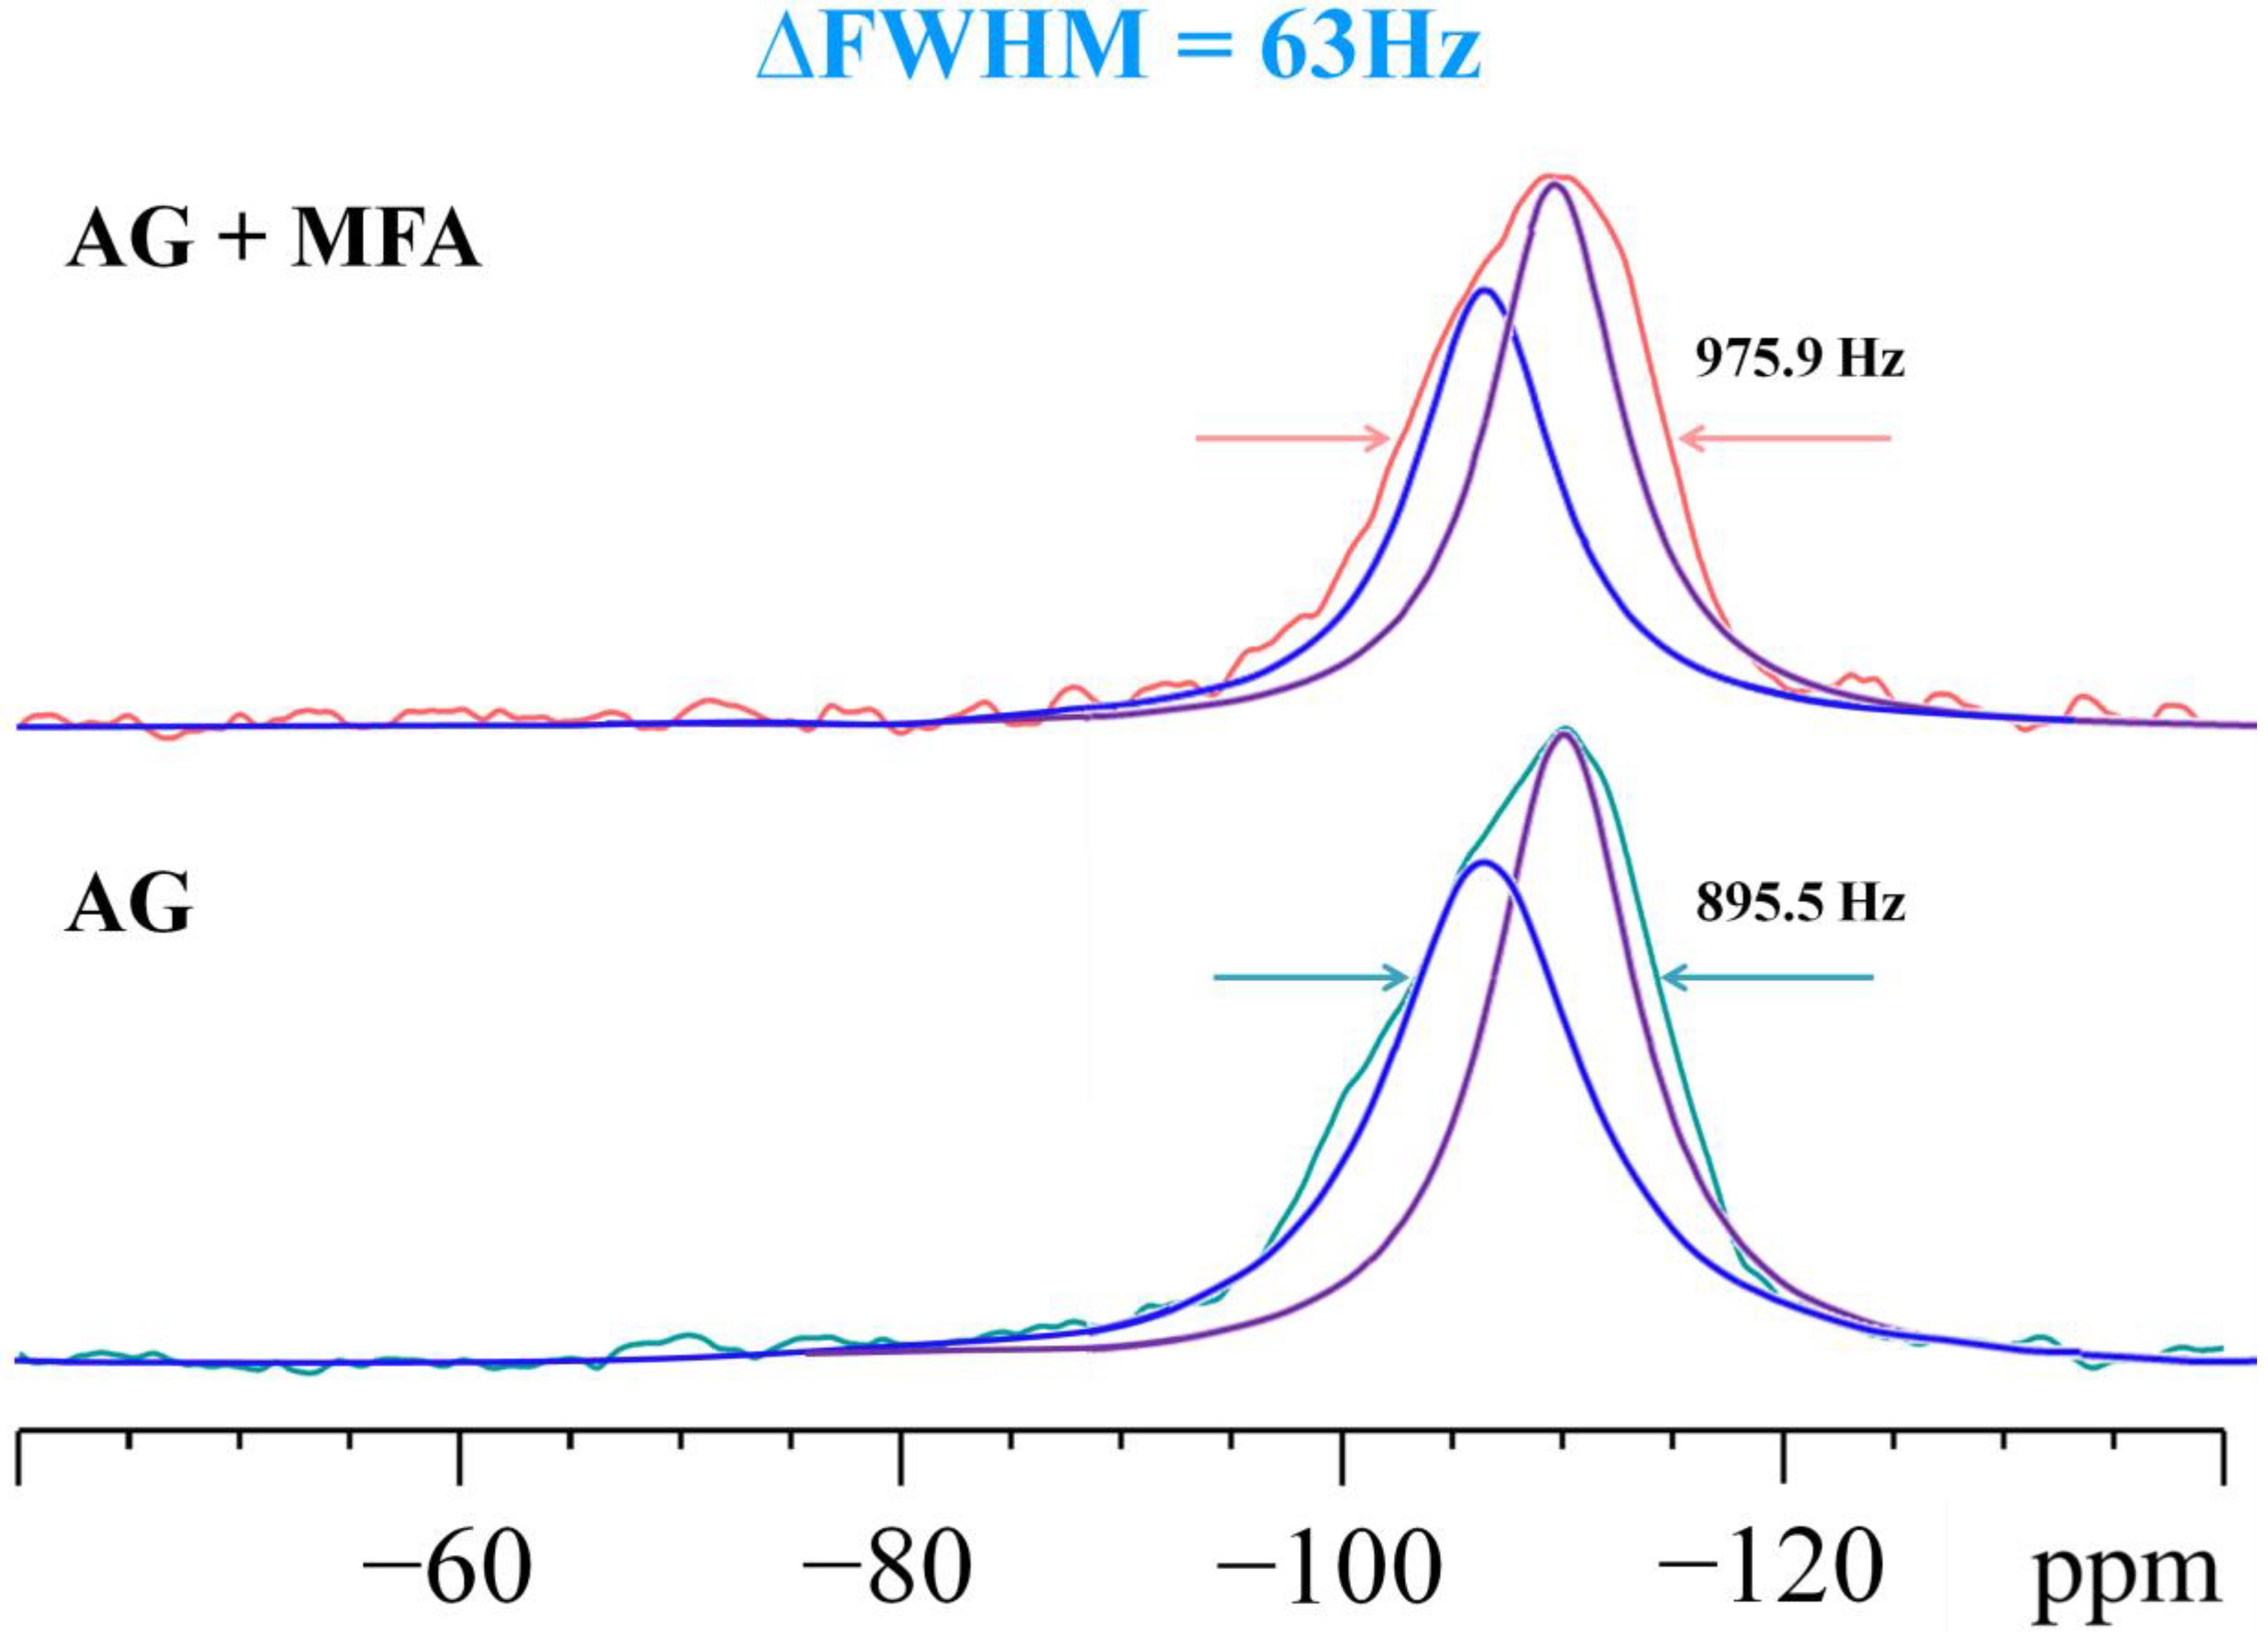
2.1. Solid State MAS NMR Analysis of Aerogel Composite Material

The density, Brunauer, Emmett and Teller theory (BET) surface area, porosity, and pore size of commercial aerogel, as summarized in the literature [22,23,24], agree with the values obtained for our samples. Silica aerogel (based on silica precursors with four oxygen neighbors per Si atom) are brittle materials with densities between 0.203 and 0.205 g/cm3 and surface areas between 593 and 602 m2/g. Pure aerogel has a typical blue tint due to Rayleigh scattering from the mesopores of the silica aerogel. When a porous matrix is impregnated with mefenamic acid, the aerogel changes color to dark yellow, which is caused by a change in mesoporosity (see Figure S2) [25,26].
The 1H and 13C MAS spectra of aerogels confirmed the structure and provided further insight into silica chemistry. The 1H MAS NMR spectrum showed that the signal belonging to the hydrogen atoms of the methyl groups was located at lower frequencies (1.24 ppm) than the signal of the hydrogen atoms of the CH2 groups (4.00 ppm). They confirmed the presence of a minor fraction of ethoxy ≡Si(Q3)–O–CH2–CH3 groups for the TEOS samples, as reported in the literature [24,27]. No non-precursor signals were found, indicating the high quality of the aerogel. While the presence of mefenamic acid is not clearly evident from the reported 1H NMR spectra (Figure S5), we believe that the signals at ca. 7 ppm and ca. 4 ppm (marked green in Figure 1) stem from mefenamic acid [28]. The presence of mefenamic acid is not evident from the reported 1H NMR spectra. The color change shown in Figure S2 is a more clear indication of the acid adsorption and its interaction with the surface silanol groups [29]. It should be noted that detecting minor amounts of mefenamic acid is difficult with NMR because mefenamic groups are characterized by broad 1H NMR lines that shift depending on the strength of the intermolecular bonding. The 29Si NMR signal analysis can indirectly estimate the mefenamic acid content.
There are five types of Si(O1/2)4 tetrahedral units (denoted Q0, Q1, Q2, Q3, and Q4) that can be observed on the 29Si NMR spectrum [30,31]. The four different stereochemical units of silicon atoms are the Q0 tetrahedron, which has no external connections and is more reactive; the Q1 tetrahedron, which has one external connection and is less reactive than the Q0; the Q2 middle group, which has two external connections; the Q3 branching site, which has three external connections; and the Q4 cross-linked site, which has four external connections and is the least reactive (see Figure 2) [32,33]. The chemical shifts of the Si atoms in the different units vary due to the different types of chemical environments around the Si atoms and cover the overall range of ca. 60 ppm. Q0 has the highest chemical shift of −60 to −66 ppm, while Q4 has the lowest chemical shift of −108 to 120 ppm [34]. Meanwhile, the Q1, Q2, and Q3 units have chemical shifts ranging from −73 to −75 ppm, −81 to −90 ppm, and −92 to −98 ppm, respectively [35].
The 29Si MAS NMR spectra of clean, undoped aerogel (see Figure 3) showed the presence of an intense, asymmetrical signal at −108.8 ppm, which can be attributed to Q4 cross-linked site [36] silicon atoms forming the aerogel lattice. In the 29Si MAS NMR spectra of the aerogel doped with mefenamic acid (see Figure 3), the signal position remained practically unchanged. At the same time, the width increased from ca. 900 Hz (11.3 ppm) to ca. 976 Hz (12.3 ppm). We attempted to observe the change in the coordination states of silica by deconvoluting the signal and analyzing the relative intensities of Qn, which signify the states of Si(On) [22,27,37,38]. To obtain this data, we employed the pseudo-Voigt profile approximation to deconvolute the signal lines, with 100% of the Lorentz contribution to the signal shape (see Figure 3).
The profiles of the spectral line approximation by the pseudo-Voigt function showed two pronounced contributions, which, based on the values of chemical shifts, can be attributed to Q3 (ac. 100 ppm) and Q4 (ac. 110 ppm) [39]. The ratio of Q4 to Q3 increased from 1.91 for the clean sample to 2.80 for the doped form of AG, suggesting a more cross-linked and, consequently, denser structure with fewer unreacted groups [40]. This is in agreement with the literature data on silylation, which indicates that the increase in the Q4/Q3 ratio is due to the replacement of the polar and hydrophilic SiOH groups by CH3 fragments [41], reducing the number of Q3 sites and resulting in a higher Q4/Q3 ratio [42,43]. The numerical values of Q4/Q3 should be taken with a grain of salt, considering the limited quality of the fit. An alternative interpretation of the 29Si NMR test result suggests that the interaction between mefenamic acid and aerogel is not limited to electrostatic forces and involves covalent electron pairs and strong π–π bonds [44]. This could explain the observed signal width and reduced relaxation time [45], which could be attributed to the paramagnetic inclusions in the nearest environment of the aerogel [46,47]. Further research is needed to accurately characterize the effects of these interactions [48,49].

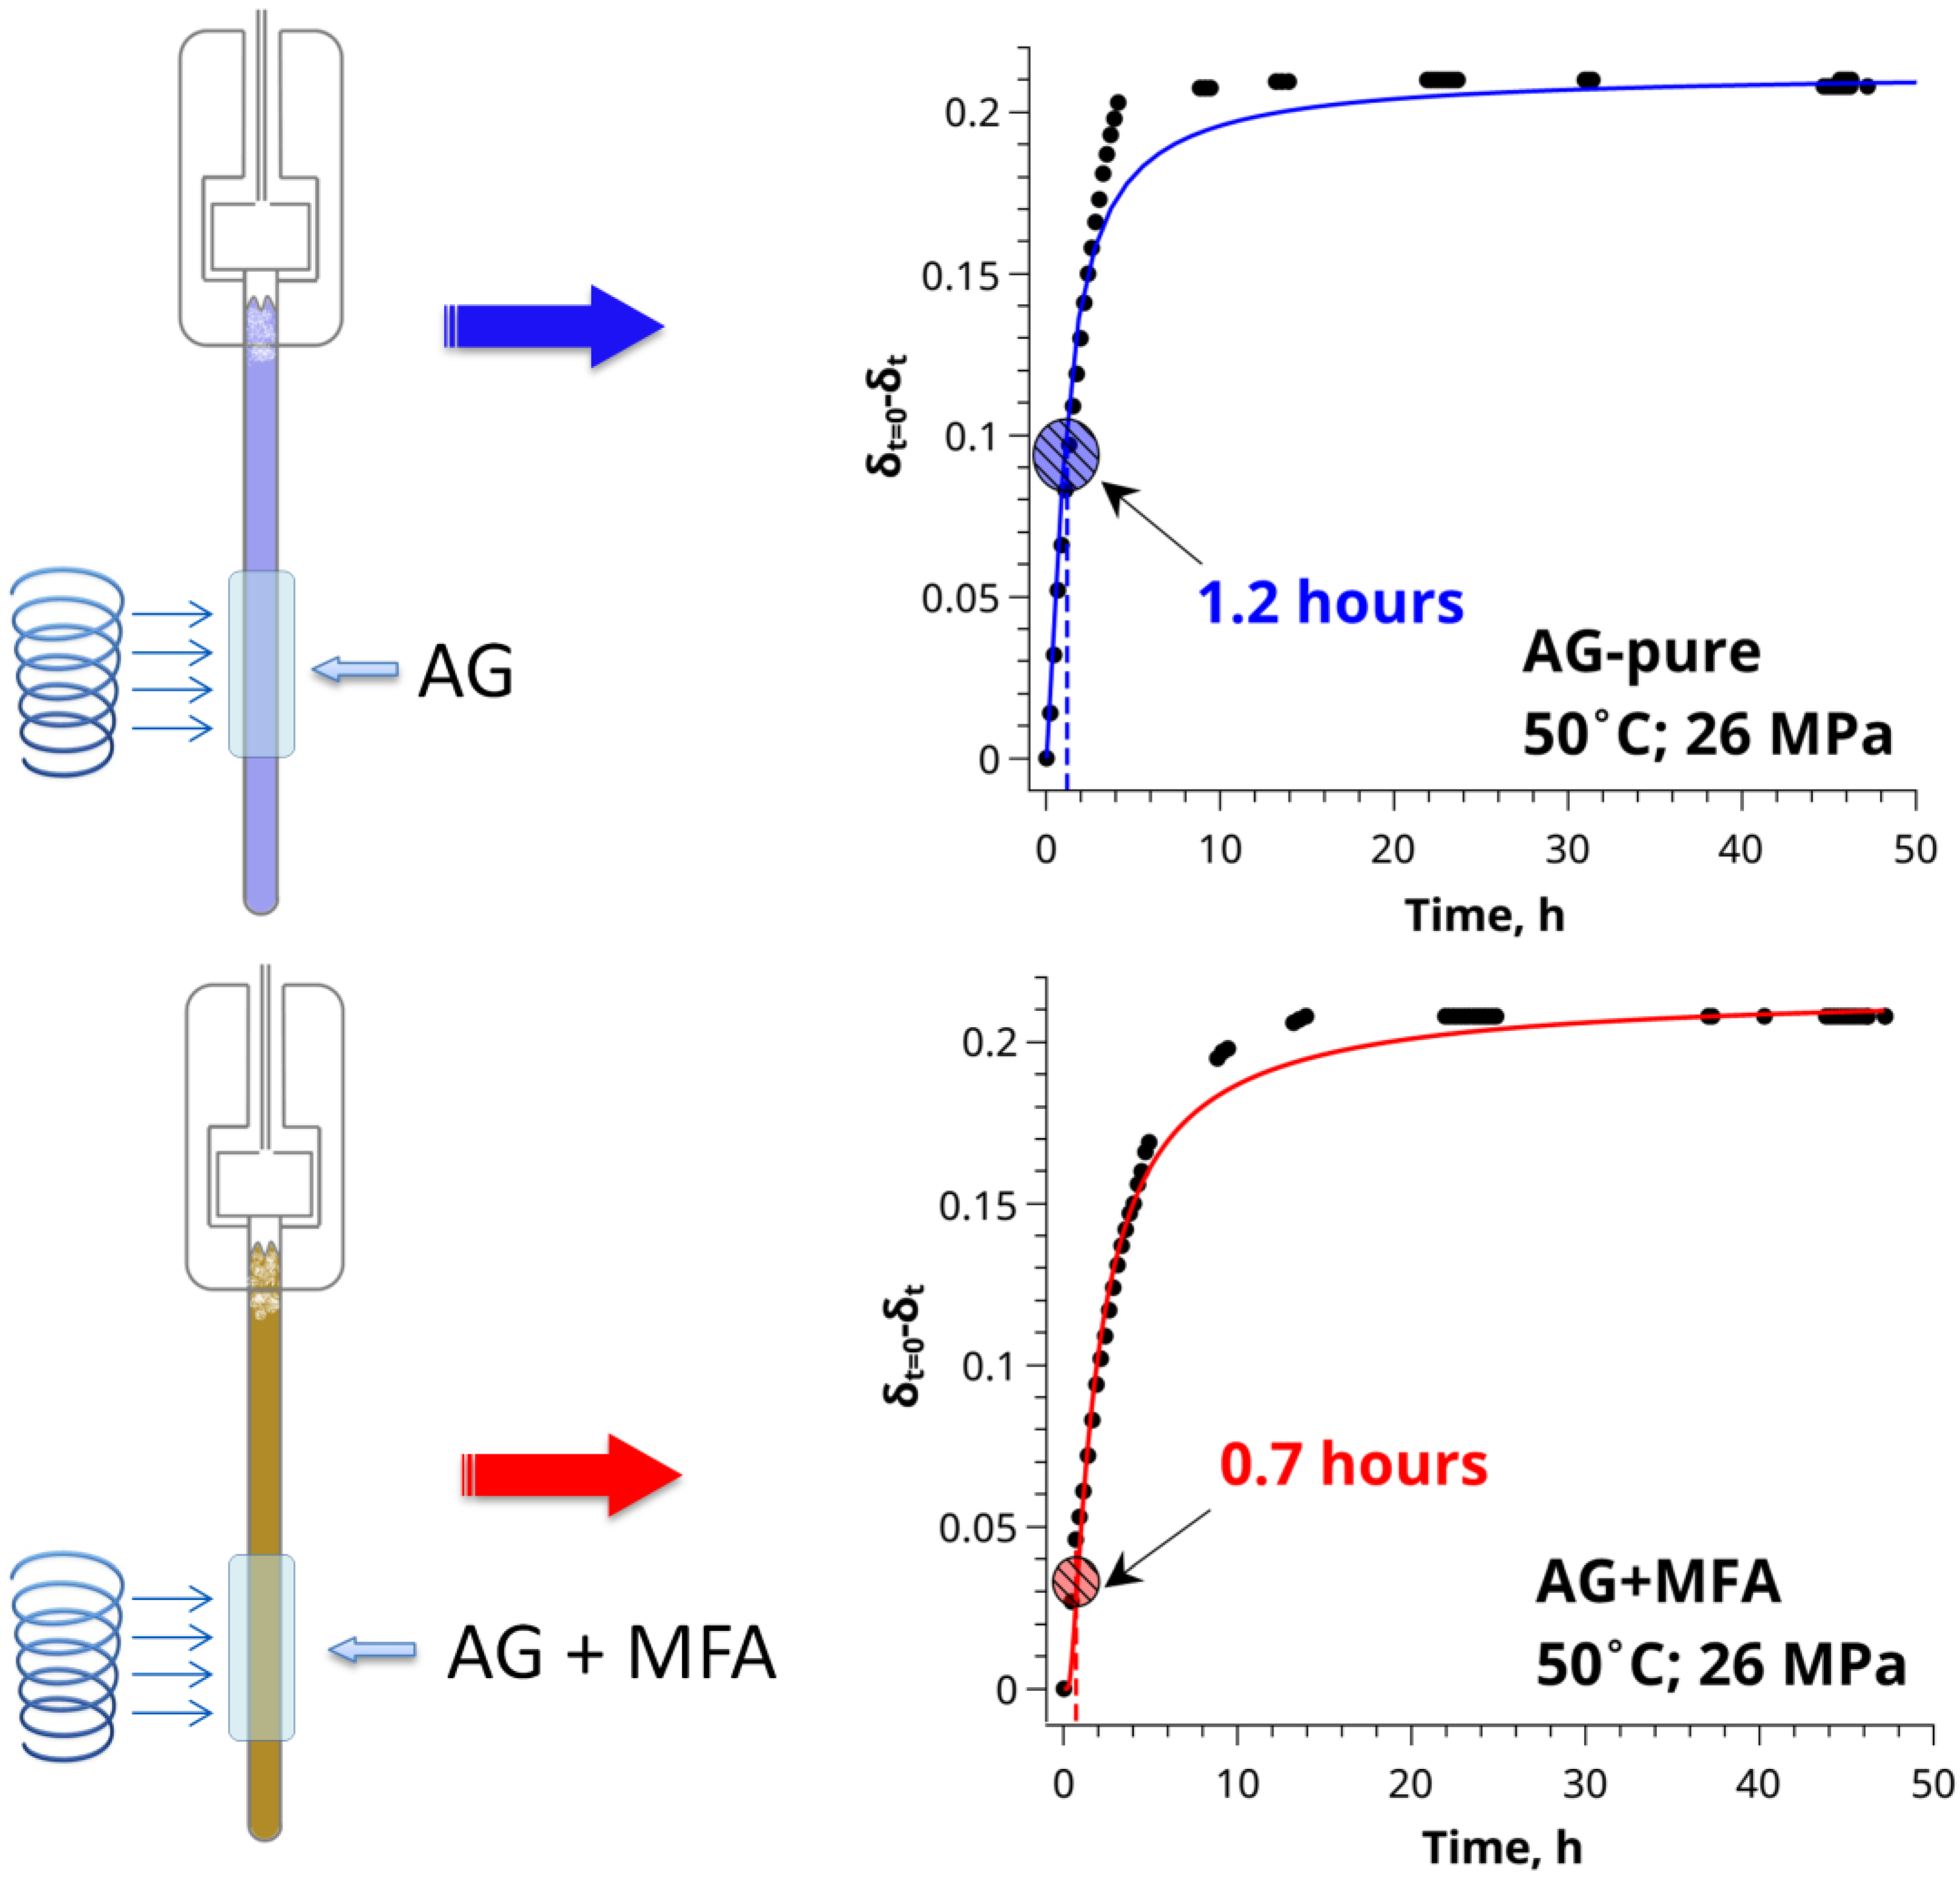
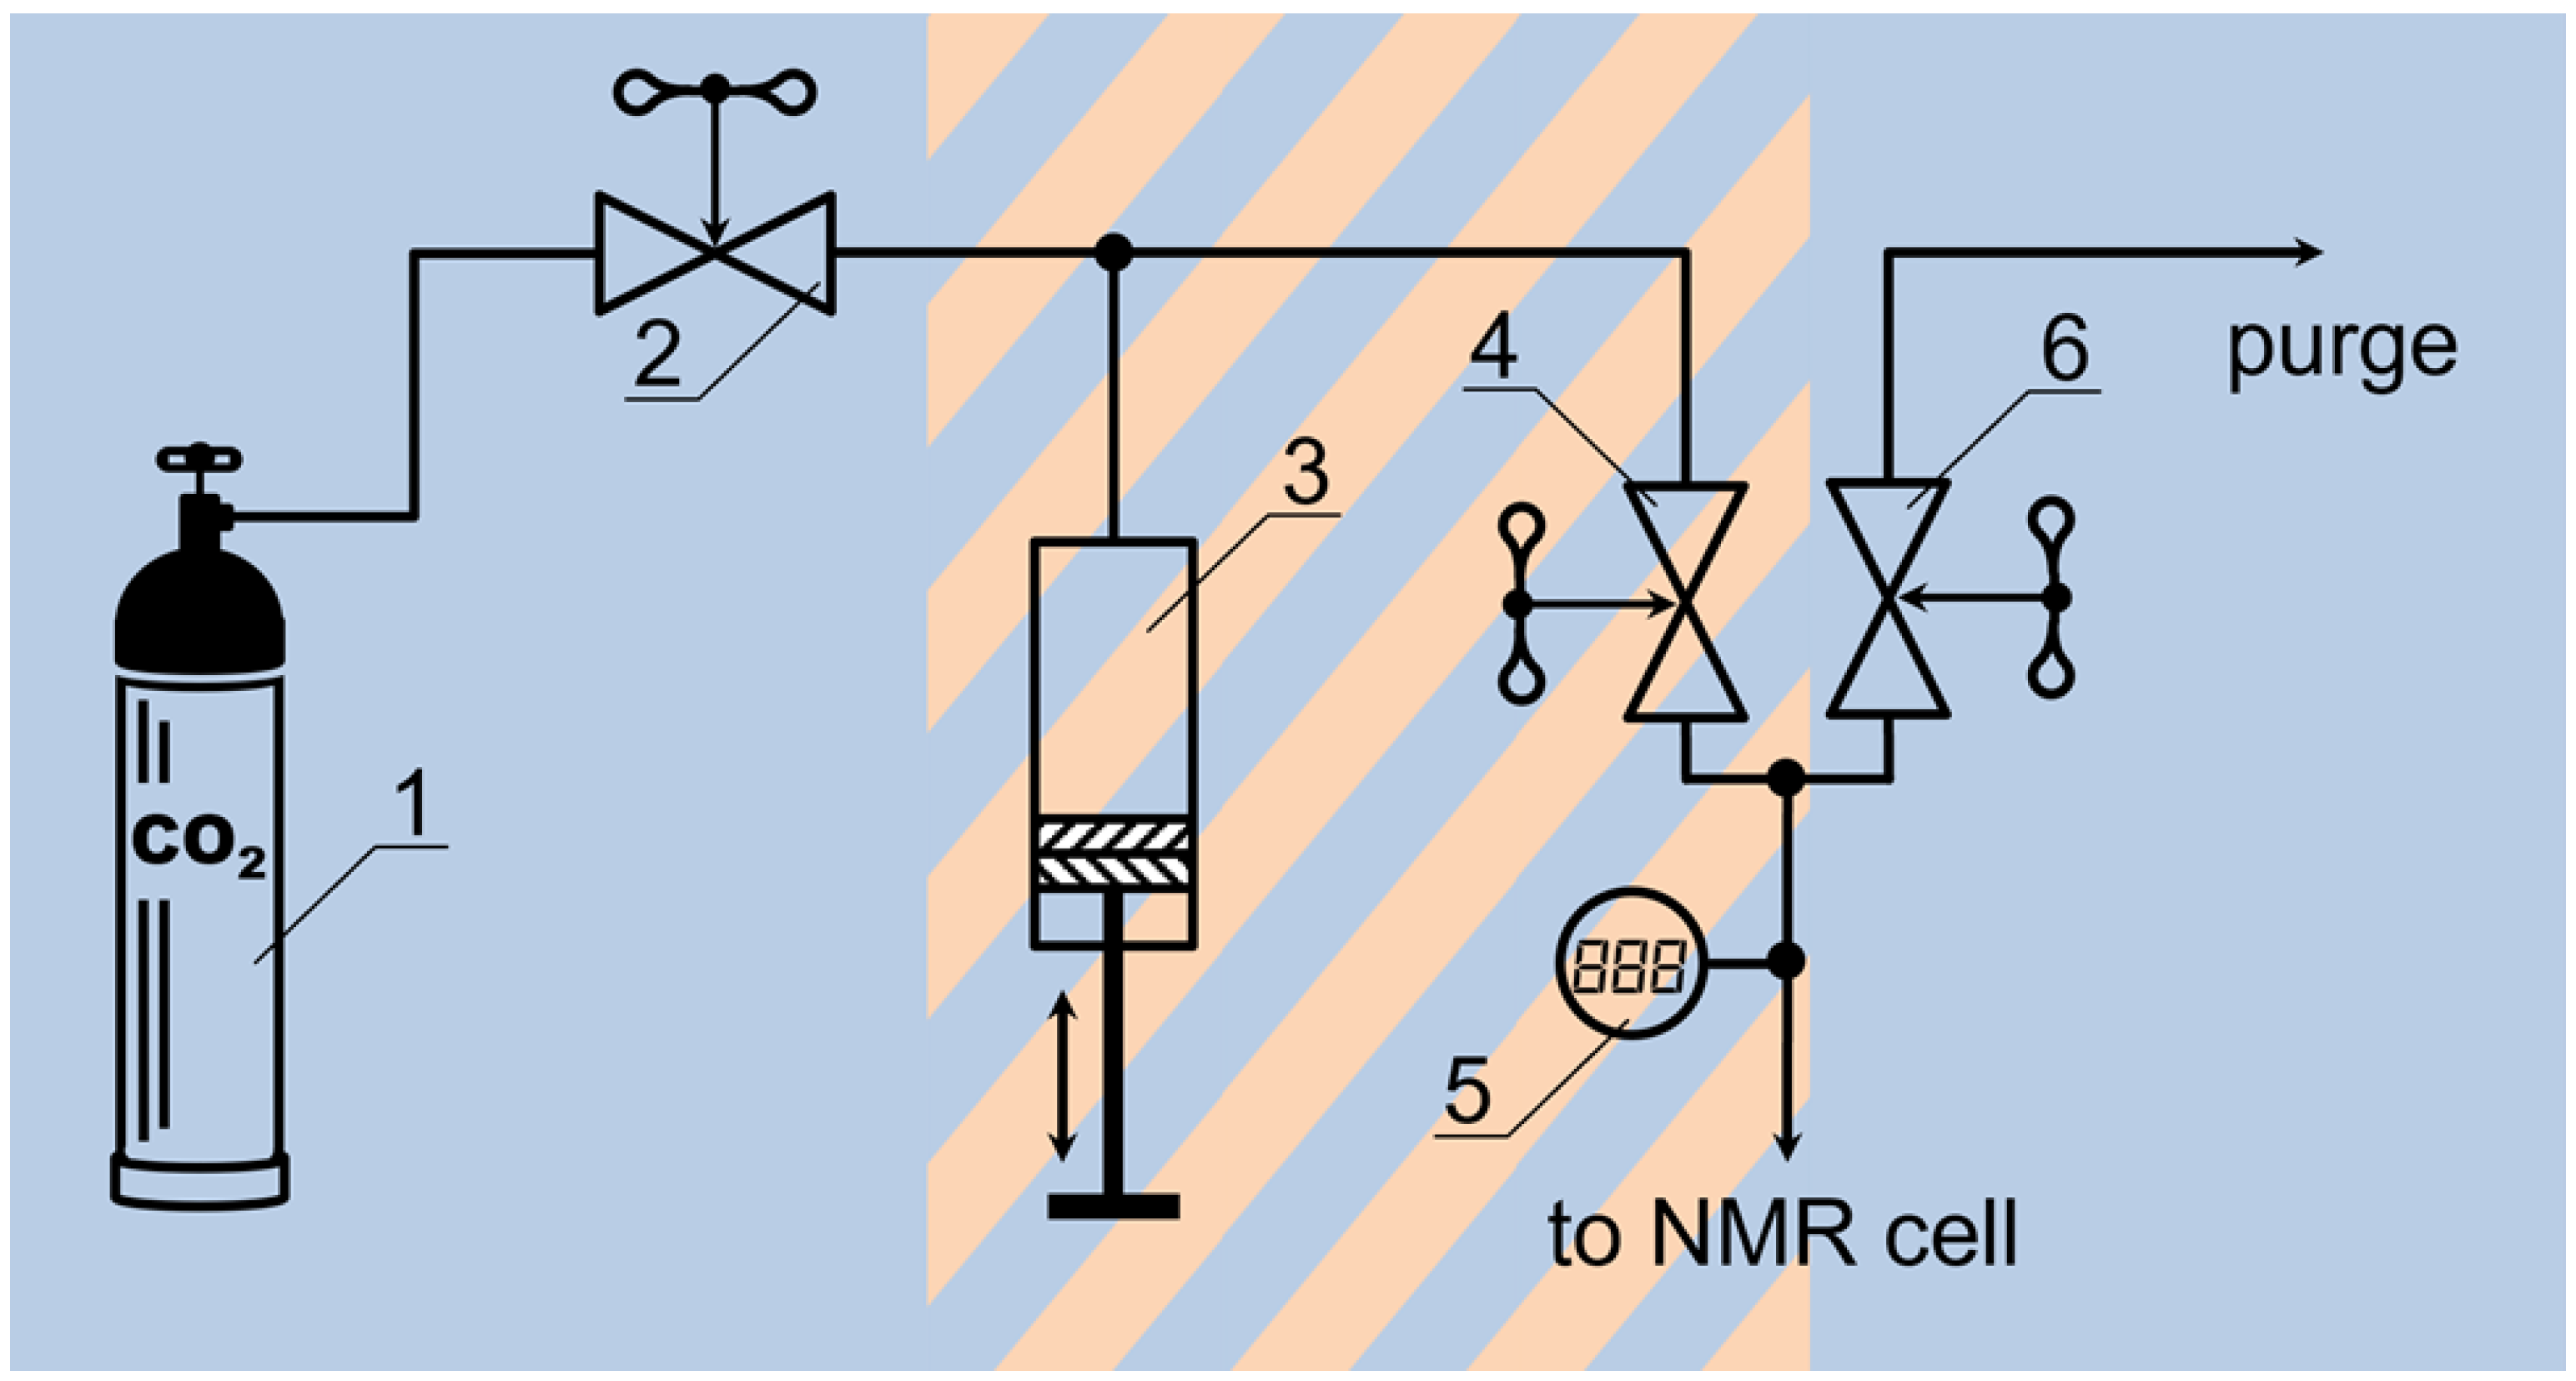
2.2. High-Pressure 13C NMR Kinetic Study of CO2 Sorption

To identify mefenamic acid in aerogels and understand the doped material physicochemical properties, high-pressure 13C NMR experiments were conducted in the aerogel confinement. The 13C chemical shift values were obtained and it was found that the observed signals belonged to scCO2 carbon atoms. The characteristic kinetic time of scCO2 sorption by aerogel was 50 h, where 45 experiments were recorded for both the original aerogel and the one doped with mefenamic acid. The choice of 13C NMR as the method for measuring kinetics was due to the rates of CO2 sorption being sufficiently high for this parameter. Since the reaction of CO2 with the immobilized surface groups is reversible and exothermic, higher temperatures are usually used to take advantage of this. We exploited the fact that that the amount of adsorbed CO2 decreases with increasing temperature to reduce the reaction rate and maintain the amount of adsorbed CO2 [50,51,52,53]. Anas et al. observed this effect in their study where some aerogels showed significantly higher CO2 adsorption capacities at high pressures [54,55]. Therefore, at elevated temperatures and pressures, 13C NMR can be used to compare the sorption characteristics of pure aerogel and aerogel doped by mefenamic acid. According to the literature data [56], 26 MPa and 50 °C correspond to the slowest kinetics, allowing for the comparison of the materials with the 13C NMR approach. The signals in the 13C scCO2 NMR spectra were approximated by the Lorentz functions. By analyzing the obtained spectral NMR data, it was possible to identify the characteristic changes in the magnitude of the chemical shift of the observed NMR signal that was used to plot the kinetic curves of the original aerogel (see Figure 4 (blue)) and the one doped with mefenamic acid (see Figure 4 (red)). The kinetic curves were approximated using a single exponential model (Equation (1)), which was previously successfully used for the study of scCO2 sorption onto poly(methyl methacrylate) (PMMA) [57].
δ t = δ 0 + δ exp ( k t )
where δt is the value of the chemical shift of the CO2 signal at time t, δ0 is the value of the chemical shift at the saturation point, k is the kinetic rate constant, and δ is the multiplier corresponding to the difference between the value of the initial value δt = 0 (at time t = 0) and δ0.
The application of the proposed mathematical model allowed us to calculate the corresponding correlation times of the process, tc = 1/k, which were 1.2 and 0.7 h for systems with the original and doped aerogel, respectively. These results indicate that the rate of CO2 sorption into mefenamic acid with aerogel is 1.7 times slower than the initial rate, likely because some of the aerogel pore surface vacancies are occupied by mefenamic acid, which serves as a limitation to the sorption process. Overall, 13C NMR spectroscopy is a suitable method for studying the kinetics of CO2 sorption, since it provides direct insight into the chemical environment of the surface groups and can be used to identify the species involved in the reaction. In addition, it can be used to quantify the amount of CO2 adsorbed and the rates of CO2 uptake. These data provide reliable evidence of the influence of a mefenamic acid small amount on the sorption characteristics of the aerogel composite material, so subsequent experiments were conducted based on the relaxation characteristics by T1–T2 RRCOSY of the sorption process to estimate the relative amount of mefenamic acid in the aerogel pores. This technique was previously tested on PMMA and demonstrated to be an effective method for determining the sorption characteristics of highly porous materials in a scCO2 medium [57].

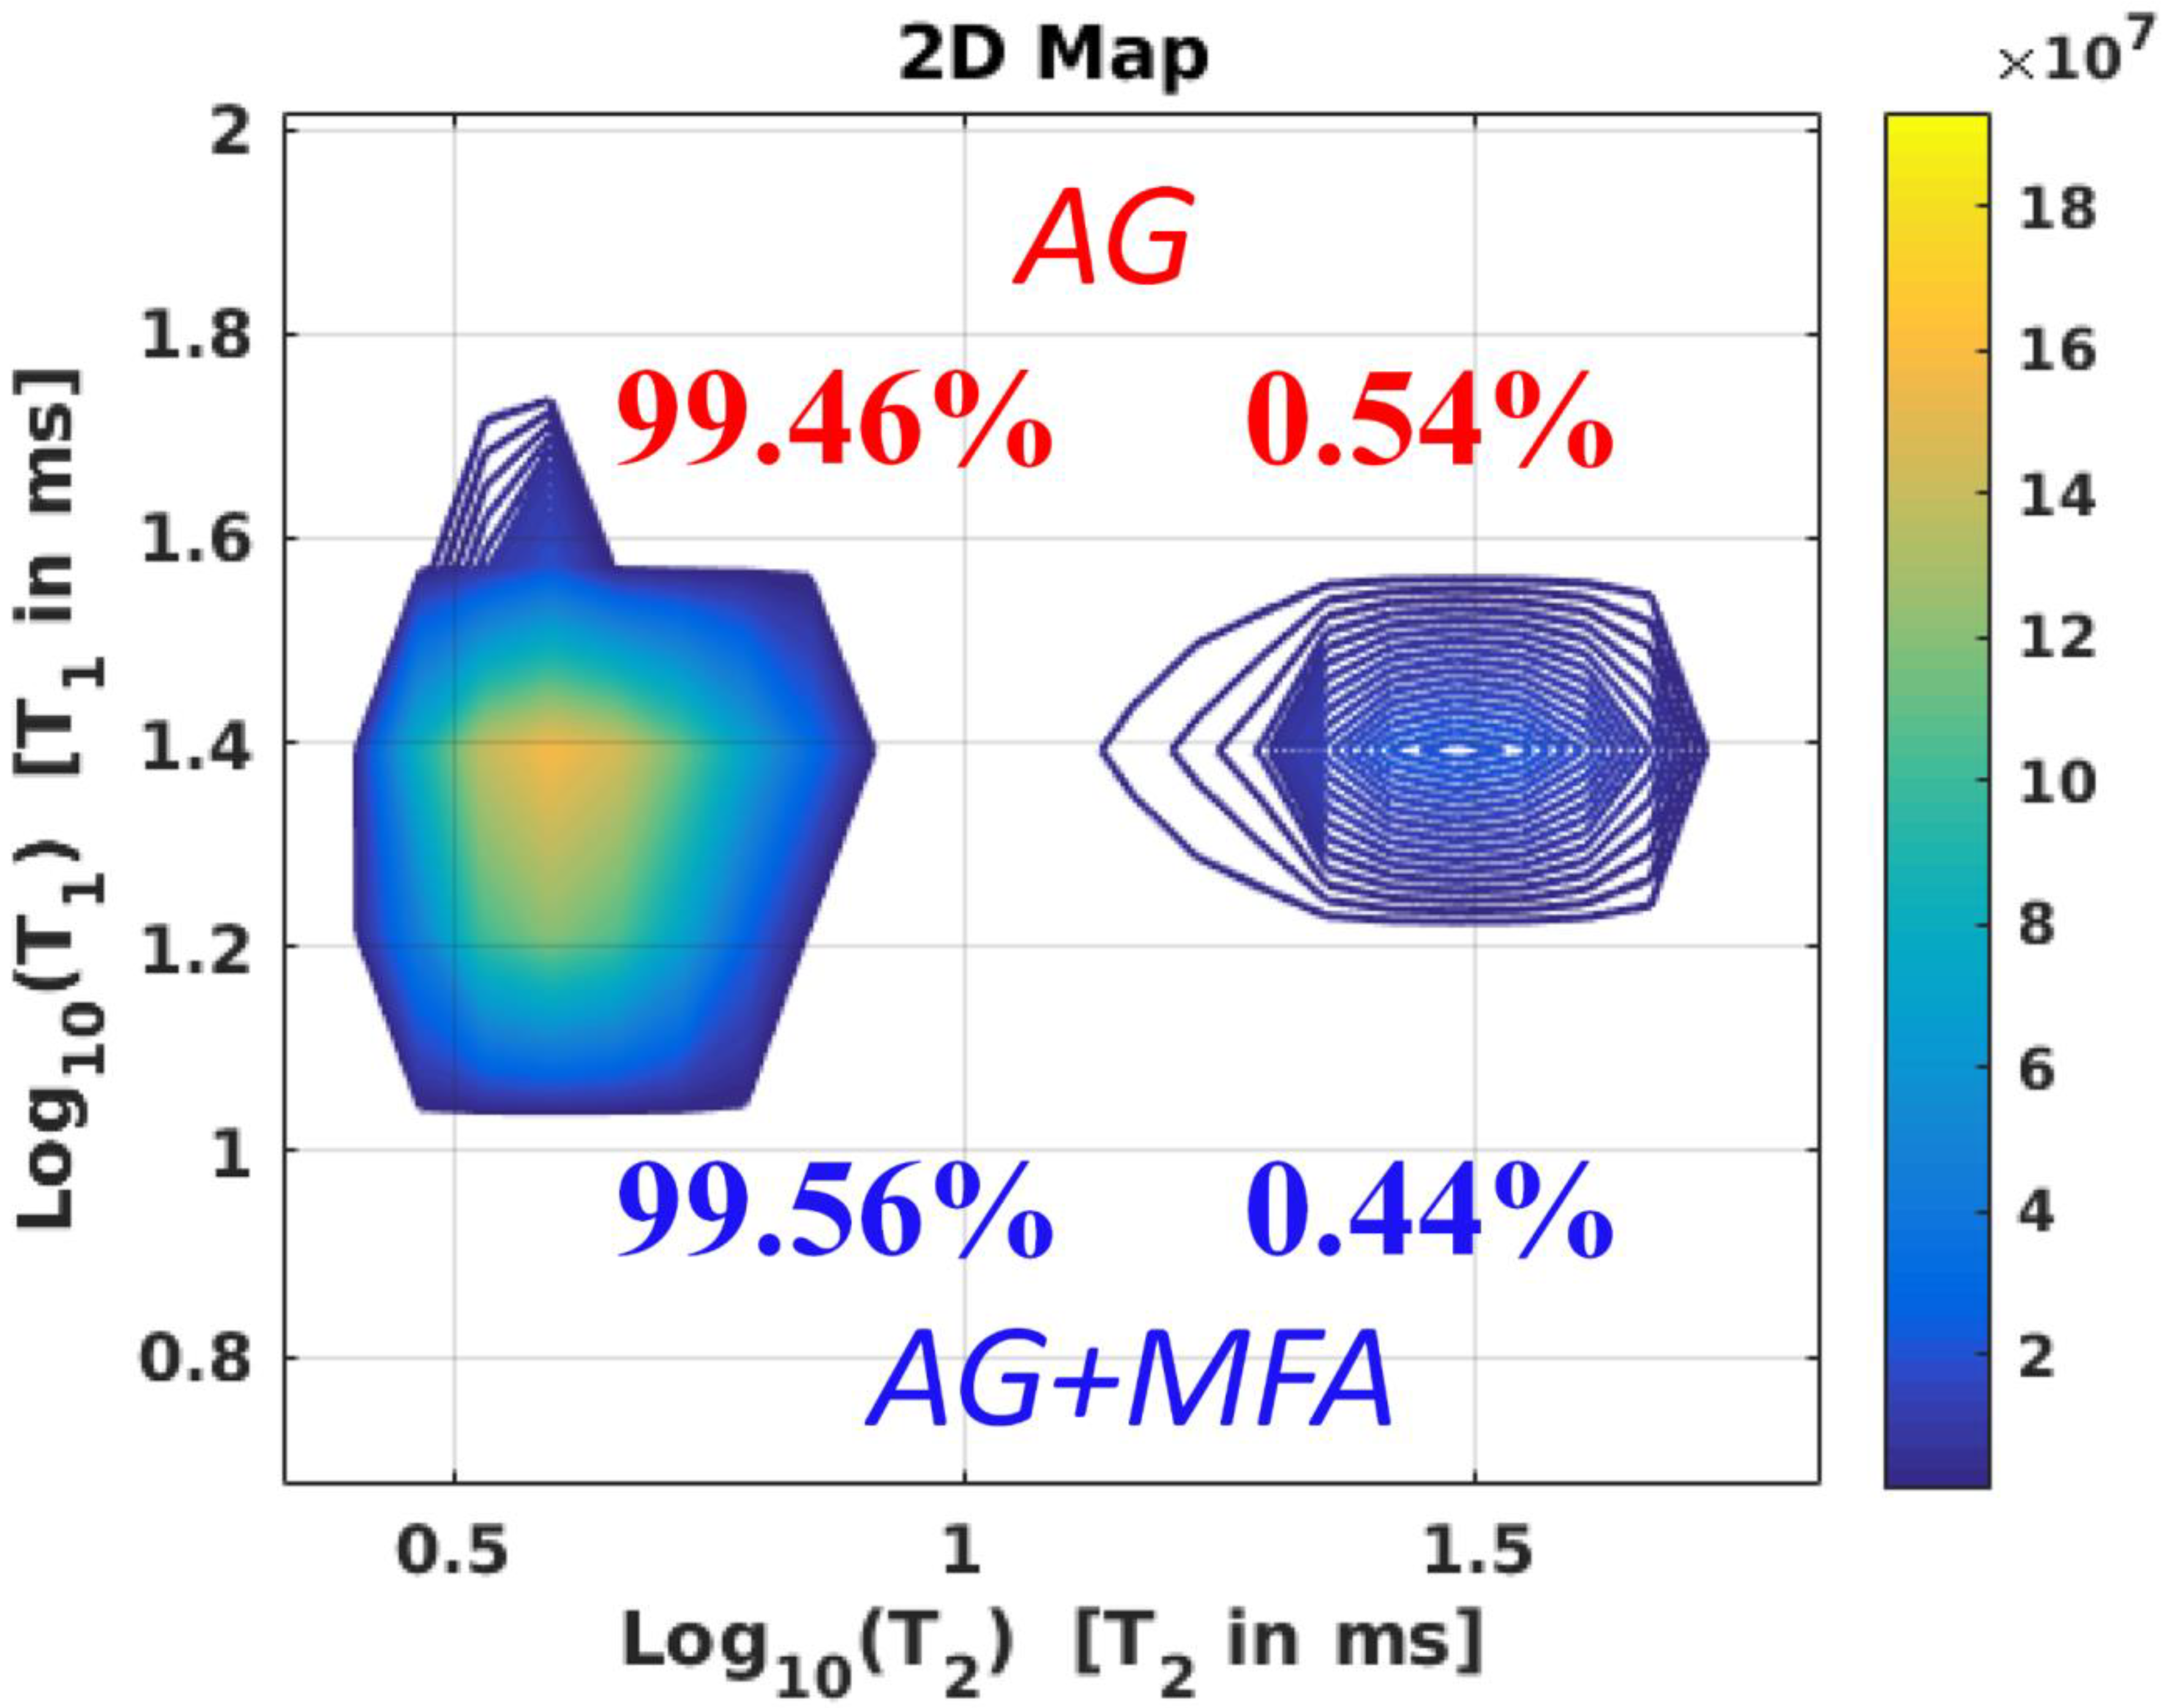
2.3. A High-Pressure T1–T2 RRCOSY Study

Relaxation–relaxation correlation spectroscopy (RRCOSY) correlates T1 with T2, offering another method to investigate the pore space in porous media. The RRCOSY technique enables the observation of correlations between T1–T2 relaxation times through a two-dimensional inversion of the Laplace transform [58]. In RRCOSY, a pair of unique series pulses is used to obtain the 2D relaxation maps of the aerogels samples. Saturation-recovery sequence for the T1 and CPMG for the T2 relaxation times was used, which was then processed by the two-dimensional inverse Laplace transform (2D-ILT) code created by Venkataraman and co-authors [59]. This technique has been applied to investigate the diffusion process in porous media, for example, in brine-saturated rock [60] and hydrating cement pastes [61,62]. By correlating T1 with T2, it is possible to calculate the T1/T2 ratio, which provides insight into the rotational mobility of a molecule and molecular state exchange within a porous system [63]. The intensity of each cross-peak in this spectrum measures the cross-correlation between the T1 and T2 relaxation times [64]. By analyzing the cross-peak intensities, it is possible to infer the molecular structure of the sample as well as its dynamical properties.
The data obtained from RRCOSY spectra represent populations of specific amplitudes, which are generated due to the various physical regions of mobility of CO2 in the material and form different sites. Figure 5 shows two sites on the graph, and two T2 values identified but only one T1 value can be observed.
The results of the 2D RRCOSY experiment display two prominent peaks: one is situated at the most extended values of T1 and T2. At the same time, the second is an exchange peak located at the extended values of T1 and short T2. The exchange process averages T1 relaxation processes, making it challenging to isolate internal T1 values; hence, only one T1 value is observed. Nevertheless, internal T2 values can still be obtained using direct data analysis. One of the populations, which appears as a non-diagonal peak, is located within the parity line T1 = T2, where data representing sites of free solvent scCO2 may be found. According to the literature, the farther the population is from the parity line, the more limited the rotational mobility of molecules is [57,60]. The closer the sites are to the parity line, the freer the rotational mobility. Therefore, there are two specific sites in pure and composite aerogel containing mefenamic acid—these sites are physically responsible for binding free CO2 molecules and are impregnated into the aerogel pores. Numerical integration of these sites results in a slight increase in the concentration of CO2 in the aerogel pores, as expected, compared to the free ones. The integral intensities of the 2D RRCOSY spectra for pure and composite aerogels containing mefenamic acid were compared, showing slight differences in the integral intensities of the signals. The normalized integral intensity values for pure aerogel ranged from 0.54% to 99.46%, while the integral intensity values for composite aerogel containing mefenamic acid ranged from 0.44% to 99.56%. This indicates differences in the chemical environment of the two aerogels, likely due to mefenamic acid in the composite aerogel. These additional results suggest that the presence of mefenamic acid affects the chemical environment of the aerogel, which is reflected by the slight changes in the integral intensities of the 2D RRCOSY spectra.

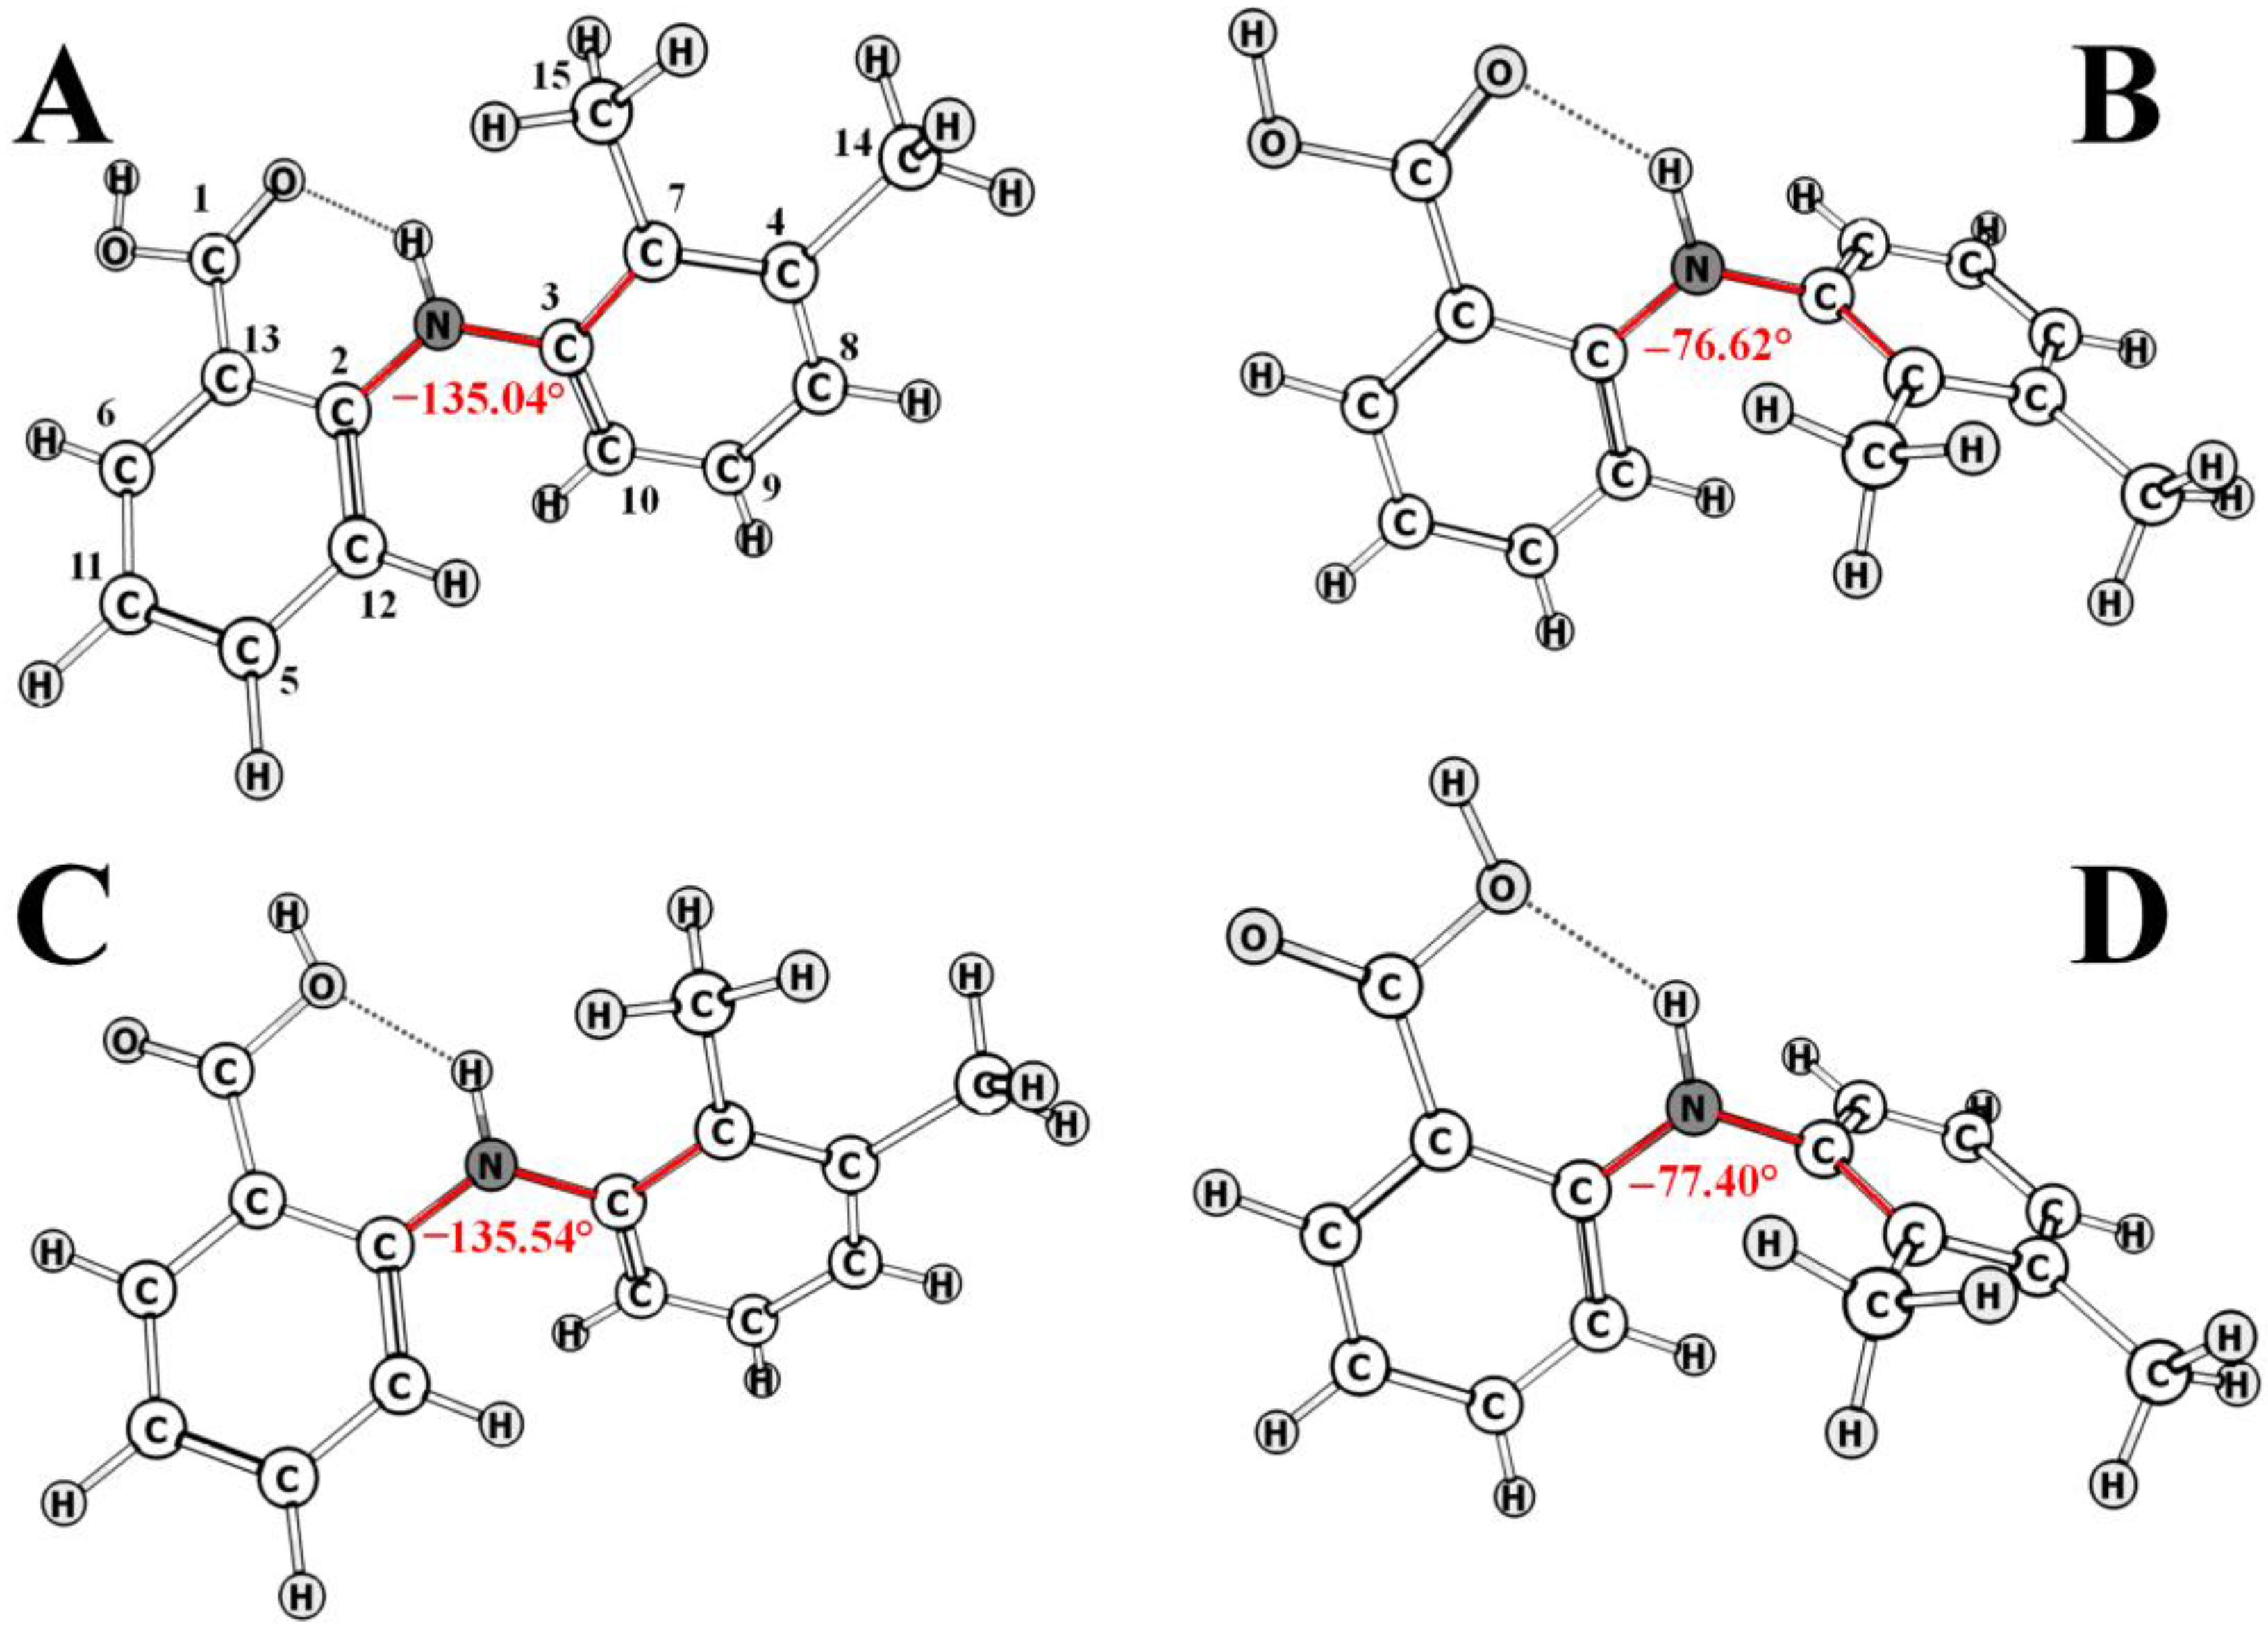
2.4. High-Pressure NOESY Study of the Conformational Preference of Mefenamic Acid Release

One of the critical aspects of this research is investigating how a small dosage of mefenamic acid in an aerogel can influence the conformational equilibrium upon release. This inquiry is significant when constructing drug delivery systems. By understanding how the drug responds to different environmental conditions, researchers can tailor the aerogel to deliver the drug effectively. Additionally, these data can be used to develop a model that predicts the conformational behavior of the drug in different scenarios. This model can then be used to optimize existing drug delivery systems and design new ones.
The determination of interproton distances from NOE data, which we have previously discussed, is based on comparing relative NOE intensities for pairs of nuclei in NOESY experiments [65,66,67]. Suppose we assume that the sample being studied is in the extreme narrowing regime and that the initial rate approximation [68] is valid. In that case, the normalized NOE intensity between two nuclei I and S, ηIS, is proportional to the experimental cross-relaxation rate, σIS, between them and the mixing time, τm, of the experiment (Equation (2)).
Furthermore, the cross-relaxation rate, σIS, between spins I and S is proportional to the internuclear distance between them (rIS−6), as demonstrated by Equation (3). This technique can be used to determine the interproton distances of small molecules. For further details, refer to the provided references [69,70,71,72,73,74].
η I S = σ I S τ m
σ I S ~ r I S 6
Assuming that the values of ω (Larmor frequency), τc (rotational correlation time), and γ (magnetogyric ratio) remain constant for each nuclear pair in a given 2D NMR experiment, the ratio of intensities of a pair of NOE signals, ηI(1)S(1):ηI(2)S(2), can be proportional to the ratio of their internuclear distances (Equation (4)) for isotropic intramolecular motion. As such, by comparing ηI(1)S(1) and ηI(2)S(2) within the same 2D NOESY experiment [75,76], we only need to know the reference distance of one of the nuclear pairs, depending on the conformer, e.g., rI(1)S(1), in order to calculate the experimental distance of the other, rI(2)S(2).
η I 1 S ( 1 ) η I 2 S ( 2 ) = r I 1 S ( 1 ) r I 2 S ( 2 ) 6
Determining internuclear distances becomes more challenging when analyzing a flexible molecular system with multiple conformations. A general approach to the treatment of small molecules using NOE experiments for both conformational and population analysis is outlined in the reference [71]. The main idea is that, in a narrow approximation, we can identify groups of conformers that may be realized by quantum chemical calculations based on the values of distances as the main criterion. Each distance is proportional to the cross-relaxation rate, and the experimentally observed rate is a weighted average of all possible conformers (Equation (5)).
σ = i σ i x i
For example, in the case of mefenamic, when analyzing the mobility of benzene rings and the internuclear distance responsible for it, we are dealing with two groups of conformers, A + B and C + D, as described in our previous work [77]. The results of quantum chemical calculations are provided in detail in the literature. The range of MFA conformers (A, B, C, and D) is attributed to the alteration in the values of the C2-N(H)-C3-C7 angle from −135° (A and C) to −77° (B and D) (Figure 6). As demonstrated in [78], these conformers are present in various polymorphic forms of MFA. By comparing the relaxation rates of the two groups, we can determine the relative populations of each conformer. Additionally, suppose the experimentally observed rates differ significantly from the theoretically calculated ones. In that case, other conformers likely exist, and the molecule structure should be further analyzed.
For the accurate calculation of the cross-relaxation rate of each conformer, it is essential to accurately average the intermolecular lability within the groups under consideration for which the distance is determined. Previously, the Tropp model was the most effective in considering intramolecular mobility. As discussed in our paper, we have suggested a semi-empirical coefficient for spherical harmonics [79]. Using this method [80], we can accurately calculate the average cross-relaxation rate of all conformers in a system.
Sternberg and Witter [81] showed that using an incorrect averaging model could lead to misinterpretations of NOESY data, thus hampering the accurate evaluation of the conformational preferences of small molecules. This finding warns against the indiscriminate application of averaging models in NOESY data interpretation and suggests that more sophisticated models should be employed.
On the one hand, in the framework of this study, it was interesting to observe how the release of mefenamic acid from aerogel could affect its conformational preferences in CO2 bulk solution by NOESY. The accurate determination of the populations of API molecules has always been limited by the low concentration of API in CO2 and the low accuracy of the 2D NOESY-derived restraints used, thus making it impossible to determine conformer populations that fit the observed 2D NOESY sensitivity.
On the other hand, with the high accuracy provided by the NOESY distance analysis, we have recently identified and quantified a previously unrecognized conformer of fenamates by measuring NOESY-derived interproton distances across the phenyl ring of fenamates in CO2 with 2% DMSO [77]. This interring distance was observed to be ~3.3 Å for mefenamic and tolfenamic acids and ~3.9 Å for flufenamic acid under the same condition. This ratio of conformers relative to the interring distance is 70:30 for mefenamic acid, and 20:80 for flufenamic acid, respectively [82,83]. This difference in distances was attributed to the conformational lability of flufenamic acid due to the influence of the methyl group [84]. We sought to investigate the conformer populations of mefenamic acid where the intensities of conformational exchange cause its release from aerogel and, hence, any difference in conformational preference for this API.
Within the scope of this work, 2D NOESY spectra of mefenamic acid were recorded in the presence of a doped aerogel (see Figure S3). To achieve this, aerogel samples and mefenamic acid dissolved in DMSO-d6 were introduced into a high-pressure NMR cell. Then, CO2 was supplied to the cell and spectra were recorded at 45 °C and 9 MPa. The data interpretation was based on previously obtained results in [77] and Figure S4. The selection of the state parameters was based on the solubility of DMSO-d6 in scCO2, analyzed according to the literature data [85].
As previously mentioned, the B3LYP/6-311 + G(2d,p) [77] conformational search of mefenamic acid unsurprisingly yielded two non-degenerate low-energy conformers, the phenyl lability conformation (Figure 7). Each of the conformers, A + B and C + D, differ only by the orientation of the phenyl group. In each case, the A + B conformer (characterized by inter-ring distances of H9/10-H11/12—3.12 Å) is one in which the methyl protons of the benzene ring are positioned on the same side of the carboxyl-substituted benzene ring as the carbonyl group. The C + D conformer (characterized by inter-ring distances of H9/10-H11/12—4.62 Å) is one in which the methyl protons of the benzene ring are positioned on the opposite side the carboxyl-substituted benzene ring to the carbonyl group.
When aerogel was added, the experimental values of cross-relaxation rates changed from σij (1.09 × 10⁻² s−1) and σ0 (3.75 × 10⁻² s−1) without aerogel to σij (0.63 × 10⁻² s−1) and σ0 (1.74 × 10⁻² s−1) with aerogel. The addition of aerogel significantly increased the cross-relaxation rates. This is because aerogel is a porous material that can increase the surface area available for the diffusion of molecules, allowing for a more efficient exchange of energy between molecules. H6–H11/12 was chosen as the reference distance, with a value of 2.76 Å (r0calc) for all conformers. This enabled us to estimate the distances and determine the proportions of conformers. The experimental value for the distance between H12 and H15 was 3.25 Å for mefenamic acid inside the aerogel matrix and 3.81 Å for bulk mefenamic acid. These changes in internuclear distances resulted in the alteration of the ratio of conformers from 22% to 78% in the presence of aerogel from 75% to 25% in its absence (Figure 7).
In conclusion, this study has demonstrated that the NOESY analysis of mefenamic acid can accurately determine both the relative populations and internuclear distances of the different conformers of mefenamic acid in CO2 solution. We found that adding aerogel to the solution causes a shift in the conformer populations of mefenamic acid from A + B to C + D, increasing the cross-relaxation rate. The findings of this study provide further insight into the structural and conformational features of mefenamic acid, as well as a general approach to the conformational analysis of small molecules using 2D NOESY data. Thus, determining the conformational compositions of mefenamic acid in CO2 is essential for a better understanding of the impregnation process. The results of this study also demonstrated the considerable influence of aerogel on the conformation of the doped molecules, suggesting that aerogel can be used to modulate the conformational state of molecules, which could be beneficial for a variety of applications.

3. Materials and Methods

Compounds produced by Sigma-Aldrich were used for NMR experiments, including mefenamic acid (CAS: 61-68-7; MFA, Sigma Aldrich (Darmstadt, Germany), with a purity of at least 99.99% (wt/wt)) and DMSO-d6 (CAS: 61-68-7; 99.9 atom percent D). Carbon dioxide was purchased from Linde Group Company (Balashiha, Russia) (GOST 8050-85, with a purity of 99.995% CO2 and less than 0.001% H2O). TEOS-doped silica aerogel samples were provided by the Boreskov Institute of Catalysis SB RAS (Novosibirsk, Russia). The synthesis and characterization of these samples has been described in detail in previous works [86,87].
Mefenamic acid was impregnated into the aerogel using a supercritical method in a 100 cm3 autoclave at a pressure of 350 bar at temperature 100 °C for ten days. A system for separating the initial components was installed to prevent direct contact between the aerogel sample and mefenamic acid throughout the entire process of impregnation. This adsorption method was unique in that the interaction of the dopant with the aerogel was carried out without physical contact with the components, only through the phase of the scCO2 solution, in which mefenamic acid is dissolved. Schematically, a part of the installation (autoclave) is shown in Figure S1. A detailed description of the autoclave, separator, and impregnation technique was previously presented by us [88].
Solid-state 1H, 13C, and 29Si NMR spectra were recorded at 298 K with magic angle spinning (MAS) at 10 kHz using a Bruker 400WB Avance III spectrometer (400.23 MHz for 1H, 100.64 MHz for 13C, 79.51 MHz for 29Si) equipped with a 4.0 mm MAS dual probe. The number of scans was set to 8 (1H), 1088 (13C), 6184 (29Si, doped silica aerogel), and 1568 (29Si, pure silica aerogel). The relaxation delay was 30 s (1H), 2 s (13C), and 10 s (29Si).
Such a relatively low value of the relaxation delay for 29Si was previously shown to be sufficient for aerogel systems [89], including those with TEOS [90]. We note, however, that for other silica-based materials, relaxation delays exceeding hundreds of seconds [91,92] and sometimes even hundreds of minutes [93] are far more common.
13C and RRCOSY NMR spectra were recorded using a Bruker Avance III 500 spectrometer with a Bruker 5 mm TBI probe. Experiments were conducted on a pure silica aerogel sample and a composite silica aerogel containing mefenamic acid. The characterization of the spatial structure of mefenamic acid and the calculation of the proportions of conformers in the presence of an aerogel doped with mefenamic acid was determined using the data obtained on the same equipment.
An approach based on the spectroscopy of the nuclear Overhauser effect, developed in our previous works [69,70,73], was used to solve this problem. Experiments at supercritical parameters of the state of the solvent (CO2) were conducted using the unique scientific installation “Fluid-spectrum” of the G.A. Krestov Institute of Solutions Chemistry of RAS (see Figure 8).
A tube filled up to the flange with aerogel powder was used to study the kinetics of CO2 sorption by aerogel. A system of capillaries and needle valves was used to feed carbon dioxide from a cylinder into the tube (see Figure 8). The pressure inside the cell was maintained at 26 MPa using a hand press. The temperature was maintained at 50 °C by an air thermostat, which included a BVT-2000 attachment with an additional cooling module—a Bruker BCU unit with an air flow of 535 L/h. Previously, temperature calibration was performed using a standard K-type thermocouple. The selection of experimental parameters was based on the literature data [94], which indicated that an increase in pressure leads to an increase in both the sorption kinetics and the concentration of the sorbed material. Therefore, the optimal pressure value for this modification of the NMR cell was chosen.
Given the low solubility of mefenamic acid in scCO2, sample preparation required a particular approach, using a small amount of DMSO-d6 to improve solubility. This technique had been described in previous works [69,74,77] and it has been shown [83] that DMSO-d6 in the amount of 2 mol. % does not significantly affect the conformational preferences of fenamates. Sample preparation for determining the conformational preferences of mefenamic acid in a supercritical fluid (scCO2) medium involved placing a small amount of crushed silica aerogel in a sapphire ampoule below the coil registration zone. Then, 86 μL of a solution of mefenamic acid in DMSO-d6 was added to the ampoule, followed by filling the remaining volume of the ampoule with carbon dioxide from a gas cylinder (see Figure 8). The selection of state parameters (45 °C and 9 MPa) and the required amount of mefenamic acid solution in DMSO-d6 for recording NOESY spectra was based on the data of works [85,95,96].

4. Conclusions

In this research, the physical and chemical properties of aerogel composite material with mefenamic acid were studied using techniques such as solid-state MAS NMR, high-pressure 13C NMR, T1–T2 RRCOSY, and NOESY. The results show that the presence of mefenamic acid affects the chemical environment of the aerogel, and this change can be seen in the integral intensities of the 2D RRCOSY spectra. Furthermore, 13C NMR spectroscopy is a suitable method for studying the kinetics of CO2 sorption and can be used to identify the species involved in the reaction. The NOESY study also found a difference in the populations of conformers of mefenamic acid released from the aerogel compared to bulk mefenamic acid. Hence, the ratio of conformers changed from 22% to 78% for doped aerogel to 75% to 25% for a bulk solution. Overall, these results provide insight into the physicochemical properties of the aerogel composite material with mefenamic acid and can be helpful for future drug delivery applications.

Supplementary Materials

The supporting information can be downloaded at: https://www.mdpi.com/article/10.3390/ijms24086882/s1.

Author Contributions

Conceptualization, I.K. and M.K.; methodology, I.K. and P.T.; validation, K.B., V.M. and V.S.; formal analysis, I.K., P.T. and K.B.; investigation, A.D. and L.B.d.C.; resources, I.K. and M.K.; writing—original draft preparation, I.K. and K.B.; writing—review and editing, I.K., K.B. and V.S.; visualization, K.B. and V.M.; supervision, project administration, funding acquisition, M.K. All authors have read and agreed to the published version of the manuscript.

Funding

This research was funded by the grant of the Russian Science Foundation (project no. 22-13-00257).

Institutional Review Board Statement

Not applicable.

Informed Consent Statement

Not applicable.

Data Availability Statement

Not applicable.

Conflicts of Interest

The authors declare no conflict of interest.

References

  1. Guo, W.; Yang, C.; Cui, L.; Lin, H.; Qu, F. An Enzyme-Responsive Controlled Release System of Mesoporous Silica Coated with Konjac Oligosaccharide. Langmuir 2014, 30, 243–249. [Google Scholar] [CrossRef] [PubMed]
  2. Champeau, M.; Thomassin, J.M.; Tassaing, T.; Jérôme, C. Drug Loading of Polymer Implants by Supercritical CO2 Assisted Impregnation: A Review. J. Control. Release 2015, 209, 248–259. [Google Scholar] [CrossRef]
  3. Smirnova, I.; Suttiruengwong, S.; Arlt, W. Feasibility Study of Hydrophilic and Hydrophobic Silica Aerogels as Drug Delivery Systems. J. Non. Cryst. Solids 2004, 350, 54–60. [Google Scholar] [CrossRef]
  4. Alleso, M.; Chieng, N.; Rehder, S.; Rantanen, J.; Rades, T.; Aaltonen, J. Enhanced Dissolution Rate and Synchronized Release of Drugs in Binary Systems through Formulation: Amorphous Naproxen–cimetidine Mixtures Prepared by Mechanical Activation. J. Control. Release 2009, 136, 45–53. [Google Scholar] [CrossRef] [PubMed]
  5. Shen, S.C.; Ng, W.K.; Chia, L.; Dong, Y.C.; Tan, R.B.H. Stabilized Amorphous State of Ibuprofen by Co-Spray Drying With Mesoporous SBA-15 to Enhance Dissolution Properties. J. Pharm. Sci. 2010, 99, 1997–2007. [Google Scholar] [CrossRef] [PubMed]
  6. Blagden, N.; de Matas, M.; Gavan, P.T.; York, P. Crystal Engineering of Active Pharmaceutical Ingredients to Improve Solubility and Dissolution Rates. Adv. Drug Deliv. Rev. 2007, 59, 617–630. [Google Scholar] [CrossRef] [PubMed]
  7. Franco, P.; Marco, I. De Supercritical Antisolvent Process for Pharmaceutical Applications: A Review. Process 2020, 8, 938. [Google Scholar] [CrossRef]
  8. Singh, N.; Vinjamur, M.; Mukhopadhyay, M. Insights into Adsorptive Drug Loading on Silica Aerogels from Supercritical CO2. Langmuir 2022, 38, 13075–13083. [Google Scholar] [CrossRef]
  9. Akhter, F.; Jamali, A.R.; Khan, W. TEOS-Doped vs Non-TEOS Silica Aerogels: A Comparative Study of Synthesis, Characterization, Isotherm Studies and Performance Evaluation for Pb (II) Removal from Synthetic Wastewater. Water. Air. Soil Pollut. 2023, 234, 1–9. [Google Scholar] [CrossRef]
  10. Yar, A. Enhanced Output Performance of Tetraethyl Orthosilicate and Graphene Nanoplates-Decorated Nanofiber-Based Triboelectric Nanogenerators. Colloids Surf. A Physicochem. Eng. Asp. 2021, 631, 127670. [Google Scholar] [CrossRef]
  11. Giray, S.; Bal, T.; Kartal, A.M.; Kizilel, S.; Erkey, C. Controlled Drug Delivery through a Novel PEG Hydrogel Encapsulated Silica Aerogel System. J. Biomed. Mater. Res. Part A 2012, 100, 1307–1315. [Google Scholar] [CrossRef] [PubMed]
  12. Ulker, Z.; Erkey, C. An Emerging Platform for Drug Delivery: Aerogel Based Systems. J. Control. Release 2014, 177, 51–63. [Google Scholar] [CrossRef]
  13. Nakapraves, S.; Warzecha, M.; Mustoe, C.L.; Srirambhatla, V.; Florence, A.J. Prediction of Mefenamic Acid Crystal Shape by Random Forest Classification. Pharm. Res. 2022, 39, 3099–3111. [Google Scholar] [CrossRef] [PubMed]
  14. Charoenchaitrakool, M.; Roubroum, T.; Sudsakorn, K. Processing of a Novel Mefenamic Acid−paracetamol−nicotinamide Cocrystal Using Gas Anti-Solvent Process. J. CO2 Util. 2022, 62, 102080. [Google Scholar] [CrossRef]
  15. Díaz, J.d.l.A.C.; Bordín, S.F.; Mattea, F.; Romero, M.R. Loading of Drugs in Biodegradable Polymers Using Supercritical Fluid Technology. Drug Des. Using Mach. Learn. 2022, 1, 195–224. [Google Scholar] [CrossRef]
  16. Tan, F.; Yang, R.; Xu, X.; Chen, X.; Wang, Y.; Ma, H.; Liu, X.; Wu, X.; Chen, Y.; Liu, L.; et al. Drug Repositioning by Applying “expression Profiles” Generated by Integrating Chemical Structure Similarity and Gene Semantic Similarity. Mol. Biosyst. 2014, 10, 1126–1138. [Google Scholar] [CrossRef] [PubMed]
  17. Wang, W.H.; Huang, J.Q.; Zheng, G.F.; Lam, S.K.; Karlberg, J.; Wong, B.C.Y. Non-Steroidal Anti-Inflammatory Drug Use and the Risk of Gastric Cancer: A Systematic Review and Meta-Analysis. JNCI J. Natl. Cancer Inst. 2003, 95, 1784–1791. [Google Scholar] [CrossRef] [Green Version]
  18. Tkalec, G.; Pantić, M.; Novak, Z.; Knez, Ž. Supercritical Impregnation of Drugs and Supercritical Fluid Deposition of Metals into Aerogels. J. Mater. Sci. 2015, 50, 1–12. [Google Scholar] [CrossRef]
  19. Rivas, M.V.; Arenas Muñetón, M.J.; Spagnuolo, C.C.; Lombardo, M.V.; Bordoni, A.V.V.; Wolosiuk, A. Revisiting Carboxylic Group Functionalization of Silica Sol–gel Materials. J. Mater. Chem. B 2023, 8. [Google Scholar] [CrossRef]
  20. Watanabe, T.; Wakiyama, N.; Usui, F.; Ikeda, M.; Isobe, T.; Senna, M. Stability of Amorphous Indomethacin Compounded with Silica. Int. J. Pharm. 2001, 226, 81–91. [Google Scholar] [CrossRef]
  21. Lovskaya, D.D.; Lebedev, A.E.; Menshutina, N.V. Aerogels as Drug Delivery Systems: In Vitro and in Vivo Evaluations. J. Supercrit. Fluids 2015, 106, 115–121. [Google Scholar] [CrossRef]
  22. Malfait, W.J.; Zhao, S.; Verel, R.; Iswar, S.; Rentsch, D.; Fener, R.; Zhang, Y.; Milow, B.; Koebel, M.M. Surface Chemistry of Hydrophobic Silica Aerogels. Chem. Mater. 2015, 27, 6737–6745. [Google Scholar] [CrossRef]
  23. Rao, V.; Nilsen, E.; Einarsrud, M.A. Effect of Precursors, Methylation Agents and Solvents on the Physicochemical Properties of Silica Aerogels Prepared by Atmospheric Pressure Drying Method. J. Non. Cryst. Solids 2001, 296, 165–171. [Google Scholar] [CrossRef]
  24. Rao, A.P.; Rao, A.V.; Pajonk, G.M. Hydrophobic and Physical Properties of the Two Step Processed Ambient Pressure Dried Silica Aerogels with Various Exchanging Solvents. J. Sol-Gel Sci. Technol. 2005, 36, 285–292. [Google Scholar] [CrossRef]
  25. Lee, J.H.; Park, J.; Yang, J.; Yang, K.H.; Ju, S.; Lim, T.; Jeong, S.M. Hydrophobic Halochromic Aerogel Capable of Reversibly Measuring Acidic and Basic Vapors. AIP Adv. 2021, 11, 115115. [Google Scholar] [CrossRef]
  26. Kristiansen, T.; Mathisen, K.; Einarsrud, M.A.; Bjorgen, M.; Nicholson, D.G. Single-Site Copper by Incorporation in Ambient Pressure Dried Silica Aerogel and Xerogel Systems: An X-Ray Absorption Spectroscopy Study. J. Phys. Chem. C 2011, 115, 19260–19268. [Google Scholar] [CrossRef]
  27. Zhao, W.; Chen, H.; Li, Y.; Li, L.; Lang, M.; Shi, J. Investigation of Templated Mesoporous Silicate Thin Films Using High Speed, Solid-State 1H MAS and Double Quantum NMR Spectroscopy. Macromol. Chem. Phys. 2003, 204, 2023–2030. [Google Scholar] [CrossRef]
  28. Mauder, D.; Akcakayiran, D.; Lesnichin, S.B.; Findenegg, G.H.; Shenderovich, I.G. Acidity of Sulfonic and Phosphonic Acid-Functionalized SBA-15 under Almost Water-Free Conditions. J. Phys. Chem. C 2009, 113, 19185–19192. [Google Scholar] [CrossRef]
  29. Nourbakhsh, S.; Talebian, A.; Valipour, P.; Ghaffar Ebadi, A. Study of Corona Discharge Treatment on Physical and Chemical Properties of Cotton Fabric. Asian J. Chem. 2008, 20, 211–216. [Google Scholar]
  30. Ma, Z.; Dunn, B.C.; Turpin, G.C.; Eyring, E.M.; Ernst, R.D.; Pugmire, R.J. Solid State NMR Investigation of Silica Aerogel Supported Fischer–Tropsch Catalysts. Fuel Process. Technol. 2007, 88, 29–33. [Google Scholar] [CrossRef]
  31. Malfait, W.J.; Verel, R.; Koebel, M.M. Hydrophobization of Silica Aerogels: Insights from Quantitative Solid-State NMR Spectroscopy. J. Phys. Chem. C 2014, 118, 25545–25554. [Google Scholar] [CrossRef]
  32. Kim, J.; Heo, I.; Luu, Q.S.; Nguyen, Q.T.; Do, U.T.; Whiting, N.; Yang, S.H.; Huh, Y.M.; Min, S.J.; Shim, J.H.; et al. Dynamic Nuclear Polarization of Selectively 29Si-Enriched Core@shell Silica Nanoparticles. Anal. Chem. 2023, 95, 907–916. [Google Scholar] [CrossRef] [PubMed]
  33. Yan, C.; Moretto, E.; Kachouri, O.; Biagi, J.L.; Thomann, J.S.; Kayser, F.; Dieden, R. Revealing the Dehydration/deuteration Processes at the Liquid-Solid Interface by Nuclear Magnetic Resonance Spectroscopy. Colloids Surf. A Physicochem. Eng. Asp. 2022, 637, 128260. [Google Scholar] [CrossRef]
  34. Viitala, R.; Jokinen, M.; Maunu, S.L.; Jalonen, H.; Rosenholm, J.B. Chemical Characterization of Bioresorbable Sol–gel Derived SiO2 Matrices Prepared at Protein-Compatible pH. J. Non. Cryst. Solids 2005, 351, 3225–3234. [Google Scholar] [CrossRef]
  35. Rim, G.; Marchese, A.K.; Stallworth, P.; Greenbaum, S.G.; Park, A.H.A. 29Si Solid State MAS NMR Study on Leaching Behaviors and Chemical Stability of Different Mg-Silicate Structures for CO2 Sequestration. Chem. Eng. J. 2020, 396, 125204. [Google Scholar] [CrossRef]
  36. Moribe, K.; Kinoshita, R.; Higashi, K.; Tozuka, Y.; Yamamoto, K. Coloration Phenomenon of Mefenamic Acid in Mesoporous Silica FSM-16. Chem. Pharm. Bull. 2010, 58, 214–218. [Google Scholar] [CrossRef] [PubMed] [Green Version]
  37. Zhao, W.; Chen, H.; Li, Y.; Li, A.; Lang, M.; Shi, J. Uniform Rattle-Type Hollow Magnetic Mesoporous Spheres as Drug Delivery Carriers and Their Sustained-Release Property. Adv. Funct. Mater. 2008, 18, 2780–2788. [Google Scholar] [CrossRef]
  38. Gómez-Cerezo, N.; Verron, E.; Montouillout, V.; Fayon, F.; Lagadec, P.; Bouler, J.M.; Bujoli, B.; Arcos, D.; Vallet-Regí, M. The Response of Pre-Osteoblasts and Osteoclasts to Gallium Containing Mesoporous Bioactive Glasses. Acta Biomater. 2018, 76, 333–343. [Google Scholar] [CrossRef]
  39. Graetsch, H.; Mosset, A.; Gies, H. XRD and 29Si MAS-NMR Study on Some Non-Crystalline Silica Minerals. J. Non. Cryst. Solids 1990, 119, 173–180. [Google Scholar] [CrossRef]
  40. Moreno, E.M.; Zayat, M.; Morales, M.P.; Serna, C.J.; Roig, A.; Levy, D. Preparation of Narrow Size Distribution Superparamagnetic γ-Fe2O3 Nanoparticles in a Sol-Gel Transparent SiO2 Matrix. Langmuir 2002, 18, 4972–4978. [Google Scholar] [CrossRef]
  41. Vinogradova, E.; Estrada, M.; Moreno, A. Colloidal Aggregation Phenomena: Spatial Structuring of TEOS-Derived Silica Aerogels. J. Colloid Interface Sci. 2006, 298, 209–212. [Google Scholar] [CrossRef] [PubMed]
  42. Fang, H.; Wu, Z.Y.; Huang, Y.H.; Xiong, X.W.; Zhang, R.Z.; Ma, Q.H.; He, Z.; Li, R.C.; Zhang, D.Y.; Zhou, X.Y. Synthesis and Properties of P2O5-SnO2-ZnO Penetrated into Silica Aerogel Matrix by Sol-Gel Technique. Adv. Mater. Res. 2013, 800, 447–453. [Google Scholar] [CrossRef]
  43. Paradowska, K.; Wawer, I. Solid-State NMR in the Analysis of Drugs and Naturally Occurring Materials. J. Pharm. Biomed. Anal. 2014, 93, 27–42. [Google Scholar] [CrossRef] [PubMed]
  44. Tian, X.; Liu, J.; Wang, Y.; Shi, F.; Shan, Z.; Zhou, J.; Liu, J. Adsorption of Antibiotics from Aqueous Solution by Different Aerogels. J. Non. Cryst. Solids 2019, 505, 72–78. [Google Scholar] [CrossRef]
  45. Editors, G.; Hodgkinson, P.; Wimperis, S.; Ashbrook, S.E.; Zhu, J.; Geris, A.J.; Wu, G.; Chem, P.; Stebbins, J.F.; Kelsey, K.E.; et al. Anomalous Resonances in 29Si and 27Al NMR Spectra of Pyrope ([Mg,Fe]3Al2Si3O12) Garnets: Effects of Paramagnetic Cations. Phys. Chem. Chem. Phys. 2009, 11, 6906–6917. [Google Scholar] [CrossRef]
  46. Barron, P.F.; Frost, R.L.; Skjemstad, J.O. 29Si Spin–lattice Relaxation in Aluminosilicates. J. Chem. Soc. Chem. Commun. 1983, 581–583. [Google Scholar] [CrossRef]
  47. Watanabe, T.; Shimizu, H.; Masuda, A.; Saitô, H. Studies of 29Si Spin-Lattice Relaxation Times and Paramagnetic Impurities in Clay Minerals by Magic-Angle Spinning 29Si-NMR and EPR. Chem. Latters 2006, 12, 1293–1296. [Google Scholar] [CrossRef]
  48. Grey, C.P.; Dobson, C.M.; Cheetham, A.K.; Jakeman, R.J.B. Studies of Rare-Earth Stannates by 119Sn MAS NMR. The Use of Paramagnetic Shift Probes in the Solid State. J. Am. Chem. Soc. 1989, 111, 505–511. [Google Scholar] [CrossRef]
  49. Dajda, N.; Dixon, J.M.; Smith, M.E.; Carthey, N.; Bishop, P.T. Atomic Site Preferences and Structural Evolution in Vanadium-Doped ZrSiO4 from Multinuclear Solid-State NMR. Phys. Rev. B 2003, 67, 024201. [Google Scholar] [CrossRef]
  50. Wang, C.; Okubayashi, S. Polyethyleneimine-Crosslinked Cellulose Aerogel for Combustion CO2 Capture. Carbohydr. Polym. 2019, 225, 115248. [Google Scholar] [CrossRef]
  51. Alhwaige, A.A.; Ishida, H.; Qutubuddin, S. Carbon Aerogels with Excellent CO2 Adsorption Capacity Synthesized from Clay-Reinforced Biobased Chitosan-Polybenzoxazine Nanocomposites. ACS Sustain. Chem. Eng. 2016, 4, 1286–1295. [Google Scholar] [CrossRef]
  52. Liu, Q.; Han, Y.; Qian, X.; He, P.; Fei, Z.; Chen, X.; Zhang, Z.; Tang, J.; Cui, M.; Qiao, X. CO2 Adsorption over Carbon Aerogels: The Effect of Pore and Surface Properties. ChemistrySelect 2019, 4, 3161–3168. [Google Scholar] [CrossRef]
  53. He, P.; Qian, X.; Fei, Z.; Liu, Q.; Zhang, Z.; Chen, X.; Tang, J.; Cui, M.; Qiao, X. Structure Manipulation of Carbon Aerogels by Managing Solution Concentration of Precursor and Its Application for CO2 Capture. Process 2018, 6, 35. [Google Scholar] [CrossRef] [Green Version]
  54. Anas, M.; Gönel, A.G.; Bozbag, S.E.; Erkey, C. Thermodynamics of Adsorption of Carbon Dioxide on Various Aerogels. J. CO2 Util. 2017, 21, 82–88. [Google Scholar] [CrossRef]
  55. Keshavarz, L.; Ghaani, M.R.; MacElroy, J.M.D.; English, N.J. A Comprehensive Review on the Application of Aerogels in CO2-Adsorption: Materials and Characterisation. Chem. Eng. J. 2021, 412, 128604. [Google Scholar] [CrossRef]
  56. Rother, G.; Vlcek, L.; Gruszkiewicz, M.S.; Chialvo, A.A.; Anovitz, L.M.; Bañuelos, J.L.; Wallacher, D.; Grimm, N.; Cole, D.R. Sorption Phase of Supercritical CO2 in Silica Aerogel: Experiments and Mesoscale Computer Simulations. J. Phys. Chem. C 2014, 118, 15525–15533. [Google Scholar] [CrossRef]
  57. Sobornova, V.V.; Belov, K.V.; Dyshin, A.A.; Gurina, D.L.; Khodov, I.A.; Kiselev, M.G. Molecular Dynamics and Nuclear Magnetic Resonance Studies of Supercritical CO2 Sorption in Poly(Methyl Methacrylate). Polymers 2022, 14, 5332. [Google Scholar] [CrossRef]
  58. English, A.E.; Whittall, K.P.; Joy, M.L.G.; Henkelman, R.M. Quantitative Two-Dimensional Time Correlation Relaxometry. Magn. Reson. Med. 1991, 22, 425–434. [Google Scholar] [CrossRef]
  59. Venkataramanan, L.; Song, Y.Q.; Hürlimann, M.D. Solving Fredholm Integrals of the First Kind with Tensor Product Structure in 2 and 2.5 Dimensions. IEEE Trans. Signal Process. 2002, 50, 1017–1026. [Google Scholar] [CrossRef]
  60. Song, Y.Q.; Venkataramanan, L.; Hürlimann, M.D.; Flaum, M.; Frulla, P.; Straley, C. T1-T2 Correlation Spectra Obtained Using a Fast Two-Dimensional Laplace Inversion. J. Magn. Reson. 2002, 154, 261–268. [Google Scholar] [CrossRef]
  61. McDonald, P.J.; Korb, J.P.; Mitchell, J.; Monteilhet, L. Surface Relaxation and Chemical Exchange in Hydrating Cement Pastes: A Two-Dimensional NMR Relaxation Study. Phys. Rev. E—Stat. Nonlinear, Soft Matter Phys. 2005, 72, 011409. [Google Scholar] [CrossRef] [PubMed] [Green Version]
  62. Monteilhet, L.; Korb, J.P.; Mitchell, J.; McDonald, P.J. Observation of Exchange of Micropore Water in Cement Pastes by Two-Dimensional T2T2 Nuclear Magnetic Resonance Relaxometry. Phys. Rev. E—Stat. Nonlinear, Soft Matter Phys. 2006, 74, 061404. [Google Scholar] [CrossRef] [PubMed] [Green Version]
  63. Burcaw, L.M.; Callaghan, P.T. Correlation of the Inhomogeneous Field as a Measure of Sample Heterogeneity. J. Magn. Reson. 2012, 216, 144–151. [Google Scholar] [CrossRef] [PubMed]
  64. Washburn, K.E.; Callaghan, P.T. Tracking Pore to Pore Exchange Using Relaxation Exchange Spectroscopy. Phys. Rev. Lett. 2006, 97, 175502. [Google Scholar] [CrossRef]
  65. Khodov, I.; Dyshin, A.; Efimov, S.; Ivlev, D.; Kiselev, M. High-Pressure NMR Spectroscopy in Studies of the Conformational Composition of Small Molecules in Supercritical Carbon Dioxide. J. Mol. Liq. 2020, 309, 113113. [Google Scholar] [CrossRef] [Green Version]
  66. Efimov, S.V.; Dubinin, M.V.; Kobchikova, P.P.; Zgadzay, Y.O.; Khodov, I.A.; Belosludtsev, K.N.; Klochkov, V.V. Comparison of Cyclosporin Variants B–E Based on Their Structural Properties and Activity in Mitochondrial Membranes. Biochem. Biophys. Res. Commun. 2020, 526, 1054–1060. [Google Scholar] [CrossRef]
  67. Kobchikova, P.P.; Efimov, S.V.; Khodov, I.A.; Klochkov, V.V. Features of Spatial Structures of Cyclosporins D, E and G Revealed by NMR and MD Simulations. J. Mol. Liq. 2021, 336, 116244. [Google Scholar] [CrossRef]
  68. Hu, H.; Krishnamurthy, K. Revisiting the Initial Rate Approximation in Kinetic NOE Measurements. J. Magn. Reson. 2006, 182, 173–177. [Google Scholar] [CrossRef]
  69. Belov, K.V.; Dyshin, A.A.; Krestyaninov, M.A.; Efimov, S.V.; Khodov, I.A.; Kiselev, M.G. Conformational Preferences of Tolfenamic Acid in DMSO-CO2 Solvent System by 2D NOESY. J. Mol. Liq. 2022, 367, 120481. [Google Scholar] [CrossRef]
  70. Khodov, I.A.; Belov, K.V.; Dyshin, A.A.; Krestyaninov, M.A.; Kiselev, M.G. Pressure Effect on Lidocaine Conformational Equilibria in scCO2: A Study by 2D NOESY. J. Mol. Liq. 2022, 367, 120525. [Google Scholar] [CrossRef]
  71. Efimov, S.V.; Khodov, I.A.; Ratkova, E.L.; Kiselev, M.G.; Berger, S.; Klochkov, V.V. Detailed NOESY/T-ROESY Analysis as an Effective Method for Eliminating Spin Diffusion from 2D NOE Spectra of Small Flexible Molecules. J. Mol. Struct. 2016, 1104, 63–69. [Google Scholar] [CrossRef]
  72. Khodov, I.A.; Nikiforov, M.Y.; Alper, G.A.; Blokhin, D.S.; Efimov, S.V.; Klochkov, V.V.; Georgi, N. Spatial Structure of Felodipine Dissolved in DMSO by 1D NOE and 2D NOESY NMR Spectroscopy. J. Mol. Struct. 2013, 1035, 358–362. [Google Scholar] [CrossRef]
  73. Eventova, V.A.; Belov, K.V.; Efimov, S.V.; Khodov, I.A. Conformational Screening of Arbidol Solvates: Investigation via 2D NOESY. Pharmaceutics 2023, 15, 226. [Google Scholar] [CrossRef] [PubMed]
  74. Khodov, I.A.; Belov, K.V.; Krestyaninov, M.A.; Dyshin, A.A.; Kiselev, M.G.; Krestov, G.A. Investigation of the Spatial Structure of Flufenamic Acid in Supercritical Carbon Dioxide Media via 2D NOESY. Materials 2023, 16, 1524. [Google Scholar] [CrossRef]
  75. Belov, K.V.V.; Dyshin, A.A.A.; Kiselev, M.G.G.; Krestyaninov, M.A.A.; Sobornova, V.V.; Khodov, I.A.A. Determination of the Spatial Structure of Lidocaine in SC-CO2 by the 2D NOESY Method. Russ. J. Phys. Chem. B 2021, 15, 1303–1309. [Google Scholar] [CrossRef]
  76. Khodov, I.A.; Belov, K.V.; Krestyaninov, M.A.; Kiselev, M.G. Conformational Equilibria of a Thiadiazole Derivative in Solvents of Different Polarities: An NMR Study. Russ. J. Phys. Chem. A 2022, 96, 765–772. [Google Scholar] [CrossRef]
  77. Belov, K.V.; Batista de Carvalho, L.A.E.; Dyshin, A.A.; Efimov, S.V.; Khodov, I.A. The Role of Hidden Conformers in Determination of Conformational Preferences of Mefenamic Acid by NOESY Spectroscopy. Pharmaceutics 2022, 14, 2276. [Google Scholar] [CrossRef]
  78. SeethaLekshmi, S.; Row, T.N.G. Conformational Polymorphism in a Non-Steroidal Anti-Inflammatory Drug, Mefenamic Acid. Cryst. Growth Des. 2012, 12, 4283–4289. [Google Scholar] [CrossRef]
  79. Khodov, I.A.; Belov, K.V.; Pogonin, A.E.; Savenkova, M.A.; Gamov, G.A. Spatial Structure and Conformations of Hydrazones Derived from Pyridoxal 5′-Phosphate and 2-, 3-Pyridinecarbohydrazide in the Light of NMR Study and Quantum Chemical Calculations. J. Mol. Liq. 2021, 342, 117372. [Google Scholar] [CrossRef]
  80. Khodov, I.A.; Kiselev, M.G.; Efimov, S.V.; Klochkov, V.V. Comment On “conformational Analysis of Small Organic Molecules Using NOE and RDC Data: A Discussion of Strychnine and α-Methylene-γ-Butyrolactone”. J. Magn. Reson. 2016, 266, 67–68. [Google Scholar] [CrossRef]
  81. Sternberg, U.; Witter, R. Structures Controlled by Entropy: The Flexibility of Strychnine as Example. Molecules 2022, 27, 7987. [Google Scholar] [CrossRef] [PubMed]
  82. Belov, K.V.; Batista de Carvalho, L.A.E.; Dyshin, A.A.; Kiselev, M.G.; Sobornova, V.V.; Khodov, I.A. Conformational Analysis of Mefenamic Acid in scCO2-DMSO by the 2D NOESY Method. Russ. J. Phys. Chem. B 2023, 16, 1191–1199. [Google Scholar] [CrossRef]
  83. Khodov, I.A.; Belov, K.V.; Krestyaninov, M.A.; Sobornova, V.V.; Dyshin, A.A.; Kiselev, M.G. Does DMSO Affect the Conformational Changes of Drug Molecules in Supercritical CO2 Media? J. Mol. Liq. 2023; in press. [Google Scholar]
  84. Khodov, I.A.; Musabirova, G.S.; Klochkov, V.V.; Karataeva, F.K.; Huster, D.; Scheidt, H.A. Structural Details on the Interaction of Fenamates with Lipid Membranes. J. Mol. Liq. 2022, 367, 120502. [Google Scholar] [CrossRef]
  85. Andreatta, A.E.; Florusse, L.J.; Bottini, S.B.; Peters, C.J. Phase Equilibria of Dimethyl Sulfoxide (DMSO) + Carbon Dioxide, and DMSO + Carbon Dioxide + Water Mixtures. J. Supercrit. Fluids 2007, 42, 60–68. [Google Scholar] [CrossRef]
  86. Danilyuk, A.F.; Kravchenko, E.A.; Okunev, A.G.; Onuchin, A.P.; Shaurman, S.A. Synthesis of Aerogel Tiles with High Light Scattering Length. Nucl. Instrum. Methods Phys. Res. Sect. A Accel. Spectrom. Detect. Assoc. Equip. 1999, 433, 406–407. [Google Scholar] [CrossRef]
  87. Danilyuk, A.F.; Kononov, S.A.; Kravchenko, E.A.; Onuchin, A.P. Aerogel Cherenkov Detectors in Colliding Beam Experiments. Physics-Uspekhi 2015, 58, 503. [Google Scholar] [CrossRef]
  88. Oparin, R.D.; Belov, K.V.; Khodov, I.A.; Dyshin, A.A.; Kiselev, M.G. Impregnation of Polymethyl Methacrylate with Carbamazepine in Supercritical Carbon Dioxide. Russ. J. Phys. Chem. B 2021, 15, 1157–1165. [Google Scholar] [CrossRef]
  89. Mandal, C.; Donthula, S.; Rewatkar, P.M.; Sotiriou-Leventis, C.; Leventis, N. Experimental Deconvolution of Depressurization from Capillary Shrinkage during Drying of Silica Wet-Gels with SCF CO2 Why Aerogels Shrink? J. Sol-Gel Sci. Technol. 2019, 92, 662–680. [Google Scholar] [CrossRef]
  90. Chen, Y.X.; Sepahvand, S.; Gauvin, F.; Schollbach, K.; Brouwers, H.J.H.; Yu, Q. One-Pot Synthesis of Monolithic Silica-Cellulose Aerogel Applying a Sustainable Sodium Silicate Precursor. Constr. Build. Mater. 2021, 293, 123289. [Google Scholar] [CrossRef]
  91. Shenderovich, I.G.; Mauder, D.; Akcakayiran, D.; Buntkowsky, G.; Limbach, H.H.; Findenegg, G.H. NMR Provides Checklist of Generic Properties for Atomic-Scale Models of Periodic Mesoporous Silicas. J. Phys. Chem. B 2007, 111, 12088–12096. [Google Scholar] [CrossRef]
  92. Gutiérrez-Ortega, J.A.; Gómez-Salazar, S.; Shenderovich, I.G.; Manríquez-González, R. Efficiency and Lead Uptake Mechanism of a Phosphonate Functionalized Mesoporous Silica through P/Pb Association Ratio. Mater. Chem. Phys. 2020, 239, 122037. [Google Scholar] [CrossRef]
  93. MacKenzie, K.J.D.; Smith, M.E. Multinuclear Solid-State NMR of Inorganic Materials. PERGAMON Mater. Ser. 2002, 6, 748. [Google Scholar]
  94. Shieh, Y.-T.; Liu, K.-H. Solubility of CO2 in Glassy PMMA and PS over a Wide Pressure Range: The Effect of Carbonyl Groups. J. Polym. Res. 2002, 9, 107–113. [Google Scholar] [CrossRef]
  95. Sauceau, M.; Letourneau, J.-J.; Richon, D.; Fages, J. Enhanced Density-Based Models for Solid Compound Solubilities in Supercritical Carbon Dioxide with Cosolvents. Fluid Phase Equilib. 2003, 208, 99–113. [Google Scholar] [CrossRef] [Green Version]
  96. Jaxel, J.; Gusenbauer, C.; Böhmdorfer, S.; Liebner, F.; Hansmann, C. Improving Single-Step scCO2 Dyeing of Wood by DMSO-Induced Micro-Swelling. J. Supercrit. Fluids 2020, 165, 104978. [Google Scholar] [CrossRef]
Figure 1. The 1H and 13C MAS NMR spectra of the original undoped SiO2-based aerogel and aerogel doped with mefenamic acid are shown in (a,b) and (c,d), respectively, after drying in scCO2 medium. The signals corresponding to the hydrogen atoms (a) and carbon (b) of the CH2 groups of the precursor TEOS are marked in red, the signals of the CH3 groups of the precursor TEOS are marked in blue, and the signal belonging to the hydrogen atoms of the aromatic and OH/NH fragments of mefenamic acid (MFA) is marked in green.
Ijms 24 06882 g001
Figure 2. A stereochemical depiction of the Qn silica structural units.
Ijms 24 06882 g002
Figure 3. The 29Si MAS NMR spectra of pure aerogel (green line) and aerogel with MFA (pink line) and results of pseudo-Voigt profile approximation for deconvolution of signal lines, including Q3 (blue lines) and Q4 (purple lines) tetrahedral units. ∆FWHM—difference between the widths at half-height signals for doped and pure aerogel.
Ijms 24 06882 g003
Figure 4. The dependence of the chemical shift parameter of the 13C NMR of scCO2 signal on time, approximated by a single exponential model, for a system with an initial (blue) and doped (red) aerogel. The red and blue circles indicate the characteristic correlation time for each system.
Ijms 24 06882 g004
Figure 5. Two-dimensional maps of RRCOSY correlations of carbon dioxide in the original aerogel (red) and the aerogel-doped system (blue) are shown. The logarithms of the relaxation times T1 and T2 are represented by the ordinate and abscissa, respectively. The maps illustrate a marked disparity in integral intensities between the two systems.
Ijms 24 06882 g005
Figure 6. Conformers of the MFA molecule (AD) are indicated by the number of carbon atoms and their associated hydrogen atoms; the numbering of atoms remains the same for the remaining conformers. The red color indicates the C2-N(H)-C3-C7 dihedral angle, and its value results vary in different conformations of MFA.
Ijms 24 06882 g006
Figure 7. A schematic representation of the cell is shown on the left, with MFA solution in DMSO-d6 (86 μL) depicted in blue and MFA-doped aerogel in yellow. The center displays the distribution of mefenamic acid conformers in scCO2 by adding 2 mol.% DMSO-d6 and in scCO2 + DMSO-d6 in the presence of doped aerogel, calculated at 45 °C and 9 MPa based on the observed conformationally determined H12–H15 distance. On the right, the structures of the predominant MFA conformers are shown, with the numbers indicating the hydrogen atoms of the conformationally defined distance—H12–H15. The red color indicates the chemical bonds that form the dihedral angle, which alteration leads to the different conformations of the MFA molecules.
Ijms 24 06882 g007
Figure 8. Scheme of the setup for high-pressure NMR experiments at supercritical parameters of state. It consists of a cylinder with carbon dioxide (1), needle valves (2, 4, and 6), a syringe pump (3), and an electronic pressure sensor (5).
Ijms 24 06882 g008
Disclaimer/Publisher’s Note: The statements, opinions and data contained in all publications are solely those of the individual author(s) and contributor(s) and not of MDPI and/or the editor(s). MDPI and/or the editor(s) disclaim responsibility for any injury to people or property resulting from any ideas, methods, instructions or products referred to in the content.

