
Increased Biomass and Polyhydroxybutyrate Production by Synechocystis sp. PCC 6803 Overexpressing RuBisCO Genes

Abstract
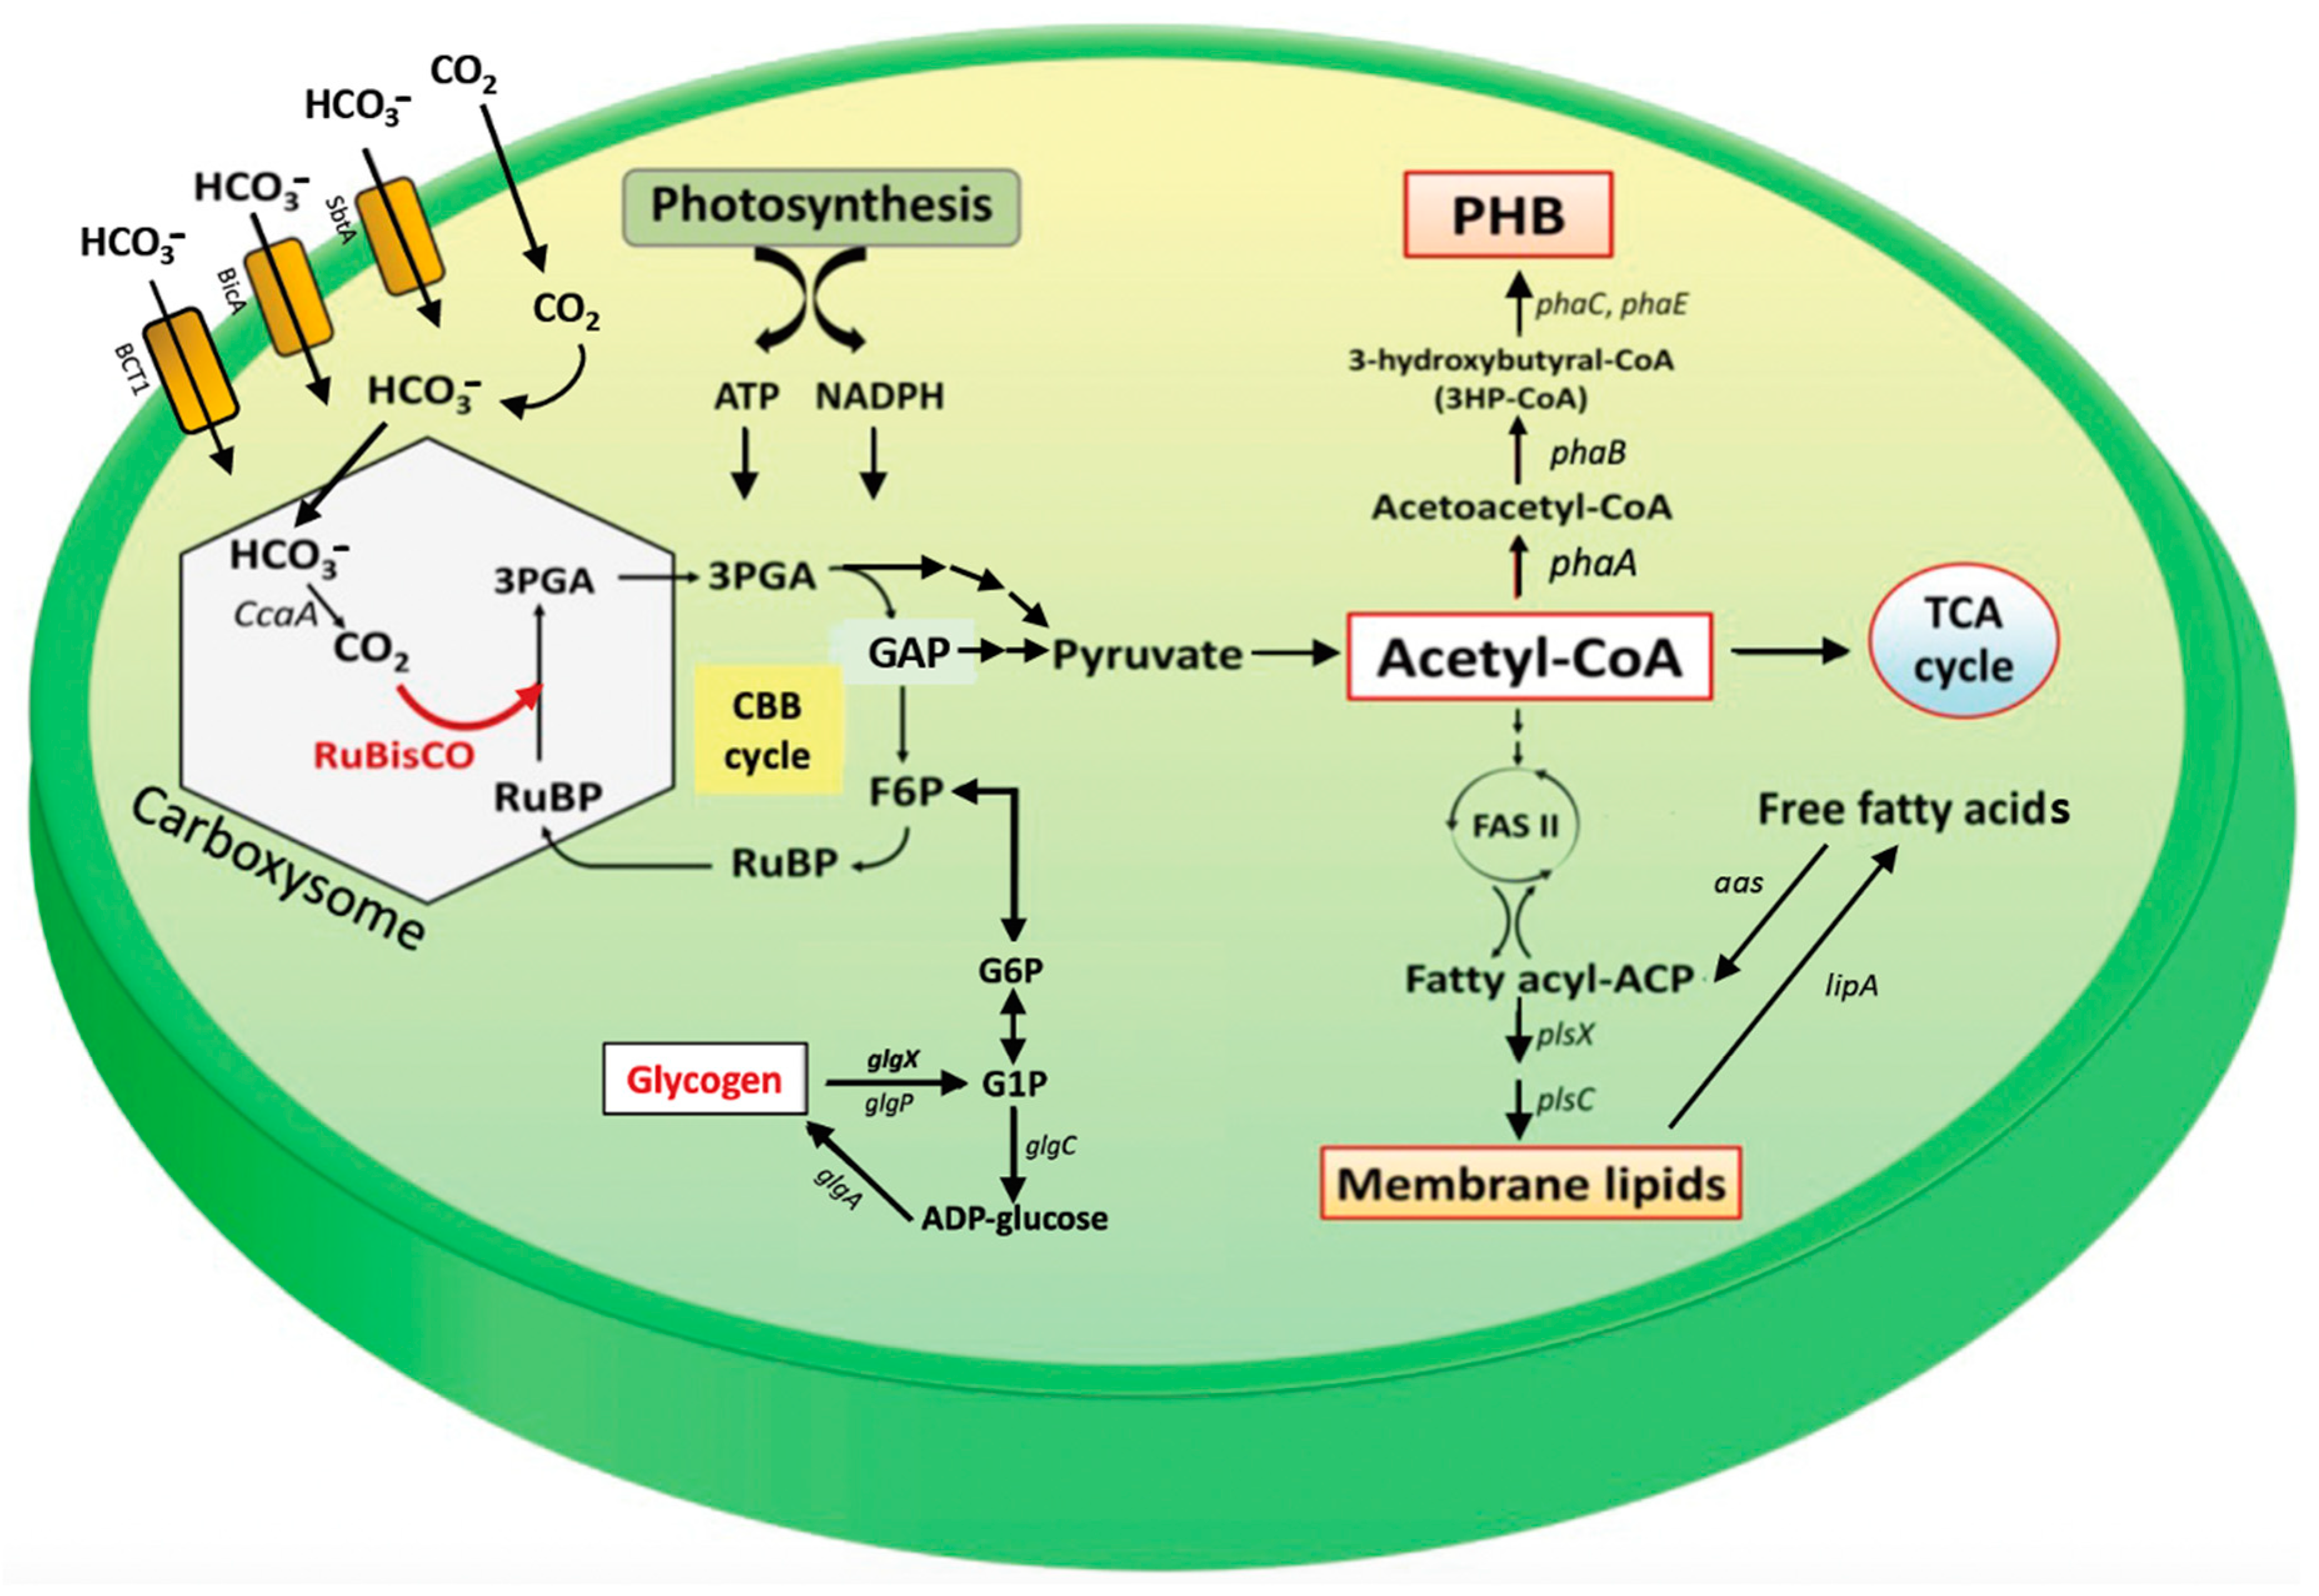
:1. Introduction
2. Results
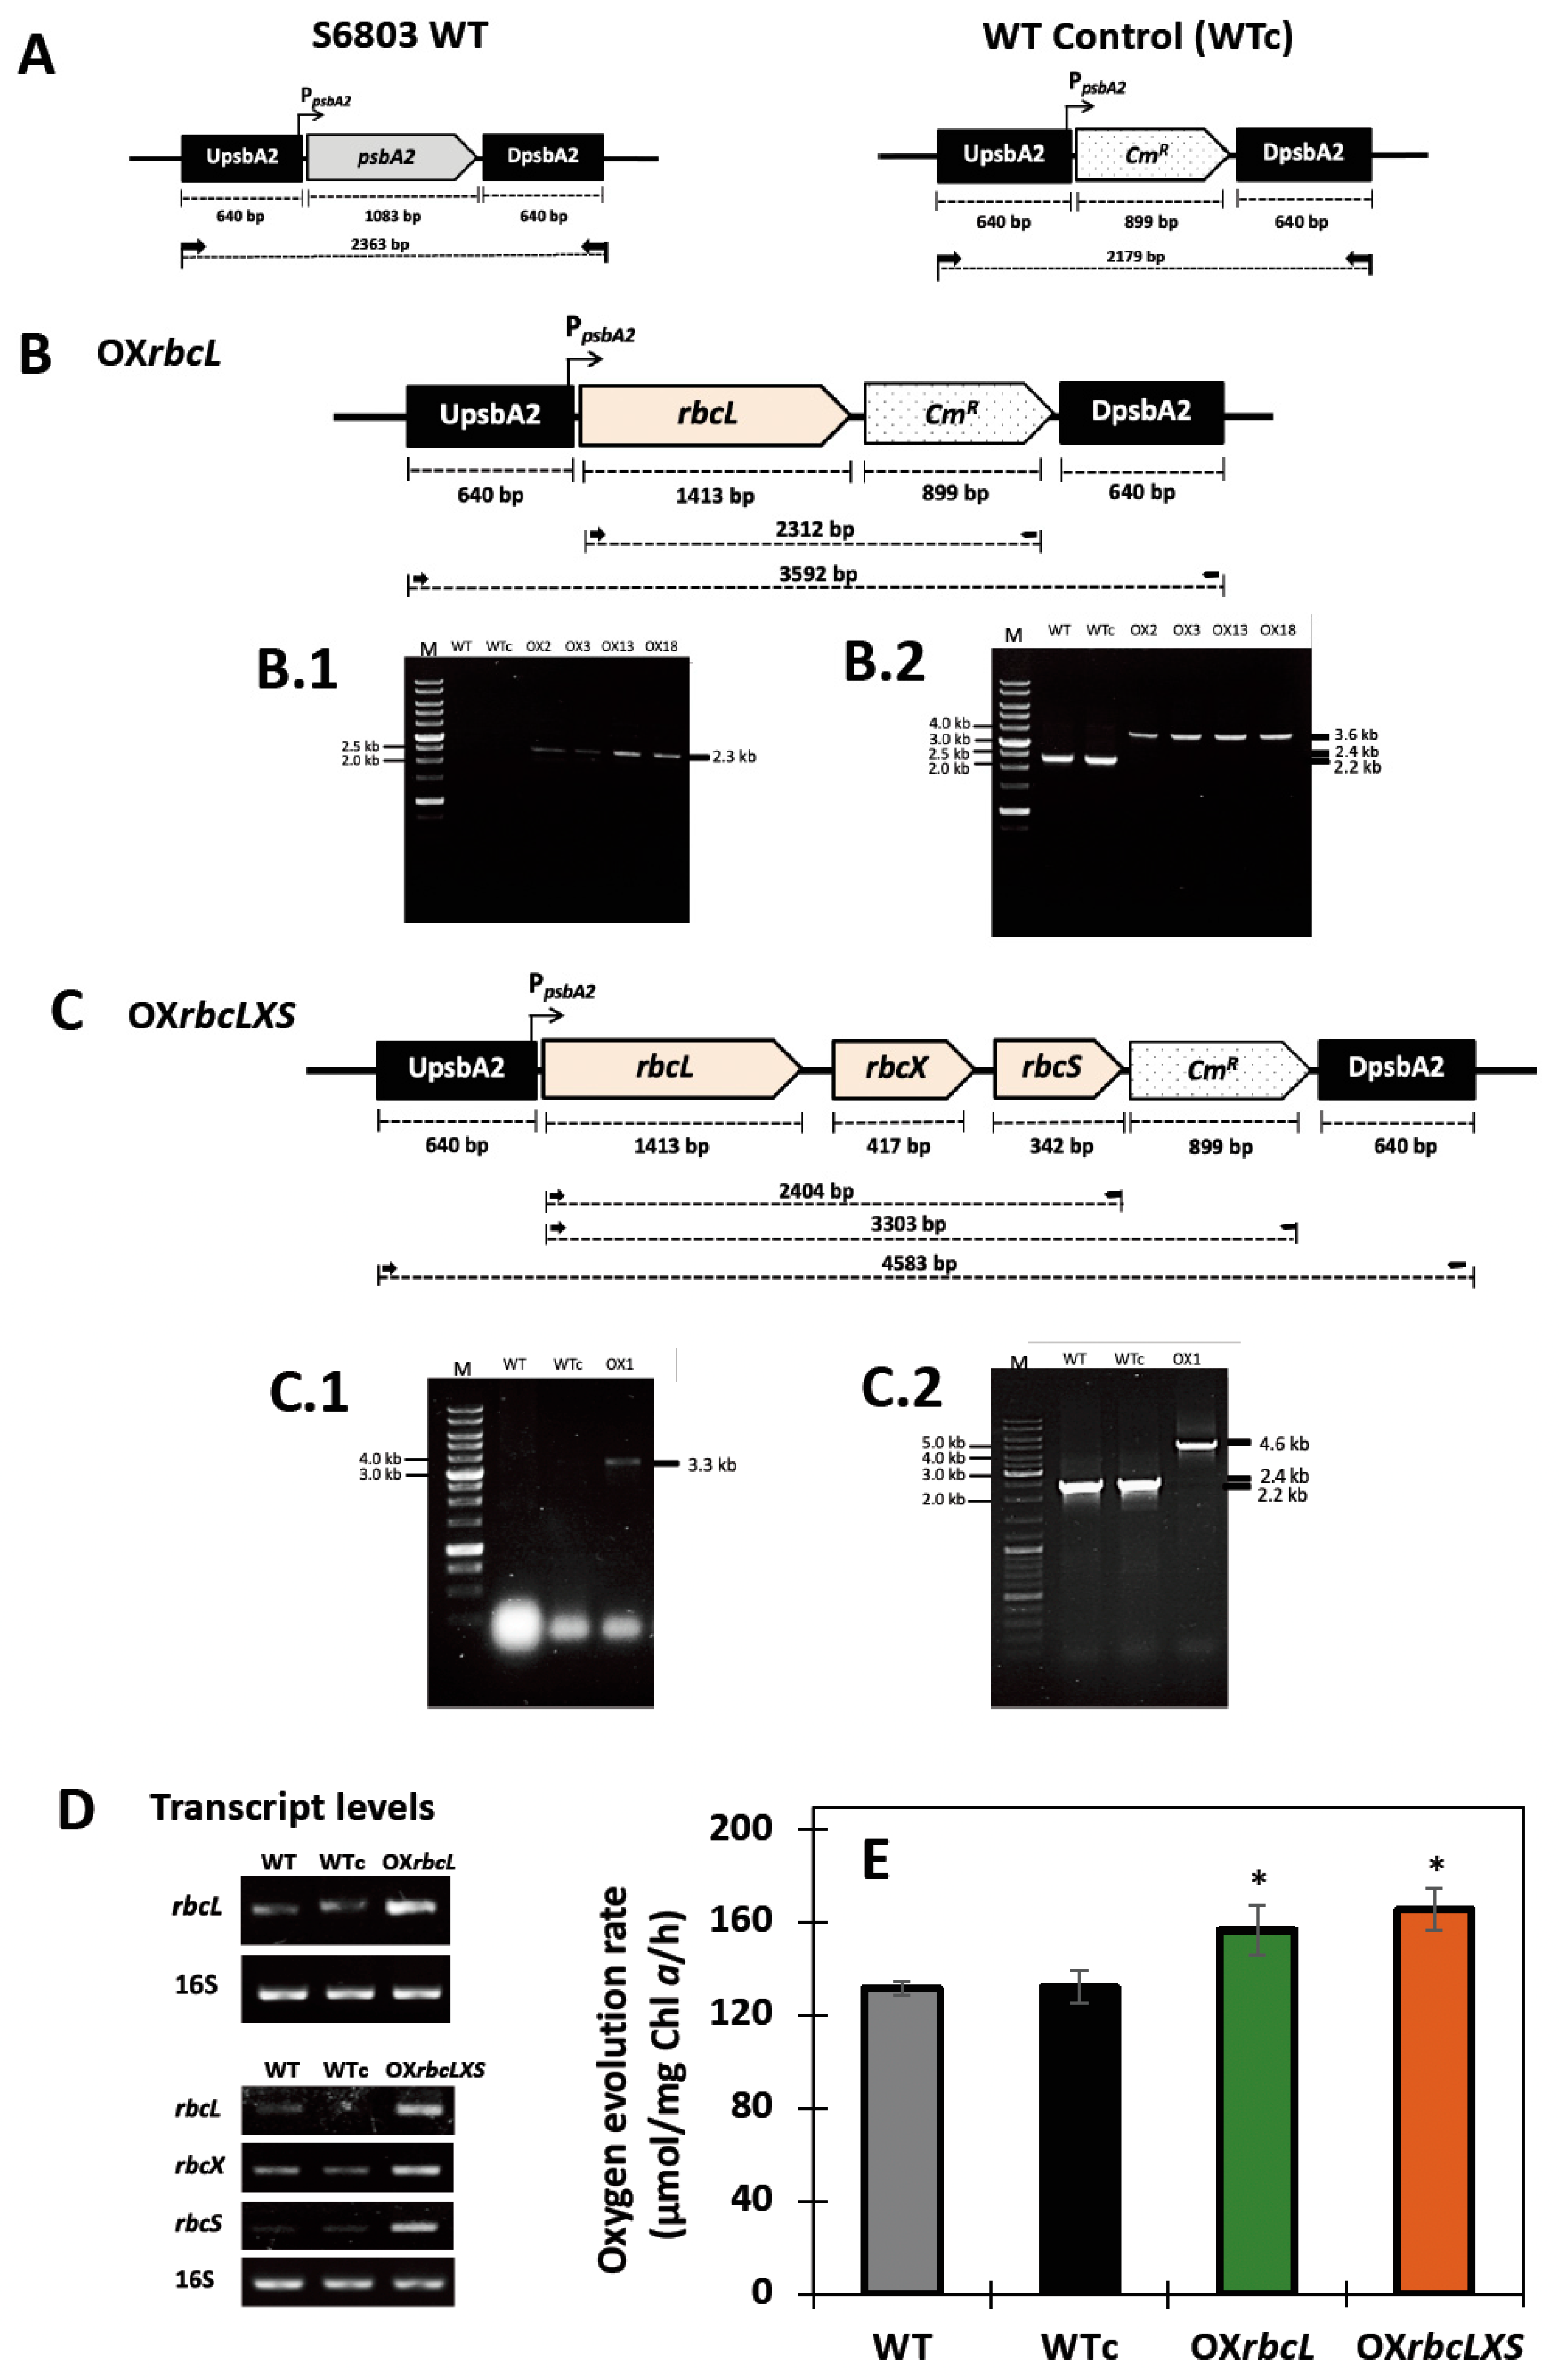
2.1. Overexpression of Native rbc Genes in Synechocystis sp. PCC 6803
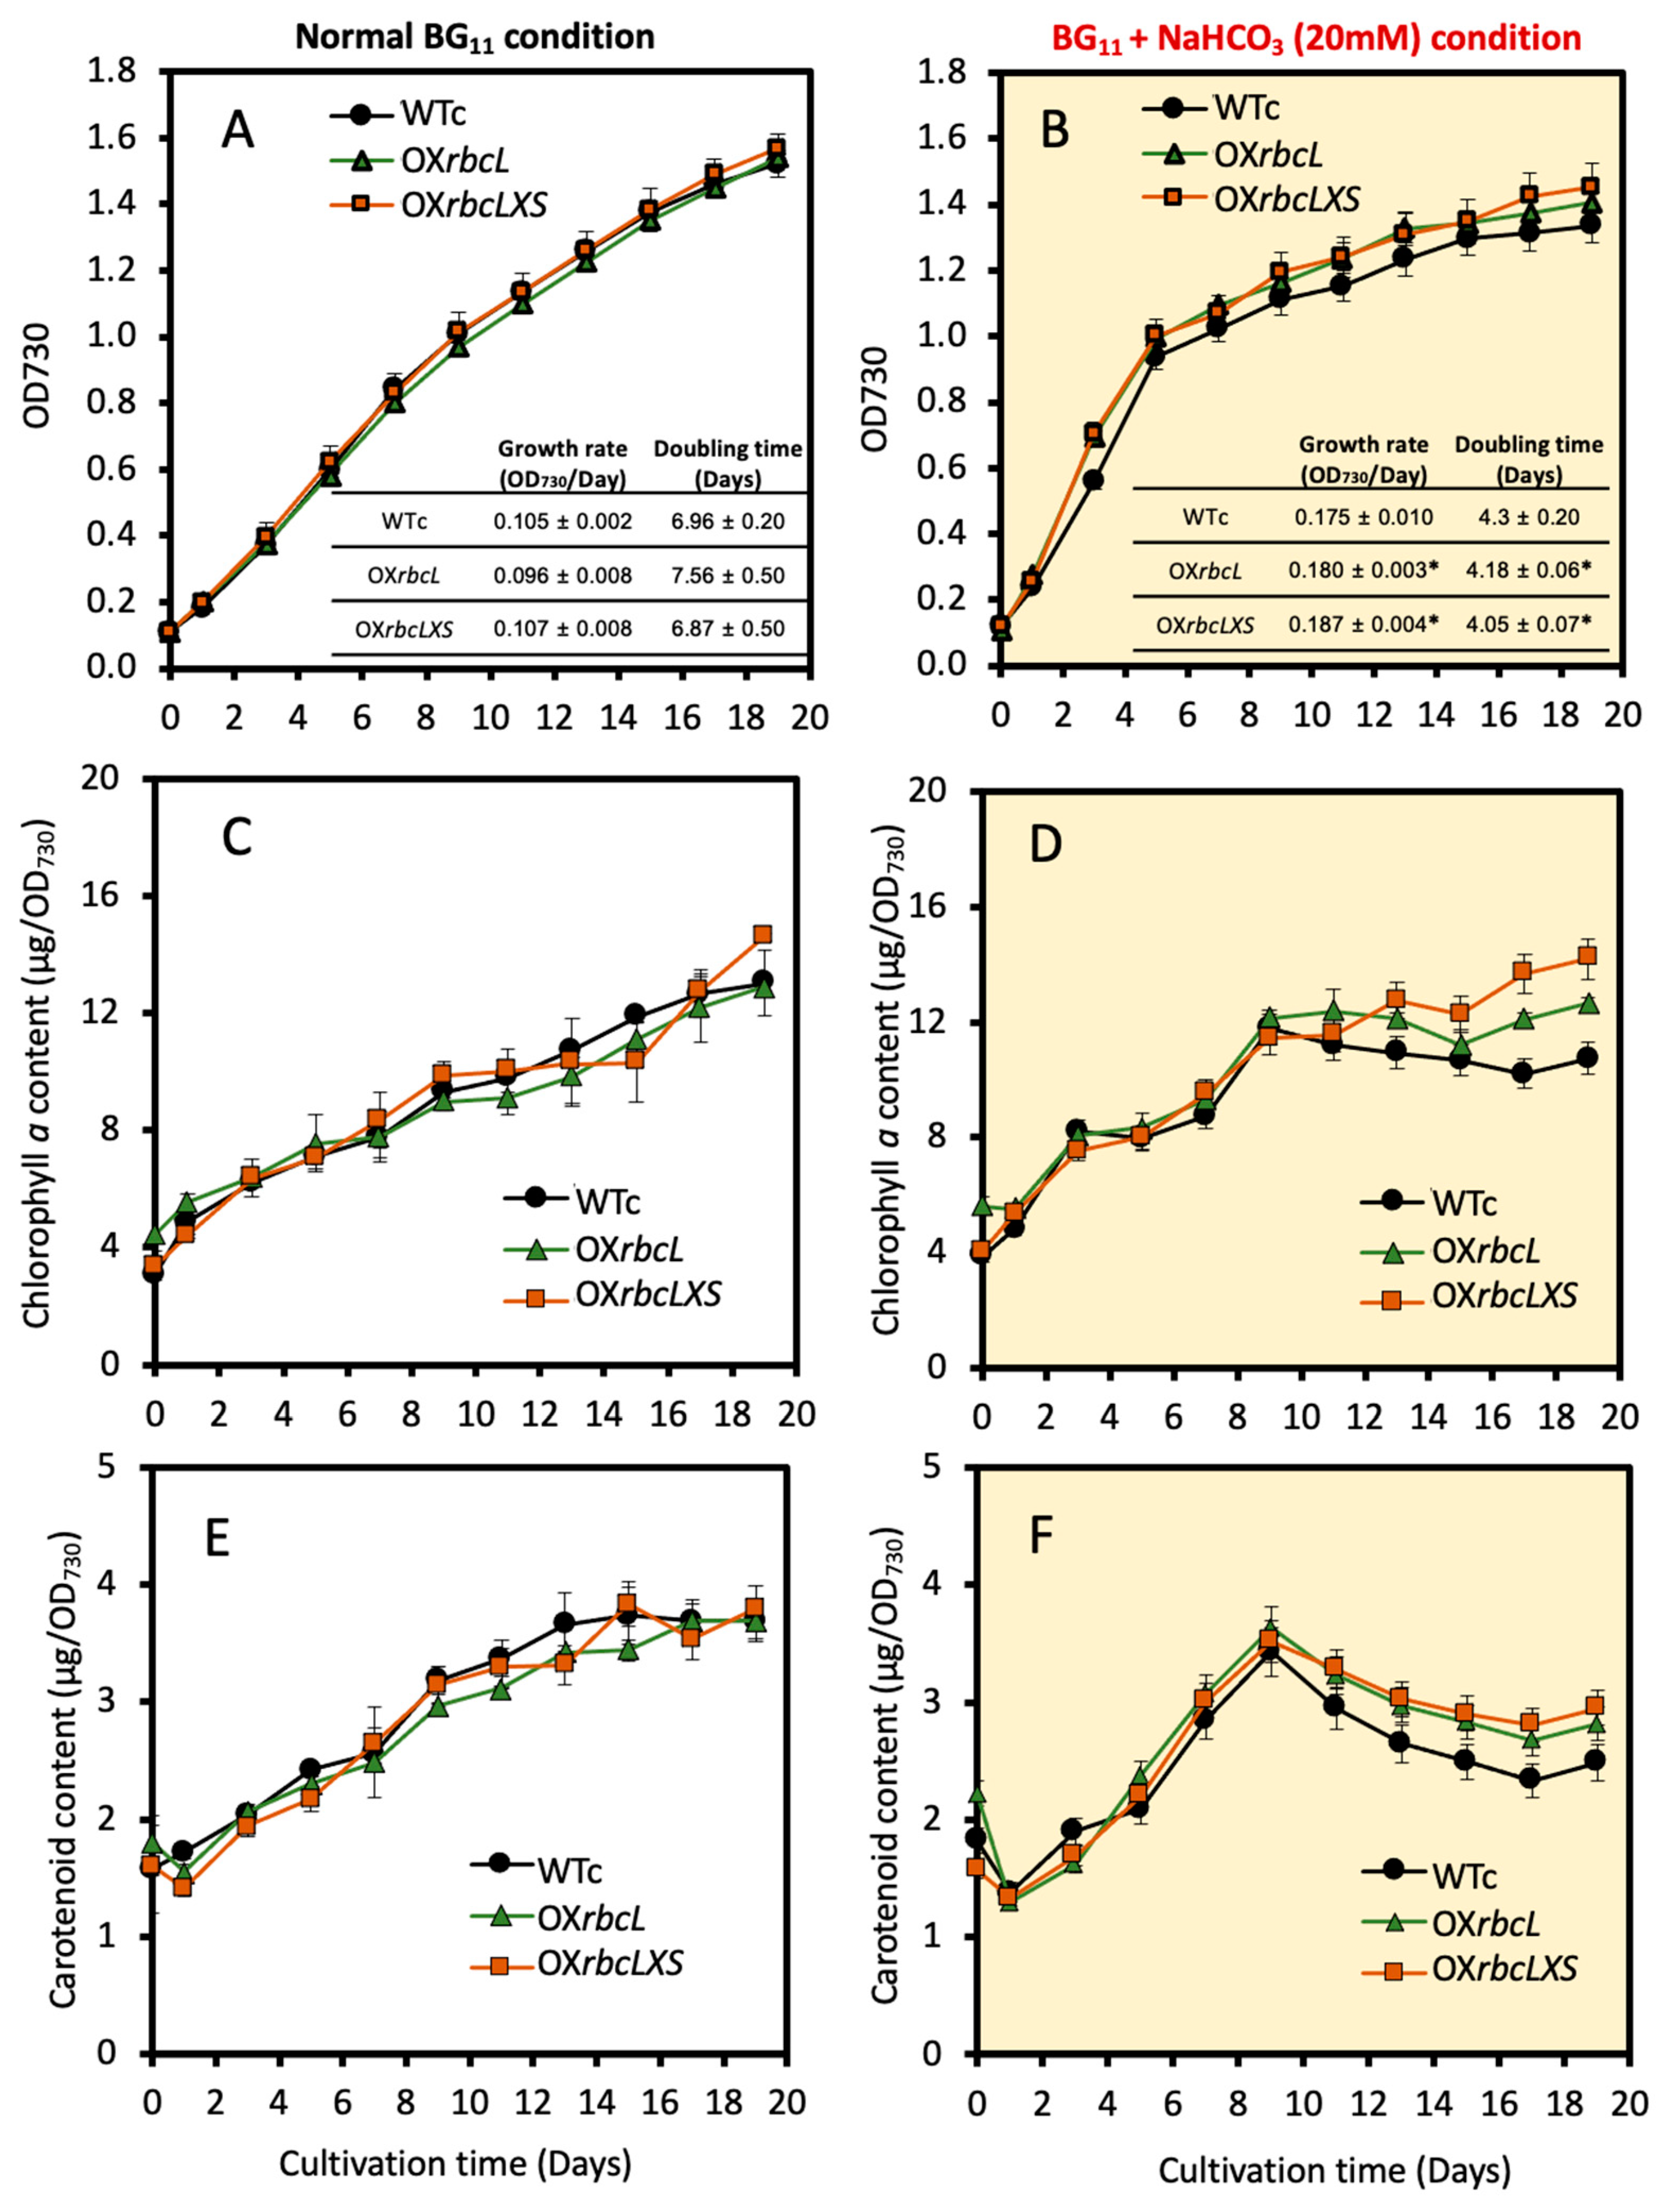
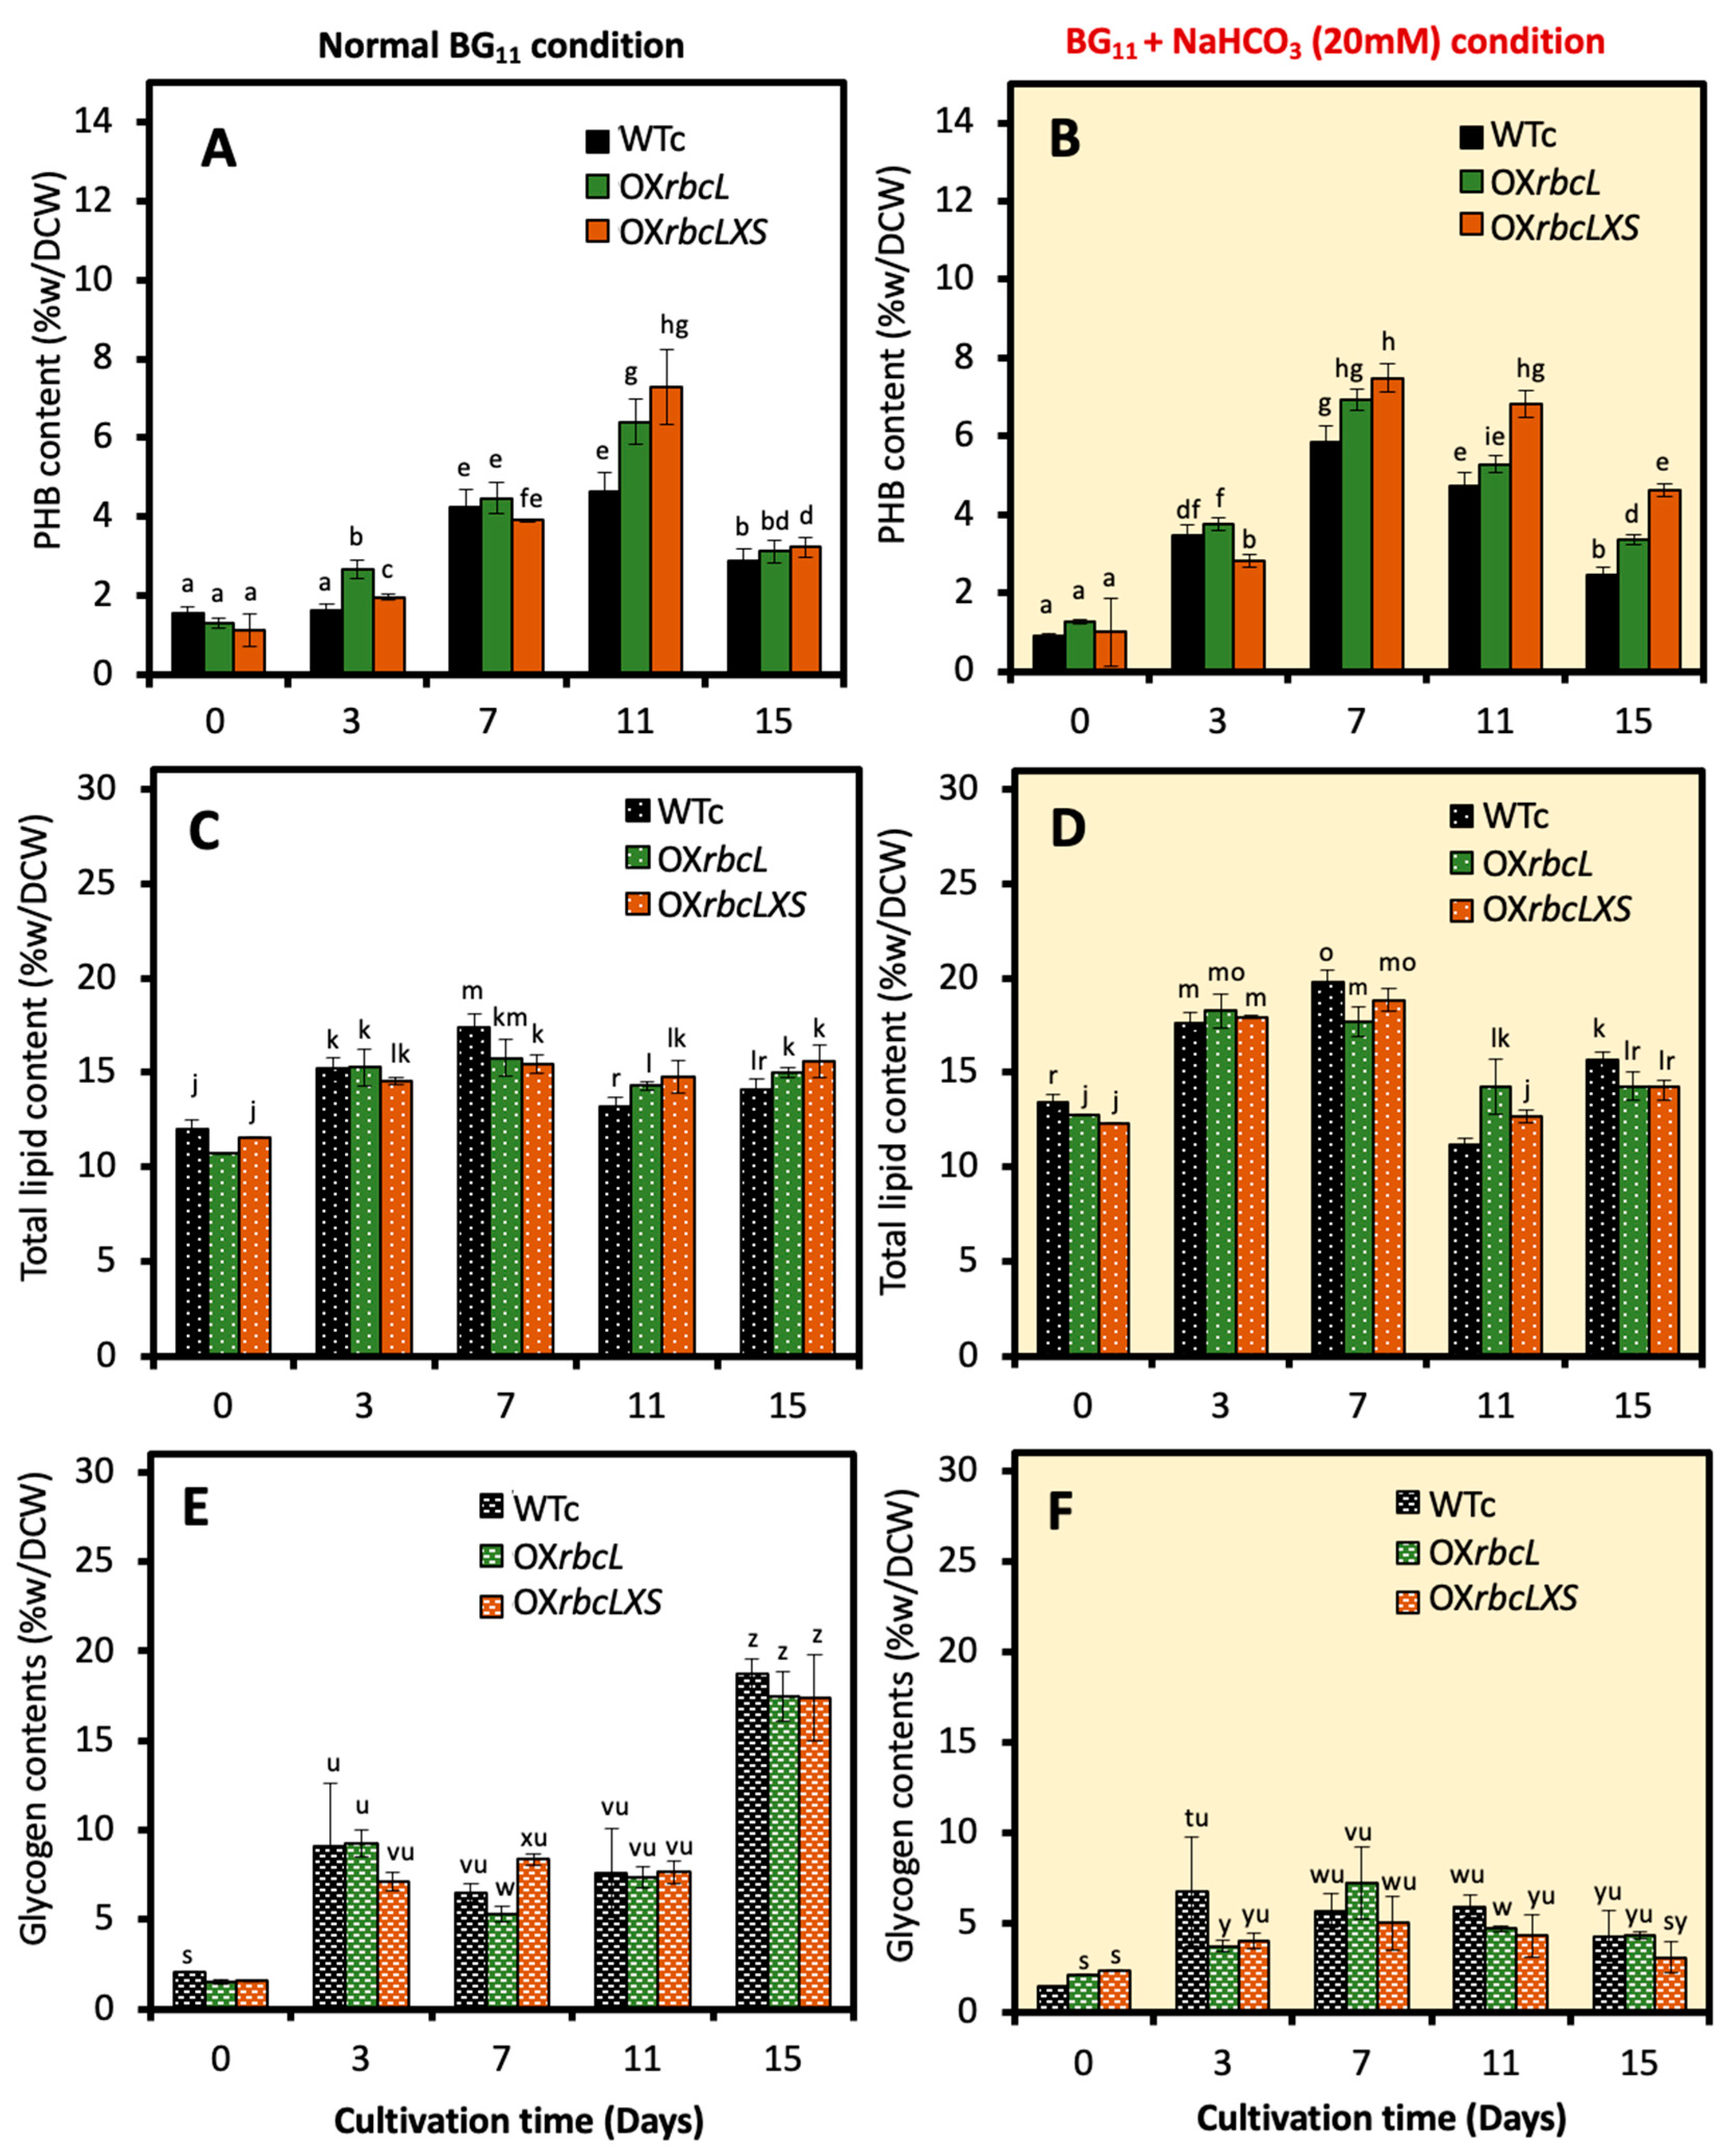
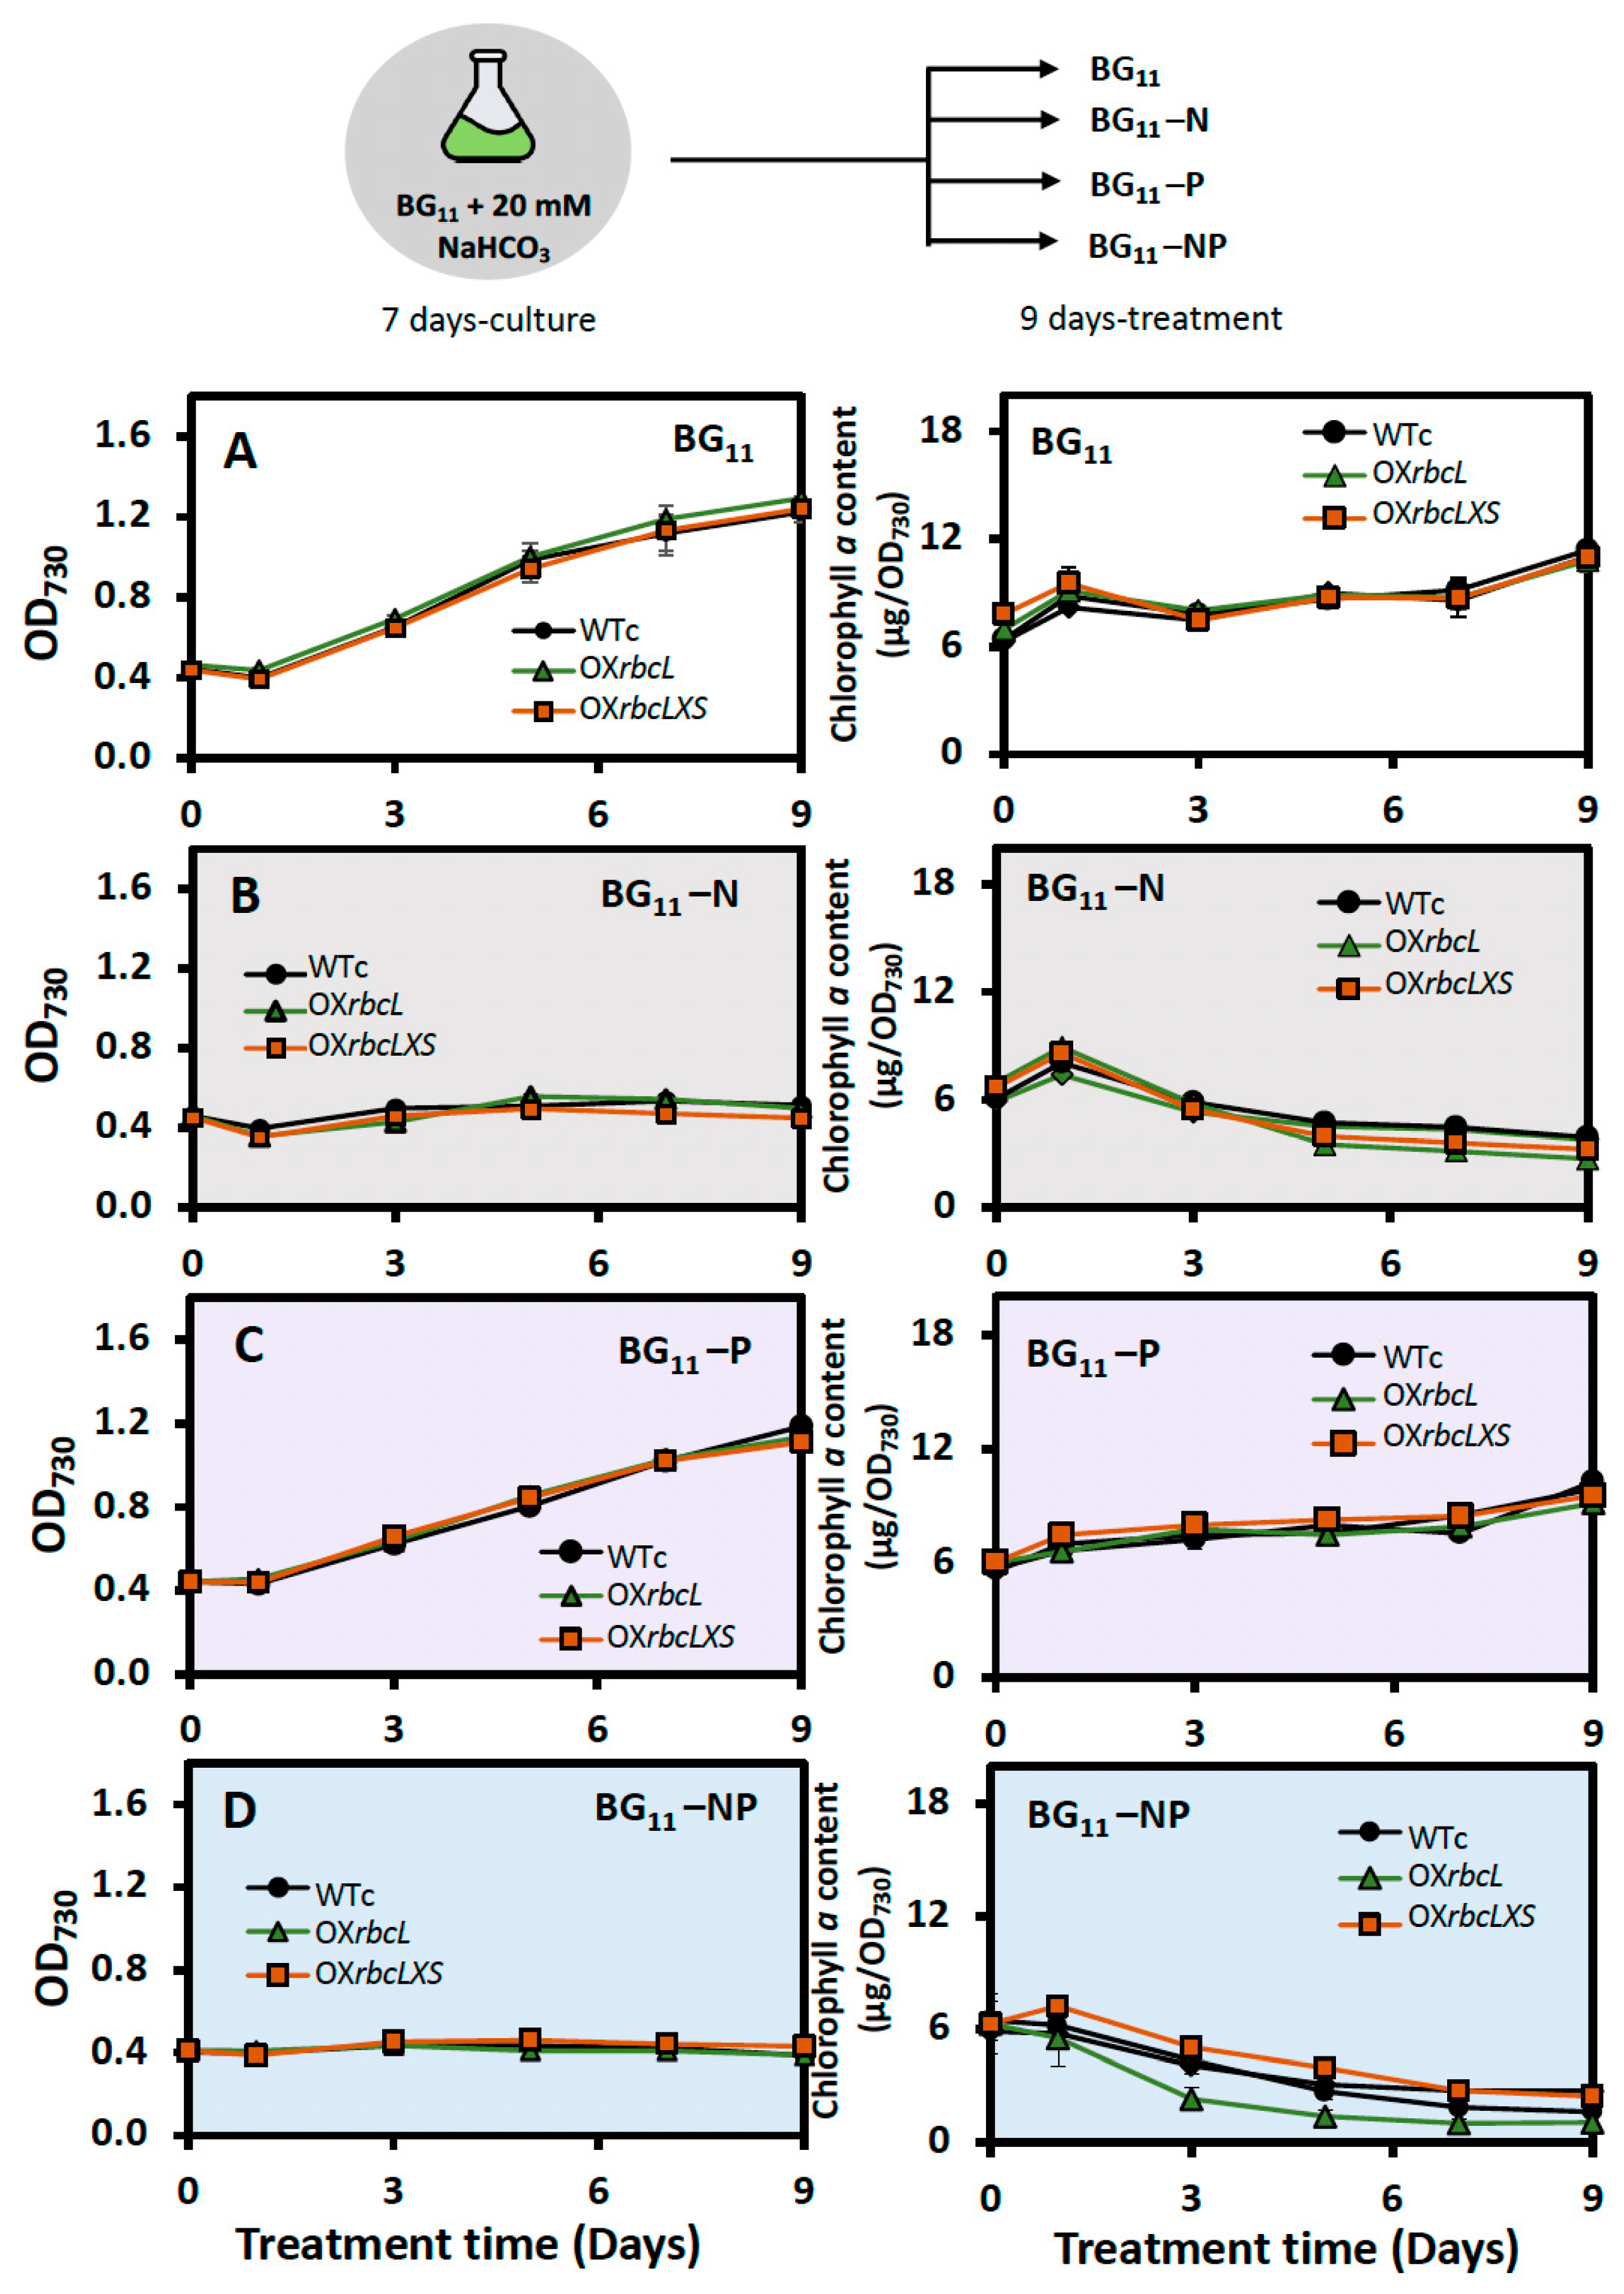
2.2. Growth, Intracellular Pigment Contents and PHB Accumulation under Bicarbonate Supplementation
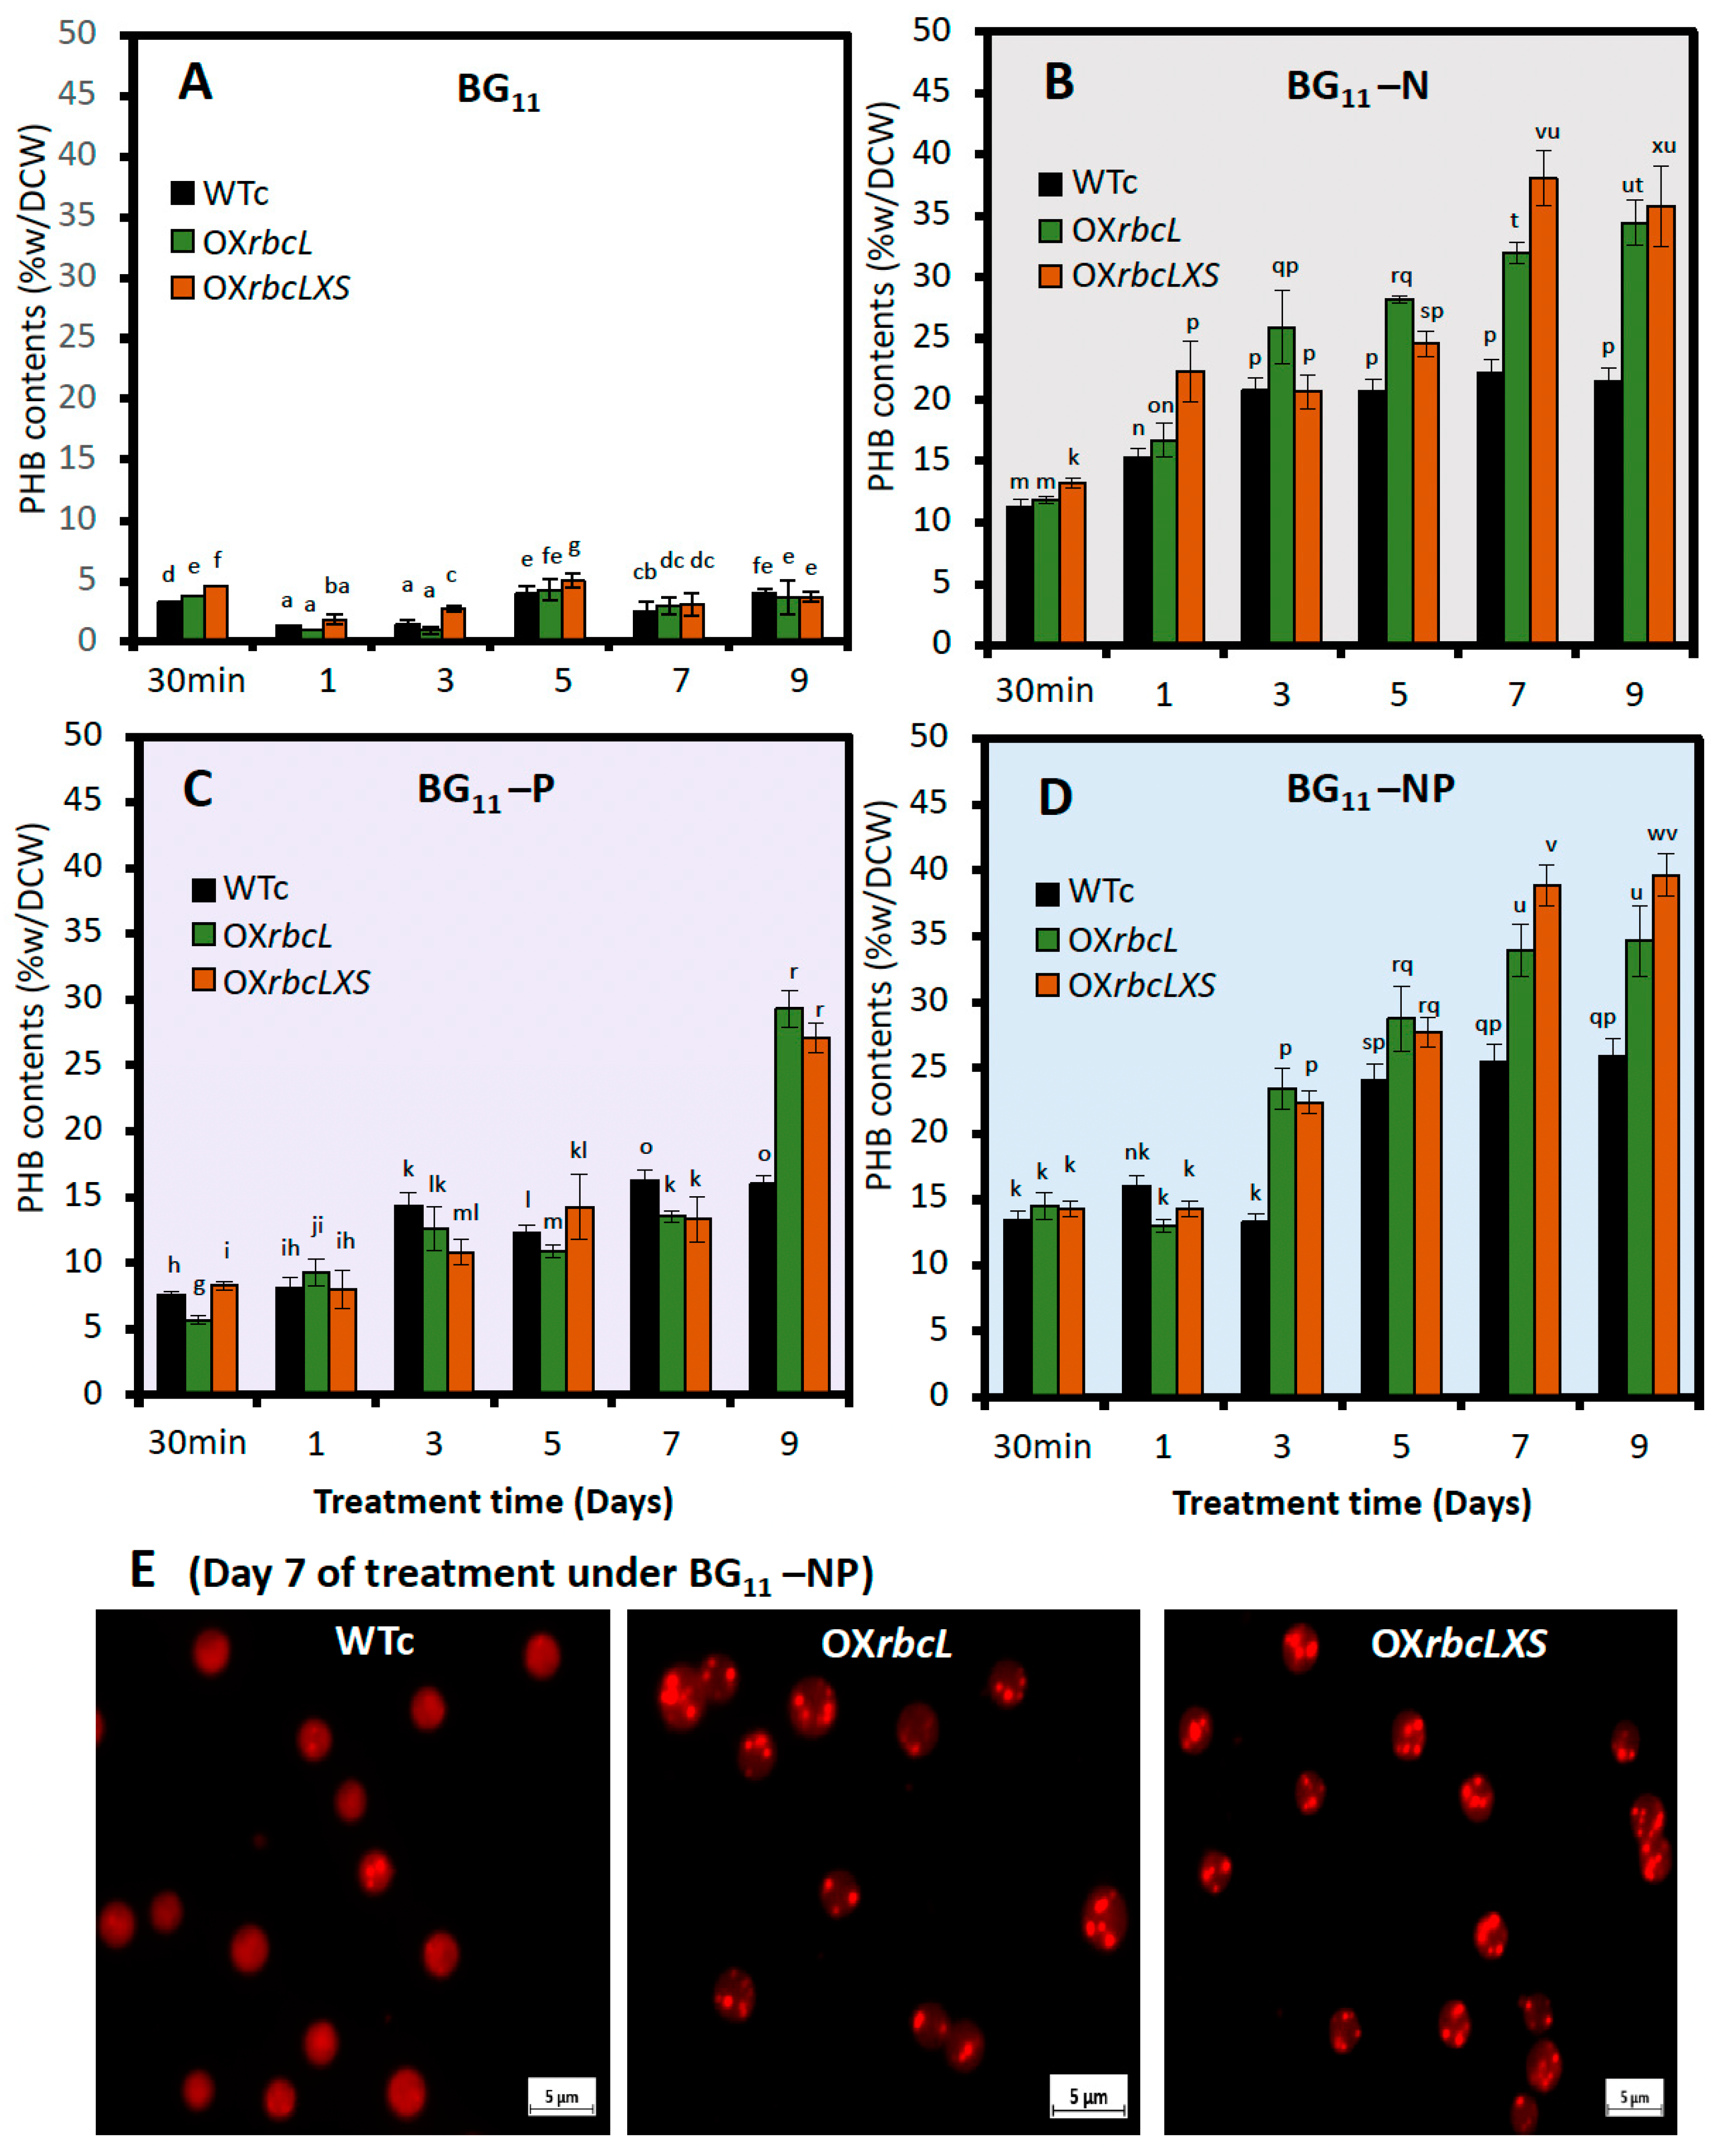
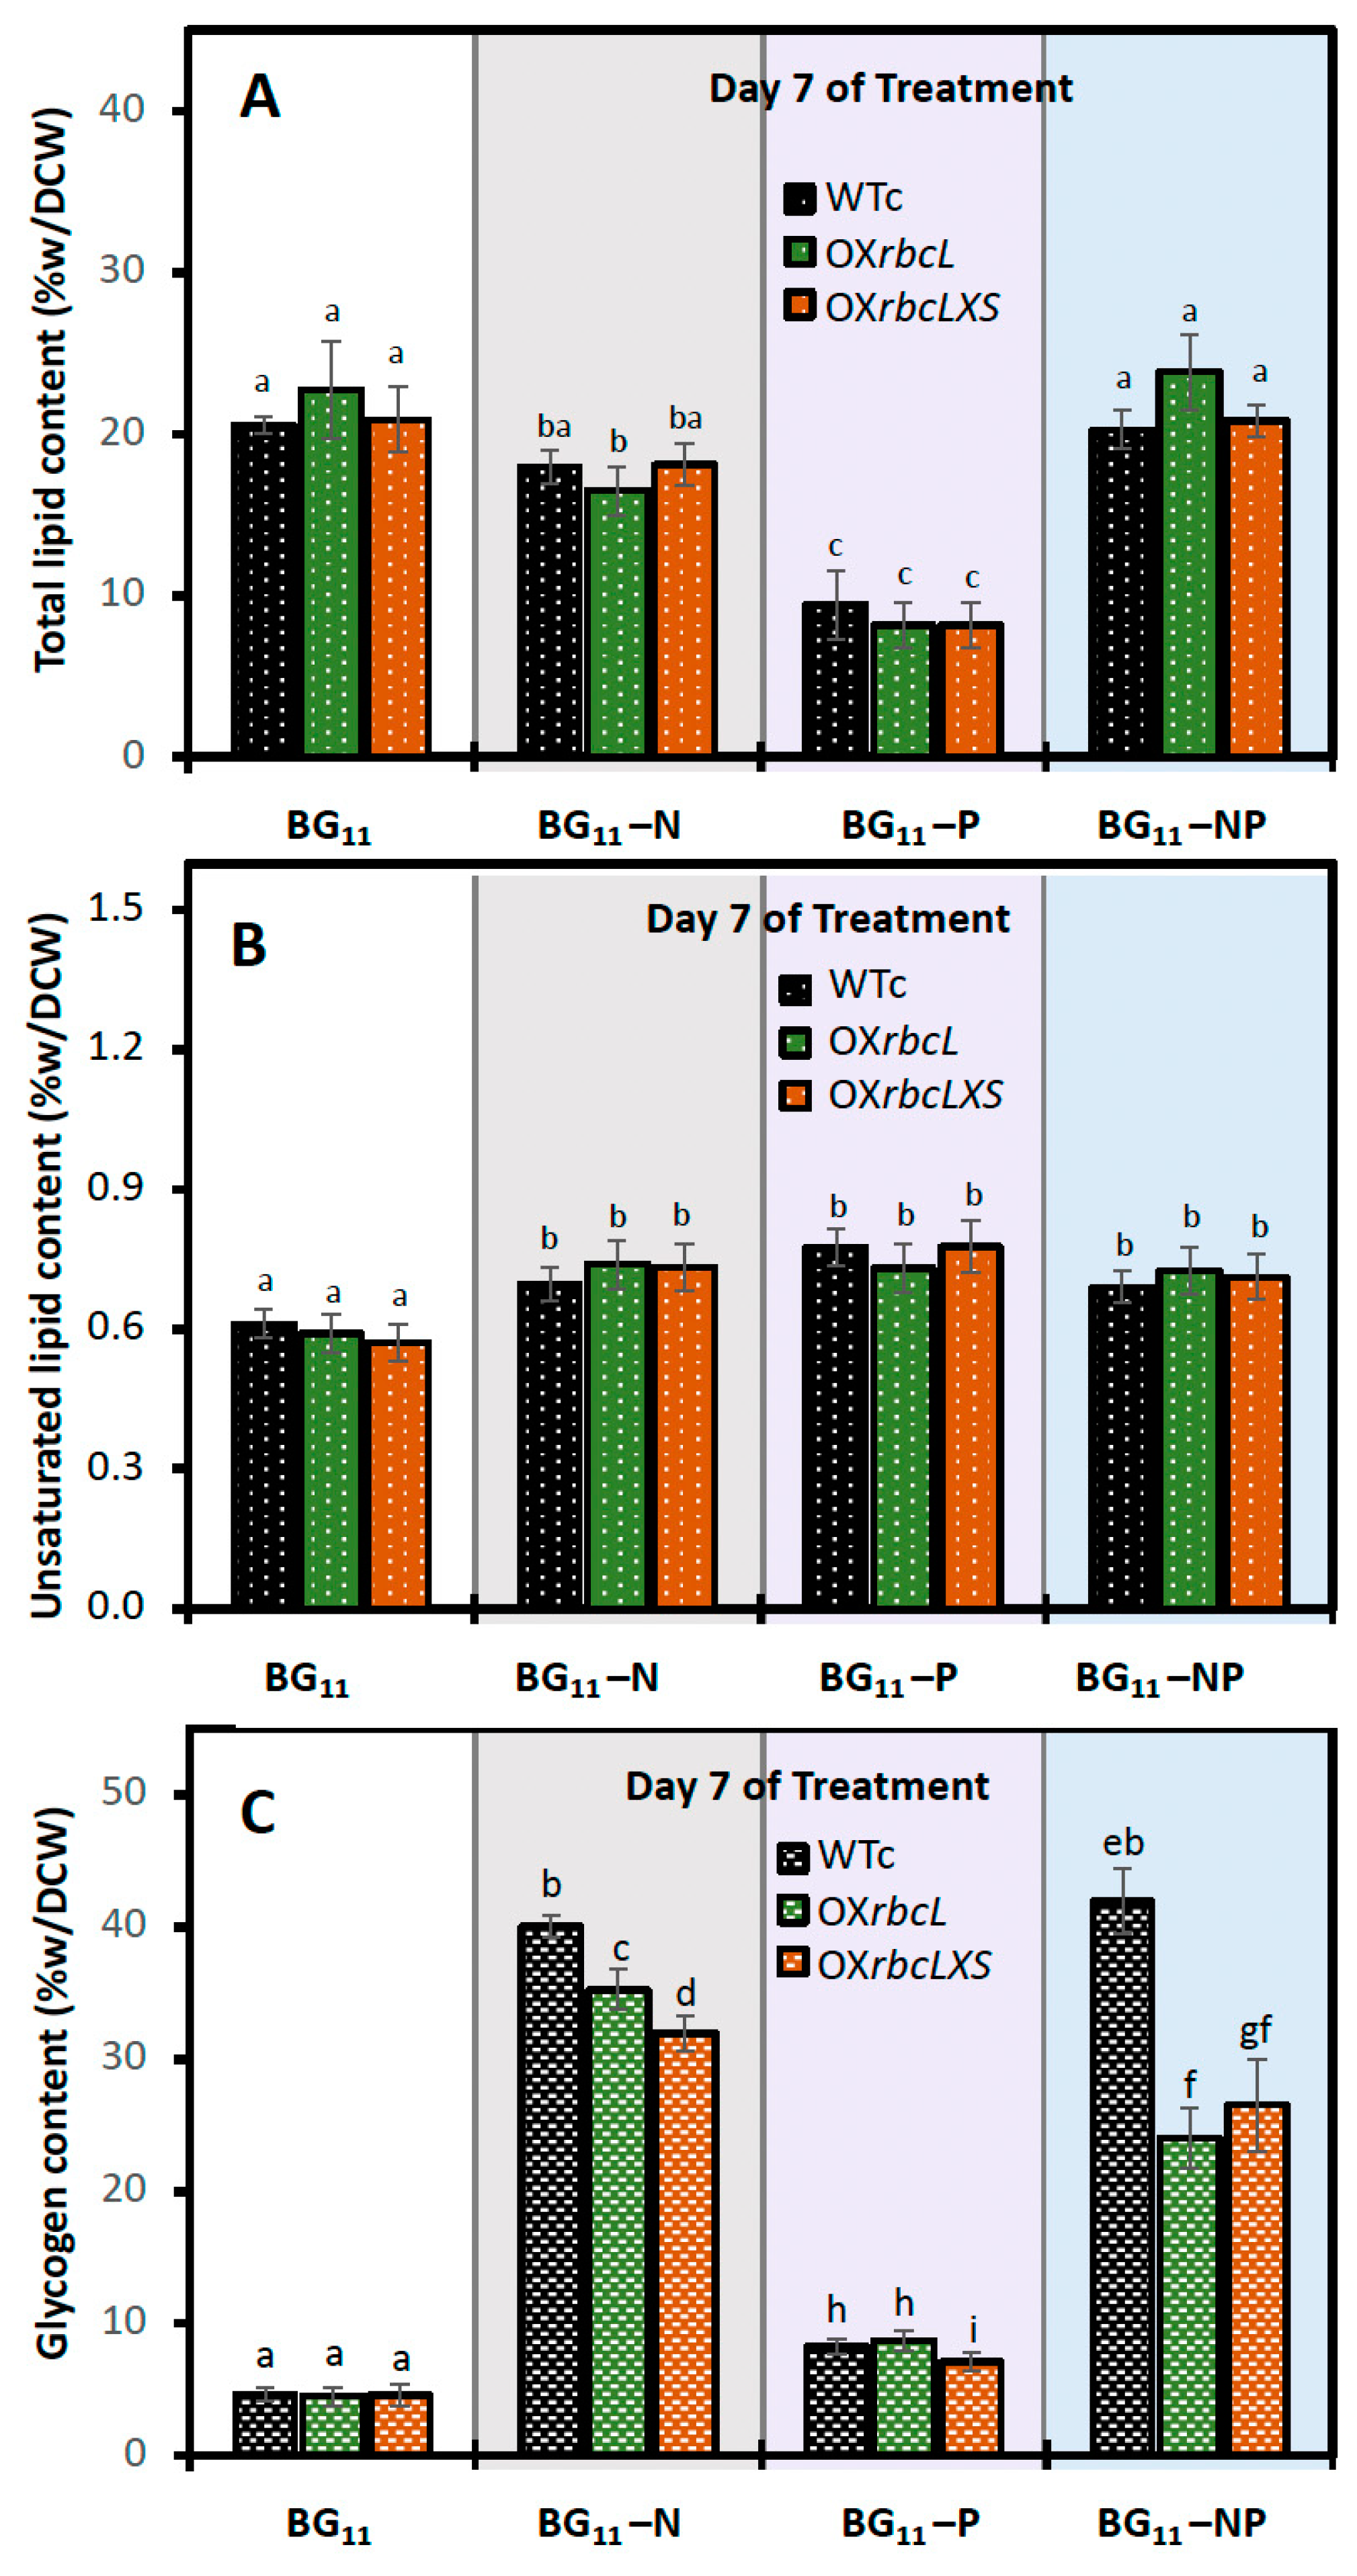
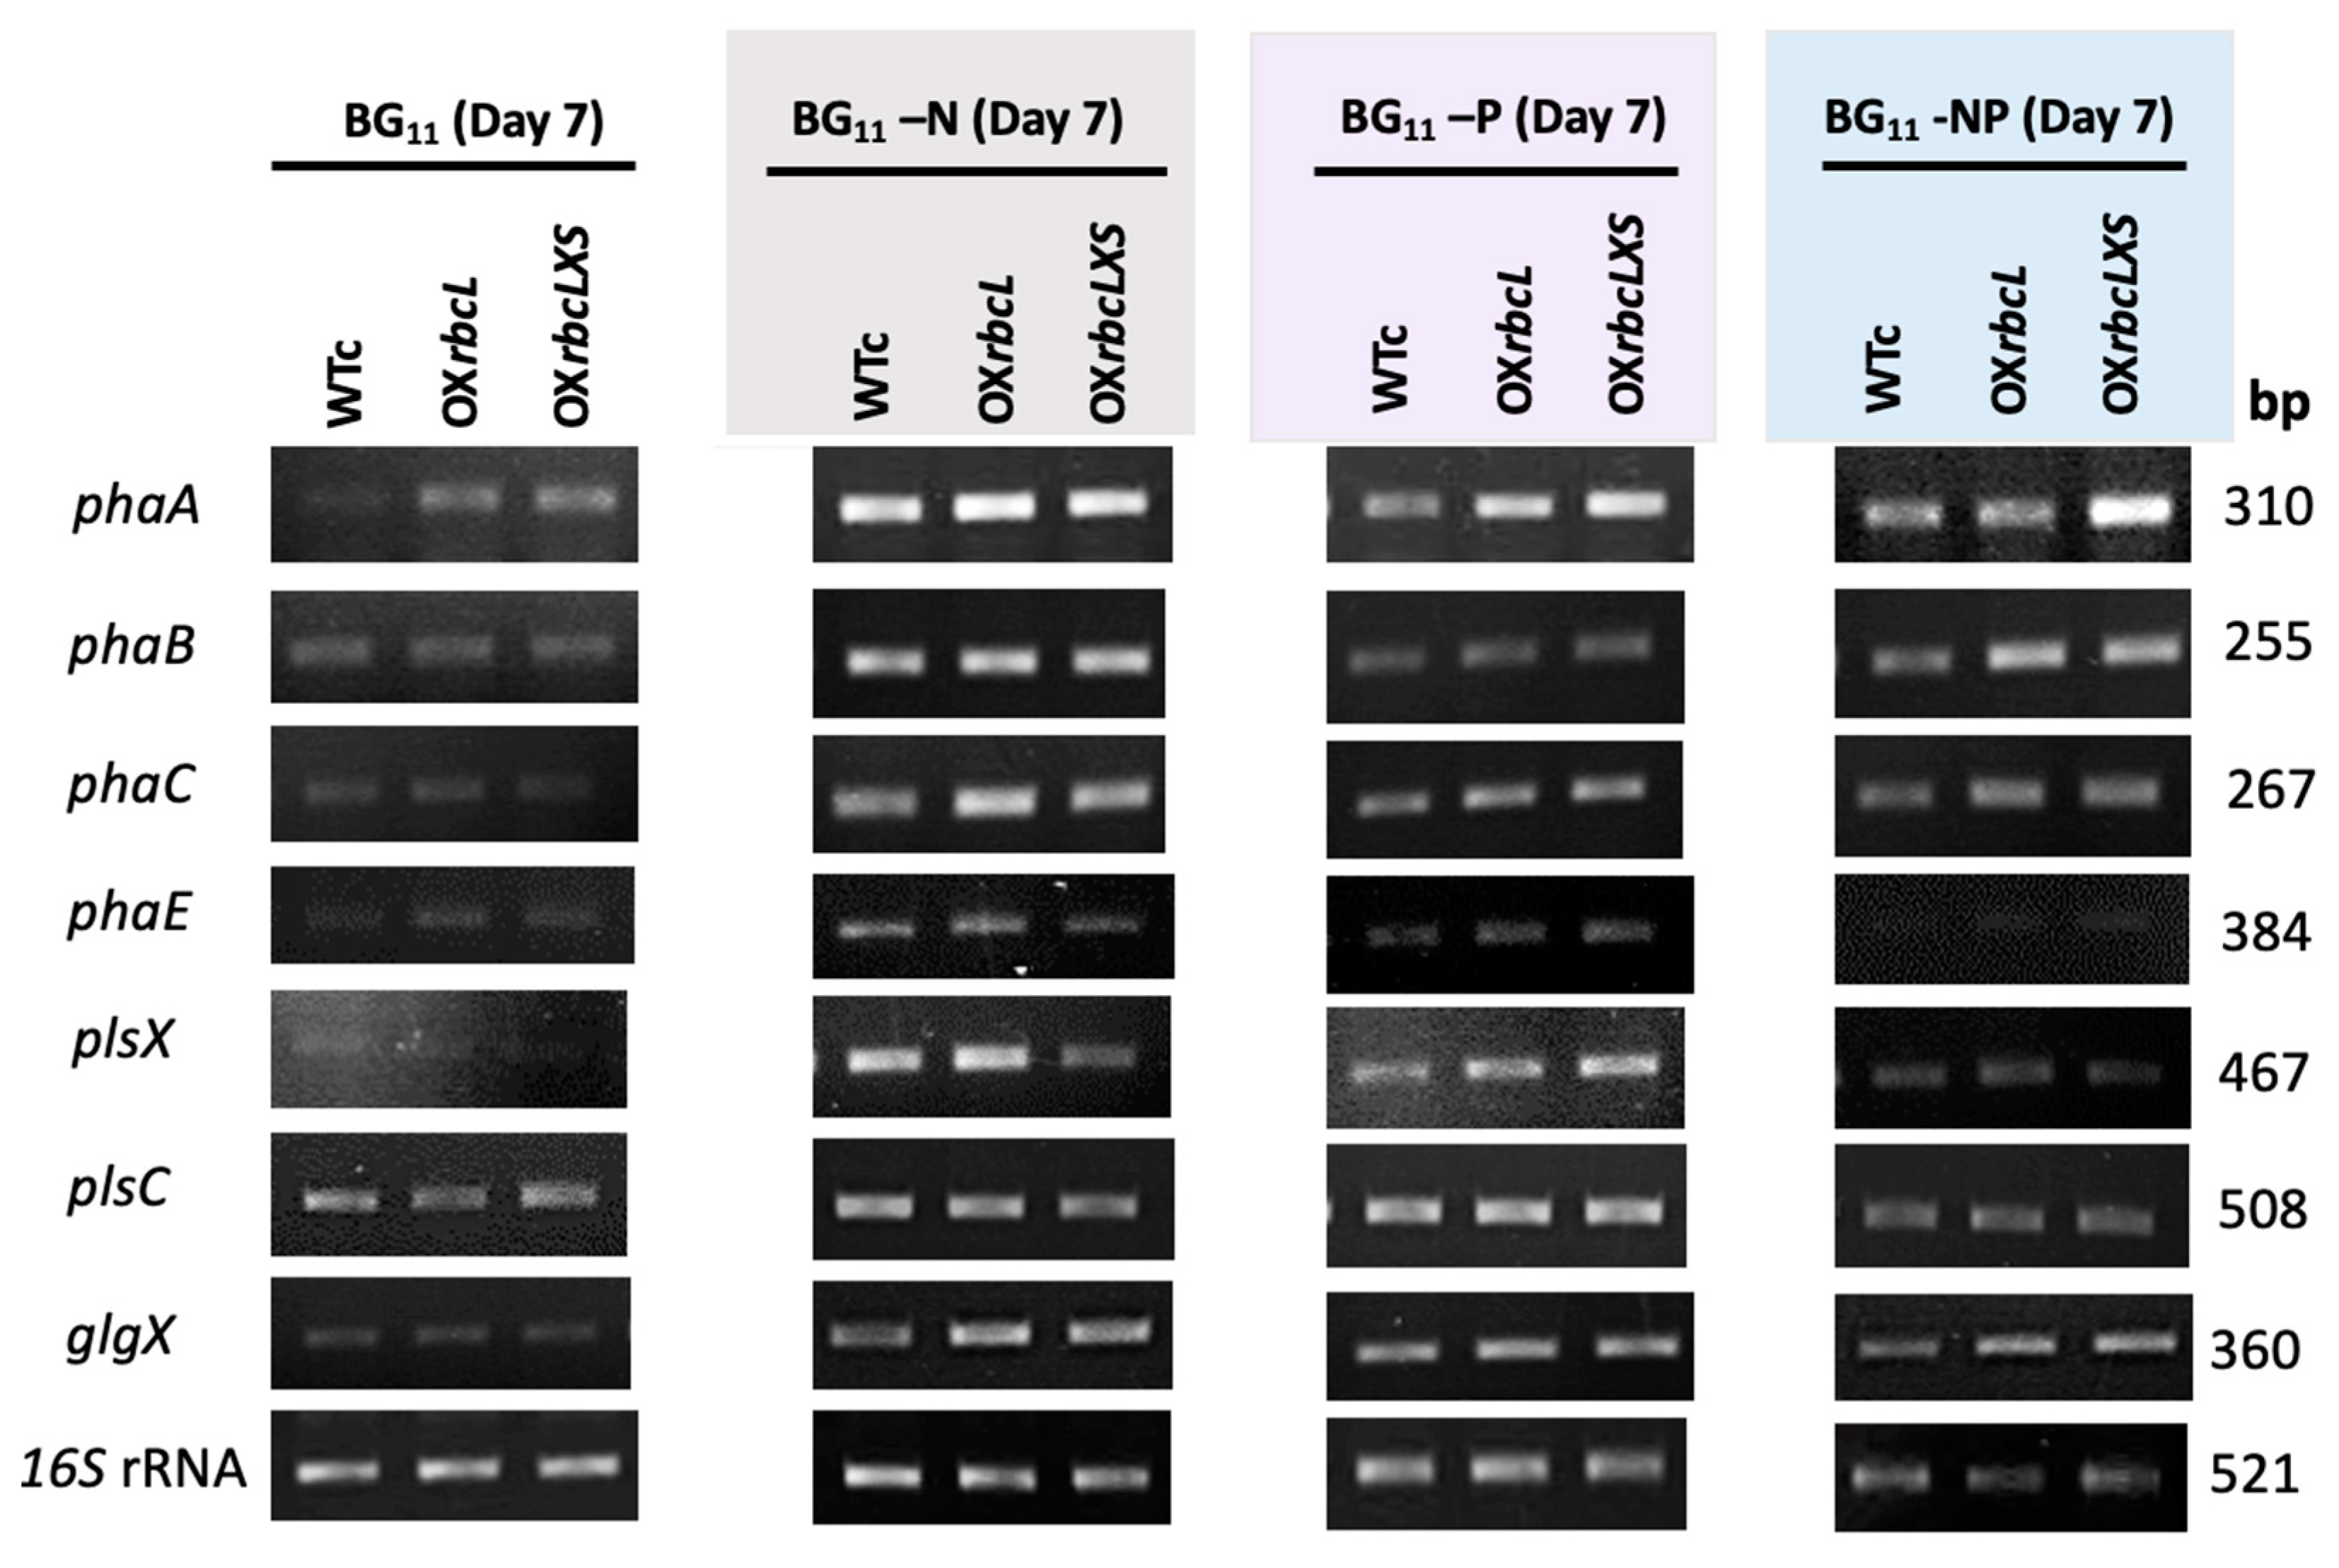
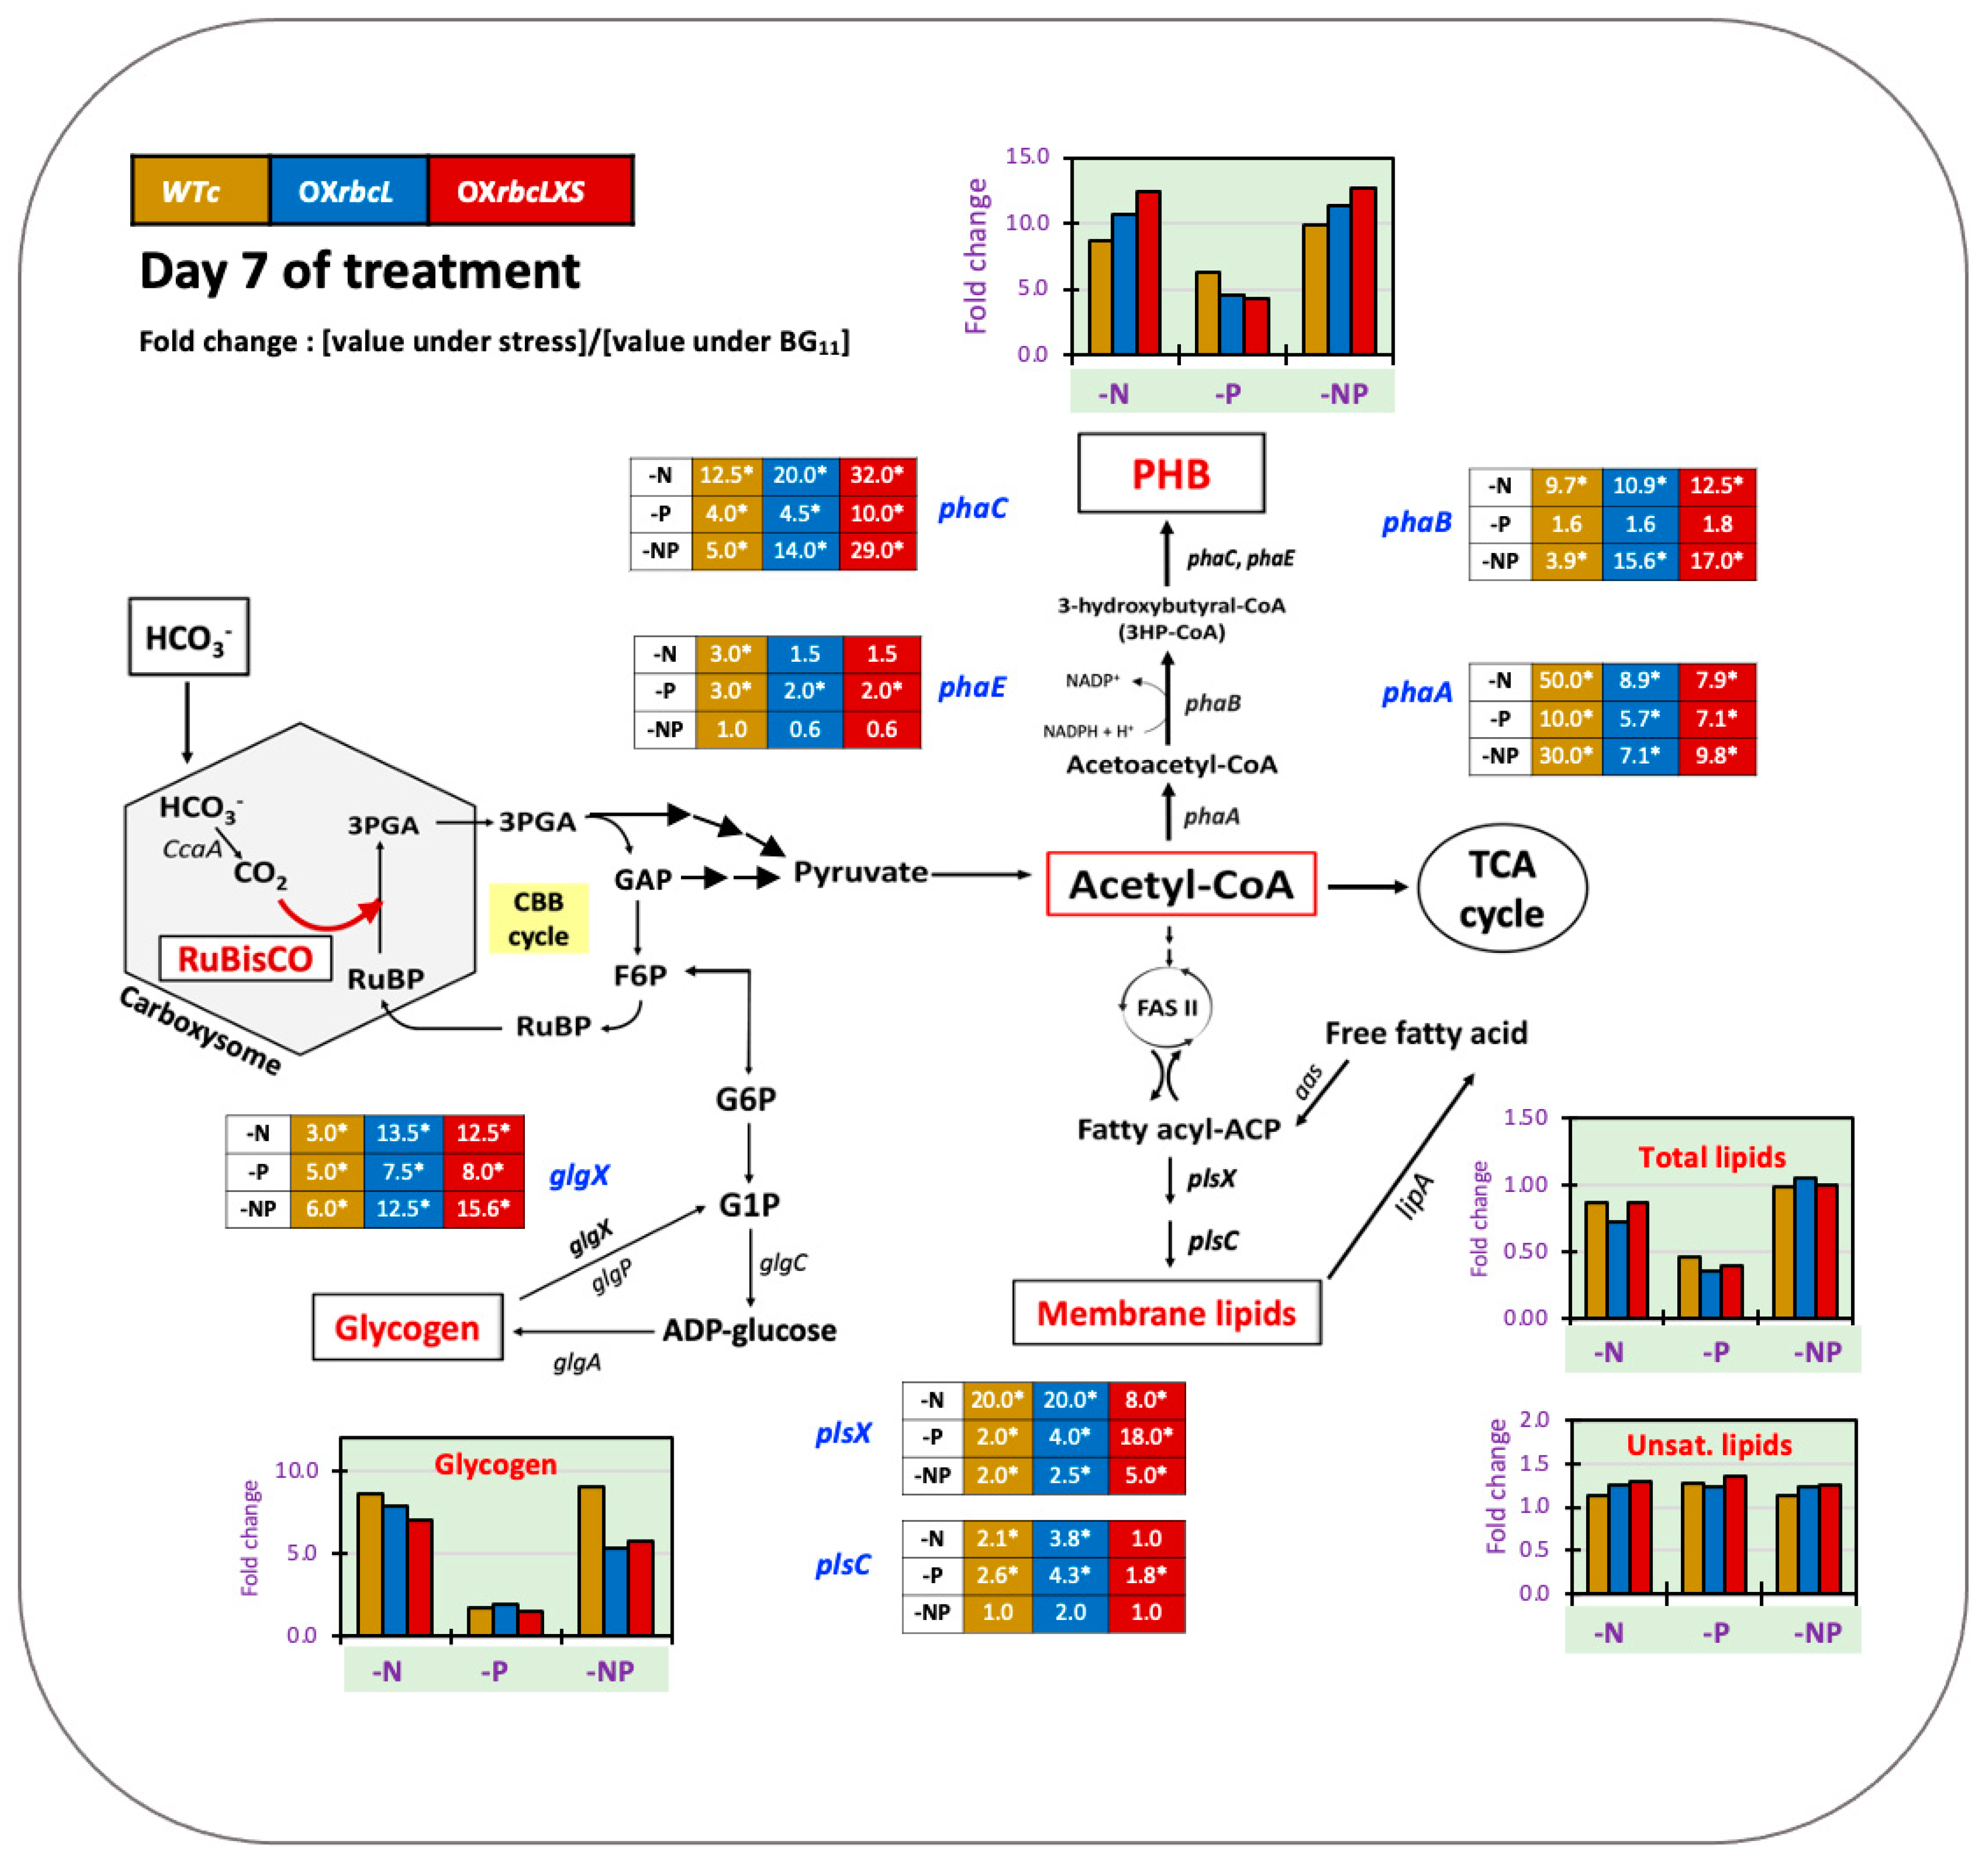
2.3. Growth and PHB Accumulation of Cells Treated under Nutrient-Deprived Conditions
3. Discussion
4. Materials and Methods
4.1. Construction of rbc-Overexpressing Synechocystis sp. PCC 6803
4.2. Strains and Culture Conditions
4.3. Determinations of Intracellular Pigments and Oxygen Evolution Rate
4.4. Total RNAs Extraction and Reverse Transcription-Polymerase Chain Reaction (RT-PCR)
4.5. Quantitative Analysis of PHB Contents
4.6. Lipid Extraction and Determinations of Total Lipid and Unsaturated Lipid Contents
4.7. Glycogen Extraction and Determination of Glycogen Content
5. Conclusions
Supplementary Materials
Author Contributions
Funding
Institutional Review Board Statement
Informed Consent Statement
Data Availability Statement
Acknowledgments
Conflicts of Interest
Abbreviations
| Car | carotenoids |
| CBB | the Calvin–Benson–Bassham cycle |
| Chl a | chlorophyll a |
| CO2 | carbon dioxide |
| DCW | dry cell weight |
| DMF | N,N-dimethylformamide |
| E. coli | Escherichia coli |
| h | hour |
| m | meter |
| μg | microgram |
| μL | microliter |
| mL | milliliter |
| mM | millimolar |
| nm | nanometer |
| OD | optical density |
| OX | overexpressing strain |
| PCR | polymerase chain reaction |
| PHB | polyhydroxybutyrate |
| rbc | RuBisCO |
| RuBisCO | ribulose-1,5-bisphosphate carboxylase/oxygenase |
| rpm | revolutions per minute |
| s | second |
| WT | wild type |
| WTc | wild type control |
References
- Rippka, R.; Deruelles, J.; Waterbury, J.B.; Herdman, M.; Stanier, R.Y. Generic assignments, strain histories and properties of pure cultures of cyanobacteria. J. Gen. Microbiol. 1979, 111, 1–61. [Google Scholar] [CrossRef] [Green Version]
- Stanier, R.Y.; Kunisawa, R.; Mandel, M.; Cohen-Bazire, G. Purification and properties of unicellular blue-green alga (order Chroococcales). Bacteriol. Rev. 1971, 35, 171–205. [Google Scholar] [CrossRef] [PubMed]
- Ikeuchi, M.; Tabata, S. Synechocystis sp. PCC 6803–A useful tool in the study of the genetics of cyanobacteria. Photosyn. Res. 2001, 70, 73–83. [Google Scholar] [CrossRef] [PubMed]
- Quintana, N.; Van der Kooy, F.; Van de Rhee, M.D.; Voshol, G.P.; Verpoorte, R. Renewable energy from cyanobacteria: Energy production optimization by metabolic pathway engineering. Appl. Microbiol. Biotechnol. 2011, 91, 471–490. [Google Scholar] [CrossRef] [Green Version]
- Liang, F.; Englund, E.; Lindberg, P.; Lindblad, P. Engineered cyanobacteria with enhanced growth show increased ethanol production and higher biofuel to biomass ratio. Metab. Eng. 2018, 46, 51–59. [Google Scholar] [CrossRef]
- Choi, S.P.; Nguyen, M.T.; Sim, S.J. Enzymatic pretreatment of Chlamydomonas reinhardtii biomass for ethanol production. Bioresour. Technol. 2010, 101, 5330–5336. [Google Scholar] [CrossRef]
- John, R.P.; Anisha, G.; Nampoothiri, K.M.; Pandey, A. Micro and macroalgal biomass: A renewable source for bioethanol. Bioresour. Technol. 2011, 102, 186–193. [Google Scholar] [CrossRef]
- Aikawa, S.; Joseph, A.; Yamada, R.; Izumi, Y.; Yamagishi, T.; Matsuda, F.; Kawai, H.; Chang, J.S.; Hasunuma, T.; Kondo, A. Direct conversion of Spirulina to ethanol without pretreatment or enzymatic hydrolysis processes. Energy Environ. Sci. 2013, 6, 1844–1849. [Google Scholar] [CrossRef]
- Möllers, K.B.; Cannella, D.; Jørgensen, H.; Frigaard, N.U. Cyanobacterial biomass as carbohydrate and nutrient feedstock for bioethanol production by yeast fermentation. Biotechnol. Biofuels 2014, 7, 64. [Google Scholar] [CrossRef] [Green Version]
- Zhang, A.; Carroll, A.L.; Atsumi, S. Carbon recycling by cyanobacteria: Improving CO2 fixation through chemical production. FEMS Microbiol. Lett. 2017, 364, fnx165. [Google Scholar] [CrossRef] [Green Version]
- Liang, F.; Lindblad, P. Synechocystis PCC 6803 overexpressing RuBisCO grow faster with increased photosynthesis. Metab. Eng. Commun. 2017, 4, 29–36. [Google Scholar] [CrossRef] [PubMed]
- Eungrasamee, K.; Incharoensakdi, A.; Lindblad, P.; Jantaro, S. Overexpression of lipA or glpD_RuBisCO in the Synechocystis sp. PCC 6803 mutant lacking the Aas gene enhances free fatty-acid secretion and intracellular lipid accumulation. Int. J. Mol. Sci. 2021, 22, 11468. [Google Scholar] [CrossRef] [PubMed]
- Atsumi, S.; Higashide, W.; Liao, J.C. Direct photosynthetic recycling of carbon dioxide to isobutyraldehyde. Nat. Biotechnol. 2009, 27, 1177–1180. [Google Scholar] [CrossRef]
- Ruffing, A.M. Improved free fatty acid production in cyanobacteria with Synechococcus sp. PCC 7002 as host. Front. Bioeng. Biotechnol. 2014, 2, 17. [Google Scholar] [CrossRef] [Green Version]
- Kanno, M.; Carroll, A.L.; Atsumi, S. Global metabolic rewiring for improved CO2 fixation and chemical production in cyanobacteria. Nat. Commun. 2017, 8, 14724. [Google Scholar] [CrossRef] [PubMed]
- Veaudor, T.; Blanc-Garin, V.; Chenebault, C.; Diaz-Santos, E.; Sassi, J.F.; Cassier-Chauvat, C.; Chauvat, F. Recent advances in the photoautotrophic metabolism of cyanobacteria: Biotechnological Implications. Life 2020, 10, 71. [Google Scholar] [CrossRef]
- Price, G.D. Inorganic carbon transporters of the cyanobacterial CO2 concentrating mechanism. Photosyn. Res. 2011, 109, 47–57. [Google Scholar] [CrossRef]
- Wang, C.; Sun, B.; Zhang, X.; Huang, X.; Zhang, M.; Guo, H.; Chen, X.; Huang, F.; Chen, T.; Mi, H.; et al. Structural mechanism of the active bicarbonate transporter from cyanobacteria. Nat. Plants 2019, 5, 1184–1193. [Google Scholar] [CrossRef]
- Lee, T.C.; Xiong, W.; Paddock, T.; Carrieri, D.; Chang, I.F.; Chiu, H.F.; Ungerer, J.; Juo, S.H.H.; Maness, P.C.; Yu, J. Engineered xylose utilization enhances bio-products productivity in the cyanobacterium Synechocystis sp. PCC 6803. Metab. Eng. 2015, 30, 179–189. [Google Scholar] [CrossRef] [Green Version]
- Díaz-Troya, S.; López-Maury, L.; Sánchez-Riego, A.M.; Roldán, M.; Florencio, F.J. Redox regulation of glycogen biosynthesis in the cyanobacterium Synechocystis sp. PCC 6803: Analysis of the AGP and glycogen synthases. Mol. Plant 2014, 7, 87–100. [Google Scholar] [CrossRef] [Green Version]
- Luan, G.; Zhang, S.; Wang, M.; Lu, X. Progress and perspective on cyanobacterial glycogen metabolism engineering. Biotechnol. Adv. 2019, 37, 771–786. [Google Scholar] [CrossRef] [PubMed]
- Mittermair, S.; Lakatos, G.; Nicoletti, C.; Ranglová, K.; Manoel, J.C.; Grivalský, T.; Kozhan, D.M.; Masojídek, J.; Richter, J. Impact of glgA1, glgA2 or glgC overexpression on growth and glycogen production in Synechocystis sp. PCC 6803. J. Biotechnol. 2021, 340, 47–56. [Google Scholar] [CrossRef] [PubMed]
- Koch, M.; Doello, S.; Gutekunst, K.; Forchhammer, K. PHB is produced from glycogen turn-over during nitrogen starvation in Synechocystis sp. PCC 6803. Int. J. Mol. Sci. 2019, 20, 1942. [Google Scholar] [CrossRef] [PubMed] [Green Version]
- Utharn, S.; Yodsang, P.; Incharoensakdi, A.; Jantaro, S. Cyanobacterium Synechocystis sp. PCC 6803 lacking adc1 gene produces higher polyhydroxybutyrate accumulation under modified nutrients of acetate supplementation and nitrogen-phosphorus starvation. Biotechnol. Rep. 2021, 31, e00661. [Google Scholar] [CrossRef]
- Hein, S.; Tran, H.; Steinbüchel, A. Synechocystis sp. PCC6803 possesses a two component polyhydroxyalkanoic acid synthase similar to that of anoxygenic purple sulfur bacteria. Arch. Microbiol. 1998, 170, 162–170. [Google Scholar] [CrossRef]
- Khetkorn, W.; Incharoensakdi, A.; Lindblad, P.; Jantaro, S. Enhancement of poly-3-hydroxybutyrate production in Synechocystis sp. PCC 6803 by overexpression of its native biosynthetic genes. Bioresour. Technol. 2016, 214, 761–768. [Google Scholar] [CrossRef]
- Beld, J.; Abbriano, R.; Finzel, K.; Hildebrand, M.; Burkart, M.D. Probing fatty acid metabolism in bacteria, cyanobacteria, green microalgae and diatoms with natural and unnatural fatty acids. Mol. BioSyst. 2016, 12, 1299. [Google Scholar] [CrossRef]
- Towijit, U.; Songruk, N.; Lindblad, P.; Incharoensakdi, A.; Jantaro, S. Co-overexpression of native phospholipid-biosynthetic genes plsX and plsC enhances lipid production in Synechocystis sp. PCC 6803. Sci. Rep. 2018, 8, 13510. [Google Scholar] [CrossRef] [Green Version]
- Englund, E.; Andersen-Ranberg, J.; Miao, R.; Hamberger, B.; Lindberg, P. Metabolic engineering of Synechocystis sp. PCC 6803 for production of the plant diterpenoid manoyl oxide. ACS Synth. Biol. 2015, 4, 1270–1278. [Google Scholar] [CrossRef] [Green Version]
- Johnson, T.J.; Zahler, J.D.; Baldwin, E.L.; Zhou, R.; Gibbons, W.R. Optimizing cyanobacteria growth conditions in a sealed environment to enable chemical inhibition tests with volatile chemicals. J. Microbiol. Methods 2016, 126, 54–59. [Google Scholar] [CrossRef]
- Iwaki, T.; Haranoh, K.; Inoue, N.; Kojima, K.; Satoh, R.; Nishino, T.; Wada, S.; Ihara, H.; Tsuyama, S.; Kobayashi, H.; et al. Expression of foreign type I ribulose-1,5-bisphosphate carboxylase/oxygenase (EC 4.1.1.39) stimulates photosynthesis in cyanobacterium Synechococcus PCC7942 cells. Photosynth. Res. 2006, 88, 287–297. [Google Scholar] [CrossRef] [PubMed]
- Lin, M.T.; Occhialini, A.; Andralojc, P.J.; Parry, M.A.J.; Hanson, M.R. A faster Rubisco with potential to increase photosynthesis in crops. Nature 2014, 513, 547–550. [Google Scholar] [CrossRef] [PubMed]
- Liang, F.; Lindblad, P. Effects of overexpressing photosynthetic carbon flux control enzymes in the cyanobacterium Synechocystis PCC 6803. Metab. Eng. 2016, 38, 56–64. [Google Scholar] [CrossRef]
- Vera, C.L.; Hyne, R.V.; Patra, R.; Ramasamy, S.; Pablo, F.; Julli, M.; Kefford, B.J. Bicarbonate toxicity to Ceriodaphnia dubia and the freshwater shrimp Paratya australiensis and its influence on zinc toxicity. Environ. Toxicol. Chem. 2014, 33, 1179–1186. [Google Scholar] [CrossRef]
- Umetani, I.; Janka, E.; Sposób, M.; Hulatt, C.J.; Kleiven, S.; Bakke, R. Bicarbonate for microalgae cultivation: A case study in a chlorophyte, Tetradesmus wisconsinensis isolated from a Norwegian lake. J. Appl. Phycol. 2021, 33, 1341–1352. [Google Scholar] [CrossRef]
- Hauf, W.; Schlebusch, M.; Hüge, J.; Kopka, J.; Hagemann, M.; Forchhammer, K. Metabolic changes in Synechocystis PCC6803 upon nitrogen-starvation: Excess NADPH sustains polyhydroxybutyrate accumulation. Metabolites 2013, 3, 101–118. [Google Scholar] [CrossRef] [Green Version]
- Kocharin, K.; Siewers, V.; Nielsen, J. Improved polyhydroxybutyrate production by Saccharomyces cerevisiae through the use of the phosphoketolase pathway. Biotechnol. Bioeng. 2013, 110, 2216–2224. [Google Scholar] [CrossRef] [PubMed]
- Carpine, R.; Du, W.; Olivieri, G.; Polliom, A.; Hellingwerf, K.J.; Marzocchella, A.; Branco dos Santos, F. Genetic engineering of Synechocystis sp. PCC6803 for poly-β-hydroxybutyrate overproduction. Algal Res. 2017, 25, 117–127. [Google Scholar] [CrossRef]
- Klotz, A.; Georg, J.; Bučinská, L.; Watanabe, S.; Reimann, V.; Januszewski, W.; Sobotka, R.; Jendrossek, D.; Hess, W.R.; Forchhammer, K. Awakening of a dormant cyanobacterium from nitrogen chlorosis reveals a genetically determined program. Curr. Biol. 2016, 26, 2862–2872. [Google Scholar] [CrossRef] [Green Version]
- Koch, M.; Berendzen, K.W.; Forchhammer, K. On the role and production of polyhydroxybutyrate (PHB) in the cyanobacterium Synechocystis sp. PCC 6803. Life 2020, 10, 47. [Google Scholar] [CrossRef]
- Koch, M.; Forchhammer, K. Polyhydroxybutyrate: A useful product of chlorotic cyanobacteria. Microb. Physiol. 2021, 31, 67–77. [Google Scholar] [CrossRef] [PubMed]
- Collier, J.L.; Grossman, A.R. A small polypeptide triggers complete degradation of light-harvesting phycobiliproteins in nutrient-deprived cyanobacteria. EMBO J. 1994, 13, 1039–1047. [Google Scholar] [CrossRef] [PubMed]
- Herrero, A.; Muro-Pastor, A.M.; Flores, E. Nitrogen control in cyanobacteria. J. Bacteriol. 2001, 183, 411–425. [Google Scholar] [CrossRef] [PubMed] [Green Version]
- Hickman, J.W.; Kotovic, K.M.; Miller, C.; Warrener, P.; Kaiser, B.; Jurista, T.; Budde, M.; Cross, F.; Roberts, J.M.; Carleton, M. Glycogen synthesis is a required component of the nitrogen stress response in Synechococcus elongatus PCC 7942. Algal Res. 2013, 2, 98–106. [Google Scholar] [CrossRef]
- Giner-Lamia, J.; Robles-Rengel, R.; Hernández-Prieto, M.A.; Muro-Pastor, M.I.; Florencio, F.J.; Futschik, M.E. Identification of the direct regulon of NtcA during early acclimation to nitrogen starvation in the cyanobacterium Synechocystis sp. PCC 6803. Nucleic Acids Res. 2017, 45, 11800–11820. [Google Scholar] [CrossRef] [Green Version]
- Orthwein, T.; Scholl, J.; Spät, P.; Lucius, S.; Koch, M.; Macek, B.; Hagemann, M.; Forchhammer, K. The novel PII-interacting regulator PirC (Sll0944) identifies 3-phosphoglycerate mutase (PGAM) as central control point of carbon storage metabolism in cyanobacteria. Proc. Natl. Acad. Sci. USA 2021, 118, e2019988118. [Google Scholar] [CrossRef]
- Bottomley, P.J.; Stewart, W.D.P. ATP pool and transients in the blue-green alga, Anabaena cylindrica. Arch. Microbiol. 1976, 108, 249–258. [Google Scholar] [CrossRef]
- Ansari, S.; Fatma, T. Cyanobacterial polyhydroxybutyrate (PHB): Screening, optimization and characterization. PLoS ONE 2016, 11, e0158168. [Google Scholar] [CrossRef] [Green Version]
- Moran, R. Formulae for determination of chlorophyllous pigments extracted with N,N- dimethylformamide. Plant Physiol. 1982, 69, 1376–1381. [Google Scholar] [CrossRef] [Green Version]
- Chamovitz, D.; Sandmann, G.; Hirschberg, J. Molecular and biochemical characterization of herbicide-resistant mutants of cyanobacteria reveals that phytoene desaturation is a rate-limiting step in carotenoid biosynthesis. J. Biol. Chem. 1993, 268, 17348–17353. [Google Scholar] [CrossRef]
- Bligh, E.G.; Dyer, W.J. A rapid method of total lipid extraction and purification. Can. J. Biochem. Physiol. 1959, 37, 911–917. [Google Scholar] [CrossRef] [PubMed]
- Fales, F.W. Evaluation of a spectrophotometric method for determination of total fecal lipid. Clin. Chem. 1971, 17, 1103–1108. [Google Scholar] [CrossRef]
- Cheng, Y.S.; Zheng, Y.; Vander Gheynst, J.S. Rapid quantitative analysis of lipids using a colorimetric method in a microplate format. Lipids 2011, 46, 95–103. [Google Scholar] [CrossRef] [PubMed]
- Ernst, A.; Kirschenlohr, H.; Diez, J.; Böger, P. Glycogen content and nitrogenase activity in Anabaena variabilis. Arch. Microbiol. 1984, 140, 120–125. [Google Scholar] [CrossRef]
- Vidal, R.; Venegas-Calerón, M. Simple, fast and accurate method for the determination of glycogen in the model unicellular cyanobacterium Synechocystis sp. PCC 6803. J. Microbiol. Methods 2019, 164, 105686. [Google Scholar] [CrossRef] [PubMed]
- Meuser, J.E.; Boyd, E.S.; Ananyev, G.; Karns, D.; Radakovits, R.; Narayana Murthy, U.M.; Ghirardi, M.L.; Charles Dismukes, G.; Peters, J.W.; Posewitz, M.C. Evolutionary significance of an algal gene encoding an [FeFe]-hydrogenase with F-domain homology and hydrogenase activity in Chlorella variabilis NC64A. Planta 2011, 234, 829–843. [Google Scholar] [CrossRef]
- Eungrasamee, K.; Lindblad, P.; Jantaro, S. Enhanced productivity of extracellular free fatty acids by gene disruptions of acyl-ACP synthetase and S-layer protein in Synechocystis sp. PCC 6803. Biotechnol. Biofuels Biopro. 2022, 15, 99. [Google Scholar] [CrossRef]


| Name | Relevant Genotype | Reference |
|---|---|---|
| Cyanobacterial strains | ||
| Synechocystis sp. PCC 6803 | Wild type | Pasteur culture collection |
| WT control | WT, CmR integrated at flanking region of psbA2 gene in Synechocystis genome | This study |
| OXrbcL | rbcL, CmR integrated at flanking region of psbA2 gene in Synechocystis genome | This study |
| OXrbcLXS | rbcLXS, CmR integrated at flanking region of psbA2 gene in Synechocystis genome | This study |
| Plasmids | ||
| pEERM | PpsbA2- CmR; plasmid containing flanking region of psbA2 gene | [29] |
| pEERM_rbcL | PpsbA2-rbcL- CmR; integrated between SpeI and PstI sites of pEERM | This study |
| pEERM_rbcLXS | PpsbA2-rbcLXS- CmR; integrated between SpeI and PstI sites of pEERM | This study |
Disclaimer/Publisher’s Note: The statements, opinions and data contained in all publications are solely those of the individual author(s) and contributor(s) and not of MDPI and/or the editor(s). MDPI and/or the editor(s) disclaim responsibility for any injury to people or property resulting from any ideas, methods, instructions or products referred to in the content. |
© 2023 by the authors. Licensee MDPI, Basel, Switzerland. This article is an open access article distributed under the terms and conditions of the Creative Commons Attribution (CC BY) license (https://creativecommons.org/licenses/by/4.0/).
Share and Cite
Tharasirivat, V.; Jantaro, S. Increased Biomass and Polyhydroxybutyrate Production by Synechocystis sp. PCC 6803 Overexpressing RuBisCO Genes. Int. J. Mol. Sci. 2023, 24, 6415. https://doi.org/10.3390/ijms24076415
Tharasirivat V, Jantaro S. Increased Biomass and Polyhydroxybutyrate Production by Synechocystis sp. PCC 6803 Overexpressing RuBisCO Genes. International Journal of Molecular Sciences. 2023; 24(7):6415. https://doi.org/10.3390/ijms24076415
Chicago/Turabian StyleTharasirivat, Vetaka, and Saowarath Jantaro. 2023. "Increased Biomass and Polyhydroxybutyrate Production by Synechocystis sp. PCC 6803 Overexpressing RuBisCO Genes" International Journal of Molecular Sciences 24, no. 7: 6415. https://doi.org/10.3390/ijms24076415