

Transcriptome Analysis Reveals the Profile of Long Non-Coding RNAs during Myogenic Differentiation in Goats
 , , , , , , and
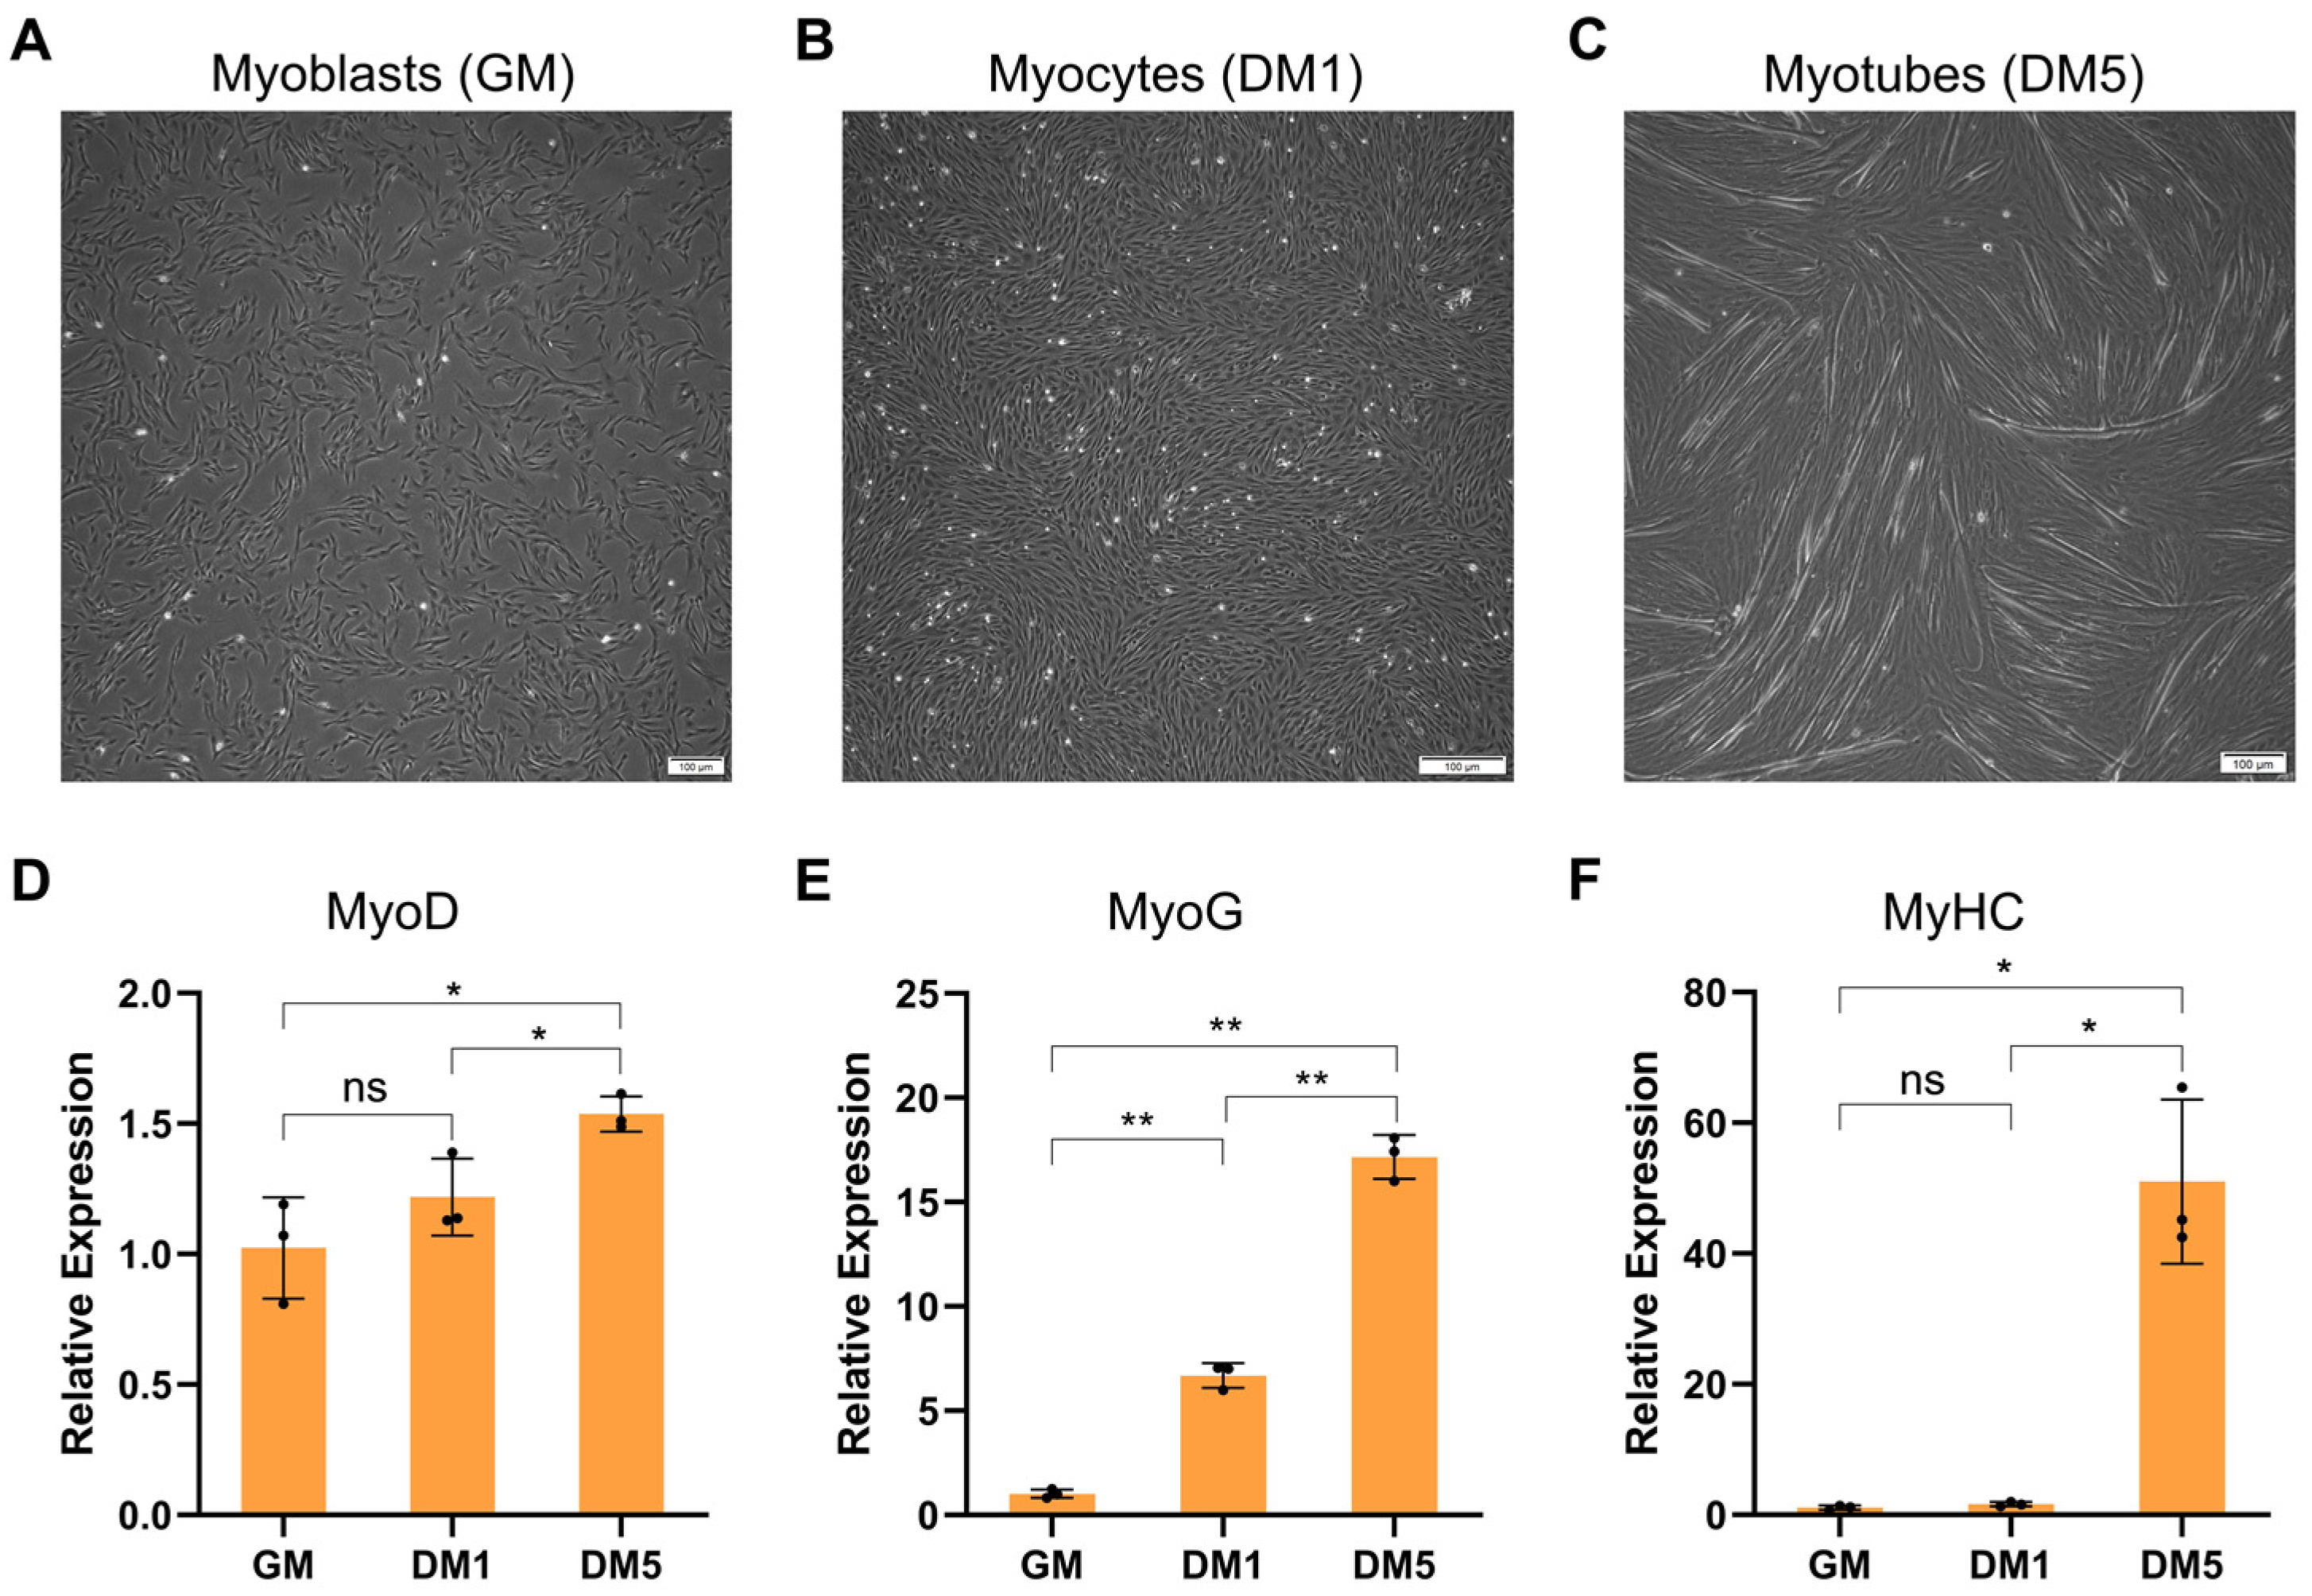
Abstract
:1. Introduction
2. Results
2.1. Establishment of Goat MuSCs Differentiation Model
2.2. Overview of RNA Sequencing Data
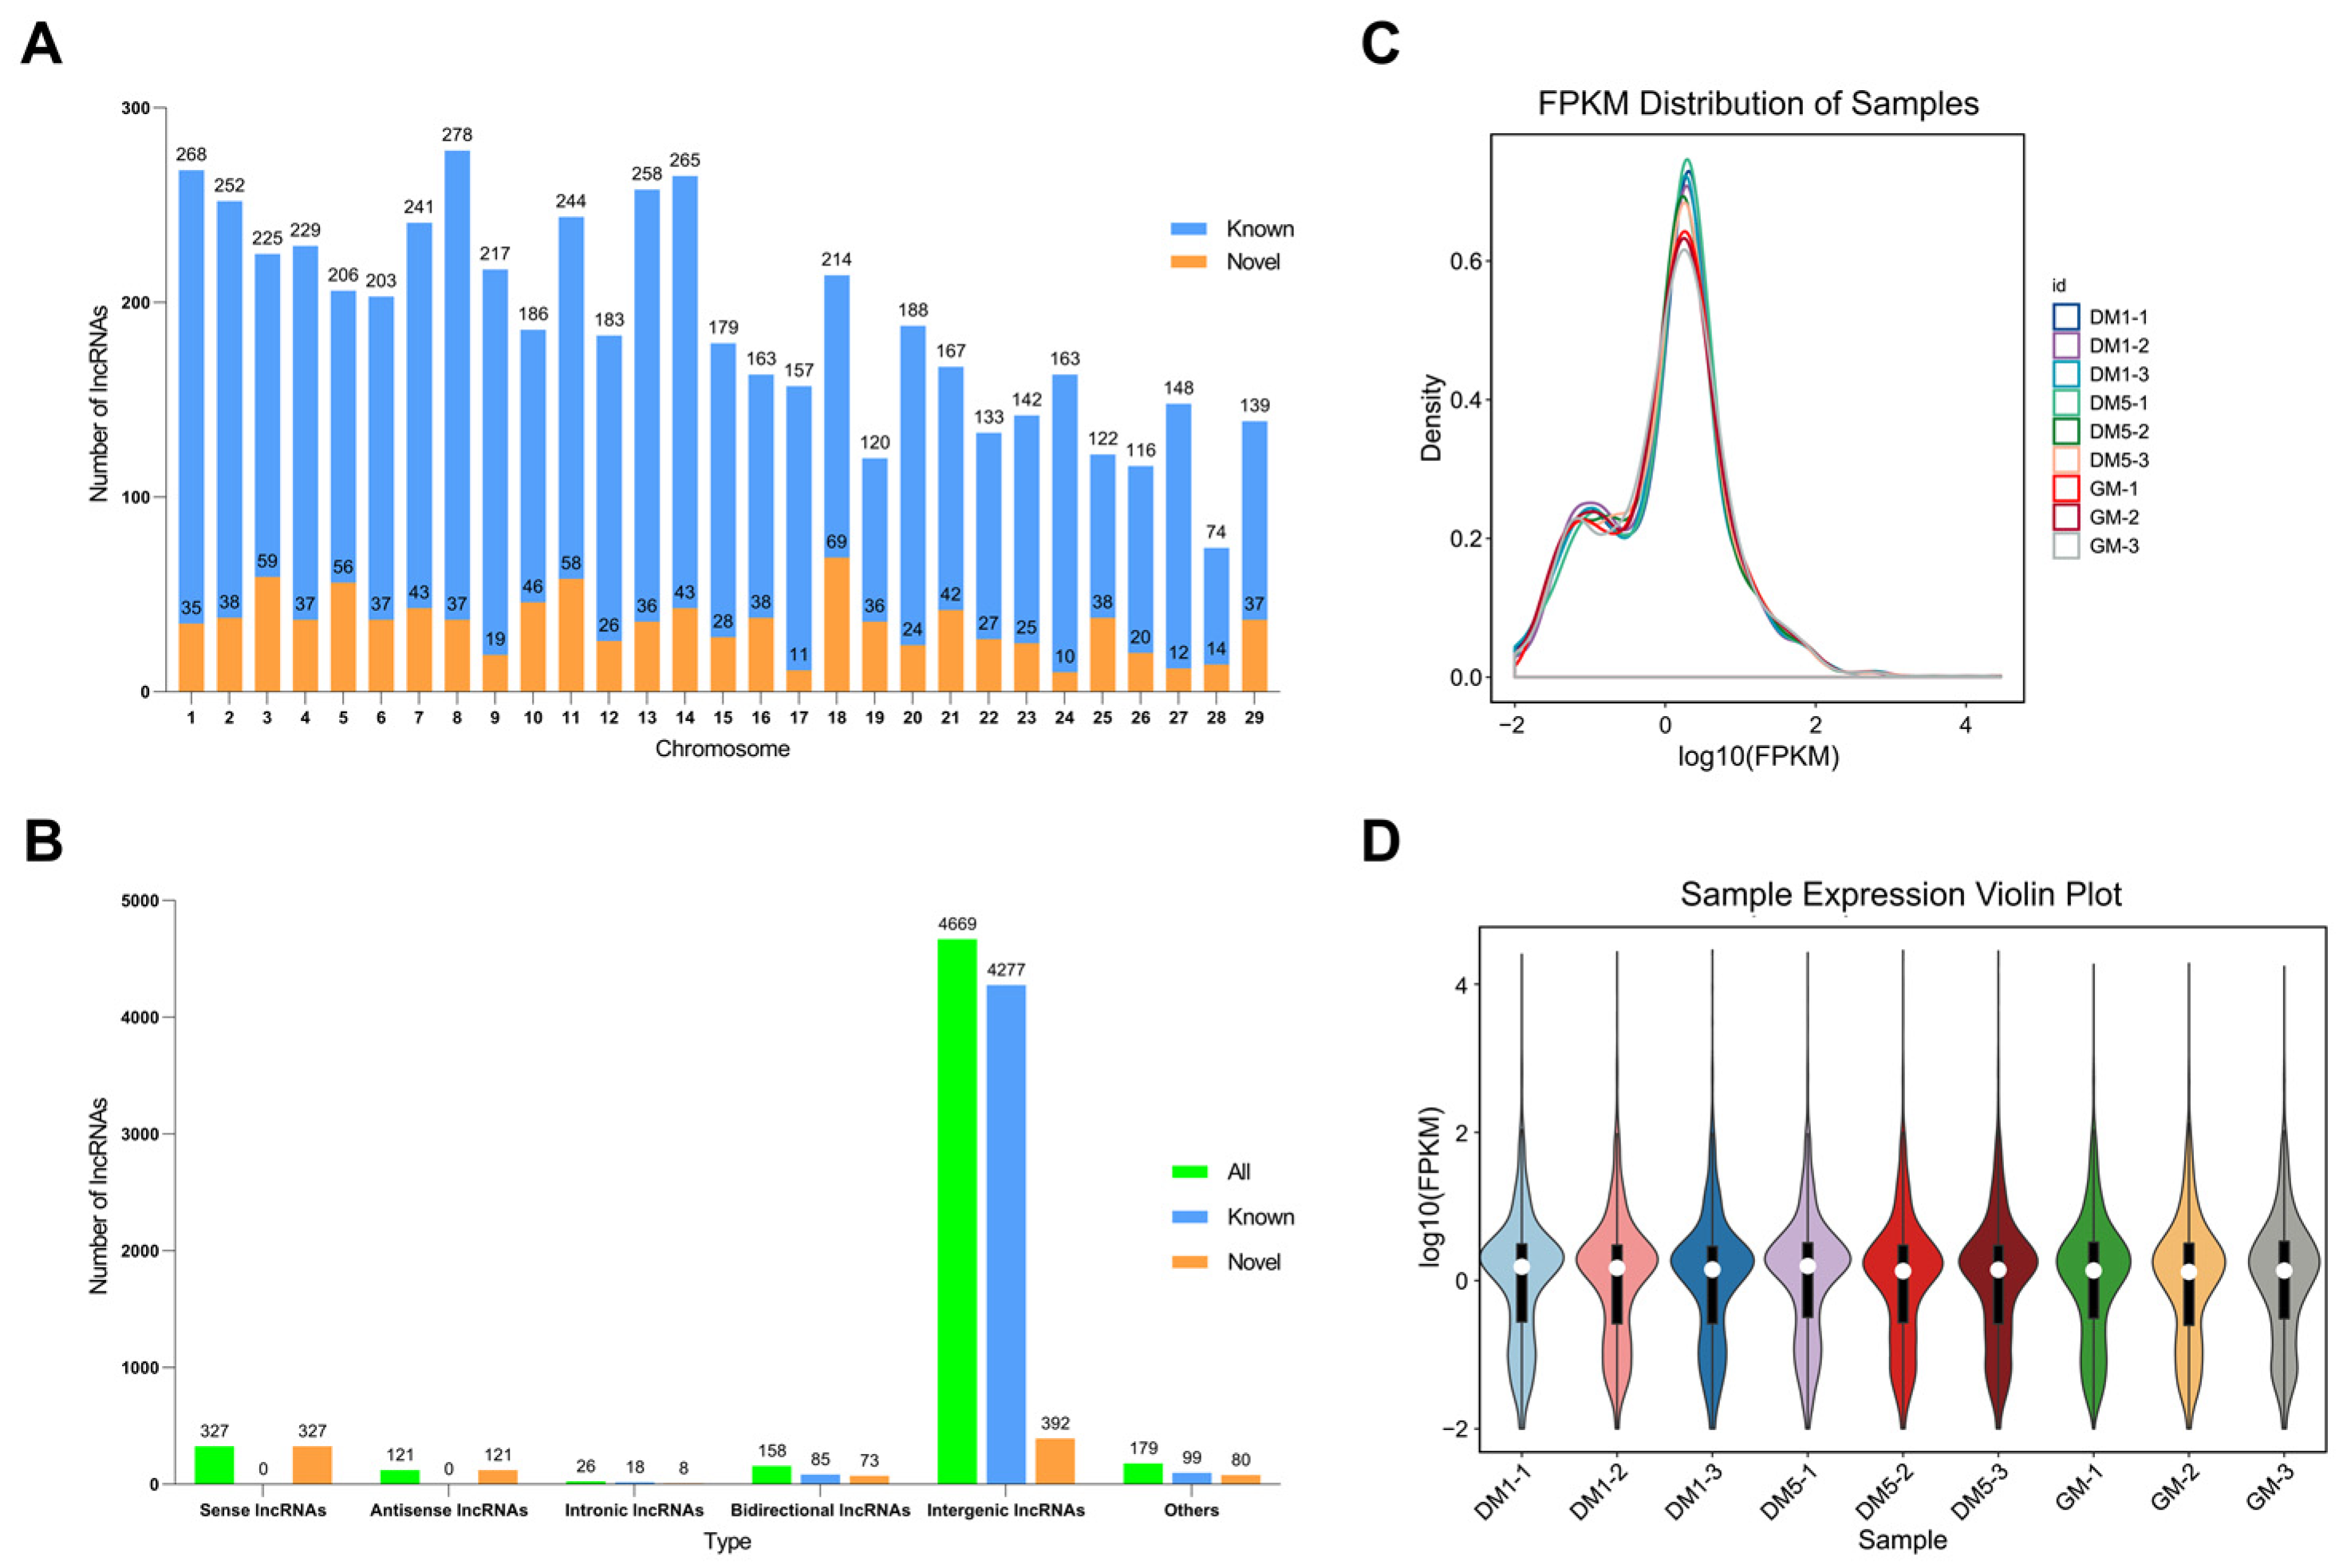
2.3. Identification and Characterization of LncRNAs in Goat MuSCs
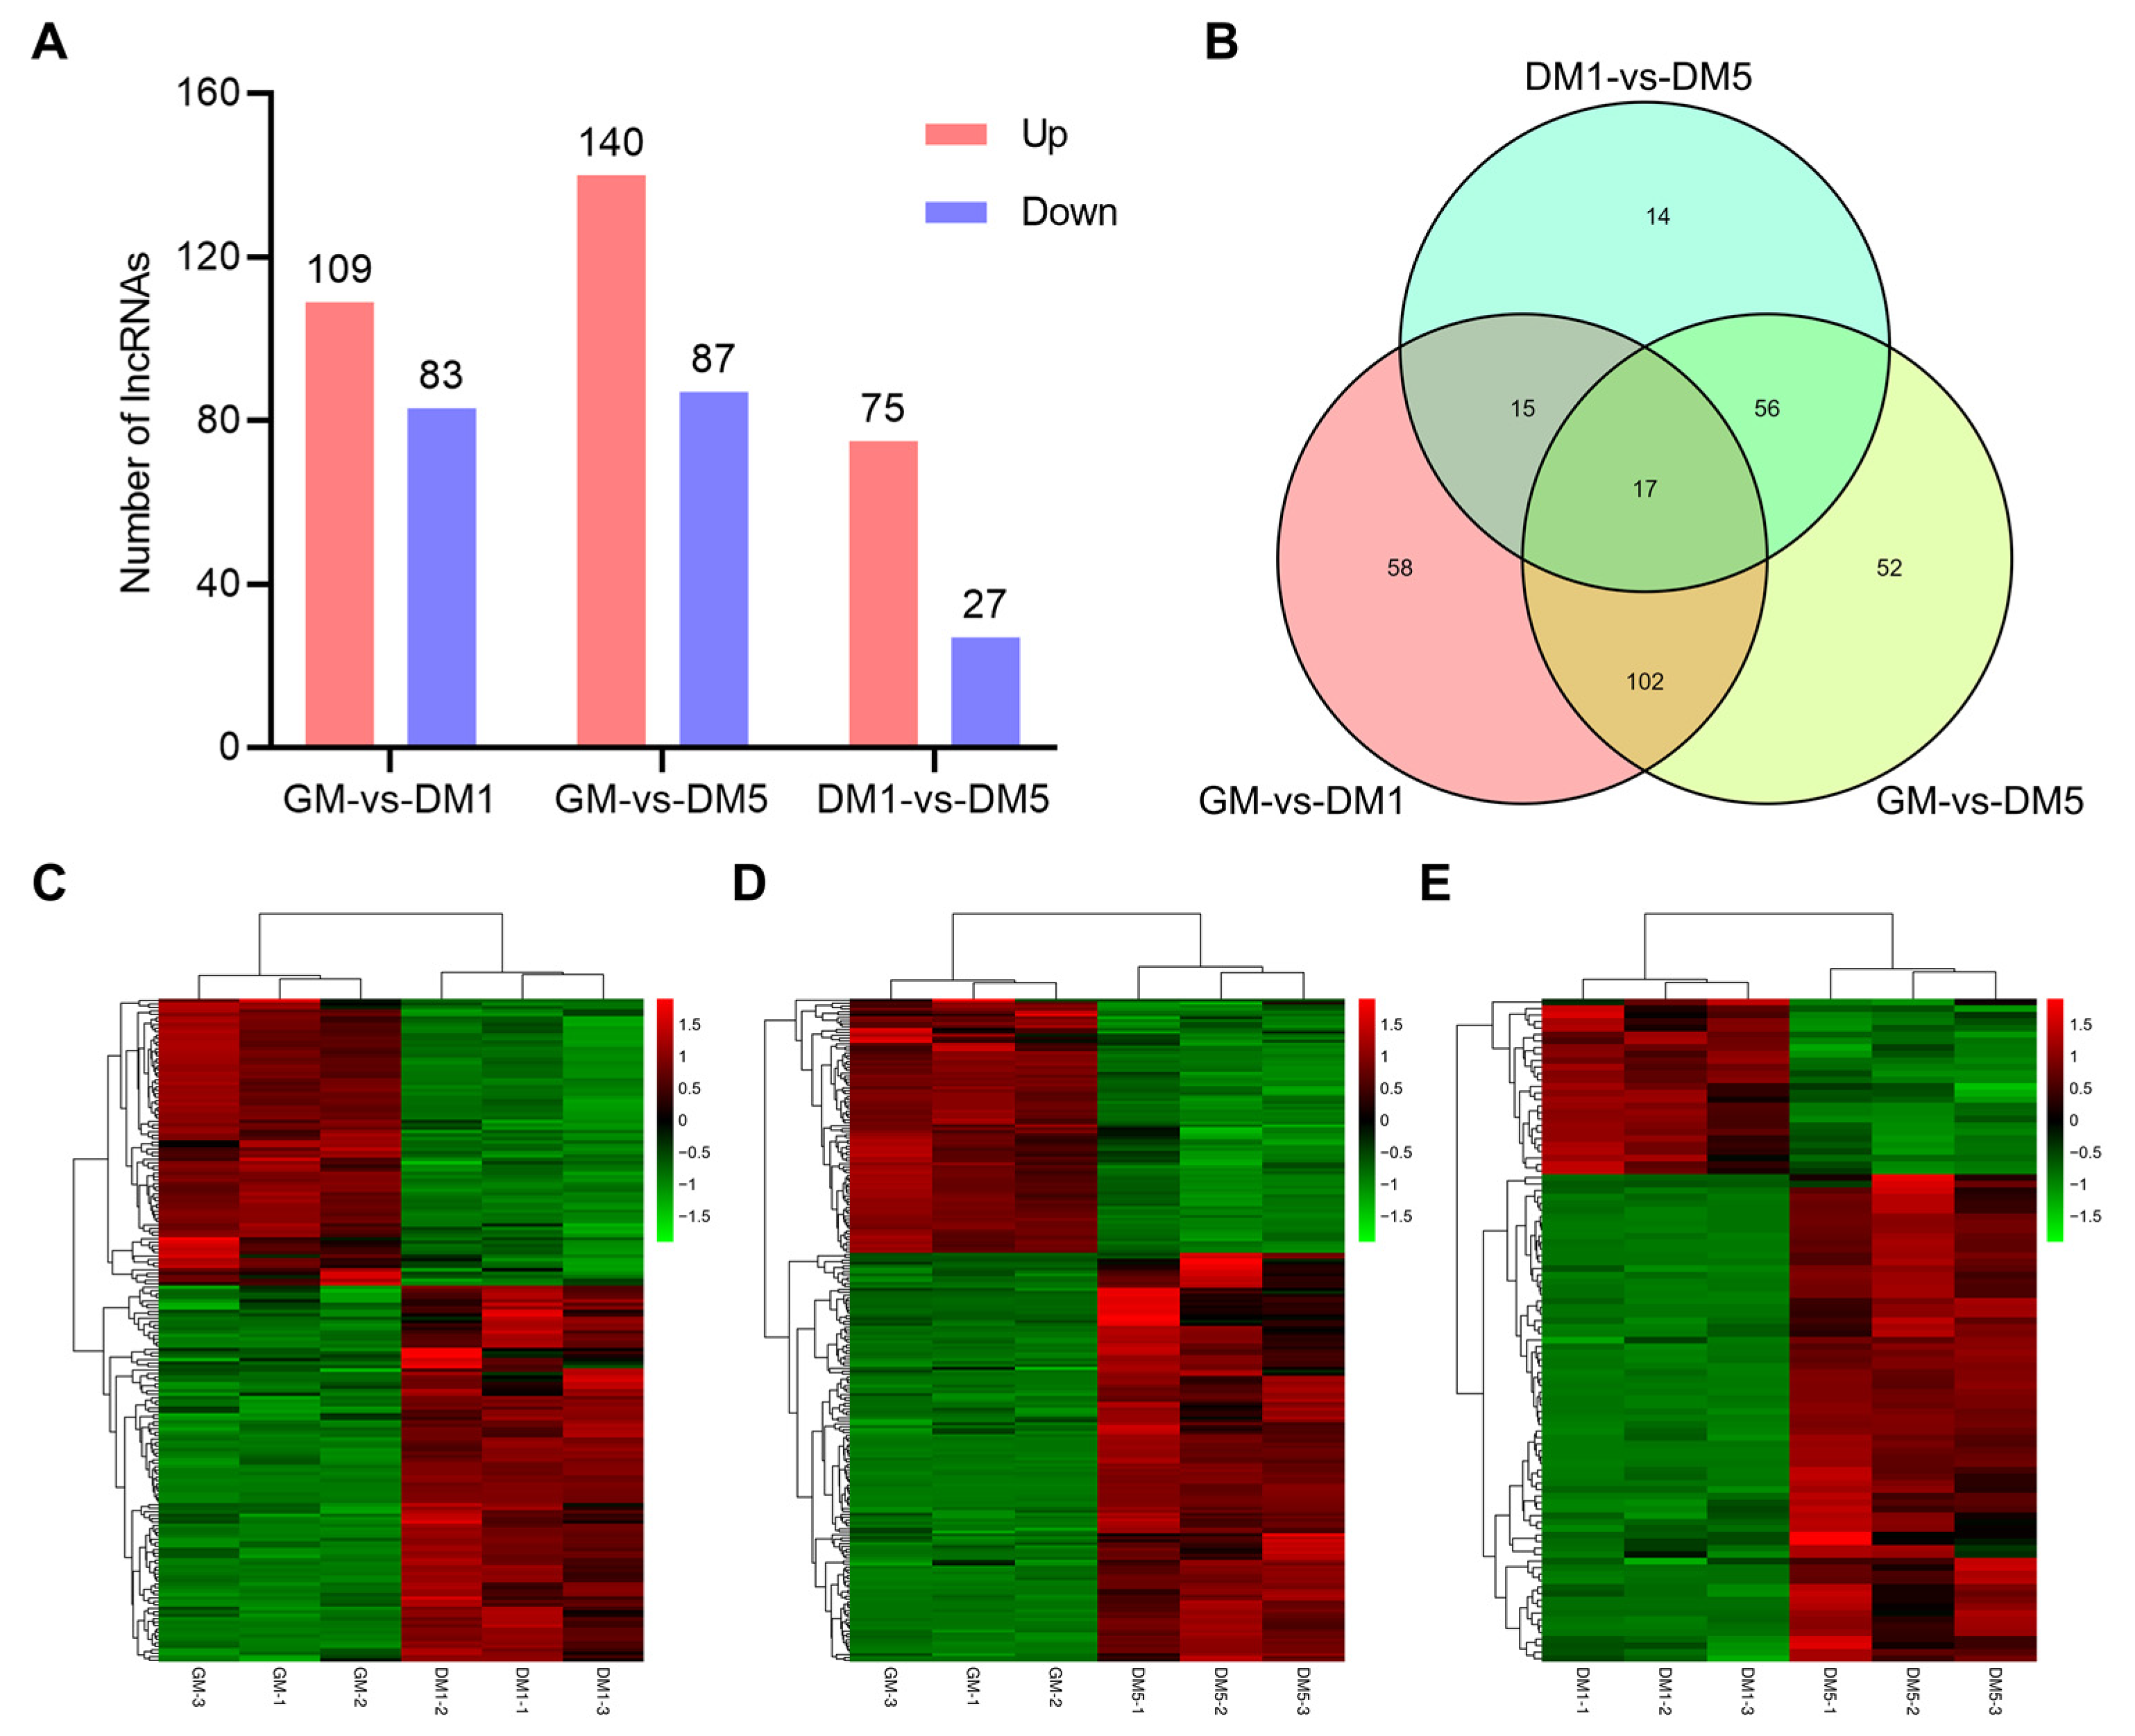
2.4. Analysis of Differential Expression of LncRNAs
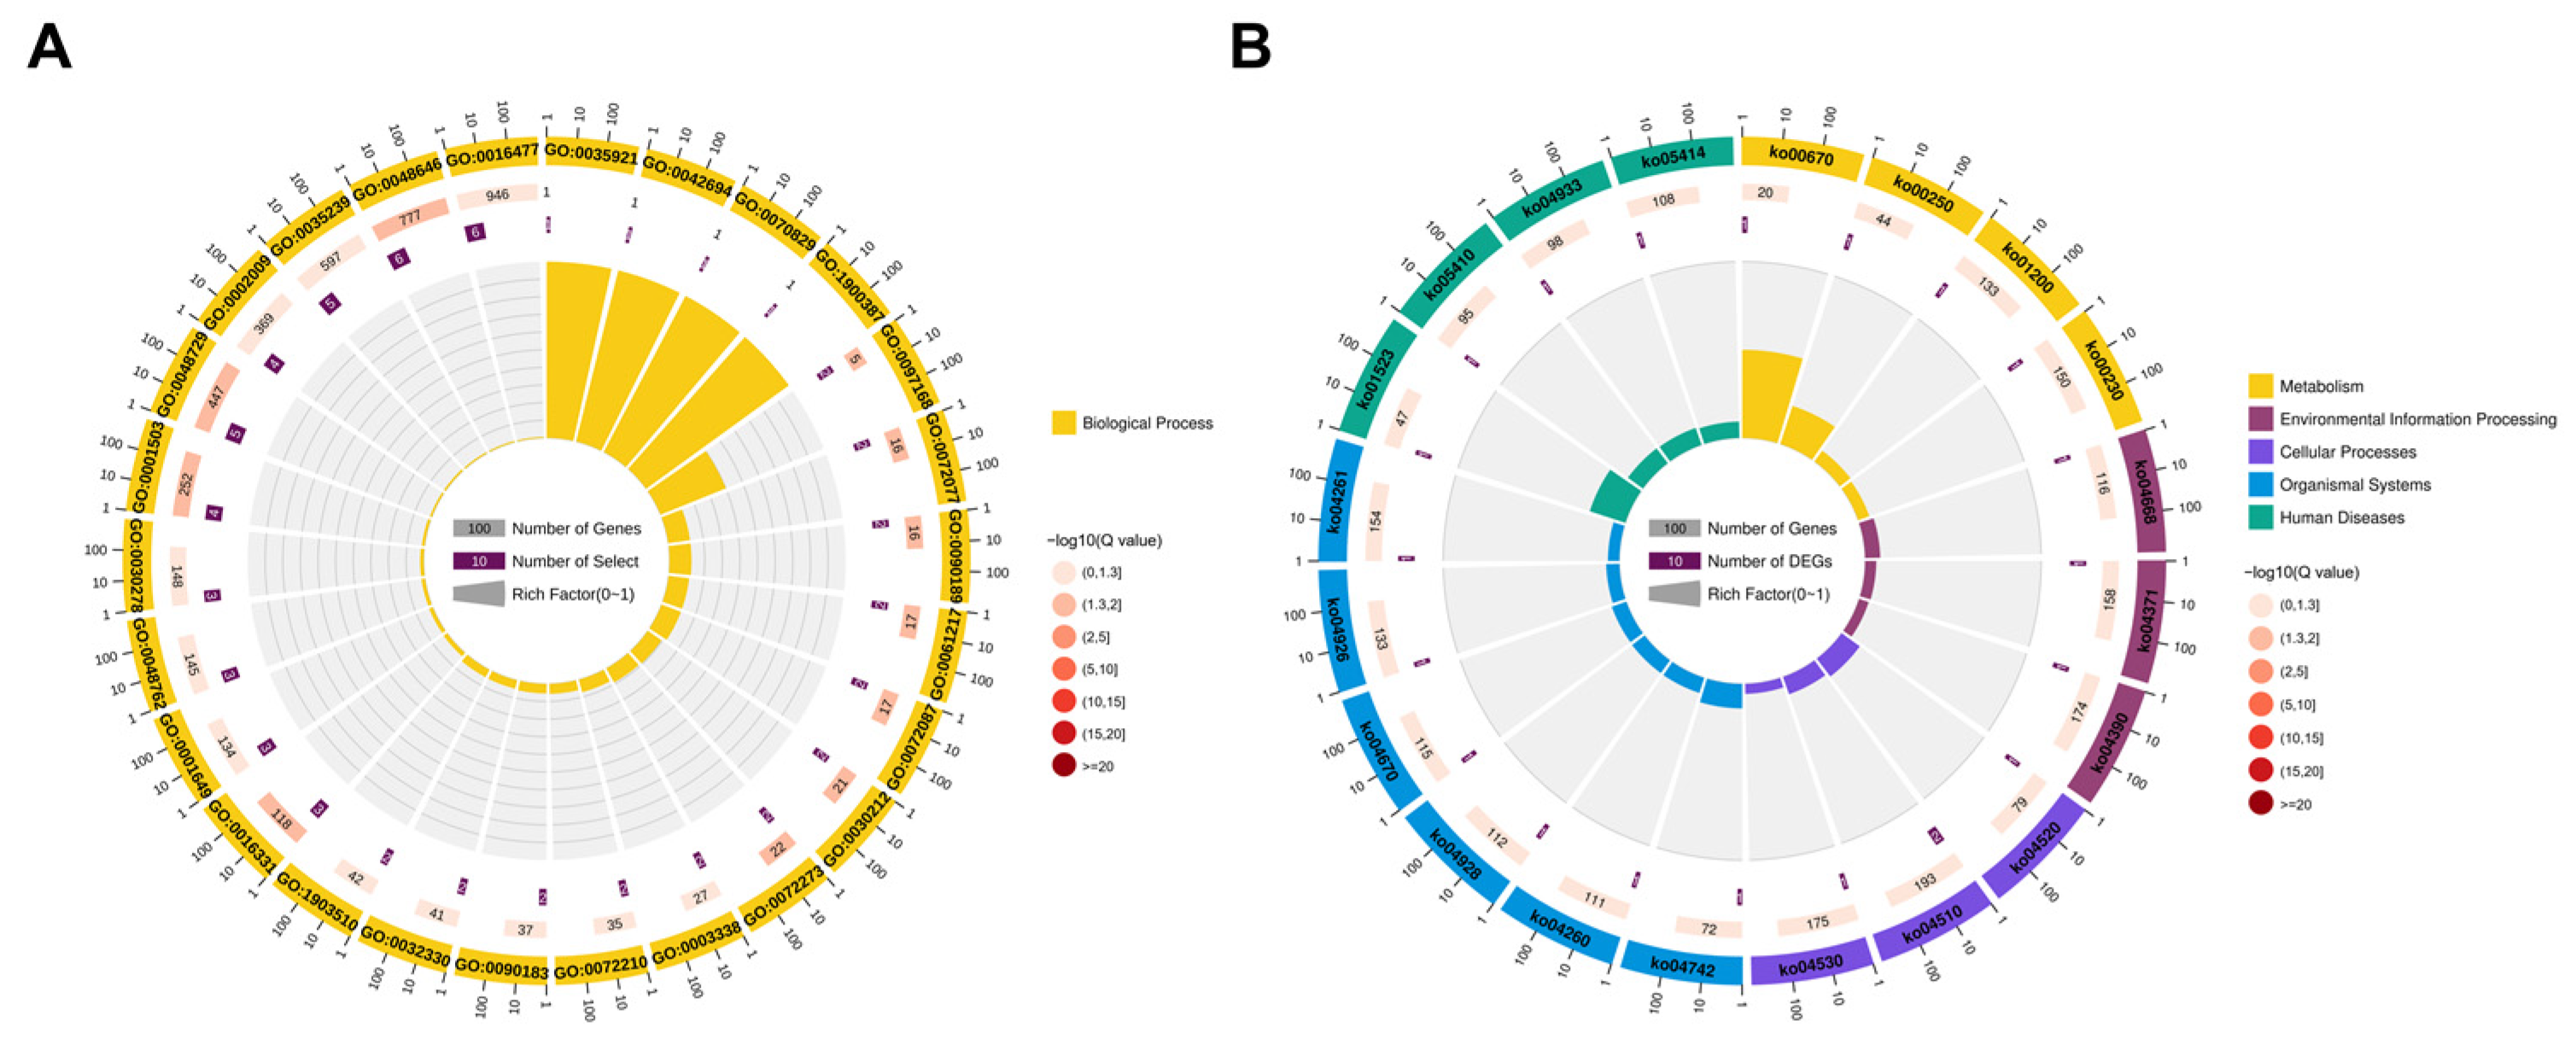
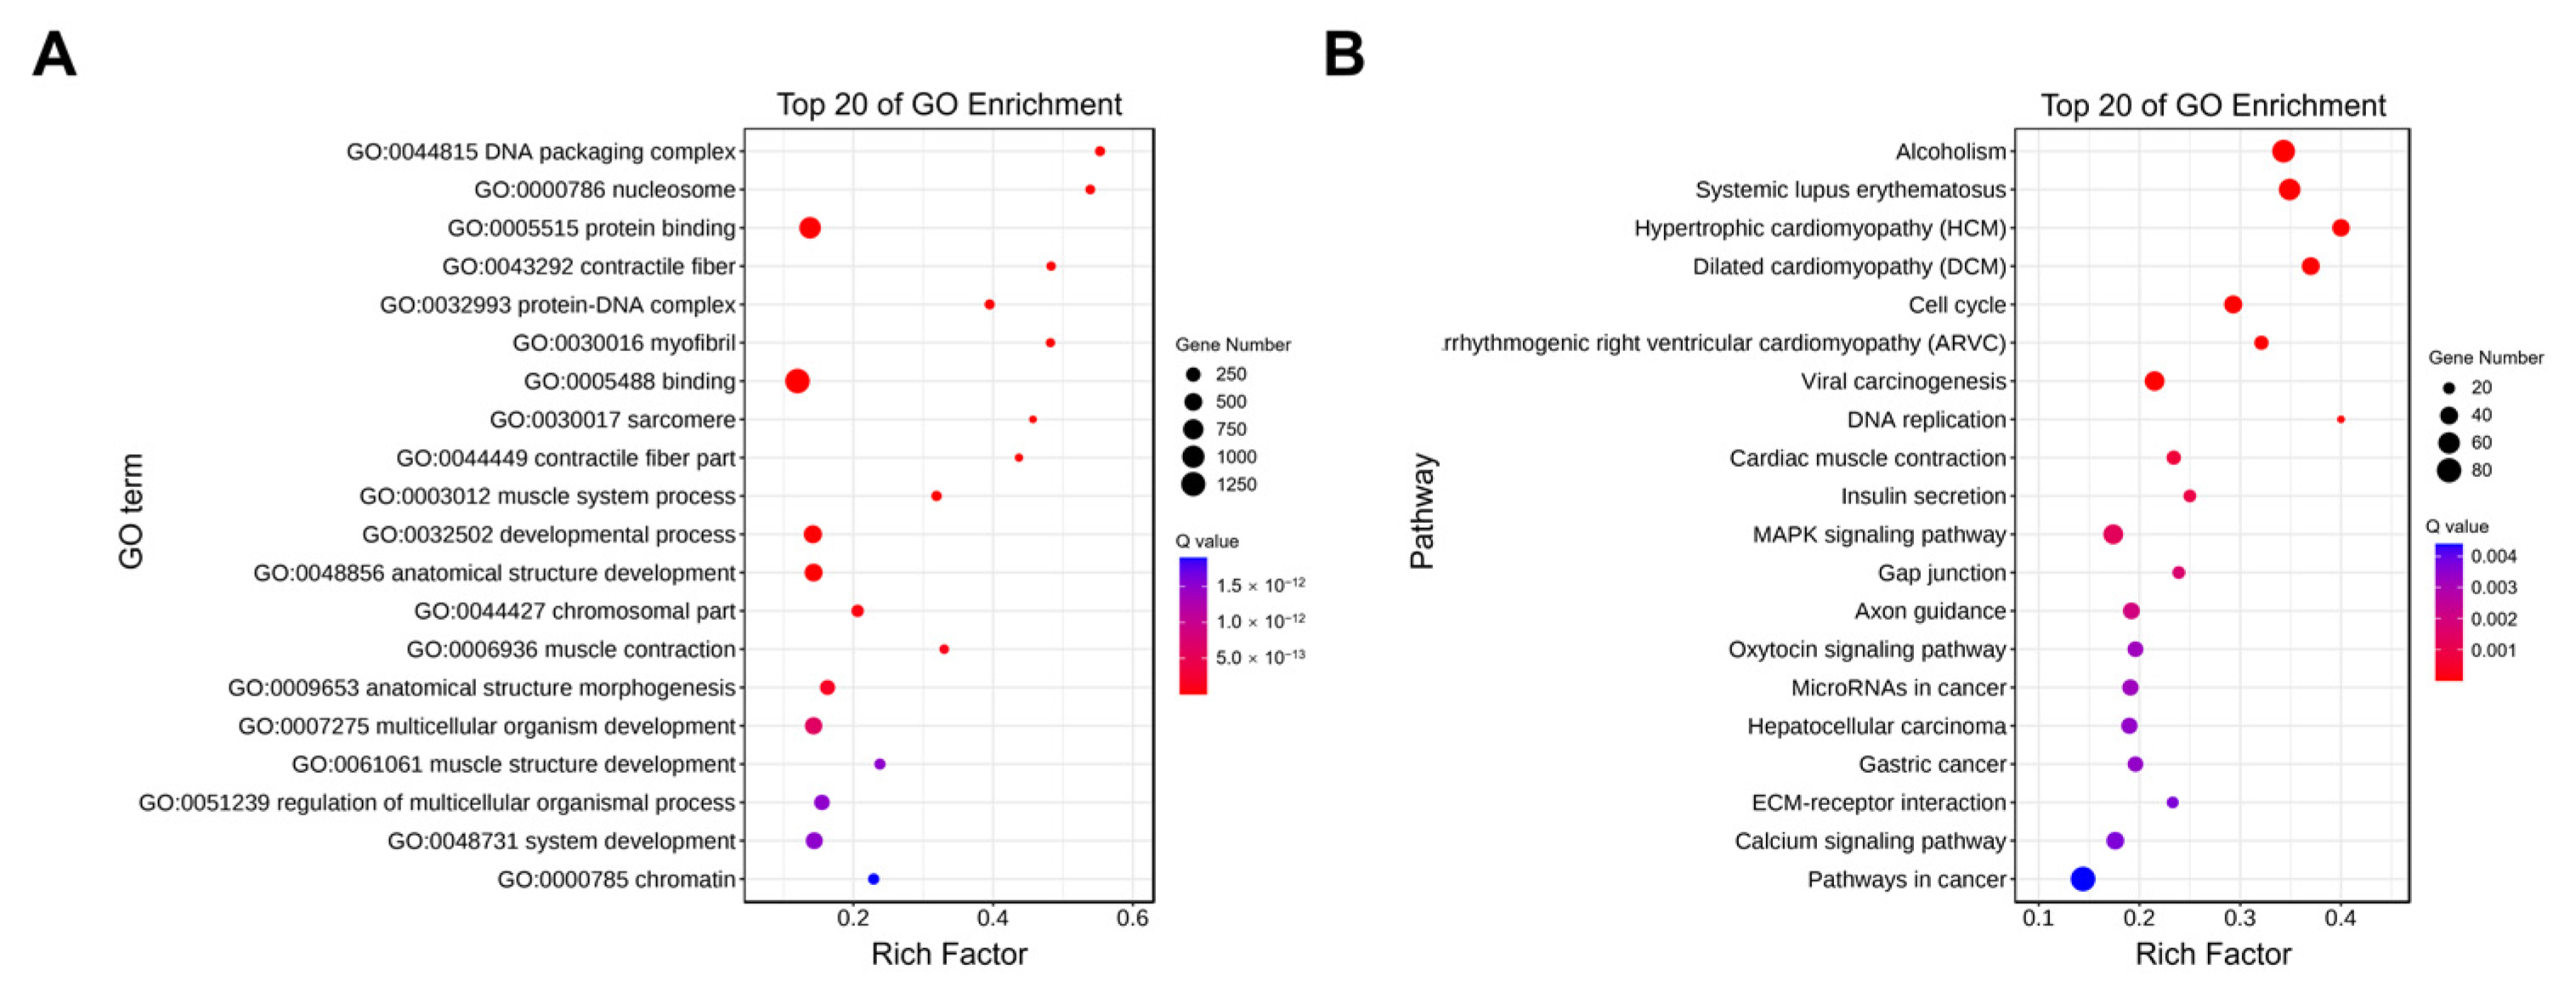
2.5. Enrichment Analysis of Cis-Target Genes of LncRNAs
2.6. Enrichment Analysis of Trans-Target Genes of LncRNAs
2.7. Enrichment Analysis of Antisense-Target Genes of LncRNAs
2.8. Construction of DE LncRNA-mRNA Interaction Networks
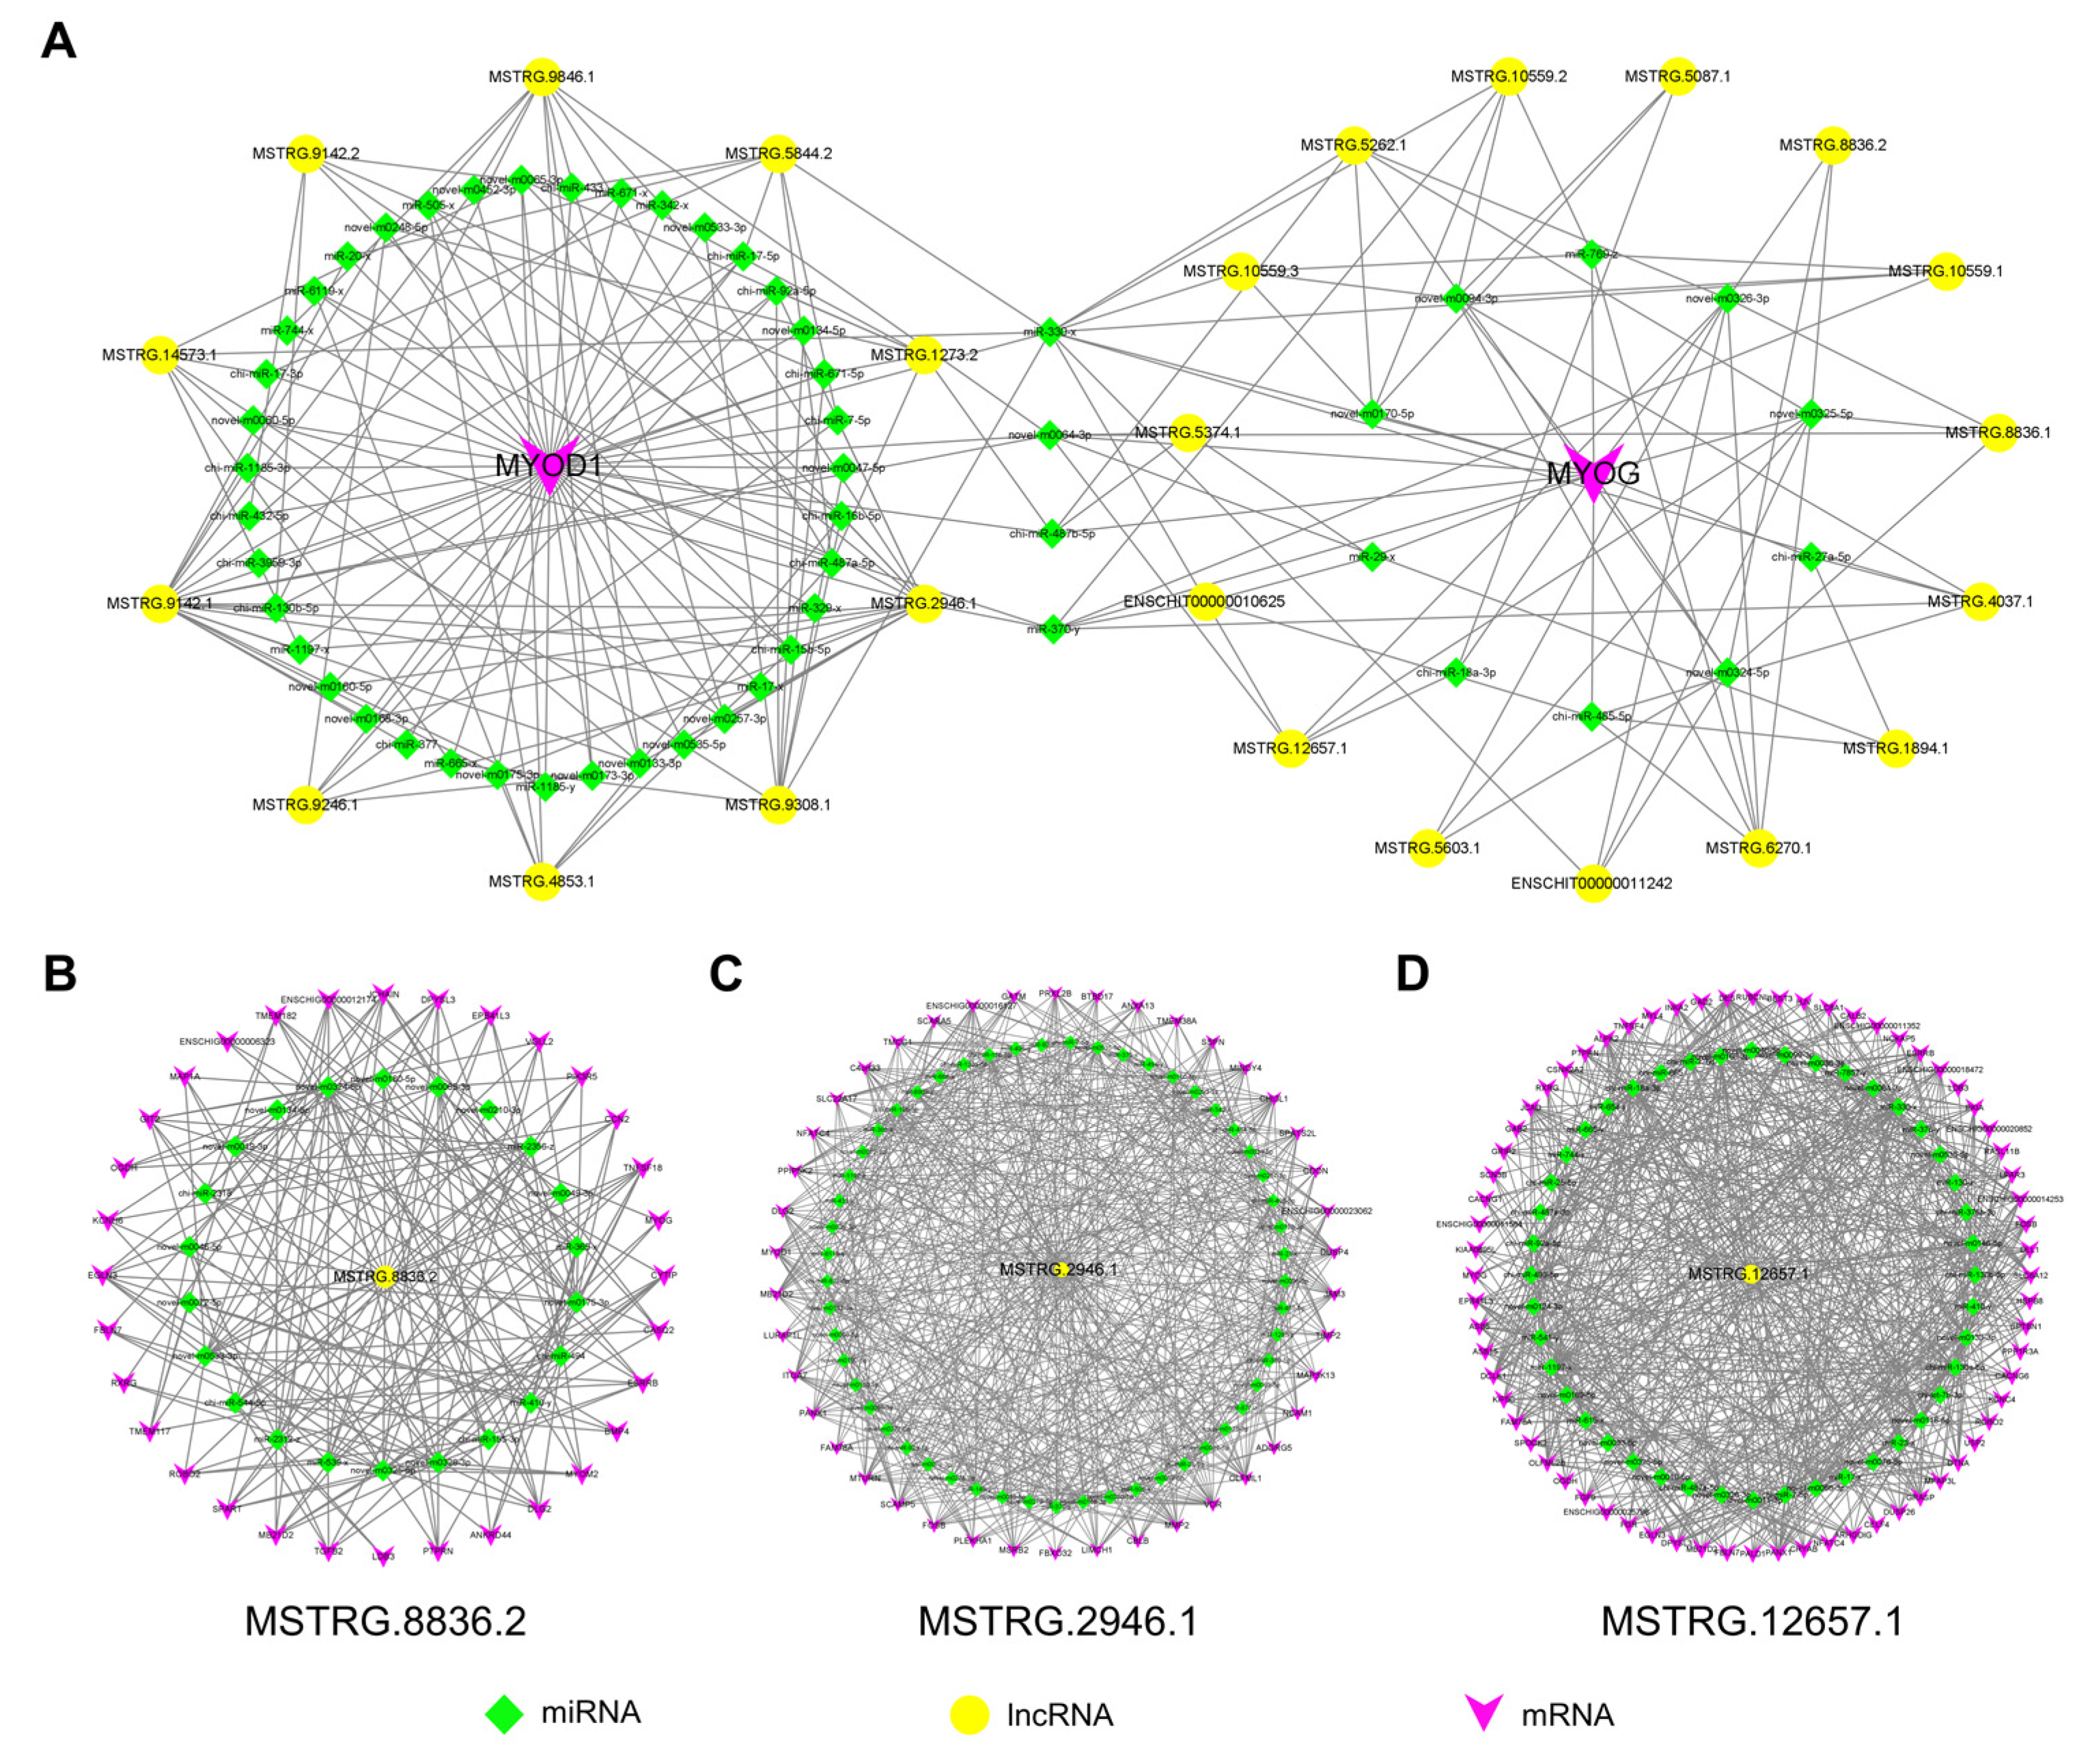
2.9. Construction of Potential LncRNA-miRNA-mRNA Regulatory Networks
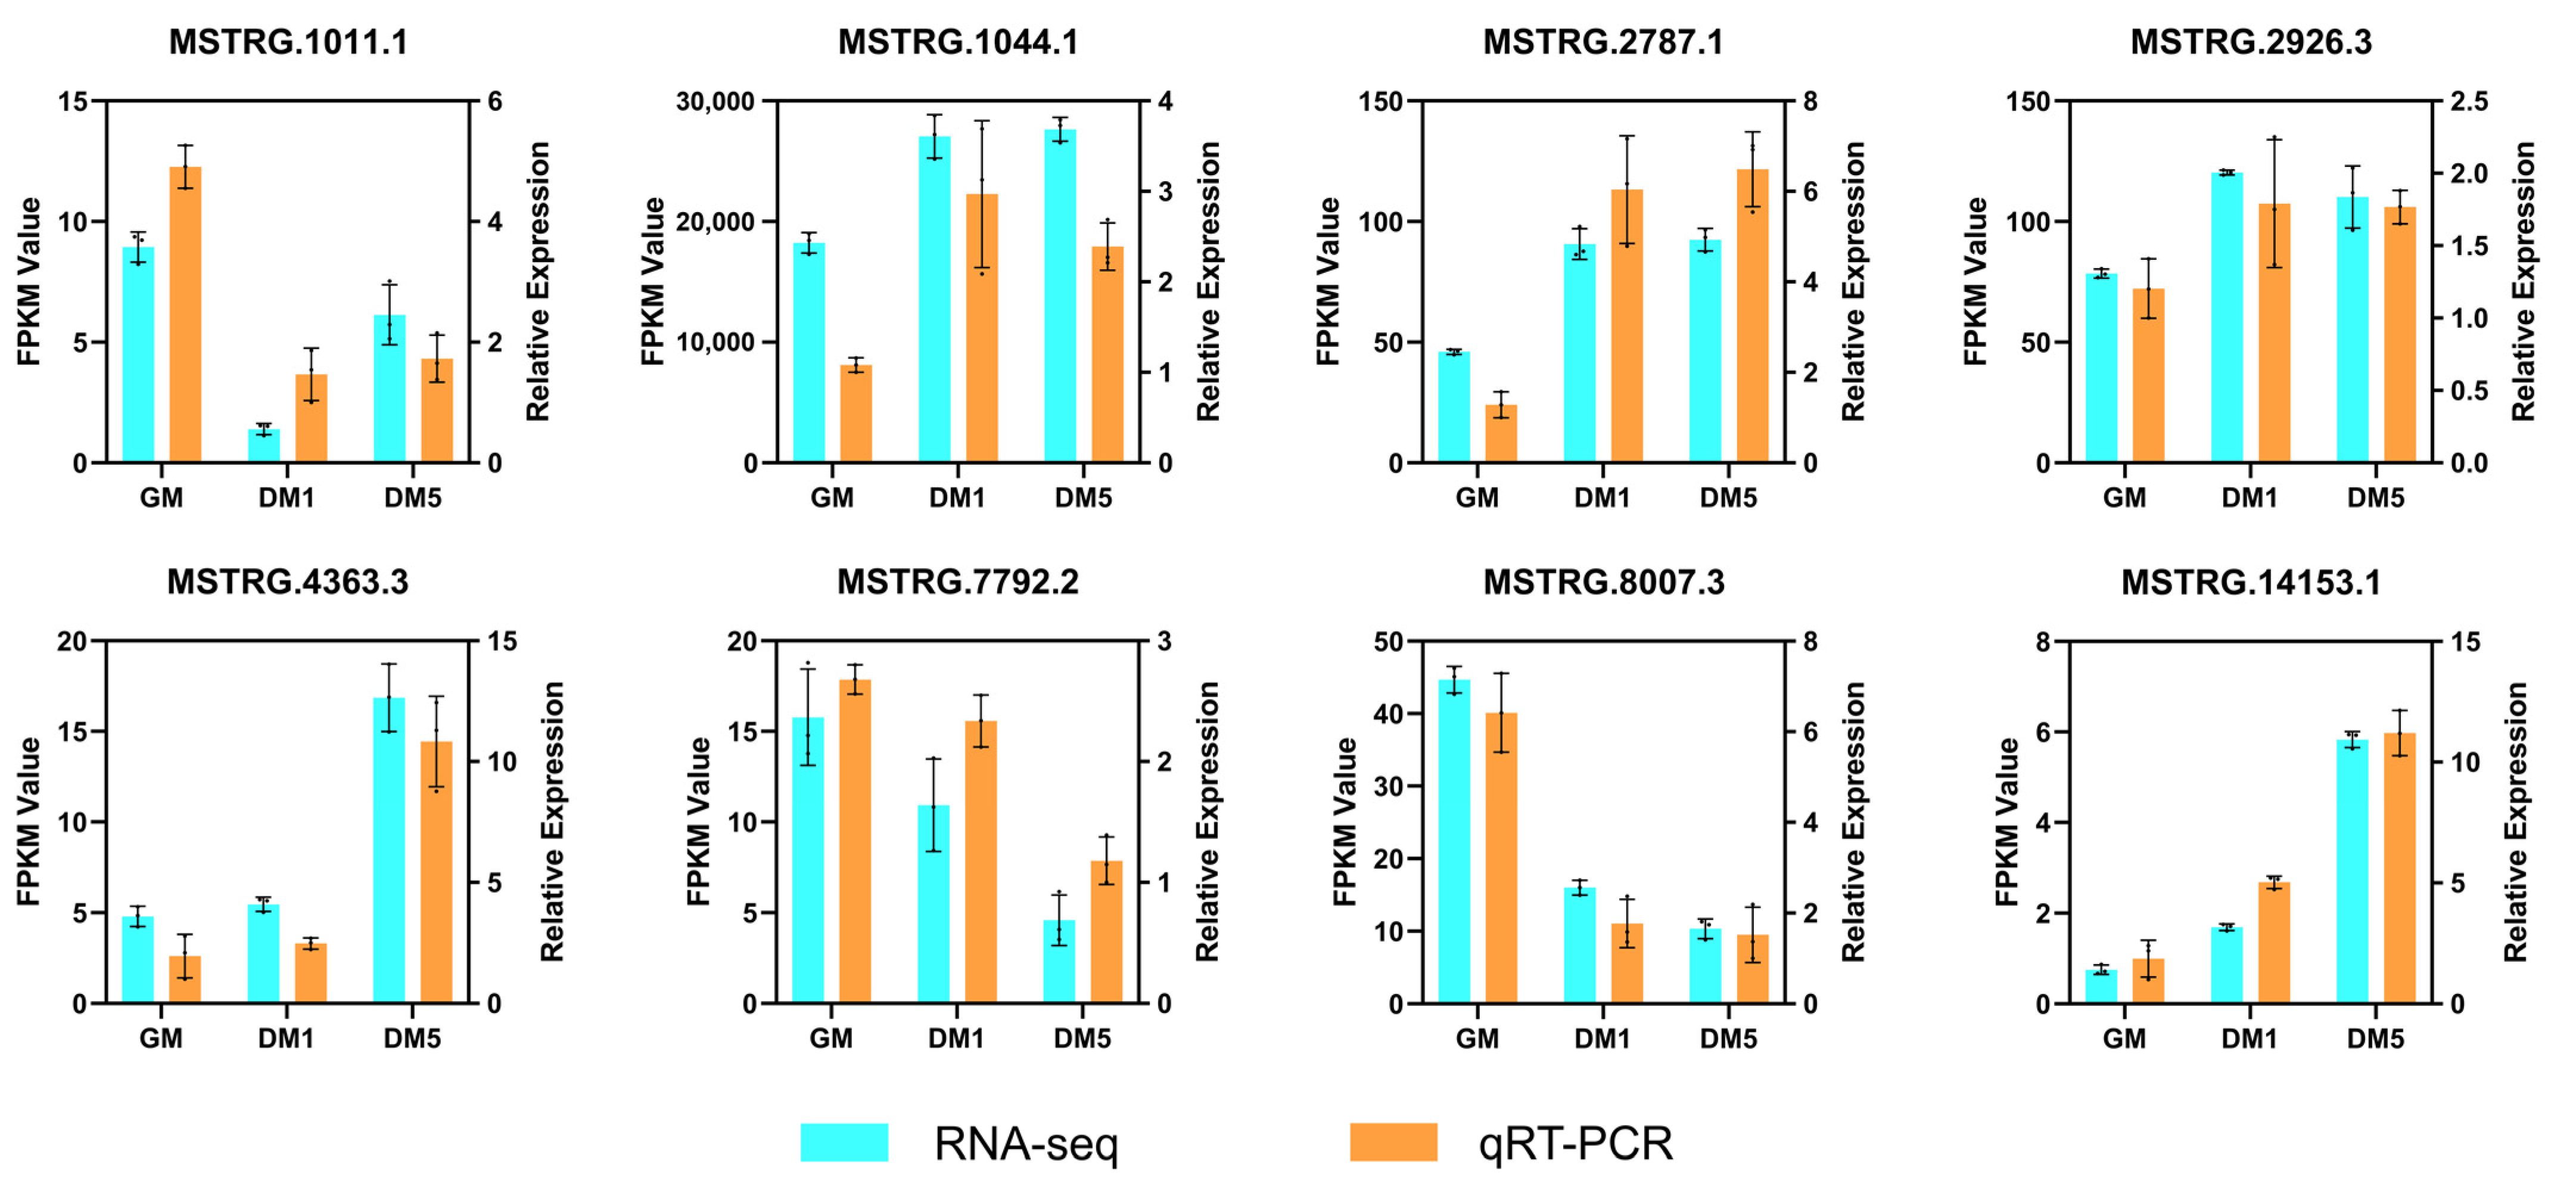
2.10. Validation of LncRNAs by qRT-PCR
3. Discussion
4. Materials and Methods
4.1. Cell Culture and Sample Preparation
4.2. RNA Extraction, Library Construction, and Sequencing
4.3. Transcriptome Data Analysis
4.4. Identification of LncRNAs
4.5. Differential Expression Analysis
4.6. Target Gene Prediction and Enrichment Analysis
4.7. Construction of DE LncRNA-mRNA and CeRNA Networks during Myogenic Differentiation
4.8. Quantitative Real-Time PCR
4.9. Statistical Analysis
5. Conclusions
Supplementary Materials
Author Contributions
Funding
Institutional Review Board Statement
Informed Consent Statement
Data Availability Statement
Conflicts of Interest
Abbreviations
| ceRNA | Competing endogenous RNA |
| CNCI | Coding-Non-Coding-Index |
| CPC | Coding Potential Calculator |
| DE | Differentially expressed |
| DM | Differentiation medium |
| FC | Fold change |
| FDR | False discovery rate |
| FPKM | Fragments per kilobase of transcript per million fragments mapped |
| GAPDH | Glyceraldehyde-3-phosphate dehydrogenase |
| GM | Growth medium |
| GO | Gene Ontology |
| KEGG | Kyoto Encyclopedia of Genes and Genomes |
| LncRNA | Long non-coding RNA |
| MuSCs | Skeletal muscle satellite cells |
| MyHC | Myosin heavy chain |
| MyoD | Myogenic differentiation 1 |
| MyoG | Myogenin |
| qRT-PCR | Quantitative real-time PCR |
References
- Costa, T.C.; Gionbelli, M.P.; Duarte, M.D. Fetal programming in ruminant animals: Understanding the skeletal muscle development to improve meat quality. Anim. Front. 2021, 11, 66–73. [Google Scholar] [CrossRef] [PubMed]
- Dayanidhi, S.; Lieber, R.L. Skeletal muscle satellite cells: Mediators of muscle growth during development and implications for developmental disorders. Muscle Nerve 2014, 50, 723–732. [Google Scholar] [CrossRef] [Green Version]
- Kopantseva, E.E.; Belyavsky, A.V. Key regulators of skeletal myogenesis. Mol. Biol. (Mosk) 2016, 50, 195–222. [Google Scholar] [CrossRef] [PubMed]
- Shi, H.; He, Y.; Li, X.; Du, Y.; Zhao, J.; Ge, C. Regulation of non-coding RNA in the growth and development of skeletal muscle in domestic chickens. Genes (Basel) 2022, 13, 1033. [Google Scholar] [CrossRef]
- Zhang, R.; Wang, J.; Xiao, Z.; Zou, C.; An, Q.; Li, H.; Zhou, X.; Wu, Z.; Shi, D.; Deng, Y.; et al. The expression profiles of mRNAs and lncRNAs in buffalo muscle stem cells driving myogenic differentiation. Front. Genet. 2021, 12, 643497. [Google Scholar] [CrossRef] [PubMed]
- Tan, Y.; Gan, M.; Shen, L.; Li, L.; Fan, Y.; Chen, Y.; Chen, L.; Niu, L.; Zhao, Y.; Jiang, A.; et al. Profiling and functional analysis of long noncoding RNAs and mRNAs during porcine skeletal muscle development. Int. J. Mol. Sci. 2021, 22, 503. [Google Scholar] [CrossRef]
- Pinheiro, A.; Naya, F.J. The key Lnc(RNA)s in cardiac and skeletal muscle development, regeneration, and disease. J. Cardiovasc. Dev. Dis. 2021, 8, 84. [Google Scholar] [CrossRef]
- Li, Y.; Jin, W.; Zhai, B.; Chen, Y.; Li, G.; Zhang, Y.; Guo, Y.; Sun, G.; Han, R.; Li, Z.; et al. LncRNAs and their regulatory networks in breast muscle tissue of Chinese Gushi chickens during late postnatal development. BMC Genom. 2021, 22, 44. [Google Scholar] [CrossRef]
- Zhu, M.; Liu, J.; Xiao, J.; Yang, L.; Cai, M.; Shen, H.; Chen, X.; Ma, Y.; Hu, S.; Wang, Z.; et al. Lnc-mg is a long non-coding RNA that promotes myogenesis. Nat. Commun. 2017, 8, 14718. [Google Scholar] [CrossRef] [Green Version]
- Gong, C.; Li, Z.; Ramanujan, K.; Clay, I.; Zhang, Y.; Lemire-Brachat, S.; Glass, D.J. A long non-coding RNA, LncMyoD, regulates skeletal muscle differentiation by blocking IMP2-mediated mRNA translation. Dev. Cell. 2015, 34, 181–191. [Google Scholar] [CrossRef] [Green Version]
- Jin, J.J.; Lv, W.; Xia, P.; Xu, Z.Y.; Zheng, A.D.; Wang, X.J.; Wang, S.S.; Zeng, R.; Luo, H.M.; Li, G.L.; et al. Long noncoding RNA SYISL regulates myogenesis by interacting with polycomb repressive complex 2. Proc. Natl. Acad. Sci. USA 2018, 115, E9802–E9811. [Google Scholar] [CrossRef] [Green Version]
- Cai, B.; Li, Z.; Ma, M.; Wang, Z.; Han, P.; Abdalla, B.A.; Nie, Q.; Zhang, X. LncRNA-Six1 encodes a micropeptide to activate Six1 in cis and is involved in cell proliferation and muscle growth. Front. Physiol. 2017, 8, 230. [Google Scholar] [CrossRef] [Green Version]
- Dey, B.K.; Mueller, A.C.; Dutta, A. Long non-coding RNAs as emerging regulators of differentiation, development, and disease. Transcription 2014, 5, e944014. [Google Scholar] [CrossRef] [PubMed] [Green Version]
- Zhan, S.; Xue, Y.; Yang, L.; Li, D.; Dai, H.; Zhong, T.; Wang, L.; Dai, D.; Li, L.; Zhang, H. Transcriptome analysis reveals long non-coding natural antisense transcripts involved in muscle development in fetal goat (Capra hircus). Genomics 2022, 114, 110284. [Google Scholar] [CrossRef]
- Li, L.; Chen, Y.; Nie, L.; Ding, X.; Zhang, X.; Zhao, W.; Xu, X.; Kyei, B.; Dai, D.; Zhan, S.; et al. MyoD-induced circular RNA CDR1as promotes myogenic differentiation of skeletal muscle satellite cells. Biochim. Biophys. Acta Gene Regul. Mech. 2019, 1862, 807–821. [Google Scholar] [CrossRef]
- Zhan, S.; Zhang, Y.; Yang, C.; Li, D.; Zhong, T.; Wang, L.; Li, L.; Zhang, H. LncR-133a suppresses myoblast differentiation by sponging miR-133a-3p to activate the FGFR1/ERK1/2 signaling pathway in goats. Genes (Basel) 2022, 13, 818. [Google Scholar] [CrossRef] [PubMed]
- Li, Y.; Chen, X.; Sun, H.; Wang, H. Long non-coding RNAs in the regulation of skeletal myogenesis and muscle diseases. Cancer Lett. 2018, 417, 58–64. [Google Scholar] [CrossRef] [PubMed]
- Wu, P.; Zhou, K.; Zhang, J.; Ling, X.; Zhang, X.; Li, P.; Zhang, L.; Wei, Q.; Zhang, T.; Xie, K.; et al. Transcriptome integration analysis at different embryonic ages reveals key lncRNAs and mRNAs for chicken skeletal muscle. Front. Vet. Sci. 2022, 9, 908255. [Google Scholar] [CrossRef] [PubMed]
- Shabbir, S.; Boruah, P.; Xie, L.; Kulyar, M.F.; Nawaz, M.; Yousuf, S.; Liu, T.; Jabeen, F.; Miao, X. Genome-wide transcriptome profiling uncovers differential miRNAs and lncRNAs in ovaries of Hu sheep at different developmental stages. Sci. Rep. 2021, 11, 5865. [Google Scholar] [CrossRef]
- Kosinska-Selbi, B.; Mielczarek, M.; Szyda, J. Review: Long non-coding RNA in livestock. Animal 2020, 14, 2003–2013. [Google Scholar] [CrossRef]
- Wang, L.; Zhao, Y.; Bao, X.; Zhu, X.; Kwok, Y.K.; Sun, K.; Chen, X.; Huang, Y.; Jauch, R.; Esteban, M.A.; et al. LncRNA Dum interacts with Dnmts to regulate Dppa2 expression during myogenic differentiation and muscle regeneration. Cell Res. 2015, 25, 335–350. [Google Scholar] [CrossRef] [Green Version]
- Cipriano, A.; Macino, M.; Buonaiuto, G.; Santini, T.; Biferali, B.; Peruzzi, G.; Colantoni, A.; Mozzetta, C.; Ballarino, M. Epigenetic regulation of Wnt7b expression by the cis-acting long noncoding RNA Lnc-Rewind in muscle stem cells. eLife 2021, 10, e54782. [Google Scholar] [CrossRef]
- Nie, M.; Deng, Z.L.; Liu, J.; Wang, D.Z. Noncoding RNAs, emerging regulators of skeletal muscle development and diseases. Biomed. Res. Int. 2015, 2015, 676575. [Google Scholar] [CrossRef] [PubMed] [Green Version]
- Yu, J.A.; Wang, Z.; Yang, X.; Ma, M.; Li, Z.; Nie, Q. LncRNA-FKBP1C regulates muscle fiber type switching by affecting the stability of MYH1B. Cell Death Discov. 2021, 7, 73. [Google Scholar] [CrossRef] [PubMed]
- Xie, B.; Zhang, C.; Kang, K.; Jiang, S. miR-599 inhibits vascular smooth muscle cells proliferation and migration by targeting TGFB2. PLoS ONE 2015, 10, e0141512. [Google Scholar] [CrossRef] [PubMed] [Green Version]
- Chiou, F.K.; Rizvi, H.; Quinlivan, R.; Gupte, G.L. Congenital myotonic dystrophy with combined heterozygous ATP8B1/ABCB4 mutation leading to progressive cholestasis and liver failure. JPGN Rep. 2021, 2, e121. [Google Scholar] [CrossRef]
- Faghihi, M.A.; Wahlestedt, C. Regulatory roles of natural antisense transcripts. Nat. Rev. Mol. Cell Biol. 2009, 10, 637–643. [Google Scholar] [CrossRef]
- Song, C.; Yang, Z.; Jiang, R.; Cheng, J.; Yue, B.; Wang, J.; Sun, X.; Huang, Y.; Lan, X.; Lei, C.; et al. lncRNA IGF2 AS regulates bovine myogenesis through different pathways. Mol. Ther. Nucleic. Acids 2020, 21, 874–884. [Google Scholar] [CrossRef]
- Wang, G.Q.; Wang, Y.; Xiong, Y.; Chen, X.C.; Ma, M.L.; Cai, R.; Gao, Y.; Sun, Y.M.; Yang, G.S.; Pang, W.J. Sirt1 AS lncRNA interacts with its mRNA to inhibit muscle formation by attenuating function of miR-34a. Sci. Rep. 2016, 6, 21865. [Google Scholar] [CrossRef] [PubMed] [Green Version]
- Dou, M.; Yao, Y.; Ma, L.; Wang, X.; Shi, X.; Yang, G.; Li, X. The long noncoding RNA MyHC IIA/X-AS contributes to skeletal muscle myogenesis and maintains the fast fiber phenotype. J. Biol. Chem. 2020, 295, 4937–4949. [Google Scholar] [CrossRef] [Green Version]
- Braun, T.; Gautel, M. Transcriptional mechanisms regulating skeletal muscle differentiation, growth and homeostasis. Nat. Rev. Mol. Cell Biol. 2011, 12, 349–361. [Google Scholar] [CrossRef]
- Buckingham, M.; Rigby, P.W. Gene regulatory networks and transcriptional mechanisms that control myogenesis. Dev. Cell 2014, 28, 225–238. [Google Scholar] [CrossRef] [PubMed] [Green Version]
- Berkes, C.A.; Tapscott, S.J. MyoD and the transcriptional control of myogenesis. Semin. Cell Dev. Biol. 2005, 16, 585–595. [Google Scholar] [CrossRef] [PubMed]
- Hernandez-Hernandez, J.M.; Garcia-Gonzalez, E.G.; Brun, C.E.; Rudnicki, M.A. The myogenic regulatory factors, determinants of muscle development, cell identity and regeneration. Semin. Cell Dev. Biol. 2017, 72, 10–18. [Google Scholar] [CrossRef] [PubMed]
- Agarwal, M.; Sharma, A.; Kumar, P.; Kumar, A.; Bharadwaj, A.; Saini, M.; Kardon, G.; Mathew, S.J. Myosin heavy chain-embryonic regulates skeletal muscle differentiation during mammalian development. Development 2020, 147, dev.184507. [Google Scholar] [CrossRef] [PubMed]
- Li, Z.; Cai, B.; Abdalla, B.A.; Zhu, X.; Zheng, M.; Han, P.; Nie, Q.; Zhang, X. LncIRS1 controls muscle atrophy via sponging miR-15 family to activate IGF1-PI3K/AKT pathway. J. Cachexia Sarcopenia Muscle 2019, 10, 391–410. [Google Scholar] [CrossRef] [Green Version]
- Li, R.; Li, B.; Shen, M.; Cao, Y.; Zhang, X.; Li, W.; Tao, J.; Wu, W.; Liu, H. LncRNA 2310043L19Rik inhibits differentiation and promotes proliferation of myoblast by sponging miR-125a-5p. Aging (Albany NY) 2020, 12, 5625–5639. [Google Scholar] [CrossRef]
- Wang, S.; Tan, B.; Xiao, L.; Zeng, J.; Zhao, X.; Hong, L.; Li, Z.; Cai, G.; Zheng, E.; Gu, T.; et al. Long non-coding RNA Gm10561 promotes myogenesis by sponging miR-432. Epigenetics 2022, 17, 2039–2055. [Google Scholar] [CrossRef]
- Cesana, M.; Cacchiarelli, D.; Legnini, I.; Santini, T.; Sthandier, O.; Chinappi, M.; Tramontano, A.; Bozzoni, I. A long noncoding RNA controls muscle differentiation by functioning as a competing endogenous RNA. Cell 2011, 147, 358–369. [Google Scholar] [CrossRef] [Green Version]
- Zhao, W.; Chen, L.; Zhong, T.; Wang, L.J.; Guo, J.Z.; Dong, Y.; Feng, J.; Song, T.Z.; Li, L.; Zhang, H.P. The differential proliferation and differentiation ability of skeletal muscle satellite cell in Boer and Nanjiang brown goats. Small Ruminant. Res. 2018, 169, 99–107. [Google Scholar] [CrossRef]
- Langmead, B.; Salzberg, S.L. Fast gapped-read alignment with Bowtie 2. Nat. Methods 2012, 9, 357–359. [Google Scholar] [CrossRef] [PubMed] [Green Version]
- Bickhart, D.M.; Rosen, B.D.; Koren, S.; Sayre, B.L.; Hastie, A.R.; Chan, S.; Lee, J.; Lam, E.T.; Liachko, I.; Sullivan, S.T.; et al. Single-molecule sequencing and chromatin conformation capture enable de novo reference assembly of the domestic goat genome. Nat. Genet. 2017, 49, 643–650. [Google Scholar] [CrossRef] [PubMed] [Green Version]
- Kim, D.; Langmead, B.; Salzberg, S.L. HISAT: A fast spliced aligner with low memory requirements. Nat. Methods 2015, 12, 357–360. [Google Scholar] [CrossRef] [PubMed] [Green Version]
- Pertea, M.; Pertea, G.M.; Antonescu, C.M.; Chang, T.C.; Mendell, J.T.; Salzberg, S.L. StringTie enables improved reconstruction of a transcriptome from RNA-seq reads. Nat. Biotechnol. 2015, 33, 290–295. [Google Scholar] [CrossRef] [PubMed] [Green Version]
- Roberts, A.; Pimentel, H.; Trapnell, C.; Pachter, L. Identification of novel transcripts in annotated genomes using RNA-Seq. Bioinformatics 2011, 27, 2325–2329. [Google Scholar] [CrossRef] [Green Version]
- Sun, L.; Luo, H.; Bu, D.; Zhao, G.; Yu, K.; Zhang, C.; Liu, Y.; Chen, R.; Zhao, Y. Utilizing sequence intrinsic composition to classify protein-coding and long non-coding transcripts. Nucleic Acids Res. 2013, 41, e166. [Google Scholar] [CrossRef]
- Kong, L.; Zhang, Y.; Ye, Z.Q.; Liu, X.Q.; Zhao, S.Q.; Wei, L.; Gao, G. CPC: Assess the protein-coding potential of transcripts using sequence features and support vector machine. Nucleic Acids Res. 2007, 35, W345–W349. [Google Scholar] [CrossRef]
- Li, B.; Dewey, C.N. RSEM: Accurate transcript quantification from RNA-Seq data with or without a reference genome. BMC Bioinform. 2011, 12, 323. [Google Scholar] [CrossRef] [Green Version]
- Love, M.I.; Huber, W.; Anders, S. Moderated estimation of fold change and dispersion for RNA-seq data with DESeq2. Genome Biol. 2014, 15, 550. [Google Scholar] [CrossRef] [Green Version]
- Tafer, H.; Hofacker, I.L. RNAplex: A fast tool for RNA-RNA interaction search. Bioinformatics 2008, 24, 2657–2663. [Google Scholar] [CrossRef] [Green Version]
- Shannon, P.; Markiel, A.; Ozier, O.; Baliga, N.S.; Wang, J.T.; Ramage, D.; Amin, N.; Schwikowski, B.; Ideker, T. Cytoscape: A software environment for integrated models of biomolecular interaction networks. Genome Res. 2003, 13, 2498–2504. [Google Scholar] [CrossRef] [PubMed]
- Thomson, D.W.; Dinger, M.E. Endogenous microRNA sponges: Evidence and controversy. Nat. Rev. Genet. 2016, 17, 272–283. [Google Scholar] [CrossRef]
- Wang, A.; Ji, Z.; Xuan, R.; Zhao, X.; Hou, L.; Li, Q.; Chu, Y.; Chao, T.; Wang, J. Differentially expressed miRNAs of goat submandibular glands among three developmental stages are involved in immune functions. Front. Genet. 2021, 12, 678194. [Google Scholar] [CrossRef]
- Enright, A.J.; John, B.; Gaul, U.; Tuschl, T.; Sander, C.; Marks, D.S. MicroRNA targets in Drosophila. Genome Biol. 2003, 5, R1. [Google Scholar] [CrossRef] [PubMed] [Green Version]
- Sethupathy, P.; Megraw, M.; Hatzigeorgiou, A.G. A guide through present computational approaches for the identification of mammalian microRNA targets. Nat. Methods 2006, 3, 881–886. [Google Scholar] [CrossRef] [PubMed]
- Zhang, Y.; Zhang, X.D.; Liu, X.; Li, Y.S.; Ding, J.P.; Zhang, X.R.; Zhang, Y.H. Reference gene screening for analyzing gene expression across goat tissue. Asian-Australas J. Anim. Sci. 2013, 26, 1665–1671. [Google Scholar] [CrossRef] [PubMed] [Green Version]
- Chen, L.; Zhao, W.; Zhan, S.; Li, D.; Li, L.; Zhong, T.; Wang, L.; Zhang, H. The expression stability analysis of reference genes in the different tissues and skeletal muscle of different development periods in goat. Acta Vet. Zootech. Sin. 2014, 45, 1228–1236. [Google Scholar] [CrossRef]
- Livak, K.J.; Schmittgen, T.D. Analysis of relative gene expression data using real-time quantitative PCR and the 2 ΔΔ C T method. Methods 2001, 25, 402–408. [Google Scholar] [CrossRef]


Disclaimer/Publisher’s Note: The statements, opinions and data contained in all publications are solely those of the individual author(s) and contributor(s) and not of MDPI and/or the editor(s). MDPI and/or the editor(s) disclaim responsibility for any injury to people or property resulting from any ideas, methods, instructions or products referred to in the content. |
© 2023 by the authors. Licensee MDPI, Basel, Switzerland. This article is an open access article distributed under the terms and conditions of the Creative Commons Attribution (CC BY) license (https://creativecommons.org/licenses/by/4.0/).
Share and Cite
Yang, C.; Zhou, X.; Xue, Y.; Li, D.; Wang, L.; Zhong, T.; Dai, D.; Cao, J.; Guo, J.; Li, L.; et al. Transcriptome Analysis Reveals the Profile of Long Non-Coding RNAs during Myogenic Differentiation in Goats. Int. J. Mol. Sci. 2023, 24, 6370. https://doi.org/10.3390/ijms24076370
Yang C, Zhou X, Xue Y, Li D, Wang L, Zhong T, Dai D, Cao J, Guo J, Li L, et al. Transcriptome Analysis Reveals the Profile of Long Non-Coding RNAs during Myogenic Differentiation in Goats. International Journal of Molecular Sciences. 2023; 24(7):6370. https://doi.org/10.3390/ijms24076370
Chicago/Turabian StyleYang, Chenyu, Xinyi Zhou, Yanan Xue, Dandan Li, Linjie Wang, Tao Zhong, Dinghui Dai, Jiaxue Cao, Jiazhong Guo, Li Li, and et al. 2023. "Transcriptome Analysis Reveals the Profile of Long Non-Coding RNAs during Myogenic Differentiation in Goats" International Journal of Molecular Sciences 24, no. 7: 6370. https://doi.org/10.3390/ijms24076370