
Stochastic Dynamic Mass Spectrometric Quantitative and Structural Analyses of Pharmaceutics and Biocides in Biota and Sewage Sludge

Abstract
:1. Introduction
2. Results and Discussion
2.1. Mass Spectrometric Data
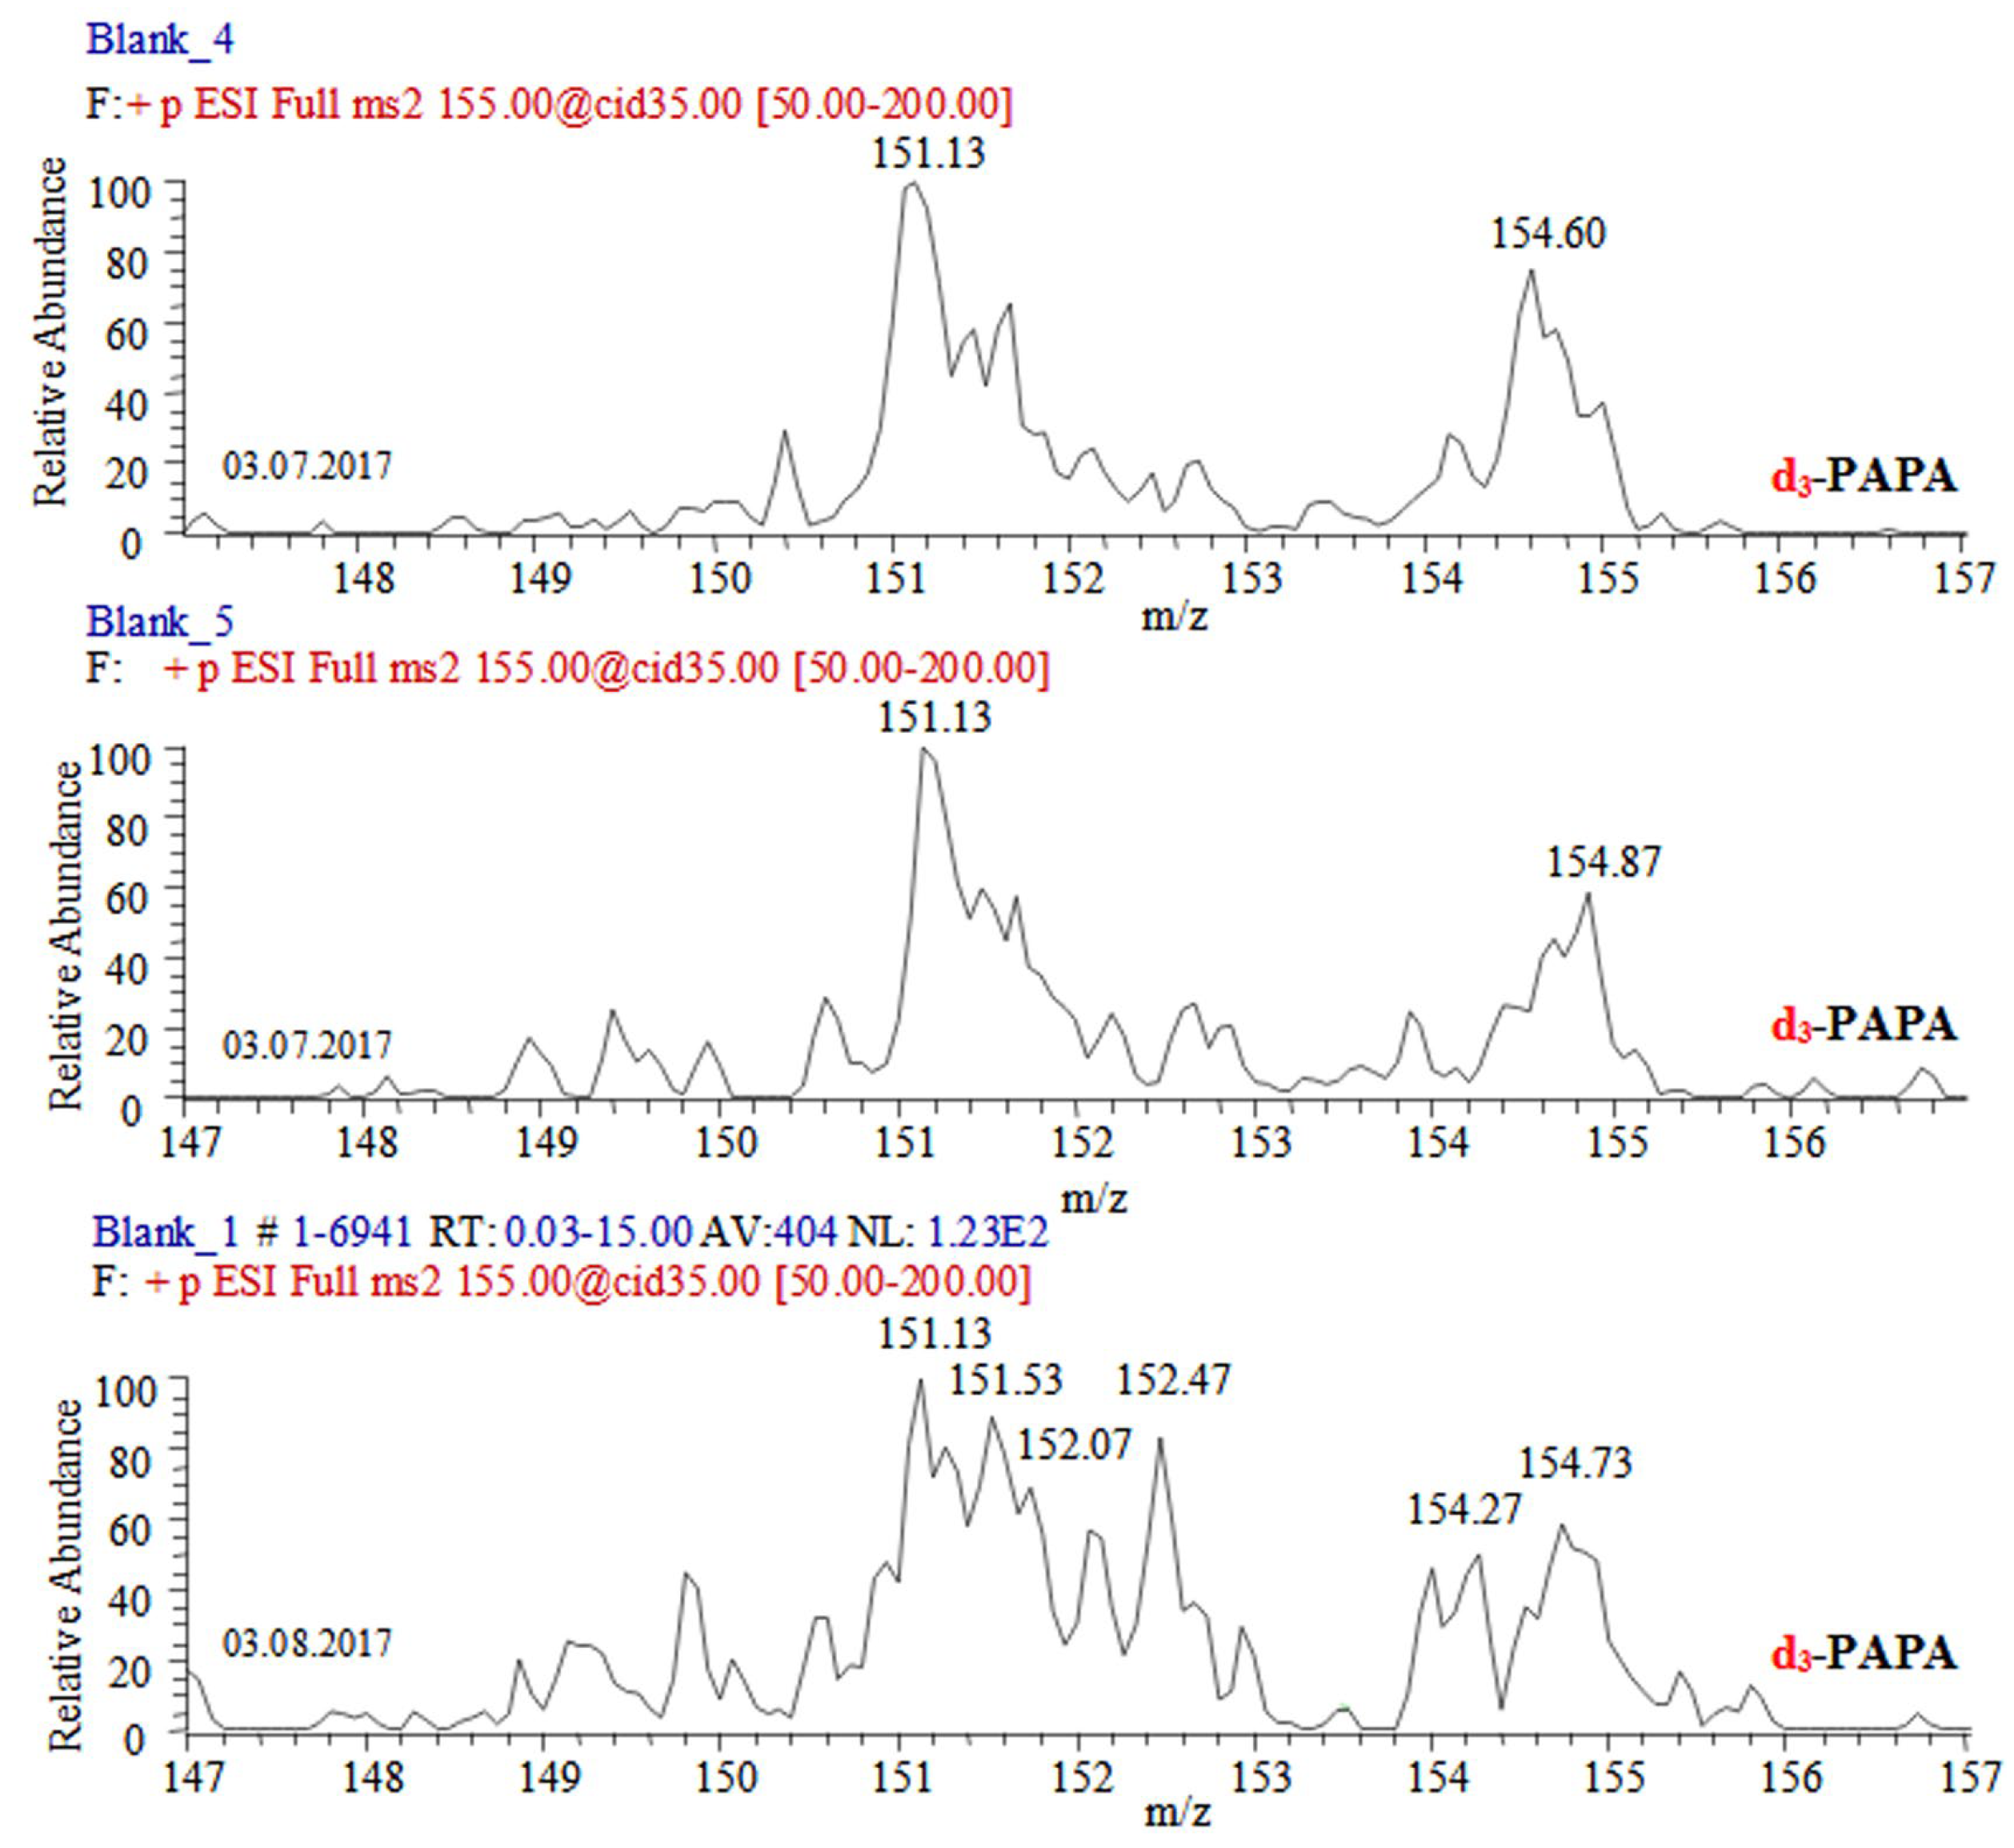
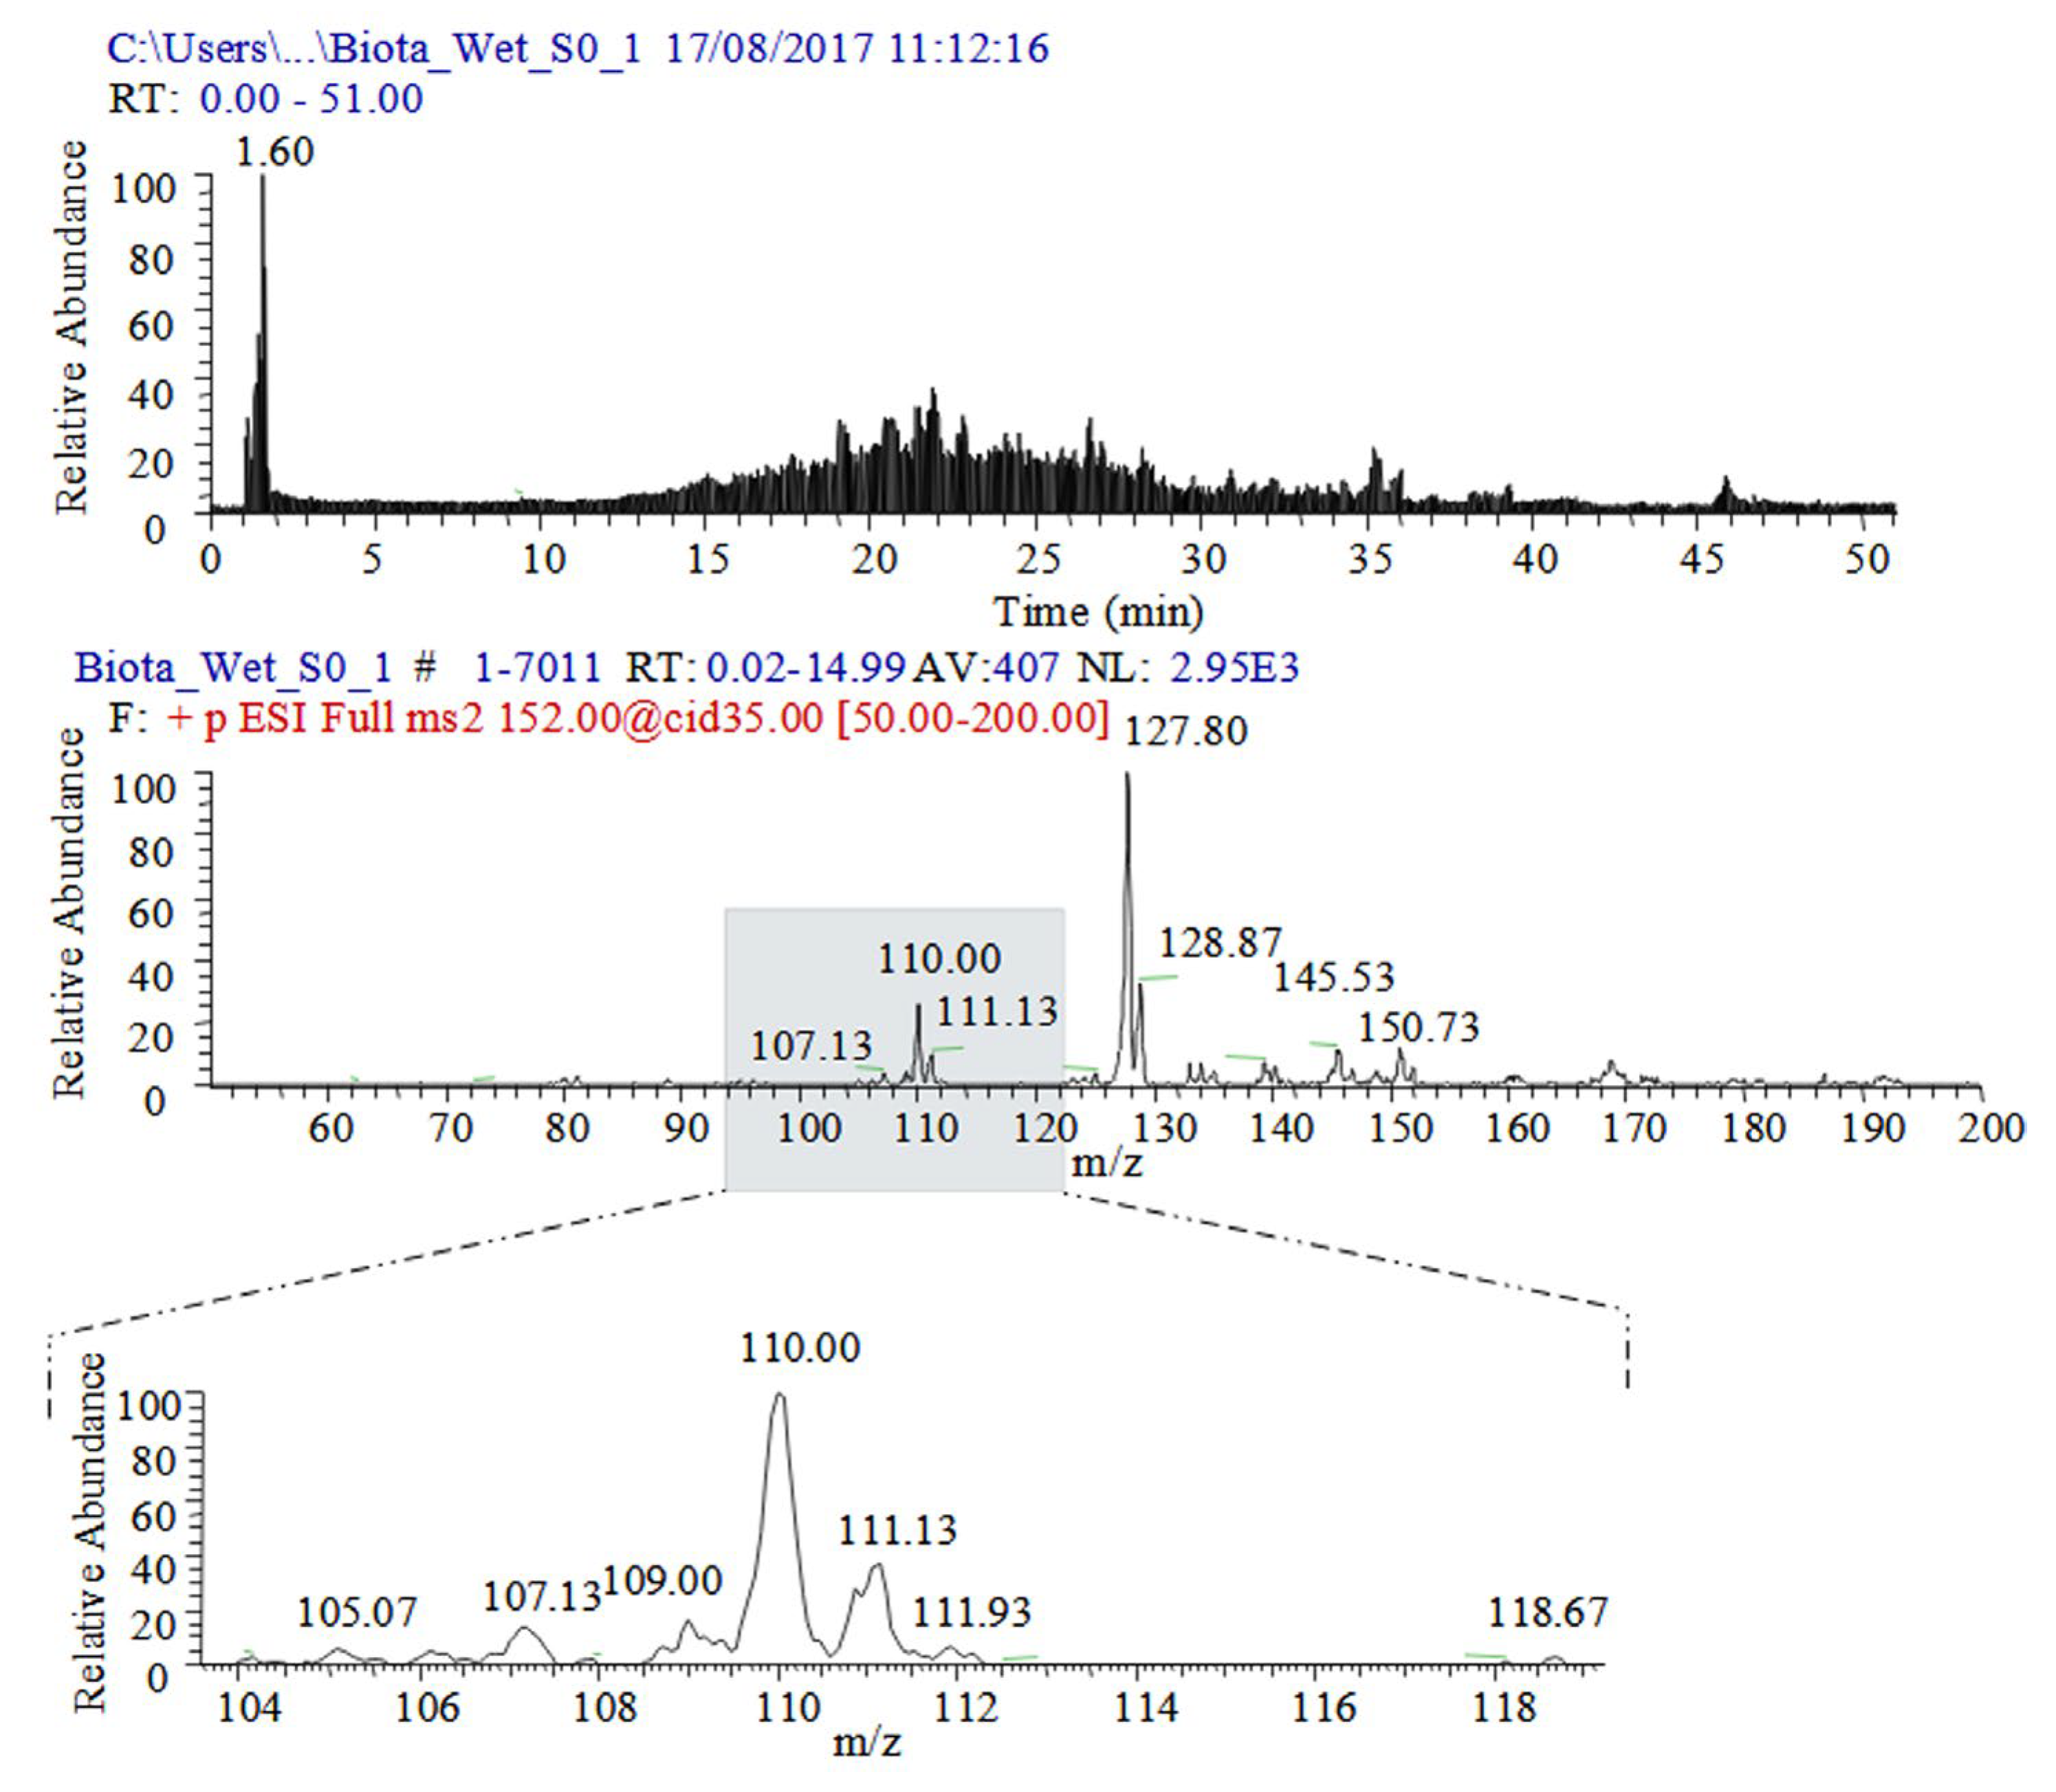
2.1.1. Mass Spectrometric Fragmentation Reactions of Paracetamol and Its d3-Derivative
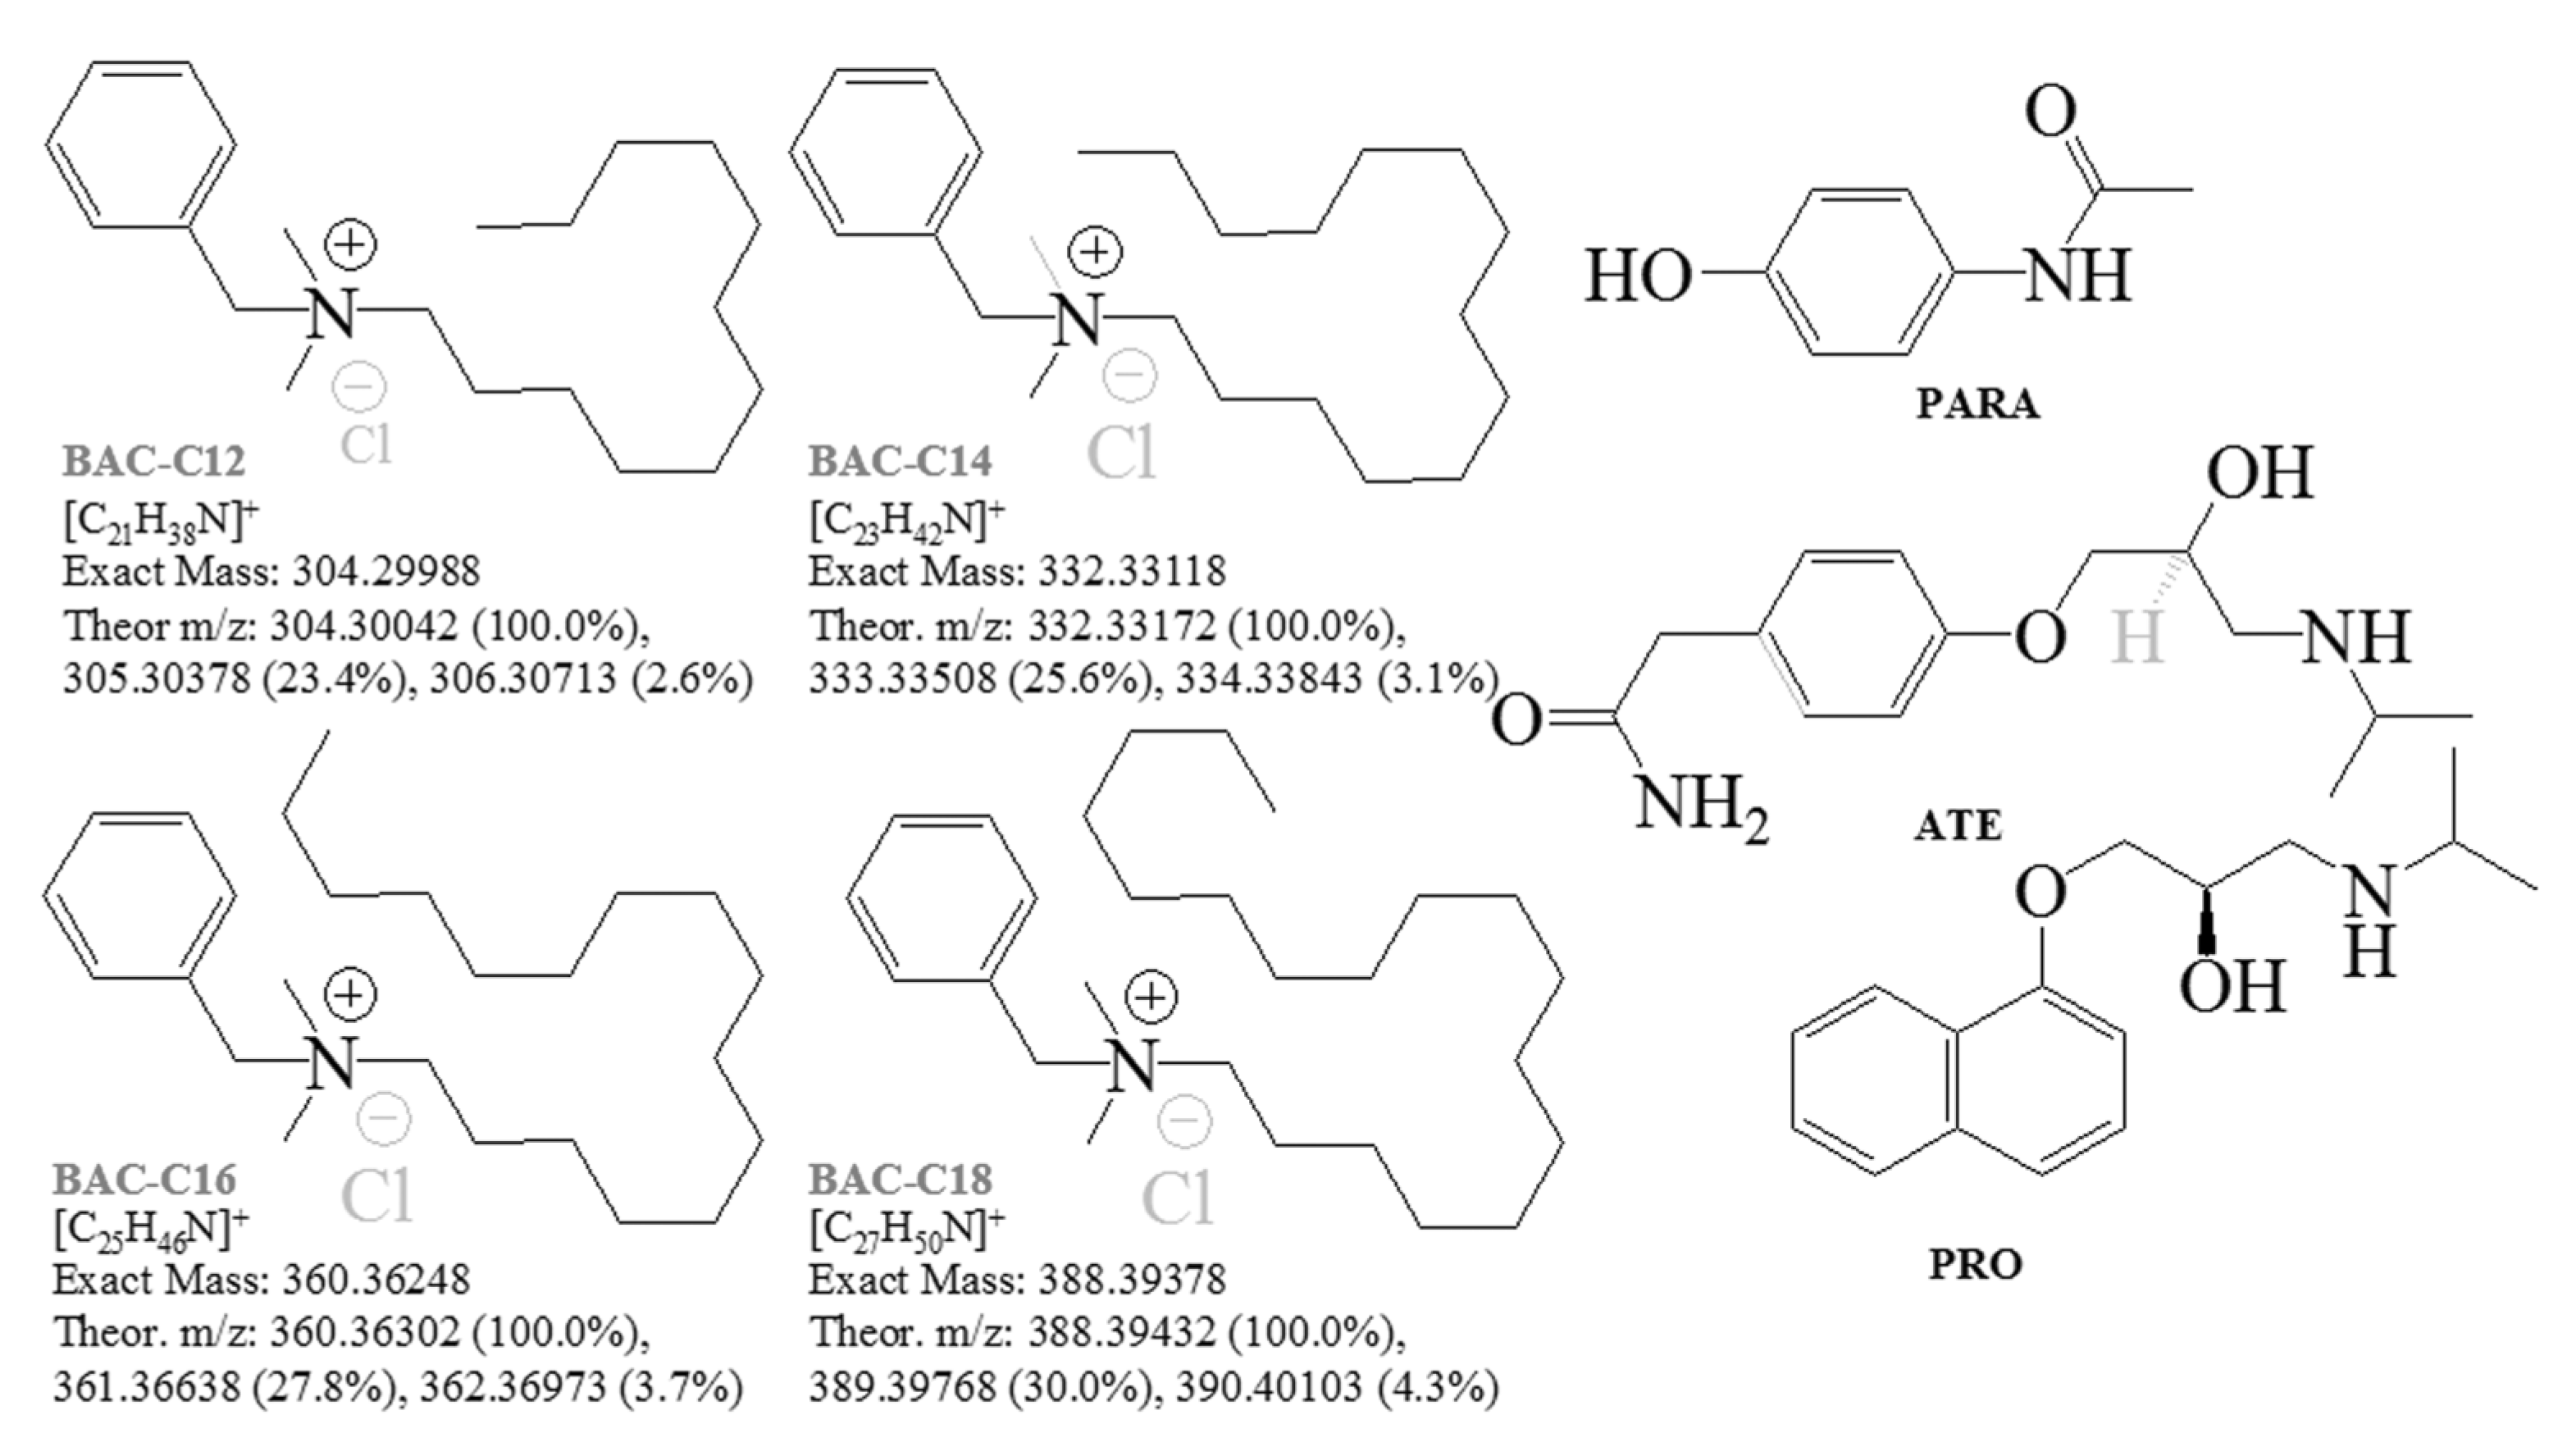
2.1.2. Mass Spectrometric Fragmentation Reactions of Biocides
2.1.3. Mass Spectrometric Fragmentation Reactions of β-Blockers
2.2. Determination of Stochastic Dynamic Diffusion Parameters
2.3. Quantitative Data on Biocides
2.4. Quantitative Functions between Mass Spectrometric Stochastic Dynamic Diffusion Parameters and Theoretical Total Intensity Variables with Respect to Experimental Parameter Collision Energy
2.5. Theoretical Data
2.5.1. 3D Molecular Conformations and Electronic Structures of Analytes and Energetics
2.5.2. Determination of Quantum Chemical Diffusion Data
2.6. Correlative Data on Mass Spectrometry and Quantum Chemistry
3. Discussion
4. Materials and Methods
4.1. Chemicals and analytical instrumentation
4.2. Sample Preparation Methods, Samples, and Solutions
4.3. Theory/Computations
4.4. Chemometrics
5. Conclusions
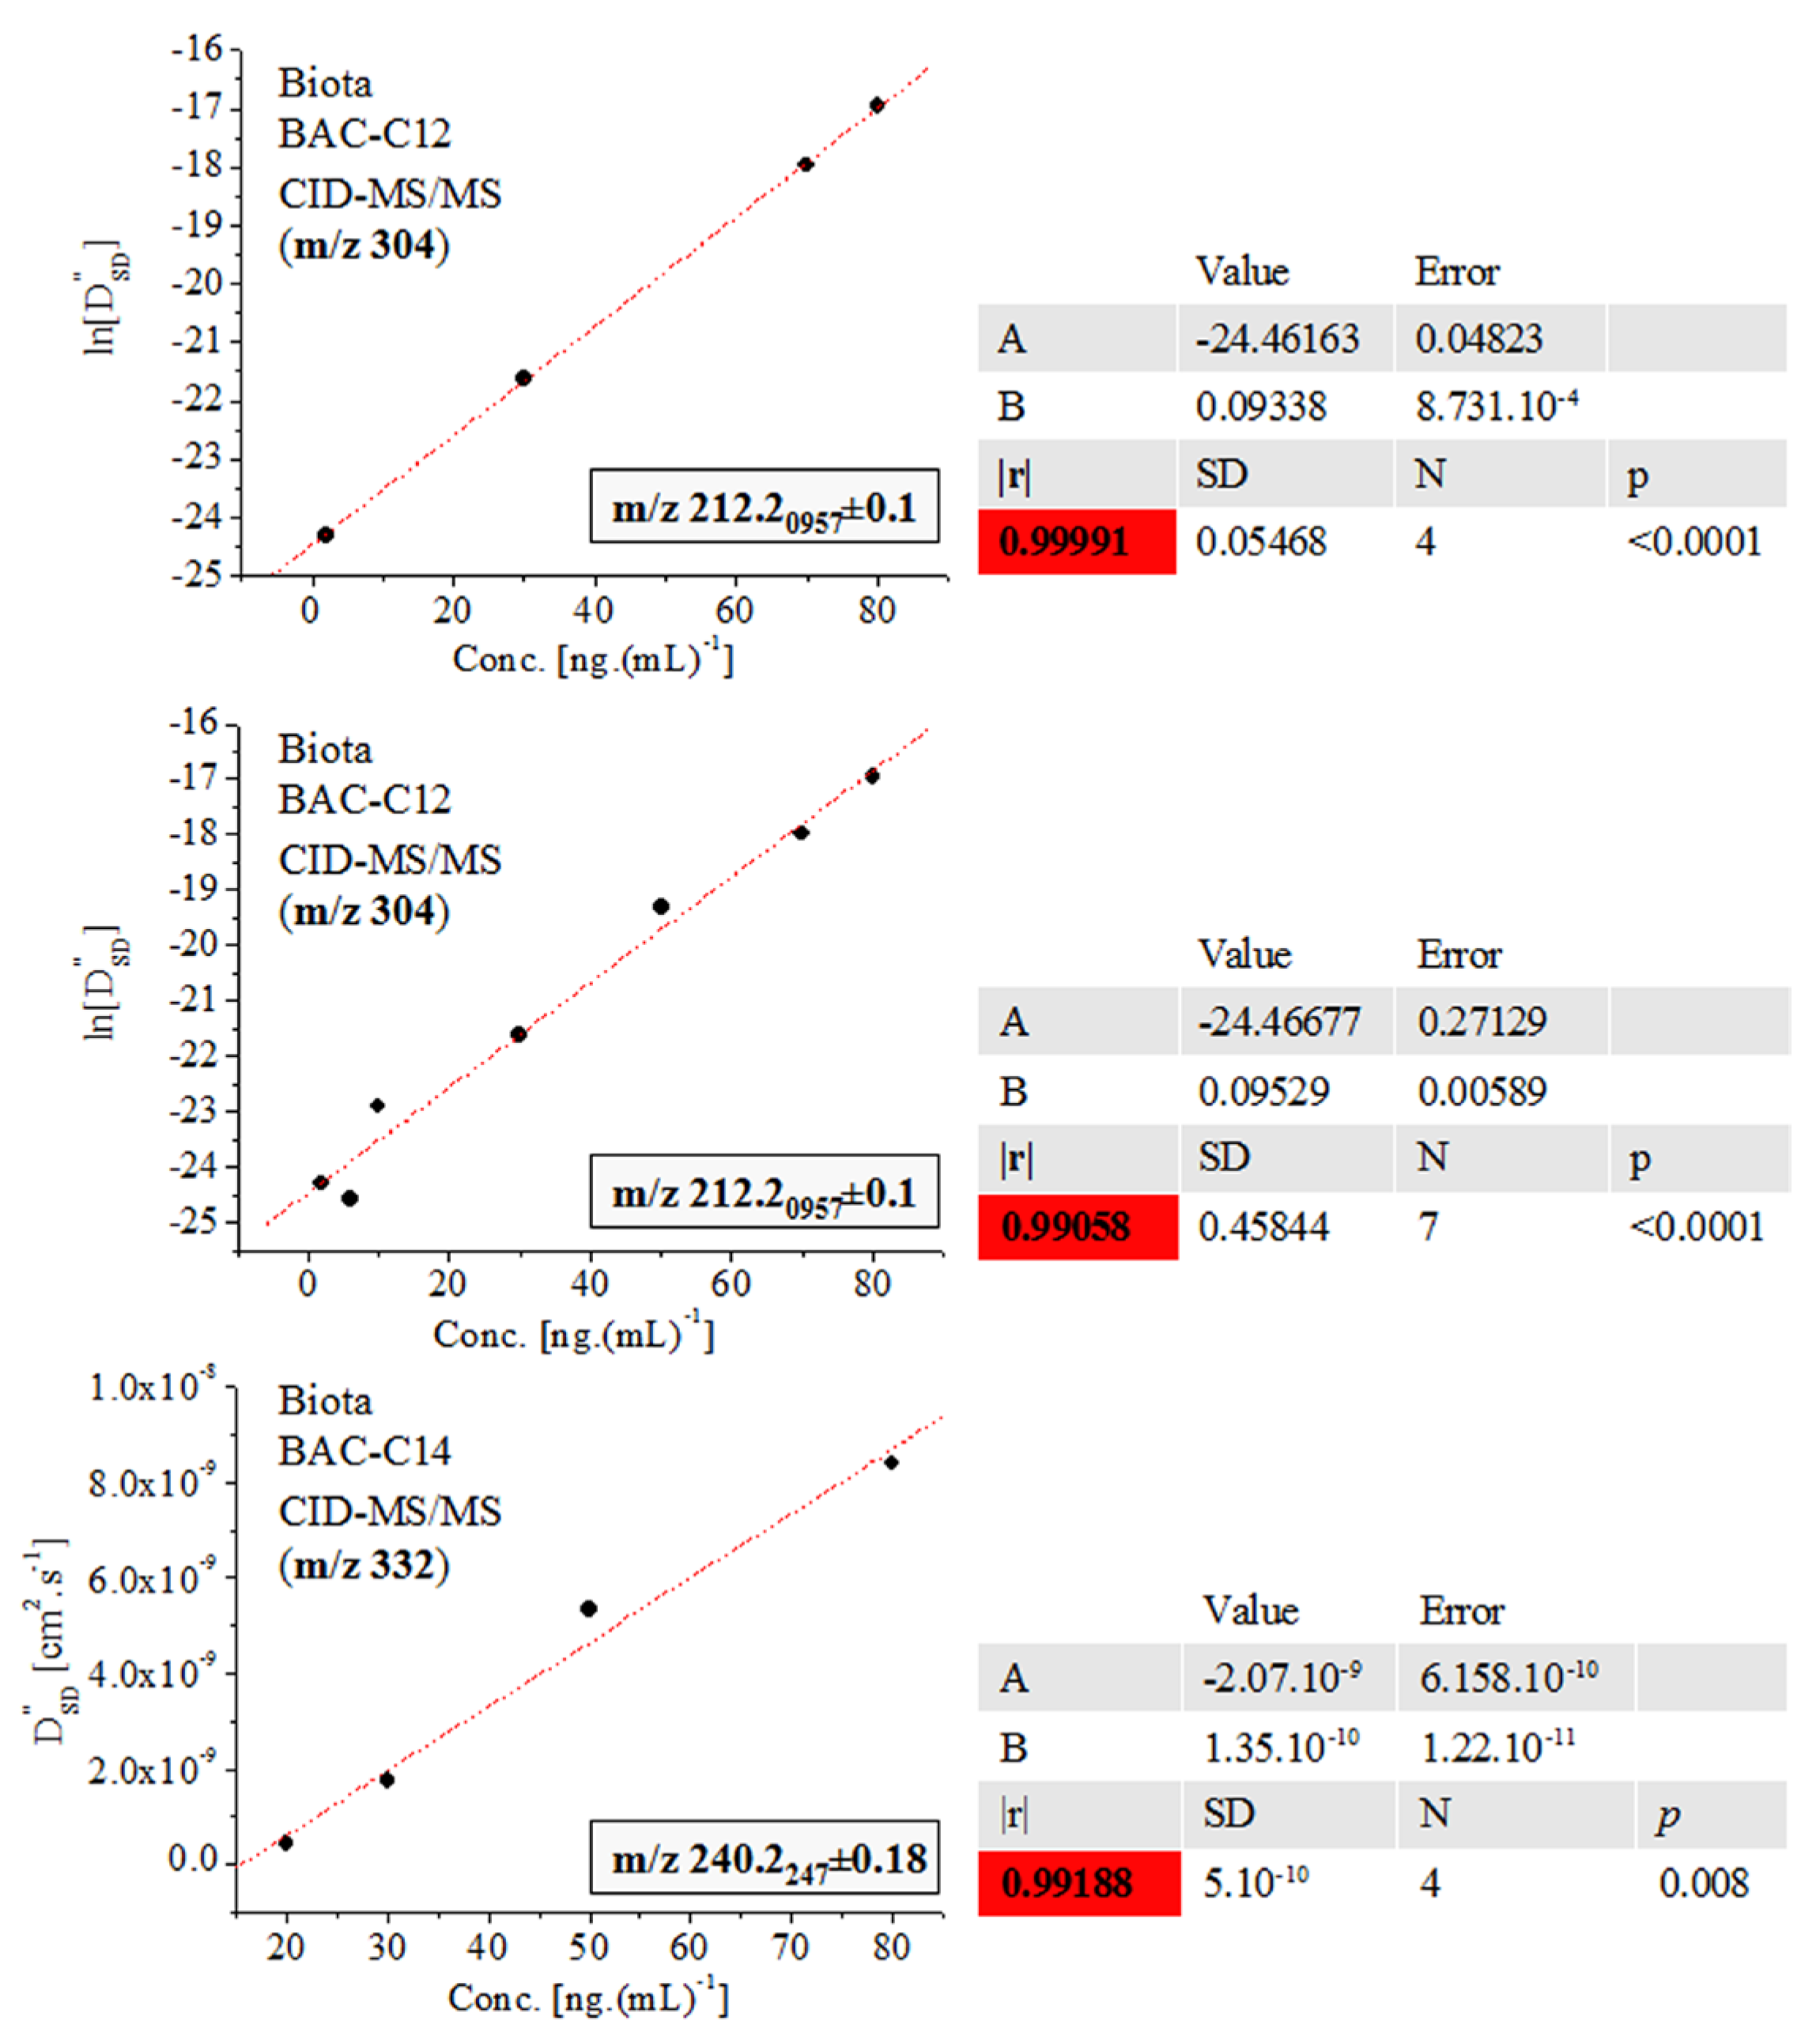
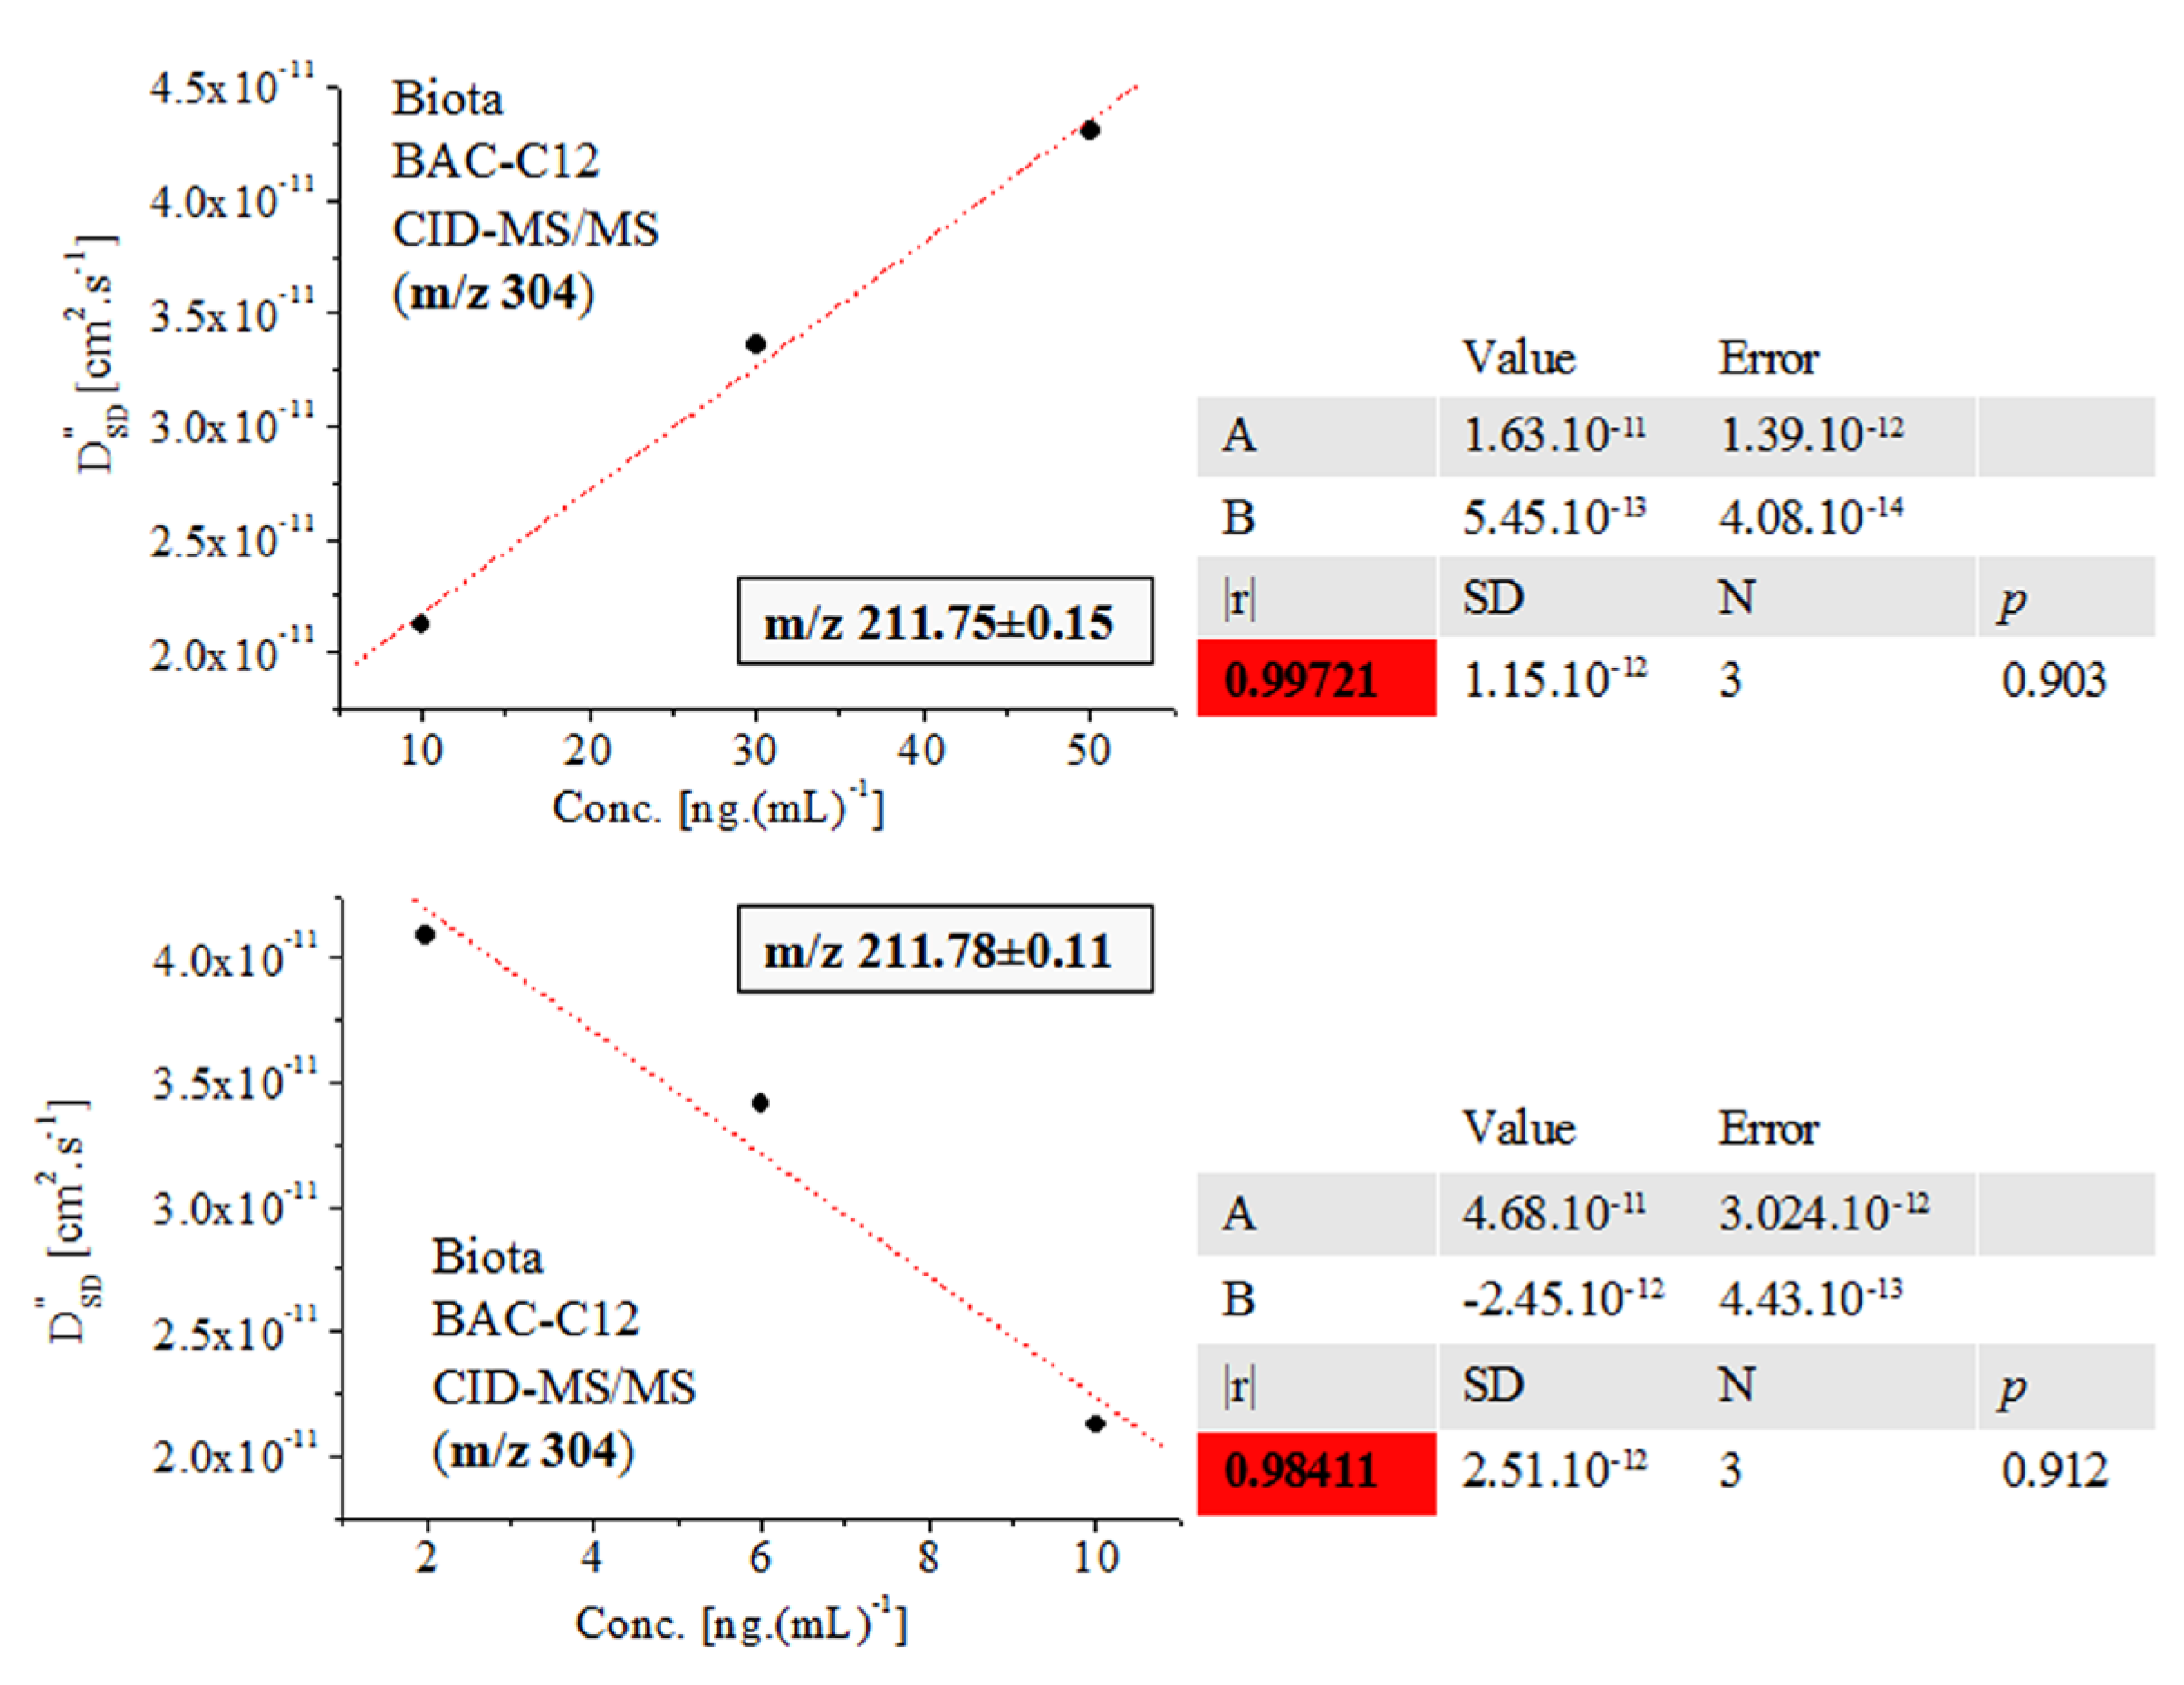
- (A)
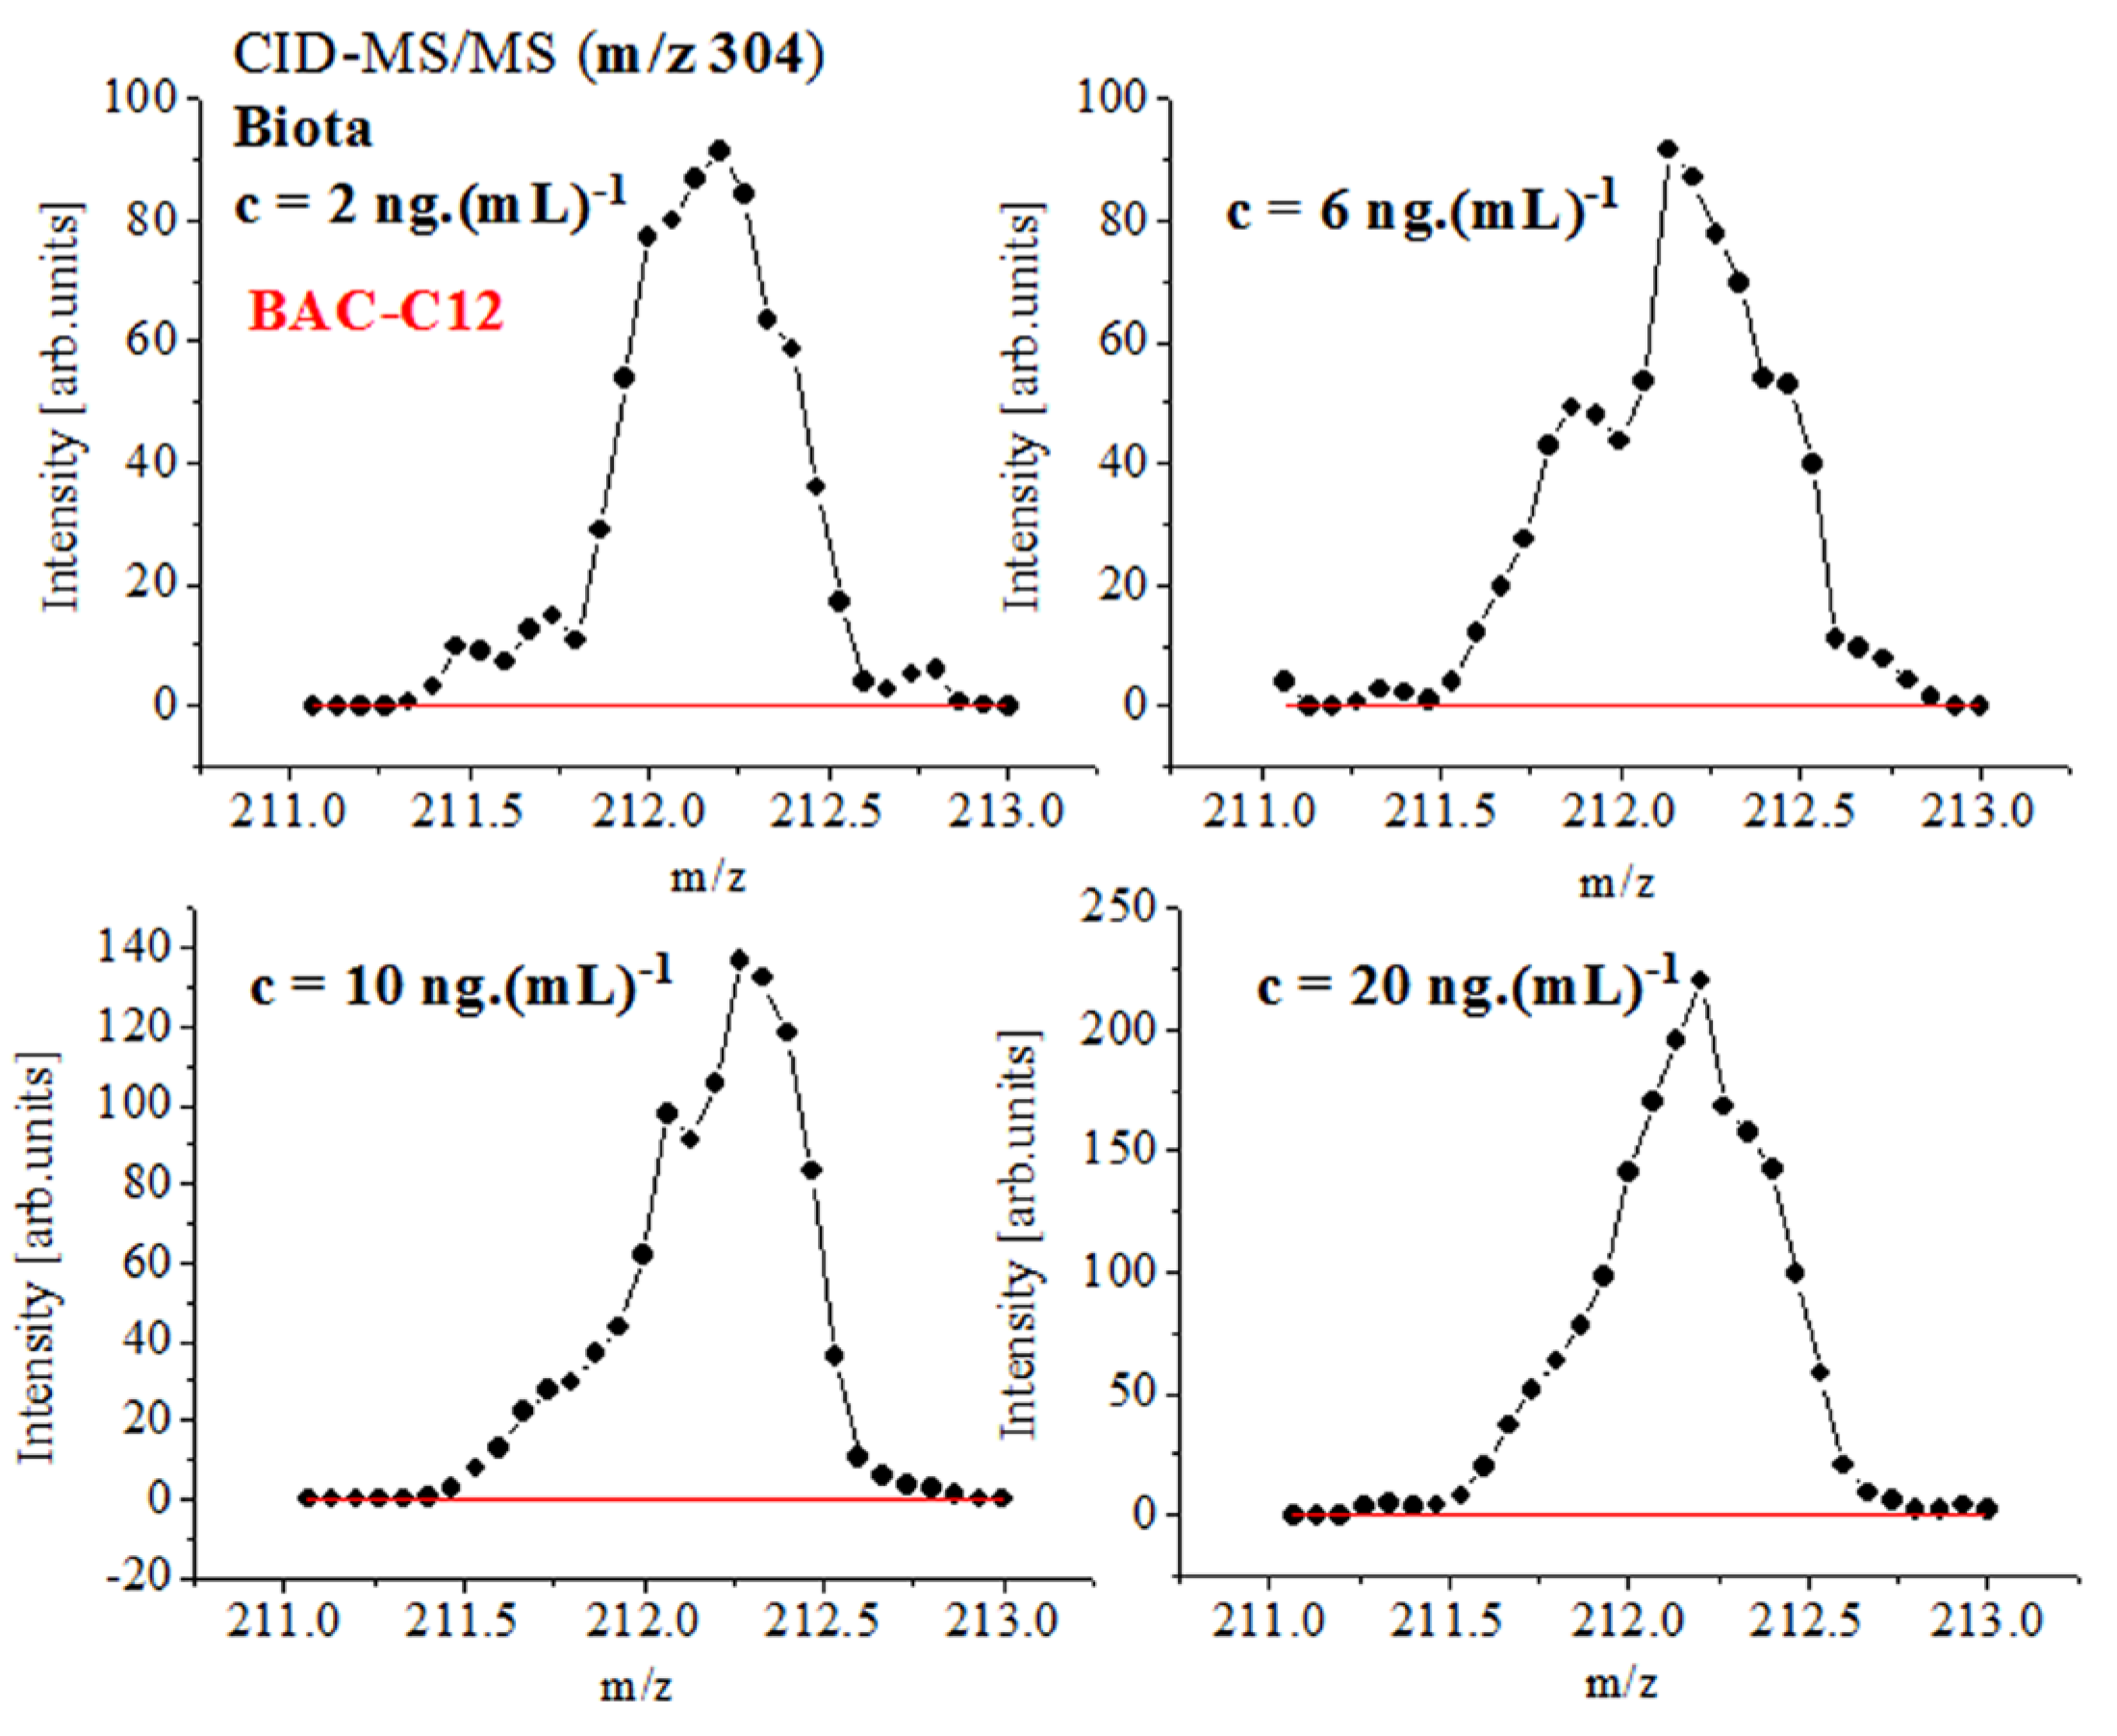
- In testing the capability of Equation (2) [] to quantify the MS intensity of analyte ions with a short span of scan time, we contrasted the use of classical quantitative methods based on ICIS and trapezoidal integration algorithms of peak detection. The analysis of surfactants in biota via equation ln[D″SD] = f(conc.) yields |r| = 0.99991 examining the peaks of BAC-C12 at m/z 212.209 ± 0.1 and 211.75 ± 0.15.
- (B)
- Equation (4) [] has been proven for PARA ions. The relation between <I>exp and <I>theor shows|r|= 0.99429 and 0.96501.
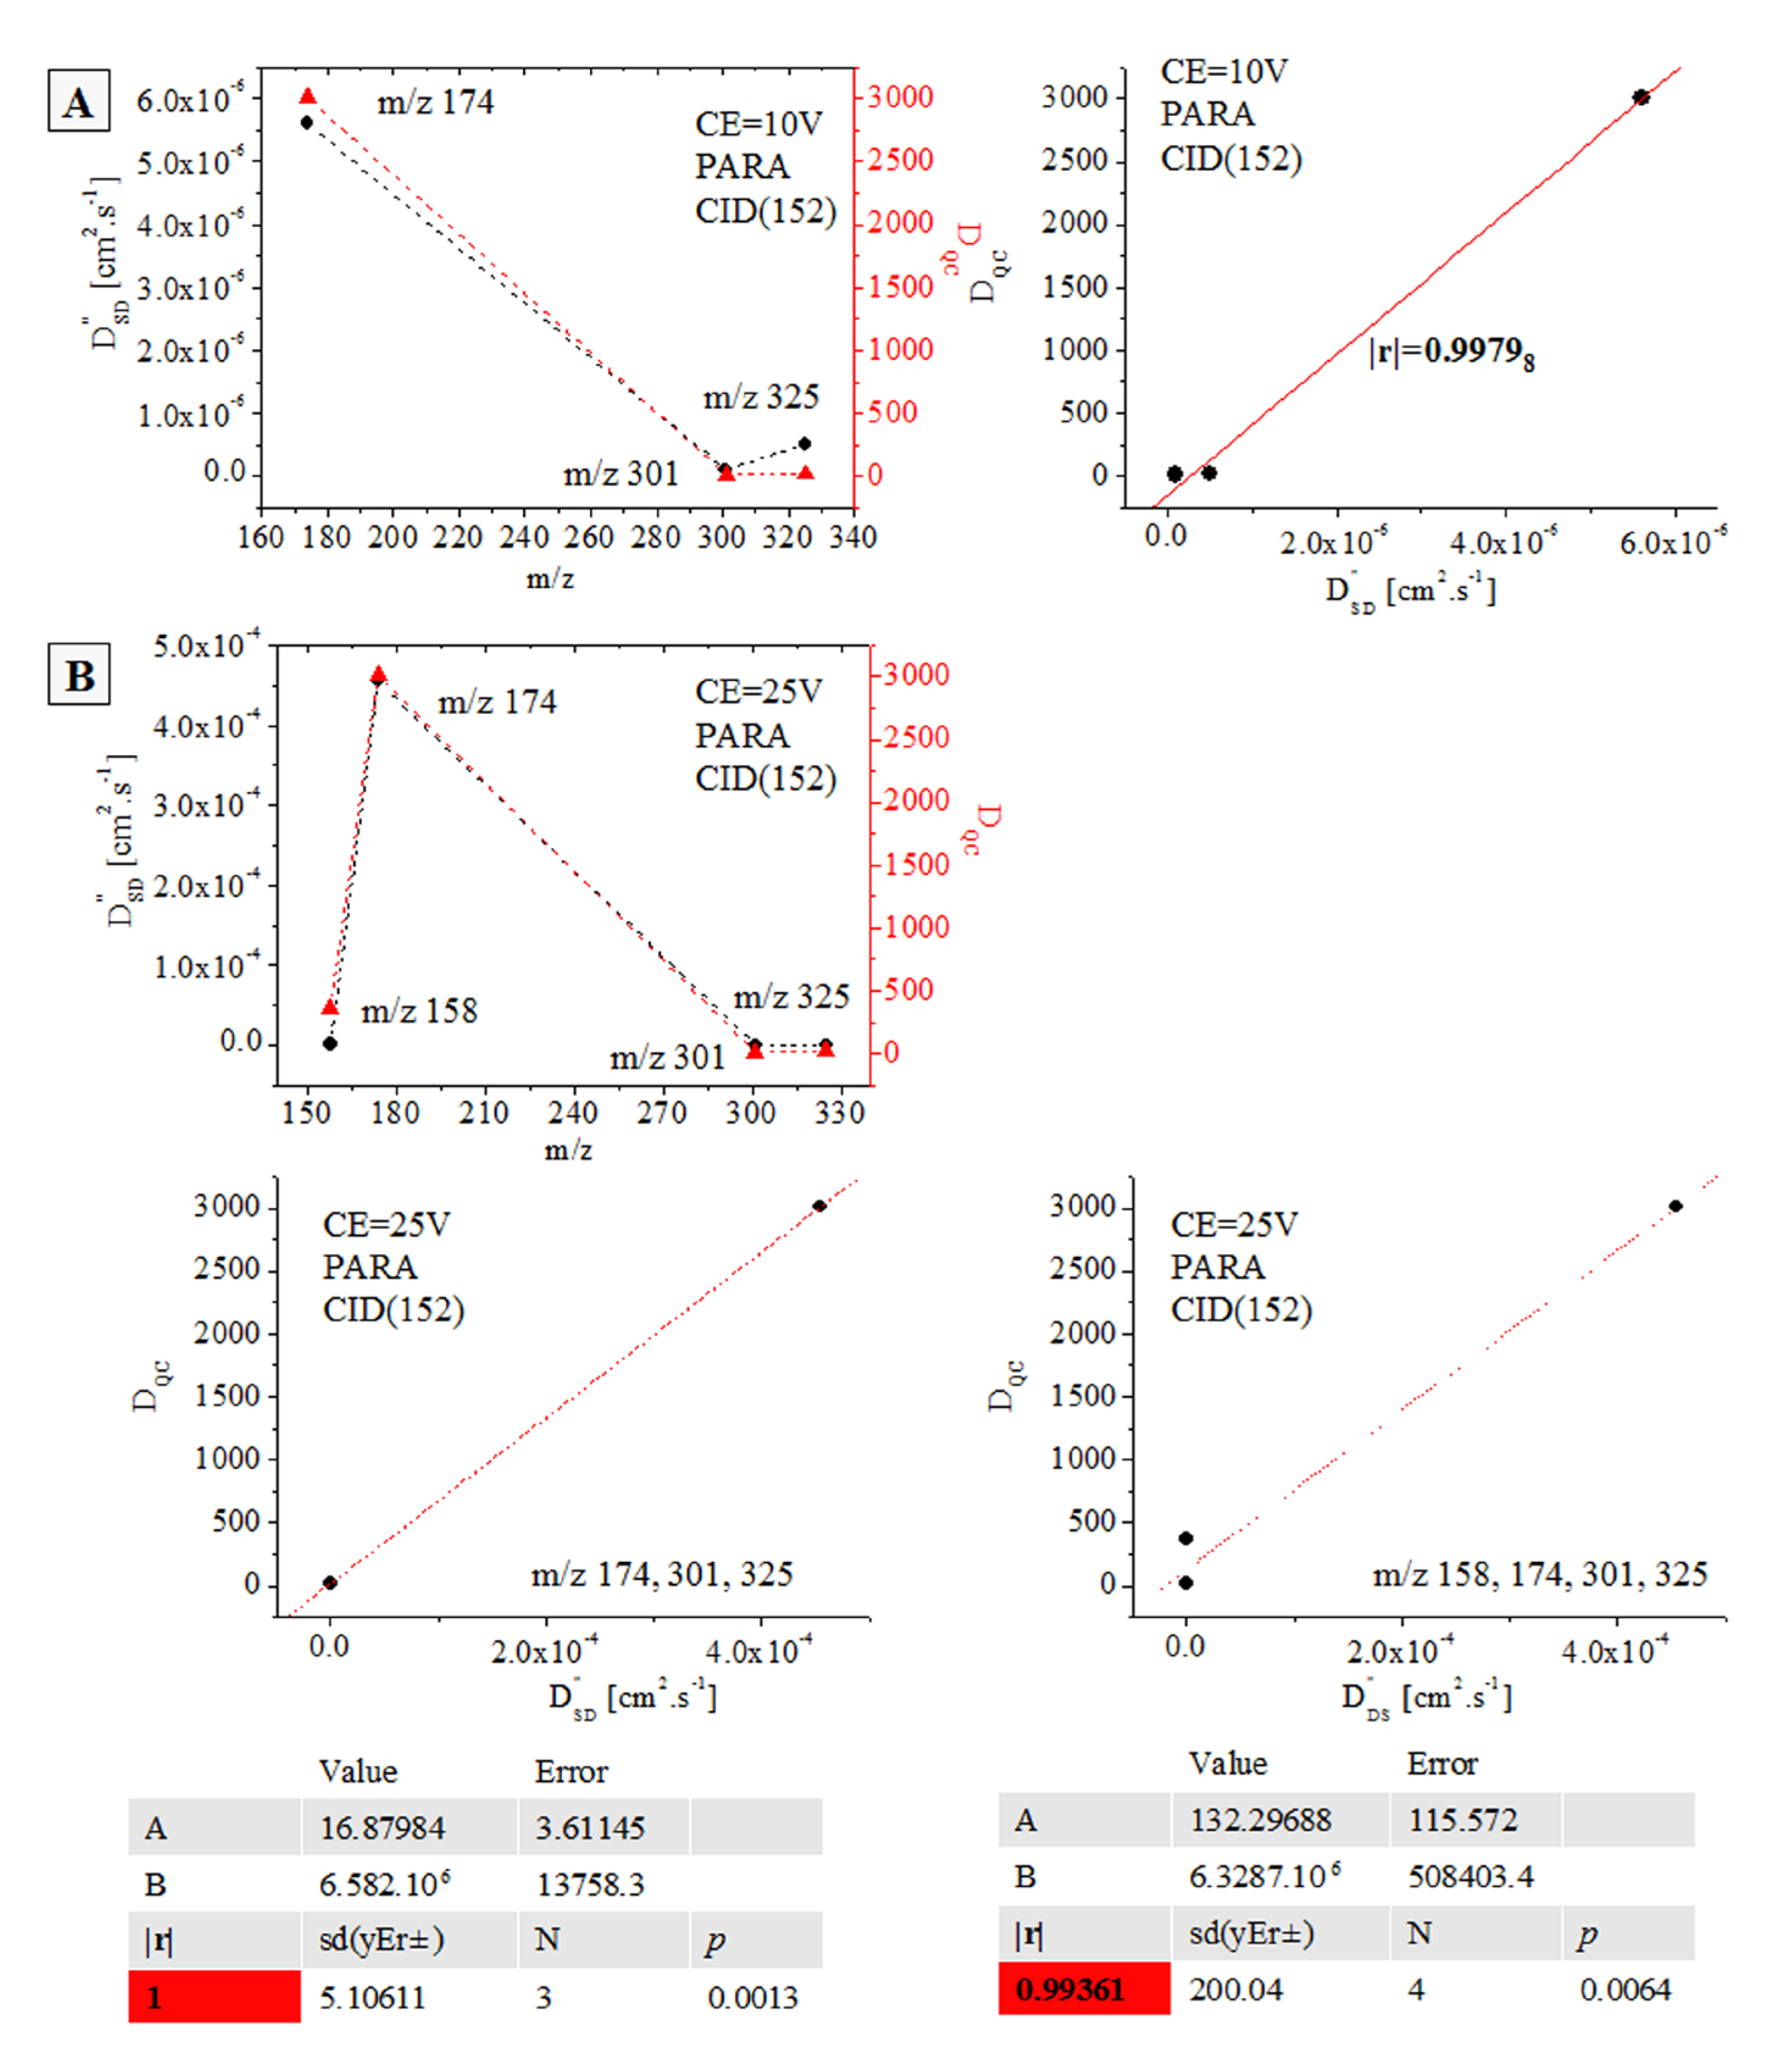
- (C)
- Parameter |r| = 1 has been obtained, determining the 3D molecular structures of PARA and its ions at m/z 152, 158, 174, 301, and 325 via the assessment of relation D″SD = f(DQC) in biota at CE = 25 V.
Supplementary Materials
Funding
Institutional Review Board Statement
Informed Consent Statement
Data Availability Statement
Acknowledgments
Conflicts of Interest
Abbreviations
| ANOVA | Analysis of variance (chemometric method) |
| APCI | Atmospheric pressure chemical ionization (mass spectrometric method) |
| ATE | Atenolol |
| BAC-C12 | Benzyl-dodecyl-dimethyl-ammonium chloride |
| BAC-C14 | Benzyl-dimethyl-tetradecyl-ammonium chloride |
| BAC-C16 | Benzyl-hexadecyl-dimethyl-ammonium chloride |
| BAC-C18 | Benzyl-dimethyl-octadecyl-ammonium chloride |
| BOMD | Born-Oppenheimer molecular dynamics |
| CID | Collision-induced dissociation (mass spectrometric operation mode) |
| CE | Collision energy |
| DFT | Density functional theory (quantum chemical method) |
| DoF | Number of points–number of parameters |
| DQC | Quantum chemical diffusion parameter according to Arrhenius’s theory |
| DSD,DSD’’ | Stochastic dynamic diffusion parameters according to our theory |
| ESI | Electrospray ionization (mass spectrometric method) |
| FT-ICR | Fourier transform ion cyclotron resonance (mass spectrometric method) |
| GS | Ground state |
| IS | Internal standard |
| LMW | Low molecular weight (analyte) |
| MD | Molecular dynamics |
| MM | Molecular mechanics |
| MS | Mass spectrometry |
| MS/MS | Tandem mass spectrometric operation mode |
| PARA | Paracetamol |
| PES | Potential energy surface |
| PRO | Propranolol |
| QuEChERS | Quick, easy, cheap, effective, rugged, and safe (extraction method) |
| |r| | Statistical coefficient of linear correlation (chemometrics) |
| SD | Stochastic dynamics |
| SIM | Selected ion monitoring (mass spectrometric operation mode) |
| sd(yEr±) | Standard deviation (chemometrics) |
| SRM | Selected reaction monitoring (mass spectrometric operation mode) |
| se(yEr±) | Standard error (chemometrics) |
| TIA | Trapezoidal integration approach |
| TS | Transition state |
| νoi | Frequencies at a stationary state of potential energy |
| νsi | Frequency in a transition state of potential energy |
| H# | Activation enthalpy |
References
- Townsend, R. Mass spectrometric investigation of pharmaceuticals in environmental matrices: Homogenate analysis. Ph.D. Thesis, Swansea University, Swansea, UK, 2019. Available online: http://cronfa.swan.ac.uk/Record/cronfa50205 (accessed on 1 January 2019).
- Gardner, M.; Comber, S.; Ellor, B. Summary of data from the UKWIR chemical investigations programme and a comparison of data from the past ten years’ monitoring of effluent quality. Sci. Total Environ. 2022, 832, 155041. [Google Scholar] [CrossRef]
- European Parliament and Council. Regulation (EU) No 528/2012 concerning the making available on the market and use of biocidal products. Off. J. Eur. Union. L 2012, 167, 1–122. [Google Scholar]
- European Parliament and Council. Directive 2013/39/EU amending directives 2000/60/EC and 2008/105/EC as regards priority substances in the field of water policy. Off. J. Eur. Commun Legis L 2013, 226, 1–17. [Google Scholar]
- Godfrey, A.; Dunscombe, J.; Gravell, A.; Hunter, A.; Barrow, M.; Van Keulen, G.; Desbrow, C.; Townsend, R. Use of QuEChERS as a manual and automated high-throughput protocol for investigating environmental matrices. Chemosphere 2022, 308, 136313. [Google Scholar] [CrossRef]
- Townsend, R.; Van Keulen, G.; Desbrow, C.; Godfrey, A. An investigation of the utility of QuEChERS for extracting acid, base, neutral and amphiphilic species from example environmental and clinical matrices. Anal. Sci. Adv. 2020, 1, 152–160. [Google Scholar] [CrossRef]
- Godfrey, A.; Townsend, R.; Desbrow, C.; Felion, C. QuEChERS: A simple extraction for monitoring quaternary ammonium biocide pollution in soils and antimicrobial resistance. Anal. Met. 2020, 12, 4387–4393. [Google Scholar] [CrossRef] [PubMed]
- Paijens, C.; Bressy, A.; Frere, B.; Moilleron, R. Biocide emissions from building materials during wet weather: Identification of substances, mechanism of release and transfer to the aquatic environment. Environ. Sci. Poll. Res. 2020, 2, 3768–3791. [Google Scholar] [CrossRef] [PubMed]
- Faccenda, H.; Melara, F.; Damini, G.; Godinho, M.; Manera, C.; Piccin, J. Graywater treatment of emerging pollutant linear alkylbenzene sulfonate by adsorption with leather shave waste activated carbon. Environ. Sci. Poll. Res. 2022, 29, 79830–79840. [Google Scholar] [CrossRef]
- Yang, K.; Chen, M.; Zhua, D. Exposure to benzalkonium chloride disinfectants promotes antibiotic resistance in sewage sludge microbiomes. Sci. Tot. Environ. 2023, 867, 161527. [Google Scholar] [CrossRef]
- Volcao, L.; Fraga, L.; De Lima Brum, R.; De Moura, R.; Bernardi, E.; Ramos, D.; Da Silva, L., Jr. Toxicity of biocide formulations in the soil to the gut community in balloniscus selowii Brandt, 1983 (Crustacea: Isopoda: Oniscidea). Water Air Soil Poll. 2020, 231, 306. [Google Scholar] [CrossRef]
- Olkowska, E.; Polkowska, Z.; Namiesnik, I. Analytics of surfactants in the environment: Problems and challenges. Chem. Rev. 2011, 111, 5667–5700. [Google Scholar] [CrossRef] [PubMed]
- UNESCO—United Nations Educational, Scientific, and Cultural Organization. Emerging Pollutants in Water and Wastewater. 2015. Available online: https://en.unesco.org/emergingpollutantsinwaterandwastewater#:~:text=These%20contaminants%20include%20mainly%20chemicals,surfactants%2C%20industrial%20additives%20and%20solvents (accessed on 1 June 2019).
- Gray, M.; Peake, S.; Farrell, A.; Bruch, R. Acute didecyl dimethyl ammonium chloride toxicity to larval lake Sturgeon, Acipenser fulvescens Rafinesque, Walleye Sander vitreus Mitchill, and Northern Pike, Esox lucius Linnaeus. Bull. Environ. Contam. Toxicol. 2005, 75, 890–896. [Google Scholar] [CrossRef] [PubMed]
- Gerba, C. Quaternary ammonium biocides: Efficacy in application. Appl. Environ. Microbiol. 2015, 81, 464–469. [Google Scholar] [CrossRef] [PubMed] [Green Version]
- Tezel, U.; Tandukar, M.; Martinez, R.; Sobecky, P.; Pavlostathis, S. Aerobic biotransformation of n-tetradecylbenzyldimethyl ammonium chloride by an enriched pseudomonas spp. community. Environ. Sci. Technol. 2012, 46, 8714–8722. [Google Scholar] [CrossRef]
- Liao, J.; Chen, Y. Removal of intl1 and associated antibiotics resistant genes in water, sewage sludge and livestock manure treatments. Rev. Environ. Sci. Biotechnol. 2018, 17, 471–500. [Google Scholar] [CrossRef]
- Ajibola, A.; Zwiener, C. Occurrence and risk assessment of antibiotic residues in sewage sludge of two Nigerian hospital wastewater treatment plants. Water Air Soil Poll. 2022, 233, 405. [Google Scholar] [CrossRef]
- Jansen, K.; Mohr, C.; Lügger, K.; Heller, C.; Siemens, J.; Mulder, I. Widespread occurrence of quaternary alkylammonium disinfectants in soils of Hesse, Germany. Sci. Tot. Environ. 2023, 857, 159228. [Google Scholar] [CrossRef]
- Shackman, H.; Ding, W.; Bolgar, M. A novel route to recognizing quaternary ammonium cations using electrospray mass spectrometry. J. Am. Soc. Mass Spectrom. 2015, 26, 181–189. [Google Scholar] [CrossRef] [PubMed]
- Ahmad, R.; Cho, E.; Rakhmat, S.; Hyun, M.; Park, C.; Kim, S. Characterization of structure isomers of ethylbenzalkyl dimethyl ammonium chlorides and quantification in commercial household disinfectant products. Environ. Technol. Innov. 2023, 29, 102979. [Google Scholar] [CrossRef]
- Dew, N.; Bramer, T.; Edsman, K. Catanionic aggregates formed from drugs and lauric or capric acids enable prolonged release from gels. J. Coll. Int. Sci. 2008, 323, 386–394. [Google Scholar] [CrossRef]
- Ertekin, E.; Hatt, J.; Konstantinidis, K.; Tezel, U. Similar microbial consortia and genes are involved in the biodegradation of benzalkonium chlorides in different environments. Environ. Sci. Technol. 2016, 50, 4304–4313. [Google Scholar] [CrossRef] [PubMed]
- Ertekin, E.; Konstantinidis, K.; Tezel, U. A rieske-type oxygenase of Pseudomonas sp. BIOMIG1 converts benzalkonium chlorides to benzyldimethyl amine. Environ. Sci. Technol. 2017, 51, 175–181. [Google Scholar] [CrossRef] [PubMed]
- Li, R.; Zhang, C.; Liu, D.; Sun, J. Biosorption of tetradecyl benzyl dimethyl ammonium chloride on activated sludge: Kinetic, thermodynamic and reaction mechanisms. Biores. Technol. 2011, 102, 3799–3804. [Google Scholar]
- Zhang, C.; Tezel, U.; Li, K.; Liu, D.; Ren, R.; Du, J.; Pavlostathis, S. Evaluation and modeling of benzalkonium chloride inhibition and biodegradation in activated sludge. Water Res 2011, 45, 1238–1246. [Google Scholar] [CrossRef] [PubMed]
- Berge, A.; Bulete, A.; Fildier, A.; Vulliet, E. High-resolution mass spectrometry as a tool to evaluate the sample preparation of sludge. Anal. Chem. 2017, 89, 9685–9694. [Google Scholar] [CrossRef] [PubMed]
- Patrauchan, M.; Oriel, P. Degradation of benzyldimethylalkylammonium chloride by aeromonas hydrophila sp. K. J. Appl. Microbiol. 2003, 94, 266–272. [Google Scholar] [CrossRef]
- Jia, Y.; Huang, Y.; Ma, J.; Zhang, S.; Liu, J.; Li, T.; Song, L. Toxicity of the disinfectant benzalkonium chloride (C14) towards cyanobacterium Microcystis results from its impact on the photosynthetic apparatus and cell metabolism. J. Environ. Sci. 2024, 135, 198–209. [Google Scholar] [CrossRef]
- Ibusquiza, P.; Herrera, J.; Vázquez-Sanchez, D.; Parada, A.; Cabo, A. A new and efficient method to obtain benzalkonium chloride adapted cells of Listeria monocytogenes. J. Microbiol. Meth. 2012, 91, 57–61. [Google Scholar] [CrossRef] [PubMed]
- Wang, Y.; Yang, Y.; Liu, X.; Zhao, J.; Liu, R.; Xing, B. Interaction of microplastics with antibiotics in aquatic environment: Distribution, adsorption, and toxicity. Environ. Sci. Technol. 2021, 55, 15579–15595. [Google Scholar] [CrossRef]
- Li, W.; Zhang, X.; Han, J. Formation of larger molecular weight disinfection byproducts from acetaminophen in chlorine disinfection. Environ. Sci. Technol. 2022, 56, 16929–16939. [Google Scholar] [CrossRef]
- Nejuma, K.; Manoj, P.; Aravind, U.; Aravindakumar, C. Sonochemical degradation of a pharmaceutical waste, atenolol, in aqueous medium. Environ. Sci. Pollut. Res. 2014, 21, 4297–4308. [Google Scholar] [CrossRef] [PubMed]
- Bianchi, C.; Sacchi, B.; Pirola, C.; Demartin, F.; Cerrato, G.; Morandi, S.; Capucci, V. Aspirin and paracetamol removal using a commercialmicro-sized TiO2 catalyst in deionized and tap water. Environ. Sci. Pollut. Res. 2017, 24, 12646–12654. [Google Scholar] [CrossRef] [PubMed]
- Ahmed, F.; Tscharke, B.; O’Brien, J.; Hall, W.; Cabot, P.; Sowa, P.; Samanipour, S.; Thomas, K. National wastewater reconnaissance of analgesic consumption in Australia. Environ. Sci. Technol. 2023, 57, 1712–1720. [Google Scholar] [CrossRef] [PubMed]
- Rouibah, I.; Hassen, W.; Sallem, O.; Khellaf, N.; Hassen, A.; Ben Mansour, H. Photocatalytic and biodegradation treatments of paracetamol: Investigation of the in vivo toxicity. Environ. Sci. Poll. Res. 2021, 28, 14530–14545. [Google Scholar] [CrossRef] [PubMed]
- European Parliament and Council Directive of the European Parliament and of the Council establishing a framework for Community action in the field of water policy: 000/60/EC, 2008/105/EC, 2009/90/EC, 2013/39/EU, 2015/1787/EU. Off. J. Eur. Union. 2015. Available online: http://www.eur-lex.europa.eu/ (accessed on 6 October 2015).
- Hall, L., Jr.; Bushong, S.; Ziegenfuss, M.; Johnson, W.; Herman, R.; Wright, D. Chromic toxicity of tributyltin to chesapeake bay biota. Water Air Soil Poll. 1988, 39, 365–376. [Google Scholar] [CrossRef]
- Li, M.; Kwon, S.; Poulin, B.; Tsui, M.; Motta, L.; Cho, M. Internal dynamics and metabolism of mercury in biota: A review of insights from mercury stable isotopes. Environ. Sci. Technol. 2022, 56, 9182–9195. [Google Scholar] [CrossRef]
- Couto, C.; Ribeiro, C. Pollution status and risk assessment of trace elements in Portuguese water, soils, sediments, and associated biota: A trend analysis from the 80s to 2021. Environ. Sci. Poll. Res. 2022, 29, 48057–48087. [Google Scholar] [CrossRef] [PubMed]
- Figueiredo, C.; Oliveira, R.; Lopes, C.; Brito, P.; Caetano, M.; Raimundo, J. Rare earth elements biomonitoring using the mussel Mytilus galloprovincialis in the Portuguese coast: Seasonal variations. Marine Poll. Bull. 2022, 175, 113335. [Google Scholar] [CrossRef]
- Saaibusquiza, S.; Herrara, J.; Cabo, M. Comparison between the resistance of benzalkonium chloride-adapted and nonadapted biofilms of Listeria monocytogenes to modified atmosphere packaging and nisin once transferred to mussels. J. Food Prot. 2011, 74, 1112–1118. [Google Scholar] [CrossRef]
- Rosa, M.; Flores, Y.; Sierra, K.; Torres, B.; Ward, J. Examining effects of surfactants on particle clearance rate and capture efficiency of the blue mussel Mytilus edulis. Aquat. Biol. 2020, 29, 149–154. [Google Scholar] [CrossRef]
- Donaher, S.; Dunn, R.; Gonzales, A.; Wattier, B.; Powell, B.; Martinez, N. Tissue-specific toxicokinetics of aqueous radium-226 in an estuarine mussel, Geukensia demissa. Environ. Sci. Technol. 2023. [Google Scholar] [CrossRef]
- Liu, F.; Ma, Z.; Deng, Y.; Wang, M.; Zhou, P.; Liu, W.; Guo, S.; Tong, M.; Ma, D. Tunable covalent organic frameworks with different heterocyclic nitrogen locations for efficient Cr(VI) reduction, Escherichia coli disinfection, and paracetamol degradation under visible-light irradiation. Environ. Sci. Technol. 2021, 55, 5371–5381. [Google Scholar] [CrossRef] [PubMed]
- Zhang, H.; Jia, Y.; Khana, S.; Lu, H.; Fang, H.; Zhao, Q. Understanding the role of extracellular polymeric substances on ciprofloxacin adsorption in aerobic sludge, anaerobic sludge, and sulfate-reducing bacteria sludge systems. Environ. Sci. Technol. 2018, 52, 6476–6486. [Google Scholar] [CrossRef] [PubMed]
- Prieto-Blanco, M.; Planas-Franco, A.; Muniategui-Lorenzo, S.; Gonzalez-Castro, M. Mixed-mode chromatography of mixed functionalized analytes as the homologues of benzalkonium chloride. Application to pharmaceutical formulations. Talanta 2023, 255, 124228. [Google Scholar] [CrossRef]
- Pawar, A.; Mannepalli, C. Simple and validated stability indicating HPLC method for simultaneous quantification of brimonidine, timolol and benzalkonium chloride in anti-glaucoma ophthalmic formulations. Asian J. Chem. 2023, 35, 179–186. [Google Scholar] [CrossRef]
- Pan, M.; Yau, P. Fate of macrolide antibiotics with different wastewater treatment technologies. Water Air Soil Poll. 2021, 232, 103. [Google Scholar] [CrossRef] [PubMed]
- Alygizakis, N.; Samanipour, S.; Hollender, J.; Ibanez, M.; Kaserzon, S.; Kokkali, V.; Van Leerdam, J.; Mueller, J.; Pijnappels, M.; Reid, M.; et al. Exploring the potential of a global emerging contaminant early warning network through the use of retrospective suspect screening with high-resolution mass spectrometry. Environ. Sci. Technol. 2018, 52, 5135–5144. [Google Scholar] [CrossRef] [PubMed]
- Xian, Y.; Dong, H.; Wu, Y.; Guo, G.; Hou, X.; Wang, B. QuEChERS-based purification method coupled to ultrahigh performance liquid chromatography-tandem mass spectrometry (UPLC–MS/MS) to determine six quaternary ammonium compounds (QACs) in dairy products. Food Chem. 2016, 212, 96–103. [Google Scholar] [CrossRef]
- Dyshlyuk, L.; Fotina, N.; Milentyeva, L.; Ivanova, S.; Izgarysheva, N.; Golubtsova, Y. Antimicrobial and antioxidant activity of Panax ginseng and Hedysarum neglectum root crop extracts. Brazilian J. Biol. 2022, 84, e256944. [Google Scholar] [CrossRef]
- Raesaenen, R.; Dwivedi, P.; Fernandez, F.; Kauppila, T. Desorption atmospheric pressure photoionization and direct analysis in real time coupled with travelling wave ion mobility mass spectrometry. Rapid Commun. Mass Spectrom. 2014, 28, 2325–2336. [Google Scholar] [CrossRef]
- Zhang, M.; Lin, F.; Xu, J.; Xu, W. Membrane electrospray ionization for direct ultrasensitive biomarker quantitation in biofluids using mass spectrometry. Anal. Chem. 2015, 87, 3123–3128. [Google Scholar] [CrossRef] [PubMed]
- Ivanova, B.; Spiteller, M. Stochastic dynamic mass spectrometric quantification of steroids in mixture—Part II. Steroids 2020, 164, 108750. [Google Scholar] [CrossRef] [PubMed]
- Ivanova, B.; Spiteller, M. Stochastic dynamic mass spectrometric approach to quantify reserpine in solution. Anal. Chem. Lett. 2020, 10, 703–721. [Google Scholar] [CrossRef]
- Chen, T.; Wu, M.; Chen, Y. Ultrasonication-assisted spray ionization-based micro-reactors for online monitoring of fast chemical reactions by mass spectrometry. J Mass Spectrom. 2019, 54, 26–34. [Google Scholar] [CrossRef] [PubMed] [Green Version]
- Maus, A.; Kemp, J.; Hoffmann, T.; Ramsay, S.; Grebe, S. Isotopic distribution calibration for mass spectrometry. Anal. Chem. 2021, 93, 12532–12540. [Google Scholar] [CrossRef] [PubMed]
- European Parliament and Council Directive of the European Parliament and of the Council Decision of 12 August 2002 implementing Council Directive 96/23/EC 18 concerning the performance of analytical methods and interpretation of results. Off. J. 19 Eur. Commun. L 2002, 221, 8–36.
- Ivanova, B.; Spiteller, M. A stochastic dynamic mass spectrometric diffusion method and its application to 3D structural analysis of the analytes. Rev. Anal. Chem. 2019, 38, 1. [Google Scholar] [CrossRef]
- Ivanova, B.; Spiteller, M. Mass spectrometric stochastic dynamic 3D structural analysis of mixture of steroids in solution—Experimental and theoretical study. Steroids 2022, 181, 109001. [Google Scholar] [CrossRef]
- Ivanova, B.; Spiteller, M. Chapter 1: Mass spectrometric and quantum chemical treatments of molecular and ionic interactions of a flavonoid-O-glycoside—A stochastic dynamic approach. In Advances in Chemistry Research; Taylor, J., Ed.; NOVA Science Publishers: New York, NY, USA, 2022; Volume 74, pp. 1–126. [Google Scholar]
- Ivanova, B.; Spiteller, M. Stochastic dynamic electrospray ionization mass spectrometric quantitative analysis of metronidazole in human urine. Anal. Chem. Lett. 2022, 12, 322–348. [Google Scholar] [CrossRef]
- Ivanova, B.; Spiteller, M. Exact quantifying of mass spectrometric variable intensity of analyte peaks with respect to experimental conditions of measurements—A stochastic dynamic approach. Anal. Chem. Lett. 2022, 12, 542–561. [Google Scholar] [CrossRef]
- Ivanova, B.; Spiteller, M. Stochastic dynamic ultraviolet photofragmentation and high collision energy dissociation mass spectrometric kinetics of triadimenol and sucralose. Environ. Sci. Poll. Res. 2022. [Google Scholar] [CrossRef]
- Ivanova, B.; Spiteller, M. Stochastic dynamic quantitative and 3D structural matrix assisted laser desorption/ionization mass spectrometric analyses of mixture of nucleosides. J. Mol. Struct. 2022, 1260, 132701. [Google Scholar] [CrossRef]
- Ivanova, B.; Spiteller, M. Electrospray ionization stochastic dynamic mass spectrometric 3D structural analysis of ZnII-ion containing complexes in solution. Inorg. Nano-Met. Chem. 2022, 52, 1407–1429. [Google Scholar] [CrossRef]
- Baquer, G.; Sementé, L.; Mahamdi, T.; Correig, X.; Ràfols, P.; García-Altares, M. What are we imaging? Software tools and experimental strategies for annotation and identification of small molecules in mass spectrometry imaging. Mass. Spec. Rev. 2022, e21794. [Google Scholar] [CrossRef] [PubMed]
- Chen, H.; Zheng, J.; Zhang, X.; Luo, M.; Wang, Z.; Qiao, X. Surface desorption atmospheric pressure chemical ionization mass spectrometry for direct ambient sample analysis without toxic chemical contamination. J. Mass Spectrom. 2007, 42, 1045–1056. [Google Scholar] [CrossRef] [PubMed]
- Gravel, A.; Guerette, C.; Fortin, D.; Auger, S.; Picard, P.; Segura, P. Further studies on the signal enhancement effect in laser diode thermal desorption-triple quadrupole mass spectrometry using microwell surface coatings. J. Mass Spectrom. 2019, 54, 948–956. [Google Scholar] [CrossRef]
- Earnshaw, C.; Carolan, V.; Richards, D.; Clench, M. Direct analysis of pharmaceutical tablet formulations using matrix-assisted laser desorption/ionisation mass spectrometry imaging. Rapid Commun. Mass Spectrom. 2010, 24, 1665–1672. [Google Scholar] [CrossRef]
- Ostrowski, W.; Karczewska, K.; Frański, R. Oxidation of paracetamol by Cu2+-formation of the paracetamol radical cation. Rapid Commun. Mass Spectrom. 2013, 27, 1579–1584. [Google Scholar] [CrossRef]
- Yao, Y.; Wu, L.; Sun, W.; Luo, Z.; Di, D.; Yuan, Z.; Huang, Z.; Hu, B. Fast-switching high-voltage porous-tip electrospray ionization mass spectrometry for rapid detection of antirheumatic drugs in adulterated herbal dietary supplements. Rapid Commun. Mass. Spectrom. 2019, 33, 1877–1883. [Google Scholar] [CrossRef]
- Chan, C.; Bolgar, M.; Miller, S.; Attygalle, A. A combined desorption ionization by charge exchange (DICE) and desorption electrospray onization (DESI) source for mass spectrometry. J. Am. Soc. Mass Spectrom. 2011, 22, 173–178. [Google Scholar] [CrossRef] [Green Version]
- Winter, G.; Wilhide, J.; LaCourse, W. Molecular ionization-desorption analysis source (MIDAS) for mass spectrometry: Thin-layer chromatography. J. Am. Soc. Mass Spectrom. 2016, 27, 352–358. [Google Scholar] [CrossRef] [PubMed]
- Lu, W.; Zhao, S.; Gong, M.; Sun, L.; Ding, L. Simultaneous determination of acetaminophen and oxycodone in human plasma by LC-MS/MS and its application to a pharmacokinetic study. J. Pharmaceut. Anal. 2018, 8, 160–167. [Google Scholar] [CrossRef]
- Belal, T.; Awad, T.; Clark, C. Determination of paracetamol and tramadol hydrochloride in pharmaceutical mixture using HPLC and GC-MS. J. Chromatogr. Sci. 2009, 47, 849–854. [Google Scholar] [CrossRef] [PubMed] [Green Version]
- Schaefermann, S.; Hauk, C.; Wemakor, E.; Neci, R.; Mutombo, G.; Ndze, E.; Cletus, T.; Nyaah, F.; Pattinora, M.; Wistuba, D.; et al. Substandard and falsified antibiotics and medicines against noncommunicable diseases in western Cameroon and Northeastern Democratic Republic of Congo. Am. J. Trop. Med. Hyg. 2020, 1–15. [Google Scholar] [CrossRef] [PubMed]
- Gilpin, R.; Zhou, W. Studies of the thermal degradation of acetaminophen using a conventional HPLC approach and electrospray ionization-mass spectrometry. J. Chromatogr. Sci. 2004, 42, 15–20. [Google Scholar] [CrossRef] [Green Version]
- Upthagrove, A.; Hackett, M.; Nelson, W. Fragmentation pathways of selectively labeled uropranolol using electrospray ionization on an ion trap mass spectrometer and comparison with ions formed by electron impact. Rapid Commun. Mass Spectrom. 1999, 13, 534–541. [Google Scholar] [CrossRef]
- Conte, J., Jr.; Lin, E.; Zhao, Y.; Zurlinden, E. A high-pressure liquid chromatographic-tandem mass spectrometric method for the determination of ethambutol in human plasma, bronchoalveolar lavage fluid, and alveolar cells. J. Chromatogr. Sci. 2002, 40, 113–118. [Google Scholar] [CrossRef] [Green Version]
- Li, D.; Sheng, L.; Liu, X.; Yang, S.; Liu, Z.; Li, Y. Determination of TBI-166, a novel antituberculotic, in rat plasma by liquid chromatography-tandem mass spectrometry. Chromatographia 2014, 77, 1697–1703. [Google Scholar] [CrossRef]
- He, H.; Li, L.; Zhao, L.; Sun, N.; Zhang, M.; Cheng, Y.; Yu, L.; Ma, L.; Wang, X. An improved HPLC-MS/MS method for simultaneous quantification of propranolol and its two phase I metabolites in plasma of infants with hemangioma and its application to a comparative study of plasma concentrations. RSC Adv. 2018, 8, 37286–37294. [Google Scholar] [CrossRef] [Green Version]
- Johnson, R.; Lewis, R. Quantitation of atenolol, metoprolol, and propranolol in postmortem human fluid and tissue specimens via LC/APCI-MS. Forensic. Sci. Int. 2006, 156, 106–117. [Google Scholar] [CrossRef]
- Cahill, J.; Kertesz, V.; Weiskittel, T.; Vavrek, M.; Freddo, C.; Van Berkel, G. Online, absolute quantitation of propranolol from spatially distinct 20- and 40-μm dissections of brain, liver, and kidney thin tissue sections by laser microdissection-liquid vortex capture-mass spectrometry. Anal. Chem. 2016, 88, 6026–6034. [Google Scholar] [CrossRef] [PubMed]
- Rix, M.; Webstar, B. Electron impact-induced eliminations of acetaldehyde. J. Chem. Soc. B 1968, 254–258. [Google Scholar] [CrossRef]
- Svan, A.; Hedeland, M.; Arvidsson, T.; Jasper, J.; Sedlakd, D.; Petterssona, C. Identification of transformation products from β-blocking agents formed in wetland microcosms using LC-Q-ToF. J. Mass Spectrom. 2016, 51, 207–218. [Google Scholar] [CrossRef] [PubMed]
- Jeong, E.; Kim, S.; Cha, E.; Lee, K.; Kim, H.; Lee, S.; Kwon, O.; Lee, J. Simultaneous analysis of 210 prohibited substances in human urine by ultrafast liquid chromatography/tandem mass spectrometry in doping control. Rapid Commun. Mass Spectrom. 2015, 29, 367–384. [Google Scholar] [CrossRef]
- Huang, G.; Li, G.; Cooks, R. Induced nanoelectrospray ionization for matrix-tolerant and high-throughput mass spectrometry. Angew. Chem. Int. Ed. 2011, 50, 9907–9910. [Google Scholar] [CrossRef]
- Parson, W.; Schneider, B.; Kertesz, V.; Corr, J.; Covey, T.; Van Berkel, G. Rapid analysis of isomeric exogenous metabolites by differential mobility spectrometry—Mass spectrometry. Rapid Commun. Mass Spectrom. 2011, 25, 3382–3386. [Google Scholar] [CrossRef]
- Salomonsson, M.; Bondessona, U.; Hedelanda, M. In vitro formation of phase I and II metabolites of propranolol and determination of their structures using chemical derivatization and liquid chromatography-tandemmass spectrometry. J. Mass. Spectrom. 2009, 44, 742–755. [Google Scholar] [CrossRef]
- Vonaparti, A.; Lyris, E.; Angelis, Y.; Panderi, I.; Koupparis, K.; Tsantili-Kakoulidou, A.; Peters, R.; Nielen, M.; Georgakopoulos, C. Preventive doping control screening analysis of prohibited substances in human urine using rapid-resolution liquid chromatography/high-resolution time-of-flight mass spectrometry. Rapid Commun. Mass Spectrom. 2010, 24, 1595–1609. [Google Scholar] [CrossRef]
- Shariatgorji, M.; Amini, N.; Thorsen, G.; Crescenzi, G.; Ilag, L. μ-Trap for the SALDI-MS screening of organic compounds prior to LC/MS analysis. Anal. Chem. 2008, 80, 5515–5523. [Google Scholar] [CrossRef]
- Gergov, M.; Robson, J.; Duchoslav, E.; Ojanpera, L. Automated liquid chromatographic/tandem mass spectrometric method for screening β-blocking drugs in urine. J. Mass Spectrom. 2000, 35, 912–918. [Google Scholar] [CrossRef]
- Yoneda, M.; Tsujimoto, K.; Ohashi, M.; Shiratsuchi, M.; Ohkawa, Y. Structures of [M-44]+ ions in the electron impact and fast atom bombardment mass spectra of the β-blocker nipradilol with a nitrate ester group. Org. Mass Spectrom. 1990, 25, 146–150. [Google Scholar] [CrossRef]
- Tay, K.; Rahman, N.; Abas, M. Characterization of atenolol transformation products in ozonation by using rapid resolution high-performance liquid chromatography/quadrupole-time-of-flight mass spectrometry. Microchem. J. 2011, 99, 312–326. [Google Scholar] [CrossRef]
- Kumar, V.; Shah, R.; Malik, S.; Singh, S. Compatibility of atenolol with excipients: LC-MS/TOF characterization of degradation/interaction products, and mechanisms of their formation. J. Pharmaceut. Biomed. Anal. 2009, 49, 880–888. [Google Scholar] [CrossRef] [PubMed]
- Hou, K.; Xu, W.; Xu, J.; Cooks, R.; Ouyang, Z. Sampling wand for an ion trap mass spectrometer. Anal. Chem. 2011, 83, 1857–1861. [Google Scholar] [CrossRef] [PubMed]
- Aksenova, L.; Koval, V.; Chernonosov, A. Parallel reaction monitoring mode for atenolol quantification in dried plasma spots by liquid chromatography coupled with high-resolution mass spectrometry. Processes 2022, 10, 1240. [Google Scholar] [CrossRef]
- Medana, C.; Calza, P.; Carbone, F.; Pelizzetti, E.; Hidaka, H.; Baiocchi, C. Characterization of atenolol transformation products on light-activated TiO2 surface by high-performance liquid chromatography/high-resolution mass spectrometry. Rapid Commun. Mass Spectrom. 2008, 22, 301–313. [Google Scholar] [CrossRef] [PubMed]
- Townsend, R.; Godfrey, A.; Van Keulen, G.; Geertje, A.; Brenton, G. Mass Spectrometric Investigation of Pharmaceuticals in Environmental Matrices—Homogenate Analysis: Thesis Data 1; Zenodo: Geneva, Switzerland; p. 2022. [CrossRef]
- Townsend, R.; Godfrey, A.; Van Keulen, G.; Geertje, G. Mass Spectrometric Investigation of Pharmaceuticals in Environmental Matrices—Homogenate Analysis: Thesis Data 2; Zenodo: Geneva, Switzerland, 2022. [Google Scholar] [CrossRef]
- Ferrera, I.; Furlong, E. Identification of alkyl dimethyl benzylammonium surfactants in water samples by solid-phase extraction followed by ion trap LC/MS and LC/MS/M. Environ. Sci. Technol. 2001, 35, 2583–2588. [Google Scholar] [CrossRef] [PubMed]
- Xia, Y.; Lau, J.; Olah, T.; Jemal, M. Targeted quantitative bioanalysis in plasma using liquid chromatography/high-resolution accurate mass spectrometry: An evaluation of global selectivity as a function of mass resolving power and extraction window, with comparison of centroid and profile modes. Rapid Commun. Mass Spectrom. 2011, 25, 2863–2878. [Google Scholar]
- Zeng, J.; Tao, Y.; Giese, T.; York, D. QDπ: A quantum deep potential interaction model for drug discovery. J. Chem. Theory Comput. 2023, 19, 1261–1275. [Google Scholar] [CrossRef]
- Brown, D. The Chemical Bond in Inorganic Chemistry; Oxford University Press: Oxford, UK, 2002; pp. 1–279. [Google Scholar]
- Bader, R.; Nguyen-Dang, T.; Tal, Y. A topological theory of molecular structure. Rep. Prog. Phys. 1981, 44, 894–948. [Google Scholar] [CrossRef]
- Zacs, D.; Bartkevics, V. Trace determination of perfluorooctane sulfonate andperfluorooctanoic acid in environmental samples (surface water, wastewater, biota, sediments, and sewage sludge) using liquidchromatography—Orbitrap mass spectrometry. J. Chromatogr. A 2016, 1473, 109–121. [Google Scholar] [CrossRef] [PubMed]
- Frisch, M.; Trucks, G.; Schlegel, H.; Scuseria, G.; Robb, M.; Cheeseman, J.; Fox, D. Gaussian 09, 98; Pittsburgh, Wallingford CT; Gaussian, Inc.: 1998, 2009. Available online: www.gaussian.com (accessed on 1 January 2016).
- Helgaker, T.; Jensen, H.; Jrgensen, P.; Olsen, J.; Ruud, K.L.; Agren, H.; Auer, A.; Bak, K.; Bakken, V.; Christiansen, O.; et al. Dalton Program Package. 2011. Available online: http://www.daltonprogram.org/download.html (accessed on 1 January 2011).
- Gordon, M.; Schmidt, M. Advances in Electronic Structure Theory: GAMESS a Decade Later. In Theory and Applications of Computational Chemistry: The First Forty Years; Dykstra, C., Frenking, G., Kim, K., Scuseria, G., Eds.; Elsevier: Amsterdam, The Netherlands, 2005; pp. 1167–1189. [Google Scholar]
- Nielsen, A.; Holder, A. Gauss View 5.0, User’s Reference. Pittsburgh GausView03 Program Package; GAUSSIAN Inc.: Wallingford, CT, USA, 2009; Available online: www.gaussian.com/g_prod/gv5.htm (accessed on 1 January 2009).
- Burkert, U.; Allinger, A. Molecular Mechanics in ACS Monograph 177; American Chemical Society: Washington, DC, USA, 1982; pp. 1–339. [Google Scholar]
- Allinger, L. Conformational analysis. 130. MM2. A hydrocarbon force field utilizing V1 and V2 torsional terms. J. Am. Chem. Soc. 1977, 99, 8127–8134. [Google Scholar] [CrossRef]
- Kelley, C. Iterative Methods for Optimization. In Society for Industrial and Applied Mathematics; SIAM: Philadelphia, PA, USA, 2009; p. 18. [Google Scholar]
- Otto, M. Chemometrics, 3rd ed.; Wiley: Weinheim, Germany, 2017; pp. 1–383. [Google Scholar]
- Apache OpenOffice. Available online: http://de.openoffice.org (accessed on 1 January 2023).
- Madsen, K.; Nielsen, H.; Tingleff, T. Informatics and Mathematical Modelling, 2nd ed.; DTU Press: Kongens Lyngby, Denmark, 2004. [Google Scholar]
- Miller, J.; Miller, J. Statistics and Chemometrics for Analytical Chemistry; Pentice Hall: London, UK, 1988; pp. 1–271. [Google Scholar]
- Taylor, J. Quality Assurance of Chemical Measurements; Lewis Publishers, Inc.: Boca Raton, FL, USA, 1987; pp. 1–328. [Google Scholar]


| m/z | Form | DQC | m/z | Form | DQC |
|---|---|---|---|---|---|
| 110 | 110 | 2689.768 | |||
| 152 | 152_a | 101.531209 | 155 | 155_a | 98.1605 |
| 152_b | 646,318 | 155_b | 3.45123 | ||
| 158 | 158 | 367.4416 | 161 | 161 | 2902.9217 |
| 174 | 174 | 3009.373 | 177 | 177 | 42,352.98 |
| 325 | 325 | 21.08666 | 301 | 301 | 14.141939 |
Disclaimer/Publisher’s Note: The statements, opinions and data contained in all publications are solely those of the individual author(s) and contributor(s) and not of MDPI and/or the editor(s). MDPI and/or the editor(s) disclaim responsibility for any injury to people or property resulting from any ideas, methods, instructions or products referred to in the content. |
© 2023 by the author. Licensee MDPI, Basel, Switzerland. This article is an open access article distributed under the terms and conditions of the Creative Commons Attribution (CC BY) license (https://creativecommons.org/licenses/by/4.0/).
Share and Cite
Ivanova, B. Stochastic Dynamic Mass Spectrometric Quantitative and Structural Analyses of Pharmaceutics and Biocides in Biota and Sewage Sludge. Int. J. Mol. Sci. 2023, 24, 6306. https://doi.org/10.3390/ijms24076306
Ivanova B. Stochastic Dynamic Mass Spectrometric Quantitative and Structural Analyses of Pharmaceutics and Biocides in Biota and Sewage Sludge. International Journal of Molecular Sciences. 2023; 24(7):6306. https://doi.org/10.3390/ijms24076306
Chicago/Turabian StyleIvanova, Bojidarka. 2023. "Stochastic Dynamic Mass Spectrometric Quantitative and Structural Analyses of Pharmaceutics and Biocides in Biota and Sewage Sludge" International Journal of Molecular Sciences 24, no. 7: 6306. https://doi.org/10.3390/ijms24076306