
Ab Initio Modelling of the Structure of ToxA-like and MAX Fungal Effector Proteins

Abstract
:1. Introduction
2. Results
2.1. Benchmarking Metrics for Assessing the Successful Prediction of Ab Initio Model Structures
2.2. Selection of the “Best” Predicted Models of ToxA-like and MAX Effector Proteins
2.3. Clustering of Structural Models of ToxA-like and MAX Effectors
2.4. Cross-Validation of Ab Initio Rosetta Models with QUARK and Robetta
2.5. Modelling of Fungal Effectors Lacking Known Structures
2.6. Structural Quality Assessment of Ab Initio Models
3. Discussion
3.1. Secondary Structure Characteristics of Effector Proteins and Accuracy of the Predicted Models
3.2. Comparison with Other Ab Initio Methods
3.3. Structural Homology Detected for Predicted Structures of Structurally Unconfirmed Fungal Effectors
4. Materials and Methods
4.1. Input Data and Pre-Modelling Steps
4.2. Structural Modelling
4.3. Analysis of Ab Initio Structural Models
4.4. Structural Quality Assessment and Validation
4.5. Comparison with QUARK and Robetta
5. Conclusions
Supplementary Materials
Author Contributions
Funding
Institutional Review Board Statement
Informed Consent Statement
Data Availability Statement
Acknowledgments
Conflicts of Interest
References
- Fones, H.; Fisher, M.; Gurr, S. Emerging fungal threats to plants and animals challenge agriculture and ecosystem resilience. Microbiol. Spectr. 2017, 5, 787–809. [Google Scholar] [CrossRef] [PubMed] [Green Version]
- Vleeshouwers, V.; Oliver, R. Effectors as tools in disease resistance breeding against biotrophic, hemibiotrophic, and necrotrophic plant pathogens. Mol. Plant-Microbe Interact. 2014, 27, 196–206. [Google Scholar] [CrossRef] [PubMed] [Green Version]
- De Wit, P.J.G.M. Apoplastic fungal effectors in historic perspective; a personal view. New Phytol. 2016, 212, 805–813. [Google Scholar] [CrossRef] [Green Version]
- Park, C.; Chen, S.; Shirsekar, G.; Zhou, B.; Khang, C.; Songkumarn, P.; Afzal, A.; Ning, Y.; Wang, R.; Bellizzi, M.; et al. The magnaporthe oryzae effector avrpiz-t targets the RING E3 ubiquitin ligase APIP6 to suppress pathogen-associated molecular pattern-triggered immunity in rice. Plant Cell 2012, 24, 4748–4762. [Google Scholar] [CrossRef] [PubMed] [Green Version]
- Kanja, C.; Hammond-Kosack, K. Proteinaceous effector discovery and characterization in filamentous plant pathogens. Mol. Plant Pathol. 2020, 21, 1353–1376. [Google Scholar] [CrossRef]
- Sperschneider, J.; Dodds, P.; Gardiner, D.; Manners, J.; Singh, K.; Taylor, J. Advances and Challenges in Computational Prediction of Effectors from Plant Pathogenic Fungi. PLoS Pathog. 2015, 11, e1004806. [Google Scholar] [CrossRef] [Green Version]
- Sonah, H.; Deshmukh, R.; Bélanger, R. Computational Prediction of Effector Proteins in Fungi: Opportunities and Challenges. Front. Plant Sci. 2016, 7, 126. [Google Scholar] [CrossRef] [PubMed] [Green Version]
- Sperschneider, J.; Dodds, P. EffectorP 3.0: Prediction of Apoplastic and Cytoplasmic Effectors in Fungi and Oomycetes. Mol. Plant-Microbe Interact. 2022, 35, 146–156. [Google Scholar] [CrossRef]
- Jones, D.; Rozano, L.; Debler, J.; Mancera, R.; Moolhuijzen, P.; Hane, J. An automated and combinative method for the predictive ranking of candidate effector proteins of fungal plant pathogens. Sci. Rep. 2021, 111, 19731. [Google Scholar] [CrossRef]
- Jones, D.; Bertazzoni, S.; Turo, C.; Syme, R.; Hane, J. Bioinformatic prediction of plant–pathogenicity effector proteins of fungi. Curr. Opin. Microbiol. 2018, 46, 43–49. [Google Scholar] [CrossRef]
- Sperschneider, J.; Dodds, P.; Gardiner, D.; Singh, K.; Taylor, J. Improved prediction of fungal effector proteins from secretomes with EffectorP 2.0. Mol. Plant Pathol. 2018, 19, 2094–2110. [Google Scholar] [CrossRef] [PubMed] [Green Version]
- Sperschneider, J.; Gardiner, D.; Dodds, P.; Tini, F.; Covarelli, L.; Singh, K.; Manners, J.; Taylor, J. EffectorP: Predicting fungal effector proteins from secretomes using machine learning. New Phytol. 2016, 210, 743–761. [Google Scholar] [CrossRef] [Green Version]
- Franceschetti, M.; Maqbool, A.; Jiménez-Dalmaroni, M.; Pennington, H.; Kamoun, S.; Banfield, M. Effectors of Filamentous Plant Pathogens: Commonalities amid Diversity. Microbiol. Mol. Biol. Rev. 2017, 81, e00066-16. [Google Scholar] [CrossRef] [PubMed] [Green Version]
- Zhang, X.; He, D.; Zhao, Y.; Cheng, X.; Zhao, W.; Taylor, I.; Yang, J.; Liu, J.; Peng, Y. A positive-charged patch and stabilized hydrophobic core are essential for avirulence function of AvrPib in the rice blast fungus. Plant J. 2018, 96, 133–146. [Google Scholar] [CrossRef] [PubMed] [Green Version]
- de Guillen, K.; Ortiz-Vallejo, D.; Gracy, J.; Fournier, E.; Kroj, T.; Padilla, A. Structure Analysis Uncovers a Highly Diverse but Structurally Conserved Effector Family in Phytopathogenic Fungi. PLoS Pathog. 2015, 11, e1005228. [Google Scholar] [CrossRef] [PubMed]
- Ballance, G.; Lamari, L.; Bernier, C. Purification and characterization of a host-selective necrosis toxin from Pyrenophora tritici-repentis. Physiol. Mol. Plant Pathol. 1989, 35, 203–213. [Google Scholar] [CrossRef]
- Nyarko, A.; Singarapu, K.; Figueroa, M.; Manning, V.; Pandelova, I.; Wolpert, T.; Ciuffetti, L.; Barbar, E. Solution NMR structures of Pyrenophora tritici-repentis ToxB and its inactive homolog reveal potential determinants of toxin activity. J. Biol. Chem. 2014, 289, 25946–25956. [Google Scholar] [CrossRef] [Green Version]
- Ose, T.; Oikawa, A.; Nakamura, Y.; Maenaka, K.; Higuchi, Y.; Satoh, Y.; Fujiwara, S.; Demura, M.; Sone, T.; Kamiya, M. Solution structure of an avirulence protein, AVR-Pia, from Magnaporthe oryzae. J. Biomol. NMR 2015, 63, 229–235. [Google Scholar] [CrossRef]
- Sarma, G.; Manning, V.; Ciuffetti, L.; Karplus, P. Structure of Ptr ToxA: An RGD-Containing Host-Selective Toxin from Pyrenophora tritici-repentis. Plant Cell Online 2005, 17, 3190–3202. [Google Scholar] [CrossRef] [Green Version]
- Outram, M.; Sung, Y.; Yu, D.; Dagvadorj, B.; Rima, S.; Jones, D.; Ericsson, D.; Sperschneider, J.; Solomon, P.; Kobe, B.; et al. The crystal structure of SnTox3 from the necrotrophic fungus Parastagonospora nodorum reveals a unique effector fold and provides insight into Snn3 recognition and pro-domain protease processing of fungal effectors. New Phytol. 2021, 231, 2282–2296. [Google Scholar] [CrossRef]
- Pennington, H.; Jones, R.; Kwon, S.; Bonciani, G.; Thieron, H.; Chandler, T.; Luong, P.; Morgan, S.; Przydacz, M.; Bozkurt, T.; et al. The fungal ribonuclease-like effector protein CSEP0064/BEC1054 represses plant immunity and interferes with degradation of host ribosomal RNA. PLoS Pathog. 2019, 15, e1007620. [Google Scholar] [CrossRef] [Green Version]
- Di, X.; Cao, L.; Takken, F.; Hughes, R.; Tintor, N. Structure-function analysis of the Fusarium oxysporum Avr2 effector allows uncoupling of its immune-suppressing activity from recognition. New Phytol. 2017, 216, 897–914. [Google Scholar] [CrossRef] [Green Version]
- Wang, C.; Gunčar, G.; Forwood, J.; Teh, T.; Catanzariti, A.; Lawrence, G.; Loughlin, F.; Mackay, J.; Schirra, H.; Anderson, P.; et al. Crystal structures of flax rust avirulence proteins AvrL567-A and -D reveal details of the structural basis for flax disease resistance specificity. Plant Cell 2007, 19, 2898–2912. [Google Scholar] [CrossRef] [PubMed] [Green Version]
- Rozano, L.; Jones, D.; Hane, J.; Mancera, R. Template-based modelling of the structure of fungal effector proteins. Mol. Biotechnol. 2023. [Google Scholar] [CrossRef] [PubMed]
- Guo, L.; Cesari, S.; De Guillen, K.; Chalvon, V.; Mammri, L.; Ma, M.; Meusnier, I.; Bonnot, F.; Padilla, A.; Peng, Y.; et al. Specific recognition of two MAX effectors by integrated HMA domains in plant immune receptors involves distinct binding surfaces. Proc. Natl. Acad. Sci. USA 2018, 115, 11637–11642. [Google Scholar] [CrossRef] [PubMed] [Green Version]
- Ortiz, D.; de Guillen, K.; Cesari, S.; Chalvon, V.; Gracy, J.; Padilla, A.; Kroj, T. Recognition of the magnaporthe oryzae effector AVR-pia by the decoy domain of the rice NLR immune receptor RGA5. Plant Cell 2017, 29, 156–168. [Google Scholar] [CrossRef] [PubMed] [Green Version]
- De La Concepcion, J.; Franceschetti, M.; Maqbool, A.; Saitoh, H.; Terauchi, R.; Kamoun, S.; Banfield, M. Polymorphic residues in rice NLRs expand binding and response to effectors of the blast pathogen. Nat. Plants 2018, 4, 576–585. [Google Scholar] [CrossRef] [PubMed] [Green Version]
- Maqbool, A.; Saitoh, H.; Franceschetti, M.; Stevenson, C.; Uemura, A.; Kanzaki, H.; Kamoun, S.; Terauchi, R.; Banfield, M. Structural basis of pathogen recognition by an integrated HMA domain in a plant NLR immune receptor. Elife 2015, 4, e08709. [Google Scholar] [CrossRef]
- Zhang, Z.; Zhang, X.; Zhou, Z.; Hu, H.; Liu, M.; Zhou, B.; Zhou, J. Solution structure of the Magnaporthe oryzae avirulence protein AvrPiz-t. J. Biomol. NMR 2013, 55, 219–223. [Google Scholar] [CrossRef]
- Jones, D.; Moolhuijzen, P.; Hane, J. Remote homology clustering identifies lowly conserved families of effector proteins in plant-pathogenic fungi. Microb. Genom. 2021, 7, 000637. [Google Scholar] [CrossRef]
- Bradley, P.; Malmström, L.; Qian, B.; Schonbrun, J.; Chivian, D.; Kim, D.; Meiler, J.; Misura, K.; Baker, D. Free modeling with Rosetta in CASP6. Proteins Struct. Funct. Genet. 2005, 61, 128–134. [Google Scholar] [CrossRef] [PubMed]
- Rohl, C.; Strauss, C.; Misura, K.; Baker, D. Protein Structure Prediction Using Rosetta. Methods Enzymol. 2004, 383, 66–93. [Google Scholar] [CrossRef] [PubMed]
- Kamisetty, H.; Ovchinnikov, S.; Baker, D. Assessing the utility of coevolution-based residue-residue contact predictions in a sequence- and structure-rich era. Proc. Natl. Acad. Sci. USA 2013, 110, 15674–15679. [Google Scholar] [CrossRef] [PubMed] [Green Version]
- Simkovic, F.; Thomas, J.; Keegan, R.; Winn, M.; Mayans, O.; Rigden, D. Residue contacts predicted by evolutionary covariance extend the application of ab initio molecular replacement to larger and more challenging protein folds. IUCrJ 2016, 3, 259–270. [Google Scholar] [CrossRef] [PubMed] [Green Version]
- Ji, S. Improving Protein Structure Prediction Using Amino Acid Contact & Distance Prediction. Doctoral Dissertation, University of Birmingham, Birmingham, UK, 2019. Available online: https://etheses.bham.ac.uk/id/eprint/9044/ (accessed on 24 September 2019).
- Yang, J.; He, B.; Jang, R.; Zhang, Y.; Shen, H.B. Accurate disulfide-bonding network predictions improve ab initio structure prediction of cysteine-rich proteins. Bioinformatics 2015, 31, 3773–3781. [Google Scholar] [CrossRef] [Green Version]
- Ovchinnikov, S.; Park, H.; Varghese, N.; Huang, P.; Pavlopoulos, G.; Kim, D.; Kamisetty, H.; Kyrpides, N.; Baker, D. Protein structure determination using metagenome sequence data. Science 2017, 355, 294–298. [Google Scholar] [CrossRef] [Green Version]
- Seong, K.; Krasileva, K.V. Computational Structural Genomics Unravels Common Folds and Novel Families in the Secretome of Fungal Phytopathogen Magnaporthe oryzae. Mol. Plant-Microbe Interact. 2021, 34, 1267–1280. [Google Scholar] [CrossRef]
- Amoozadeh, S.; Johnston, J.; Meisrimler, C. Exploiting Structural Modelling Tools to Explore Host-Translocated Effector Proteins. Int. J. Mol. Sci. 2021, 22, 12962. [Google Scholar] [CrossRef]
- Stumpff-Kane, A.; Feig, M. A correlation-based method for the enhancement of scoring functions on funnel-shaped energy landscapes. Proteins Struct. Funct. Bioinform. 2006, 63, 155–164. [Google Scholar] [CrossRef]
- Luderer, R.; Takken, F.; de Wit, P.; Joosten, M. Cladosporium fulvum overcomes Cf-2-mediated resistance by producing truncated AVR2 elicitor proteins. Mol. Microbiol. 2002, 45, 875–884. [Google Scholar] [CrossRef]
- Zhong, Z.; Marcel, T.; Hartmann, F.; Ma, X.; Plissonneau, C.; Zala, M.; Ducasse, A.; Confais, J.; Compain, J.; Lapalu, N.; et al. A small secreted protein in Zymoseptoria tritici is responsible for avirulence on wheat cultivars carrying the Stb6 resistance gene. New Phytol. 2017, 214, 619–631. [Google Scholar] [CrossRef] [PubMed] [Green Version]
- Mosquera, G.; Giraldo, M.; Khang, C.; Coughlan, S.; Valent, B. Interaction Transcriptome Analysis Identifies Magnaporthe oryzae BAS1-4 as Biotrophy-Associated Secreted Proteins in Rice Blast Disease. Plant Cell 2009, 21, 1273–1290. [Google Scholar] [CrossRef] [PubMed] [Green Version]
- Plett, J.; Daguerre, Y.; Wittulsky, S.; Vayssières, A.; Deveau, A.; Melton, S.; Kohler, A.; Morrell-Falvey, J.; Brun, A.; Veneault-Fourrey, C.; et al. Effector MiSSP7 of the mutualistic fungus Laccaria bicolor stabilizes the Populus JAZ6 protein and represses jasmonic acid (JA) responsive genes. Proc. Natl. Acad. Sci. USA 2014, 111, 8299–8304. [Google Scholar] [CrossRef] [PubMed] [Green Version]
- Dagvadorj, B.; Ozketen, A.; Andac, A.; Duggan, C.; Bozkurt, T.; Akkaya, M. A Puccinia striiformis f. sp.Tritici secreted protein activates plant immunity at the cell surface. Sci. Rep. 2017, 7, 1141. [Google Scholar] [CrossRef] [Green Version]
- Laugé, R.; Joosten, M.; Van Den Ackerveken, G.; Van Den Broek, H.; De Wit, P. The in planta-produced extracellular proteins ECP1 and ECP2 of Cladosporium fulvum are virulence factors. Mol. Plant-Microbe Interact. 1997, 10, 725–734. [Google Scholar] [CrossRef] [Green Version]
- Lu, X.; Kracher, B.; Saur, I.; Bauer, S.; Ellwood, S.; Wise, R.; Yaeno, T.; Maekawa, T.; Schulze-Lefert, P. Allelic barley MLA immune receptors recognize sequence-unrelated avirulence effectors of the powdery mildew pathogen. Proc. Natl. Acad. Sci. USA 2016, 113, E6486–E6495. [Google Scholar] [CrossRef] [Green Version]
- Dong, Y.; Li, Y.; Zhao, M.; Jing, M.; Liu, X.; Liu, M.; Guo, X.; Zhang, X.; Chen, Y.; Liu, Y.; et al. Global Genome and Transcriptome Analyses of Magnaporthe oryzae Epidemic Isolate 98-06 Uncover Novel Effectors and Pathogenicity-Related Genes, Revealing Gene Gain and Lose Dynamics in Genome Evolution. PLoS Pathog. 2015, 11, e1004801. [Google Scholar] [CrossRef] [Green Version]
- Liu, C.; Pedersen, C.; Schultz-Larsen, T.; Aguilar, G.; Madriz-Ordeñana, K.; Hovmøller, M.; Thordal-Christensen, H. The stripe rust fungal effector PEC6 suppresses pattern-triggered immunity in a host species-independent manner and interacts with adenosine kinases. New Phytol. 2016. [Google Scholar] [CrossRef]
- De La Concepcion, J.; Franceschetti, M.; Maclean, D.; Terauchi, R.; Kamoun, S.; Banfield, M. Protein engineering expands the effector recognition profile of a rice NLR immune receptor. Elife 2019, 8, e47713. [Google Scholar] [CrossRef]
- Cesari, S.; Xi, Y.; Declerck, N.; Chalvon, V.; Mammri, L.; Pugnière, M.; Henriquet, C.; de Guillen, K.; Chochois, V.; Padilla, A.; et al. New recognition specificity in a plant immune receptor by molecular engineering of its integrated domain. Nat. Commun. 2022, 131, 1524. [Google Scholar] [CrossRef]
- Outram, M.; Figueroa, M.; Sperschneider, J.; Williams, S.; Dodds, P. Seeing is believing: Exploiting advances in structural biology to understand and engineer plant immunity. Curr. Opin. Plant Biol. 2022, 67, 102210. [Google Scholar] [CrossRef] [PubMed]
- Seong, K.; Krasileva, K. Prediction of effector protein structures from fungal phytopathogens enables evolutionary analyses. Nat. Microbiol. 2023, 8, 174–187. [Google Scholar] [CrossRef] [PubMed]
- Zhang, Y.; Skolnick, J. Scoring function for automated assessment of protein structure template quality. Proteins Struct. Funct. Genet. 2004, 57, 702–710. [Google Scholar] [CrossRef] [PubMed]
- Bradley, P.; Chivian, D.; Meiler, J.; Misura, K.; Rohl, C.; Schief, W.; Wedemeyer, W.; Schueler-Furman, O.; Murphy, P.; Schonbrun, J.; et al. Rosetta Predictions in CASP5: Successes, Failures, and Prospects for Complete Automation. Proteins Struct. Funct. Genet. 2003, 53, 457–468. [Google Scholar] [CrossRef] [PubMed]
- Koga, N.; Tatsumi-Koga, R.; Liu, G.; Xiao, R.; Acton, T.; Montelione, G.; Baker, D. Principles for designing ideal protein structures. Nature 2012, 491, 222–227. [Google Scholar] [CrossRef] [PubMed] [Green Version]
- Abbass, J.; Nebel, J. Enhancing fragment-based protein structure prediction by customising fragment cardinality according to local secondary structure. BMC Bioinform. 2020, 21, 170. [Google Scholar] [CrossRef]
- Koga, R.; Yamamoto, M.; Kosugi, T.; Kobayashi, N.; Sugiki, T.; Fujiwara, T.; Koga, N. Robust folding of a de novo designed ideal protein even with most of the core mutated to valine. Proc. Natl. Acad. Sci. USA 2020, 117, 31149–31156. [Google Scholar] [CrossRef]
- Yu, T.; Kim, H.; Choi, Y. B-SIDER: Computational Algorithm for the Design of Complementary β-Sheet Sequences. J. Chem. Inf. Model. 2019, 59, 4504–4511. [Google Scholar] [CrossRef]
- MacDonald, J.; Maksimiak, K.; Sadowski, M.; Taylor, W. De novo backbone scaffolds for protein design. Proteins Struct. Funct. Bioinform. 2010, 78, 1311–1325. [Google Scholar] [CrossRef] [Green Version]
- Dyson, H.; Wright, P. Intrinsically unstructured proteins and their functions. Nat. Rev. Mol. Cell Biol. 2005, 6, 197–208. [Google Scholar] [CrossRef]
- Garner, E.; Romero, P.; Dunker, A.K.; Brown, C.; Obradovic, Z. Predicting Binding Regions within Disordered Proteins. Genome Inform. Ser. Workshop Genome Inform. 1999, 10, 41–50. [Google Scholar] [CrossRef]
- Wang, R.-R.; Han, Y.; Krassovsky, K.; Sheffler, W.; Tyka, M.; Baker, D. Modeling Disordered Regions in Proteins Using Rosetta. PLoS ONE 2011, 6, e22060. [Google Scholar] [CrossRef] [PubMed]
- Kim, S.; Seffernick, J.; Lindert, S. Accurately Predicting Disordered Regions of Proteins Using Rosetta ResidueDisorder Application. J. Phys. Chem. 2018, 122, 3920–3930. [Google Scholar] [CrossRef] [PubMed]
- Linding, R.; Jensen, L.; Diella, F.; Bork, P.; Gibson, T.; Russell, R. Protein Disorder Prediction: Implications for Structural Proteomics. Structure 2003, 11, 1453–1459. [Google Scholar] [CrossRef] [PubMed] [Green Version]
- Schlessinger, A.; Yachdav, G.; Rost, B. PROFbval: Predict flexible and rigid residues in proteins. Bioinformatics 2006, 22, 891–893. [Google Scholar] [CrossRef] [PubMed] [Green Version]
- Xu, D.; Zhang, Y. Toward optimal fragment generations for ab initio protein structure assembly. Proteins Struct. Funct. Bioinform. 2013, 81, 229–239. [Google Scholar] [CrossRef] [PubMed] [Green Version]
- Trevizani, R.; Custódio, F.; Santos, K.; Dardenne, L. Critical Features of Fragment Libraries for Protein Structure Prediction. PLoS ONE 2017, 12, e0170131. [Google Scholar] [CrossRef] [PubMed]
- Jumper, J.; Evans, R.; Pritzel, A.; Green, T.; Figurnov, M.; Ronneberger, O.; Tunyasuvunakool, K.; Bates, R.; Žídek, A.; Potapenko, A.; et al. Highly accurate protein structure prediction with AlphaFold. Nature 2021, 596, 583–589. [Google Scholar] [CrossRef]
- Urban, M.; Cuzick, A.; Rutherford, K.; Irvine, A.; Pedro, H.; Pant, R.; Sadanadan, V.; Khamari, L.; Billal, S.; Mohanty, S.; et al. PHI-base: A new interface and further additions for the multi-species pathogen-host interactions database. Nucleic Acids Res. 2017, 45, D604–D610. [Google Scholar] [CrossRef]
- Brunner, P.; McDonald, B. Evolutionary analyses of the avirulence effector AvrStb6 in global populations of Zymoseptoria tritici identify candidate amino acids involved in recognition. Mol. Plant Pathol. 2018, 19, 1836–1846. [Google Scholar] [CrossRef] [Green Version]
- McLaughlin, L.; Haft, R.; Forest, K. Structural insights into the Type II secretion nanomachine. Curr. Opin. Struct. Biol. 2012, 22, 208–216. [Google Scholar] [CrossRef] [PubMed] [Green Version]
- Gao, X.; Mu, Z.; Qin, B.; Sun, Y.; Cui, S. Structure-based prototype peptides targeting the Pseudomonas aeruginosa type VI secretion system effector as a novel antibacterial strategy. Front. Cell. Infect. Microbiol. 2017, 7, 411. [Google Scholar] [CrossRef] [PubMed]
- Douzi, B.; Durand, E.; Bernard, C.; Alphonse, S.; Cambillau, C.; Filloux, A.; Tegoni, M.; Voulhoux, R. The XcpV/GspI Pseudopilin Has a Central Role in the Assembly of a Quaternary Complex within the T2SS Pseudopilus. J. Biol. Chem. 2009, 284, 34580. [Google Scholar] [CrossRef] [Green Version]
- Urban, M.; Cuzick, A.; Seager, J.; Wood, V.; Rutherford, K.; Venkatesh, S.; De Silva, N.; Martinez, M.; Pedro, H.; Yates, A.; et al. PHI-base: The pathogen-host interactions database. Nucleic Acids Res. 2020, 48, D613–D620. [Google Scholar] [CrossRef]
- Petersen, T.; Brunak, S.; von Heijne, G.; Nielsen, H. SignalP 4.0: Discriminating signal peptides from transmembrane regions. Nat. Methods 2011, 8, 785–786. [Google Scholar] [CrossRef]
- Nielsen, H. Predicting Secretory Proteins with SignalP. Methods Mol. Biol. 2017, 1611, 59–73. [Google Scholar] [CrossRef] [Green Version]
- Raman, S.; Vernon, R.; Thompson, J.; Tyka, M.; Sadreyev, R.; Pei, J.; Kim, D.; Kellogg, E.; DiMaio, F.; Lange, O.; et al. Structure prediction for CASP8 with all-atom refinement using Rosetta. Proteins Struct. Funct. Bioinform. 2009, 77, 89–99. [Google Scholar] [CrossRef] [PubMed] [Green Version]
- Chivian, D.; Kim, D.; Malmström, L.; Bradley, P.; Robertson, T.; Murphy, P.; Strauss, C.; Bonneau, R.; Rohl, C.; Baker, D. Automated Prediction of CASP-5 Structures Using the Robetta Server. Proteins Struct. Funct. Genet. 2003, 53, 524–533. [Google Scholar] [CrossRef]
- Ovchinnikov, S.; Park, H.; Kim, D.; DiMaio, F.; Baker, D. Protein structure prediction using Rosetta in CASP12. Proteins Struct. Funct. Bioinform. 2018, 86, 113–121. [Google Scholar] [CrossRef]
- Alford, R.; Leaver-Fay, A.; Jeliazkov, J.; O’Meara, M.; DiMaio, F.; Park, H.; Shapovalov, M.V.; Renfrew, P.; Mulligan, V.; Kappel, K.; et al. The Rosetta All-Atom Energy Function for Macromolecular Modeling and Design. J. Chem. Theory Comput. 2017, 13, 3031–3048. [Google Scholar] [CrossRef]
- Herbert, A. MaxCluster—A tool for Protein Structure Comparison and Clustering. 2013. Available online: http://www.sbg.bio.ic.ac.uk/~maxcluster (accessed on 24 September 2019).
- Ginalski, K.; Elofsson, A.; Fischer, D.; Rychlewski, L. 3D-Jury: A simple approach to improve protein structure predictions. Bioinformatics 2003, 19, 1015–1018. [Google Scholar] [CrossRef] [PubMed] [Green Version]
- Xu, J.; Zhang, Y. How significant is a protein structure similarity with TM-score = 0.5? Bioinformatics 2010, 26, 889–895. [Google Scholar] [CrossRef] [PubMed] [Green Version]
- Siew, N.; Elofsson, A.; Rychlewski, L.; Fischer, D. MaxSub: An automated measure for the assessment of protein structure prediction quality. Bioinformatics 2000, 16, 776–785. [Google Scholar] [CrossRef] [Green Version]
- Zhang, Y.; Skolnick, J. TM-align: A protein structure alignment algorithm based on the TM-score. Nucleic Acids Res. 2005, 33, 2302–2309. [Google Scholar] [CrossRef] [PubMed]
- Laskowski, R.; MacArthur, M.; Moss, D.; Thornton, J. PROCHECK: A program to check the stereochemical quality of protein structures. J. Appl. Crystallogr. 1993, 26, 283–291. [Google Scholar] [CrossRef]
- Wiederstein, M.; Sippl, M. ProSA-web: Interactive web service for the recognition of errors in three-dimensional structures of proteins. Nucleic Acids Res. 2007, 35, W407. [Google Scholar] [CrossRef] [Green Version]
- Eisenberg, D.; Lüthy, R.; Bowie, J. VERIFY3D: Assessment of protein models with three-dimensional profiles. Methods Enzymol. 1997, 277, 396–404. [Google Scholar] [CrossRef]
- Holm, L. Benchmarking fold detection by DaliLite v.5. Bioinformatics 2019, 35, 5326–5327. [Google Scholar] [CrossRef]
- Holm, L. Using Dali for Protein Structure Comparison. Methods Mol. Biol. 2020, 2112, 29–42. [Google Scholar] [CrossRef]
- Holm, L.; Kääriäinen, S.; Rosenström, P.; Schenkel, A. Searching protein structure databases with DaliLite v.3. Bioinformatics 2008, 24, 2780–2781. [Google Scholar] [CrossRef] [Green Version]
- Knudsen, M.; Wiuf, C. The CATH database. Hum. Genom. 2010, 4, 207–212. [Google Scholar] [CrossRef] [PubMed]
- Sillitoe, I.; Bordin, N.; Dawson, N.; Waman, V.; Ashford, P.; Scholes, H.; Pang, C.; Woodridge, L.; Rauer, C.; Sen, N.; et al. CATH: Increased structural coverage of functional space. Nucleic Acids Res. 2021, 49, D266–D273. [Google Scholar] [CrossRef] [PubMed]
- Murzin, A.; Brenner, S.; Hubbard, T.; Chothia, C. SCOP: A structural classification of proteins database for the investigation of sequences and structures. J. Mol. Biol. 1995, 247, 536–540. [Google Scholar] [CrossRef] [PubMed]
- Andreeva, A.; Kulesha, E.; Gough, J.; Murzin, A. The SCOP database in 2020: Expanded classification of representative family and superfamily domains of known protein structures. Nucleic Acids Res. 2020, 48, D376–D382. [Google Scholar] [CrossRef]
- Andreeva, A.; Howorth, D.; Chothia, C.; Kulesha, E.; Murzin, A. SCOP2 prototype: A new approach to protein structure mining. Nucleic Acids Res. 2014, 42, D310–D314. [Google Scholar] [CrossRef]
- Xu, D.; Zhang, Y. Ab initio protein structure assembly using continuous structure fragments and optimized knowledge-based force field. Proteins 2012, 80, 1715–1735. [Google Scholar] [CrossRef] [Green Version]
- Kim, D.; Chivian, D.; Baker, D. Protein structure prediction and analysis using the Robetta server. Nucleic Acids Res. 2004, 32, W526–W531. [Google Scholar] [CrossRef] [Green Version]
- Zhang, Y.; Skolnick, J. SPICKER: A clustering approach to identify near-native protein folds. J. Comput. Chem. 2004, 25, 865–871. [Google Scholar] [CrossRef]
- Wang, T.; Gong, H.; Shakhnovich, E. Improved fragment-based movement with LRFragLib for all-atom Ab initio protein folding. arXiv 2019, arXiv:1906.05785. [Google Scholar]


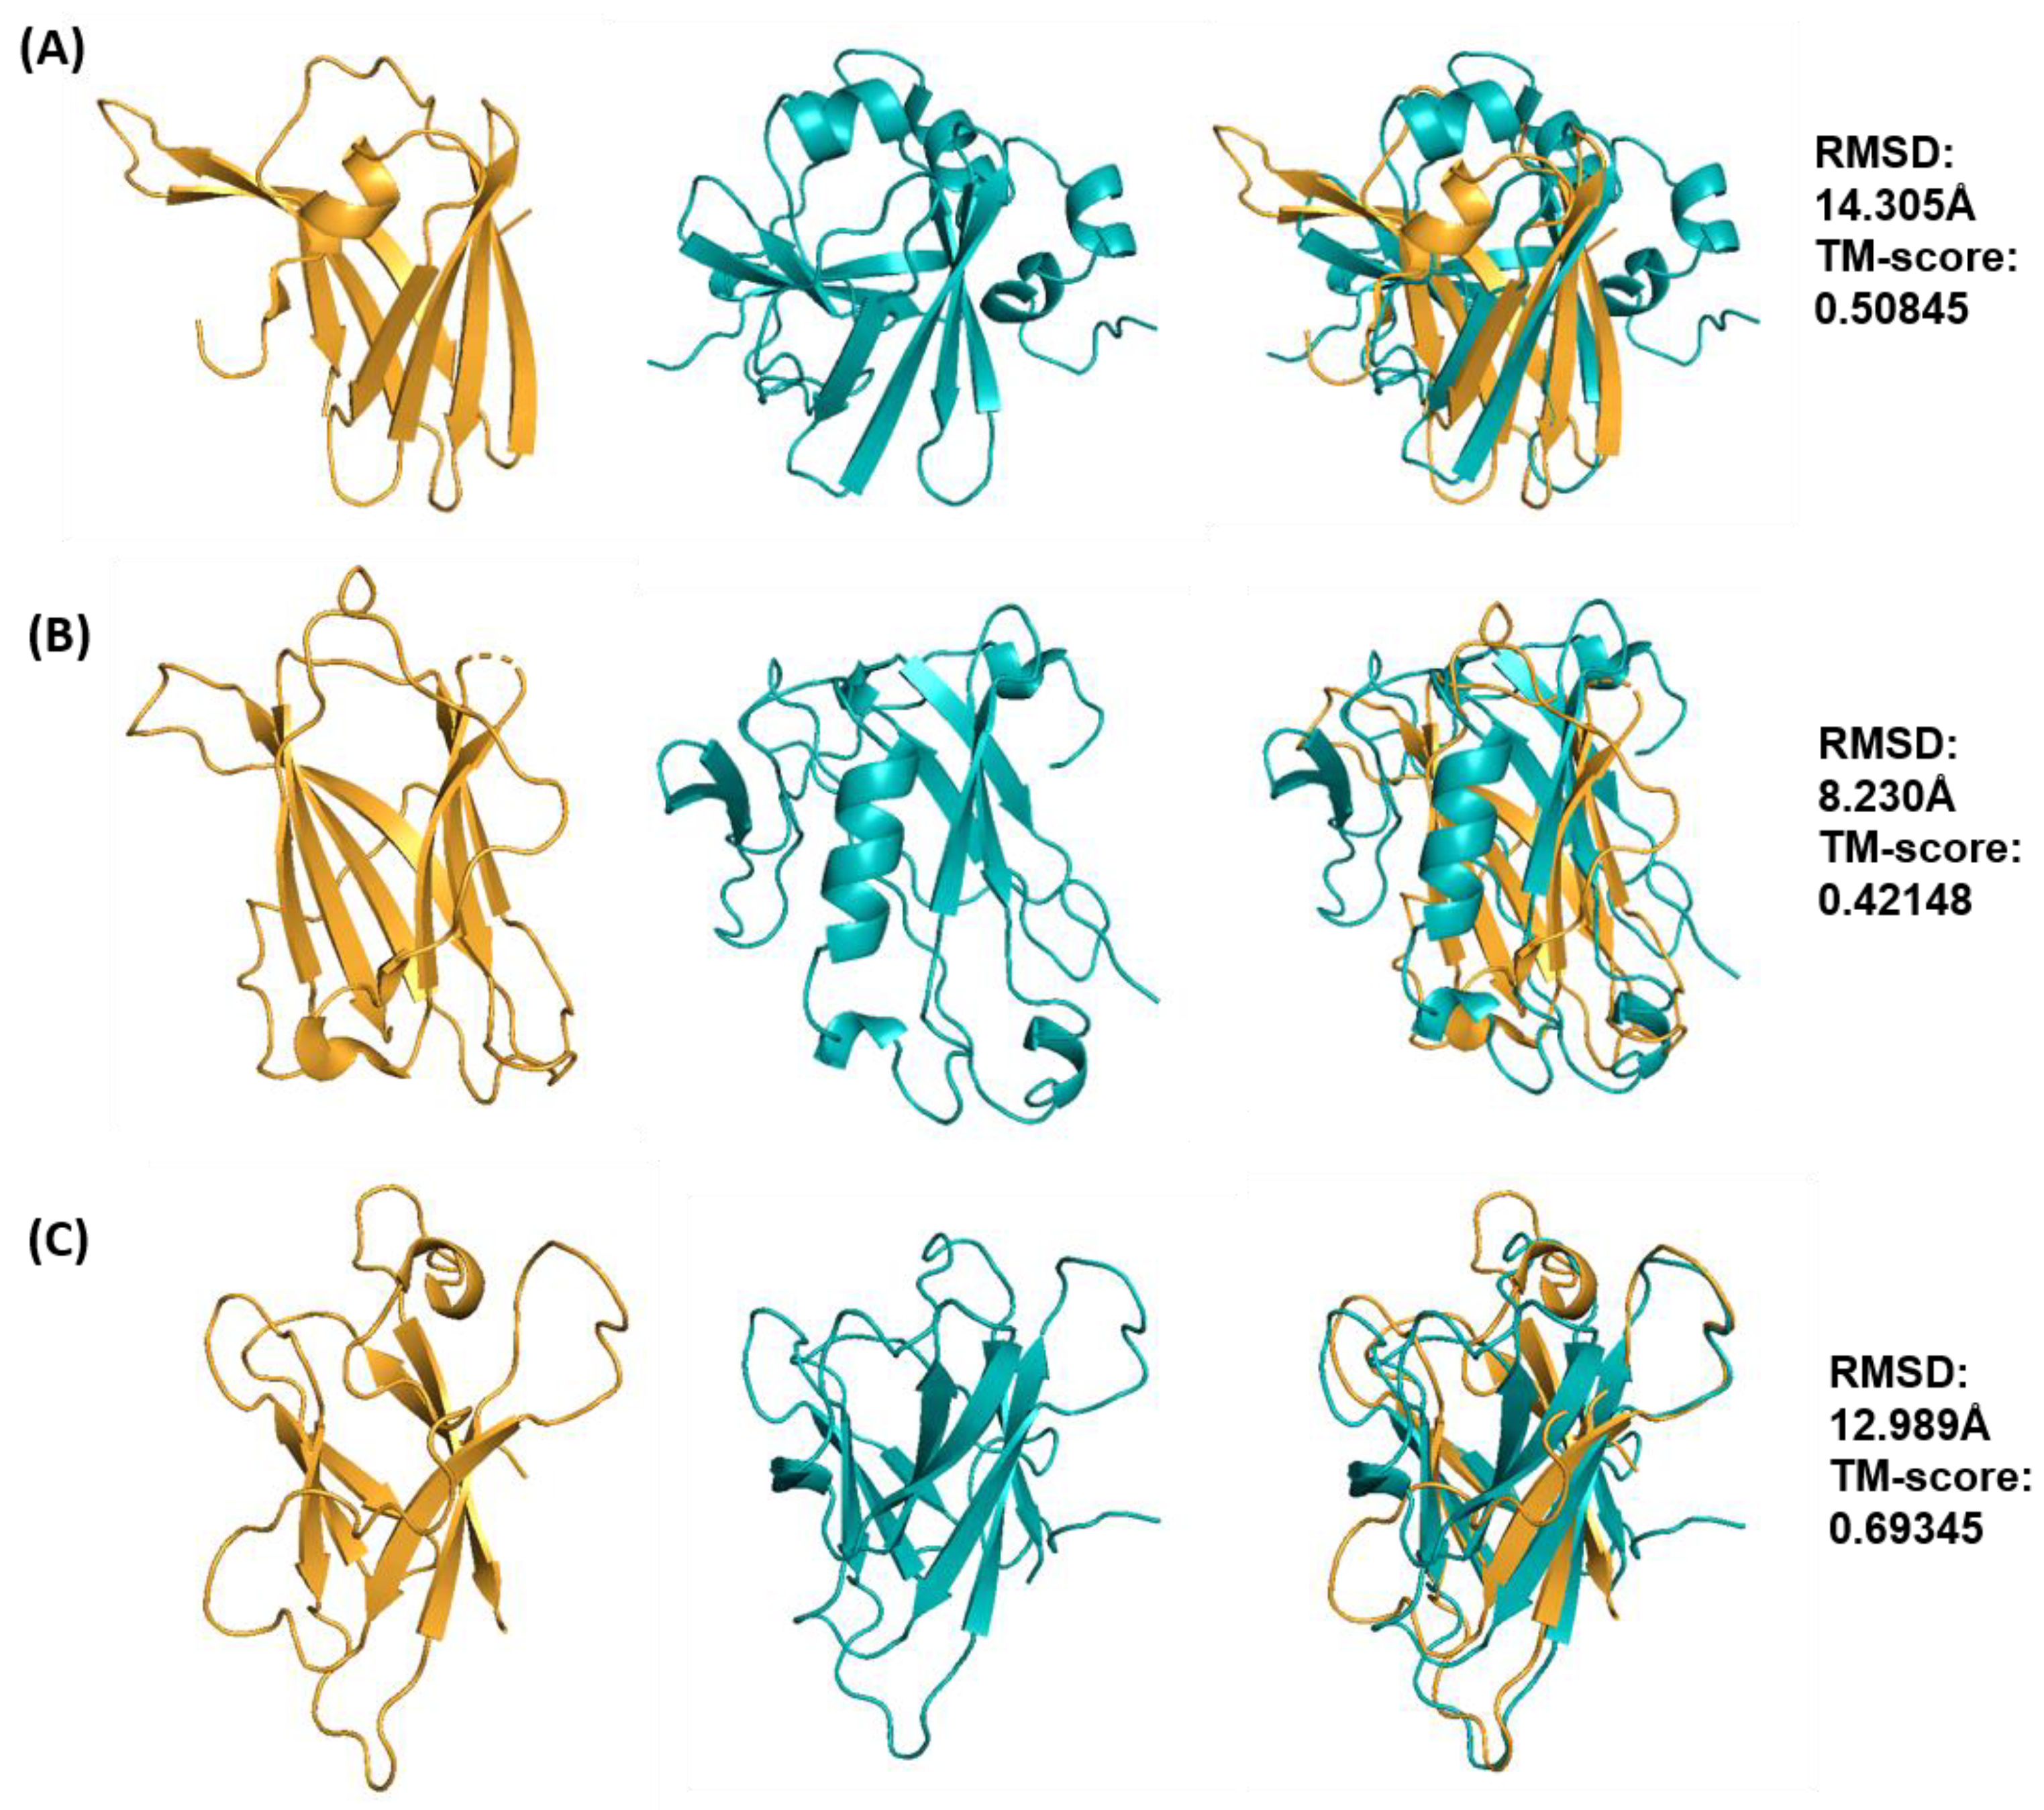
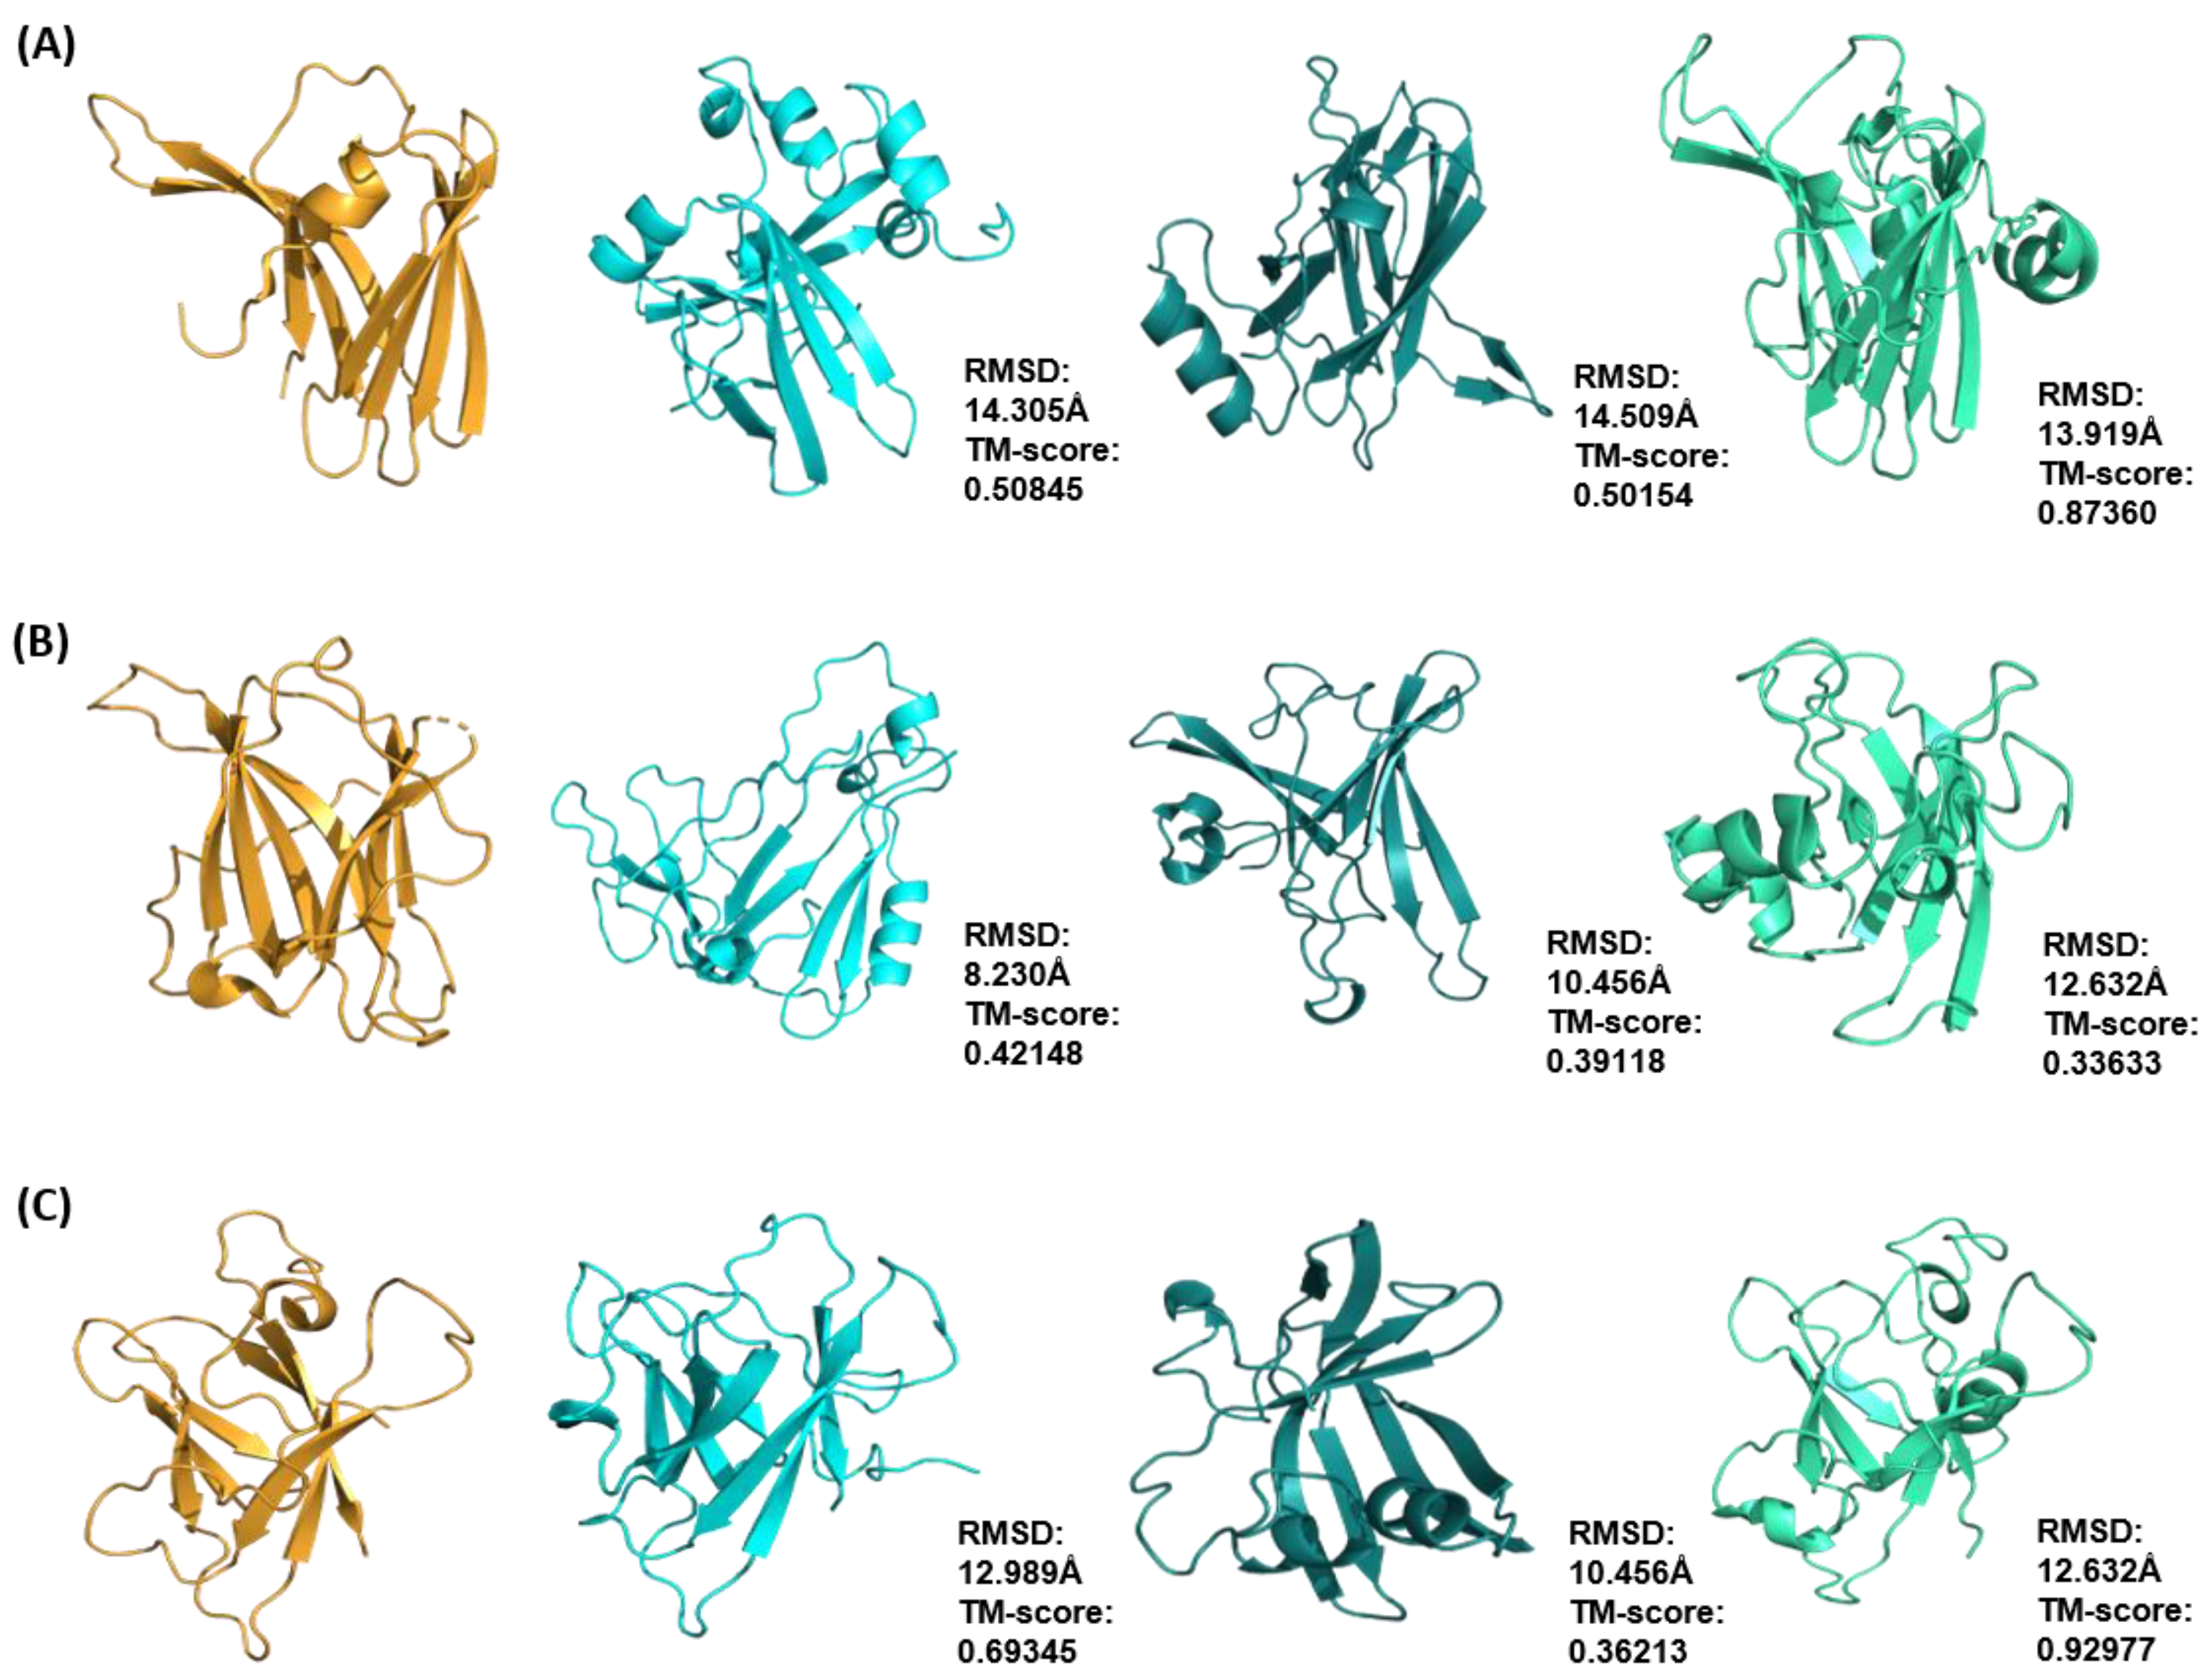
| Effector Protein Template (PDB ID) | Species | TM-Score | RMSD (Å) | nstruct |
|---|---|---|---|---|
| ToxA (1ZLD) | Pyrenophora tritici repentis | 0.50845 | 14.31 | 50,000 |
| Avr2 (Fol) (5OD4) | Fusarium oxysporum f. sp. lycopersici | 0.42148 | 8.23 | 40,000 |
| AvrL567 (2QVT) | Melampsora lini | 0.69345 | 12.99 | 30,000 |
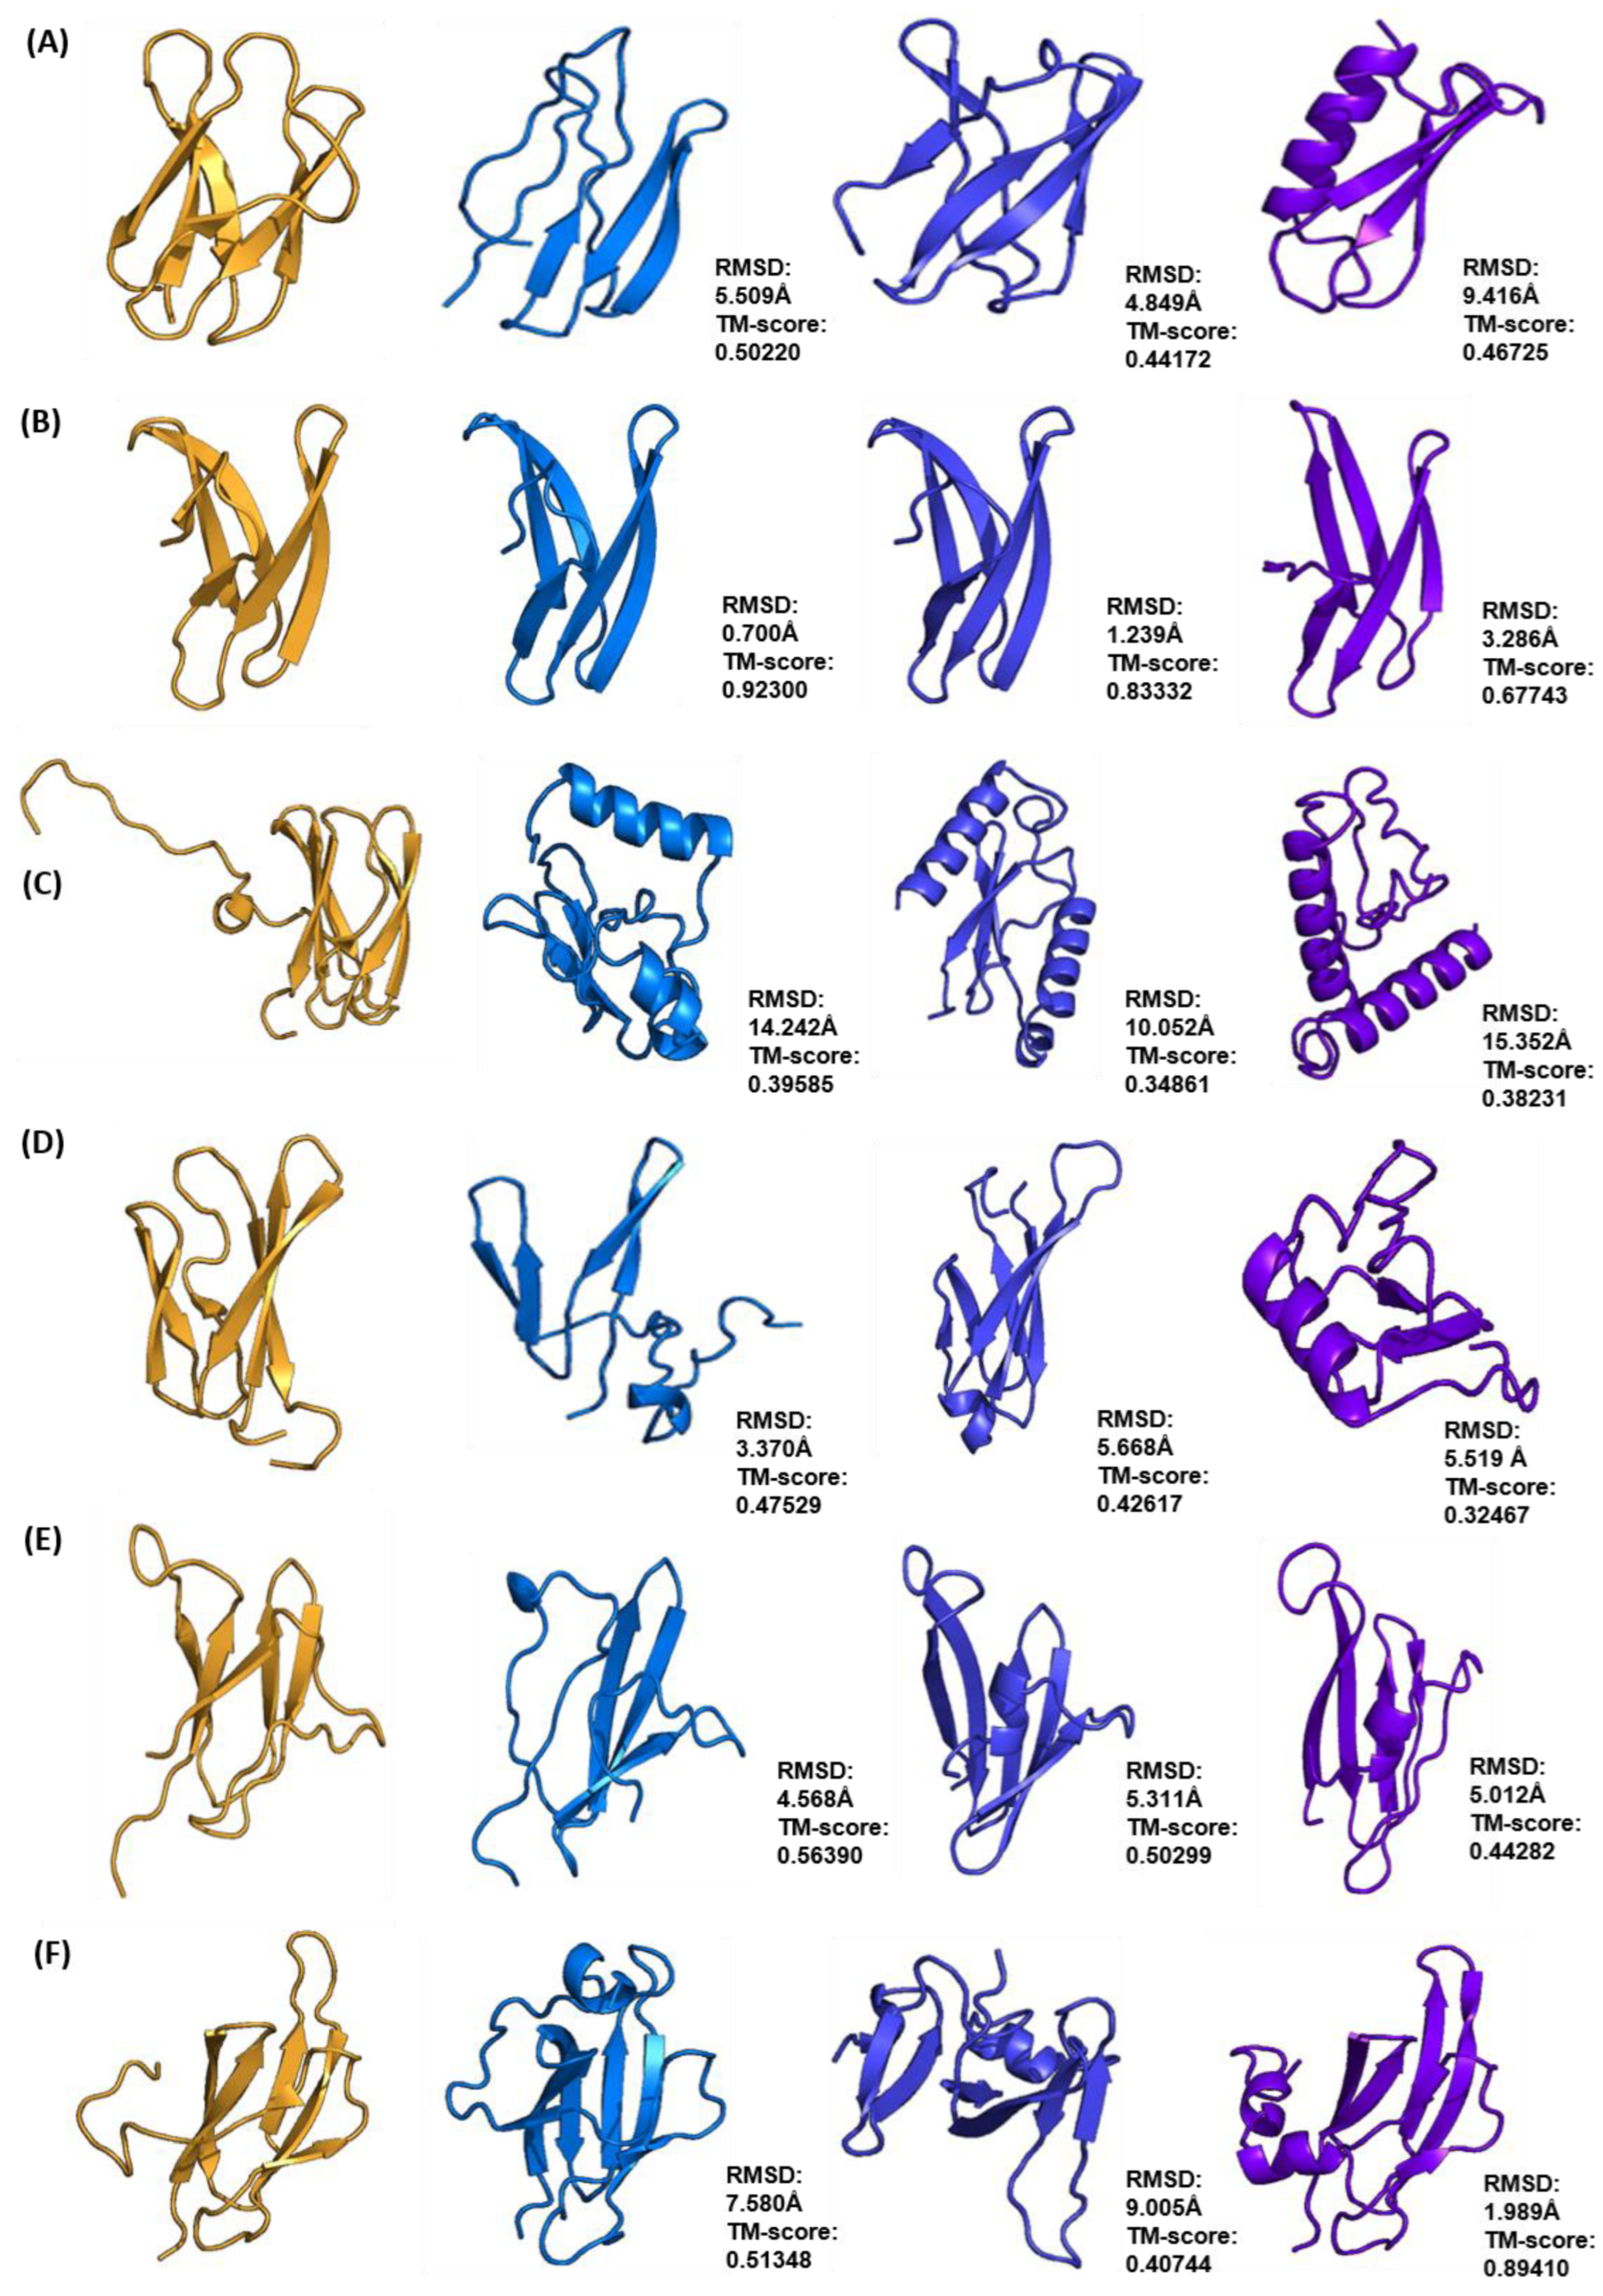
| ToxB (2MM0) | Pyrenophora tritici repentis | 0.50220 | 5.51 | 40,000 |
| AvrPib (5Z1V) | Magnaporthe oryzae | 0.92300 | 0.70 | 10,000 |
| AvrPik (6FUB) | Magnaporthe oryzae | 0.39585 | 14.24 | 50,000 |
| Avr1CO39 (5ZNG) | Magnaporthe oryzae | 0.47529 | 3.37 | 50,000 |
| AvrPia (2N37) | Magnaporthe oryzae | 0.56390 | 4.57 | 50,000 |
| AvrPiz-t (2LW6) | Magnaporthe oryzae | 0.51348 | 7.58 | 7500 |
| Effector Protein | Total Number of Clusters | Cluster Rank with Best Structural Model |
|---|---|---|
| ToxA | 117 | 4 |
| Avr2 (Fol) | 59 | 1 |
| AvrL567 | 57 | 7 |
| ToxB | 81 | 1 |
| AvrPib | 24 | 2 |
| AvrPik | 136 | 1 |
| Avr1CO39 | 86 | 1 |
| AvrPia * | 137 | NA |
| AvrPiz-t * | 20 | NA |
| Effector Proteins | 10,000 | 20,000 | 30,000 | 40,000 | 50,000 |
|---|---|---|---|---|---|
| ToxA | 2/33 | 2/41 | 4/57 | 2/90 | 4/117 |
| Avr2 (Fol) | NA/23 | 1/25 | 1/46 | 1/59 | NA/26 |
| AvrL567 | 8/32 | 13/65 | 7/57 | 7/89 | 6/108 |
| ToxB | 1/21 | 8/39 | 3/62 | 1/81 | 1/96 |
| AvrPib | 2/24 | 3/47 | 8/71 | 3/91 | 2/110 |
| AvrPik | 1/40 | NA/78 | 1/129 | NA/105 | 1/136 |
| Avr1CO39 | NA/21 | NA/40 | 1/84 | 13/56 | 1/86 |
| AvrPia | 20/28 | NA/51 | NA/28 | NA/105 | NA/137 |
| AvrPiz-t | 5/21 | NA/47 | NA/72 | NA/95 | 1/128 |
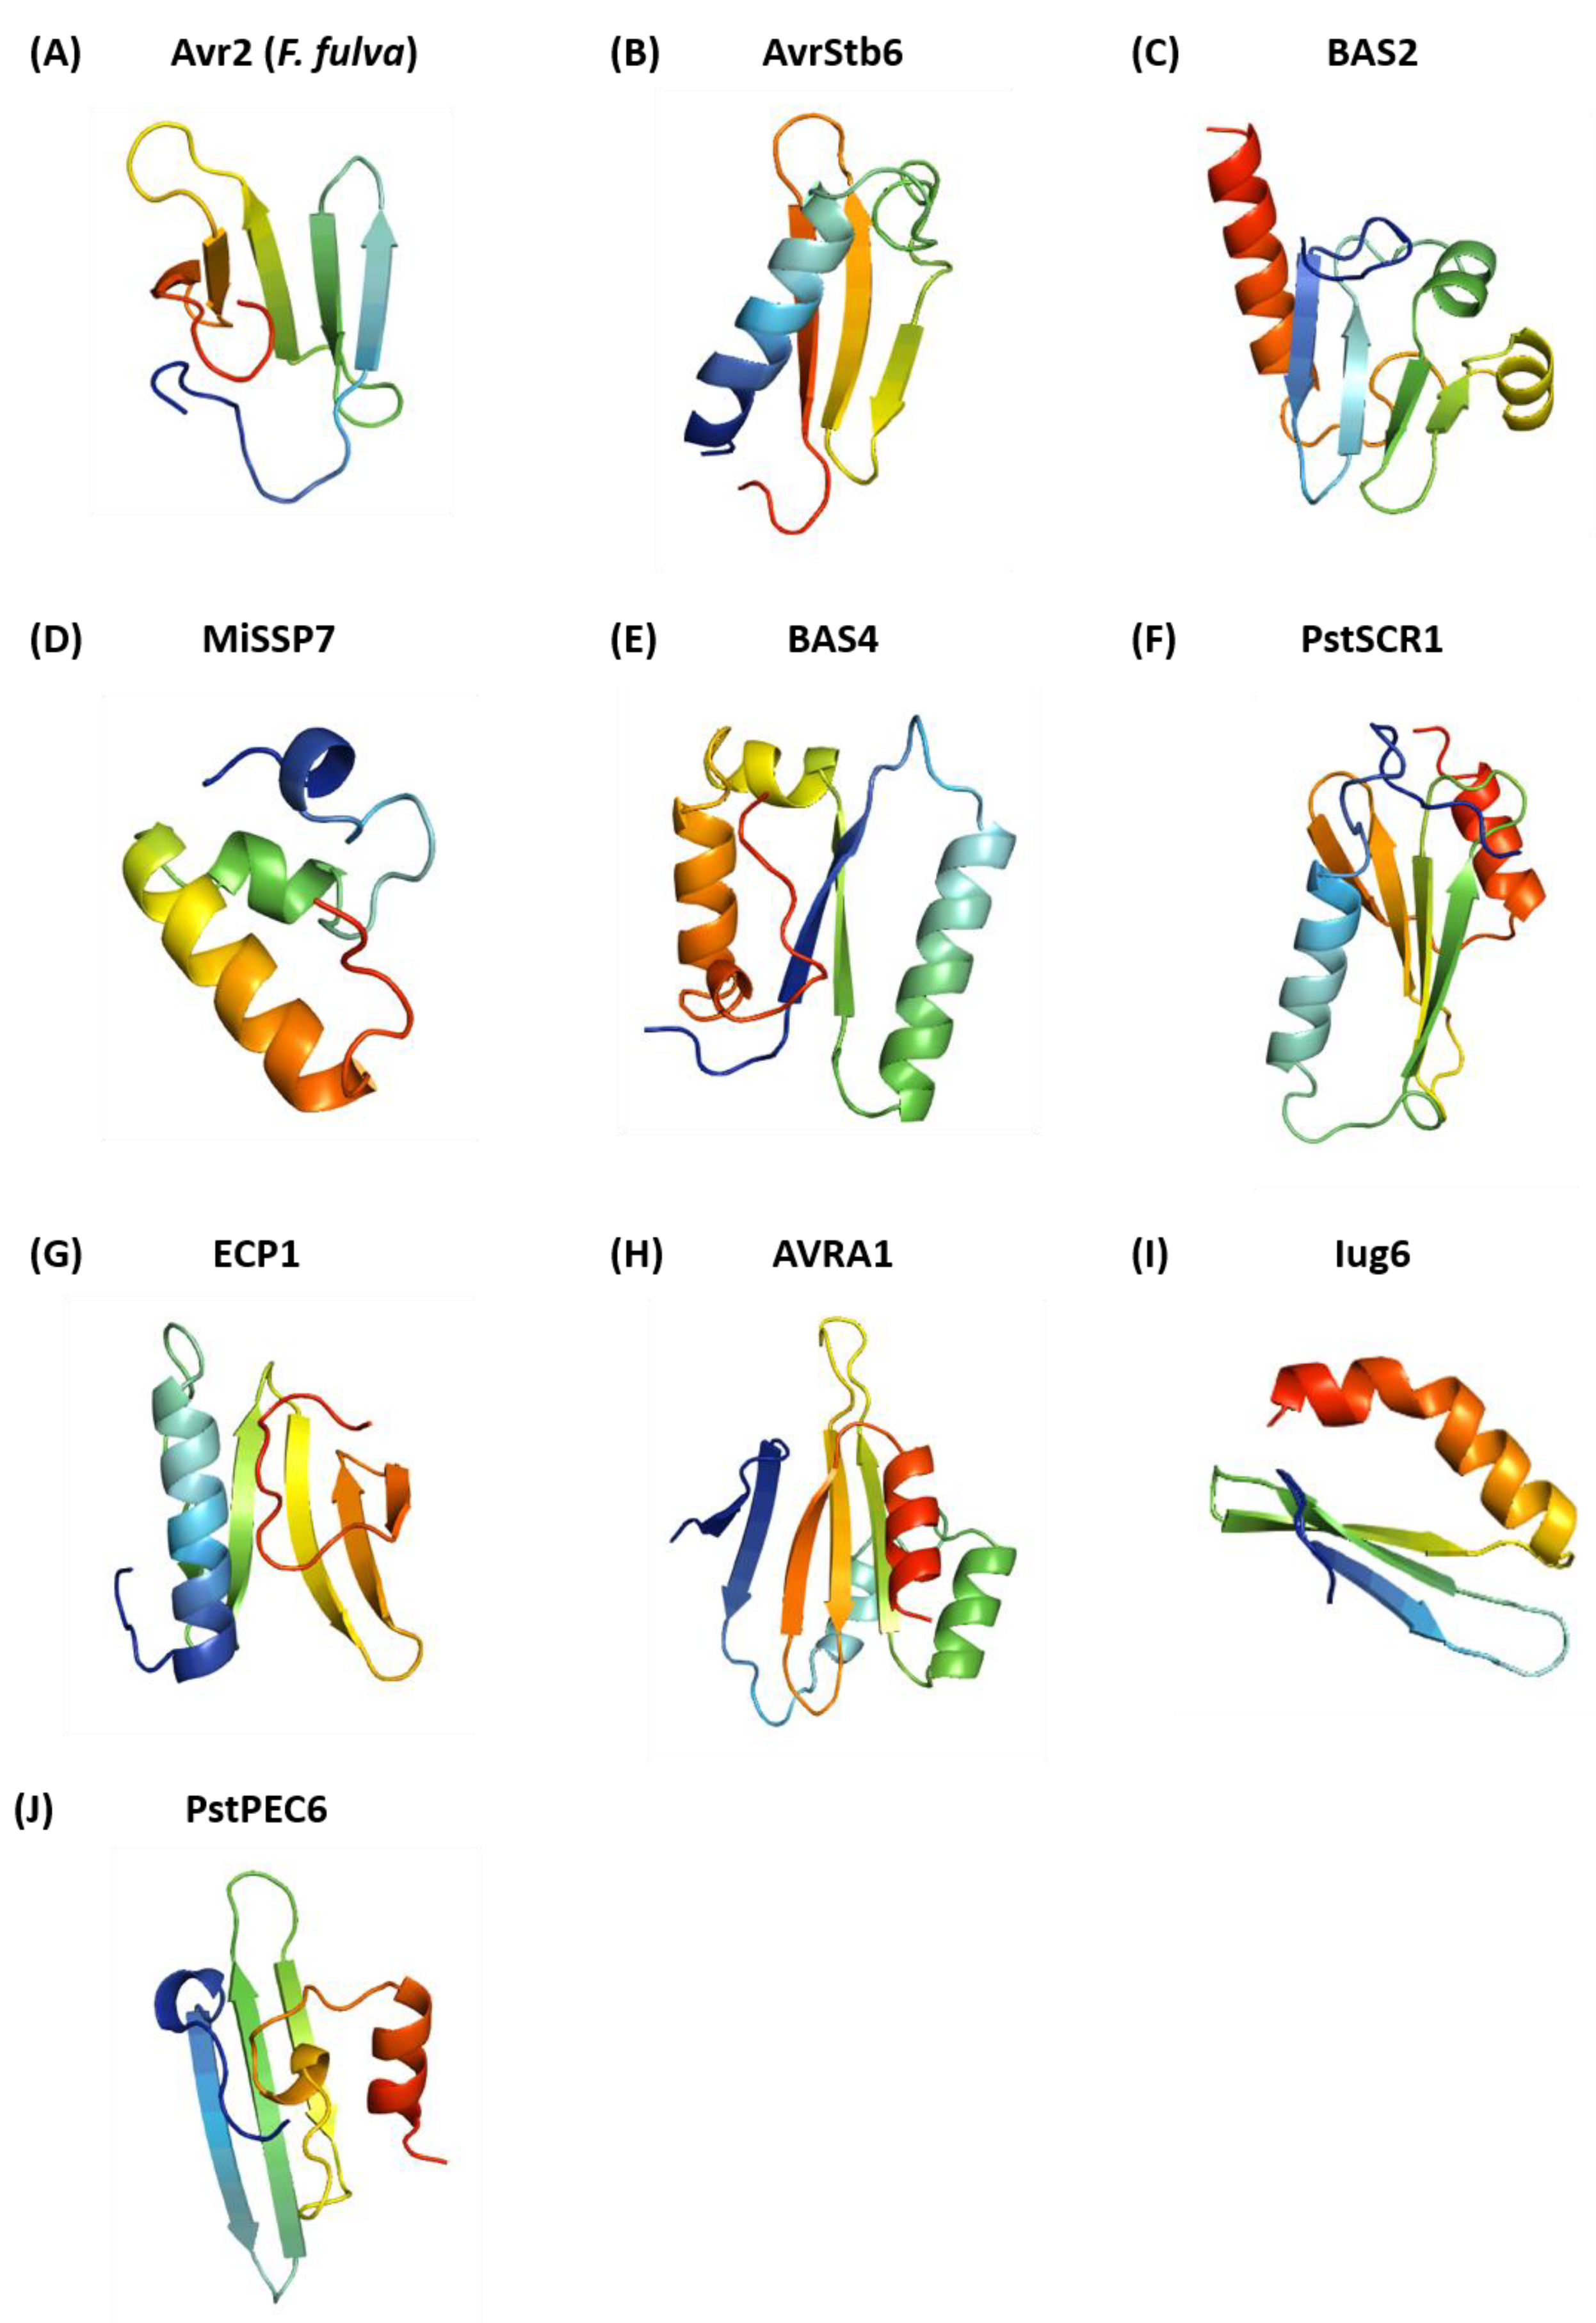
| Effector Name | Fungal Species | Structural Homologue (PDB ID) | DALI Z-Score | RMSD (Å) |
|---|---|---|---|---|
| Avr2 | Fulvia fulva | Outer surface protein A/B (1P4P) | 4.5 | 2.8 |
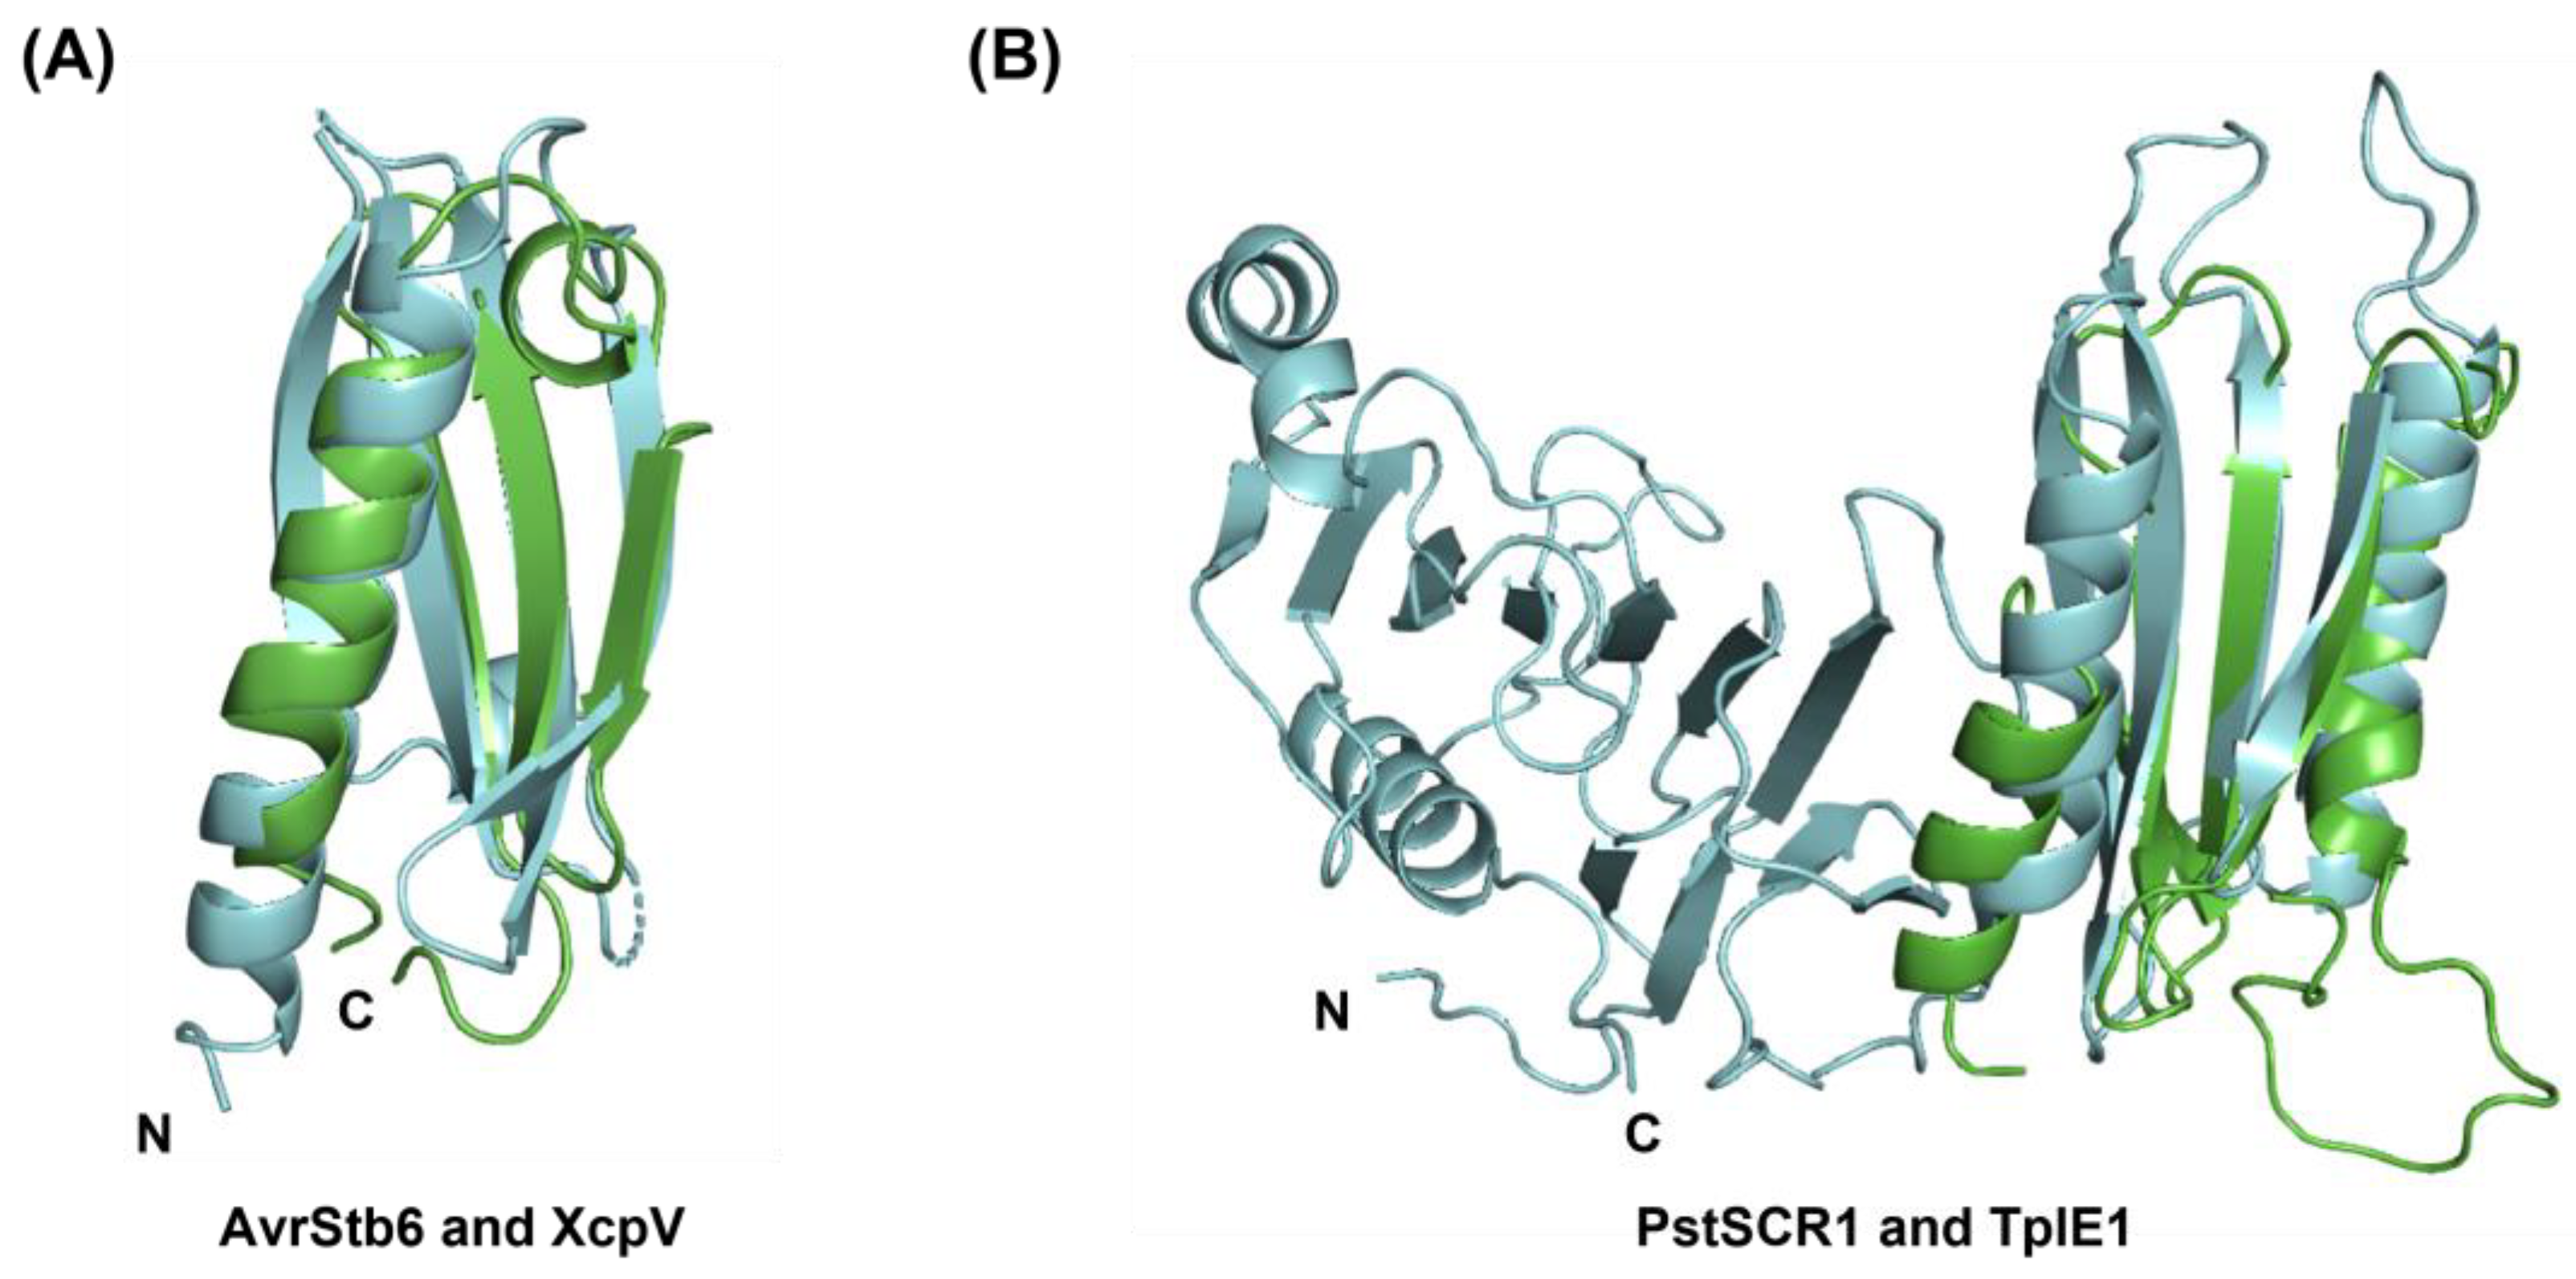
| AvrStb6 | Zymoseptoria tritici | Type II secretion system protein J (5BW0) | 4.6 | 2.2 |
| BAS2 | Magnaporthe oryzae | Serine–threonine protein kinase PLK4 (5LHX) | 3.2 | 4.0 |
| MiSSP7 | Laccaria bicolor | Deneddylase (4TT0) | 3.5 | 2.1 |
| BAS4 | Magnaporthe orzae | Rod-shape determining protein MREB (4CZM) | 5.8 | 3.0 |
| PstSCR1 | Puccinia striiformis f. sp. tritici | Type VI secretion system protein (5H7Z) | 5.6 | 3.5 |
| ECP1 | Fulvia fulva | Mediator of RNA polymerase II transcription subunit (5N9J) | 6.0 | 2.9 |
| AVRA1 | Blumeria graminis f. sp. hordie | DUF1795 domain containing protein (1MIL) | 5.9 | 3.4 |
| Iug6 | Magnaporthe oryzae | Fermitin family homologue 1 (4BBK) | 5.0 | 2.8 |
| Neurobeachin (1MI1) | 5.4 | 2.1 | ||
| PstPEC6 | Puccinia striiformis f. sp. tritici | Protein of unknown function (DUF1696) with pleckstrin (3DCX) | 3.0 | 2.4 |
| UDP-N-acetylmuramoylalanine-D-glutamyl-lysine-D-A (2AM1) | 3.6 | 3.2 |
| Effector Name (Species) | CATH Classification (PDB ID Match) | C: Class A: Architecture T: Topology H: Homologous Superfamily | SSAP Score, RMSD (Å) | Ref. |
|---|---|---|---|---|
| Avr2 (Fulvia fulva) | 2.30.30.370 (1WZO) | Mainly beta. Roll. SH3 type barrels. FAH Domain | 78.5, 4.3 | [41] |
| AvrStb6 (Zymoseptoria tritici) | 3.10.450.210 (2P0X) | Alpha beta. Roll. Nuclear Transport Factor 2, Chain A. | 75.2, 3.9 | [42] |
| BAS2 (Magnaporthe oryzae) | 3.30.390.90 (3D9X) | Alpha beta. Two-layer sandwich. Enolase-like domain 1. | 76.4, 7.2 | [43] |
| MiSSP7 (Laccaria bicolor) | 1.10.8.550 (2L09) | Mainly alpha. Orthogonal bundle. Helicase, Ruva protein, domain 3. Proto-chlorophyllide reductase 57 kD subunitB. | 72.3, 2.7 | [44] |
| BAS4 (Magnaporthe oryzae) | 3.30.429.10 (3EJ7) | Alpha beta. Two-layer sandwich. Macrophage migration inhibitory factor (T and H). | 80.1, 5.9 | [43] |
| PstSCR1 (Puccinia striiformis f. sp. tritici) | 3.10.450.210 (2P0X) | Alpha beta. Roll. Nuclear transport factor 2, chain A. | 80.5, 3.3 | [45] |
| ECP1 (Fulvia fulva) | 2.60.40.1180 (1LWJ) | Mainly beta. Sandwich. Immunoglubulin-like. Golgi alpha-mannoside 2 | 76.2, 3.3 | [46] |
| AVRA1 (Blumeria graminis f. sp. hordei) | 3.30.160.190 (2JYA) | Alpha beta. Two-layer sandwich. Double stranded RNA binding domain. Atu1810-like domain. | 74.8, 4.0 | [47] |
| Iug6 (Magnaporthe oryzae) | 3.30.160.60 (4F6M) | Alpha beta. Two-layer sandwich. Double stranded RNA binding domain. Classic zinc finger. | 78.9, 2.3 | [48] |
| PstPEC6 (Puccinia striiformis f. sp. tritici) | 2.20.25.10 (2JS4) | Mainly beta. Single sheet. N-terminal domain of TfIIb. | 74.6, 3.9 | [49] |
Disclaimer/Publisher’s Note: The statements, opinions and data contained in all publications are solely those of the individual author(s) and contributor(s) and not of MDPI and/or the editor(s). MDPI and/or the editor(s) disclaim responsibility for any injury to people or property resulting from any ideas, methods, instructions or products referred to in the content. |
© 2023 by the authors. Licensee MDPI, Basel, Switzerland. This article is an open access article distributed under the terms and conditions of the Creative Commons Attribution (CC BY) license (https://creativecommons.org/licenses/by/4.0/).
Share and Cite
Rozano, L.; Mukuka, Y.M.; Hane, J.K.; Mancera, R.L. Ab Initio Modelling of the Structure of ToxA-like and MAX Fungal Effector Proteins. Int. J. Mol. Sci. 2023, 24, 6262. https://doi.org/10.3390/ijms24076262
Rozano L, Mukuka YM, Hane JK, Mancera RL. Ab Initio Modelling of the Structure of ToxA-like and MAX Fungal Effector Proteins. International Journal of Molecular Sciences. 2023; 24(7):6262. https://doi.org/10.3390/ijms24076262
Chicago/Turabian StyleRozano, Lina, Yvonne M. Mukuka, James K. Hane, and Ricardo L. Mancera. 2023. "Ab Initio Modelling of the Structure of ToxA-like and MAX Fungal Effector Proteins" International Journal of Molecular Sciences 24, no. 7: 6262. https://doi.org/10.3390/ijms24076262