Article

TNFα Activates the Liver X Receptor Signaling Pathway and Promotes Cholesterol Efflux from Human Brain Pericytes Independently of ABCA1

1
Blood-Brain Barrier Laboratory (LBHE), UR 2465, University of Artois, F-62300 Lens, France
2
Department of Neurology and Clinical Neuroscience, Graduate School of Medicine, Yamaguchi University, Ube 755-8505, Japan
3
Department of Pathology, Section of Neuropathology, Translational Neurodegeneration Research and Neuropathology Lab, University of Oslo, Oslo University Hospital, Sognsvannsveien 20, 0372 Oslo, Norway
4
Pahnke Lab (Drug Development and Chemical Biology), Lübeck Institute of Experimental Dermatology (LIED), University of Lübeck, University Medical Center Schleswig-Holstein, Ratzeburger Allee 160, 23538 Lübeck, Germany
5
Department of Pharmacology, Faculty of Medicine, University of Latvia, Jelgavas iela 3, 1004 Riga, Latvia
6
Department of Neurobiology, The Georg S. Wise Faculty of Life Sciences, Tel Aviv University, Tel Aviv 6997801, Israel
*
Author to whom correspondence should be addressed.
Int. J. Mol. Sci. 2023, 24(6), 5992; https://doi.org/10.3390/ijms24065992
Submission received: 30 January 2023 / Revised: 13 March 2023 / Accepted: 18 March 2023 / Published: 22 March 2023
(This article belongs to the Collection Feature Paper Collection in Biochemistry)

Abstract

:
Neuroinflammation and brain lipid imbalances are observed in Alzheimer’s disease (AD). Tumor necrosis factor-α (TNFα) and the liver X receptor (LXR) signaling pathways are involved in both processes. However, limited information is currently available regarding their relationships in human brain pericytes (HBP) of the neurovascular unit. In cultivated HBP, TNFα activates the LXR pathway and increases the expression of one of its target genes, the transporter ATP-binding cassette family A member 1 (ABCA1), while ABCG1 is not expressed. Apolipoprotein E (APOE) synthesis and release are diminished. The cholesterol efflux is promoted, but is not inhibited, when ABCA1 or LXR are blocked. Moreover, as for TNFα, direct LXR activation by the agonist (T0901317) increases ABCA1 expression and the associated cholesterol efflux. However, this process is abolished when LXR/ABCA1 are both inhibited. Neither the other ABC transporters nor the SR-BI are involved in this TNFα-mediated lipid efflux regulation. We also report that inflammation increases ABCB1 expression and function. In conclusion, our data suggest that inflammation increases HBP protection against xenobiotics and triggers an LXR/ABCA1 independent cholesterol release. Understanding the molecular mechanisms regulating this efflux at the level of the neurovascular unit remains fundamental to the characterization of links between neuroinflammation, cholesterol and HBP function in neurodegenerative disorders.

1. Introduction

The brain is the most cholesterol-rich organ of the body and central nervous system (CNS) cholesterol synthesis accounts for the highest production rates across the body [1]. Cholesterol is an essential component of all mammalian cells, ensuring proper membrane integrity, fluidity, and biochemical function, thus affecting endocytosis, and is enriched in the myelin sheath. The membrane cholesterol pool is also important in host defense processes during immune responses [2]. In CNS, almost all of the cholesterol is produced de novo by astrocytes due to the presence of the blood–brain barrier (BBB) which strictly regulates nutrients, waste products and cell exchanges between CNS and the bloodstream [1,3]. Cholesterol is then transferred from the plasma membrane of astrocytes by the ATP-binding cassette A subfamily 1 (ABCA1) transporter to form high density lipoproprotein (HDL) particles comprising apolipoproteins such as APOA-I or APOE. ABCG1, a second ABC transporter, is then able to transfer additional cholesterol molecules from astrocyte membranes to HDL to form mature HDL that are then shuttled to neurons and taken up by the low density lipoprotein receptor (LDLR) and the LDLR-related protein 1 (LRP1) in order to be used for synaptogenesis, myelin sheath synthesis and membrane repair [4,5]. Cerebral cholesterol levels of neural cells are strictly sensed and regulated by the nuclear liver X receptors (LXRs) that tightly control the expression of ABCA1 [6]. The LXR/ABCA1 axis is a very promising therapeutic target for Alzheimer’s disease (AD), wherein dysfunction in CNS cholesterol metabolism and the abnormal accumulation of toxic amyloid β (Aβ) peptides have been reported. In this regard, treatments with LXR agonists or overexpression of ABCA1 lead to a decrease in Aβ burden in mouse brains, which was correlated with a partial recovery of cognitive function [7,8,9]. On the contrary, deletion of ABCA1 is associated with increased brain Aβ deposition [10,11]. APP/PS1 LXR null mice show increased lipid in the brain as well as Aβ deposition [12]. Furthermore, it has been reported that ABCA1-mediated cholesterol efflux is impaired in patients with AD and mild cognitive impairment [13]. More recently, genome-wide association studies (GWAS) have identified ABCA1 polymorphisms as strongly linked to a high risk of developing AD [14], thus reinforcing the hypothesis that the LXR/ABCA1 axis could be a promising drug target for AD. Despite these findings, the role of the LXR/ABCA1 axis in the CNS remains to be clarified, in particular for CNS cholesterol homeostasis. Closely linked with the cholesterol metabolism, neuroinflammation is also a key component of AD and a recent GWAS identified the tumor necrosis factor α (TNFα) signaling pathway as a central genetic etiology of AD and related dementias [15]. However, few studies have investigated the links between TNFα and LXR/ABCA1 axis [16,17].
Besides astrocytes, CNS pericytes might also play an important role in brain cholesterol metabolism and AD. However, there is a persisting gap in the knowledge of the role of brain pericytes in inflammatory conditions. These cells are embedded in the basal lamina of the brain capillaries forming the BBB and play a key role in BBB permeability and physiology [18,19,20]. During the last 15 years, advances in high resolution imaging techniques, transcriptomic methods, new cell isolation and cultivation protocols have allowed an exponentially increasing number of studies focusing on brain pericytes [21], thus highlighting new functions for them in CNS homeostasis and BBB functioning. Loss or functional defect of pericytes has been reported in AD [22]. Despite the fact that CNS inflammation is primarily driven by microglia, astrocytes and infiltrating leukocytes, important roles of brain pericytes in immune responses have also been suggested [21]. When activated by TNFα or other inflammatory stimuli, brain pericytes facilitate the trafficking of immune cells to inflammatory sites [23] and show altered phagocytic activities [24,25]. Bovine brain pericytes express ABCA1, but not ABCG1, and generate HDL when stimulated with LXR agonists [26]. Cholesterol efflux is a key event in immune response, as intensively studied in leukocytes and macrophages [2], but this process remains poorly studied in human brain pericytes.
Based on all of these observations, and on our previous works obtained in bovine pericytes [26,27], we therefore hypothesized that the LXR/ABCA1 axis also controls the cholesterol efflux in human brain pericytes (HBP) and that this process might be affected by inflammation. Using a cell line recapitulating the HBP phenotype [28,29,30], the objective of our study was to characterize the effects of TNFα signaling on cholesterol transport/metabolism in particular focusing on the LXR/ABCA1 axis.

2. Results

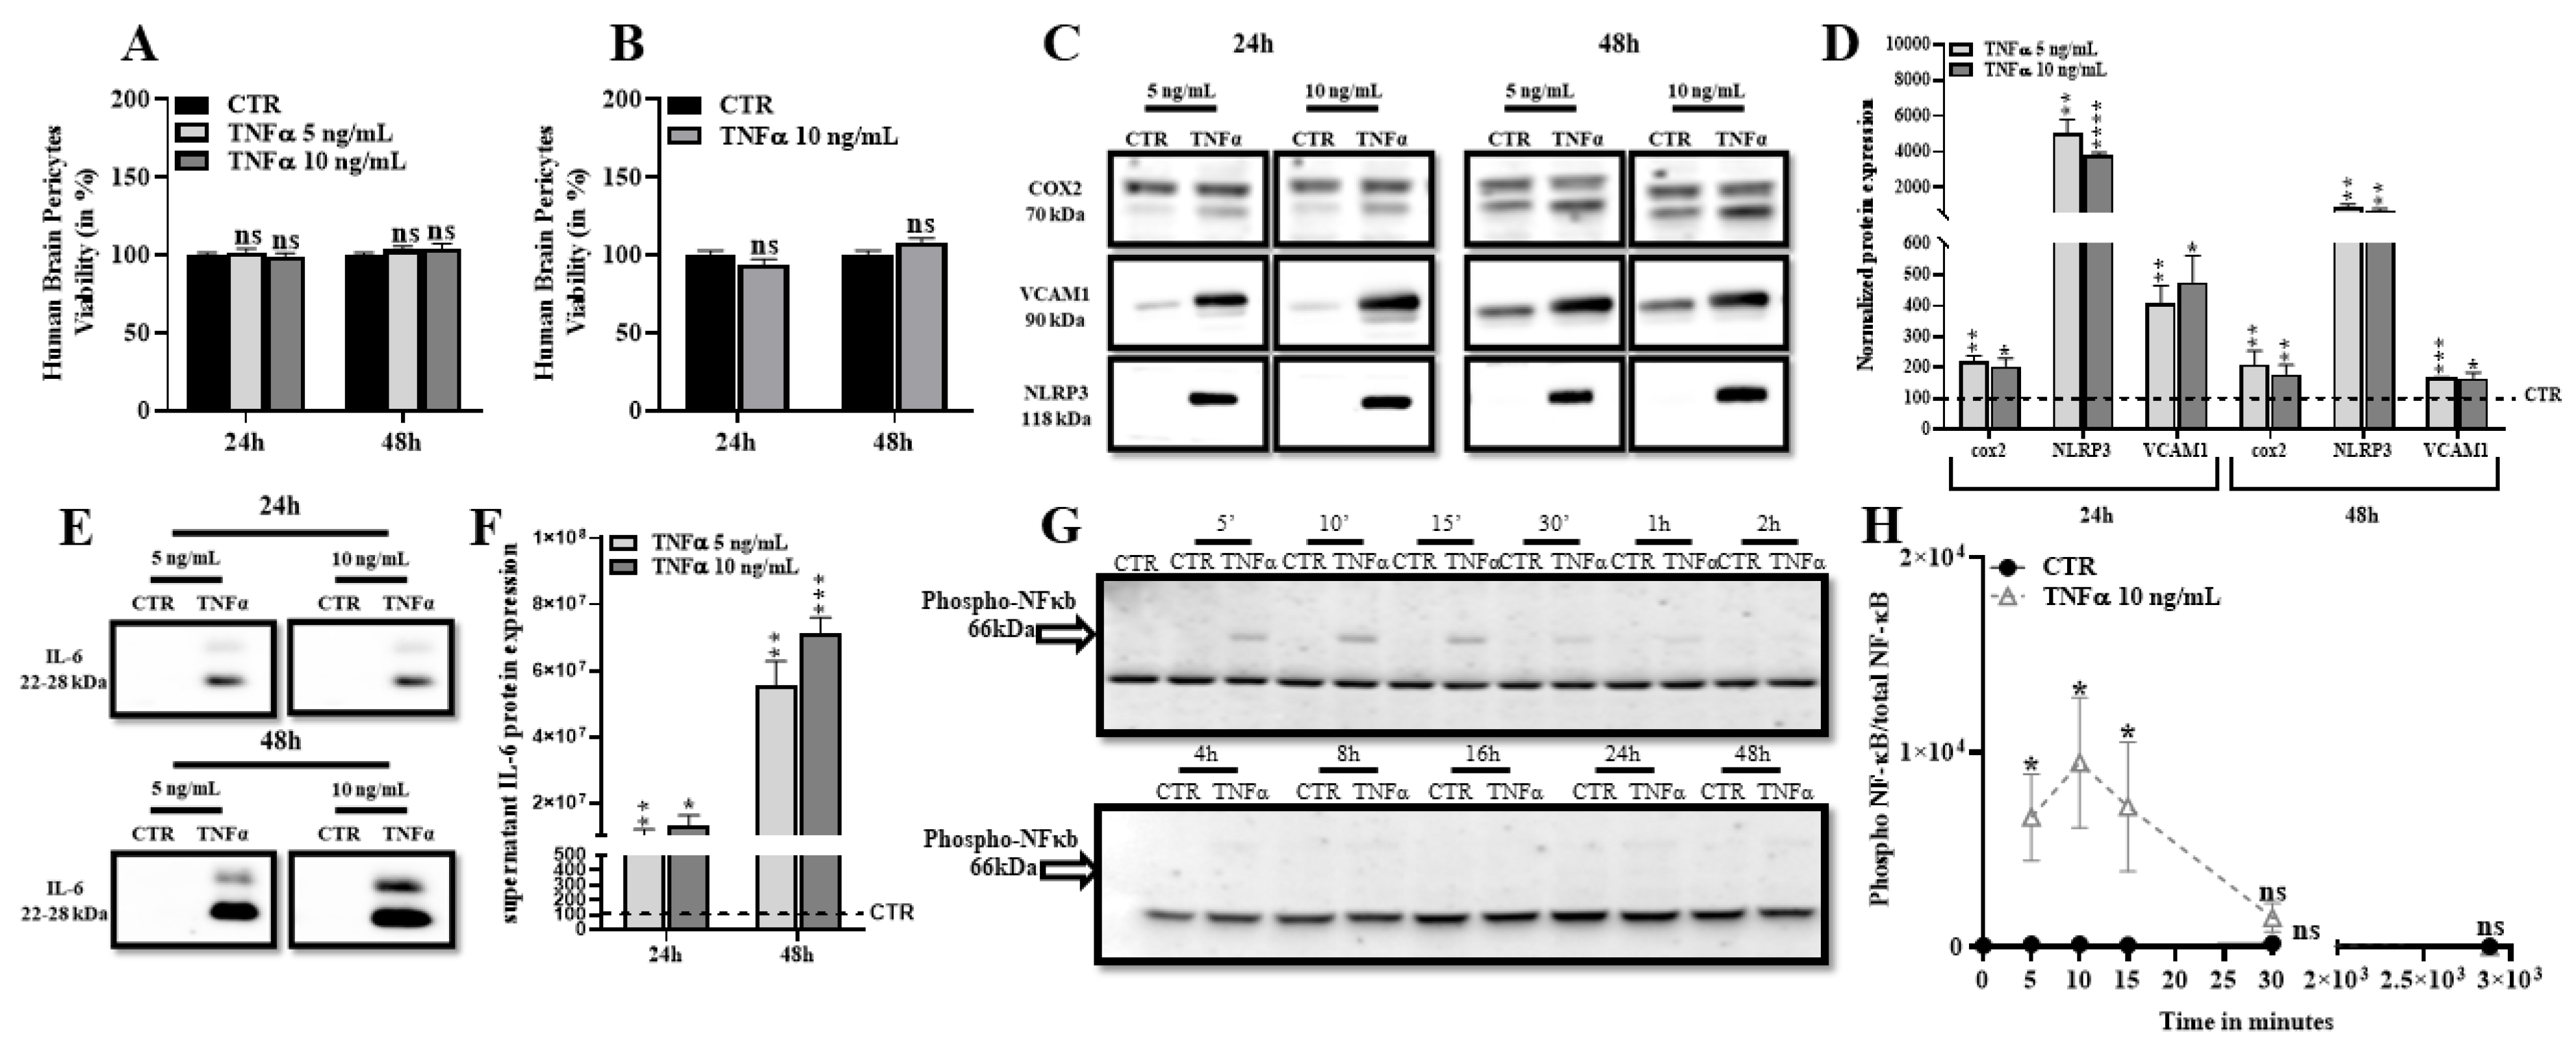
2.1. TNFα Promotes Expression of Inflammatory Markers and Does Not Affect Human Brain Pericytes Survival

We first assessed the effects of TNFα on HBP survival using two distinct methods. As shown in Figure 1A,B, exposure to TNFα at 5 ng/mL and 10 ng/mL for 24 h and 48 h did not affect HBP viability, indicating that this inflammatory molecule did not induce cell death at these concentrations in our culture conditions. The levels of inflammatory markers were then quantified by Western blot. Figure 1C,D show that expression of vascular cell adhesion molecule-1 (VCAM-1), cyclooxygenase 2 (COX-2) and the inflammasome molecule NOD-like receptor family, pyrin domains-containing 3 (NLRP3), were significantly upregulated after 24 h and 48 h of treatment with 5 ng/mL or 10 ng/mL of TNFα. Moreover, secretion of the pro-inflammatory interleukin 6 (IL-6) was also increased in an HBP supernatant treated with different concentrations of TNFα (Figure 1E,F). We then investigated the activation of the TNFα signaling pathway by Western blot, measuring the phosphorylation states of the nuclear factor κappa B protein (NF-κB). Figure 1G,H show a fast but brief increase in the detection of the phosphorylated NF-κB during the first 30 min after TNFα treatment. Overall, these results demonstrate that TNFα treatment triggers the NF-κB signaling pathway in HBP and induces a fast inflammatory response without altering cell viability, even during long incubation periods (24 h and 48 h).

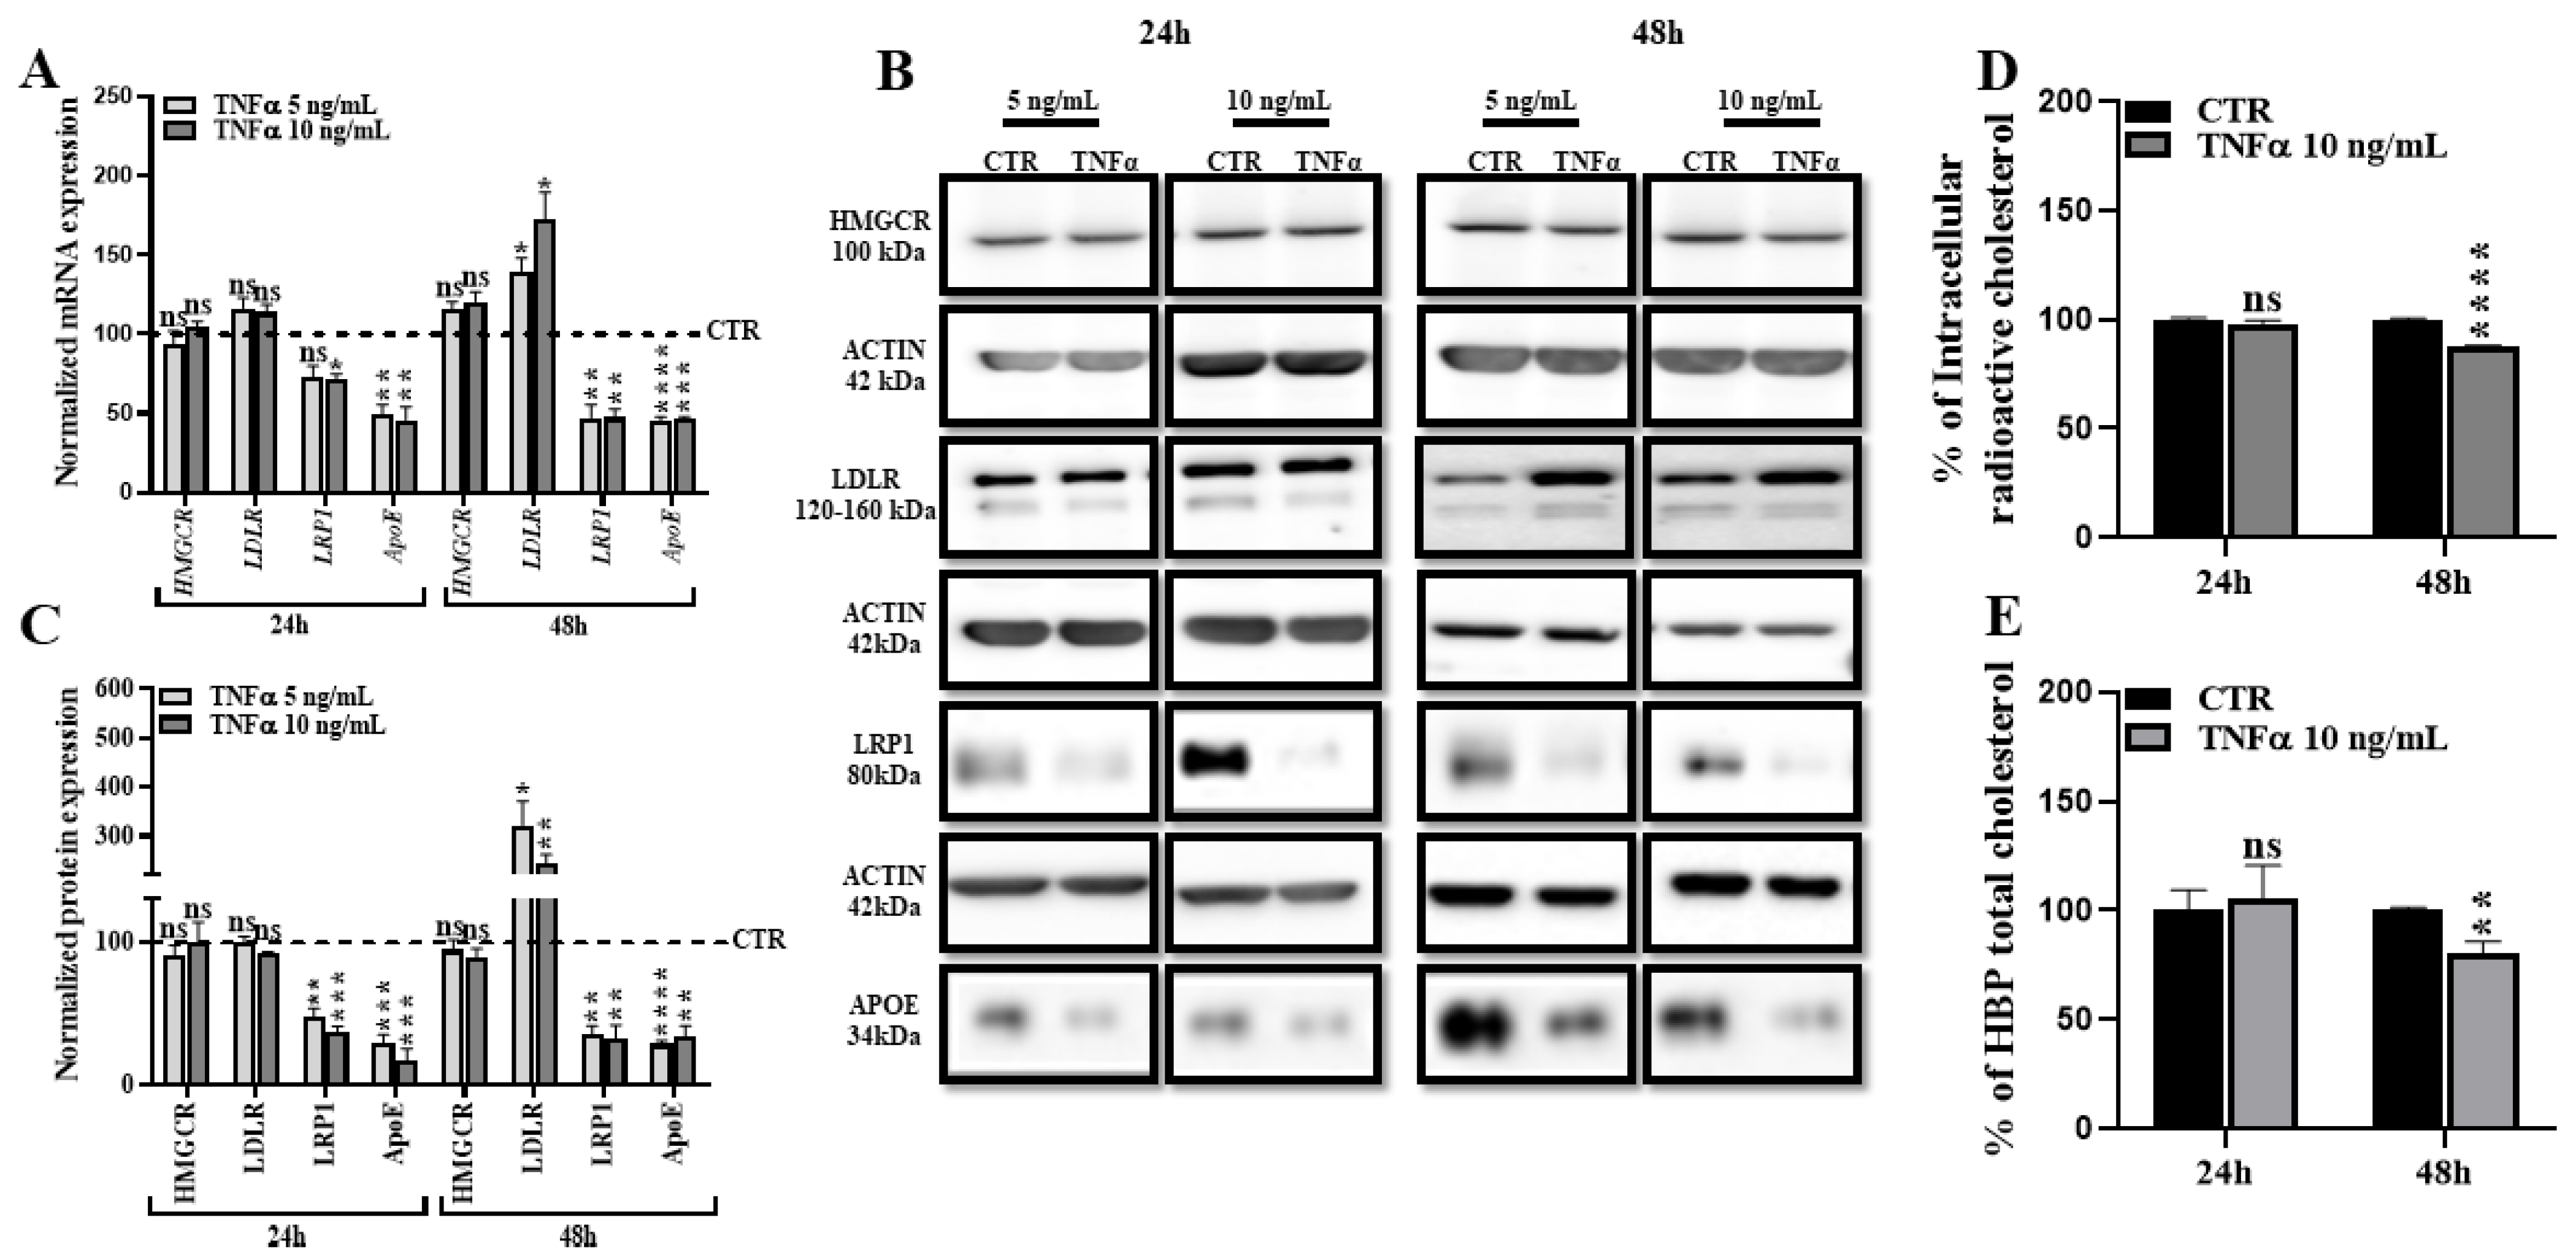
2.2. TNFα Alters HBP Cholesterol Metabolism

The effect of inflammatory stimuli such as TNFα on cholesterol metabolism has been previously investigated in human macrophages and monocytes [31,32] but has never been studied in HBP. Therefore, we investigated the expression levels of several key players of the cholesterol metabolism in HBP treated with 5 and 10 ng/mL of TNFα for 24 and 48 h. We first assessed the expression levels of receptors involved in lipoproteins uptake: LDLR and LRP1. mRNA and protein levels of LRP1 were downregulated after 24 h and 48 h of TNFα treatment (Figure 2A–C). LDLR expression remained unchanged at 24 h but was significantly increased at 48 h (Figure 2A–C). 3-hydroxy-3-methylglutaryl-CoA reductase (HMGCR) is the rate-limiting enzyme in mammalian cells responsible for the cholesterol synthesis. No changes have been reported on mRNA and protein levels with the TNFα treatment (Figure 2A–C). In addition, we assessed the mRNA level of MYLIP, which is responsible for LDLR degradation and implicated in the control of intracellular cholesterol levels. TNFα treatments do not modulate its expression (Supplementary Material Figure S1). Interestingly, we observed that TNFα treatment decreased the expression levels and the secretion of the cholesterol acceptor APOE, which is the major lipid acceptor in CNS and is the strongest genetic risk factor involved in AD [33,34] (Figure 2A–C). We then quantified the intracellular pool of cholesterol using two different methods and observed a decrease after 48 h of TNFα treatment, but not at 24 h (Figure 2D,E). These data suggest that TNFα affects the cholesterol metabolism in HBP at 48 h, without modifying the cholesterol synthesis, but rather by modulating the cholesterol efflux as demonstrated by the downregulation of the APOE secretion.

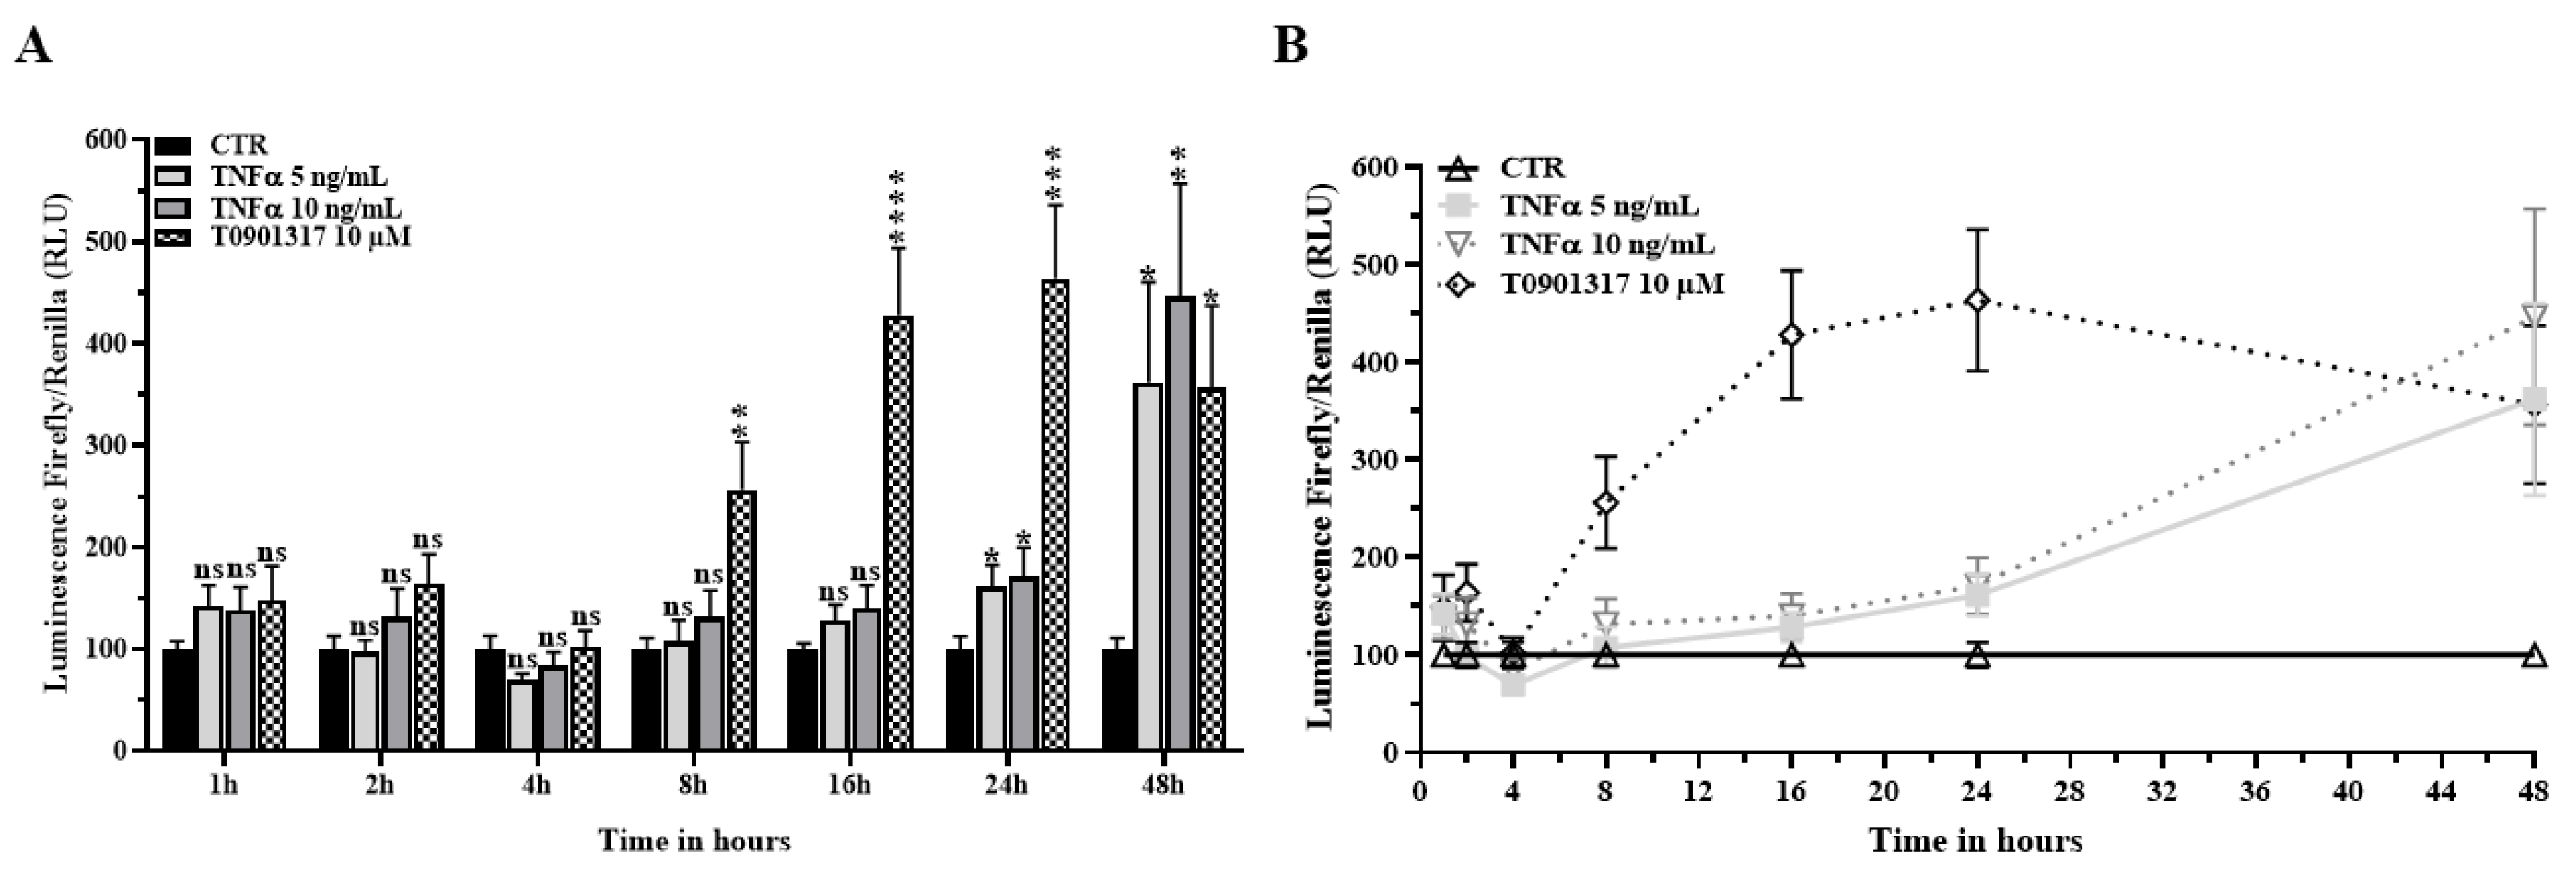
2.3. TNFα Activates the LXR Signaling Pathway

In order to gain insights into the molecular mechanisms modifying the intracellular storage and renewal of cholesterol, we studied the effects of TNFα on the liver X Receptor (LXR) signaling pathway that senses the intracellular cholesterol concentration and controls the transcription of the key player in cholesterol efflux, namely the ATP-binding cassette sub-family A member 1 (ABCA1) transporter. HBP expresses both LXR isoforms with LXRα, and is itself expressed almost three-fold more than LXRβ (Supplementary Material Figure S2). TNFα receptor 1 (TNFRSF1A) is highly expressed whereas expression of TNFα receptor 2 (TNFRSF1B) is very low (Supplementary Material Figure S2A). HBP were transfected with an LXR reporter vector and were then treated with TNFα as previously done. No changes in the Firefly/Renilla luminescence were observed during the first 16 h of TNFα treatment (Figure 3A,B). However, a 1.5-fold increase was reported at 24 h, and a four to five-fold increase was observed at 48 h when compared with the untreated conditions. These results suggest a slight activation of the LXR pathway after 24 h of TNFα treatment, which was then strengthened after 48 h of treatment. No change in mRNA expression of both LXR isoforms was observed after TNFα treatment (Supplementary Material Figure S2B). LXR pathway activation was faster (at 8 h) and higher in transfected HBP treated with T0901317 (10 µM), an LXR synthetic agonist (Saint-Pol et al., 2012, 2013), used as a positive control in our experiments. These data strongly reinforce our hypothesis that the HBP cholesterol metabolism is altered in inflammatory situations. Interestingly, they also indicate that TNFα triggered the LXR signaling pathway later, after 24 and 48 h of treatment, when compared with a direct LXR activation by agonist.

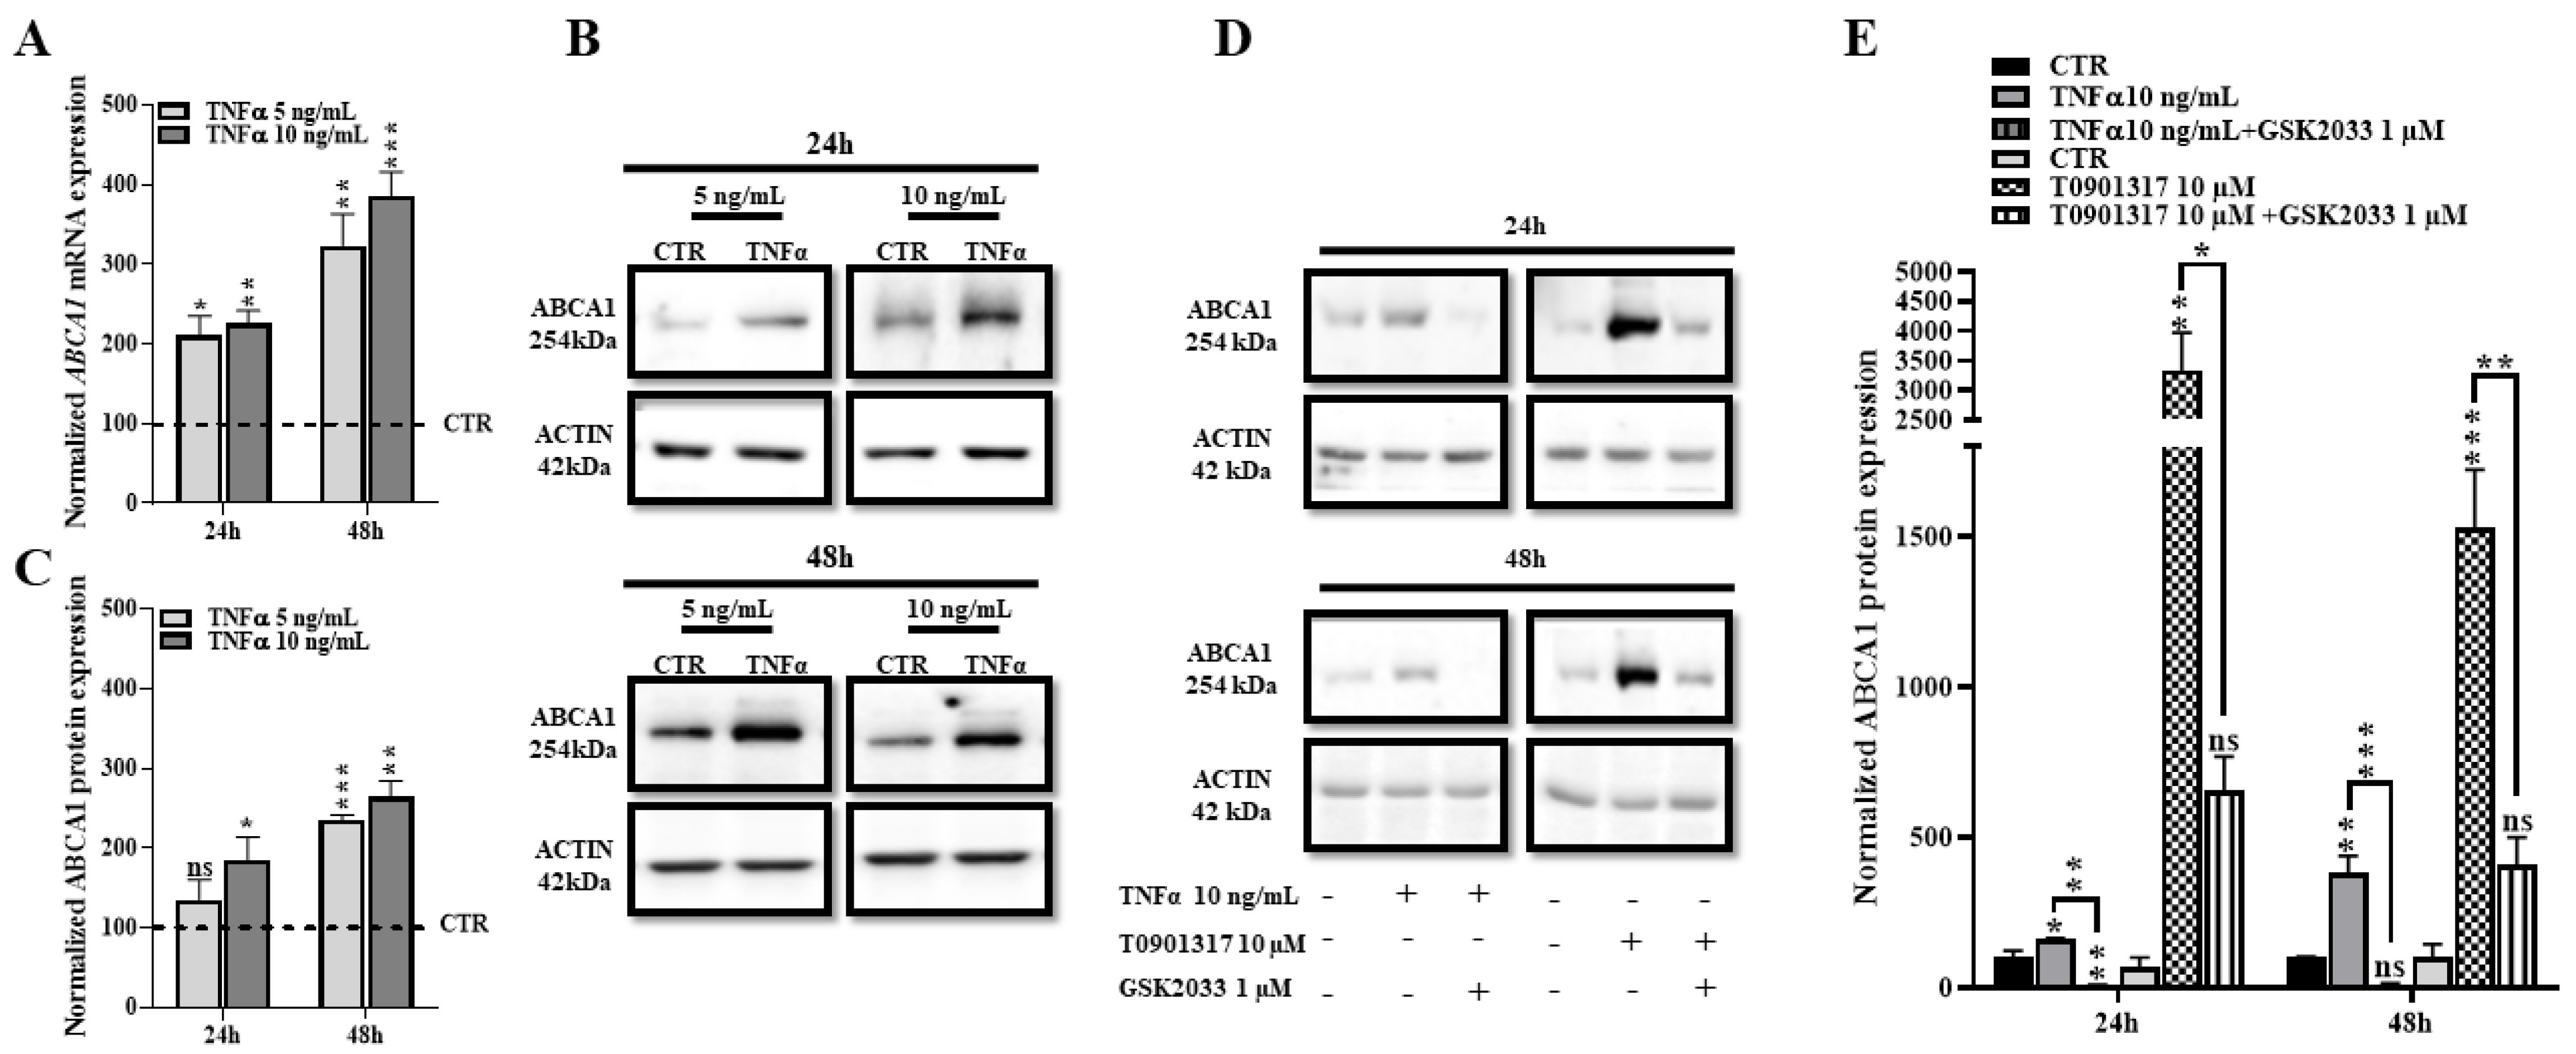
2.4. TNFα Increases Expression of ABCA1 at the Transcriptional and Protein Levels

As mentioned above, ABCA1 is the key transporter promoting cholesterol efflux from cell membranes [6]. Because its expression is tightly controlled by the LXR signaling pathway, we next investigated ABCA1 expression in HBP after TNFα treatment. RT-qPCR analysis of ABCA1 showed that TNFα treatment (5 and 10 ng/mL) upregulated mRNA expression by two-fold at 24 h, and by three–four-fold at 48 h (Figure 4A). In line with the mRNA analysis, our Western blot results also show the highest upregulation of ABCA1 protein levels occurring after 48 h of TNFα treatment (Figure 4B,C).
To confirm that ABCA1 upregulation is directly mediated by the LXR signaling pathway, we then used the LXR blocker, GSK2033 [35]. This inhibitor totally abolishes the ABCA1-upregulation mediated by TNFα and T0901317 (Figure 4D,E), thus confirming that inflammation increased ABCA1 expression via the LXR pathway. The direct comparison of ABCA1 expressions after TNFα and T0901317 treatments shown in Figure 4 also demonstrates that T0901317 is largely more efficient than TNFα at increasing ABCA1 expression. Indeed, whereas TNFα increased ABCA1 expression by 1.5-fold at 24 h, T0901317 increased ABCA1 expression by 34-fold. At 48 h, the TNFα-mediated increase was 400% whereas the T0901317-induction of ABCA1 was 1500% (Figure 4E). Therefore, LXR activation by TNFα in HBP is slower and less efficient than direct LXR activation by LXR agonist such as T0901317.

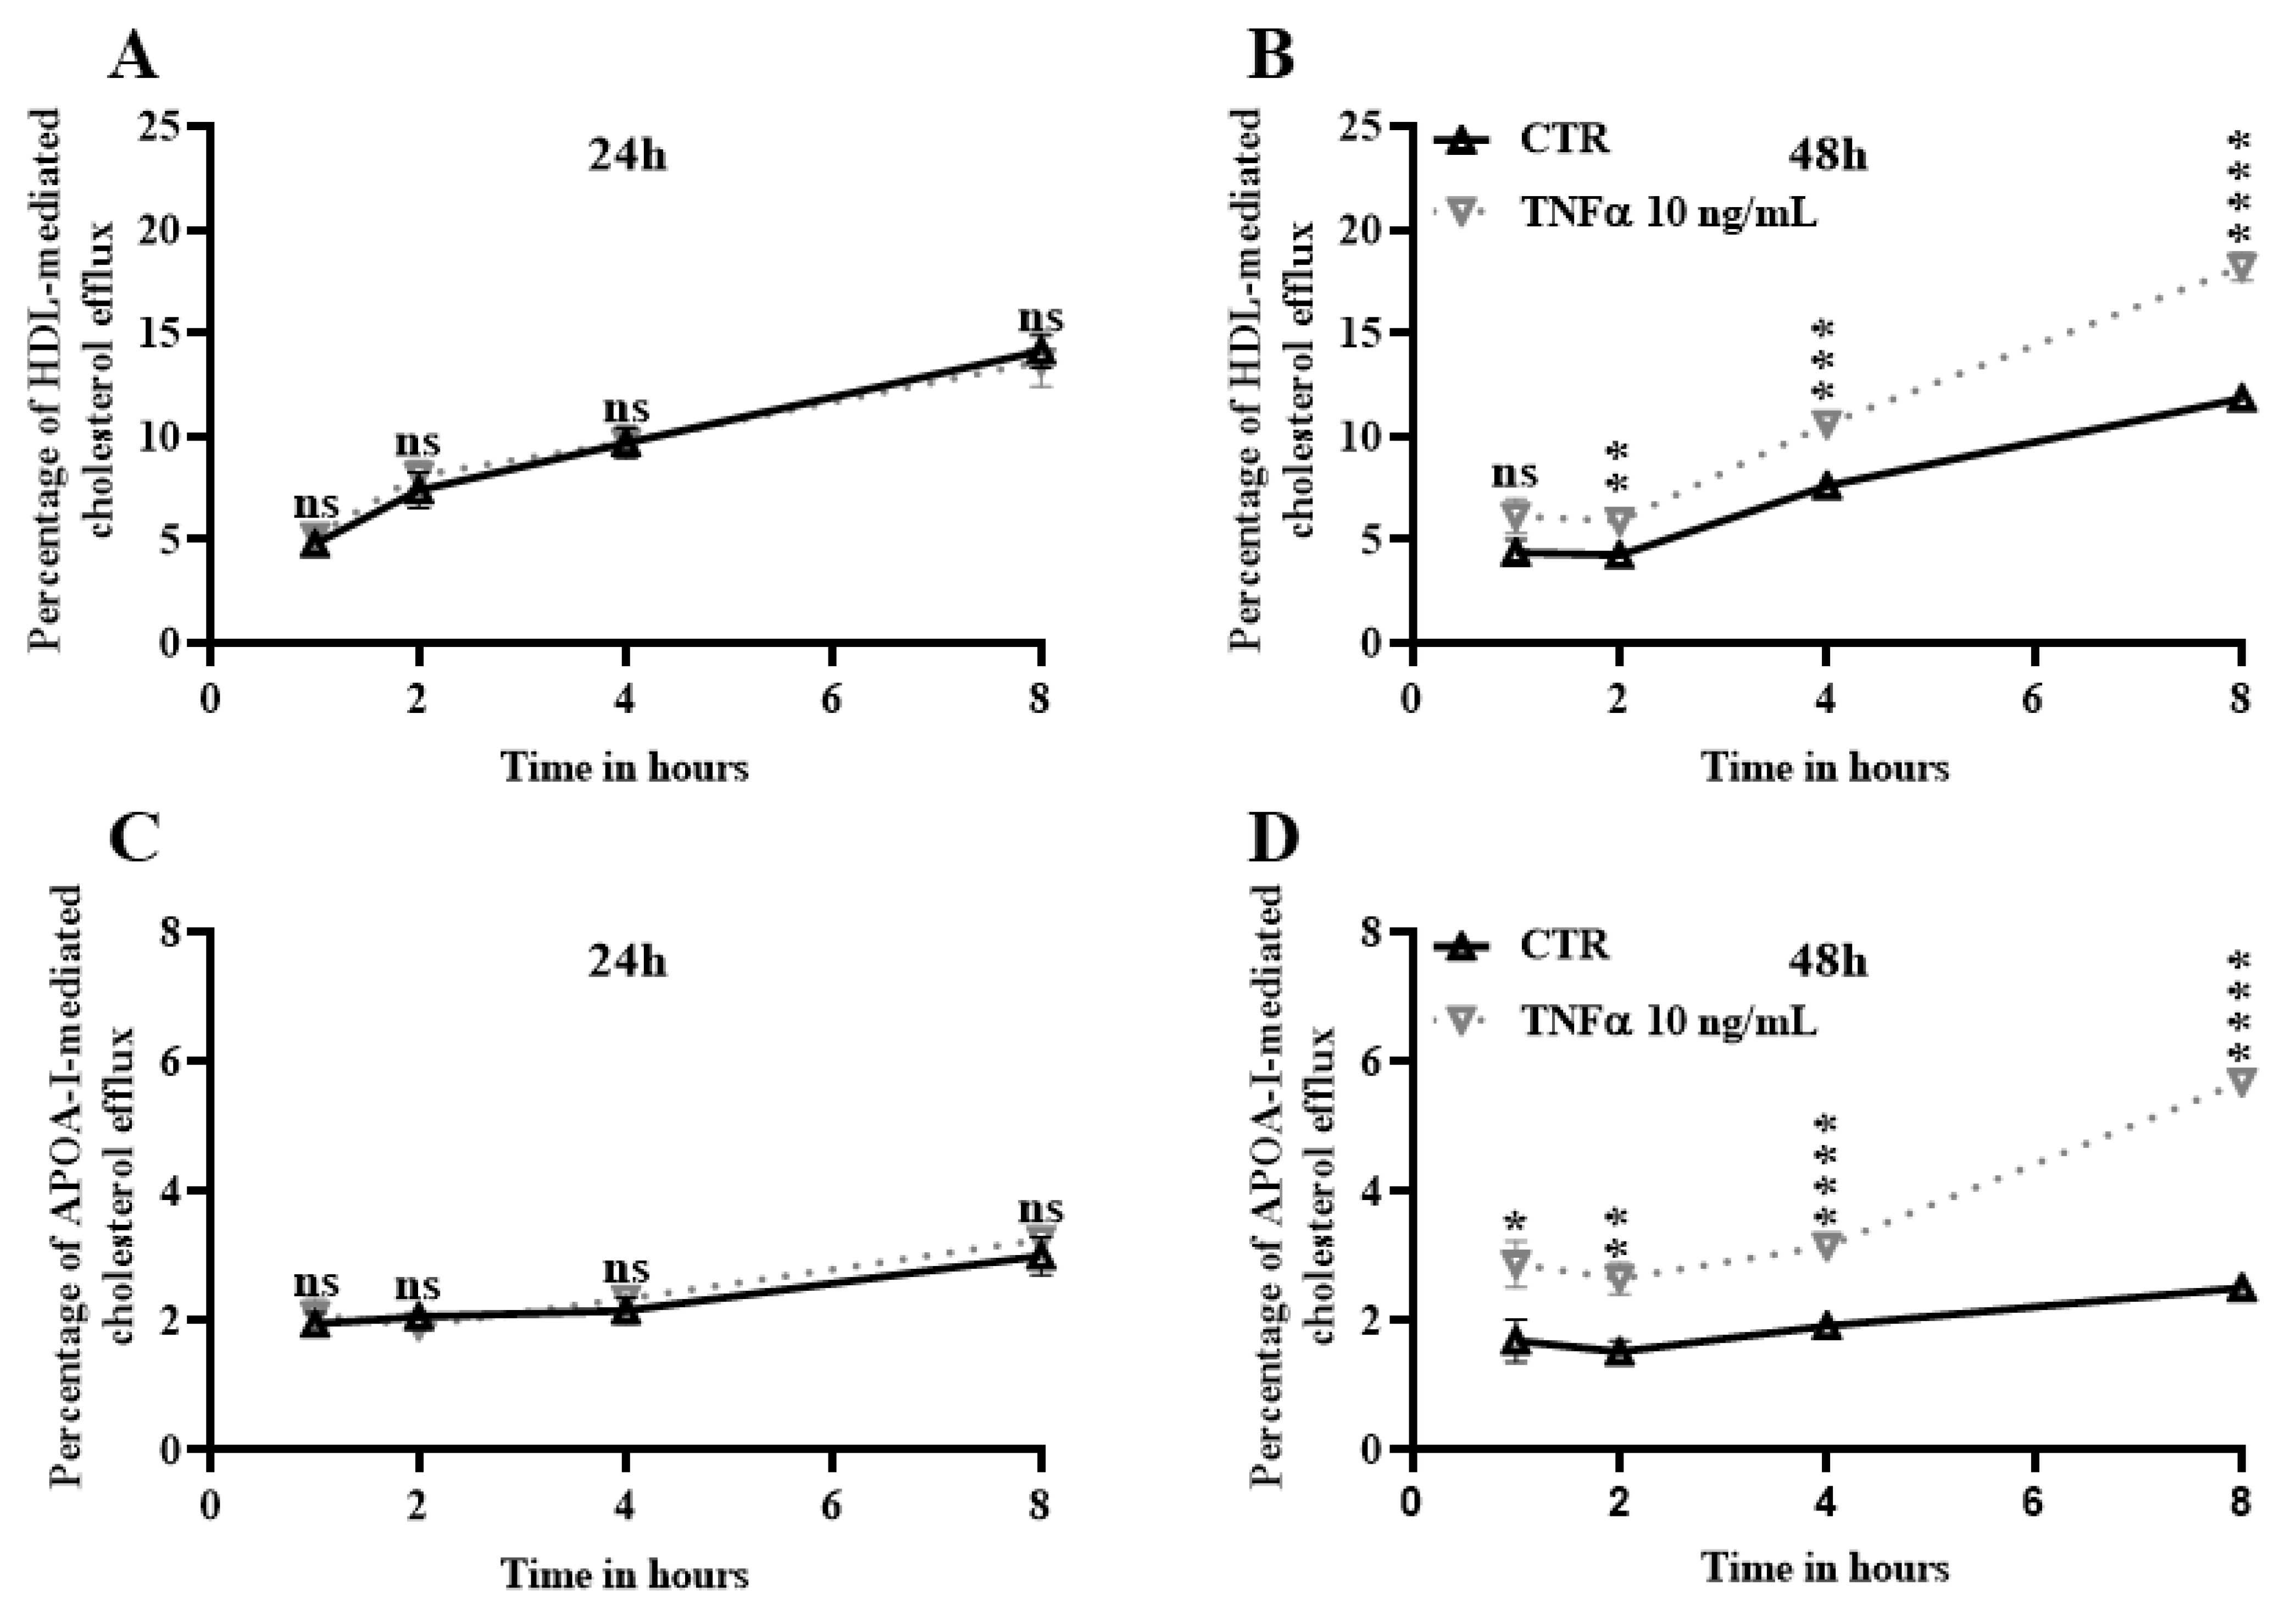
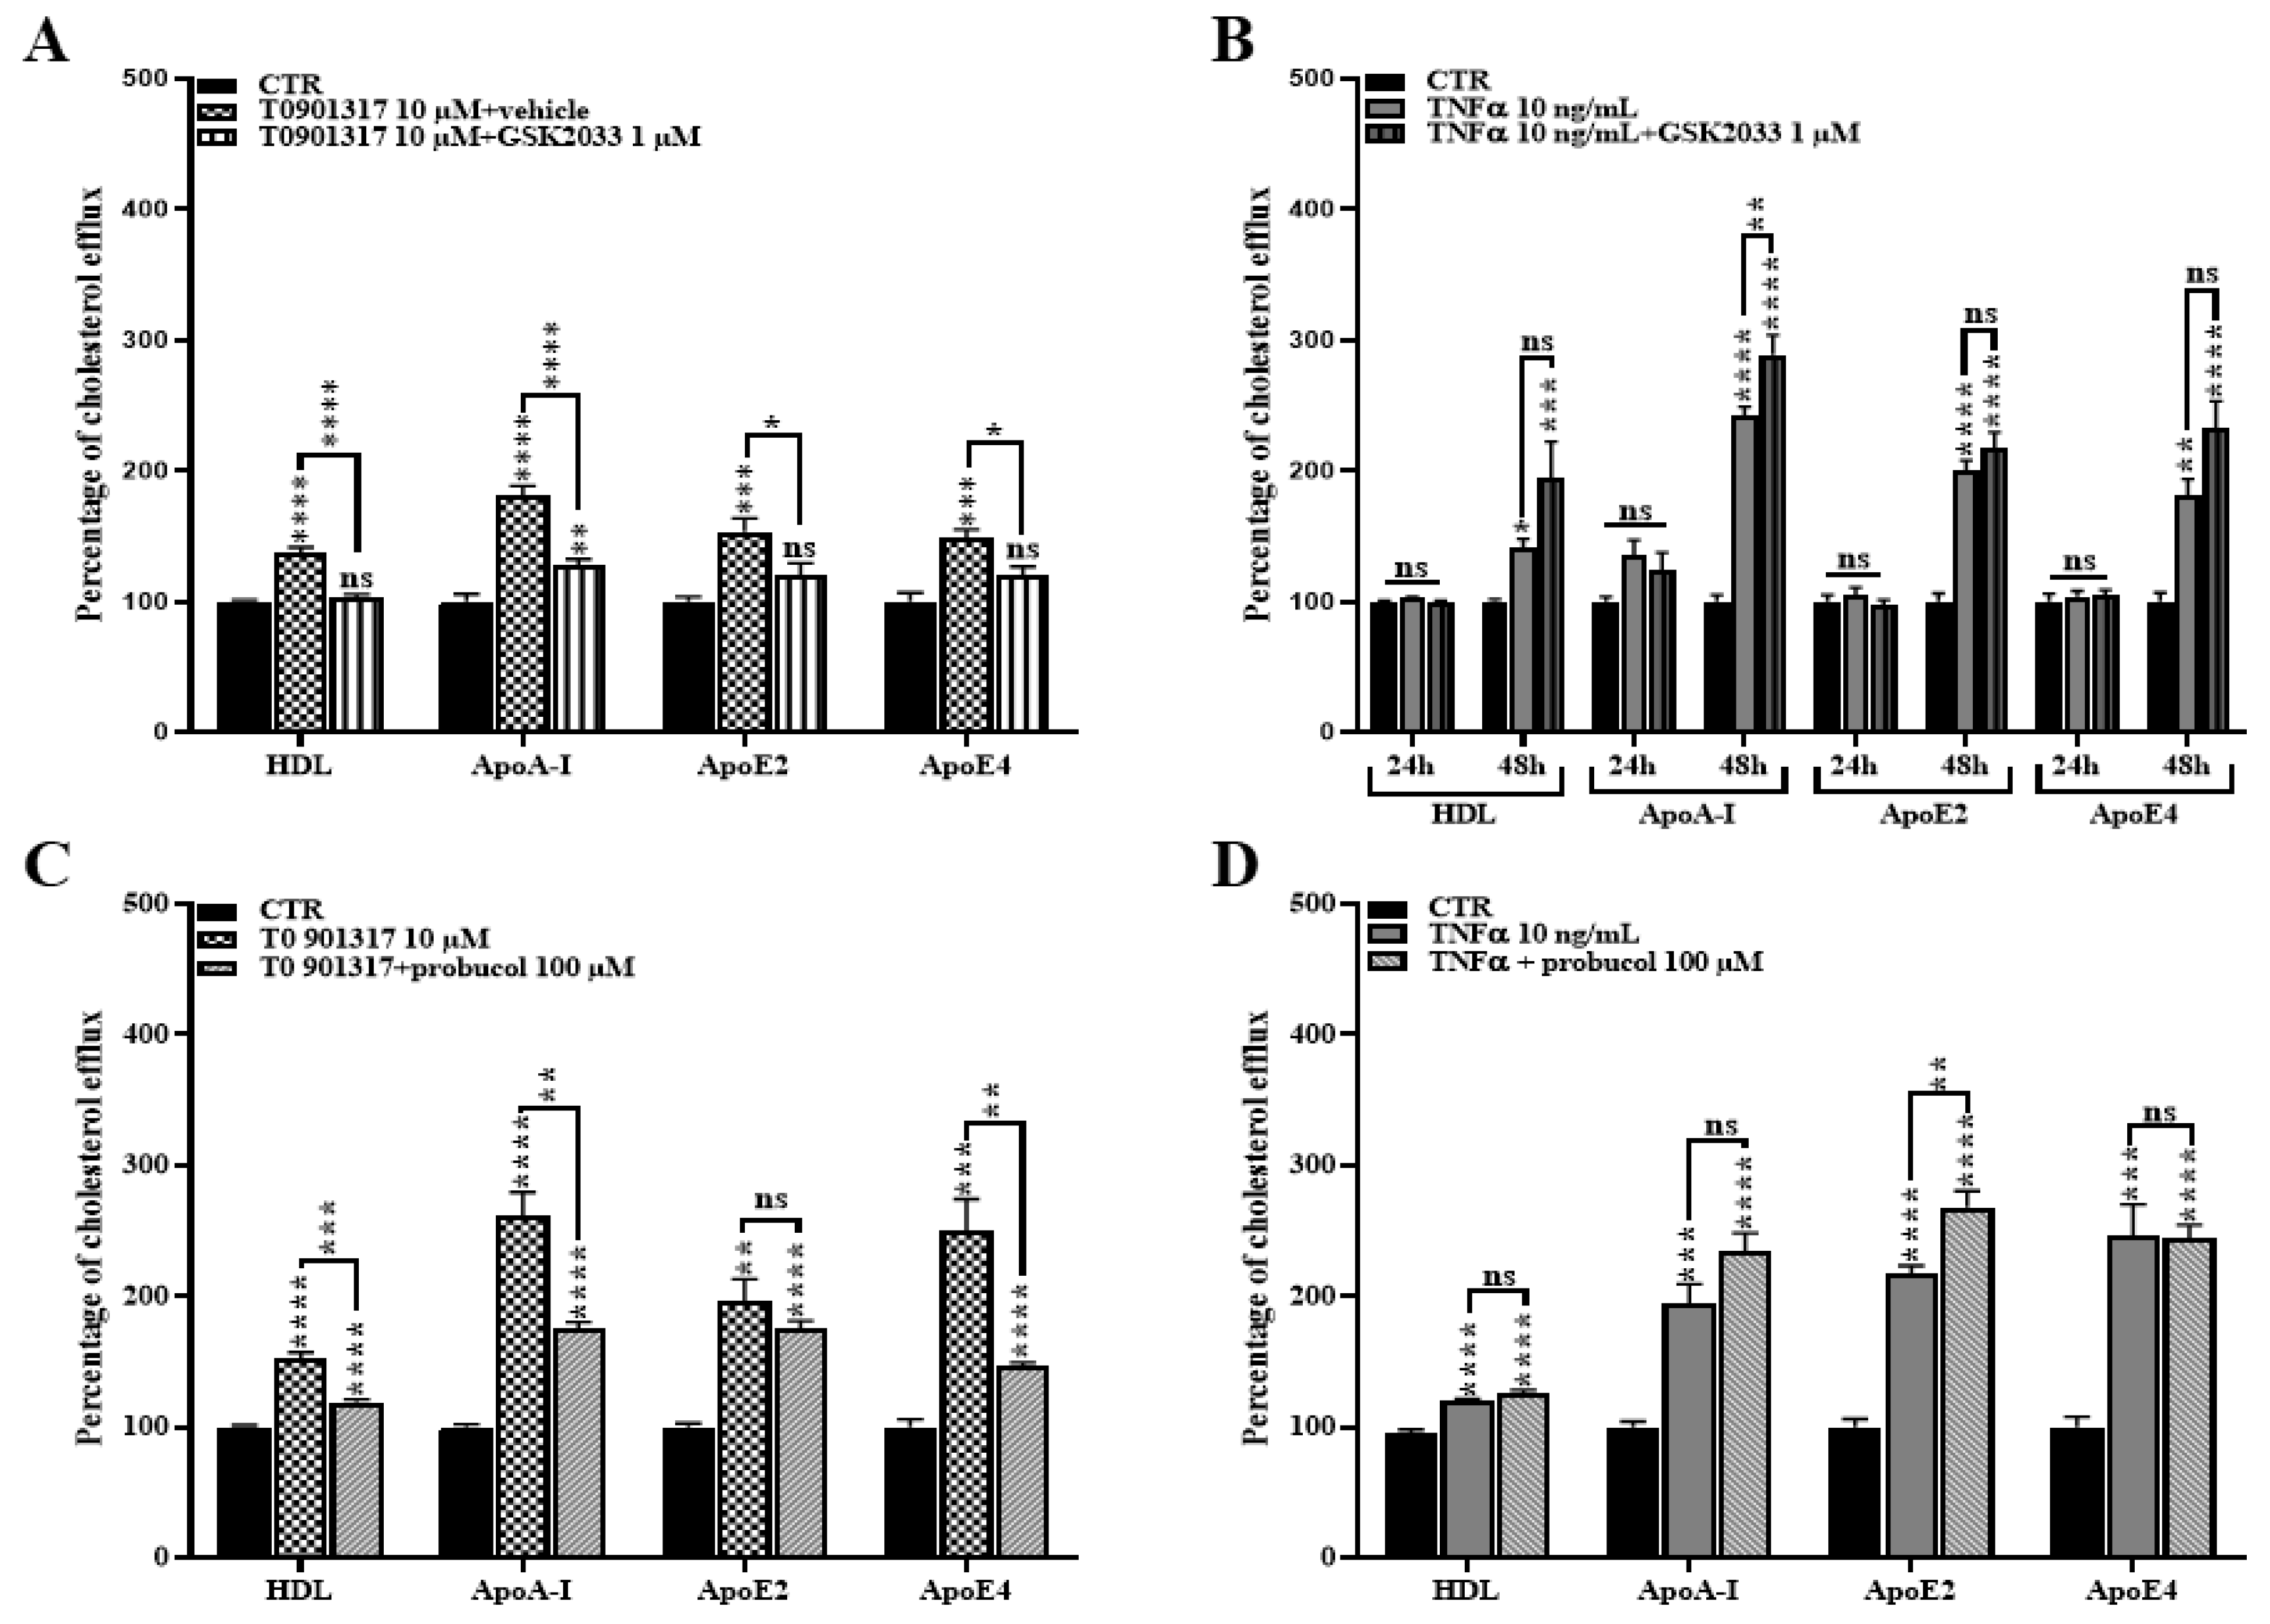
2.5. TNFα Increases Cholesterol Efflux

Because ABCA1 is known to induce lipid efflux in many cell types in the presence of lipid acceptors such APOA-I and high-density lipoproteins (HDL) [7,26], we checked in our next experiments if TNFα finally promotes lipid efflux through ABCA1. Herein, we investigated the TNFα effect on cholesterol efflux in HBP (Figure 5). We first observed that HBP are more prone to release cholesterol to the lipid acceptors HDL than to APOA-I (for example, after one hour of cholesterol efflux 1.95% ± 0.16 versus 4.81% ± 0.30, respectively, Figure 5A,C) as previously reported in bovine brain pericytes [26]. The cholesterol efflux assay showed no difference between HBP treated and untreated with TNFα for 24 h in the presence of HDL and APOA-I (Figure 5A and Figure 5C, respectively). However, HBP released high amounts of cholesterol to both lipid acceptors after 48 h of treatment when compared with the untreated condition (Figure 5B,D). The efflux was even greater to HDL comparing with the efflux to APOA-I, (after 8 h of efflux, 18.17% ± 0.69 versus 5.69% ± 0.16, respectively). These findings correlate with the ABCA1 upregulation reported earlier in Figure 4, suggesting that TNFα may increase cholesterol efflux through ABCA1 upregulation at 48 h, but not at 24 h.

2.6. ABCA1 Inhibition Does Not Rescue the TNFα Induced Cholesterol Efflux

In order to establish a causal link between ABCA1 upregulation and the increased cholesterol efflux observed after TNFα treatment in Figure 5, we next performed cholesterol efflux assays in the presence of GSK2033, an inhibitor of the LXR signaling pathway. Because it has been demonstrated that LXR activation by T0901317 also promoted cholesterol efflux to the lipid acceptors—APOE2 and APOE4—that are strongly involved in AD, we included them in the experimental set-up [26,36].
We earlier demonstrated that GSK2033 suppressed ABCA1 expression in T0901317-treated HBP (Figure 4). In line with this result, GSK2033 suppressed the T0901317-induced cholesterol efflux (Figure 6A) confirming that the lipid release is induced through the LXR/ABCA1 axis. However, GSK2033 was not able to reduce the TNFα-induced cholesterol efflux (Figure 6B), while ABCA1 expression is decreased (Figure 4). These data suggest that TNFα and T0901317 do not share the same cholesterol efflux mechanism, and that TNFα induces an LXR/ABCA1-independent cholesterol release.
To confirm that ABCA1 is not involved in the cholesterol release from HBP in inflammatory conditions, we then directly blocked ABCA1 activity using Probucol, an ABCA1 inhibitor [26,37]. Again, we observed that the inhibition of ABCA1 decreased the cholesterol efflux after T0901317 stimulation (Figure 6C), but not when mediated by TNFα (Figure 6D). Altogether, these data reinforce the results observed in Figure 6A,B and strongly suggest that, despite the activation of the LXR/ABCA1 axis observed in the presence of TNFα, the cholesterol efflux to acceptors (HDL, APOA-I, APOE2, APOE4) is controlled by another or other transporter(s).

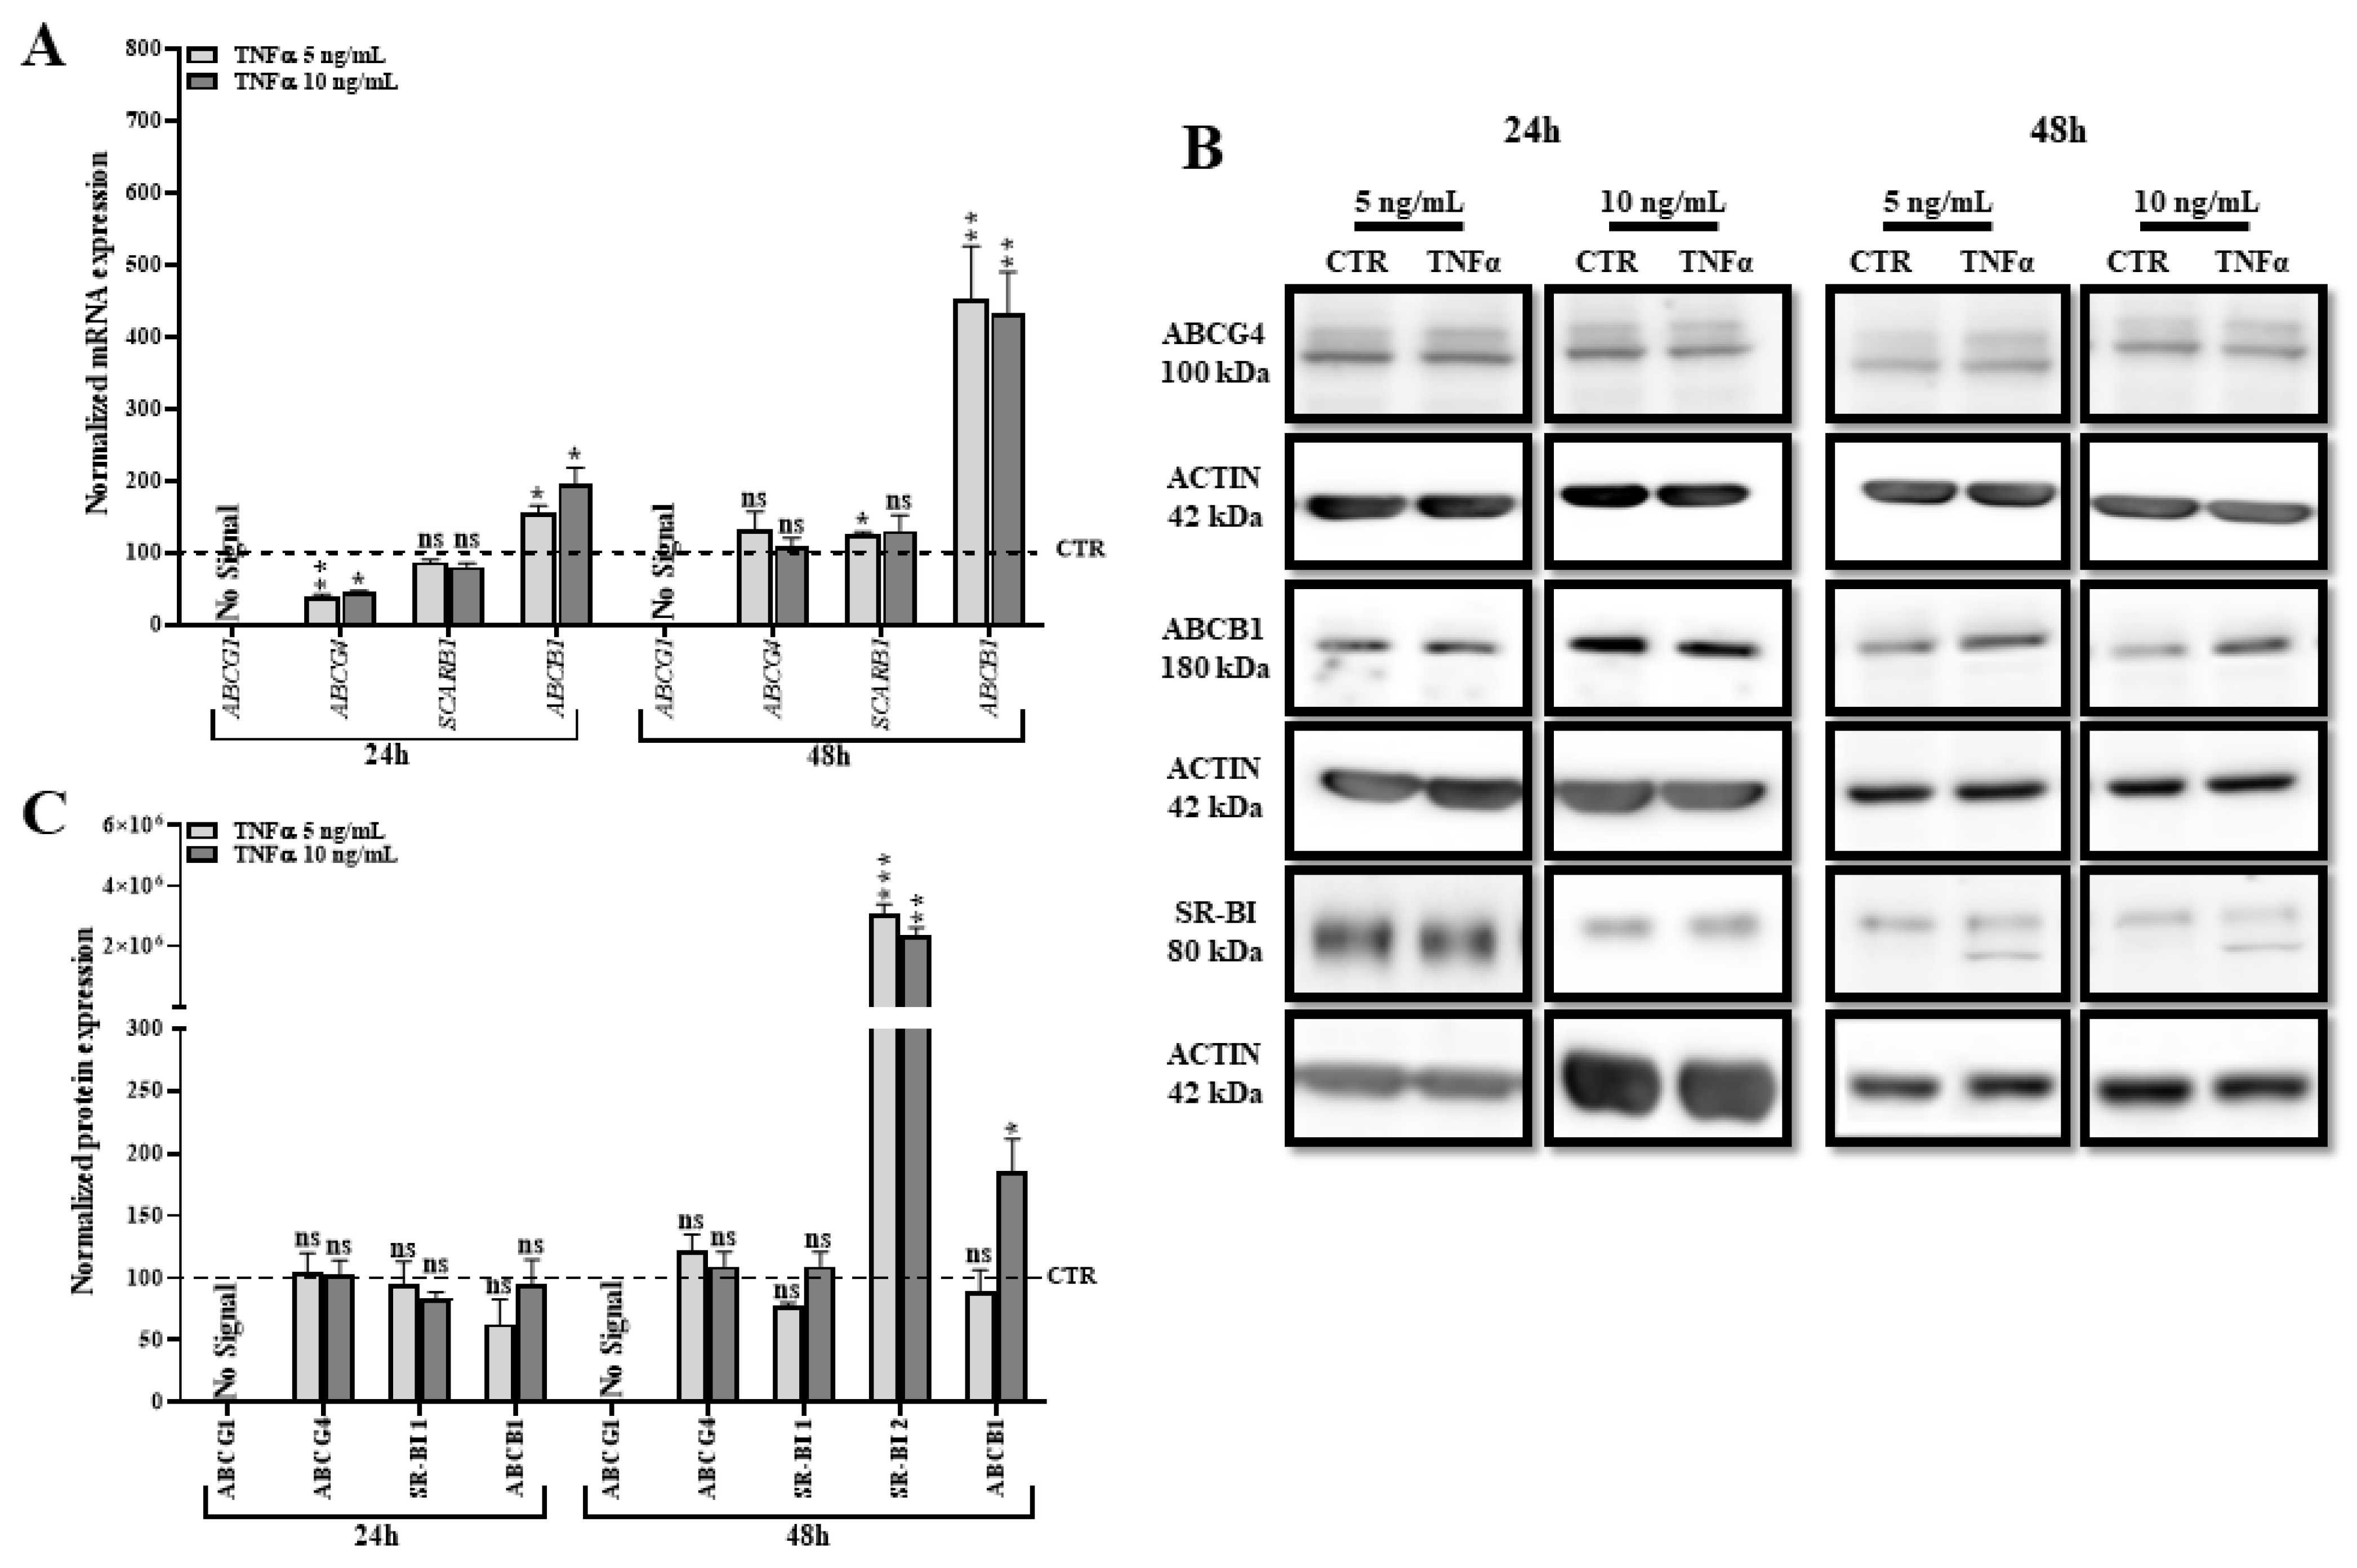
2.7. TNFα Modifies the Expression of Other Transporters Involved in Lipid Efflux

We demonstrated that TNFα induces an ABCA1-independent cholesterol efflux in HBP. To identify which transporter is responsible for this efflux, we investigated the gene and protein expression of other transporters that might be involved in lipid efflux, such as the ABC transporters ABCG1, ABCG4, ABCB1 (P-gp) and scavenger receptor class B member 1 (SR-BI). As with ABCA1, ABCG1 is known to be regulated by the LXR pathway and promotes cholesterol release to HDL [38]. However, its expression has not previously been observed in bovine brain pericytes and human fibroblasts [27,39,40]. SR-BI has previously been shown to be expressed by brain pericytes [27] but its function has never been studied. The SR-BI protein is encoded by the SCARB1 gene that is not controlled by the LXR signaling pathway. SR-BI is considered to be a receptor for HDL and thus promotes bidirectional cholesterol exchanges between lipoproteins and the membranes of cells [41]. ABCG4 is highly expressed in the brain, shows high amino acid similarity with ABCG1 and is involved in cholesterol efflux to HDL in neurons and other cell types [42]. ABCB1 is a well-known efflux pump expressed by several cell types of the body, usually present at the physiological barriers (testis, BBB, intestinal barrier, etc.), and able to release xenobiotics from the plasma membrane into the bloodstream. ABCB1 was initially described as a lipid flippase, able to transport hydrophobic lipids from the inner to the outer leaflet of the membrane [43,44]. It has also been suggested that lipid composition of the membrane could affect its functionality, thus proposing an interesting mechanism to modulate its protecting activity.
Despite our effort by testing several primers pairs and antibodies, our RT-qPCR and Western blot tests suggest that ABCG1 is not expressed in HBP and is thus in line with previous data obtained in bovine pericytes [26]. T0901317 and TNFα did not induce its expression (Supplementary Material Figure S3 and Figure 7A and Figure 7C, respectively). No significant variation of ABCG4 expression was observed after 24 and 48 h of TNFα treatment (Figure 7A,B). Interestingly, mRNA and protein expressions of ABCB1 were upregulated after 48 h of treatment. While our RT-qPCR analysis for SCARB1 did not show any variation at the gene expression level (Figure 7A), our Western blot analysis identified an additional signal for SR-BI that appeared only 48 h after TNFα treatment (Figure 7B,C). However, the molecular weight of this band is lower than the expected molecular weight reported for SR-BI. To discard any doubts about SCARB1 implication, we considered SCARB1, as well as ABCB1, to be our potential suspects responsible for the observed TNFα-induced cholesterol efflux.

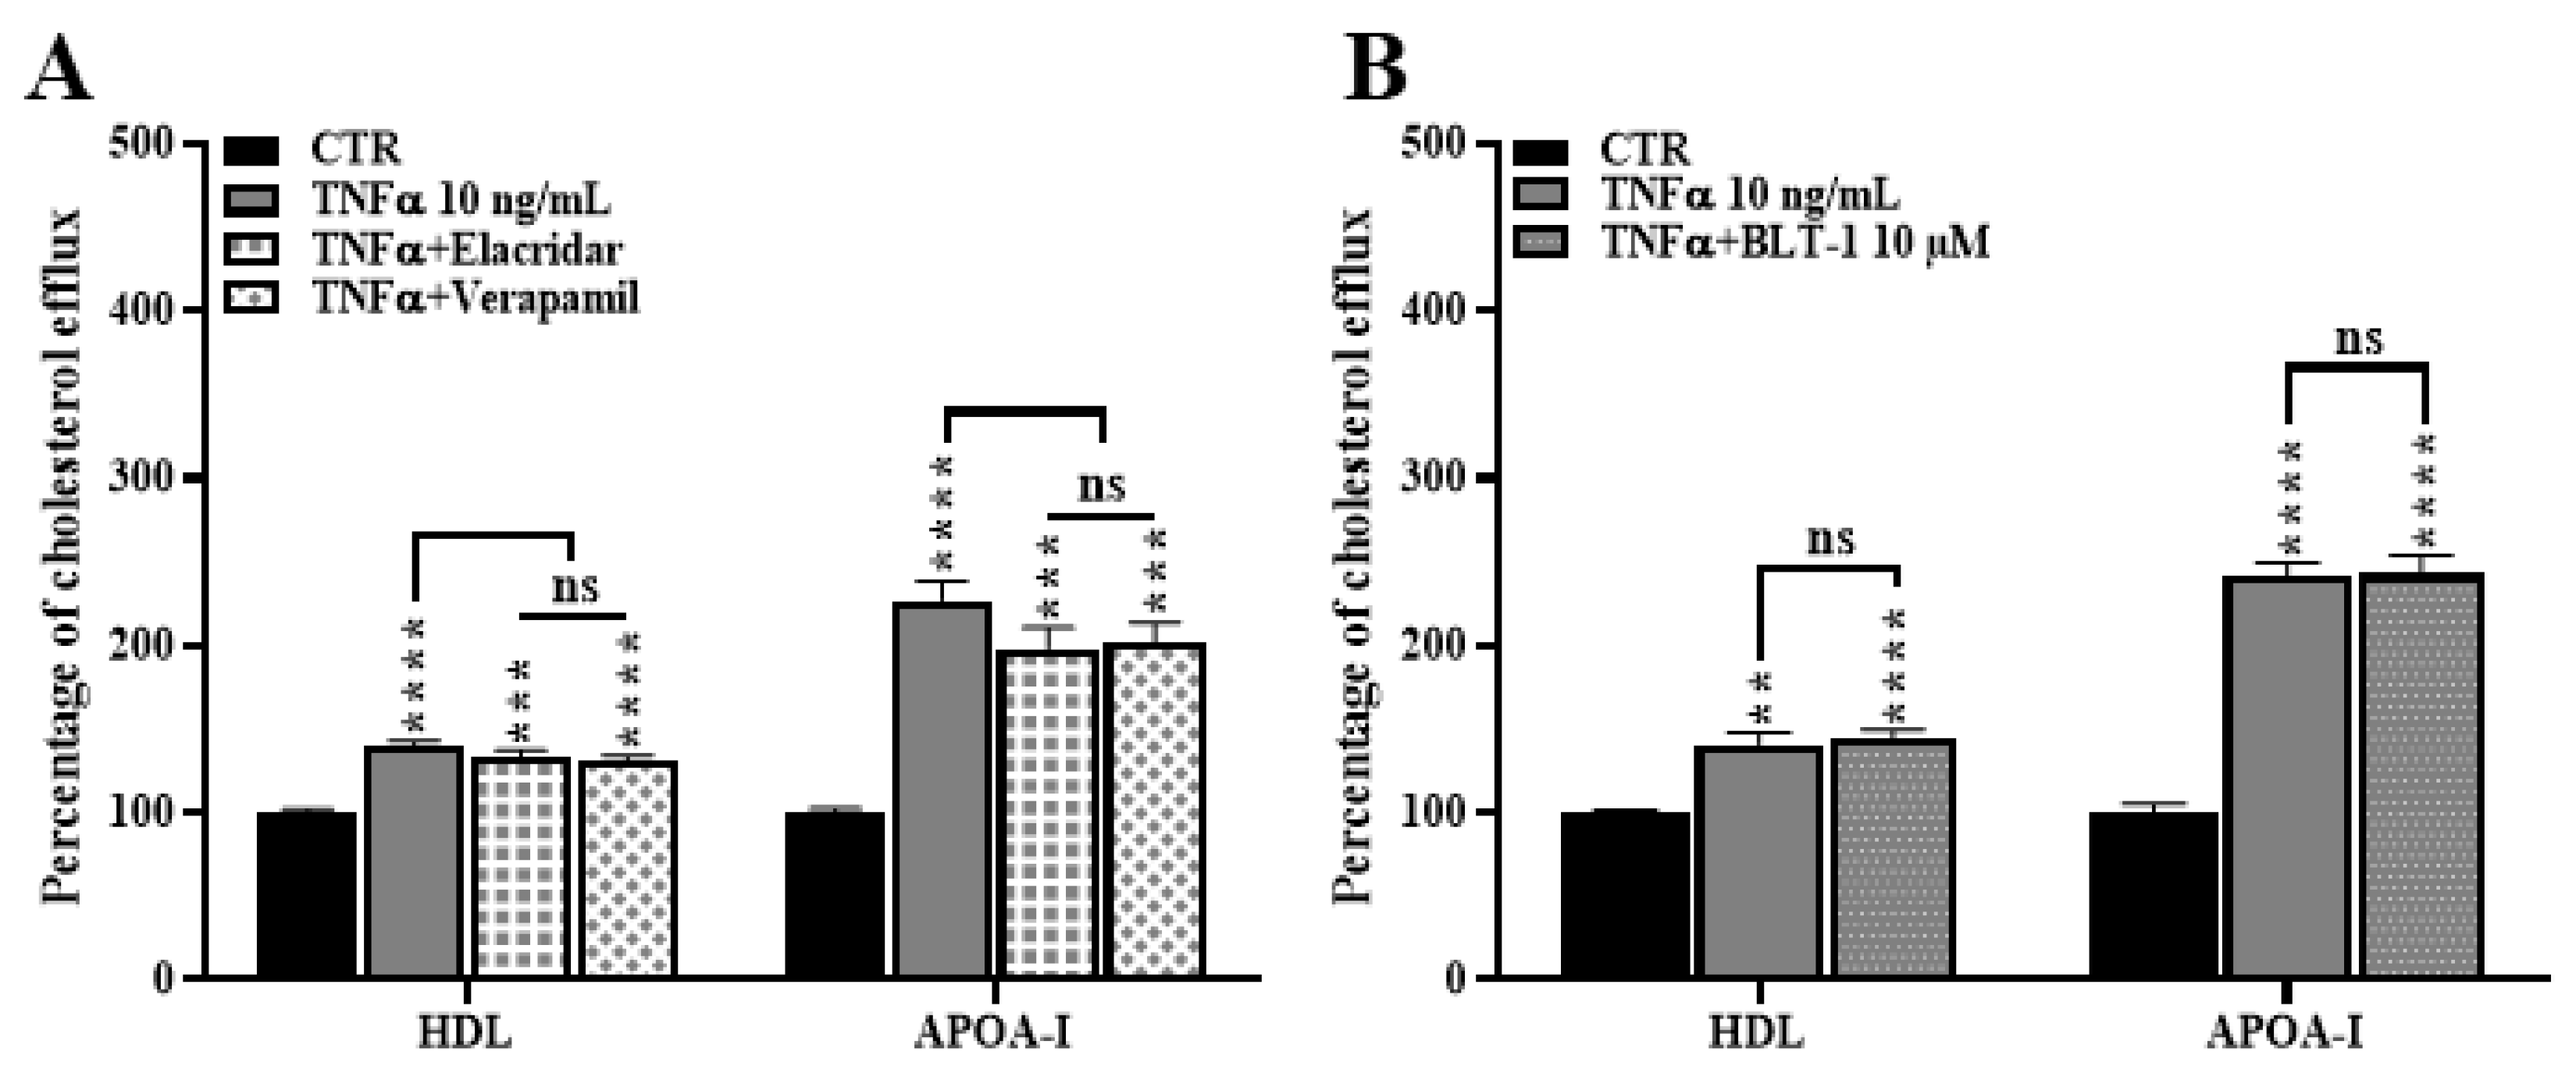
2.8. ABCB1 and SR-BI Inhibition Does Not Rescue the TNFα-Induced Cholesterol Efflux

To determine if SR-BI and ABCB1 might be responsible for the increased cholesterol efflux observed in HBP treated with TNFα, we next performed radiolabeled cholesterol efflux assays in the presence of the ABCB1 inhibitors verapamil and elacridar [45,46], and an SR-BI inhibitor, BLT-1 [47]. Our results show that inhibitors did not decrease the cholesterol release, thus discarding the idea of the contribution of SR-BI and ABCB1 in this process (Figure 8). These results definitively rule out the possible involvement of SR-BI and ABCB1 in cholesterol release to lipid acceptors.

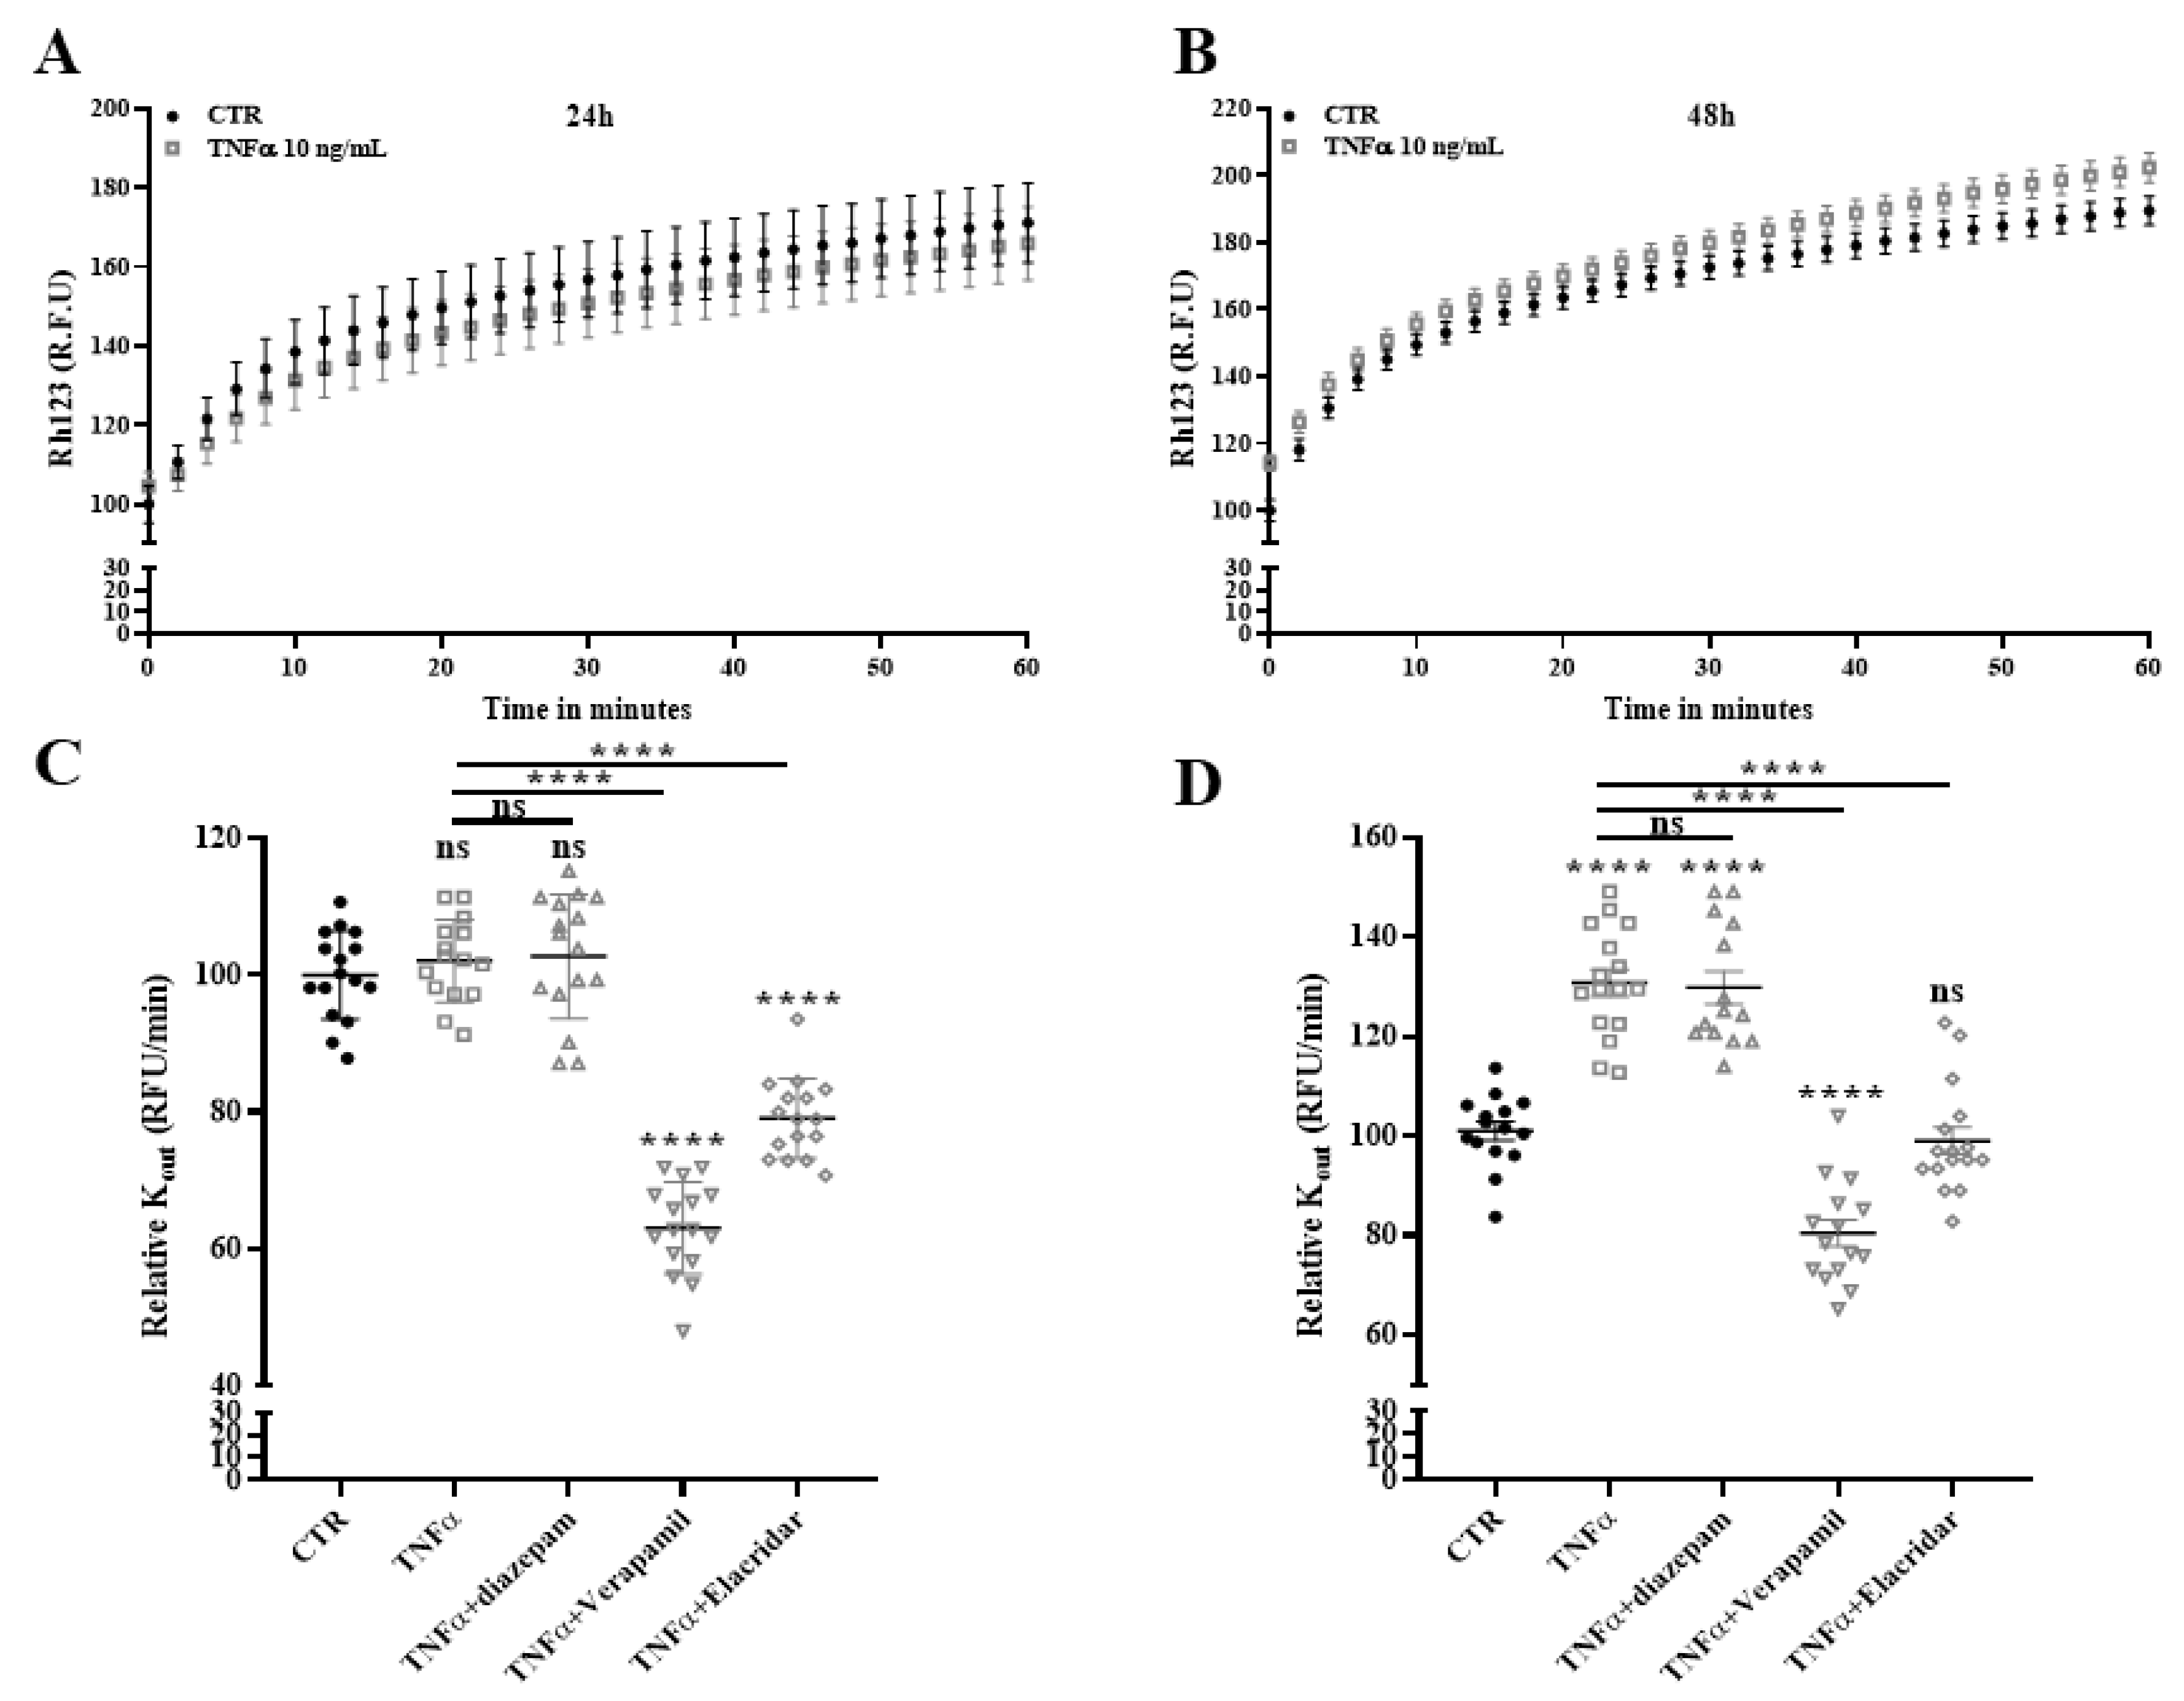
2.9. Drug Efflux Activity of ABCB1 Is Promoted by TNFα

At the BBB, ABCB1 is expressed by endothelial cells and brain pericytes and protects the CNS from harmful substances [27,40]. It has been previously demonstrated that TNFα modifies ABCB1 expression and functionality in BBB endothelial cells [48]. For the first time, we report that TNFα increased ABCB1 expression in HBP (Figure 7). To determine if the TNFα promotes ABCB1 functionality, we next assessed the efflux drug activity of ABCB1 using the pump out system. This method consists of accumulating within cells an ABCB1 substrate (rhodamine 123) and subsequently monitoring the ABCB1 mediated release of this compound in real time [46]. The same inhibitors that we used above (Figure 8) are included, as well as diazepam as a negative control because this molecule is a non-ABCB1 transported drug [46]. The kinetic of rhodamine 123 release shown in Figure 9A confirms that TNFα treatment significantly increased the efflux pump activity of the ABCB1 at 48 h but not at 24 h. The calculated Kout of rhodamine 123 at 48 h is increased (130.68% ± 2.73% versus 100.00% ± 1.87%) in control conditions. This TNFα-increased Kout is not modified in the presence of diazepam (129.71% ± 3.29%) and is significantly decreased in the presence of verapamil and elacridar, which inhibit ABCB1 activity (Figure 9B, 80.41% ± 2.66% and, 98.94% ± 2.71%, respectively). These results clearly demonstrate that elacridar and verapamil, also used in Figure 8, efficiently inhibit P-gp functions. This strengthens our previous conclusion that P-gp is not involved in cholesterol efflux after TNFα stimulation.
Because the transporter breast cancer cells resistant protein (BCRP, aka ABCG2) shows substrate overlap with ABCB1, as we previously observed in other cell types [45,46], we also studied ABCG2 expression in HBP. Our data demonstrate that ABCG2 expression is not affected by TNFα (Supplementary Material Figure S4). These results strongly support the notion that inflammatory stimuli such as TNFα, promote ABCB1 expression and function in HBP.

3. Discussion

In mammals, cholesterol is the major component of the cell membrane where it plays numerous roles in establishing crucial biochemical and biophysical properties, including cell signaling, organization of lipid microdomains, receptor distribution and function, bilayer fluidity, and membrane integrity [49]. A new emerging concept suggests that this membrane cholesterol pool might be divided into three distinct pools, each of them involved in inflammatory responses and defenses (reviewed in [2]).
In the brain, which is the most cholesterol-rich organ of the body, cholesterol also plays a central role in myelin sheath formation, synaptogenesis and membrane repair [1]. LXR/ABCA1 axis controls cholesterol homeostasis within the CNS, and disturbances in this signaling pathway might contribute to several neurological disorders such as in AD. Therefore, the LXR/ABCA1 axis and ABCA transporters have been previously suggested as promising therapeutical targets in AD [50,51,52,53]. Recent identification of ABCA1 as an important genetic factor for AD by genome wide association studies (GWAS) strengthen this hypothesis [14].
In our study, we investigated the LXR/ABCA1 axis in human brain pericytes (HBP) under inflammatory situations that are also a pathological feature of several neuroinflammatory diseases, including AD [15]. Brain pericytes are mural cells, embedded in the vascular basal lamina of the brain capillaries, and participating in the blood–brain barrier (BBB) formation and maintenance [19,20]. Loss or defect of brain pericytes has been reported in AD, suggesting that they can significantly contribute to AD onset and progression [22]. Recent advances in high resolution imaging techniques, transcriptomic techniques, new cell isolation methods, and cultivation protocols allow the highlighting of new functions for brain pericytes in CNS homeostasis and BBB functioning. For example, Erdener et al. have demonstrated that brain pericytes express several actin isoforms and myosin heavy chain type 11 suggesting that such cells might regulate the cerebral blood flow due to their ability to contract in response to stimuli [54]. Brain pericytes also play a central role in CNS immune response as it has been demonstrated that TNFα promotes expression of cell surface adhesion molecules such as VCAM1, triggering trafficking of leukocytes to inflammatory sites [55]. Our results, obtained in HBP confirm that TNFα increases VCAM1 expression in vitro. We also observed an increase in IL-6 production and secretion. Other in vitro studies performed with porcine and human brain pericytes previously showed the phagocytic activity of cell debris in inflammatory conditions [24,25,56], thus strongly suggesting that brain pericytes play an essential role in neuroinflammation.
The majority of the biological processes regulating CNS acute inflammation has focused on the contribution of glial cells, which are undoubtedly crucial for host defense and cell survival. However, there is a persisting gap in the knowledge of the role of brain pericytes in inflammatory conditions. Therefore, we studied the cholesterol metabolism and the LXR/ABCA1 axis using a human cell line that is very well characterized and summarized the major molecular signature of brain pericytes [28,29,30]. HBP highly express LXRα and, to a lower expression level (three-fold less), LXRβ. For the first time, we demonstrated in human brain pericytes that TNFα triggers the LXR signaling pathway, thus enhancing the ABCA1 expression that correlates with a lower cholesterol intracellular accumulation and an increase of the cholesterol efflux to HDL, APOA-I, APOE2 and APOE4. Activation of the LXR signaling pathway by synthetic agonist T0901317 gives the same trend as previously demonstrated in bovine brain pericytes [26]. However, neither ABCA1 blockade nor LXR signaling pathway inhibition affected this TNFα-mediated efflux, suggesting that this process is possibly passive and independent of LXR and ABCA1. Previous studies have already observed an upregulation of ABCA1 and of the cholesterol efflux in peritoneal mouse macrophages treated with TNFα and have attributed this lipid release to ABCA1 [17]. However, no LXR or ABCA1 inhibitions were performed. Additionally we cannot exclude the idea that the effect of TNFα is ultimately cell type dependent because human vein endothelial cells treated with TNF-α showed neither ABCA1 upregulation nor change in the cholesterol efflux [31].
We excluded participation of other ABC transporters and scavenger receptors described as participating in cholesterol efflux such as ABCG1, ABCG4 and SCARB1. As in bovine brain pericytes and human fibroblasts, ABCG1 is absent in HBP [27,39] and is not upregulated by LXR activation or TNFα. Interestingly, APOE expression and secretion are also decreased after TNFα treatment whereas expressions of the LDLR and LRP1 responsible for the lipoprotein’s uptake are increased and decreased, respectively. While TNFα altered the cholesterol uptake and efflux, cholesterol synthesis is not affected. Altogether, these data suggest that TNFα affects cholesterol homeostasis in HBP by (i) modifying the uptake of lipoproteins, and (ii) promoting cholesterol efflux but independently of ABCA1. All these modifications lead to a decrease of the total cholesterol pool of HBP. One major observation of this study is that ABCA1 is not involved in cholesterol efflux in inflammatory conditions. Therefore, the role of ABCA1 in this context needs further investigations. An alternative function for ABCA1 in macrophages may be to promote efferocytosis, which refers to the engulfment/clearance of apoptotic cells, as has been suggested by previous studies [17,57]. For instance, ABCA1−/− mice and macrophages show an impairment of recognition and clearance of apoptotic cells [58,59]. As mentioned previously, brain pericytes show phagocytic activity [21] thus suggesting that further investigations are needed to understand if the upregulation of ABCA1 in TNFα-treated HBP could promote cell debris clearance.
We were not able to identify another lipid transporter responsible for the increased cholesterol release observed after TNFα stimulation. This suggests that the mechanism of this cholesterol release might be mediated by another transporter as recently suggested in red blood cells by Ohkawa et al. [60]. Another explanation might be that this lipid release corresponds to the aqueous diffusion pathway in which the cholesterol molecules from the plasma membrane (PM), in contact with the HDL particles, can be trapped without the involvement of a transporter. This hypothesis is supported by an emerging concept in which the cholesterol pool of the membranes can be divided into three distinct pools [2]:
  • The first pool is the accessible or metabolically active pool, which is usually low (around 10% of the total PM cholesterol pool). This pool can be transferred to HDL and apolipoproteins by a process involving a transporter (such ABCA1) or by the aforementioned process called aqueous passive diffusion. If not transferred at external sources, cholesterol molecules of this pool can also be transferred to the intracellular pool of cholesterol located in the endoplasmic reticulum (ER), which senses the total cholesterol pool of the cells. Therefore, this metabolic pool is currently suspected to be a key player in the immune response and defense processes. This pool can be targeted by bacteria and viruses in order to penetrate within cells. Interestingly, it has been suggested that brain pericytes are more permissive for viral and bacterial infection than other CNS cells [61].
  • The second pool is the phospholipid-sequestered pool (almost 45% of the total PM pool) representing a strong biophysical basis for the assembly of lipid microdomains or lipid rafts.
  • The last cholesterol pool is the essential pool (45% of PM pool also), currently suspected to play a fundamental role in lipid bilayer integrity.
Based on this, we hypothesize that, in HBP, TNFα increases this metabolically active pool of cholesterol of the PM that can therefore be released to HDL and apolipoproteins in the highest quantity by a process that is not mediated by ABCA1. It seems to be rather mediated by a passive aqueous phenomenon during which HDL interact with the PM to trap cholesterol molecules of this active pool. Consequently, there is an increase in the HDL lipidation. At the periphery, HDL have anti-inflammatory and anti-oxidative properties [62,63]. We cannot exclude that HDL particles also have similar functions in CNS to mitigate damages in neurological diseases. Further investigations are needed in this direction to understand if the HDL and HDL-like particles generated by the brain pericytes cholesterol efflux might have CNS anti-inflammatory actions.
Another important result of our study is the understanding that inflammation can upregulate ABCB1 expression and function in HBP. We first suspected ABCB1 to be responsible for the increased cholesterol efflux observed in the presence of TNFα but we only observed an increased involvement of this transporter in cellular drug release. To our knowledge, this is the first time that similar effects have been reported in HBP. In the endothelial cells of the BBB, we and others have reported that TNFα decreases ABCB1 and ABCG2 expression and functionality, thus suggesting different mechanisms of regulation in these cell types [48,64]. We have previously reported the upregulation of ABCB1 when the LXR signaling pathway is activated by natural or synthetic agonist in endothelial BBB cells [36]. Altogether, these data strongly suggest that TNFα activates the LXR signaling pathway that in turn increases ABCB1 expression and functions.
Importantly, we generated these data in HBP cultured in vitro. Further studies with human samples or tissues are needed to confirm these effects of the inflammation at the human BBB and CNS.

4. Materials and Methods

4.1. Human Brain Pericytes (HBP)

Human brain pericytes (HBP) were isolated from a patient who had suddenly died from a heart attack [28]. Study protocol for human tissue was approved by the ethics committee of the Medical Faculty (IRB#: H18-033-6), University of Yamaguchi Graduate School, and was conducted in accordance with the Declaration of Helsinki, as amended in Somerset West in 1996. Written informed consent was obtained from the family of the participant before entering the study. The protocol was approved by the French Ministry of Higher Education and Research (CODECOH Number DC2011-1321). All experiments were carried out in accordance with the approved protocol.
Briefly, these pericytes were transfected and immortalized using retro-virus vectors holding human temperature-sensitive SV40 T antigen (tsA58) and human telomerase (Htert). HBP were then amplified and cultured at 33 °C in high glucose (4.5 g/L) Dulbecco’s modified Eagles’ medium (DMEM/HG), supplemented with 10% non-heat-inactivated fetal calf serum (FCS, Sigma-Aldrich, Saint-Louis, MS, USA), 1% L-glutamine (Merck chemicals, Darmstadt, Germany) and 1% penicillin–streptomycin (Sciencell, Carlsbad, CA, USA). Morphology and expression of HBP markers such as desmin, neuroglial2 (NG2), α smooth muscle actin (αSMA) and platelet-derived growth factor receptor (PDGF-R) were evaluated, while HBP have been deeply characterized in previous studies [28,29,30].
Before seeding, well plates were coated with collagen I (Corning, NY, USA). Then, HBP were seeded in 6-well plates at a density of 150,000 cells/well, in 12-well plates at a density of 50,000 cells/well, in 24-well plates at a density of 25,000 cells/well or in 96-well plates at 5000 cells/well for pump out assays and 7500 cells/well for LXR signal reporter assay. Only brain pericytes at passage 11 were used in this study. Cells were cultured at 37 °C in DMEM/HG supplemented with 1% L-glutamine (Merck KGaA, Darmstadt, Germany) and 1% penicillin–streptomycin (Sciencell) during 48 h to reach 80 to 90% of confluence.

4.2. Treatment of HBP

TNFα (Sigma-Aldrich) was dissolved in DMEM/HG supplemented with 0.1% bovine albumin serum (BSA, Sigma-Aldrich) at a concentration of 10 µg/mL. When ready, HBP were rinsed once with warm DMEM/HG/0.1% BSA and then incubated in DMEM/HG/0.1% BSA supplemented or not with 5 or 10 ng/mL of TNFα. These concentrations were selected based on previous in vitro studies published by us and others [64,65,66,67].

4.3. Cell Viability and Cytotoxicity Assessment

Cell viability was assessed for all tested molecules (TNFα, inhibitors, agonists, etc.) by performing the resazurin test and MTT assay. Please see the supplementary Material Figure S5 for toxicity assessment of all the compounds used in this study on HBP. The resazurin assay was performed based on the protocol of Jennings et al. [68]. A resazurin stock solution at 880 µM (R7017, Sigma) was prepared by dissolving the powder in 0.1 N NaOH (0.011 g/mL) and diluting it in phosphate saline buffer (PBS) with a final pH of 7.8. At the end of 24 and 48 h of treatment with TNFα, HBP were rinsed once with warm PBS then incubated for 2 h in 500 µL of resazurin diluted 20 times in DMEM 0.1% BSA solution. Fluorescence of resorufin (resazurin reduction product) was measured using the Synergy H1 plate reader (Agilent, Santa Clara, CA, USA) (λ excitation = 540 nm & λ emission = 590 nm). The MTT tetrazolium viability assay (Sigma-Aldrich) was performed according to manufacturer instructions and using the MTT (3-(4,5-dimethylthiazol-2-yl)-2,5-diphenyltetrazolium bromide). After treatments with different compounds, or after pump out experiments, HBP were incubated for 1 h with MTT tetrazolium diluted in Ringer–HEPES (RH buffer) buffer (150 mM NaCl, 5.2 mM KCl, 2.2 mM CaCl2, 0.2 mM MgCl2, 6 H2O, 6 mM NaHCO3, 5 mM HEPES, pH: 7.4) at 37 °C. HBP were then lysed using DMSO. Formazan absorbance was then measured in treated and in control HBP using the Synergy H1 reading spectrophotometer at 570 nm.

4.4. RNA Isolation, Reverse Transcription and Quantitative PCR

Nucleospin RNA/Protein Kit from Macherey-Nagel (Macherey-Nagel, Dueren, Germany) was used to isolate mRNA from HBP cultures following the manufacturer protocol. Briefly, after treatments, cells were rinsed once with cold RH buffer and then lysed with RP1 10% DTT lysis buffer. RNA purity was monitored by measuring the absorbance at 260, 280 and 320 nm using a Take 3 plate and Agilent’s Synergy H1 spectrophotometer. Reverse transcription was performed using IScript Reverse Transcription Supermix (Bio-Rad, Hercules, CA, USA) and following the manufacturer’s instructions. An amount of 250 ng of mRNA was used to obtain cDNA for each sample. qPCRs were performed in 96-well plates, where to each well we added: 2 µL of obtained cDNA, 0.4 µL of forward and 0.4 µL of reverse primers (10 pmol), 2.2 µL of RNAse-free water, and 5 µL of SoFast EvaGreen Supermix (Bio-Rad). Amplification was monitored using the CFX96 thermocycler (Bio-Rad) by performing 40 cycles with an annealing temperature of 60 °C. Data were analyzed using the Bio-Rad CFX Manager software and target genes expression levels were normalized to the housekeeping gene GAPDH using the ΔΔCt method. Specificity and efficiency for all target genes primers were evaluated before performing qPCR. Primer sequences are listed in Table 1.

4.5. Protein Extraction and Immunoblots

At the end of the treatment, cells were rinsed twice with cold RH buffer and lysed with RIPA buffer (Sigma-Aldrich) supplemented with anti-proteases and -phosphatases (Sigma-Aldrich). The lysates were then centrifuged at 10,000 rpm for 10 min at 4 °C. Pellets were discarded and the protein concentration present in the supernatant was quantified using the Bradford method (Bio-Rad). An amount of 20 µg protein per sample was added to 4x Laemmli buffer (Bio-Rad) and used for immunoblotting. Depending on each antibody’s working conditions, proteins were heated or not and supplemented or not with β-mercaptoethanol (Sigma-Aldrich) (Table 2). Prepared cell lysates were loaded into acrylamide fixed concentration gels for electrophoresis (SDS-PAGE) and transferred onto a nitrocellulose membrane (Amersham Biosciences, Buckinghamshire, United Kingdom). After transfer, blocking of the membranes was performed with 5% non-fat dry milk diluted in Tris base saline-1% tween 20 (TBST) and supplemented with 3% serum normal goat (SNG, Sigma-Aldrich) for at least 1 h. Depending on the working conditions of each primary antibody, incubation was performed overnight at 4 °C or 2 h at room temperature (RT). Antibodies were diluted in TBST (Table 2). After primary antibody incubation, membranes were rinsed three times with TBST and incubated with mouse, rabbit or rat secondary antibodies coupled to horseradish peroxidase (Dako, Lostrup, Denmark) for 1 h at RT. Proteins were revealed using enhanced chemiluminescence kit (GE Healthcare, Little Chalfont, UK). Chemiluminescence was observed by Western blot imaging system Azure c600 (Azure Biosystems, Dublin, Ireland) and quantified using AzureSpot 2.0 software. Each target protein was normalized to β-actin (ACTIN). Primary antibody details are shown in Table 2. Representative images of uncropped, full blots for all targets assessed in this study are shown in Supplementary Figure S6.

4.6. APOE and IL-6 Determination in Cell Culture Supernatant

Supernatants were collected after each TNFα treatment and stored at −20 °C. To precipitate secreted proteins, four volumes of pure acetone (Sigma-Aldrich) were added to one volume of supernatant and incubated at −20 °C overnight. After a centrifugation step at 10,000× g for 10 min, supernatant was discarded, and the remaining acetone was air-dried. The pellet was resuspended in RIPA lysis buffer supplemented with anti-proteases and anti-phosphatases. Bradford assay was performed for protein quantification and 50 µg of proteins were used for Western blot analysis. Then, immunoblots were performed as described above. Secreted targets were normalized to BSA.

4.7. Pump out Assay

The initial “pump out” method has been developed using Caco-2 cells [46]. In the present study, this method has been updated for HBP. After seeding and TNFα treatment, cells were rinsed once with warm RH buffer and incubated with 10 µM of rhodamine 123 (Sigma-Aldrich) solution during 2 h for the assessment of ABCB1 (P-gp) functionality. After incubation period, cells were rinsed once with warm RH buffer and then incubated in RH buffer with or without the following compounds, all purchased at Sigma-Aldrich: 50 µM diazepam (control molecule because not substrate of these efflux pumps), 10 µM elacridar (ABCB1 and ABCG2 inhibitor), 50 µM verapamil (ABCB1 inhibitor). Fluorescent dye efflux was measured every 2 min during 60 min at 37 °C, and the efflux rate (Kout) was calculated as the slope of the dye cumulative amount curve over time. Kout of treated and untreated conditions were compared for different tested inhibitors. The measurements were taken by the microplate fluorescence reader SYNERGY H1 for rhodamine 123 (λex = 501 nm and λem = 538 nm). After each pump out experiment, MTT assay was performed to assess HBP viability after incubation with the different chemical compounds.

4.8. Cellular Cholesterol Efflux Assay

Radiolabeled medium was obtained following two steps. In the first step, 0.5 µCi/mL of [3H]-Cholesterol (Perkin Elmer, Waltham, MA, USA) was added to FCS and incubated at 37 °C during 3 h. In the second step, radiolabeled serum was completed with DMEM/HG, 1% L-glutamine and 1% penicillin–streptomycin (completing the HBP medium). HBP were seeded as described previously in 24-well plate format. After cell attachment, medium was removed and replaced by 500 µL of the radiolabeled media for 36 h. Then, HBP were rinsed twice with DMEM/HG and incubated with DMEM/HG/0.1% BSA in the absence or presence of 10 ng/mL of TNFα for 24 and 48 h. After treatment, HBP were rinsed once with DMEM/HG/0,1% BSA and incubated for 1 h, 2 h, 4 h and 8 h with DMEM/HG/0.1% BSA containing or not the lipid acceptors: 50 µg/mL of high-density lipoproteins (HDL, Sigma-Aldrich), 20 µg/mL of apolipoprotein A-I (APOA-I, Sigma-Aldrich) or 20 µg/mL of apolipoprotein E2 or E4 (APOE2 & E4, Preprotech, Neuilly-sur-Seine, France). At the end of each time point, supernatants were collected and HBP were rinsed four times with cold RH buffer before being lysed in 1% Triton X-100 (Sigma-Aldrich). Supernatants and cell lysates were then centrifuged for 4 min at 4000 rpm. Radioactivity in the supernatant and lysates was quantified using an HIDEX 300SL scintillation counter (Sciencetec, Villebon-sur-Yvette, France) and the relative cholesterol efflux was calculated as previously described by us [26,36,69] and based on the following formula:
Relative   Cholesterol   Efflux   ( % ) = 100 Supernatant   radioactivity   [ Bq ] Supernatant   radioactivity   [ Bq ] +   Lysate   radioactivity   [ Bq ]
After the preliminary time points tests for cholesterol efflux estimation, we used the time point 8 h for the rest of our experiments. For inhibition experiments, we used GSK2033 (inhibitor of the LXR signaling pathway, MedChemExpress, Clinisciences, Nanterre, France) at 1 µM and incubated the cells 30 min before TNFα treatments. Inhibitors of ABC transporters activity were used during the 8 h of cholesterol efflux with the following concentrations: 100 µM of probucol (ABCA1 inhibitor [37]); 10 µM elacridar (ABCB1 inhibitor [45]); 50 µM verapamil (ABCB1 [46]); 10 µM BLT1 [70,71]. Amounts of 10 µM of T0901317 and 1 µM of GSK2033 were used as LXR agonist and inhibitor, respectively, as previously described [26,35].

4.9. Intracellular Cholesterol Quantification

Intracellular cholesterol dosage in HBP was performed using a cholesterol quantitation kit from Sigma-Aldrich. Briefly, HBP were seeded in 6-well plates, then treated with 10 ng/mL TNFα for 24 and 48 h, as described above, and rinsed twice with cold RH buffer. Cells were scrapped in 500 µL of RH buffer and lysates were collected. Lysates were centrifuged at 2000 rpm during 5 min and pellets were dissolved in 200 µL of chloroform:isopropanol:IGEPAL (7:11:0.1) (Sigma-Aldrich) lysis buffer. After 10 min of 10,000× g centrifugation, organic solvent phases were transferred in new collection tubes and pellets were discarded. Lipid extraction and cholesterol dosage were performed according to the manufacturer’s instructions. These data were then correlated with cholesterol accumulation also calculated in the cholesterol efflux experiments.

4.10. Assessment of LXR Pathway Activation

HBP were plated in a 96-well plate as described above. The following day, cells were transiently transfected with the LXR signal reporter assay (CCS-0041L, Qiagen, Hilden, Germany) using the Jetprime transfection reagent (Polyplus, Illkirch, France). After 24 h of transfection, HBP were rinsed and treated with 5 and 10 ng/mL of TNFα or with 10 µM of T0901317 for 1, 2, 4, 8, 24 and 48 h. After each time point, HBP were rinsed once with calcium- and magnesium-free phosphate buffered saline (PBS-CMF; 8 g/L NaCl, 0.2 g/L KCl, 0.2 g/L KH2PO4, 2.86 g/L Na2HPO4·12 H2O; pH 7.4), and then lysed with passive lysis buffer (PLB 1X). Firefly and Renilla Luciferase luminescence was assessed using the Dual-Luciferase® Reporter Assay System (E1910, Promega, France) following the manufacturer’s instructions, and using the Agilent Synergy H1 microplate reader.

4.11. Statistical Analysis

Results are presented as the mean ± SEM or ± SD as indicated in each figure legends. Normal distribution of values was analyzed using the Shapiro–Wilk test. Statistical testing for significance was performed using Student’s t-test or one-way ANOVA test followed by different tests for multiple comparison as indicated in figure legends. All the statistical tests were performed using Prism Software (GraphPad Software Inc., San Diego, CA, USA).

5. Conclusions

Our results are summarized in Figure 10. In this study, we observed for the first time in HBP that TNFα increases cholesterol efflux by a process independent of the LXR/ABCA1 axis. No other investigated lipid transporters are involved in this process, suggesting that this lipid release is likely a passive mechanism that might play a key role in HBP resistance to stressful situations or infection. Further studies are needed to better understand this process, and to decipher the role of the LXR/ABCA1 axis in HBP during neurodegenerative diseases onset and progression.

Supplementary Materials

The following supporting information can be downloaded at: https://www.mdpi.com/article/10.3390/ijms24065992/s1.

Author Contributions

Conceptualization, S.D., R.A.L., J.S.-P. and F.G.; methodology, R.A.L., F.G., E.S. and J.P.; formal analysis, S.D., R.A.L., E.S. and J.S.-P.; resources, F.G., F.S., T.K. and J.P.; data curation, S.D.; writing—original draft preparation, S.D. and F.G.; validation, F.G.; writing—review and editing, S.D., R.A.L., J.S.-P., E.S., F.S., T.K., J.P. and F.G.; supervision, F.G.; project administration, F.G.; funding acquisition, J.P. and F.G. All authors have read and agreed to the published version of the manuscript.

Funding

This project has been supported by the JPND PETABC multinational project and was funded by the French National Agency (ANR, grant number ANR-20-JPW2-0002-04 to F.G. and ANR-21-CE14-0002 to J.S.P). R.A.L. received a fellowship of the PETABC project. F.G. received further funding from the French State and Region Hauts-de-France as part of CPER 2021-2027 MOSOPS project. Shiraz Dib received a fellowship from ‘Conseil régional des Hauts-de-France’. J.P. received funding from the German Research Foundation (DFG, Germany; #263024513), HelseSØ (Norway; #2019054, #2019055, #2022046), Barnekreftforeningen (Norway; #19008), EEA and Norway grants Kappa programme (Iceland, Liechtenstein, Norway, Czech Republic; #TO01000078 (TAČR TARIMAD)), Norges forskningsråd (NFR, Norway; #295910 (NAPI), #327571 (PETABC)). PETABC is an EU Joint programme—Neurodegenerative Disease Research (JPND) project. PETABC is supported through the following funding organizations under the aegis of JPND—www.jpnd.eu: NFR (Norway; #327571), FFG (Austria; #882717), BMBF (Germany; #01ED2106); MSMT (Czech Republic; #8F21002), Latvia; #ES RTD/2020/26, ANR (France; #20-JPW2-0002-04), SRC (Sweden; #2020-02905). A CC-BY public copyright license has been applied by the authors to the present document and will be applied to all subsequent versions up to the author-accepted manuscript arising from this submission, in accordance with the grant’s open access conditions.

Institutional Review Board Statement

This study was conducted according to the guidelines of the Declaration of Helsinki.

Informed Consent Statement

Informed consent was obtained from the family of the subject.

Data Availability Statement

The data that supports the findings of this study are available on request from the corresponding author.

Conflicts of Interest

The authors declare no conflict of interest.

References

  1. Dietschy, J.M.; Turley, S.D. Thematic review series: Brain Lipids. Cholesterol metabolism in the central nervous system during early development and in the mature animal. J. Lipid. Res. 2004, 45, 1375–1397. [Google Scholar] [CrossRef] [PubMed] [Green Version]
  2. Lee, M.S.; Bensinger, S.J. Reprogramming cholesterol metabolism in macrophages and its role in host defense against cholesterol-dependent cytolysins. Cell. Mol. Immunol. 2022, 19, 327–336. [Google Scholar] [CrossRef] [PubMed]
  3. Candela, P.; Gosselet, F.; Miller, F.; Buee-Scherrer, V.; Torpier, G.; Cecchelli, R.; Fenart, L. Physiological pathway for low-density lipoproteins across the blood-brain barrier: Transcytosis through brain capillary endothelial cells in vitro. Endothelium 2008, 15, 254–264. [Google Scholar] [CrossRef] [PubMed]
  4. Pfrieger, F.W.; Ungerer, N. Cholesterol metabolism in neurons and astrocytes. Prog. Lipid. Res. 2011, 50, 357–371. [Google Scholar] [CrossRef] [PubMed]
  5. Martín, M.G.; Pfrieger, F.; Dotti, C.G. Cholesterol in brain disease: Sometimes determinant and frequently implicated. EMBO Rep. 2014, 15, 1036–1052. [Google Scholar] [CrossRef] [Green Version]
  6. Saint-Pol, J.; Gosselet, F. Oxysterols and the NeuroVascular Unit (NVU): A far true love with bright and dark sides. J. Steroid Biochem. Mol. Biol. 2019, 191, 105368. [Google Scholar] [CrossRef] [PubMed]
  7. Burns, M.P.; Vardanian, L.; Pajoohesh-Ganji, A.; Wang, L.; Cooper, M.; Harris, D.C.; Duff, K.; Rebeck, G.W. The effects of ABCA1 on cholesterol efflux and Abeta levels in vitro and in vivo. J. Neurochem. 2006, 98, 792–800. [Google Scholar] [CrossRef]
  8. Lefterov, I.; Bookout, A.; Wang, Z.; Staufenbiel, M.; Mangelsdorf, D.; Koldamova, R. Expression profiling in APP23 mouse brain: Inhibition of Abeta amyloidosis and inflammation in response to LXR agonist treatment. Mol. Neurodegener. 2007, 2, 20. [Google Scholar] [CrossRef] [Green Version]
  9. Wahrle, S.E.; Jiang, H.; Parsadanian, M.; Kim, J.; Li, A.; Knoten, A.; Jain, S.; Hirsch-Reinshagen, V.; Wellington, C.L.; Bales, K.R.; et al. Overexpression of ABCA1 reduces amyloid deposition in the PDAPP mouse model of Alzheimer disease. J. Clin. Investig. 2008, 118, 671–682. [Google Scholar] [CrossRef]
  10. Wahrle, S.E.; Jiang, H.; Parsadanian, M.; Hartman, R.E.; Bales, K.R.; Paul, S.M.; Holtzman, D.M. Deletion of ABCA1 increases Abeta deposition in the PDAPP transgenic mouse model of Alzheimer disease. J. Biol. Chem. 2005, 280, 43236–43242. [Google Scholar] [CrossRef] [Green Version]
  11. Fitz, N.F.; Cronican, A.A.; Saleem, M.; Fauq, A.H.; Chapman, R.; Lefterov, I.; Koldamova, R. ABCA1 deficiency affects Alzheimer’s disease-like phenotype in human ApoE4 but not in ApoE3-targeted replacement mice. J. Neurosci. 2012, 32, 13125–13136. [Google Scholar] [CrossRef] [PubMed] [Green Version]
  12. Zelcer, N.; Khanlou, N.; Clare, R.; Jiang, Q.; Reed-Geaghan, E.G.; Landreth, G.E.; Vinters, H.V.; Tontonoz, P. Attenuation of neuroinflammation and Alzheimer’s disease pathology by liver x receptors. Proc. Natl. Acad. Sci. USA 2007, 104, 10601–10606. [Google Scholar] [CrossRef] [PubMed] [Green Version]
  13. Yassine, H.N.; Feng, Q.; Chiang, J.; Petrosspour, L.M.; Fonteh, A.N.; Chui, H.C.; Harrington, M.G. ABCA1-Mediated Cholesterol Efflux Capacity to Cerebrospinal Fluid Is Reduced in Patients with Mild Cognitive Impairment and Alzheimer’s Disease. J. Am. Heart Assoc. 2016, 5, e002886. [Google Scholar] [CrossRef] [PubMed] [Green Version]
  14. Holstege, H.; Hulsman, M.; Charbonnier, C.; Grenier-Boley, B.; Quenez, O.; Grozeva, D.; van Rooij, J.G.J.; Sims, R.; Ahmad, S.; Amin, N.; et al. Exome sequencing identifies rare damaging variants in ATP8B4 and ABCA1 as risk factors for Alzheimer’s disease. Nat. Genet. 2022, 54, 1786–1794. [Google Scholar] [CrossRef]
  15. Bellenguez, C.; Küçükali, F.; Jansen, I.E.; Kleineidam, L.; Moreno-Grau, S.; Amin, N.; Naj, A.C.; Campos-Martin, R.; Grenier-Boley, B.; Andrade, V.; et al. New insights into the genetic etiology of Alzheimer’s disease and related dementias. Nat. Genet. 2022, 54, 412–436. [Google Scholar] [CrossRef]
  16. Courtney, R.; Landreth, G.E. LXR Regulation of Brain Cholesterol: From Development to Disease. Trends Endocrinol. Metab. TEM 2016, 27, 404–414. [Google Scholar] [CrossRef] [Green Version]
  17. Gerbod-Giannone, M.C.; Li, Y.; Holleboom, A.; Han, S.; Hsu, L.C.; Tabas, I.; Tall, A.R. TNFalpha induces ABCA1 through NF-kappaB in macrophages and in phagocytes ingesting apoptotic cells. Proc. Natl. Acad. Sci. USA 2006, 103, 3112–3117. [Google Scholar] [CrossRef] [Green Version]
  18. Cecchelli, R.; Berezowski, V.; Lundquist, S.; Culot, M.; Renftel, M.; Dehouck, M.P.; Fenart, L. Modelling of the blood-brain barrier in drug discovery and development. Nat. Rev. Drug. Discov. 2007, 6, 650–661. [Google Scholar] [CrossRef]
  19. Daneman, R.; Zhou, L.; Kebede, A.A.; Barres, B.A. Pericytes are required for blood-brain barrier integrity during embryogenesis. Nature 2010, 468, 562–566. [Google Scholar] [CrossRef] [Green Version]
  20. Armulik, A.; Genove, G.; Mae, M.; Nisancioglu, M.H.; Wallgard, E.; Niaudet, C.; He, L.; Norlin, J.; Lindblom, P.; Strittmatter, K.; et al. Pericytes regulate the blood-brain barrier. Nature 2010, 468, 557–561. [Google Scholar] [CrossRef] [Green Version]
  21. Brown, L.S.; Foster, C.G.; Courtney, J.M.; King, N.E.; Howells, D.W.; Sutherland, B.A. Pericytes and Neurovascular Function in the Healthy and Diseased Brain. Front. Cell. Neurosci. 2019, 13, 282. [Google Scholar] [CrossRef] [PubMed] [Green Version]
  22. Nikolakopoulou, A.M.; Montagne, A.; Kisler, K.; Dai, Z.; Wang, Y.; Huuskonen, M.T.; Sagare, A.P.; Lazic, D.; Sweeney, M.D.; Kong, P.; et al. Pericyte loss leads to circulatory failure and pleiotrophin depletion causing neuron loss. Nat. Neurosci. 2019, 22, 1089–1098. [Google Scholar] [CrossRef] [PubMed]
  23. Zheng, Z.; Chopp, M.; Chen, J. Multifaceted roles of pericytes in central nervous system homeostasis and disease. J. Cereb. Blood. Flow. Metab. 2020, 40, 1381–1401. [Google Scholar] [CrossRef] [PubMed]
  24. Rustenhoven, J.; Aalderink, M.; Scotter, E.L.; Oldfield, R.L.; Bergin, P.S.; Mee, E.W.; Graham, E.S.; Faull, R.L.; Curtis, M.A.; Park, T.I.; et al. TGF-beta1 regulates human brain pericyte inflammatory processes involved in neurovasculature function. J. Neuroinflamm. 2016, 13, 37. [Google Scholar] [CrossRef] [Green Version]
  25. Rustenhoven, J.; Smyth, L.C.; Jansson, D.; Schweder, P.; Aalderink, M.; Scotter, E.L.; Mee, E.W.; Faull, R.L.M.; Park, T.I.; Dragunow, M. Modelling physiological and pathological conditions to study pericyte biology in brain function and dysfunction. BMC Neurosci. 2018, 19, 6. [Google Scholar] [CrossRef] [PubMed]
  26. Saint-Pol, J.; Vandenhaute, E.; Boucau, M.C.; Candela, P.; Dehouck, L.; Cecchelli, R.; Dehouck, M.P.; Fenart, L.; Gosselet, F. Brain Pericytes ABCA1 Expression Mediates Cholesterol Efflux but not Cellular Amyloid-beta Peptide Accumulation. J. Alzheimers Dis. 2012, 30, 489–503. [Google Scholar] [CrossRef] [Green Version]
  27. Gosselet, F.; Candela, P.; Sevin, E.; Berezowski, V.; Cecchelli, R.; Fenart, L. Transcriptional profiles of receptors and transporters involved in brain cholesterol homeostasis at the blood-brain barrier: Use of an in vitro model. Brain Res. 2009, 1249, 34–42. [Google Scholar] [CrossRef]
  28. Shimizu, F.; Sano, Y.; Abe, M.A.; Maeda, T.; Ohtsuki, S.; Terasaki, T.; Kanda, T. Peripheral nerve pericytes modify the blood-nerve barrier function and tight junctional molecules through the secretion of various soluble factors. J. Cell Physiol. 2011, 226, 255–266. [Google Scholar] [CrossRef]
  29. Deligne, C.; Hachani, J.; Duban-Deweer, S.; Meignan, S.; Leblond, P.; Carcaboso, A.M.; Sano, Y.; Shimizu, F.; Kanda, T.; Gosselet, F.; et al. Development of a human in vitro blood-brain tumor barrier model of diffuse intrinsic pontine glioma to better understand the chemoresistance. Fluids Barriers CNS 2020, 17, 37. [Google Scholar] [CrossRef]
  30. Heymans, M.; Figueiredo, R.; Dehouck, L.; Francisco, D.; Sano, Y.; Shimizu, F.; Kanda, T.; Bruggmann, R.; Engelhardt, B.; Winter, P.; et al. Contribution of brain pericytes in blood-brain barrier formation and maintenance: A transcriptomic study of cocultured human endothelial cells derived from hematopoietic stem cells. Fluids Barriers CNS 2020, 17, 48. [Google Scholar] [CrossRef]
  31. Fowler, J.W.M.; Zhang, R.; Tao, B.; Boutagy, N.E.; Sessa, W.C. Inflammatory stress signaling via NF-kB alters accessible cholesterol to upregulate SREBP2 transcriptional activity in endothelial cells. eLife 2022, 11, e79529. [Google Scholar] [CrossRef]
  32. Al-Rashed, F.; Ahmad, Z.; Thomas, R.; Melhem, M.; Snider, A.J.; Obeid, L.M.; Al-Mulla, F.; Hannun, Y.A.; Ahmad, R. Neutral sphingomyelinase 2 regulates inflammatory responses in monocytes/macrophages induced by TNF-α. Sci. Rep. 2020, 10, 16802. [Google Scholar] [CrossRef] [PubMed]
  33. Strittmatter, W.J.; Saunders, A.M.; Schmechel, D.; Pericak-Vance, M.; Enghild, J.; Salvesen, G.S.; Roses, A.D. Apolipoprotein E: High-avidity binding to beta-amyloid and increased frequency of type 4 allele in late-onset familial Alzheimer disease. Proc. Natl. Acad. Sci. USA 1993, 90, 1977–1981. [Google Scholar] [CrossRef] [PubMed] [Green Version]
  34. Hollingworth, P.; Harold, D.; Sims, R.; Gerrish, A.; Lambert, J.C.; Carrasquillo, M.M.; Abraham, R.; Hamshere, M.L.; Pahwa, J.S.; Moskvina, V.; et al. Common variants at ABCA7, MS4A6A/MS4A4E, EPHA1, CD33 and CD2AP are associated with Alzheimer’s disease. Nat. Genet. 2011, 43, 429–435. [Google Scholar] [CrossRef] [Green Version]
  35. Xu, X.; Xiao, X.; Yan, Y.; Zhang, T. Activation of liver X receptors prevents emotional and cognitive dysfunction by suppressing microglial M1-polarization and restoring synaptic plasticity in the hippocampus of mice. Brain Behav. Immun. 2021, 94, 111–124. [Google Scholar] [CrossRef] [PubMed]
  36. Saint-Pol, J.; Candela, P.; Boucau, M.C.; Fenart, L.; Gosselet, F. Oxysterols decrease apical-to-basolateral transport of Abeta peptides via an ABCB1-mediated process in an in vitro Blood-brain barrier model constituted of bovine brain capillary endothelial cells. Brain Res. 2013, 1517, 1–15. [Google Scholar] [CrossRef]
  37. Favari, E.; Lee, M.; Calabresi, L.; Franceschini, G.; Zimetti, F.; Bernini, F.; Kovanen, P.T. Depletion of pre-beta-high density lipoprotein by human chymase impairs ATP-binding cassette transporter A1- but not scavenger receptor class B type I-mediated lipid efflux to high density lipoprotein. J. Biol. Chem. 2004, 279, 9930–9936. [Google Scholar] [CrossRef] [Green Version]
  38. Rezaei, F.; Farhat, D.; Gursu, G.; Samnani, S.; Lee, J.Y. Snapshots of ABCG1 and ABCG5/G8: A Sterol’s Journey to Cross the Cellular Membranes. Int. J. Mol. Sci. 2022, 24, 484. [Google Scholar] [CrossRef]
  39. O’Connell, B.J.; Denis, M.; Genest, J. Cellular physiology of cholesterol efflux in vascular endothelial cells. Circulation 2004, 110, 2881–2888. [Google Scholar] [CrossRef] [Green Version]
  40. Gosselet, F.; Saint-Pol, J.; Candela, P.; Fenart, L. Amyloid-beta Peptides, Alzheimer’s Disease and the Blood-brain Barrier. Curr. Alzheimer Res. 2013, 10, 1015–1033. [Google Scholar] [CrossRef]
  41. Yancey, P.G.; Bortnick, A.E.; Kellner-Weibel, G.; de la Llera-Moya, M.; Phillips, M.C.; Rothblat, G.H. Importance of different pathways of cellular cholesterol efflux. Arterioscler. Thromb. Vasc. Biol. 2003, 23, 712–719. [Google Scholar] [CrossRef] [PubMed]
  42. Kim, W.S.; Weickert, C.S.; Garner, B. Role of ATP-binding cassette transporters in brain lipid transport and neurological disease. J. Neurochem. 2008, 104, 1145–1166. [Google Scholar] [CrossRef] [PubMed]
  43. Thangapandian, S.; Kapoor, K.; Tajkhorshid, E. Probing cholesterol binding and translocation in P-glycoprotein. Biochim. Biophys. Acta Biomembr. 2020, 1862, 183090. [Google Scholar] [CrossRef] [PubMed]
  44. Sharom, F.J. Shedding light on drug transport: Structure and function of the P-glycoprotein multidrug transporter (ABCB1). Biochem. Cell Biol. Biochim. Biol. Cell. 2006, 84, 979–992. [Google Scholar] [CrossRef]
  45. Candela, P.; Gosselet, F.; Saint-Pol, J.; Sevin, E.; Boucau, M.C.; Boulanger, E.; Cecchelli, R.; Fenart, L. Apical-to-basolateral transport of amyloid-beta peptides through blood-brain barrier cells is mediated by the receptor for advanced glycation end-products and is restricted by P-glycoprotein. J. Alzheimers Dis. 2010, 22, 849–859. [Google Scholar] [CrossRef] [PubMed] [Green Version]
  46. Sevin, E.; Dehouck, L.; Versele, R.; Culot, M.; Gosselet, F. A Miniaturized Pump Out Method for Characterizing Molecule Interaction with ABC Transporters. Int. J. Mol. Sci. 2019, 20, 5529. [Google Scholar] [CrossRef] [Green Version]
  47. Raldúa, D.; Babin, P.J. BLT-1, a specific inhibitor of the HDL receptor SR-BI, induces a copper-dependent phenotype during zebrafish development. Toxicol. Lett. 2007, 175, 1–7. [Google Scholar] [CrossRef]
  48. Poller, B.; Drewe, J.; Krähenbühl, S.; Huwyler, J.; Gutmann, H. Regulation of BCRP (ABCG2) and P-glycoprotein (ABCB1) by cytokines in a model of the human blood-brain barrier. Cell Mol. Neurobiol. 2010, 30, 63–70. [Google Scholar] [CrossRef]
  49. Juhl, A.D.; Wüstner, D. Pathways and Mechanisms of Cellular Cholesterol Efflux-Insight from Imaging. Front. Cell Dev. Biol. 2022, 10, 834408. [Google Scholar] [CrossRef]
  50. Pahnke, J.; Bascuñana, P.; Brackhan, M.; Stefan, K.; Namasivayam, V.; Koldamova, R.; Wu, J.; Möhle, L.; Stefan, S.M. Strategies to gain novel Alzheimer’s disease diagnostics and therapeutics using modulators of ABCA transporters. Free Neuropathol. 2021, 2, 33. [Google Scholar] [CrossRef]
  51. Koldamova, R.; Fitz, N.F.; Lefterov, I. ATP-binding cassette transporter A1: From metabolism to neurodegeneration. Neurobiol. Dis. 2014, 72 Pt A, 13–21. [Google Scholar] [CrossRef] [Green Version]
  52. Fu, Y.; Hsiao, J.H.; Paxinos, G.; Halliday, G.M.; Kim, W.S. ABCA7 Mediates Phagocytic Clearance of Amyloid-beta in the Brain. J. Alzheimers Dis. 2016, 54, 569–584. [Google Scholar] [CrossRef] [PubMed]
  53. Lamartiniere, Y.; Boucau, M.C.; Dehouck, L.; Krohn, M.; Pahnke, J.; Candela, P.; Gosselet, F.; Fenart, L. ABCA7 Downregulation Modifies Cellular Cholesterol Homeostasis and Decreases Amyloid-beta Peptide Efflux in an in vitro Model of the Blood-Brain Barrier. J. Alzheimers Dis. 2018, 64, 1195–1211. [Google Scholar] [CrossRef] [PubMed]
  54. Erdener, Ş.E.; Küreli, G.; Dalkara, T. Contractile apparatus in CNS capillary pericytes. Neurophotonics 2022, 9, 021904. [Google Scholar] [CrossRef] [PubMed]
  55. Stark, K.; Eckart, A.; Haidari, S.; Tirniceriu, A.; Lorenz, M.; von Brühl, M.L.; Gärtner, F.; Khandoga, A.G.; Legate, K.R.; Pless, R.; et al. Capillary and arteriolar pericytes attract innate leukocytes exiting through venules and ‘instruct’ them with pattern-recognition and motility programs. Nat. Immunol. 2013, 14, 41–51. [Google Scholar] [CrossRef]
  56. Pieper, C.; Marek, J.J.; Unterberg, M.; Schwerdtle, T.; Galla, H.J. Brain capillary pericytes contribute to the immune defense in response to cytokines or LPS in vitro. Brain Res. 2014, 1550, 1–8. [Google Scholar] [CrossRef]
  57. Hamon, Y.; Broccardo, C.; Chambenoit, O.; Luciani, M.F.; Toti, F.; Chaslin, S.; Freyssinet, J.M.; Devaux, P.F.; McNeish, J.; Marguet, D.; et al. ABC1 promotes engulfment of apoptotic cells and transbilayer redistribution of phosphatidylserine. Nat. Cell Biol. 2000, 2, 399–406. [Google Scholar] [CrossRef]
  58. Luciani, M.F.; Chimini, G. The ATP binding cassette transporter ABC1, is required for the engulfment of corpses generated by apoptotic cell death. EMBO J. 1996, 15, 226–235. [Google Scholar] [CrossRef]
  59. Chen, W.; Li, L.; Wang, J.; Zhang, R.; Zhang, T.; Wu, Y.; Wang, S.; Xing, D. The ABCA1-efferocytosis axis: A new strategy to protect against atherosclerosis. Clin. Chim. Acta Int. J. Clin. Chem. 2021, 518, 1–8. [Google Scholar] [CrossRef]
  60. Ohkawa, R.; Low, H.; Mukhamedova, N.; Fu, Y.; Lai, S.J.; Sasaoka, M.; Hara, A.; Yamazaki, A.; Kameda, T.; Horiuchi, Y.; et al. Cholesterol transport between red blood cells and lipoproteins contributes to cholesterol metabolism in blood. J. Lipid Res. 2020, 61, 1577–1588. [Google Scholar] [CrossRef]
  61. Salmeri, M.; Motta, C.; Anfuso, C.D.; Amodeo, A.; Scalia, M.; Toscano, M.A.; Alberghina, M.; Lupo, G. VEGF receptor-1 involvement in pericyte loss induced by Escherichia coli in an in vitro model of blood brain barrier. Cell. Microbiol. 2013, 15, 1367–1384. [Google Scholar] [CrossRef] [PubMed]
  62. Fotakis, P.; Kothari, V.; Thomas, D.G.; Westerterp, M.; Molusky, M.M.; Altin, E.; Abramowicz, S.; Wang, N.; He, Y.; Heinecke, J.W.; et al. Anti-Inflammatory Effects of HDL (High-Density Lipoprotein) in Macrophages Predominate Over Proinflammatory Effects in Atherosclerotic Plaques. Arterioscler. Thromb. Vasc. Biol. 2019, 39, e253–e272. [Google Scholar] [CrossRef] [PubMed]
  63. Grao-Cruces, E.; Lopez-Enriquez, S.; Martin, M.E.; Montserrat-de la Paz, S. High-density lipoproteins and immune response: A review. Int. J. Biol. Macromol. 2022, 195, 117–123. [Google Scholar] [CrossRef] [PubMed]
  64. Versele, R.; Sevin, E.; Gosselet, F.; Fenart, L.; Candela, P. TNF-α and IL-1β Modulate Blood-Brain Barrier Permeability and Decrease Amyloid-β Peptide Efflux in a Human Blood-Brain Barrier Model. Int. J. Mol. Sci. 2022, 23, 10235. [Google Scholar] [CrossRef] [PubMed]
  65. Ni, Y.; Teng, T.; Li, R.; Simonyi, A.; Sun, G.Y.; Lee, J.C. TNFα alters occludin and cerebral endothelial permeability: Role of p38MAPK. PLoS ONE 2017, 12, e0170346. [Google Scholar] [CrossRef] [Green Version]
  66. Lopez-Ramirez, M.A.; Male, D.K.; Wang, C.; Sharrack, B.; Wu, D.; Romero, I.A. Cytokine-induced changes in the gene expression profile of a human cerebral microvascular endothelial cell-line, hCMEC/D3. Fluids Barriers CNS 2013, 10, 27. [Google Scholar] [CrossRef] [Green Version]
  67. da Rocha, G.H.O.; Loiola, R.A.; de Paula-Silva, M.; Shimizu, F.; Kanda, T.; Vieira, A.; Gosselet, F.; Farsky, S.H.P. Pioglitazone Attenuates the Effects of Peripheral Inflammation in a Human In Vitro Blood-Brain Barrier Model. Int. J. Mol. Sci. 2022, 23, 12781. [Google Scholar] [CrossRef]
  68. Jennings, P.; Koppelstaetter, C.; Aydin, S.; Abberger, T.; Wolf, A.M.; Mayer, G.; Pfaller, W. Cyclosporine A induces senescence in renal tubular epithelial cells. Am. J. Physiol. Ren. Physiol. 2007, 293, F831–F838. [Google Scholar] [CrossRef] [Green Version]
  69. Kuntz, M.; Candela, P.; Saint-Pol, J.; Lamartiniere, Y.; Boucau, M.C.; Sevin, E.; Fenart, L.; Gosselet, F. Bexarotene Promotes Cholesterol Efflux and Restricts Apical-to-Basolateral Transport of Amyloid-beta Peptides in an In Vitro Model of the Human Blood-Brain Barrier. J. Alzheimers Dis. 2015, 48, 849–862. [Google Scholar] [CrossRef] [Green Version]
  70. Nieland, T.J.; Chroni, A.; Fitzgerald, M.L.; Maliga, Z.; Zannis, V.I.; Kirchhausen, T.; Krieger, M. Cross-inhibition of SR-BI- and ABCA1-mediated cholesterol transport by the small molecules BLT-4 and glyburide. J. Lipid. Res. 2004, 45, 1256–1265. [Google Scholar] [CrossRef] [Green Version]
  71. Nieland, T.J.; Penman, M.; Dori, L.; Krieger, M.; Kirchhausen, T. Discovery of chemical inhibitors of the selective transfer of lipids mediated by the HDL receptor SR-BI. Proc. Natl. Acad. Sci. USA 2002, 99, 15422–15427. [Google Scholar] [CrossRef] [PubMed] [Green Version]
Figure 1. TNFα induces inflammatory markers expression but does not affect HBP viability. (A). After TNFα treatment, HBP were incubated with resazurin. Viable HBP converted resazurin into fluorescent Resorufin, which was measured and represented in percentage relative to the control condition (CTR). Each bar represents the mean ± SEM of three independent experiments with four replicates each (N = 3; n = 12). Statistical analysis: Student’s t-test, ns: non-significant. (B). MTT assay was performed to the highest applied dose. Data are shown as the mean ± SEM of three experiments with eight replicates each (N = 3, n = 24). Statistical analysis: Student’s t-test, ns: non-significant. (C). Cell inflammatory markers’ (COX2, NLRP3, VCAM1) protein levels were monitored by Western blot. (D). Each bar represents the level of quantified protein signal normalized to ACTIN relative to the CTR. Data are shown as the mean ± SEM of three independent experiments (N = 3). (E). Secreted inflammatory marker IL-6 protein level was analyzed by Western blot after supernatant proteins precipitation. (F). Each bar represents the level of quantified protein signal normalized to albumin relative to the CTR. Statistical analysis: Student’s t-test, * p < 0.05, ** p < 0.01, *** p < 0.001, **** p < 0.0001. (G). TNFα treatment was performed in kinetic and NF-κB pathway activation was analyzed by Western blot. (H). Data are shown as the mean ± SEM of three independent experiments (N = 3). Statistical analysis: Student’s t-test, ns: non-significant, * p < 0.05.
Ijms 24 05992 g001
Figure 2. TNFα decreases HBP intracellular cholesterol level without modulating HMGCR expression. (A). Transcriptional expression of HMGCR, LDLR, LRP1 and APOE was measured by RT-qPCR. Each bar represents the level of mRNA expression normalized to the housekeeping gene GAPDH, relative to the control condition (CTR). Data are shown as the mean ± SEM of three experiments from pooled triplicates (N = 3). Statistical analysis: Student’s t-test, ns: non-significant, * p < 0.05, ** p < 0.01, *** p < 0.001, **** p < 0.0001. (B). HMGCR, LDLR, LRP1 and APOE protein level was assessed by Western blot. Among all the investigated proteins, only APOE was quantified from the supernatant and normalized to albumin. (C). Each bar represents the level of quantified protein normalized to ACTIN, relative to the CTR. Data are shown as the mean ± SEM of three independent experiments (N = 3). Statistical analysis: Student’s t-test, ns: non-significant, * p < 0.05, ** p < 0.01, *** p < 0.001, **** p < 0.0001. (D). Total intracellular cholesterol accumulations were first monitored by using radiolabeled cholesterol as mentioned in the material and methods section. Data are shown as the mean ± SEM of 25 experiments of cholesterol efflux, representing 96 biological replicates. Statistical analysis: Student’s t-test, ns: non-significant, **** p < 0.0001. (E). Quantification of total intracellular cholesterol using a cholesterol quantitation kit shows reduced cholesterol at 48 h of TNFα treatment. Each bar represents the percentage of total cholesterol relative to the CTR. Data are shown as the mean ± SEM of three independent experiments within three replicates each (N = 3; n = 9). Statistical analysis: Student’s t-test, ns: non-significant, ** p < 0.01.
Ijms 24 05992 g002
Figure 3. TNFα activates the LXR signaling pathway. (A). HBP were transfected with an LXR signal reporter assay. T0901317 was used as a positive control for LXR activation. Luminescence was measured after 1, 2, 4, 8, 16, 24, and 48 h of TNFα treatment. Each bar represents the mean ± SEM of three independent experiments within three replicates each (N = 3; n = 9). (B). Results are plotted against the control condition (CTR). Statistical analysis: Student’s t-test, ns: non-significant, * p < 0.05, ** p < 0.01, *** p < 0.001, **** p < 0.0001.
Ijms 24 05992 g003
Figure 4. TNFα treatment increases ABCA1 mRNA and protein expression and LXR inhibition alleviates TNFα-mediated ABCA1 expression. (A). Transcriptional expression of ABCA1 was measured by RT-qPCR. Each bar represents the level of mRNA expression normalized to the housekeeping gene GAPDH, relative to the control condition (CTR). Data are shown as the mean ± SEM of three experiments from pooled triplicates (N = 3). Statistical analysis: Student’s t-test, ns: non-significant, * p < 0.05, ** p < 0.01, *** p < 0.001. (B). ABCA1 protein level was assessed by Western blot. (C). Each bar represents the level of quantified ABCA1 signal normalized to ACTIN, relative to the CTR condition. Data are shown as the mean ± SEM of three independent experiments (N = 3). Statistical analysis: Student’s t-test, ns: non-significant ** p < 0.01, *** p < 0.001. (D). To inhibit LXR activation, HBP were pre-treated for 30 min with GSK2033 (1 µM) then incubated with T0901317 (10 µM) or with TNFα (10 ng/mL) for 24 and 48 h. (E). Each bar represents ABCA1 protein expression normalized to ACTIN, relative to the control condition (CTR). Data are shown as the mean ± SEM of three independent experiments (N = 3). Statistical analysis: one-way ANOVA followed by Tukey’s multiple comparison, ns: non-significant, * p < 0.05, ** p < 0.01, *** p < 0.001.
Ijms 24 05992 g004
Figure 5. Cholesterol efflux is increased after 48 h of treatment with TNFα. Radiolabeled cholesterol efflux to lipid acceptors was measured after 24 and 48 h of treatment with TNFα (10 ng/mL) during 1, 2, 4, and 8 h. Control condition (CTR) refers to the cells treated only with vehicle as described in the Materials and Methods section. HDL (50 µg/mL)-mediated cholesterol efflux is shown in (A,B). APOA-I (20 µg/mL)-mediated cholesterol efflux is shown in (C,D). Each time point represents the mean ± SEM of two independent experiments within three replicates each (N = 2; n = 6). Statistical analysis: Student’s t-test, ns: non-significant * p < 0.05, ** p < 0.01, *** p < 0.001, **** p < 0.0001.
Ijms 24 05992 g005
Figure 6. GSK2033 and Probucol partially rescued the T0901317-mediated cholesterol efflux, but not the TNFα-mediated cholesterol efflux. HBP were pre-treated for 30 min with GSK2033 (1 µM) then the LXR agonist T0901317 (10 µM) (A) was added in the supernatant for 24 h or the TNFα (10 ng/mL) (B) for 24 h and 48 h. Cholesterol efflux to lipid acceptors HDL (50 µg/mL), APOA-I (20 µg/mL), APOE2 and E4 (20 µg/mL) was then assessed during 8 h. Each bar represents the mean ± SEM of two independent experiments within four replicates each (N = 2; n = 8). Treated conditions were then compared with the control (CTR) conditions (100%). Statistical analysis: one-way ANOVA followed by Tukey’s multiple comparison test, ns: non-significant, * p < 0.05, ** p < 0.01, *** p < 0.001, **** p < 0.0001. Human brain pericytes were treated for 24 h with the LXR agonist T0901317 (10 µM) (C) and for 48 h with TNFα (10 ng/mL) (D). Cholesterol efflux to lipid acceptors HDL (50 µg/mL) and APOA-I, APOE2, APOE4 (20 µg/mL) was then assessed during 8 h in the presence or absence of the ABCA1 inhibitor, Probucol (100 µM). Each bar represents the mean ± SEM of two independent experiments within four replicates each (N = 2; n = 8). Treated conditions were then compared with the control (CTR) condition (fixed at 100%). Statistical analysis: one-way ANOVA followed by Tukey’s multiple comparison (for equal variances) and one-way ANOVA Welsh test followed by Games-Howell’s multiple comparison (for significantly different variances): ns: non-significant, * p < 0.05, ** p < 0.01, *** p < 0.001, **** p < 0.0001.
Ijms 24 05992 g006
Figure 7. TNFα increases expression of other transporters involved in lipid release. (A) Transcriptional expression of ABCG1, ABCG4, SCARB1, and ABCB1 mRNAs was monitored by RT-qPCR. Each bar represents the level of mRNA normalized to the housekeeping gene GAPDH, relative to the control condition (CTR). Data are shown as the mean ± SEM of three experiments from pooled triplicates (N = 3). (B) ABCG4, ABCB1 and SR-BI protein levels assessed by Western blot. (C) Each bar represents the level of quantified protein signal normalized to ACTIN, relative to the CTR condition. Data are shown as the mean ± SEM of three independent experiments (N = 3). Statistical analysis for (A,C): Student’s t-test, ns: non-significant, * p < 0.05, ** p < 0.01, *** p < 0.001.
Ijms 24 05992 g007
Figure 8. SR-BI and ABCB1 are not involved in TNFα mediated cholesterol efflux from HBP. After 48 h of incubation with TNFα (10 ng/mL), cholesterol efflux to lipid acceptors HDL (50 µg/mL) and APOA-I (20 µg/mL) was assessed during 8 h in the presence or absence of elacridar (10 µM) or verapamil (50 µM) to inhibit ABCB1 (A) or BLT-1 (10 µM) to inhibit SR-BI (B). Each bar represents the mean ± SEM of two independent experiments within four replicates each (N = 2; n = 8). Control condition (CTR) was only treated with vehicle. Statistical analysis: one-way ANOVA followed by Tukey’s multiple comparison (for equal variances) and one-way ANOVA Welsh test followed by Games-Howell’s multiple comparison (for significantly different variances) ns: non-significant, ** p < 0.01, *** p < 0.001, **** p < 0.0001.
Ijms 24 05992 g008
Figure 9. TNFα increases ABCB1 function in HBP. Rhodamine 123 (Rh 123) is an ABCB1 substrate and its efflux is monitored in real time during 1 h in TNFα-treated HBP for 24 h (A) and 48 h (B). Efflux rate (Kout) of rhodamine 123 was measured in the absence or presence of ABCB1 inhibitors and calculated as described in the Materials and Methods section (C,D). Kout for control (CTR) condition was fixed at 100% and relative Kout of each condition was calculated (CTR 24 h: 42.36 RFU/min ± 0.92; CTR 48 h: 43.95 RFU/min ± 2.22). Each bar represents the mean ± SEM of two independent experiments within eight replicates each (N = 2; n = 16). Statistical analysis: one-way ANOVA followed by Tukey’s multiple comparison: ns: non-significant, **** p < 0.0001.
Ijms 24 05992 g009
Figure 10. TNFα induces an LXR/ABCA1 independent cholesterol efflux. In HBP, T0901317 (LXR agonist) activates the LXR pathway which upregulates ABCA1 gene and protein expression. Consequently, the reverse cholesterol transport (RCT) mediated by ABCA1 is increased (1). However, LXR pathway inhibition via the antagonist GSK2033, suppress ABCA1 expression and consequently inhibits the T0901317-ABCA1-mediated cholesterol efflux (2). The same effect was reported using Probucol, the ABCA1 inhibitor (2). Under inflammatory stimulation, TNFα activates the NF-κB pathway and the LXR pathway (3). As in the T0901317 case, activation of the LXR pathway upregulates ABCA1 and correlates with an increased cholesterol efflux (3). Contrary to the T0901317’s case, neither LXR inhibition with GSK2033, nor ABCA1 inhibition with Probucol, were able to suppress the TNFα-induced cholesterol efflux, suggesting that this efflux is LXR/ABCA1-independent. The TNFα-induced cholesterol efflux is possibly related to another transporter not identified in our study or to a passive transport, a direct lipid exchange between the plasma membrane and the cell surrounding lipid acceptors. In parallel, TNFα stimulation upregulates ABCB1 gene and protein expression (3). The activity of this protein is increased, and, consequently, HBP protection against xenobiotics is improved (3). Thus, TNFα induces an LXR/ABCA1-independent cholesterol efflux and xenobiotics efflux in HBP, shedding light on the possible role of pericytes in diseases progression.
Ijms 24 05992 g010
Table 1. Primers sequences for qPCR. Primer pairs: F: forward primer and R: reverse primer.
TargetSequence (F/R)Accession Number
ABCA1F: CAGTGCTTCCTGATTAGCACAC
R: AGGCTAGCGAAGATCTTGGTG
NM_005502.4
ABCB1F: CAGACAGCAGCTGACAGTCCAAGAACAGGACT
R: GCCTGGCAGCTGGAAGACAAATACACAAAATT
NM_001348945.2
ABCG4F: GGACATAGAGTTCGTGGAGC
R: GGTCTTATAACCCCTTTTGCGCC
NM_001348191.2
SCARB1F: ATCCCCTTCTATCTCTCCGTCT
R: GTCGTTGTTGTTGAAGGTGATG
NM_001367988.1
HMGCRF: TGTGTGTGGGACCGTAATGG
R: GCTGTCTTCTTGGTGCAAGC
NM_001130996.2
APOEF: GGTCGCTTTTGGGATTACCT
R: CCTTCAACTCCTTCATGGTCTC
NM_001302690.2
LDLRF: TTCATGGCTTCATGTACTGGAC
R: TTTTCAGTCACCAGCGAGTAGA
NM_000527.5
LRP1F: AATGAGTGTCTCAGCCGCAA
R: AACGGTTCCTCGTCAGTCAC
NM_002332.3
MYLIPF: TATGTGACGAGGCCGGACG
R: TGATTCCCAGTCGCCTGCAC
NM_013262.4
NR1H3
(LXRα)
F: CAGGGCCATGAATGAGCTGC
R: TGTGCTGCAGCCTCTCTACC
NM_005693.4
NR1H2
(LXRβ)
F: TCCTACCACGAGTTCCCTGG
R: TGGTTCCTCTTCGGGATCTGG
NM_007121.7
TNFRSF1A
(TNFR1)
F: ACAAGCCACAGAGCCTAGACACTG
R: ACGAATTCCTTCCAGCGCAACG
NM_001065.4
TNFRSF1B
(TNFR2)
F: TCTCCAACACGACTTCATCCACGG
R: AGACTGCATCCATGCTTGCATTCC
NM_001066.3
GAPDHF: GATGACATCAAGAAGGTGGTGA
R: GCTGTTGAAGTCAGAGGAGACC
NM_001357943.2
Table 2. Western blot antibody details. Summary of primary antibodies used for Western blots.
TargetkDaReferenceSupplierConditionsDilution
ABCA1254ab18180Abcamnon-heated/reduced1:1000
ABCB1 (P-gp)180GTX23364Genetexheated/reduced1:500
ABCG2 (BCRP)72Ab207732Abcamnon-heated/reduced1:1000
ABCG4100PA5-34855Invitrogenheated/reduced1:1000
SR-BI80ab52629Abcamheated/reduced1:1000
HMGCR100Mab90619Sigmanon-heated/reduced1:1000
LRP180sc57351Santa Cruzheated/reduced1:500
LDLR140ab52818Abcamheated/reduced1:1000
APOE34ab1906Abcamheated/reduced1:1000
COX270NBD100-689SSNovusheated/reduced1:1000
NLRP3118ab263899Abcamheated/reduced1:1000
VCAM190–100ab134047Abcamheated/reduced1:1000
IL-622–28NBD600-1131SSNovusheated/reduced1:1000
PhosphoNF-κB66–75Mab72261R&Dheated/reduced1:1000
NF-κB66–75ab32536Abcamheated/reduced1:1000
ACTIN42A5441Sigmaheated/reduced1:10,000
Disclaimer/Publisher’s Note: The statements, opinions and data contained in all publications are solely those of the individual author(s) and contributor(s) and not of MDPI and/or the editor(s). MDPI and/or the editor(s) disclaim responsibility for any injury to people or property resulting from any ideas, methods, instructions or products referred to in the content.

