
Extracellular Vesicles of COVID-19 Patients Reflect Inflammation, Thrombogenicity, and Disease Severity
Abstract
:1. Introduction
2. Results
2.1. Patient Characteristics
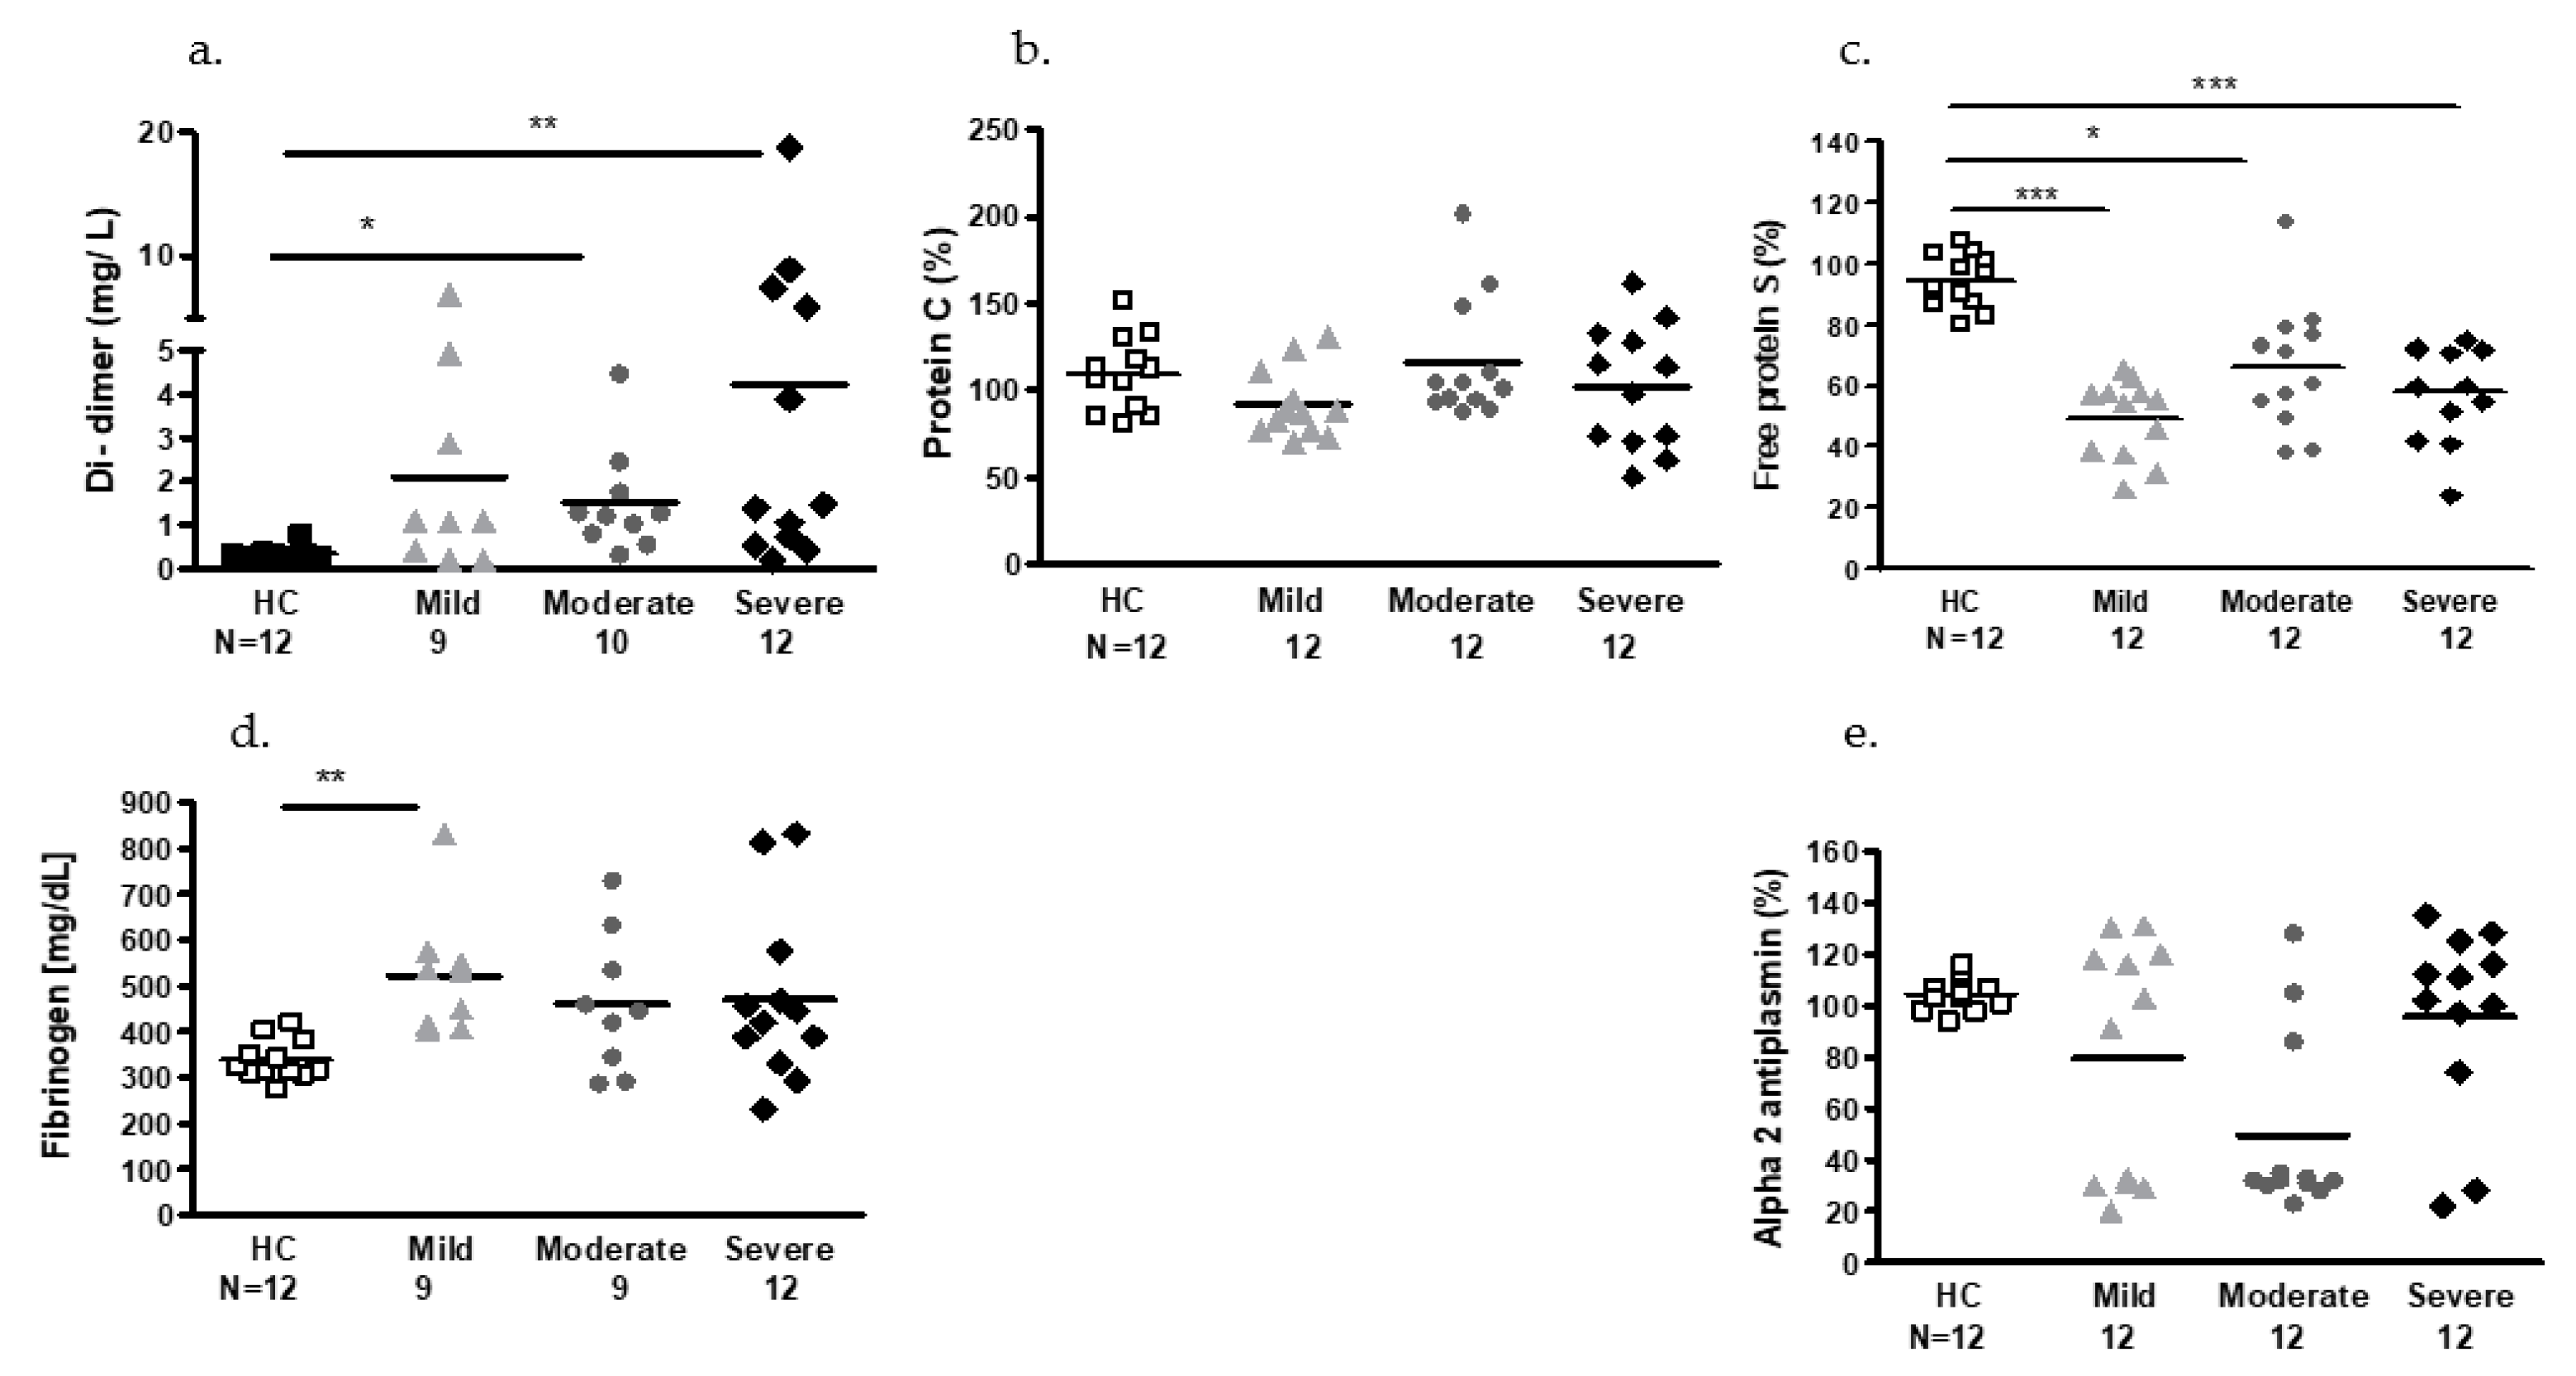
2.2. Plasmatic Hemostatic Factors
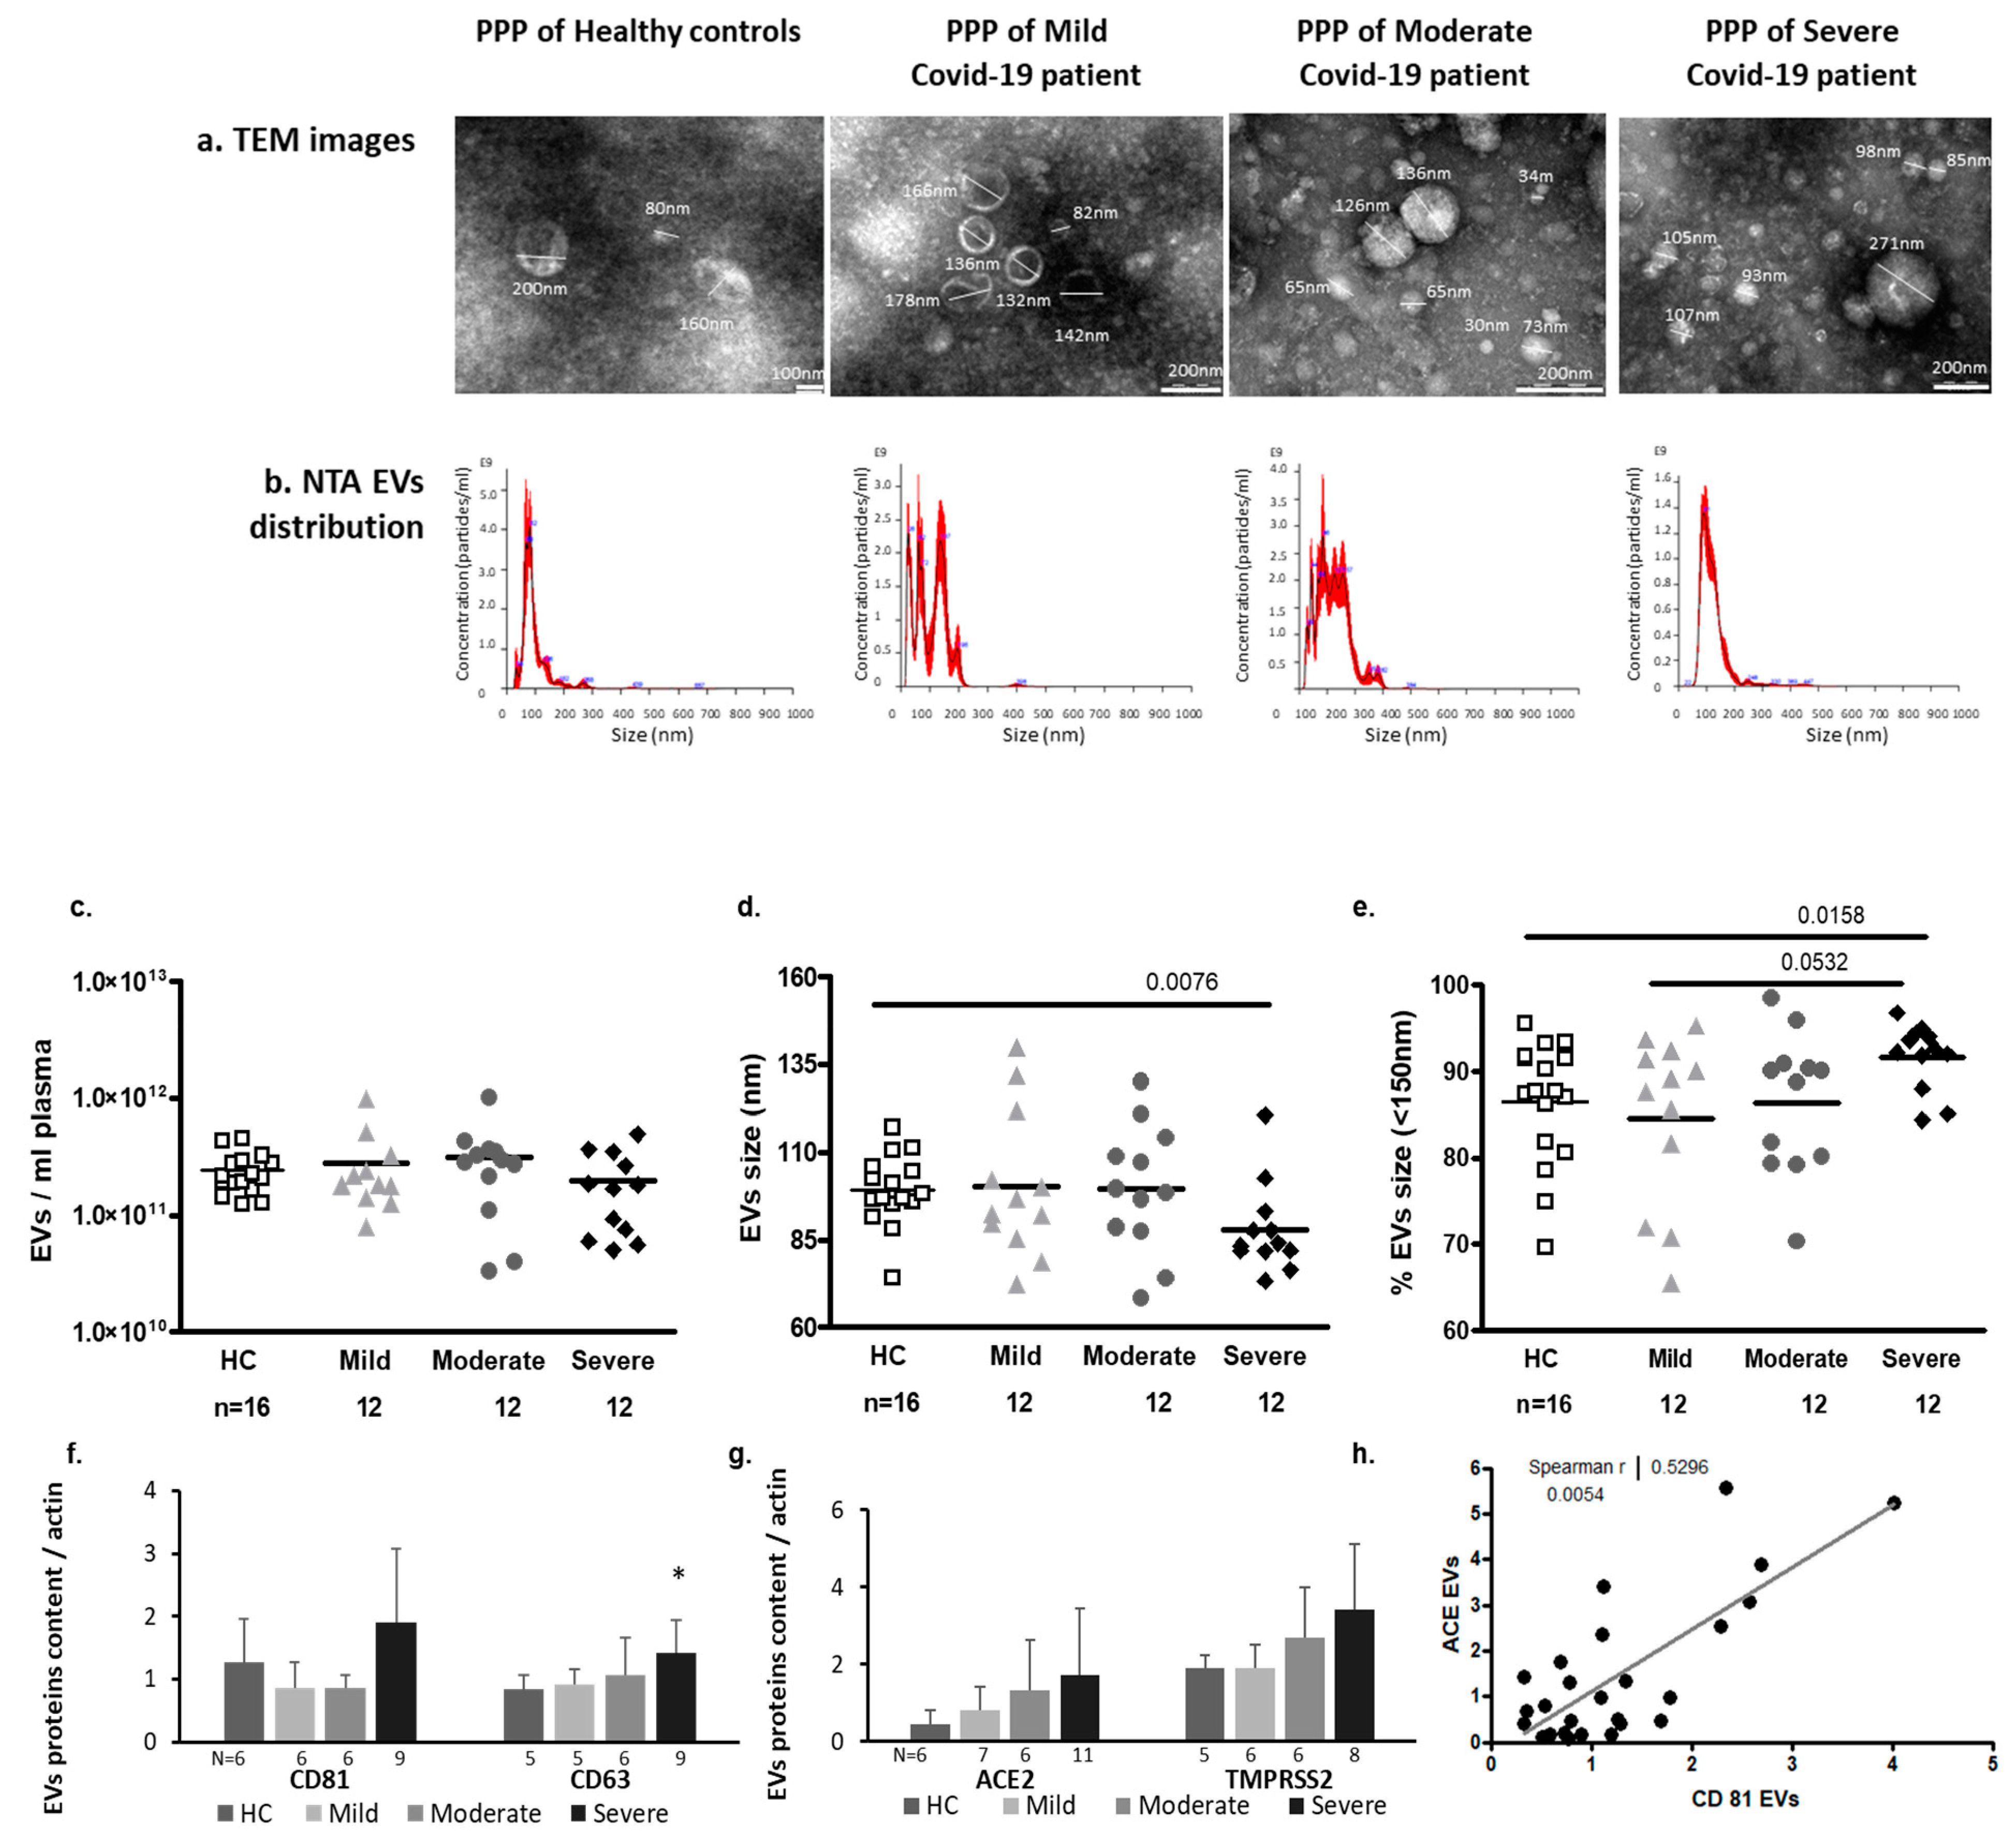
2.3. EV Characteristics
2.3.1. EV Size and Exosome Markers
2.3.2. SARS-CoV2 Entrance Proteins ACE2 and TMPRSS2 Expression in EVs
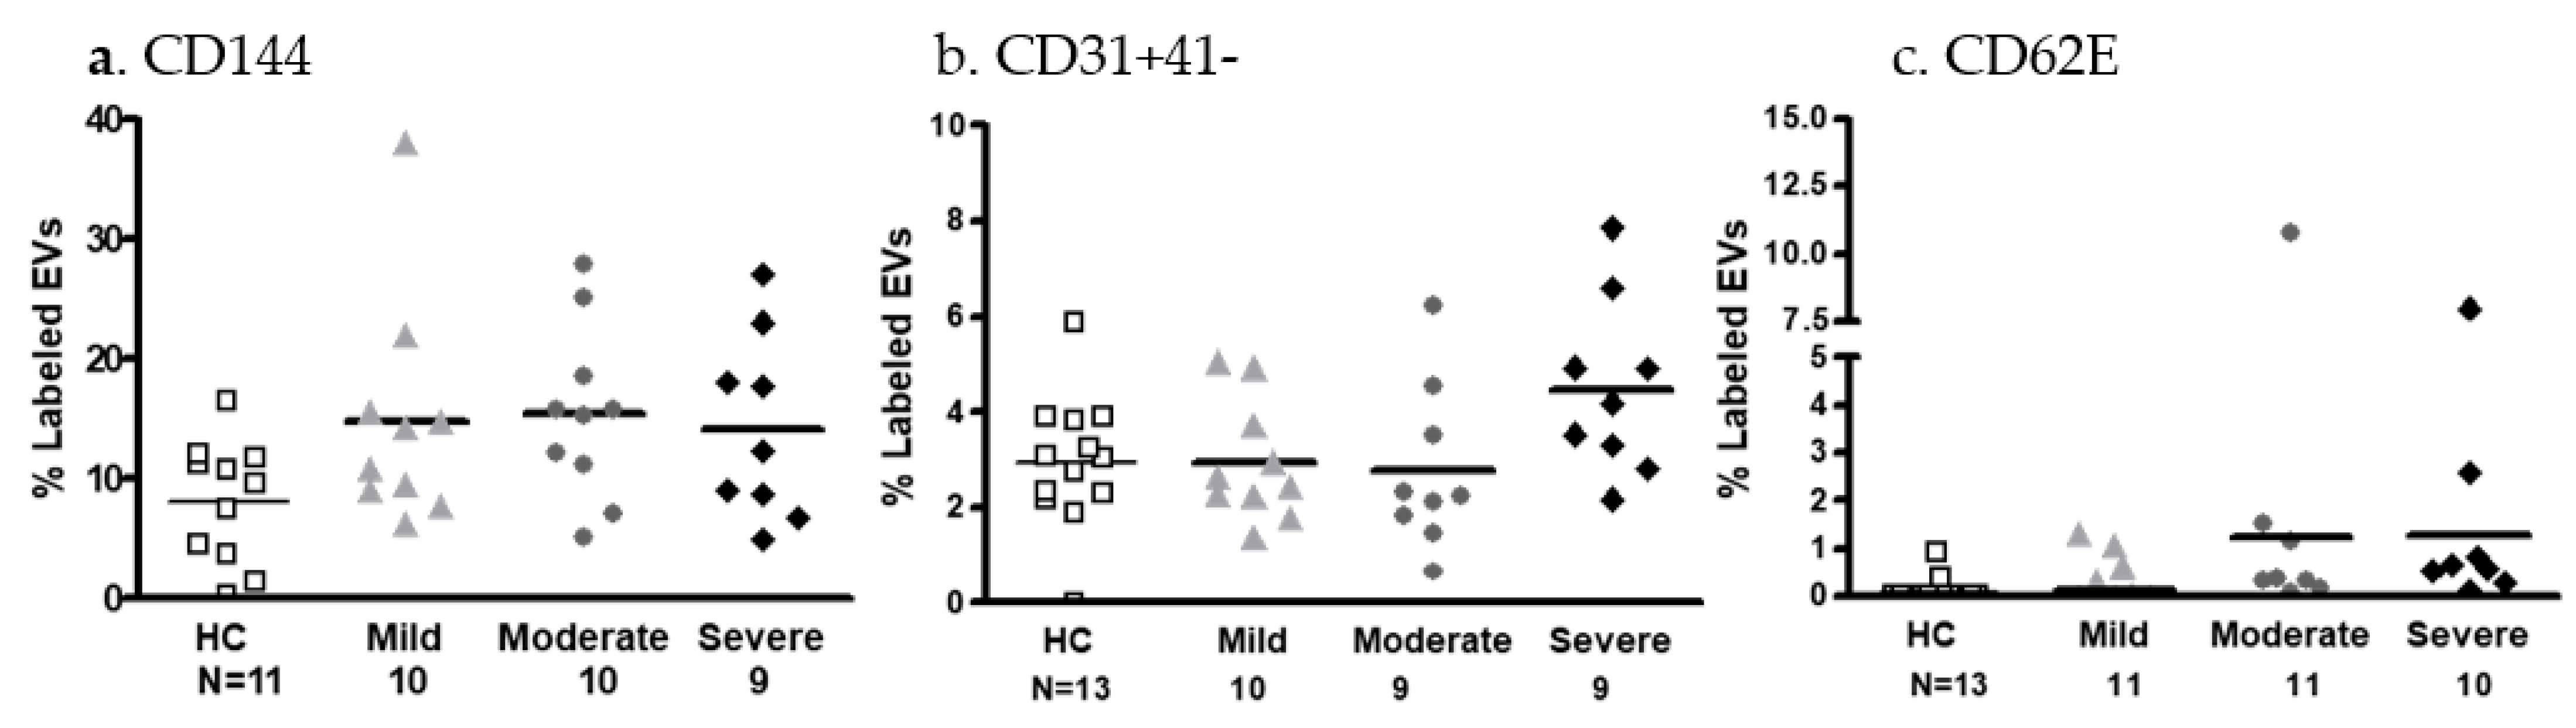
2.3.3. EV Membrane Antigen Expression
- Endothelial cell markers
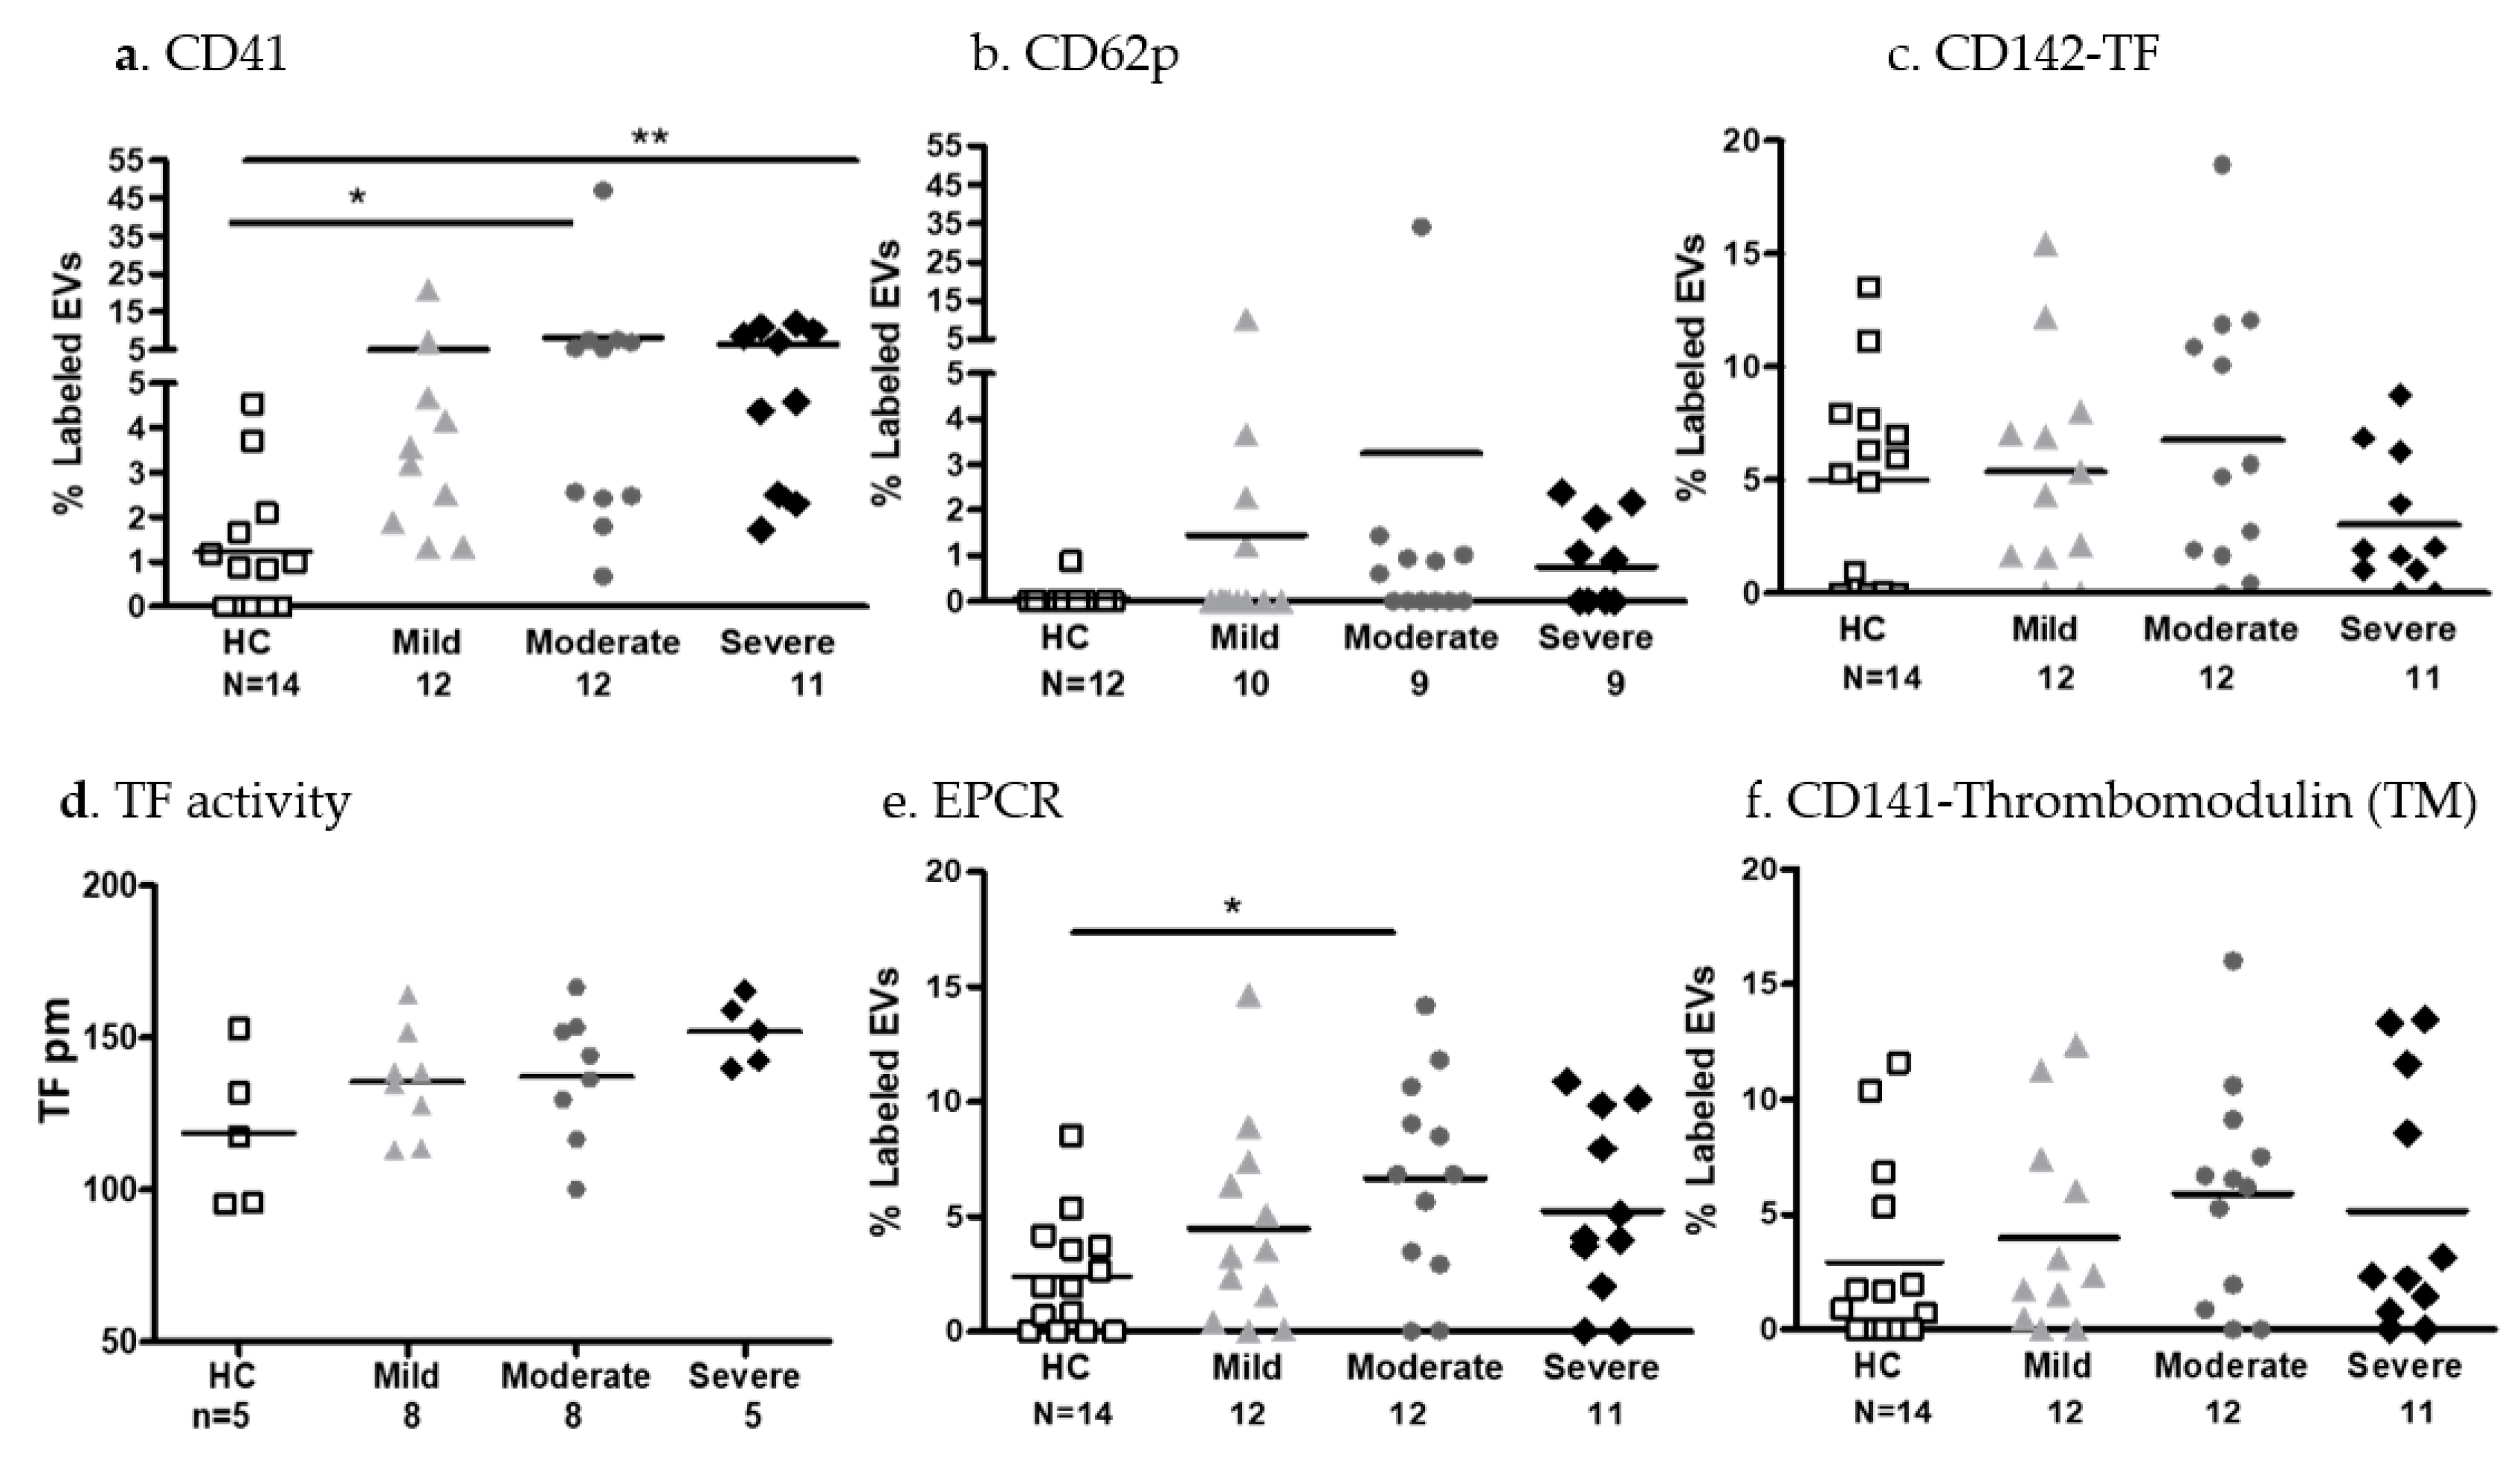
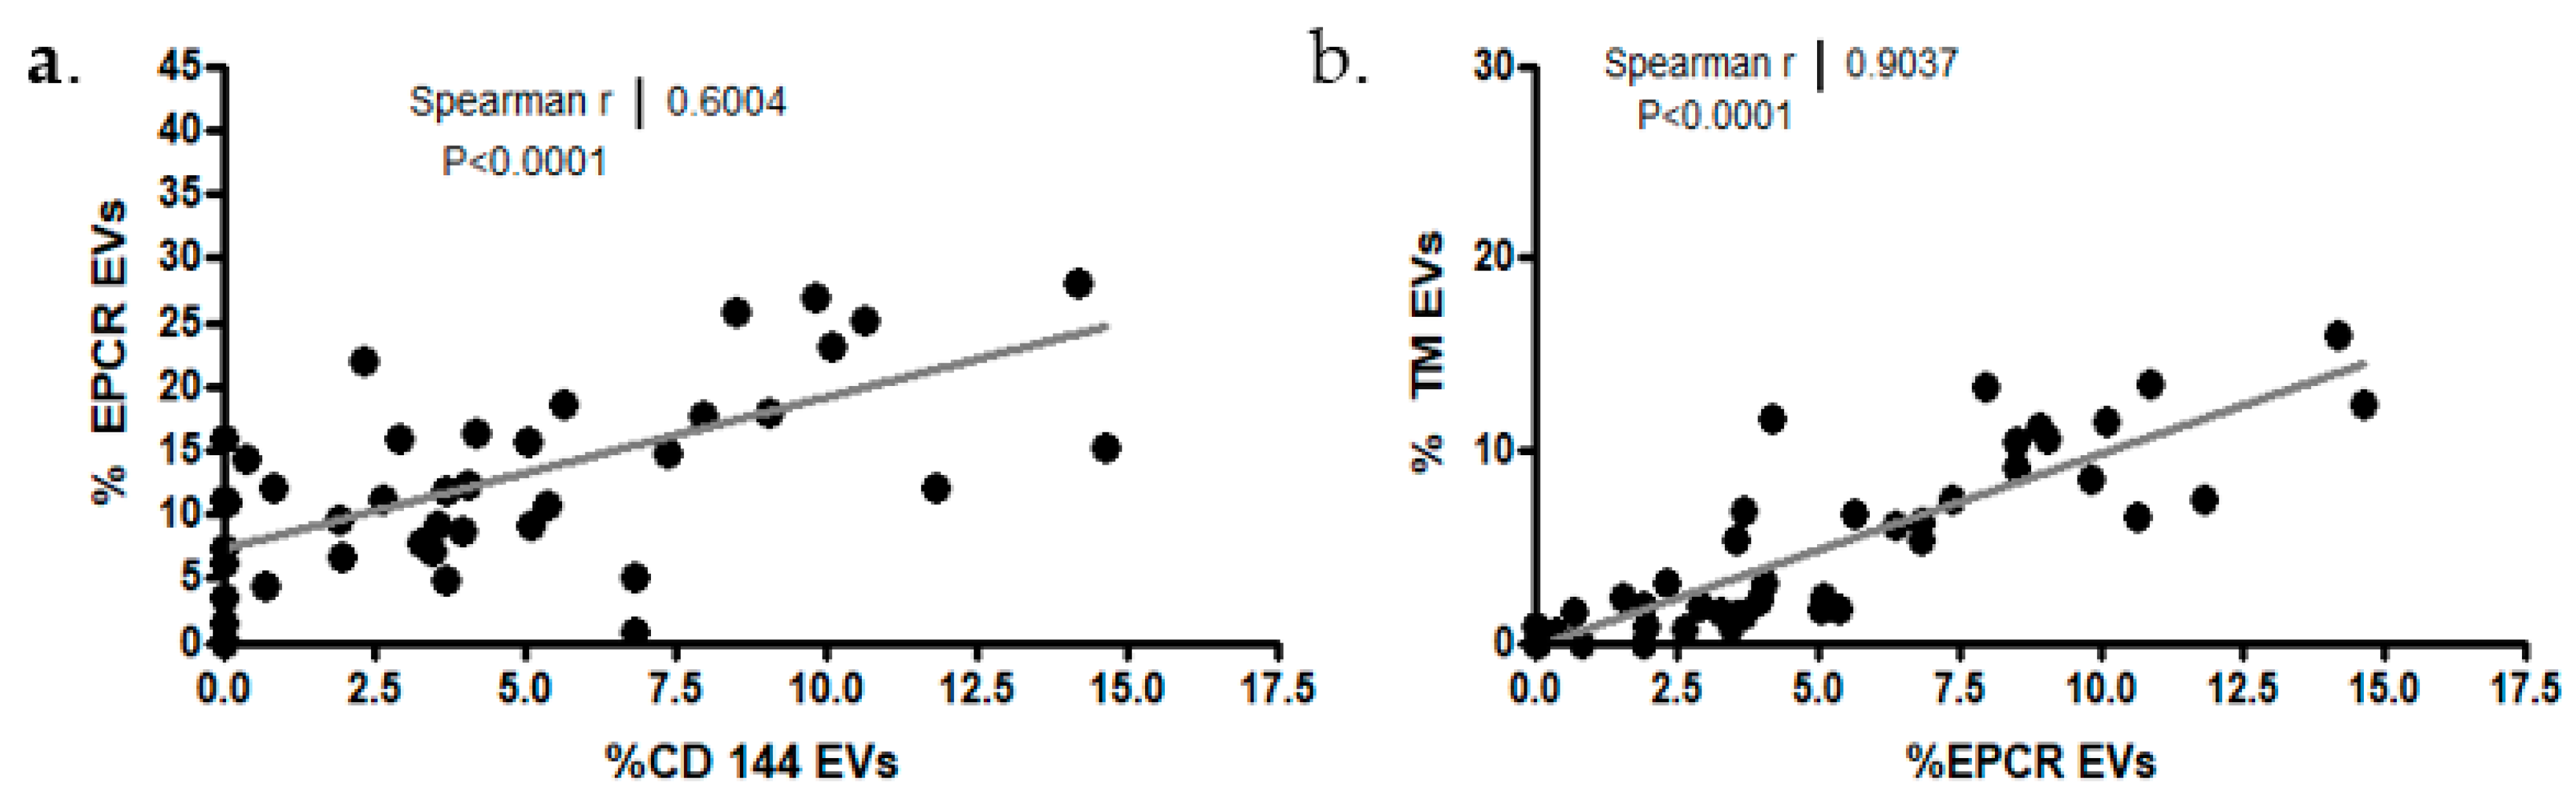
- EV platelet markers and coagulation factors
2.3.4. EV Immune Cell Markers and Cytokine Content
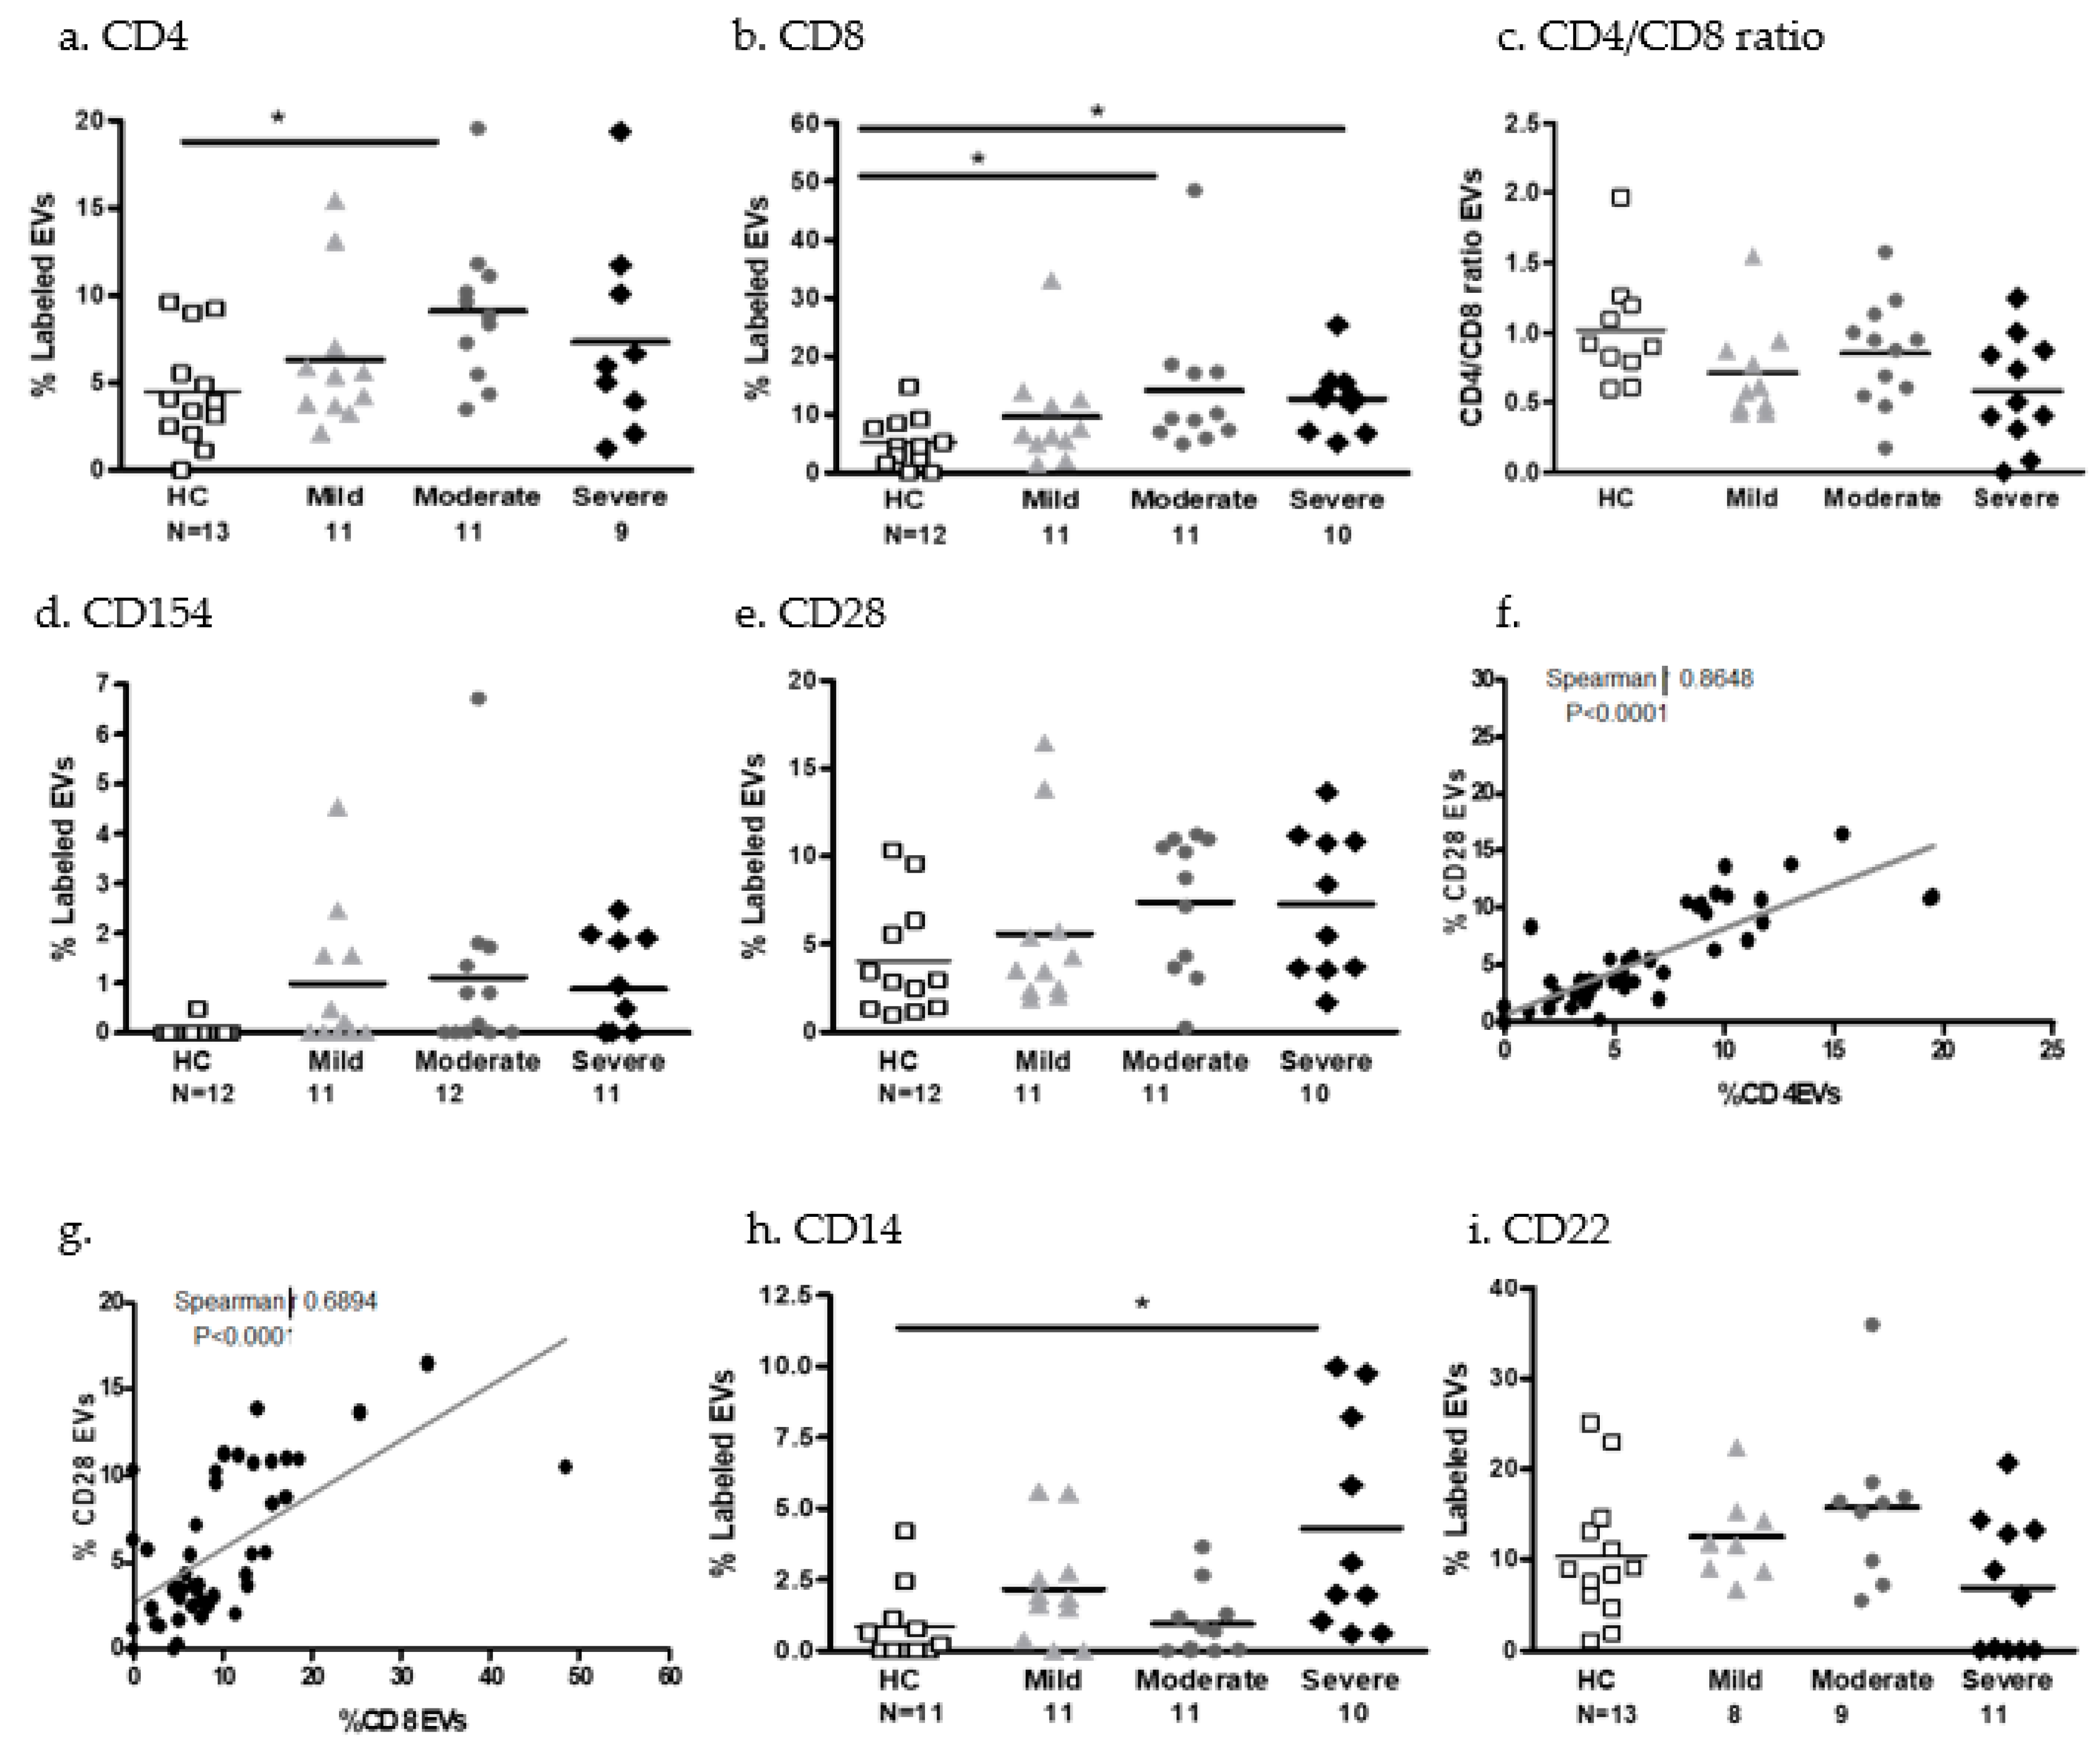
- EV immune cell markers
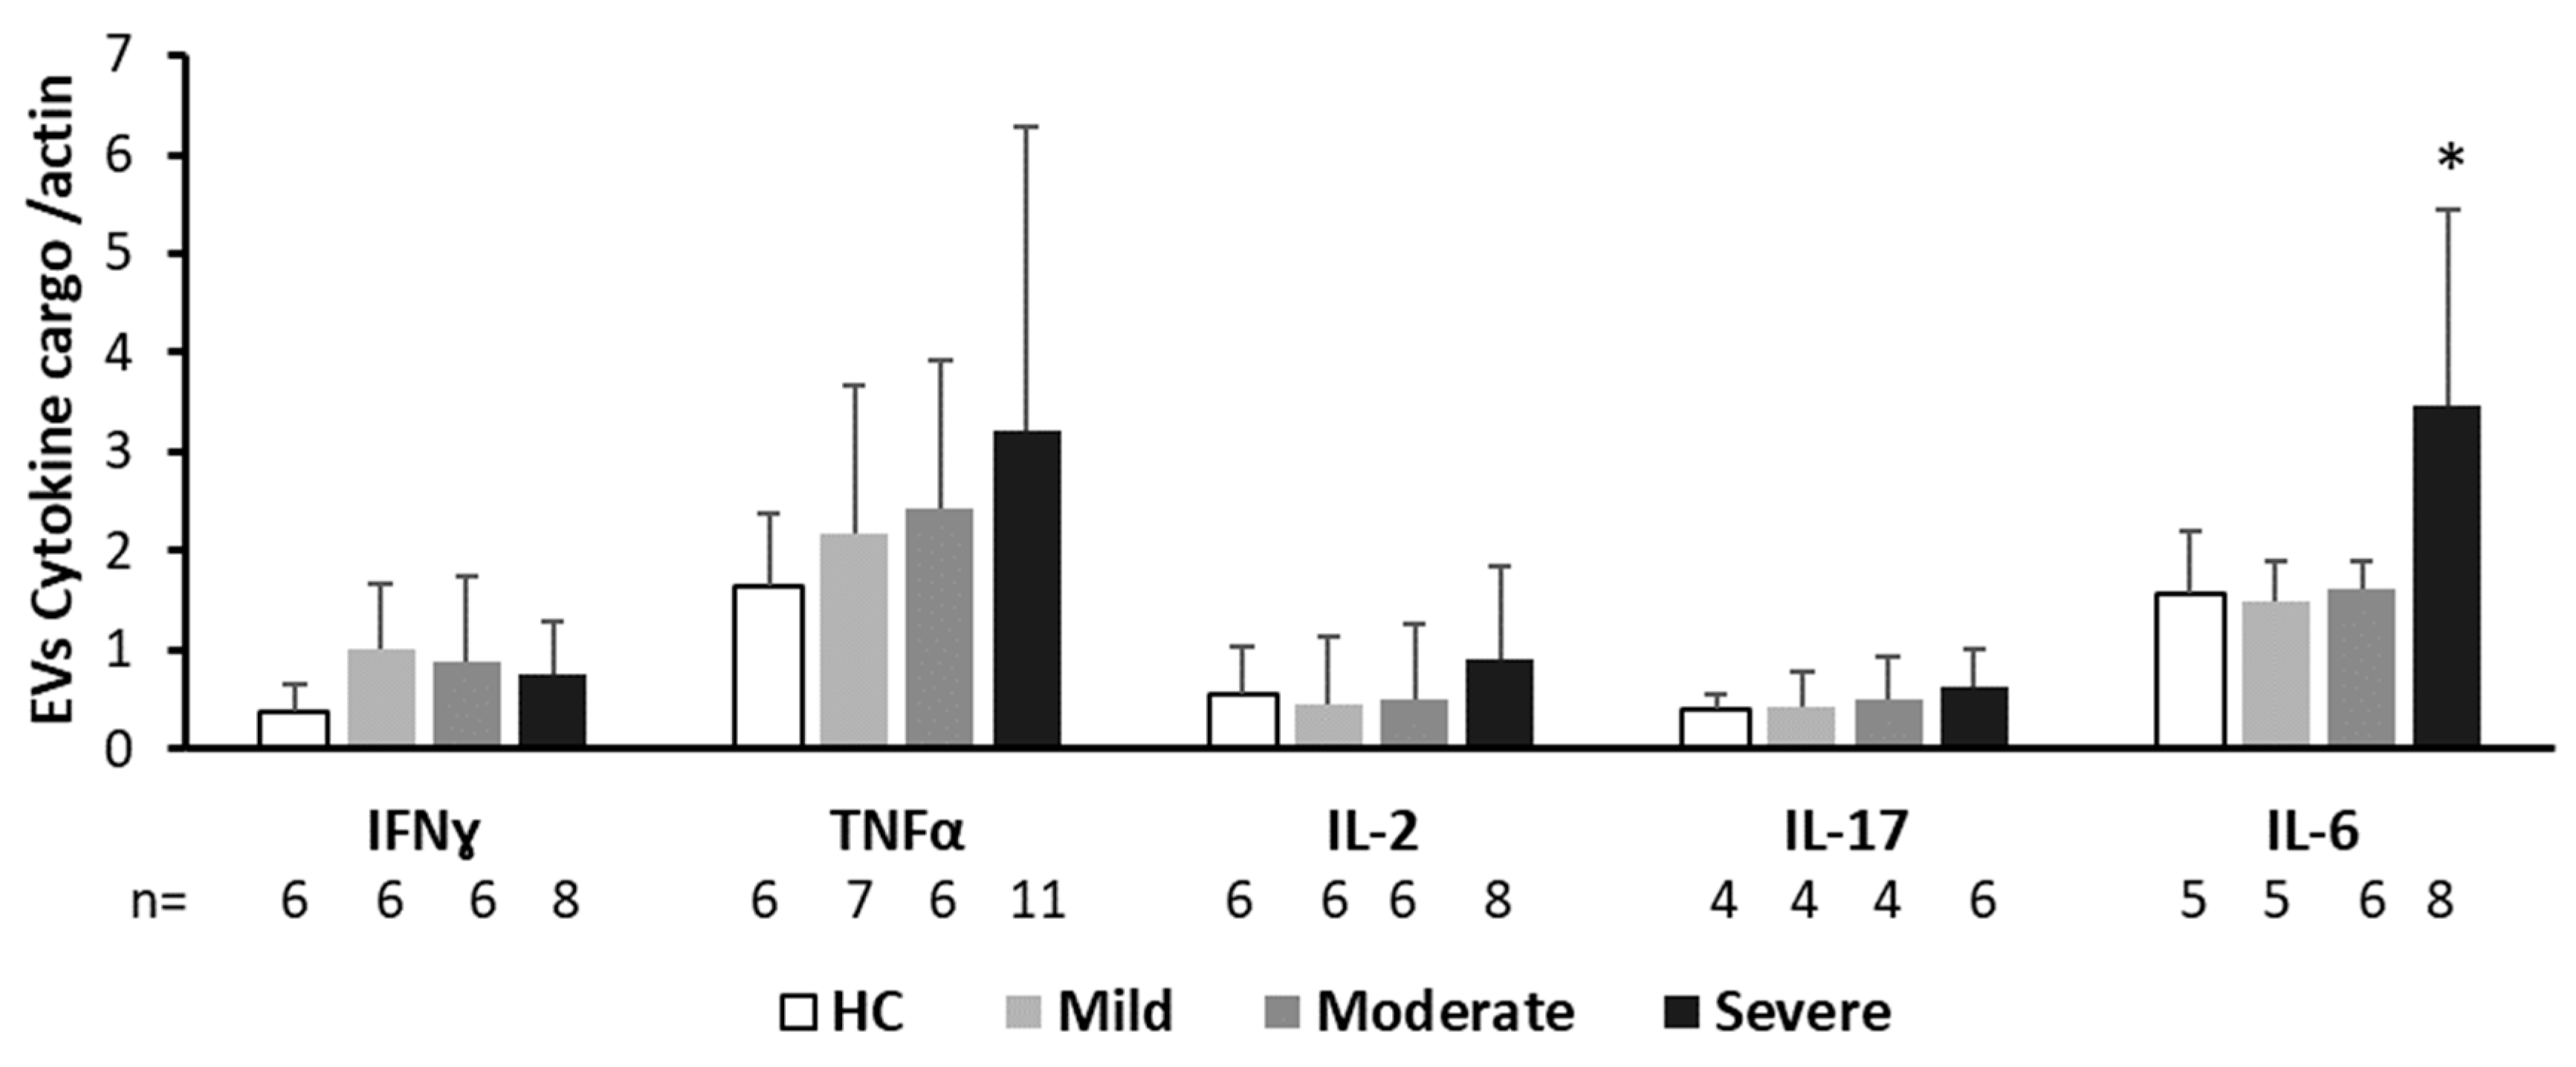
- EV cytokine cargo
3. Discussion
3.1. EV and Thrombogenicity, Inflammation, and Fibrinolysis
3.2. Immune Cell EVs and Cytokine Cargo
4. Materials and Methods
4.1. Patient Acquisition
4.1.1. Patient Population
4.1.2. Blood Tests
4.2. EV Isolation and Characterization
4.3. Statistics
5. Conclusions
Supplementary Materials
Author Contributions
Funding
Institutional Review Board Statement
Informed Consent Statement
Data Availability Statement
Acknowledgments
Conflicts of Interest
References
- Koelle, K.; Martin, M.A.; Antia, R.; Lopman, B.; Dean, N.E. The changing epidemiology of SARS-CoV-2. Science 2022, 375, 1116–1121. [Google Scholar] [CrossRef] [PubMed]
- Xu, W.; Sun, N.N.; Gao, H.N.; Chen, Z.Y.; Yang, Y.; Ju, B.; Tang, L.L. Risk factors analysis of COVID-19 patients with ARDS and prediction based on machine learning. Sci. Rep. 2021, 11, 2933. [Google Scholar] [CrossRef]
- Merad, M.; Martin, J.C. Author Correction: Pathological inflammation in patients with COVID-19: A key role for monocytes and macrophages. Nat. Rev. Immunol. 2020, 20, 448. [Google Scholar] [CrossRef] [PubMed]
- Gunst, J.D.; Staerke, N.B.; Pahus, M.H.; Kristensen, L.H.; Bodilsen, J.; Lohse, N.; Dalgaard, L.S.; Bronnum, D.; Frobert, O.; Honge, B.; et al. Efficacy of the TMPRSS2 inhibitor camostat mesilate in patients hospitalized with Covid-19-a double-blind randomized controlled trial. EClinicalMedicine 2021, 35, 100849. [Google Scholar] [CrossRef] [PubMed]
- Abhinand, C.S.; Nair, A.S.; Krishnamurthy, A.; Oommen, O.V.; Sudhakaran, P.R. Potential protease inhibitors and their combinations to block SARS-CoV-2. J. Biomol. Struct. Dyn. 2022, 40, 903–917. [Google Scholar] [CrossRef] [PubMed]
- Samavati, L.; Uhal, B.D. ACE2, Much More Than Just a Receptor for SARS-COV-2. Front. Cell. Infect. Microbiol. 2020, 10, 317. [Google Scholar] [CrossRef] [PubMed]
- Bikdeli, B.; Madhavan, M.V.; Jimenez, D.; Chuich, T.; Dreyfus, I.; Driggin, E.; Nigoghossian, C.; Ageno, W.; Madjid, M.; Guo, Y.; et al. COVID-19 and Thrombotic or Thromboembolic Disease: Implications for Prevention, Antithrombotic Therapy, and Follow-Up: JACC State-of-the-Art Review. J. Am. Coll. Cardiol. 2020, 75, 2950–2973. [Google Scholar] [CrossRef]
- Rostami, M.; Mansouritorghabeh, H. D-dimer level in COVID-19 infection: A systematic review. Expert Rev. Hematol. 2020, 13, 1265–1275. [Google Scholar] [CrossRef]
- Jacob, G.; Aharon, A.; Brenner, B. COVID-19-Associated Hyper-Fibrinolysis: Mechanism and Implementations. Front. Physiol. 2020, 11, 596057. [Google Scholar] [CrossRef]
- Kooijmans, S.A.A.; de Jong, O.G.; Schiffelers, R.M. Exploring interactions between extracellular vesicles and cells for innovative drug delivery system design. Adv. Drug Deliv. Rev. 2021, 173, 252–278. [Google Scholar] [CrossRef]
- Alberro, A.; Iparraguirre, L.; Fernandes, A.; Otaegui, D. Extracellular Vesicles in Blood: Sources, Effects, and Applications. Int. J. Mol. Sci. 2021, 22, 8163. [Google Scholar] [CrossRef] [PubMed]
- Dickhout, A.; Koenen, R.R. Extracellular Vesicles as Biomarkers in Cardiovascular Disease; Chances and Risks. Front. Cardiovasc. Med. 2018, 5, 113. [Google Scholar] [CrossRef] [PubMed]
- Shomer, E.; Katzenell, S.; Zipori, Y.; Sammour, R.N.; Isermann, B.; Brenner, B.; Aharon, A. Microvesicles of women with gestational hypertension and preeclampsia affect human trophoblast fate and endothelial function. Hypertension 2013, 62, 893–898. [Google Scholar] [CrossRef] [PubMed] [Green Version]
- Aharon, A.; Horn, G.; Bar-Lev, T.H.; Zagagi Yohay, E.; Waks, T.; Levin, M.; Deshet Unger, N.; Avivi, I.; Globerson Levin, A. Extracellular Vesicles Derived from Chimeric Antigen Receptor-T Cells: A Potential Therapy for Cancer. Hum. Gene Ther. 2021, 32, 1224–1241. [Google Scholar] [CrossRef] [PubMed]
- Aharon, A.; Sabbah, A.; Ben-Shaul, S.; Berkovich, H.; Loven, D.; Brenner, B.; Bar-Sela, G. Chemotherapy administration to breast cancer patients affects extracellular vesicles thrombogenicity and function. Oncotarget 2017, 8, 63265–63280. [Google Scholar] [CrossRef] [Green Version]
- Hisada, Y.; Mackman, N. Cancer cell-derived tissue factor-positive extracellular vesicles: Biomarkers of thrombosis and survival. Curr. Opin. Hematol. 2019, 26, 349–356. [Google Scholar] [CrossRef] [PubMed]
- Aiello, A.; Giannessi, F.; Percario, Z.A.; Affabris, E. An emerging interplay between extracellular vesicles and cytokines. Cytokine Growth Factor Rev. 2020, 51, 49–60. [Google Scholar] [CrossRef]
- Avisar, A.; Cohen, M.; Brenner, B.; Bronshtein, T.; Machluf, M.; Bar-Sela, G.; Aharon, A. Extracellular Vesicles Reflect the Efficacy of Wheatgrass Juice Supplement in Colon Cancer Patients During Adjuvant Chemotherapy. Front. Oncol. 2020, 10, 1659. [Google Scholar] [CrossRef]
- Tsimerman, G.; Roguin, A.; Bachar, A.; Melamed, E.; Brenner, B.; Aharon, A. Involvement of microparticles in diabetic vascular complications. Thromb. Haemost. 2011, 106, 310–321. [Google Scholar] [CrossRef]
- Aharon, A.; Spector, P.; Ahmad, R.S.; Horrany, N.; Sabbach, A.; Brenner, B.; Aharon-Peretz, J. Extracellular Vesicles of Alzheimer’s Disease Patients as a Biomarker for Disease Progression. Mol. Neurobiol. 2020, 57, 4156–4169. [Google Scholar] [CrossRef]
- Tzoran, I.; Rebibo-Sabbah, A.; Brenner, B.; Aharon, A. Disease dynamics in patients with acute myeloid leukemia: New biomarkers. Exp. Hematol. 2015, 43, 936–943. [Google Scholar] [CrossRef] [PubMed]
- Xia, X.; Yuan, P.; Liu, Y.; Wang, Y.; Cao, W.; Zheng, J.C. Emerging roles of extracellular vesicles in COVID-19, a double-edged sword? Immunology 2021, 163, 416–430. [Google Scholar] [CrossRef] [PubMed]
- Kerviel, A.; Zhang, M.; Altan-Bonnet, N. A New Infectious Unit: Extracellular Vesicles Carrying Virus Populations. Annu. Rev. Cell Dev. Biol. 2021, 37, 171–197. [Google Scholar] [CrossRef]
- Xia, X.; Wang, Y.; Zheng, J.C. Emerging roles of extracellular vesicles in mediating RNA virus infection. Fundam. Res. 2021, 1, 179–185. [Google Scholar] [CrossRef]
- Caillon, A.; Trimaille, A.; Favre, J.; Jesel, L.; Morel, O.; Kauffenstein, G. Role of neutrophils, platelets, and extracellular vesicles and their interactions in COVID-19-associated thrombopathy. J. Thromb. Haemost. 2022, 20, 17–31. [Google Scholar] [CrossRef] [PubMed]
- Zaid, Y.; Puhm, F.; Allaeys, I.; Naya, A.; Oudghiri, M.; Khalki, L.; Limami, Y.; Zaid, N.; Sadki, K.; Ben El Haj, R.; et al. Platelets Can Associate with SARS-Cov-2 RNA and Are Hyperactivated in COVID-19. Circ. Res. 2020, 127, 1404–1418. [Google Scholar] [CrossRef]
- Gurunathan, S.; Kang, M.H.; Kim, J.H. Diverse Effects of Exosomes on COVID-19: A Perspective of Progress From Transmission to Therapeutic Developments. Front. Immunol. 2021, 12, 716407. [Google Scholar] [CrossRef]
- Pillalamarri, N.; Abdullah; Ren, G.; Khan, L.; Ullah, A.; Jonnakuti, S.; Ullah, M. Exploring the utility of extracellular vesicles in ameliorating viral infection-associated inflammation, cytokine storm and tissue damage. Transl. Oncol. 2021, 14, 101095. [Google Scholar] [CrossRef]
- Masoud, M.; Sarig, G.; Brenner, B.; Jacob, G. Orthostatic hypercoagulability: A novel physiological mechanism to activate the coagulation system. Hypertension 2008, 51, 1545–1551. [Google Scholar] [CrossRef] [Green Version]
- Catenacci, V.; Sheikh, F.; Patel, K.; Fox-Robichaud, A.E. The prognostic utility of protein C as a biomarker for adult sepsis: A systematic review and meta-analysis. Crit. Care 2022, 26, 21. [Google Scholar] [CrossRef]
- Krishnamachary, B.; Cook, C.; Spikes, L.; Chalise, P.; Dhillon, N.K. The Potential Role of Extracellular Vesicles in COVID-19 Associated Endothelial injury and Pro-inflammation. Medrxiv Prepr. Serv. Health Sci. 2020. [Google Scholar] [CrossRef]
- Krishnamachary, B.; Cook, C.; Kumar, A.; Spikes, L.; Chalise, P.; Dhillon, N.K. Extracellular vesicle-mediated endothelial apoptosis and EV-associated proteins correlate with COVID-19 disease severity. J. Extracell. Vesicles 2021, 10, e12117. [Google Scholar] [CrossRef]
- Guervilly, C.; Bonifay, A.; Burtey, S.; Sabatier, F.; Cauchois, R.; Abdili, E.; Arnaud, L.; Lano, G.; Pietri, L.; Robert, T.; et al. Dissemination of extreme levels of extracellular vesicles: Tissue factor activity in patients with severe COVID-19. Blood Adv. 2021, 5, 628–634. [Google Scholar] [CrossRef] [PubMed]
- Campello, E.; Radu, C.M.; Simion, C.; Spiezia, L.; Bulato, C.; Gavasso, S.; Tormene, D.; Perin, N.; Turatti, G.; Simioni, P. Longitudinal Trend of Plasma Concentrations of Extracellular Vesicles in Patients Hospitalized for COVID-19. Front. Cell Dev. Biol. 2021, 9, 770463. [Google Scholar] [CrossRef] [PubMed]
- El-Shennawy, L.; Hoffmann, A.D.; Dashzeveg, N.K.; McAndrews, K.M.; Mehl, P.J.; Cornish, D.; Yu, Z.; Tokars, V.L.; Nicolaescu, V.; Tomatsidou, A.; et al. Circulating ACE2-expressing extracellular vesicles block broad strains of SARS-CoV-2. Nat. Commun. 2022, 13, 405. [Google Scholar] [CrossRef] [PubMed]
- Saad, M.H.; Badierah, R.; Redwan, E.M.; El-Fakharany, E.M. A Comprehensive Insight into the Role of Exosomes in Viral Infection: Dual Faces Bearing Different Functions. Pharmaceutics 2021, 13, 1405. [Google Scholar] [CrossRef]
- Hoffmann, M.; Kleine-Weber, H.; Schroeder, S.; Kruger, N.; Herrler, T.; Erichsen, S.; Schiergens, T.S.; Herrler, G.; Wu, N.H.; Nitsche, A.; et al. SARS-CoV-2 Cell Entry Depends on ACE2 and TMPRSS2 and Is Blocked by a Clinically Proven Protease Inhibitor. Cell 2020, 181, 271–280.e8. [Google Scholar] [CrossRef]
- Nolte-‘t Hoen, E.; Cremer, T.; Gallo, R.C.; Margolis, L.B. Extracellular vesicles and viruses: Are they close relatives? Proc. Natl. Acad. Sci. USA 2016, 113, 9155–9161. [Google Scholar] [CrossRef] [Green Version]
- Canzano, P.; Brambilla, M.; Porro, B.; Cosentino, N.; Tortorici, E.; Vicini, S.; Poggio, P.; Cascella, A.; Pengo, M.F.; Veglia, F.; et al. Platelet and Endothelial Activation as Potential Mechanisms Behind the Thrombotic Complications of COVID-19 Patients. JACC Basic Transl. Sci. 2021, 6, 202–218. [Google Scholar] [CrossRef]
- Ducros, E.; Mirshahi, S.S.; Faussat, A.M.; Mirshahi, P.; Dimicoli, S.; Tang, R.; Pardo, J.; Ibrahim, J.; Marie, J.P.; Therwath, A.; et al. Soluble endothelial protein C receptor (sEPCR) is likely a biomarker of cancer-associated hypercoagulability in human hematologic malignancies. Cancer Med. 2012, 1, 261–267. [Google Scholar] [CrossRef]
- Saha, D.; Saha, S.; Sergeeva, E.G.; Ionova, Z.I.; Gorbach, A.V. Tissue factor and atherothrombosis. Curr. Pharm. Des. 2015, 21, 1152–1157. [Google Scholar] [CrossRef] [PubMed]
- Mann, K.G.; Krudysz-Amblo, J.; Butenas, S. Tissue factor controversies. Thromb. Res. 2012, 129 (Suppl. 2), S5–S7. [Google Scholar] [CrossRef] [PubMed] [Green Version]
- Mohan Rao, L.V.; Esmon, C.T.; Pendurthi, U.R. Endothelial cell protein C receptor: A multiliganded and multifunctional receptor. Blood 2014, 124, 1553–1562. [Google Scholar] [CrossRef] [Green Version]
- Vassiliou, A.G.; Keskinidou, C.; Jahaj, E.; Gallos, P.; Zacharis, A.; Athanasiou, N.; Tsipilis, S.; Mastora, Z.; Dimopoulou, I.; Kotanidou, A.; et al. Could Soluble Endothelial Protein C Receptor Levels Recognize SARS-CoV2-Positive Patients Requiring Hospitalization? Shock 2021, 56, 733–736. [Google Scholar] [CrossRef] [PubMed]
- Bayrakci, N.; Ozkan, G.; Mutlu, L.C.; Erdem, L.; Yildirim, I.; Gulen, D.; Celikkol, A. Relationship between serum soluble endothelial protein C receptor level and COVID-19 findings. Blood Coagul. Fibrinolysis Int. J. Haemost. Thromb. 2021, 32, 550–555. [Google Scholar] [CrossRef] [PubMed]
- Van de Wouwer, M.; Collen, D.; Conway, E.M. Thrombomodulin-protein C-EPCR system: Integrated to regulate coagulation and inflammation. Arterioscler. Thromb. Vasc. Biol. 2004, 24, 1374–1383. [Google Scholar] [CrossRef]
- Won, T.; Wood, M.K.; Hughes, D.M.; Talor, M.V.; Ma, Z.; Schneider, J.; Skinner, J.T.; Asady, B.; Goerlich, E.; Halushka, M.K.; et al. Endothelial thrombomodulin downregulation caused by hypoxia contributes to severe infiltration and coagulopathy in COVID-19 patient lungs. EBioMedicine 2022, 75, 103812. [Google Scholar] [CrossRef]
- Bouck, E.G.; Denorme, F.; Holle, L.A.; Middelton, E.A.; Blair, A.M.; de Laat, B.; Schiffman, J.D.; Yost, C.C.; Rondina, M.T.; Wolberg, A.S.; et al. COVID-19 and Sepsis Are Associated With Different Abnormalities in Plasma Procoagulant and Fibrinolytic Activity. Arterioscler. Thromb. Vasc. Biol. 2021, 41, 401–414. [Google Scholar] [CrossRef]
- Sosa-Hernandez, V.A.; Torres-Ruiz, J.; Cervantes-Diaz, R.; Romero-Ramirez, S.; Paez-Franco, J.C.; Meza-Sanchez, D.E.; Juarez-Vega, G.; Perez-Fragoso, A.; Ortiz-Navarrete, V.; Ponce-de-Leon, A.; et al. B Cell Subsets as Severity-Associated Signatures in COVID-19 Patients. Front. Immunol. 2020, 11, 611004. [Google Scholar] [CrossRef]
- Sun, H.B.; Zhang, Y.M.; Huang, L.G.; Lai, Q.N.; Mo, Q.; Ye, X.Z.; Wang, T.; Zhu, Z.Z.; Lv, X.L.; Luo, Y.J.; et al. The changes of the peripheral CD4+ lymphocytes and inflammatory cytokines in Patients with COVID-19. PLoS ONE 2020, 15, e0239532. [Google Scholar] [CrossRef]
- Fitzgerald, W.; Freeman, M.L.; Lederman, M.M.; Vasilieva, E.; Romero, R.; Margolis, L. A System of Cytokines Encapsulated in ExtraCellular Vesicles. Sci. Rep. 2018, 8, 8973. [Google Scholar] [CrossRef] [PubMed] [Green Version]
- Shah, V.K.; Firmal, P.; Alam, A.; Ganguly, D.; Chattopadhyay, S. Overview of Immune Response During SARS-CoV-2 Infection: Lessons From the Past. Front. Immunol. 2020, 11, 1949. [Google Scholar] [CrossRef] [PubMed]
- Wang, J.; Jiang, M.; Chen, X.; Montaner, L.J. Cytokine storm and leukocyte changes in mild versus severe SARS-CoV-2 infection: Review of 3939 COVID-19 patients in China and emerging pathogenesis and therapy concepts. J. Leukoc. Biol. 2020, 108, 17–41. [Google Scholar] [CrossRef] [PubMed]
- Mangalmurti, N.; Hunter, C.A. Cytokine Storms: Understanding COVID-19. Immunity 2020, 53, 19–25. [Google Scholar] [CrossRef] [PubMed]
- Aharon, A.; Tamari, T.; Brenner, B. Monocyte-derived microparticles and exosomes induce procoagulant and apoptotic effects on endothelial cells. Thromb. Haemost. 2008, 100, 878–885. [Google Scholar]
- Masoud, M.; Sarig, G.; Brenner, B.; Jacob, G. Hydration does not prevent orthostatic hypercoagulability. Thromb. Haemost. 2010, 103, 284–290. [Google Scholar] [CrossRef]
- Ali-Saleh, M.; Sarig, G.; Ablin, J.N.; Brenner, B.; Jacob, G. Inhalation of a Short-Acting beta2-Adrenoreceptor Agonist Induces a Hypercoagulable State in Healthy Subjects. PLoS ONE 2016, 11, e0158652. [Google Scholar] [CrossRef] [Green Version]
- Levin, C.; Koren, A.; Rebibo-Sabbah, A.; Koifman, N.; Brenner, B.; Aharon, A. Extracellular Vesicle Characteristics in beta-thalassemia as Potential Biomarkers for Spleen Functional Status and Ineffective Erythropoiesis. Front. Physiol. 2018, 9, 1214. [Google Scholar] [CrossRef]
- Thery, C.; Witwer, K.W.; Aikawa, E.; Alcaraz, M.J.; Anderson, J.D.; Andriantsitohaina, R.; Antoniou, A.; Arab, T.; Archer, F.; Atkin-Smith, G.K.; et al. Minimal information for studies of extracellular vesicles 2018 (MISEV2018): A position statement of the International Society for Extracellular Vesicles and update of the MISEV2014 guidelines. J. Extracell. Vesicles 2018, 7, 1535750. [Google Scholar] [CrossRef] [Green Version]
- Yuana, Y.; Boing, A.N.; Grootemaat, A.E.; van der Pol, E.; Hau, C.M.; Cizmar, P.; Buhr, E.; Sturk, A.; Nieuwland, R. Handling and storage of human body fluids for analysis of extracellular vesicles. J. Extracell. Vesicles 2015, 4, 29260. [Google Scholar] [CrossRef]
- Nunez Lopez, Y.O.; Coen, P.M.; Goodpaster, B.H.; Seyhan, A.A. Gastric bypass surgery with exercise alters plasma microRNAs that predict improvements in cardiometabolic risk. Int. J. Obes. 2017, 41, 1121–1130. [Google Scholar] [CrossRef] [PubMed] [Green Version]
- Peng, G.; Tang, Y.; Cowan, T.M.; Zhao, H.; Scharfe, C. Timing of Newborn Blood Collection Alters Metabolic Disease Screening Performance. Front. Pediatr. 2020, 8, 623184. [Google Scholar] [CrossRef] [PubMed]


| Epidemiological Characteristics | ||||
|---|---|---|---|---|
| Characteristic | Mild | Moderate | Severe | p Value |
| Sex | ||||
| Male | 6 | 8 | 7 | |
| Female | 6 | 4 | 5 | |
| Age | 60.6 ± 18.7 | 60 ± 17.9 | 62.4 ± 18.4 | NS |
| Body mass index (BMI) | 28.5 ± 6.2 | 29.43 ± 4.27 | 29.35 ± 7.14 | NS |
| Smoking | 0 | 0 | 1 | NS |
| Chronic illnesses (total) | 20 | 23 | 14 | |
| Diabetes mellitus | 2 | 5 | 4 | NS |
| Hypertension | 5 | 5 | 0 | Severe vs. mild/moderate p = 0.037 |
| Dyslipidemia | 3 | 5 | 2 | NS |
| Cardiovascular | 1 | 2 | 2 | NS |
| Congestive heart failure | 1 | 1 | 1 | NS |
| Valvar disease | 0 | 1 | 1 | NS |
| Atrial fibrillation | 2 | 1 | 0 | NS |
| Obstructive sleep apnea | 2 | 0 | 1 | NS |
| Chronic obstructive pulmonary disease | 2 | 0 | 0 | NS |
| Chronic renal failure | 1 | 2 | 0 | NS |
| Hyperthyroidism | 1 | 0 | 0 | NS |
| Hypothyroidism | 0 | 0 | 2 | NS |
| Immunosuppression | 0 | 1 | 0 | NS |
| Medication | ||||
| Anti-aggregates | 2 | 2 | 3 | NS |
| ACE-inhibitor, angiotensin receptor blockers | 4 | 1 | 3 | NS |
| Beta-Blockers | 4 | 1 | 4 | NS |
| Calcium channel blocker | 1 | 3 | 1 | NS |
| Proton pump inhibitor (PPI) | 2 | 5 | 4 | NS |
| Mean ± Std. Deviation | Mild Disease | Moderate Disease | Severe Disease | p = t-Test | |
|---|---|---|---|---|---|
| HB | 12.959 ± 2.357 | 14.139 ± 1.868 | 13.83 ± 2.2 | NS | |
| WBC | 5.818 ± 1.481 | 9.067 ± 4.131 | 7.633 ± 3.952 | Mild vs. moderate p = 0.0489 | |
| LYMPH No. | 1.018 ± 0.525 | 2.417 ± 3.335 | 1.992 ± 3.333 | NS | |
| NEU No. | 4.345 ± 1.196 | 5.375 ± 2.411 | 4.933 ± 3.498 | NS | |
| Neu/lymph ratio | 6.4 ± 7.468 | 5.525 ± 3.393 | 8.7 ± 7.485 | NS | |
| MON No. | 0.4545 ± 0.2018 | 0.6667 ± 0.403 | 0.525 ± 0.4003 | NS | |
| ESO No. | 0.1 ± 0.3 | 0.1583 ± 0.337 | 0.05 ± 0.09045 | NS | |
| PLTs | 201.5 ± 85.45 | 268.9 ± 182.6 | 214.7 ± 163.5 | NS | |
| Coagulation | Di-dimer | 2.099 ± 2.364 | 1.52 ± 1.199 | 4.221 ± 5.447 | NS |
| INR | 1.046 ± 0.1041 | 1.178 ± 0.4686 | 1.103 ± 0.1155 | NS | |
| PT | 10.93 ± 1.07 | 12.19 ± 4.232 | 11.53 ± 1.17 | NS | |
| PTT | 31.55 ± 6.089 | 31.8 ± 5.169 | 29.31 ± 0.8669 | NS | |
| Fibrinogen | 522.7 ± 134.2 | 461.1 ± 150.7 | 470.7 ± 186.7 | NS | |
| FV | 122.6 ± 32.4 | 135.6 ± 27.49 | 119.5 ± 32.08 | NS | |
| FVIII | 215.2 ± 95.12 | 255.0 ± 108.8 | 229.5 ± 80.4 | NS | |
| vWF (IU/dL) | 290.7 ± 81.4 | 356.9 ± 190.8 | 393.8 ± 211.8 | NS | |
| Chemistry | Creatinine (Cr.) | 1.109 ± 0.7864 | 1.126 ± 0.9076 | 0.7333 ± 0.2497 | Moderate vs. severe p = 0.0142 |
| Blood urea nitrogen (BUN) | 20.9 ± 13 | 20.75 ± 9.799 | 19.25 ± 7.569 | NS | |
| Na | 137.1 ± 2.548 | 136.8 ± 4.351 | 137.9 ± 4.999 | NS | |
| Cl | 102.3 ± 3.823 | 102.5 ± 4.927 | 101.9 ± 3.848 | NS | |
| K | 4.207 ± 0.3957 | 4.161 ± 0.5111 | 4.163 ± 0.3994 | NS | |
| Mg | 2.201 ± 0.1527 | 2.042 ± 0.2227 | 2.103 ± 0.2243 | NS | |
| Ca | 8.56 ± 0.4248 | 8.875 ± 0.6283 | 8.775 ± 0.4615 | NS | |
| Phosphate | 3.173 ± 0.3526 | 2.863 ± 0.4719 | 3.043 ± 0.739 | NS | |
| Creatine phosphokinase (CPK) | 143 ± 133 | 106 ± 84 | 284.3 ± 456 | NS | |
| Lactate dehydrogenase (LDH) | 468.7 ± 120.2 | 679.9 ± 334 | 750.8 ± 382.3 | Mild vs. severe p = 0.0230 | |
| Alanine aminotransferase (ALT) | 34.91 ± 36.55 | 61.58 ± 79.3 | 35.75 ± 22.72 | NS | |
| Aspartate aminotransferase (AST) | 31.4 ± 21.55 | 50 ± 52.17 | 44.58 ± 16.28 | Mild vs. severe p = 0.0347 | |
| Alkaline phosphatase (ALKP) | 62.7 ± 30.47 | 72.5 ± 28.66 | 78.5 ± 37.09 | NS | |
| Gamma-glutamyl transferase (GGT) | 41.64 ± 46.08 | 81.25 ± 75.24 | 72.75 ± 65.44 | NS | |
| Bilirubin | 0.5882 ± 0.337 | 0.47 ± 0.1473 | 0.6542 ± 0.4736 | NS | |
| Albumin | 38.6 ± 3.921 | 37.42 ± 4.889 | 38.58 ± 5.4 | NS | |
| Troponin | 11.95 ± 15.16 | 21.35 ± 46.1 | 20.83 ± 25.28 | NS | |
| Brain natriuretic peptide (BNP) | 27.4 ± 34.5 | 62.67 ± 16.02 | 41 ± 27.48 | NS | |
| Ferritin | 624 ± 536 | 1232 ± 926 | 632.3 ± 598.7 | NS | |
| C-reactive protein CRP) | 48.54 ± 50.88 | 52.33 ± 67.18 | 76.67 ± 70.02 | NS | |
| Lactate | 1.912 ± 1.368 | 1.687 ± 0.3717 | 1.97 ± 0.5804 | NS | |
| Gas | pH | 7.401 ± 0.04625 | 7.415 ± 0.06004 | 7.381 ± 0.03879 | NS |
| pCO2 | 43.88 ± 7.246 | 39.22 ± 4.98 | 44.83 ± 9.581 | NS | |
| Bicarbonate (HCO3) | 25.54 ± 3.347 | 24.06 ± 1.538 | 26.11 ± 3.591 | NS | |
| pO2 | 26.31 ± 15.07 | 35.46 ± 15.16 | 32.48 ± 15.54 | NS |
Disclaimer/Publisher’s Note: The statements, opinions and data contained in all publications are solely those of the individual author(s) and contributor(s) and not of MDPI and/or the editor(s). MDPI and/or the editor(s) disclaim responsibility for any injury to people or property resulting from any ideas, methods, instructions or products referred to in the content. |
© 2023 by the authors. Licensee MDPI, Basel, Switzerland. This article is an open access article distributed under the terms and conditions of the Creative Commons Attribution (CC BY) license (https://creativecommons.org/licenses/by/4.0/).
Share and Cite
Aharon, A.; Dangot, A.; Kinaani, F.; Zavaro, M.; Bannon, L.; Bar-lev, T.; Keren-Politansky, A.; Avivi, I.; Jacob, G. Extracellular Vesicles of COVID-19 Patients Reflect Inflammation, Thrombogenicity, and Disease Severity. Int. J. Mol. Sci. 2023, 24, 5918. https://doi.org/10.3390/ijms24065918
Aharon A, Dangot A, Kinaani F, Zavaro M, Bannon L, Bar-lev T, Keren-Politansky A, Avivi I, Jacob G. Extracellular Vesicles of COVID-19 Patients Reflect Inflammation, Thrombogenicity, and Disease Severity. International Journal of Molecular Sciences. 2023; 24(6):5918. https://doi.org/10.3390/ijms24065918
Chicago/Turabian StyleAharon, Anat, Ayelet Dangot, Fadi Kinaani, Mor Zavaro, Lian Bannon, Tali Bar-lev, Anat Keren-Politansky, Irit Avivi, and Giris Jacob. 2023. "Extracellular Vesicles of COVID-19 Patients Reflect Inflammation, Thrombogenicity, and Disease Severity" International Journal of Molecular Sciences 24, no. 6: 5918. https://doi.org/10.3390/ijms24065918