
Exopolysaccharide Biosynthesis in Rhizobium leguminosarum bv. trifolii Requires a Complementary Function of Two Homologous Glycosyltransferases PssG and PssI
 , , , , , , and
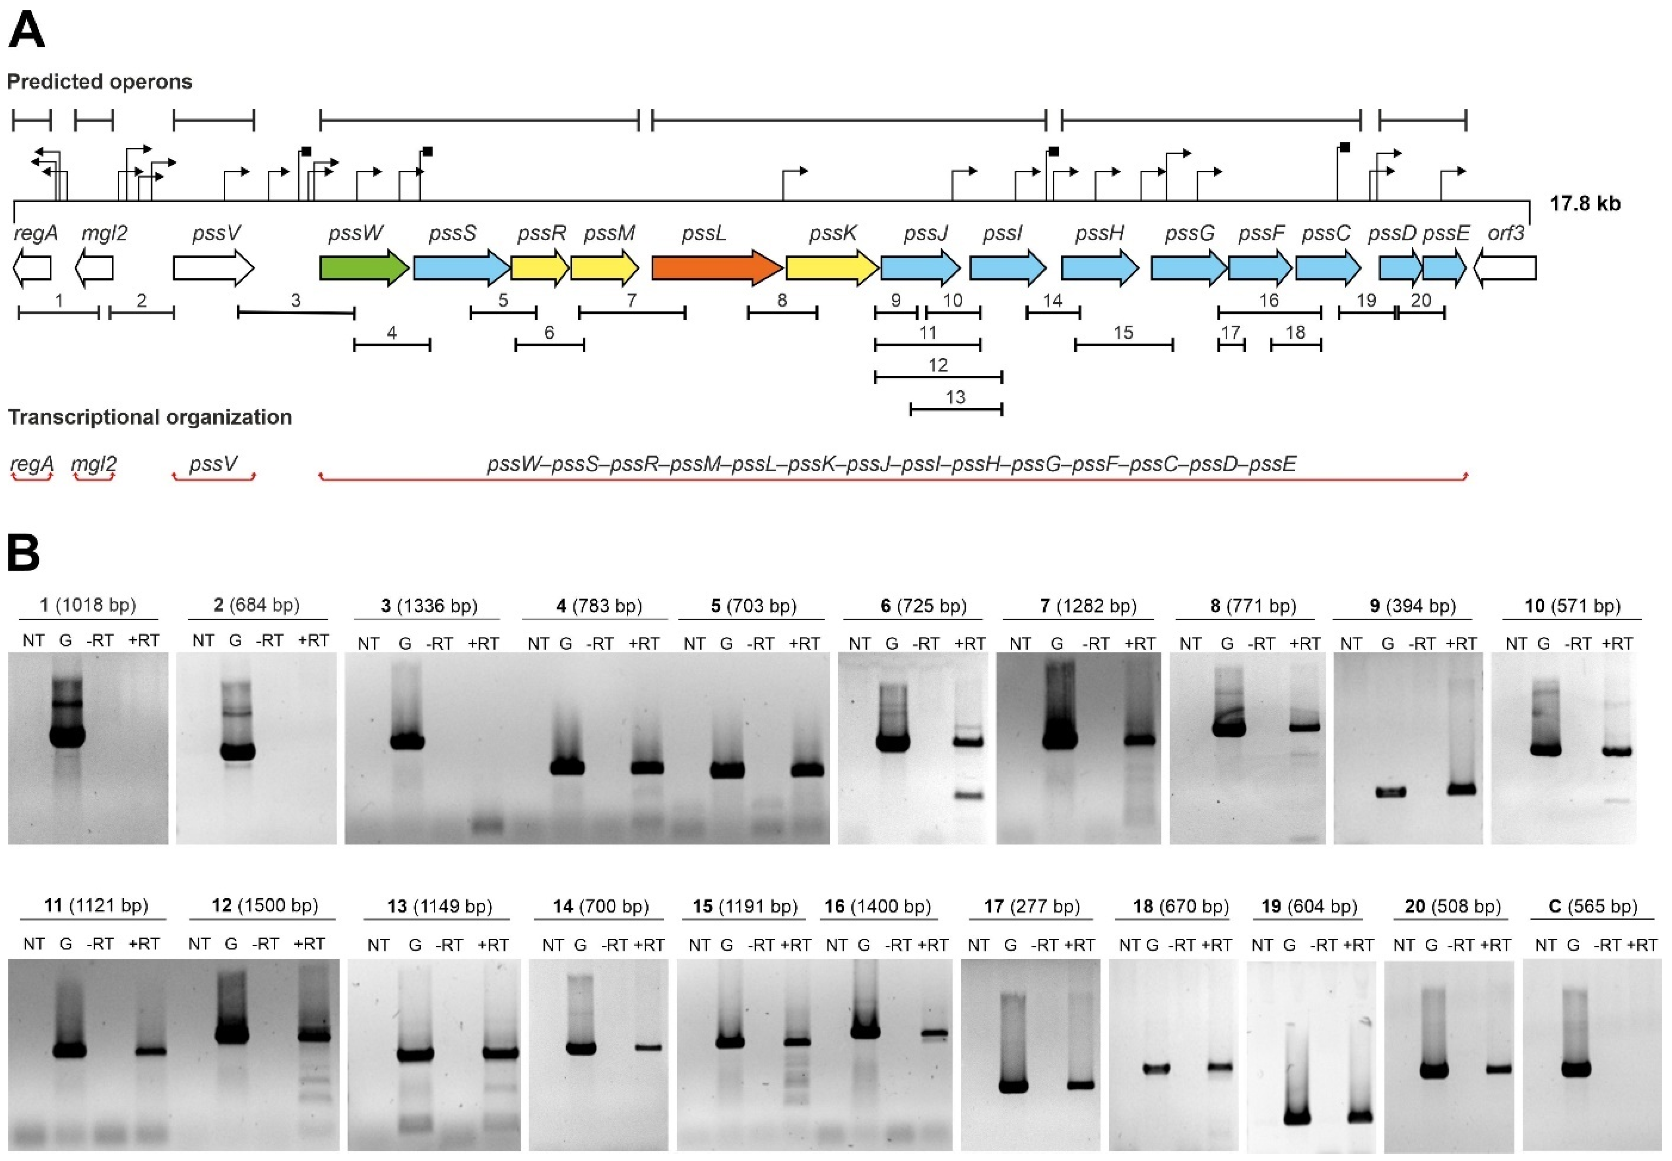
Abstract
:1. Introduction
2. Results
2.1. Genes Encoding Glycosyltransferases Involved in EPS Biosynthesis in R. leguminosarum bv. trifolii Are Part of a Single Transcriptional Unit
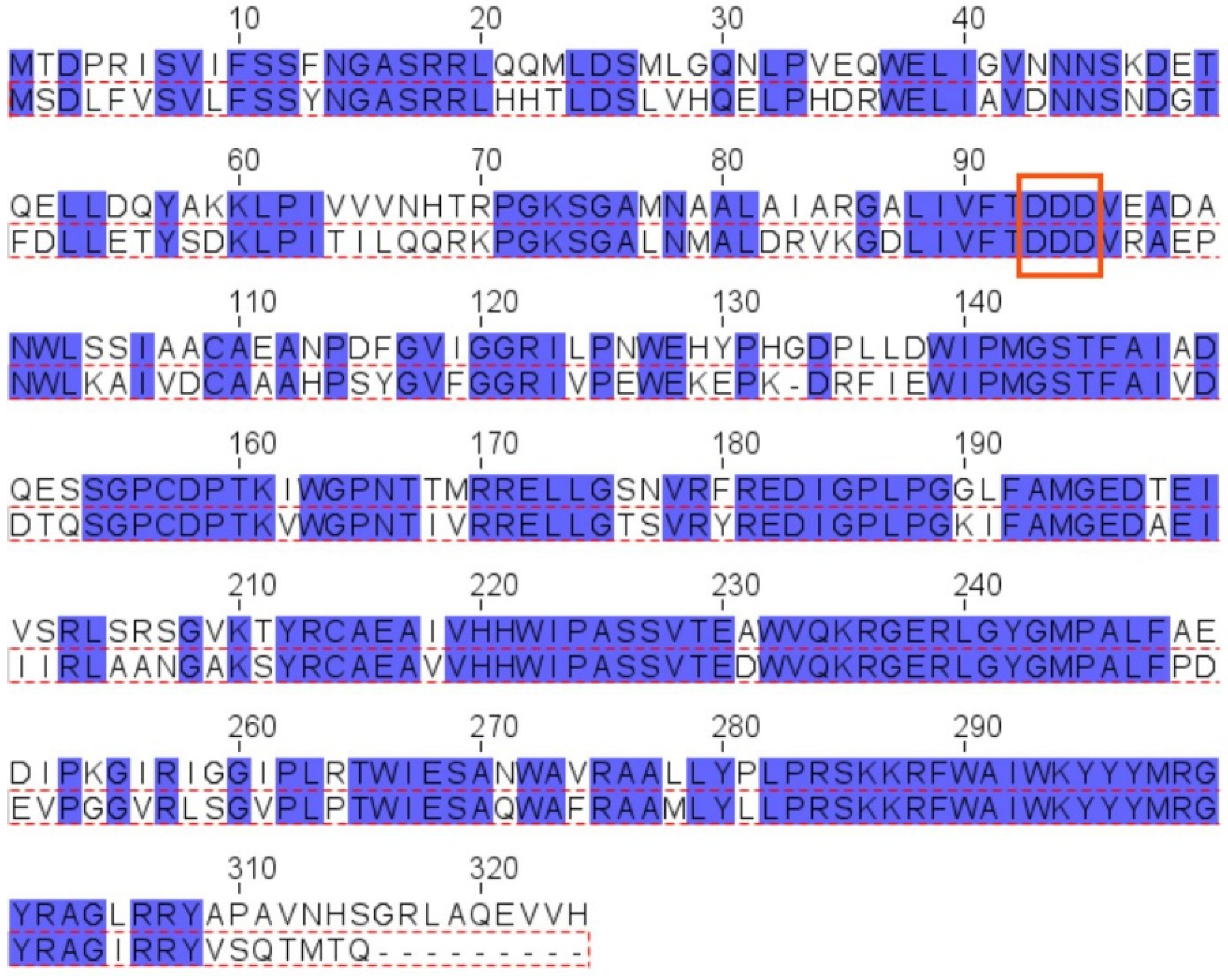
2.2. PssG and PssI Proteins—Highly Similar, Yet Different
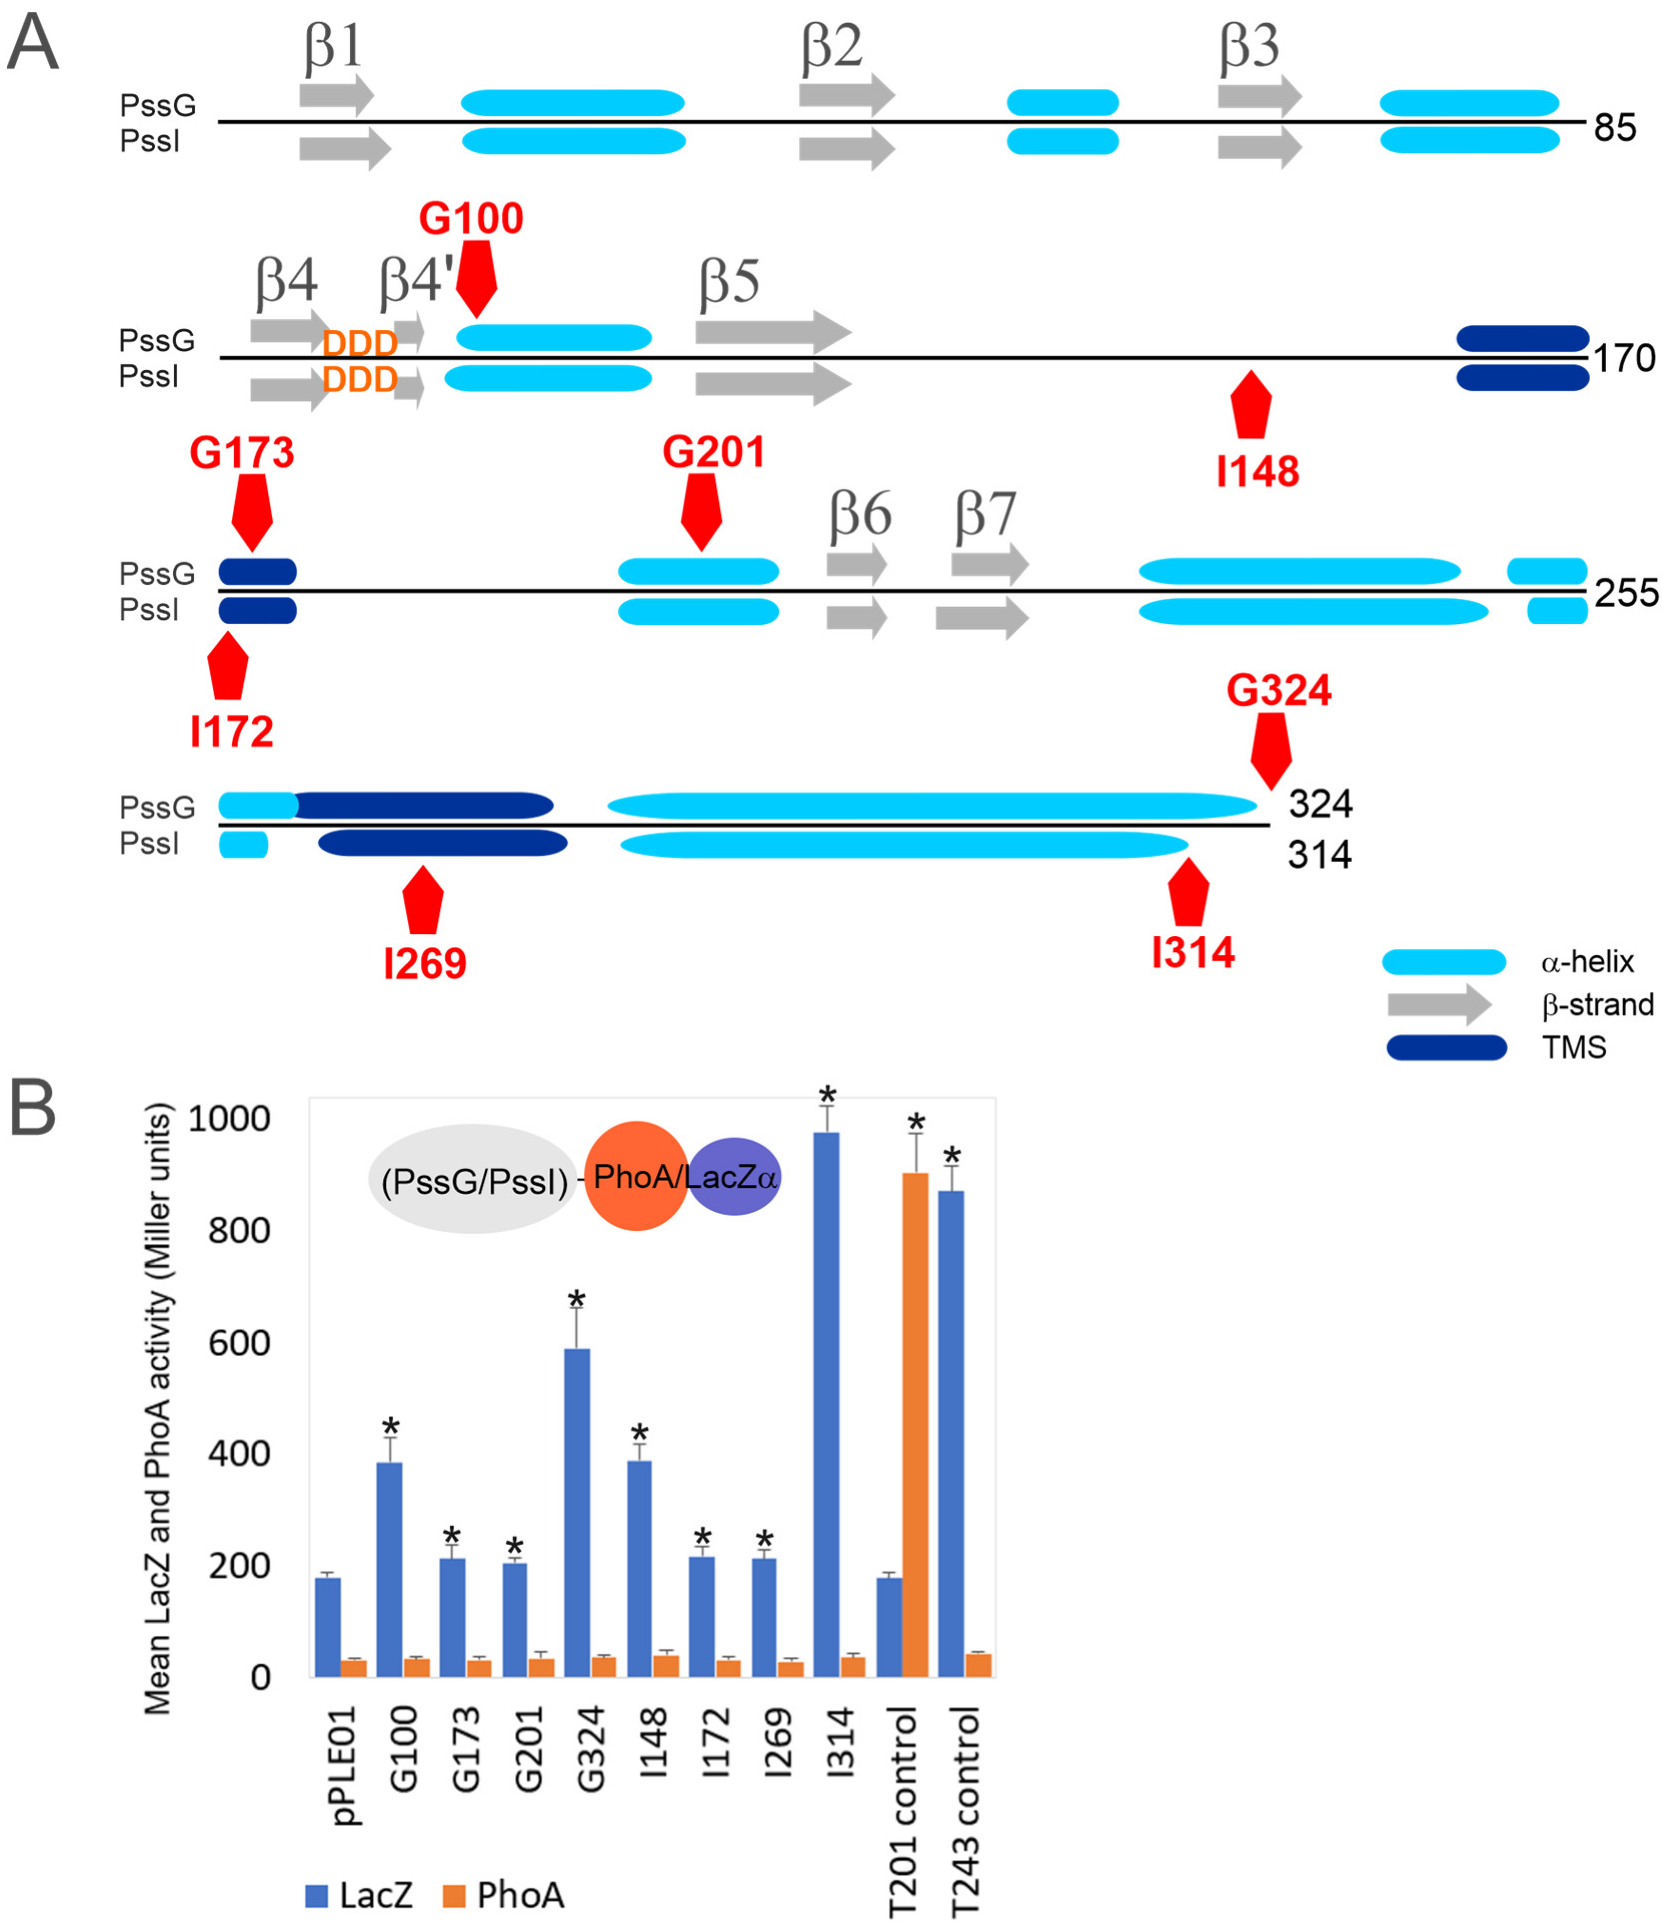
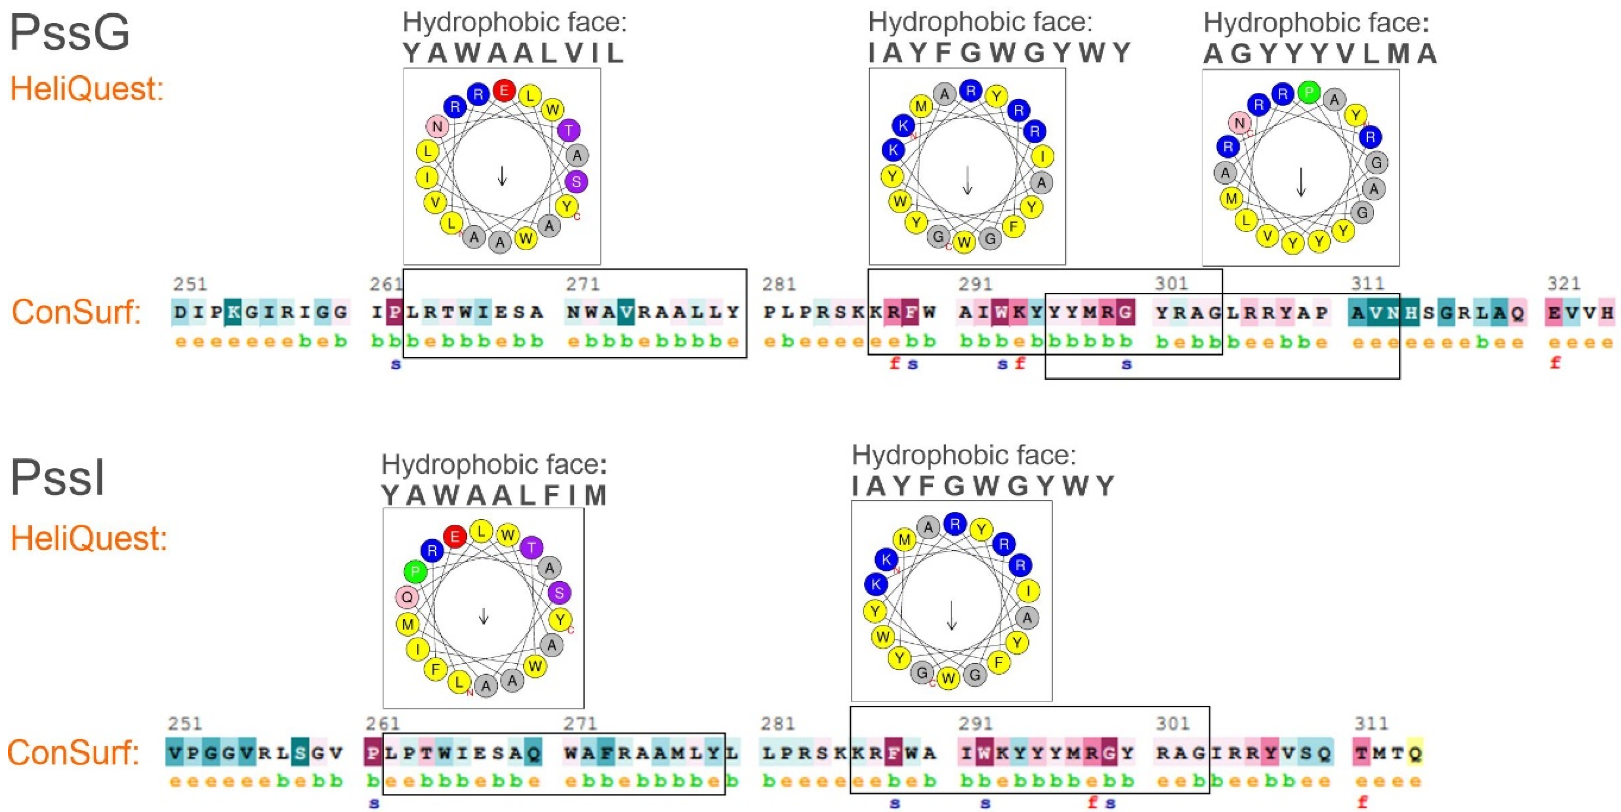
2.3. PssG and PssI Interact with the Inner Membrane through Amphipathic Helices
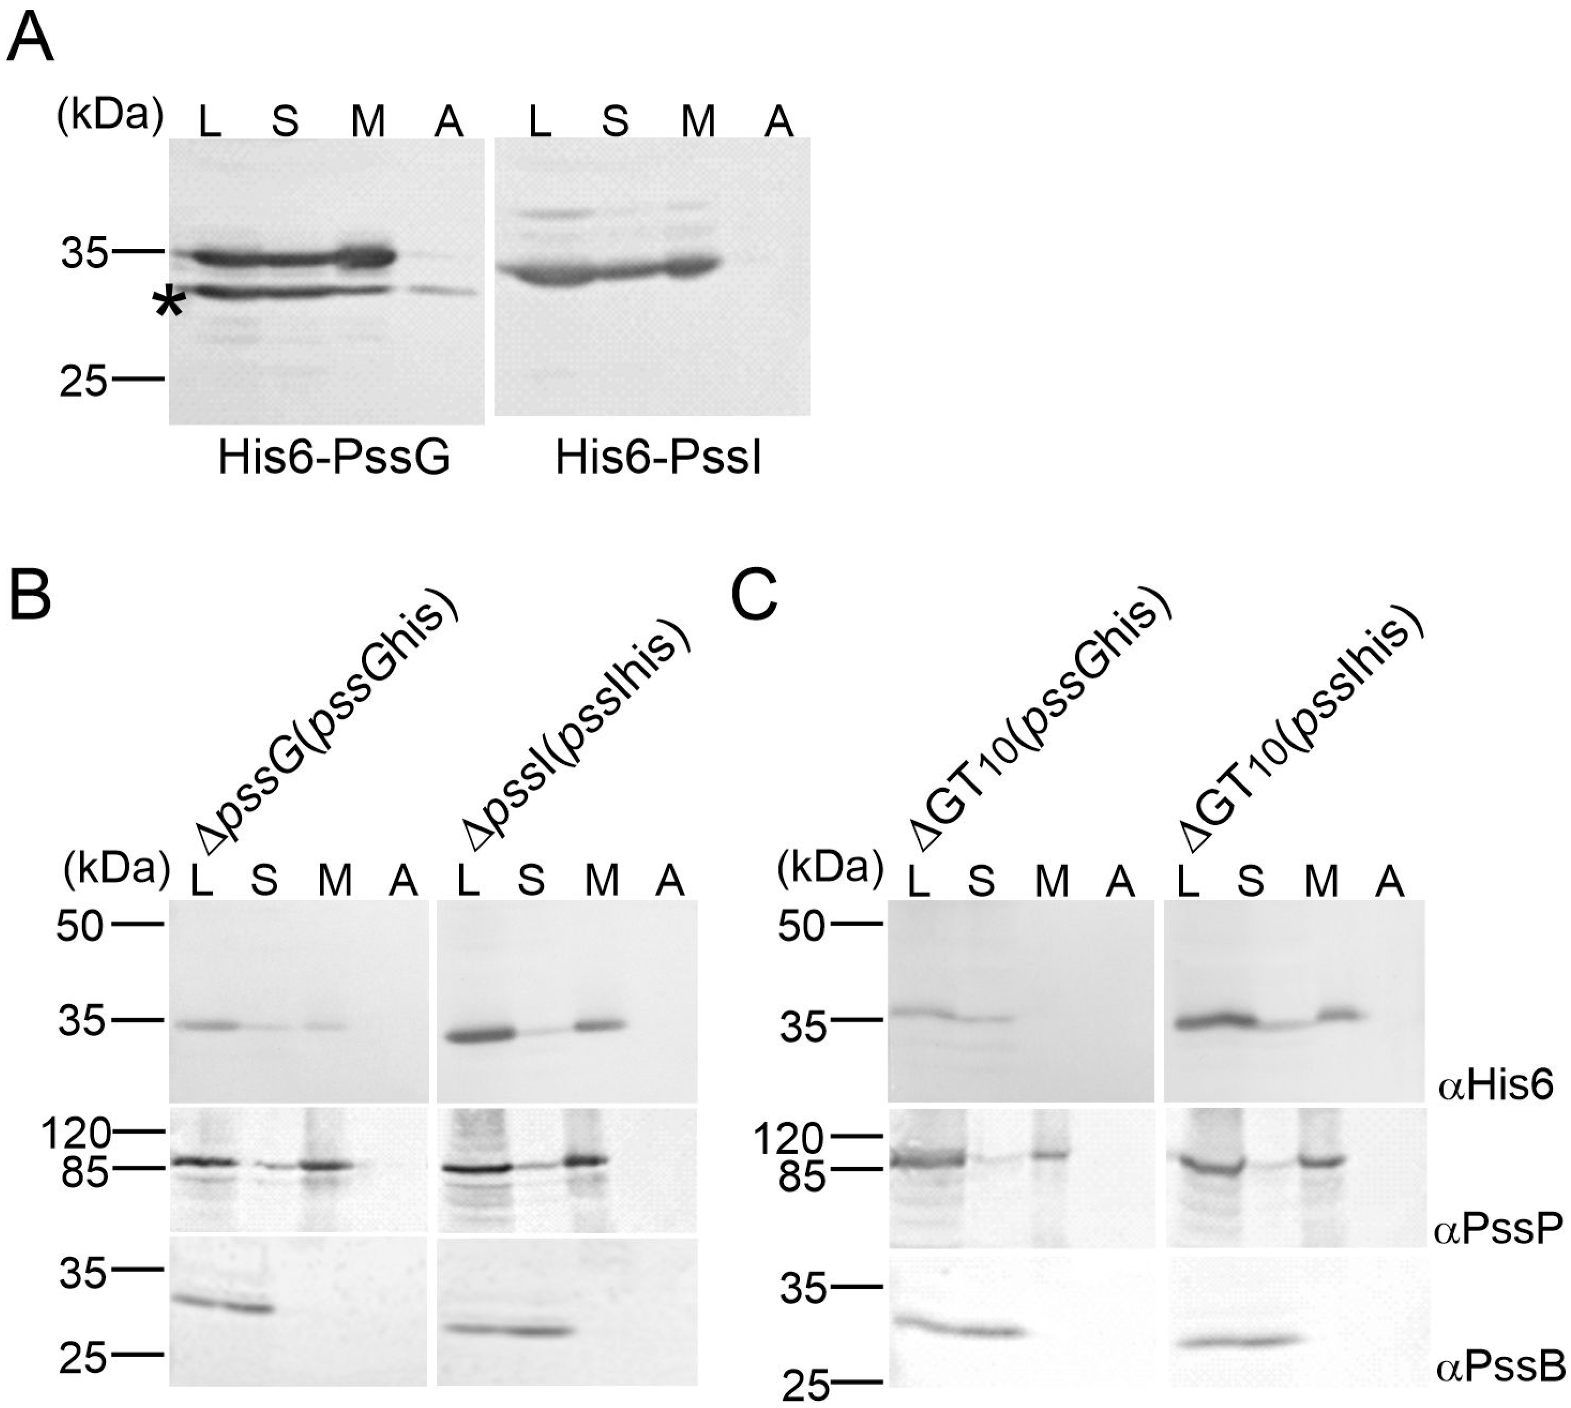
2.4. PssG but Not PssI Localization to the Inner Membrane Requires Other Proteins Involved in EPS Synthesis
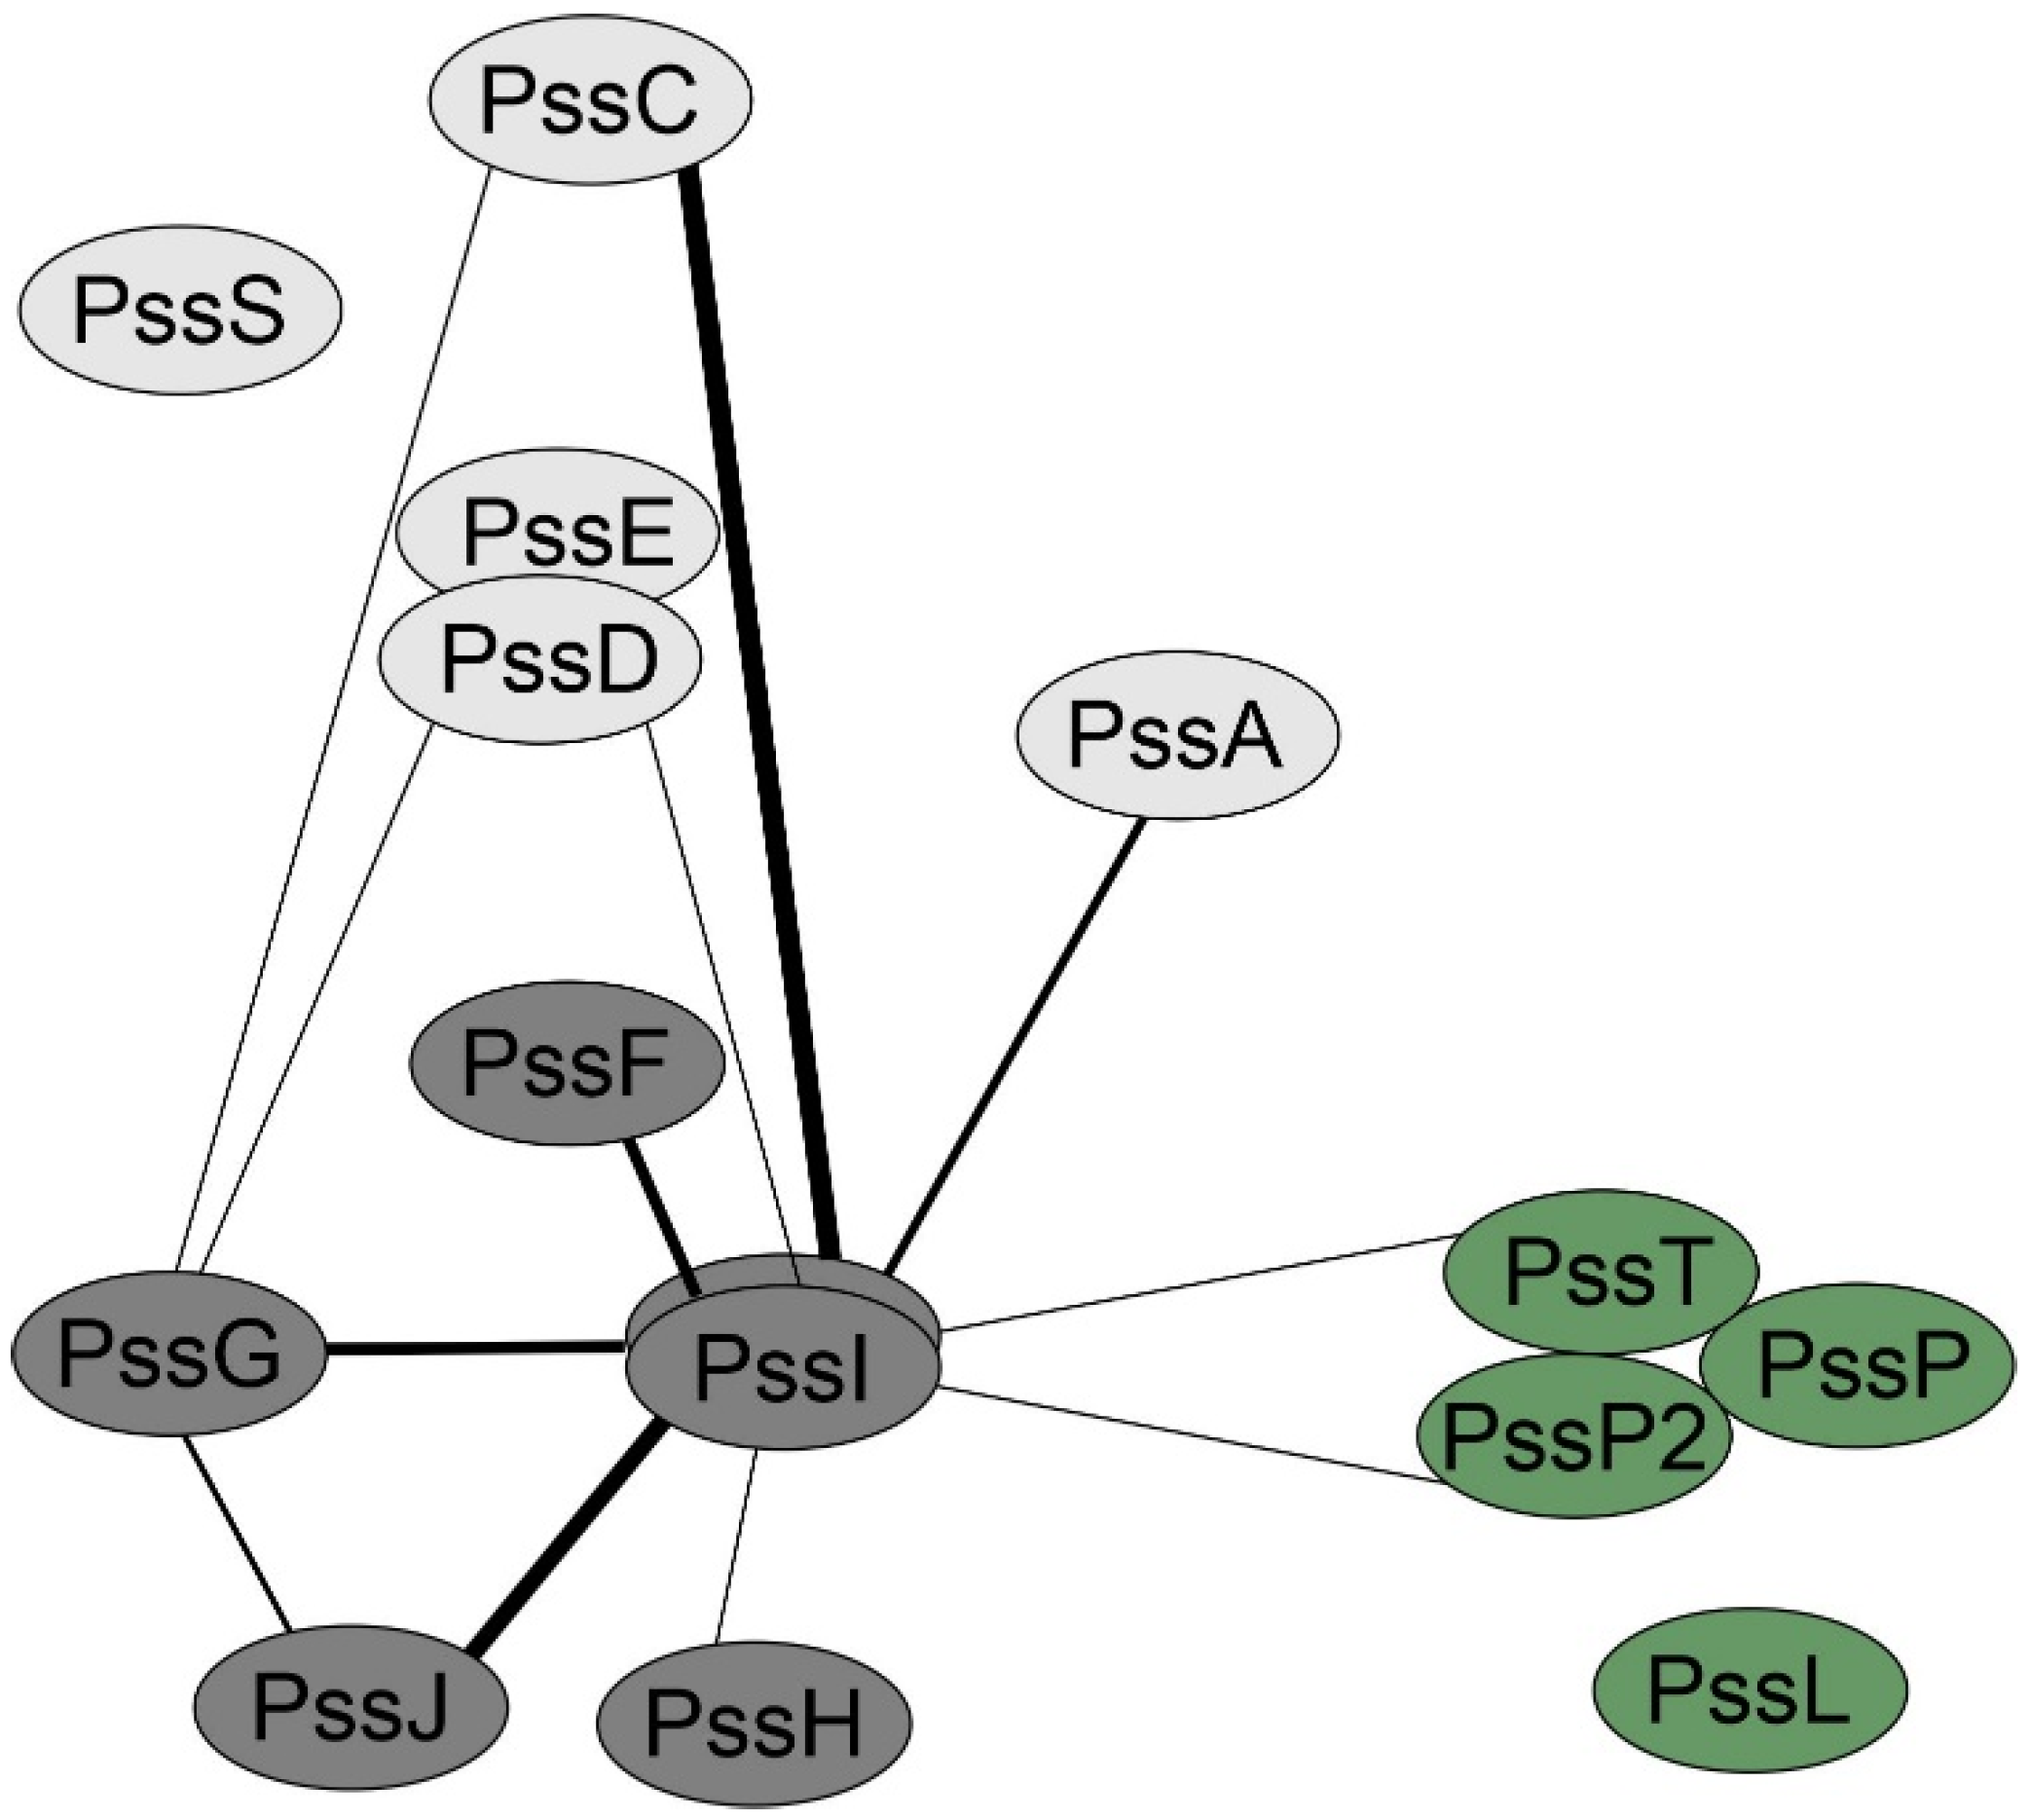
2.5. PssI Has a More Expanded BTH Interaction Network Than PssG
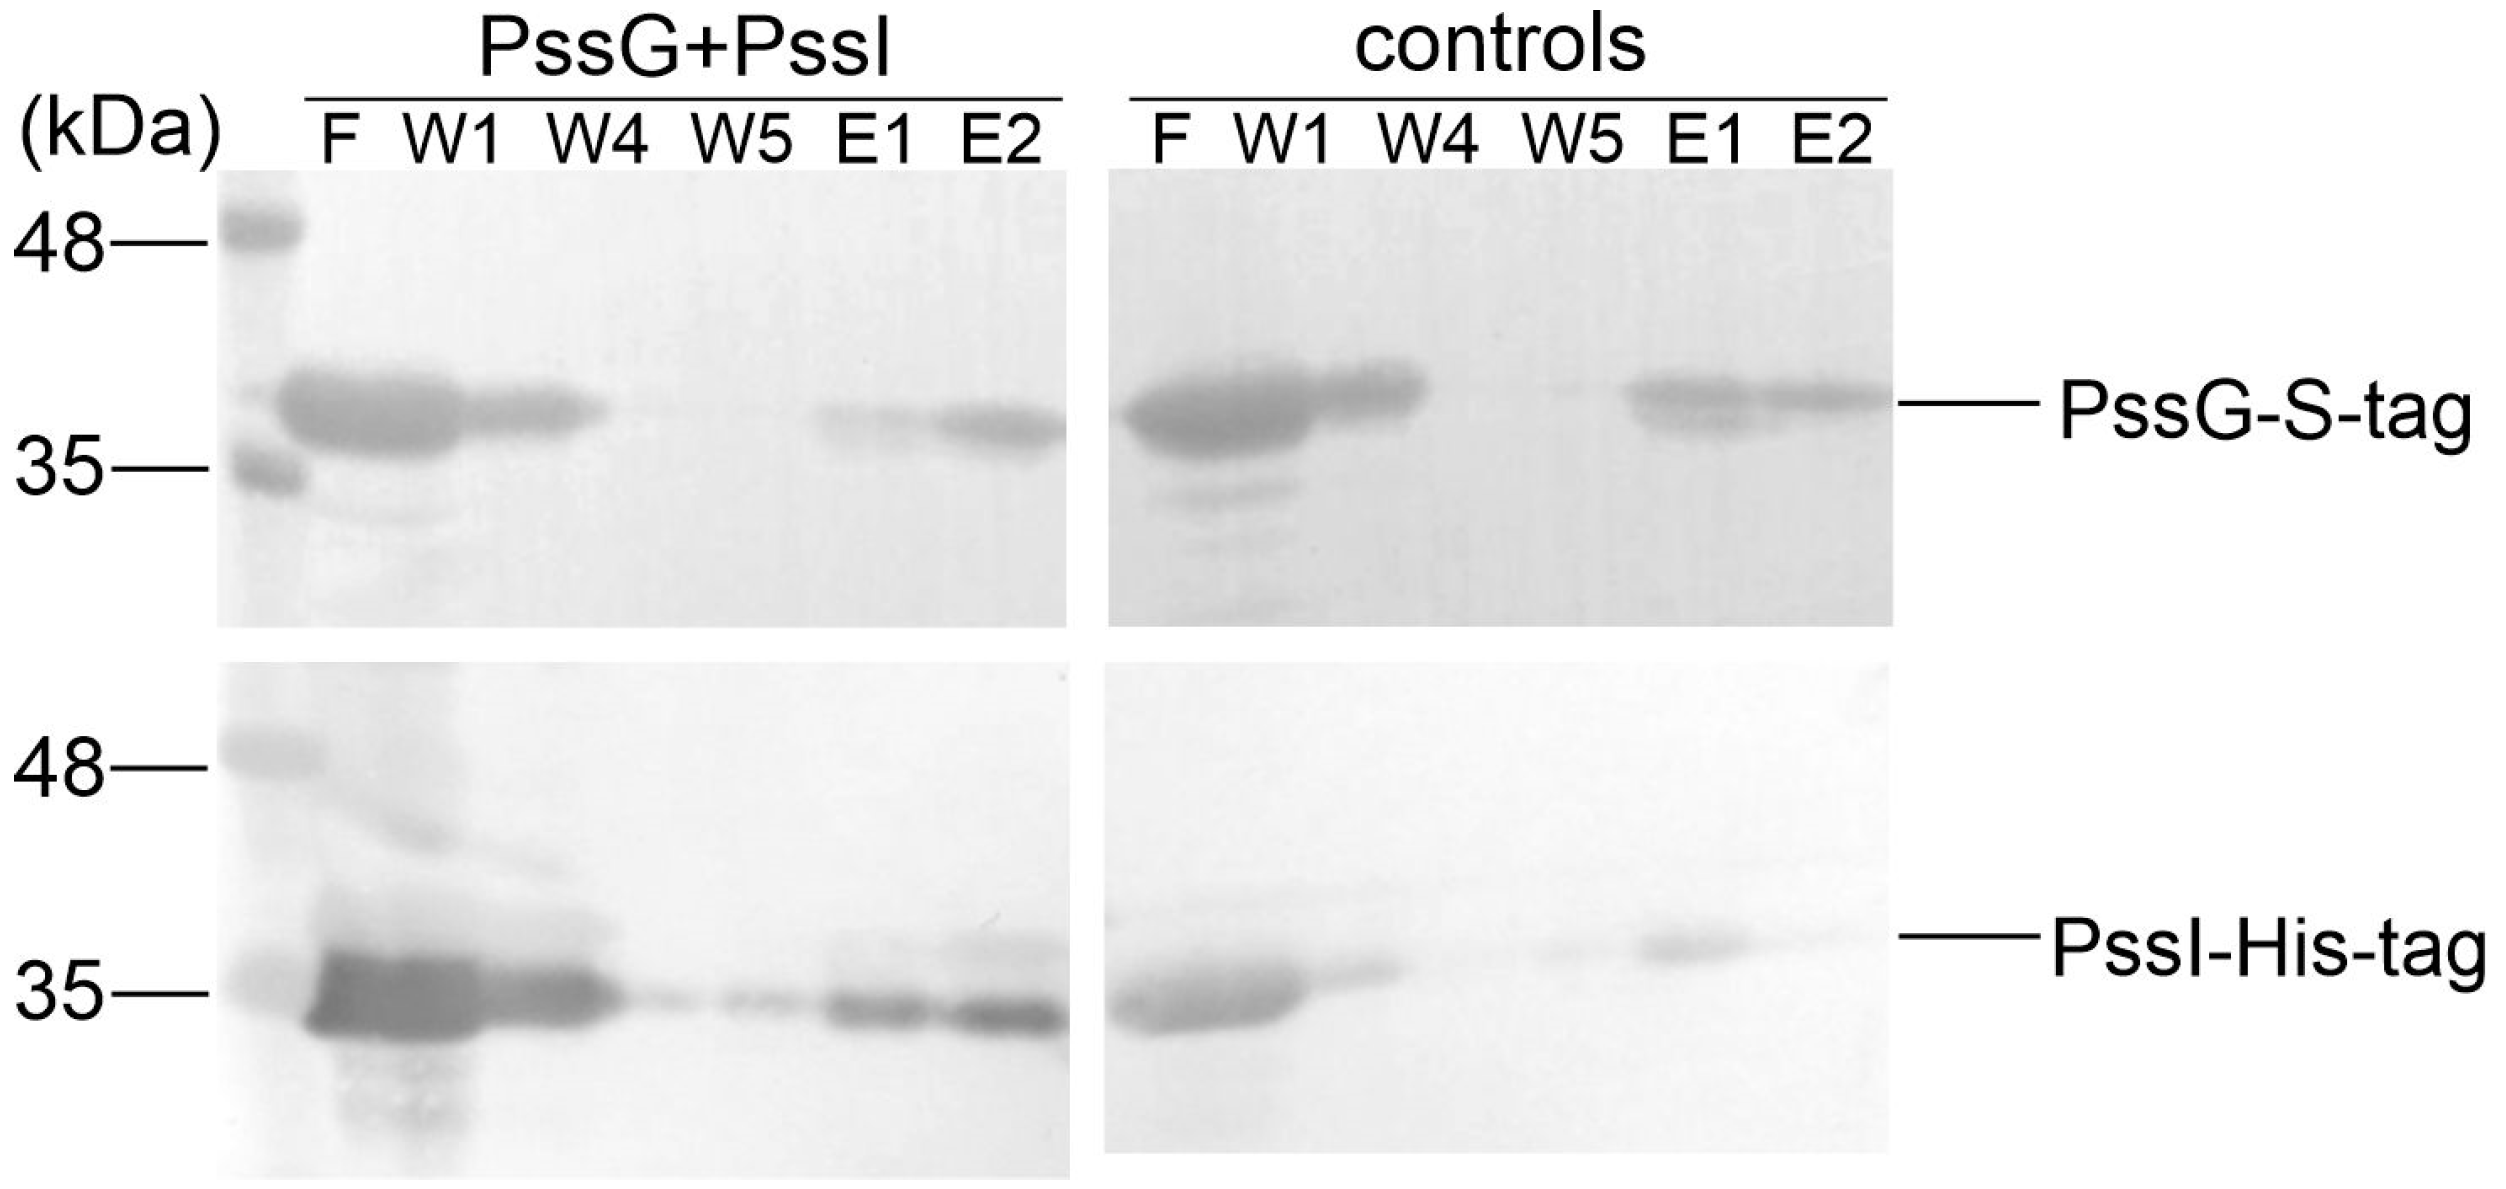
2.6. PssG and PssI Interact In Vitro
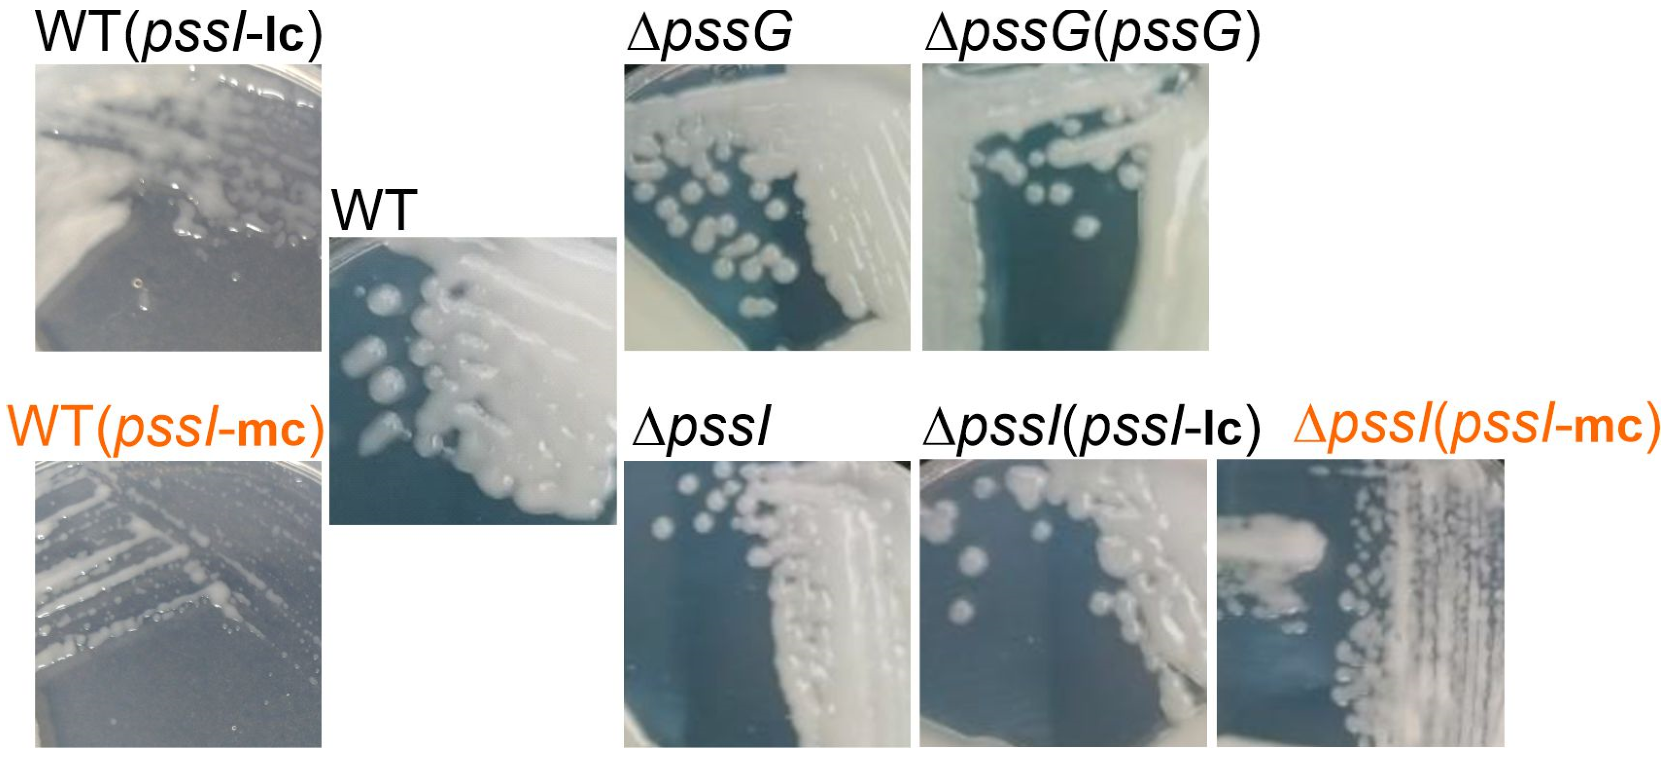
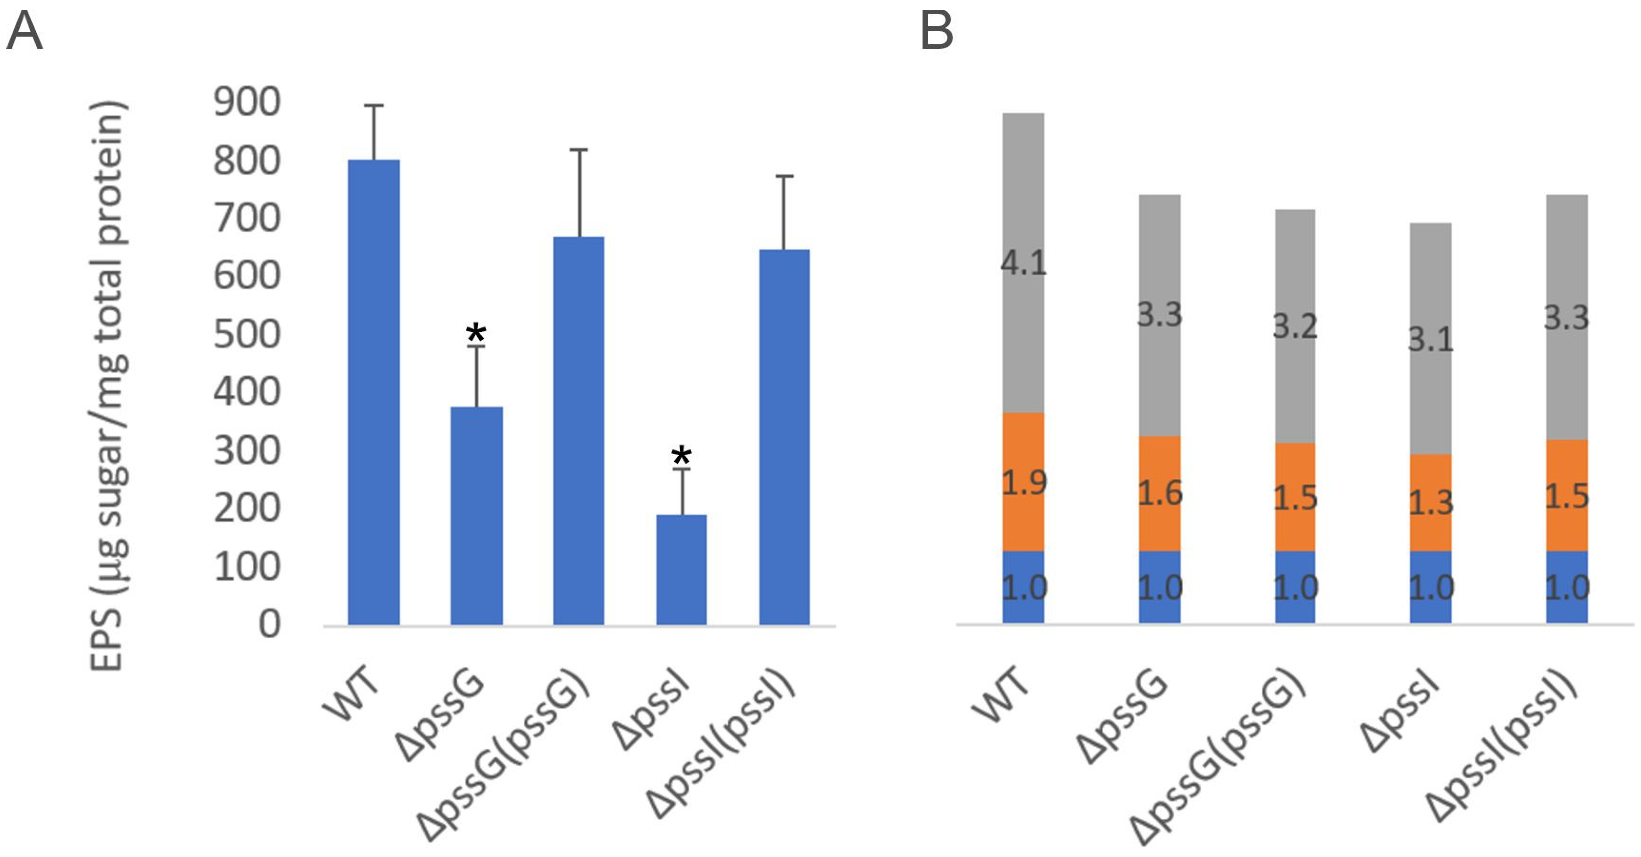
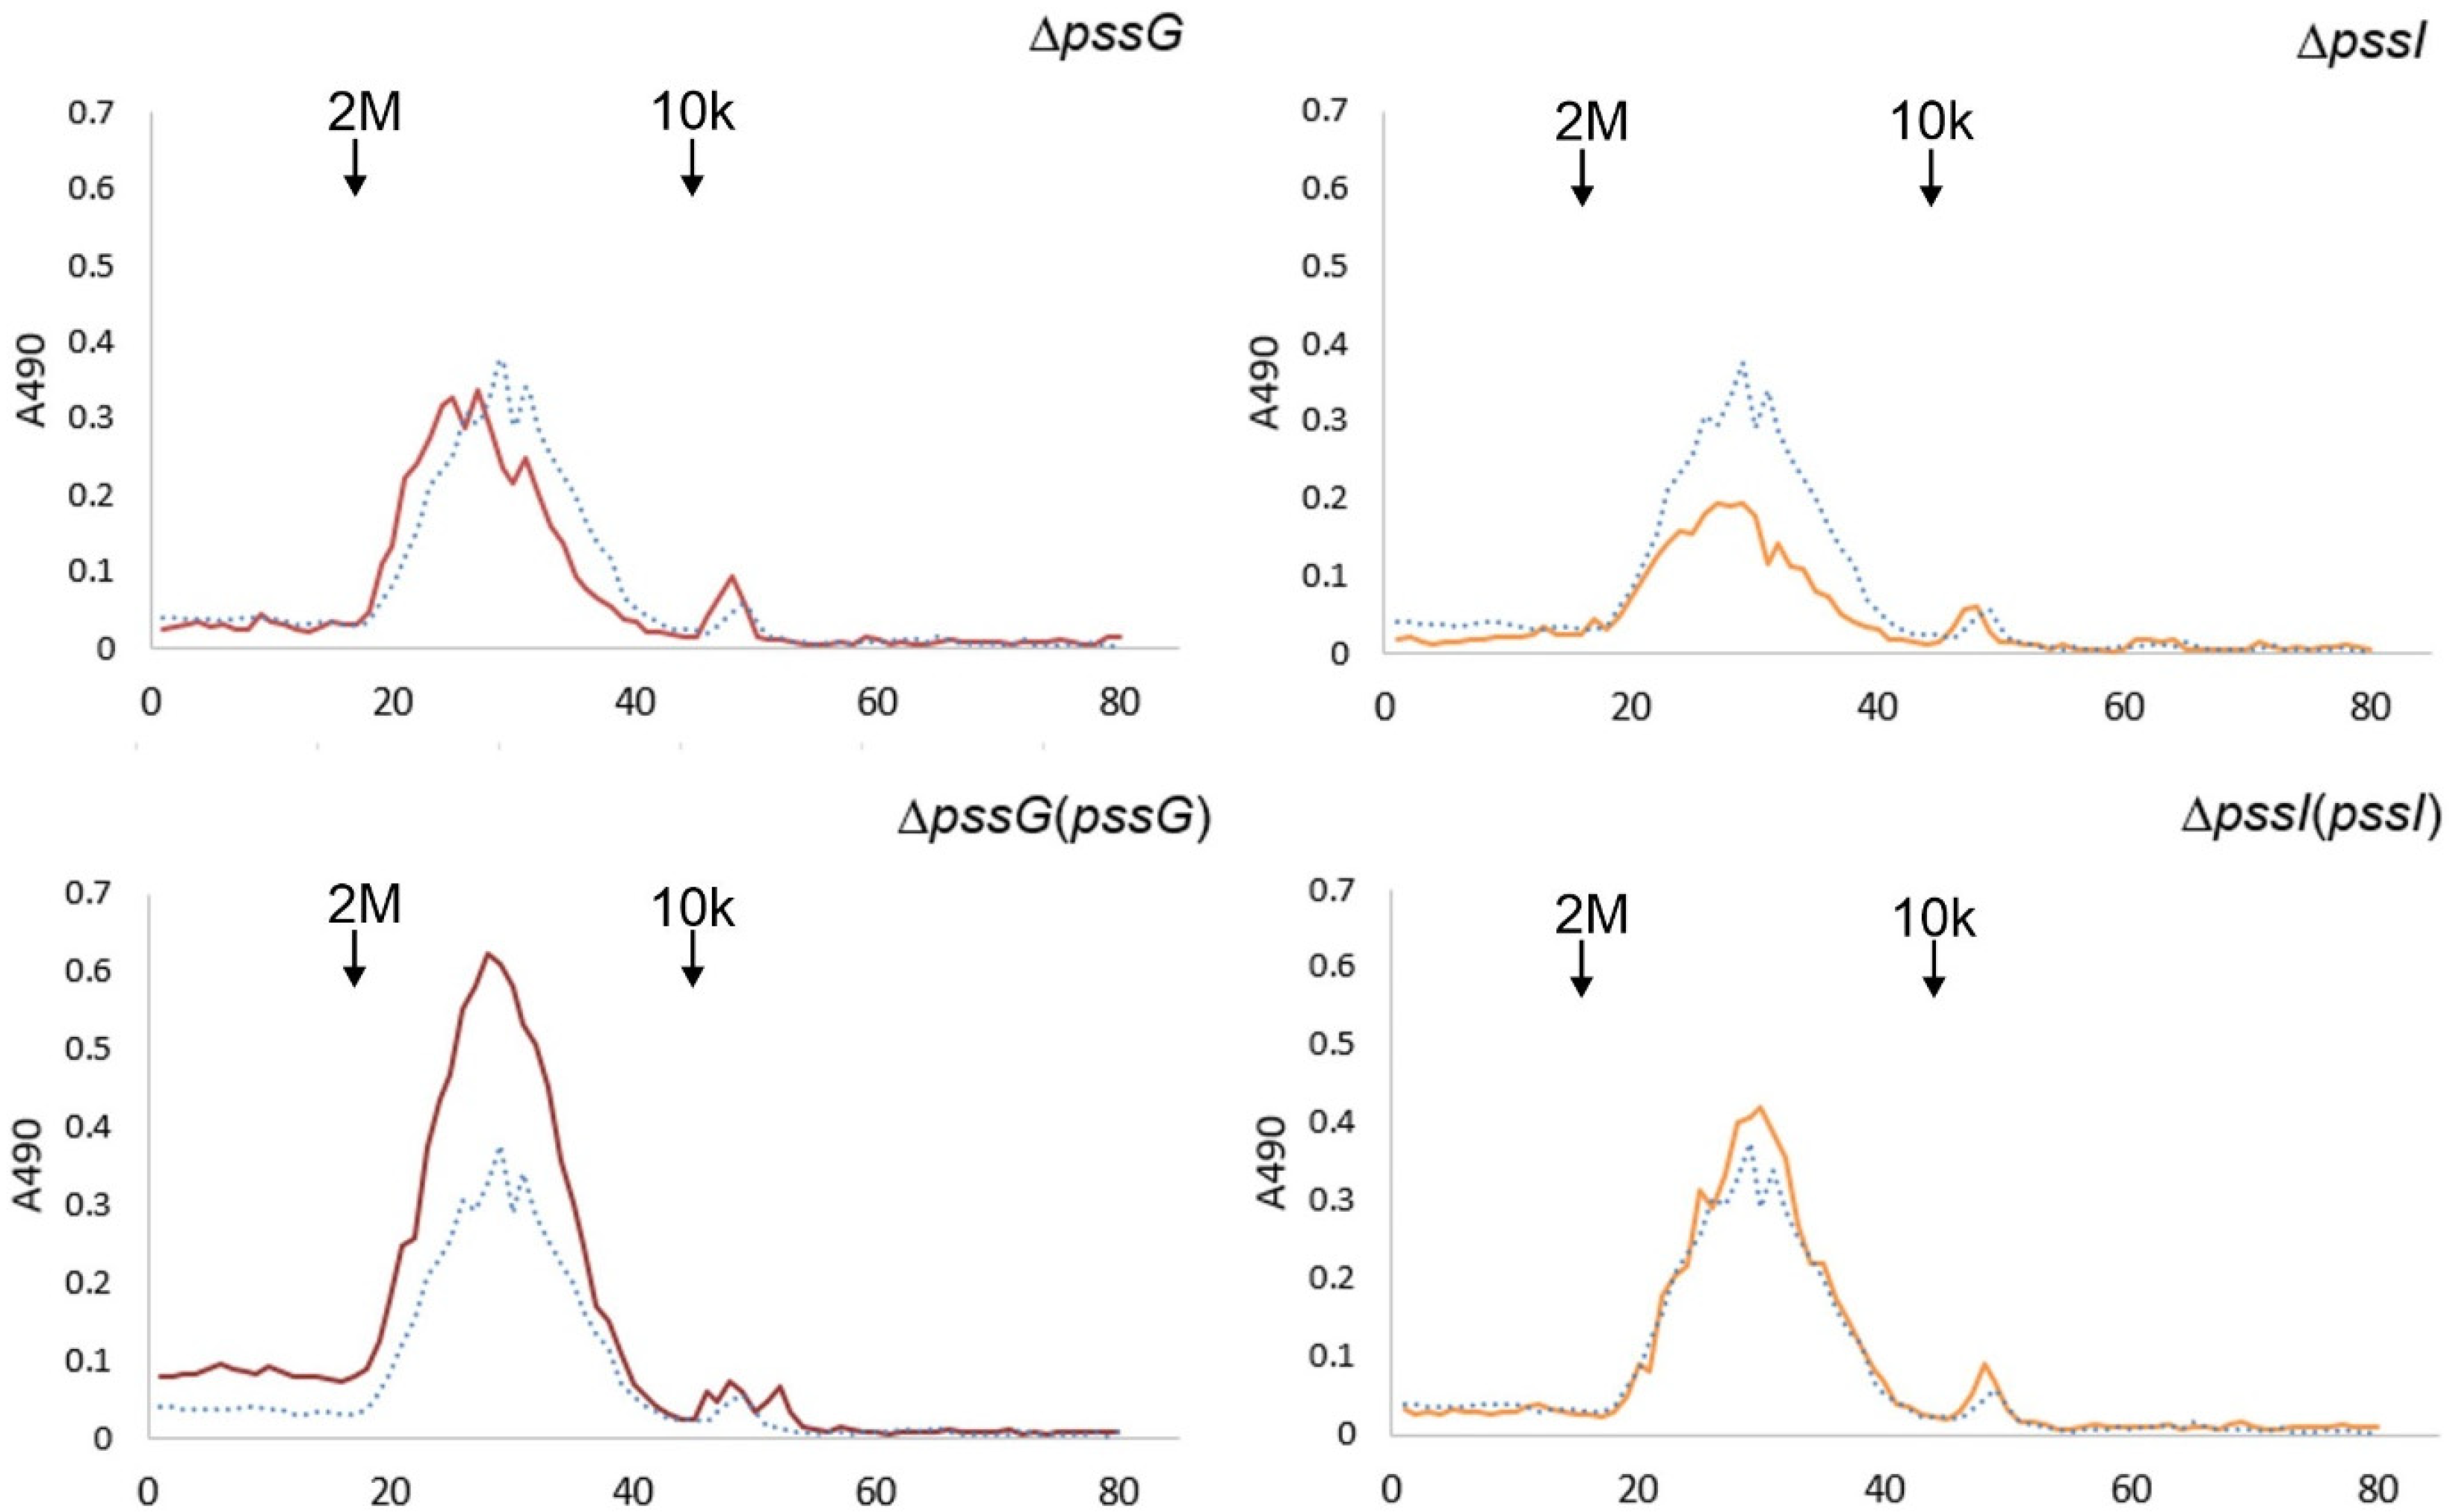
2.7. Single pssG or pssI Deletion Decreases the EPS Amount by Half
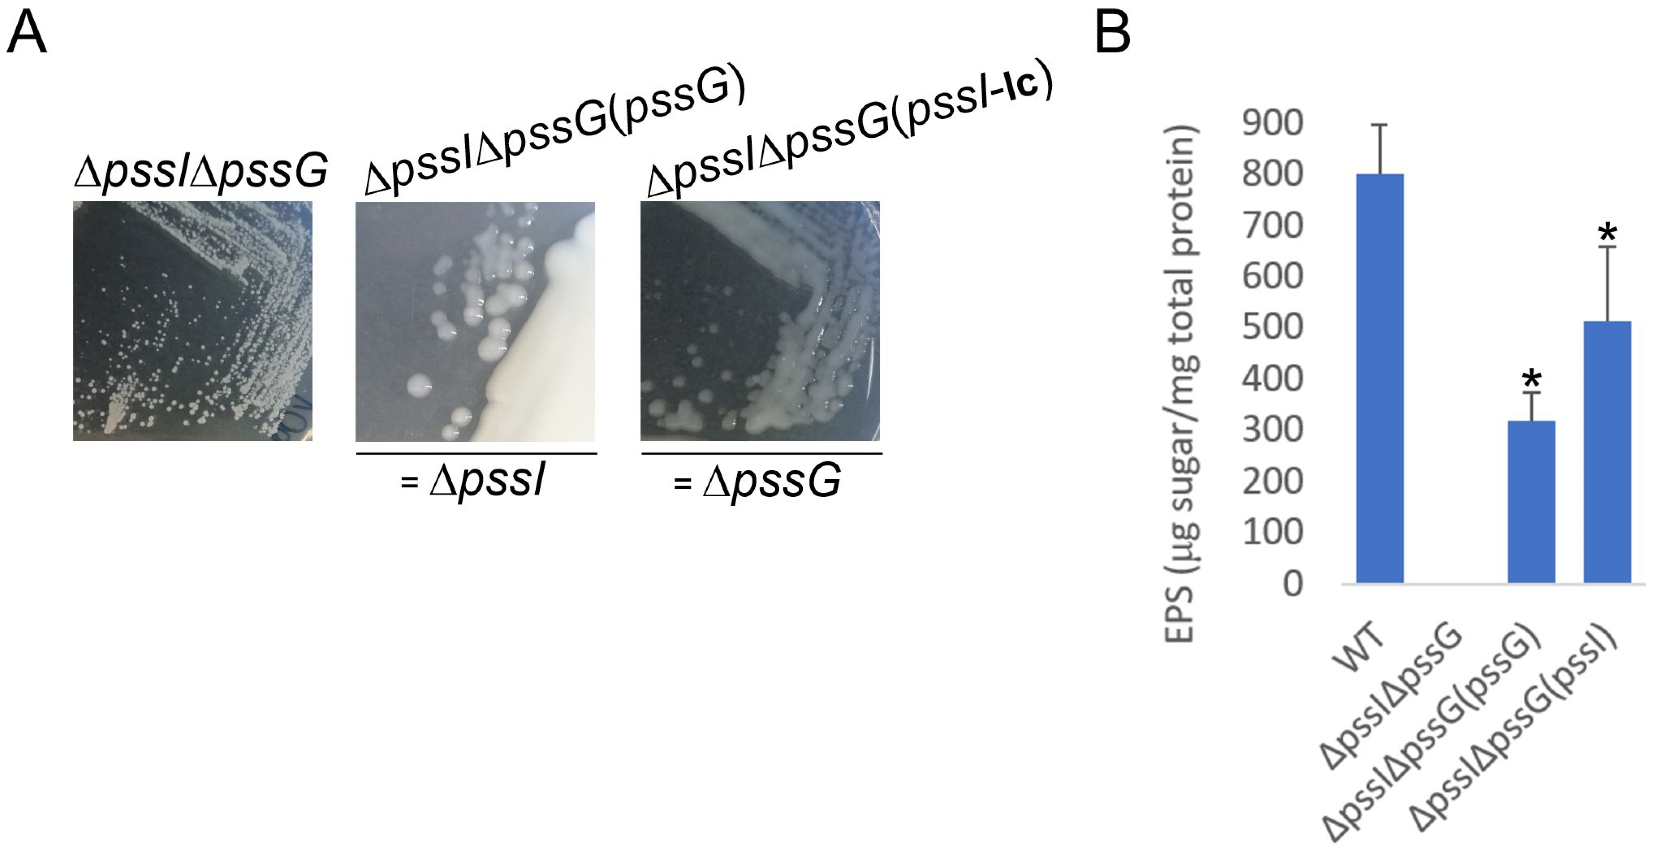
2.8. PssG and PssI Serve Complementary Functions in EPS Synthesis
3. Discussion
4. Materials and Methods
4.1. Bacterial Strains and Culture Conditions
4.2. Bioinformatic Analyses
4.3. Total RNA Isolation and cDNA Synthesis
4.4. DNA Techniques
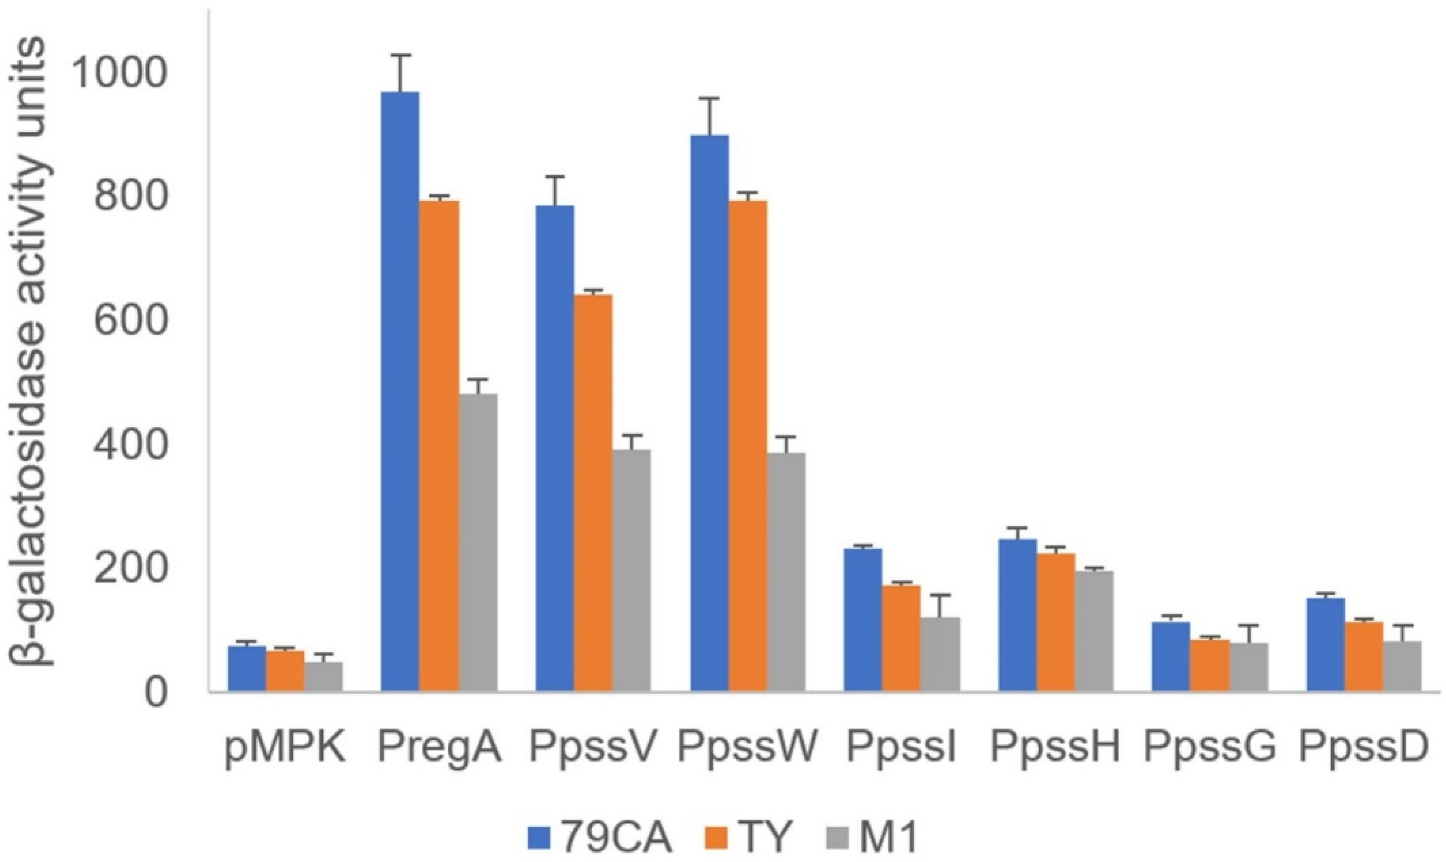
4.5. β-Galactosidase Activity Measurements of Transcriptional Fusions
4.6. Construction of the ΔpssI and ΔpssG Single Mutants, ΔpssIΔpssG Double Mutant, ΔGT10 Mutant, and Their Complemented Derivatives
4.7. General Analyses of Proteins
4.8. Subcellular Localization Study
4.8.1. Localization of Proteins in the Heterologous System
4.8.2. Localization of Proteins in the Homologous System
4.9. Purification and Solubilization of Inclusion Bodies
4.10. Protein Refolding and Pull-Down Assay
4.11. Topology Analyses
4.12. Bacterial Two-Hybrid Analysis
4.13. Exopolysaccharide Analyses
4.14. Sensitivity Tests
4.15. Statistical Analyses
Supplementary Materials
Author Contributions
Funding
Conflicts of Interest
References
- Mestrom, L.; Przypis, M.; Kowalczykiewicz, D.; Pollender, A.; Kumpf, A.; Marsden, S.R.; Bento, I.; Jarzębski, A.B.; Szymańska, K.; Chruściel, A.; et al. Leloir Glycosyltransferases in Applied Biocatalysis: A Multidisciplinary Approach. Int. J. Mol. Sci. 2019, 20, 5263. [Google Scholar] [CrossRef] [PubMed] [Green Version]
- Gloster, T.M. Advances in understanding glycosyltransferases from a structural perspective. Curr. Opin. Struct. Biol. 2014, 28, 131–141. [Google Scholar] [CrossRef] [PubMed] [Green Version]
- Lairson, L.L.; Henrissat, B.; Davies, G.J.; Withers, S.G. Glycosyltransferases: Structures, functions, and mechanisms. Annu. Rev. Biochem. 2008, 77, 521–555. [Google Scholar] [CrossRef] [Green Version]
- Liang, D.M.; Liu, J.H.; Wu, H.; Wang, B.B.; Zhu, H.J.; Qiao, J.J. Glycosyltransferases: Mechanisms and applications in natural product development. Chem. Soc. Rev. 2015, 44, 8350–8374. [Google Scholar] [CrossRef] [PubMed]
- Albesa-Jové, D.; Giganti, D.; Jackson, M.; Alzari, P.M.; Guerin, M.E. Structure-function relationships of membrane-associated GT-B glycosyltransferases. Glycobiology 2014, 24, 108–124. [Google Scholar] [CrossRef] [PubMed] [Green Version]
- Albuquerque-Wendt, A.; Hütte, H.J.; Buettner, F.F.R.; Routier, F.H.; Bakker, H. Membrane Topological Model of Glycosyltransferases of the GT-C Superfamily. Int. J. Mol. Sci. 2019, 20, 4842. [Google Scholar] [CrossRef] [PubMed] [Green Version]
- Bi, Y.; Hubbard, C.; Purushotham, P.; Zimmer, J. Insights into the structure and function of membrane-integrated processive glycosyltransferases. Curr. Opin. Struct. Biol. 2015, 34, 78–86. [Google Scholar] [CrossRef] [PubMed] [Green Version]
- Lizak, C.; Gerber, S.; Numao, S.; Aebi, M.; Locher, K.P. X-ray structure of a bacterial oligosaccharyltransferase. Nature 2011, 474, 350–355. [Google Scholar] [CrossRef]
- Zhang, H.; Zhu, F.; Yang, T.; Ding, L.; Zhou, M.; Li, J.; Haslam, S.M.; Dell, A.; Erlandsen, H.; Wu, H. The highly conserved domain of unknown function 1792 has a distinct glycosyltransferase fold. Nat. Commun. 2014, 5, 4339. [Google Scholar] [CrossRef] [Green Version]
- Kattke, M.D.; Gosschalk, J.E.; Martinez, O.E.; Kumar, G.; Gale, R.T.; Cascio, D.; Sawaya, M.R.; Philips, M.; Brown, E.D.; Clubb, R.T. Structure and mechanism of TagA, a novel membrane-associated glycosyltransferase that produces wall teichoic acids in pathogenic bacteria. PLoS Pathog. 2019, 15, e1007723. [Google Scholar] [CrossRef] [Green Version]
- Downie, J.A. The roles of extracellular proteins, polysaccharides and signals in the interactions of rhizobia with legume roots. FEMS Microbiol. Rev. 2010, 34, 150–170. [Google Scholar] [CrossRef] [PubMed]
- Gibson, K.E.; Kobayashi, H.; Walker, G.C. Molecular determinants of a symbiotic chronic infection. Annu. Rev. Genet. 2008, 42, 413–441. [Google Scholar] [CrossRef] [PubMed] [Green Version]
- Skorupska, A.; Janczarek, M.; Marczak, M.; Mazur, A.; Król, J. Rhizobial exopolysaccharides: Genetic control and symbiotic functions. Microb. Cell. Fact. 2006, 5, 7. [Google Scholar] [CrossRef] [PubMed] [Green Version]
- Philip-Hollingsworth, S.; Hollingsworth, R.I.; Dazzo, F.B. Host-range related structural features of the acidic extracellular polysaccharides of Rhizobium trifolii and Rhizobium leguminosarum. J. Biol. Chem. 1989, 264, 1461–1466. [Google Scholar] [CrossRef] [PubMed]
- Robertsen, B.K.; Åman, P.; Darvill, A.G.; McNeil, M.; Albersheim, P. Host-symbiont interactions. V. The structure of acidic extracellular polysaccharides secreted by Rhizobium leguminosarum and Rhizobium trifolii. Plant Physiol. 1981, 67, 389–400. [Google Scholar] [CrossRef] [Green Version]
- Islam, S.T.; Lam, J.S. Synthesis of bacterial polysaccharides via the Wzx/Wzy-dependent pathway. Can. J. Microbiol. 2014, 60, 697–716. [Google Scholar] [CrossRef] [Green Version]
- Schmid, J.; Heider, D.; Wendel, N.J.; Sperl, N.; Sieber, V. Bacterial glycosyltransferases: Challenges and opportunities of a highly diverse enzyme class toward tailoring natural products. Front. Microbiol. 2016, 7, 182. [Google Scholar] [CrossRef] [Green Version]
- Islam, S.T.; Eckford, P.D.; Jones, M.L.; Nugent, T.; Bear, C.E.; Vogel, C.; Lam, J.S. Proton-dependent gating and proton uptake by Wzx support O-antigen-subunit antiport across the bacterial inner membrane. mBio 2013, 4, e00678-13. [Google Scholar] [CrossRef] [Green Version]
- Król, J.E.; Mazur, A.; Marczak, M.; Skorupska, A. Syntenic arrangements of the surface polysaccharide biosynthesis genes in Rhizobium leguminosarum. Genomics 2007, 89, 237–247. [Google Scholar] [CrossRef] [Green Version]
- Marczak, M.; Mazur, A.; Koper, P.; Żebracki, K.; Skorupska, A. Synthesis of rhizobial exopolysaccharides and their importance for symbiosis with legume plants. Genes 2017, 8, 360. [Google Scholar] [CrossRef] [Green Version]
- Janczarek, M.; Rachwał, K.; Kopcińska, J. Genetic characterization of the Pss region and the role of PssS in exopolysaccharide production and symbiosis of Rhizobium leguminosarum bv. trifolii with clover. Plant Soil 2015, 396, 257–275. [Google Scholar] [CrossRef] [Green Version]
- Janczarek, M.; Rachwał, K.; Turska-Szewczuk, A. A mutation in pssE affects exopolysaccharide synthesis by Rhizobium leguminosarum bv. trifolii, its surface properties, and symbiosis with clover. Plant Soil 2017, 417, 331–347. [Google Scholar] [CrossRef] [Green Version]
- Król, J.; Wielbo, J.; Mazur, A.; Kopcińska, J.; Łotocka, B.; Golinowski, W.; Skorupska, A. Molecular characterization of pssCDE genes of Rhizobium leguminosarum bv. trifolii strain TA1: pssD mutant is affected in exopolysaccharide synthesis and endocytosis of bacteria. Mol. Plant Microbe Interact. 1998, 11, 1142–1148. [Google Scholar] [CrossRef] [PubMed] [Green Version]
- Pollock, T.J.; van Workum, W.A.; Thorne, L.; Mikolajczak, M.J.; Yamazaki, M.; Kijne, J.W.; Armentrout, R.W. Assignment of biochemical functions to glycosyl transferase genes which are essential for biosynthesis of exopolysaccharides in Sphingomonas strain S88 and Rhizobium leguminosarum. J. Bacteriol. 1998, 180, 586–593. [Google Scholar] [CrossRef] [Green Version]
- Mazur, A.; Marczak, M.; Król, J.E.; Skorupska, A. Topological and transcriptional analysis of pssL gene product: A putative Wzx-like exopolysaccharide translocase in Rhizobium leguminosarum bv. trifolii TA1. Arch. Microbiol. 2005, 184, 1–10. [Google Scholar] [CrossRef]
- Marczak, M.; Wójcik, M.; Żebracki, K.; Turska-Szewczuk, A.; Talarek, K.; Nowak, D.; Wawiórka, L.; Sieńczyk, M.; Łupicka-Słowik, A.; Bobrek, K.; et al. PssJ Is a Terminal Galactosyltransferase Involved in the Assembly of the Exopolysaccharide Subunit in Rhizobium Leguminosarum bv. Trifolii. Int. J. Mol. Sci. 2020, 21, 7764. [Google Scholar] [CrossRef]
- Janczarek, M.; Rachwał, K. Mutation in the pssA gene involved in exopolysaccharide synthesis leads to several physiological and symbiotic defects in Rhizobium leguminosarum bv. trifolii. Int. J. Mol. Sci. 2013, 14, 23711–23735. [Google Scholar] [CrossRef] [Green Version]
- Ksenzenko, V.N.; Ivashina, T.V.; Dubeikovskaya, Z.A.; Ivanov, S.G.; Nanazashvili, M.B.; Druzhinina, T.N.; Kalinchuk, N.A.; Shibaev, V.N. The pssA gene encodes UDP-glucose: Polyprenyl phosphate-glucosyl phosphotransferase initiating biosynthesis of Rhizobium leguminosarum exopolysaccharide. Russ. J. Bioorganic Chem. 2007, 33, 150–155. [Google Scholar] [CrossRef]
- Marczak, M.; Żebracki, K.; Koper, P.; Turska-Szewczuk, A.; Mazur, A.; Wydrych, J.; Wójcik, M.; Skorupska, A. Mgl2 Is a hypothetical methyltransferase involved in exopolysaccharide production, biofilm formation, and motility in Rhizobium leguminosarum bv. trifolii. Mol. Plant Microbe Interact. 2019, 32, 899–911. [Google Scholar] [CrossRef]
- Lipa, P.; Vinardell, J.M.; Kopcińska, J.; Zdybicka-Barabas, A.; Janczarek, M. Mutation in the pssZ Gene Negatively Impacts Exopolysaccharide Synthesis, Surface Properties, and Symbiosis of Rhizobium leguminosarum bv. trifolii with Clover. Genes 2018, 9, 369. [Google Scholar] [CrossRef] [Green Version]
- Katzen, F.; Becker, A.; Zorreguieta, A.; Pühler, A.; Ielpi, L. Promoter analysis of the Xanthomonas campestris pv. campestris gum operon directing biosynthesis of the xanthan polysaccharide. J. Bacteriol. 1996, 178, 4313–4318. [Google Scholar] [CrossRef] [PubMed] [Green Version]
- Chitnis, C.E.; Ohman, D.E. Genetic analysis of the alginate biosynthetic gene cluster of Pseudomonas aeruginosa shows evidence of an operonic structure. Mol. Microbiol. 1993, 8, 583–593. [Google Scholar] [CrossRef] [PubMed]
- Becker, A.; Kleickmann, A.; Keller, M.; Arnold, W.; Pühler, A. Identification and analysis of the Rhizobium meliloti exoAMONP genes involved in exopolysaccharide biosynthesis and mapping of promoters located on the exoHKLAMONP fragment. Mol. Gen. Genet. MGG 1993, 241, 367–379. [Google Scholar] [CrossRef] [PubMed]
- Marczak, M.; Żebracki, K.; Koper, P.; Horbowicz, A.; Wójcik, M.; Mazur, A. A New Face of the Old Gene: Deletion of the PssA, Encoding Monotopic Inner Membrane Phosphoglycosyl Transferase in Rhizobium leguminosarum, Leads to Diverse Phenotypes That Could Be Attributable to Downstream Effects of the Lack of Exopolysaccharide. Int. J. Mol. Sci. 2023, 24, 1035. [Google Scholar] [CrossRef] [PubMed]
- Breton, C.; Snajdrová, L.; Jeanneau, C.; Koca, J.; Imberty, A. Structures and mechanisms of glycosyltransferases. Glycobiology 2006, 16, 29R–37R. [Google Scholar] [CrossRef] [PubMed]
- Elazar, A.; Weinstein, J.J.; Prilusky, J.; Fleishman, S.J. Interplay between hydrophobicity and the positive-inside rule in determining membrane-protein topology. Proc. Natl. Acad. Sci. USA 2016, 113, 10340–10345. [Google Scholar] [CrossRef] [Green Version]
- Tsirigos, K.D.; Govindarajan, S.; Bassot, C.; Västermark, Å.; Lamb, J.; Shu, N.; Elofsson, A. Topology of membrane proteins-predictions, limitations and variations. Curr. Opin. Struct. Biol. 2018, 50, 9–17. [Google Scholar] [CrossRef]
- Entova, S.; Billod, J.M.; Swiecicki, J.M.; Martín-Santamaría, S.; Imperiali, B. Insights into the key determinants of membrane protein topology enable the identification of new monotopic folds. eLife 2018, 7, 40889. [Google Scholar] [CrossRef]
- Islam, S.T.; Taylor, V.L.; Qi, M.; Lam, J.S. Membrane topology mapping of the O-antigen flippase (Wzx), polymerase (Wzy), and ligase (WaaL) from Pseudomonas aeruginosa PAO1 reveals novel domain architectures. mBio 2010, 1, e00189-10. [Google Scholar] [CrossRef] [Green Version]
- Giménez-Andrés, M.; Čopič, A.; Antonny, B. The Many Faces of Amphipathic Helices. Biomolecules 2018, 8, 45. [Google Scholar] [CrossRef] [Green Version]
- González, V.; Santamaría, R.I.; Bustos, P.; Hernández-González, I.; Medrano-Soto, A.; Moreno-Hagelsieb, G.; Janga, S.C.; Ramírez, M.A.; Jiménez-Jacinto, V.; Collado-Vides, J.; et al. The partitioned Rhizobium etli genome: Genetic and metabolic redundancy in seven interacting replicons. Proc. Natl. Acad. Sci. USA 2006, 103, 3834–3839. [Google Scholar] [CrossRef] [Green Version]
- Young, J.P.; Crossman, L.C.; Johnston, A.W.; Thomson, N.R.; Ghazoui, Z.F.; Hull, K.H.; Wexler, M.; Curson, A.R.; Todd, J.D.; Poole, P.S.; et al. The genome of Rhizobium leguminosarum has recognizable core and accessory components. Genome Biol. 2006, 7, R34. [Google Scholar] [CrossRef] [Green Version]
- Wright, B.W.; Molloy, M.P.; Jaschke, P.R. Overlapping genes in natural and engineered genomes. Nat. Rev. Genet. 2022, 23, 154–168. [Google Scholar] [CrossRef]
- Mao, X.; Ma, Q.; Liu, B.; Chen, X.; Zhang, H.; Xu, Y. Revisiting operons: An analysis of the landscape of transcriptional units in E. coli. BMC Bioinform. 2015, 16, 356. [Google Scholar] [CrossRef] [Green Version]
- Cortes, T.; Schubert, O.T.; Rose, G.; Arnvig, K.B.; Comas, I.; Aebersold, R.; Young, D.B. Genome-wide mapping of transcriptional start sites defines an extensive leaderless transcriptome in Mycobacterium tuberculosis. Cell Rep. 2013, 5, 1121–1131. [Google Scholar] [CrossRef] [Green Version]
- Sharma, C.M.; Hoffmann, S.; Darfeuille, F.; Reignier, J.; Findeiss, S.; Sittka, A.; Chabas, S.; Reiche, K.; Hackermüller, J.; Reinhardt, R.; et al. The primary transcriptome of the major human pathogen Helicobacter pylori. Nature 2010, 464, 250–255. [Google Scholar] [CrossRef]
- Pelly, S.; Winglee, K.; Xia, F.F.; Stevens, R.L.; Bishai, W.R.; Lamichhane, G. REMap: Operon map of M. tuberculosis based on RNA sequence data. Tuberculosis 2016, 99, 70–80. [Google Scholar] [CrossRef] [Green Version]
- Tian, C.F.; Young, J.P.W. Genomics and Evolution of Rhizobia. In Ecology and Evolution of Rhizobia: Principles and Applications; Wang, E.T., Tian, C.F., Chen, W.F., Young, J.P.W., Chen, W.X., Eds.; Springer: Singapore, 2019; pp. 103–119. [Google Scholar]
- Wang, S.; Meade, A.; Lam, H.M.; Luo, H. Evolutionary Timeline and Genomic Plasticity Underlying the Lifestyle Diversity in Rhizobiales. mSystems 2020, 5, e00438-20. [Google Scholar] [CrossRef] [PubMed]
- Gevers, D.; Vandepoele, K.; Simillon, C.; Van de Peer, Y. Gene duplication and biased functional retention of paralogs in bacterial genomes. Trends Microbiol. 2004, 12, 148–154. [Google Scholar] [CrossRef] [PubMed]
- Janczarek, M. Environmental signals and regulatory pathways that influence exopolysaccharide production in rhizobia. Int. J. Mol. Sci. 2011, 12, 7898–7933. [Google Scholar] [CrossRef] [PubMed] [Green Version]
- Mendrygal, K.E.; González, J.E. Environmental regulation of exopolysaccharide production in Sinorhizobium meliloti. J. Bacteriol. 2000, 182, 599–606. [Google Scholar] [CrossRef] [PubMed] [Green Version]
- Morgan, J.L.; McNamara, J.T.; Zimmer, J. Mechanism of activation of bacterial cellulose synthase by cyclic di-GMP. Nat. Struct. Mol. Biol. 2014, 21, 489–496. [Google Scholar] [CrossRef] [PubMed] [Green Version]
- Bertani, G. Studies on lysogenesis. I. The mode of phage liberation by lysogenic Escherichia coli. J. Bacteriol. 1951, 62, 293–300. [Google Scholar] [CrossRef] [PubMed] [Green Version]
- Beringer, J.E. R factor transfer in Rhizobium leguminosarum. J. Gen. Microbiol. 1974, 84, 188–198. [Google Scholar] [CrossRef] [Green Version]
- Brown, C.M.; Dilworth, M.J. Ammonia assimilation by Rhizobium cultures and bacteroids. J. Gen. Microbiol. 1975, 86, 39–48. [Google Scholar] [CrossRef] [Green Version]
- Kowalczuk, E.; Lorkiewicz, Z. Transfer of RP4 and R68.45 factors to Rhizobium. Acta Microbiol. Pol. 1979, 28, 221–229. [Google Scholar]
- Taboada, B.; Estrada, K.; Ciria, R.; Merino, E. Operon-mapper: A web server for precise operon identification in bacterial and archaeal genomes. Bioinformatics 2018, 34, 4118–4120. [Google Scholar] [CrossRef] [Green Version]
- Tjaden, B. A computational system for identifying operons based on RNA-seq data. Methods 2020, 176, 62–70. [Google Scholar] [CrossRef]
- Reese, M.G. Application of a time-delay neural network to promoter annotation in the Drosophila melanogaster genome. Comput. Chem. 2001, 26, 51–56. [Google Scholar] [CrossRef]
- Klucar, L.; Stano, M.; Hajduk, M. phiSITE: Database of gene regulation in bacteriophages. Nucleic Acids Res. 2010, 38, D366–D370. [Google Scholar] [CrossRef]
- Lesnik, E.A.; Sampath, R.; Levene, H.B.; Henderson, T.J.; McNeil, J.A.; Ecker, D.J. Prediction of rho-independent transcriptional terminators in Escherichia coli. Nucleic Acids Res. 2001, 29, 3583–3594. [Google Scholar] [CrossRef] [PubMed] [Green Version]
- Camacho, C.; Coulouris, G.; Avagyan, V.; Ma, N.; Papadopoulos, J.; Bealer, K.; Madden, T.L. BLAST+: Architecture and applications. BMC Bioinform. 2009, 10, 421. [Google Scholar] [CrossRef] [PubMed] [Green Version]
- Sievers, F.; Higgins, D.G. Clustal Omega for making accurate alignments of many protein sequences. Protein Sci. 2018, 27, 135–145. [Google Scholar] [CrossRef] [PubMed] [Green Version]
- Waterhouse, A.M.; Procter, J.B.; Martin, D.M.; Clamp, M.; Barton, G.J. Jalview Version 2—A multiple sequence alignment editor and analysis workbench. Bioinformatics 2009, 25, 1189–1191. [Google Scholar] [CrossRef] [Green Version]
- Dobson, L.; Reményi, I.; Tusnády, G.E. CCTOP: A Consensus Constrained TOPology prediction web server. Nucleic Acids Res. 2015, 43, W408–W412. [Google Scholar] [CrossRef] [Green Version]
- Kelley, L.A.; Mezulis, S.; Yates, C.M.; Wass, M.N.; Sternberg, M.J. The Phyre2 web portal for protein modeling, prediction and analysis. Nat. Protoc. 2015, 10, 845–858. [Google Scholar] [CrossRef] [Green Version]
- Ashkenazy, H.; Abadi, S.; Martz, E.; Chay, O.; Mayrose, I.; Pupko, T.; Ben-Tal, N. ConSurf 2016: An improved methodology to estimate and visualize evolutionary conservation in macromolecules. Nucleic Acids Res. 2016, 44, W344–W350. [Google Scholar] [CrossRef] [Green Version]
- Gautier, R.; Douguet, D.; Antonny, B.; Drin, G. HELIQUEST: A web server to screen sequences with specific alpha-helical properties. Bioinformatics 2008, 24, 2101–2102. [Google Scholar] [CrossRef] [Green Version]
- Sambrook, J.; Russell, D.W. Molecular Cloning: A Laboratory Manual, 3rd ed.; Cold Spring Harbor Laboratory Press: New York, NY, USA, 2001. [Google Scholar]
- Żebracki, K.; Koper, P.; Marczak, M.; Skorupska, A.; Mazur, A. Plasmid-Encoded RepA Proteins Specifically Autorepress Individual repABC Operons in the Multipartite Rhizobium leguminosarum bv. trifolii Genome. PLoS ONE 2015, 10, e0131907. [Google Scholar] [CrossRef] [Green Version]
- Garg, B.; Dogra, R.C.; Sharma, P.K. High-efficiency transformation of Rhizobium leguminosarum by electroporation. Appl. Environ. Microbiol. 1999, 65, 2802–2804. [Google Scholar] [CrossRef] [Green Version]
- Miller, J.H. Assay of β-galactosidase. In Experiments in Molecular Genetics; Miller, J.H., Ed.; Cold Spring Harbor Laboratory Press: New York, NY, USA, 1972; pp. 352–355. [Google Scholar]
- Marx, C.J.; Lidstrom, M.E. Broad-host-range cre-lox system for antibiotic marker recycling in gram-negative bacteria. BioTechniques 2002, 33, 1062–1067. [Google Scholar] [CrossRef] [PubMed] [Green Version]
- Simon, R.; Priefer, U.; Pühler, A. A broad host range mobilization system for in vivo genetic engineering: Transposon mutagenesis in Gram negative bacteria. Bio/Technology 1983, 1, 784–791. [Google Scholar] [CrossRef]
- Marczak, M.; Dźwierzyńska, M.; Skorupska, A. Homo- and heterotypic interactions between Pss proteins involved in the exopolysaccharide transport system in Rhizobium leguminosarum bv. trifolii. Biol. Chem. 2013, 394, 541–559. [Google Scholar] [CrossRef] [PubMed]
- Janczarek, M.; Skorupska, A. The Rhizobium leguminosarum bv. trifolii pssB gene product is an inositol monophosphatase that influences exopolysaccharide synthesis. Arch. Microbiol. 2001, 175, 143–151. [Google Scholar] [CrossRef] [PubMed]
- Marczak, M.; Matysiak, P.; Kutkowska, J.; Skorupska, A. PssP2 is a polysaccharide co-polymerase involved in exopolysaccharide chain-length determination in Rhizobium leguminosarum. PLoS ONE 2014, 9, e109106. [Google Scholar] [CrossRef] [Green Version]
- Dubois, M.; Gilles, K.A.; Hamilton, J.K.; Rebers, P.A.; Smith, F. Colorimetric method for determination of sugars and related substances. Anal. Chem. 1956, 28, 350–356. [Google Scholar] [CrossRef]
- Karimova, G.; Pidoux, J.; Ullmann, A.; Ladant, D. A bacterial two-hybrid system based on a reconstituted signal transduction pathway. Proc. Natl. Acad. Sci. USA 1998, 95, 5752–5756. [Google Scholar] [CrossRef] [Green Version]
- Kovach, M.E.; Elzer, P.H.; Hill, D.S.; Robertson, G.T.; Farris, M.A.; Roop, R.M.; Peterson, K.M. Four new derivatives of the broad-host-range cloning vector pBBR1MCS, carrying different antibiotic-resistance cassettes. Gene 1995, 166, 175–176. [Google Scholar] [CrossRef]
- Jones, J.; Gutterson, N. An efficient mobilizable cosmid vector, pRK7813, and its use in a rapid method for marker exchange in Pseudomonas fluorescens strain HV37a. Gene 1987, 61, 299–306. [Google Scholar] [CrossRef]
- Chakravorty, A.K.; Zurkowski, W.; Shine, J.; Rolfe, B.G. Symbiotic nitrogen fixation: Molecular cloning of Rhizobium genes involved in exopolysaccharide synthesis and effective nodulation. J. Mol. Appl. Genet. 1982, 1, 585–596. [Google Scholar]


Disclaimer/Publisher’s Note: The statements, opinions and data contained in all publications are solely those of the individual author(s) and contributor(s) and not of MDPI and/or the editor(s). MDPI and/or the editor(s) disclaim responsibility for any injury to people or property resulting from any ideas, methods, instructions or products referred to in the content. |
© 2023 by the authors. Licensee MDPI, Basel, Switzerland. This article is an open access article distributed under the terms and conditions of the Creative Commons Attribution (CC BY) license (https://creativecommons.org/licenses/by/4.0/).
Share and Cite
Żebracki, K.; Horbowicz, A.; Marczak, M.; Turska-Szewczuk, A.; Koper, P.; Wójcik, K.; Romańczuk, M.; Wójcik, M.; Mazur, A. Exopolysaccharide Biosynthesis in Rhizobium leguminosarum bv. trifolii Requires a Complementary Function of Two Homologous Glycosyltransferases PssG and PssI. Int. J. Mol. Sci. 2023, 24, 4248. https://doi.org/10.3390/ijms24044248
Żebracki K, Horbowicz A, Marczak M, Turska-Szewczuk A, Koper P, Wójcik K, Romańczuk M, Wójcik M, Mazur A. Exopolysaccharide Biosynthesis in Rhizobium leguminosarum bv. trifolii Requires a Complementary Function of Two Homologous Glycosyltransferases PssG and PssI. International Journal of Molecular Sciences. 2023; 24(4):4248. https://doi.org/10.3390/ijms24044248
Chicago/Turabian StyleŻebracki, Kamil, Aleksandra Horbowicz, Małgorzata Marczak, Anna Turska-Szewczuk, Piotr Koper, Klaudia Wójcik, Marceli Romańczuk, Magdalena Wójcik, and Andrzej Mazur. 2023. "Exopolysaccharide Biosynthesis in Rhizobium leguminosarum bv. trifolii Requires a Complementary Function of Two Homologous Glycosyltransferases PssG and PssI" International Journal of Molecular Sciences 24, no. 4: 4248. https://doi.org/10.3390/ijms24044248