
Identification and Biological Validation of a Chemokine/Chemokine Receptor-Based Risk Model for Predicting Immunotherapeutic Response and Prognosis in Head and Neck Squamous Cell Carcinoma

Abstract
:1. Introduction
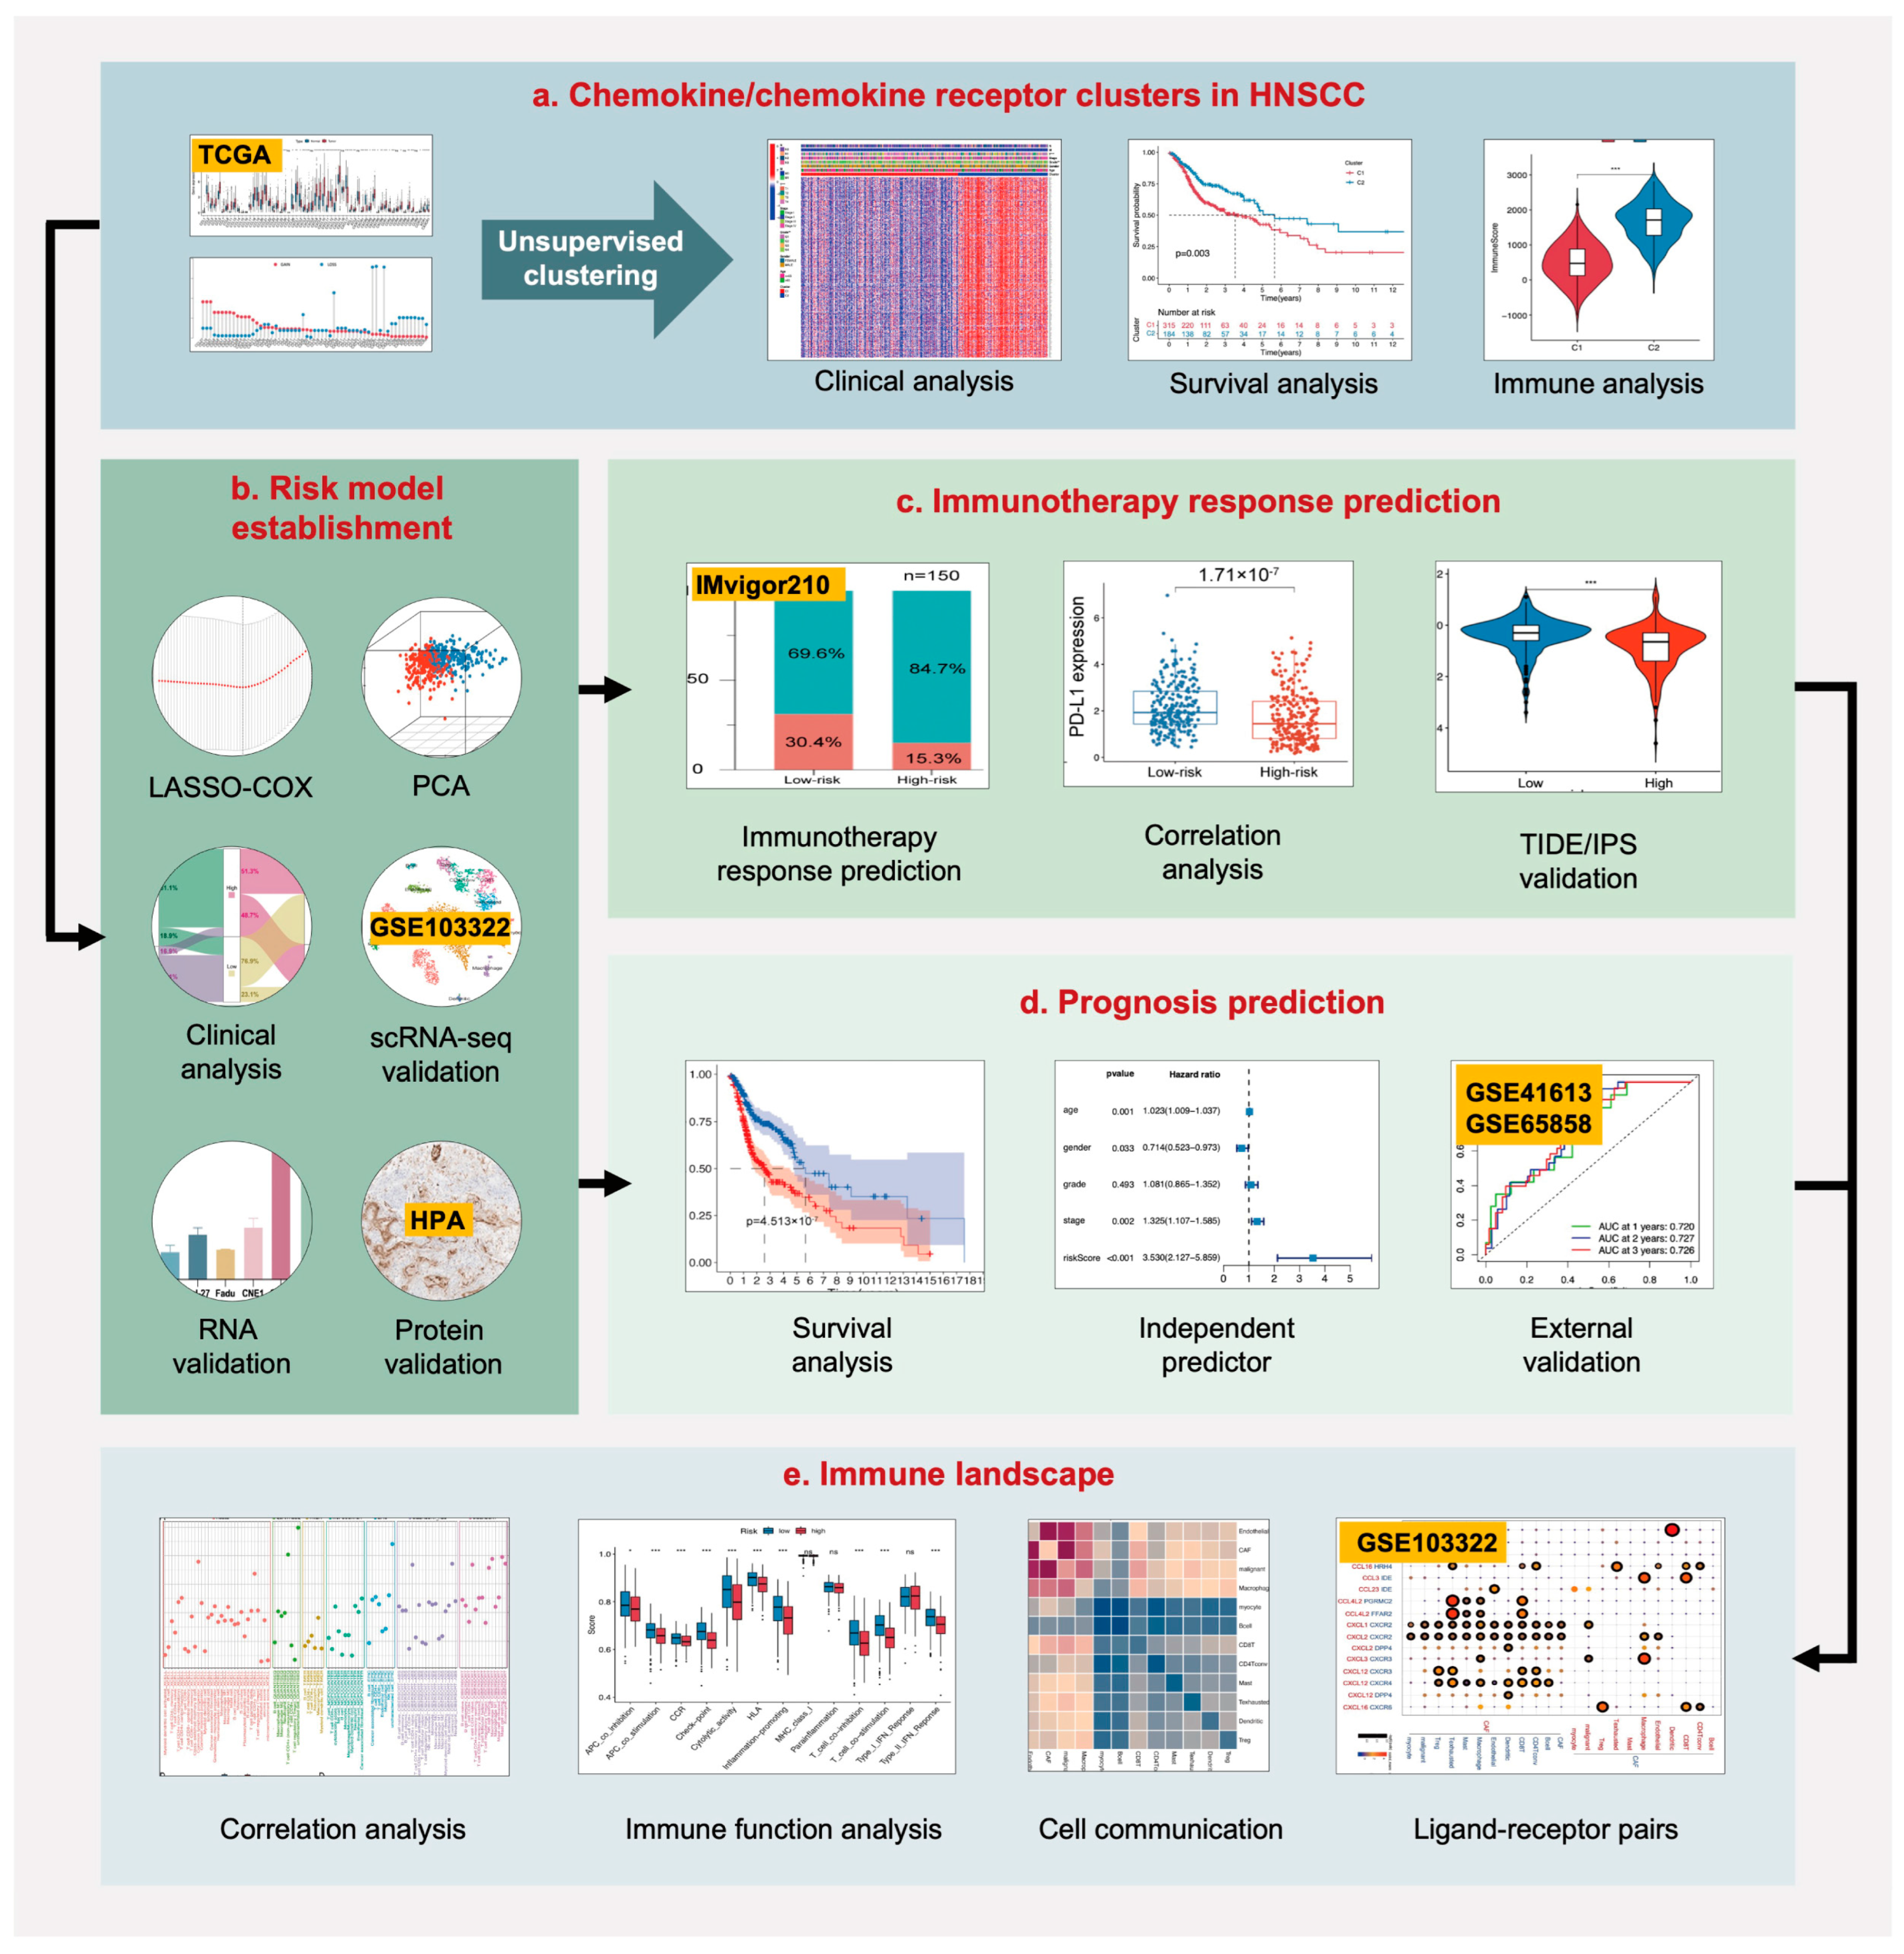
2. Results
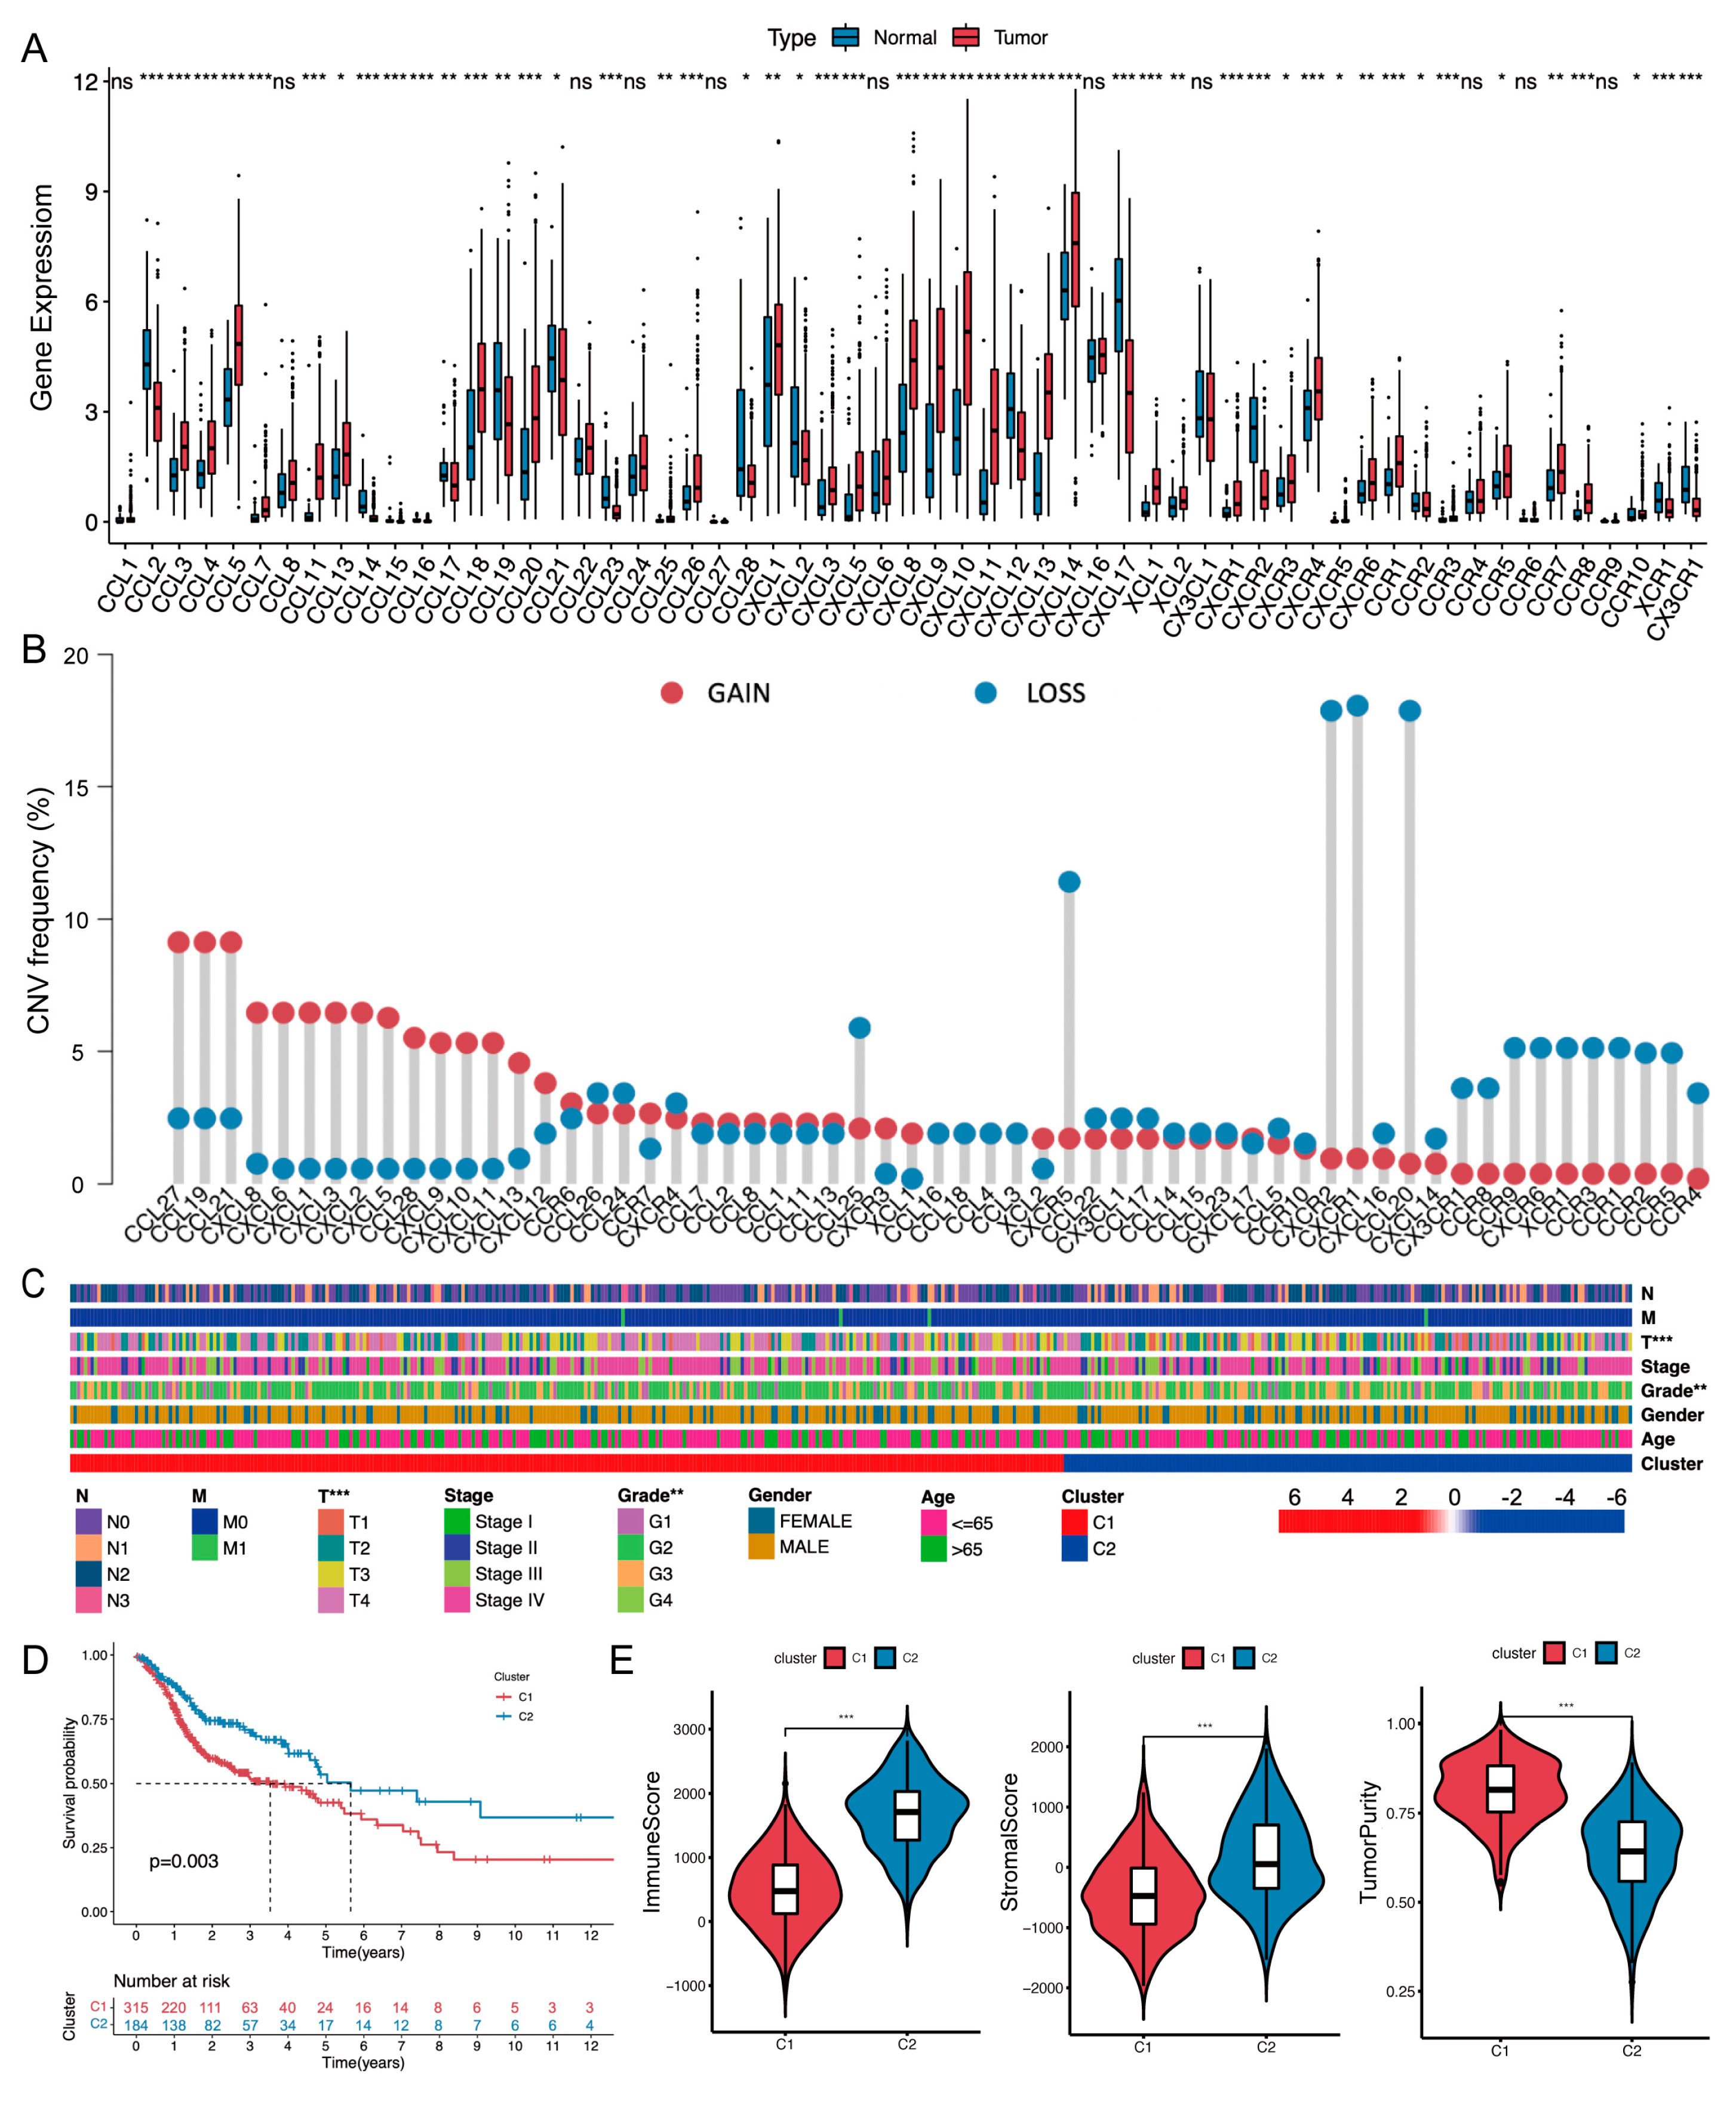
2.1. Chemokine/Chemokine Receptor Clusters in the TCGA-HNSCC Cohort
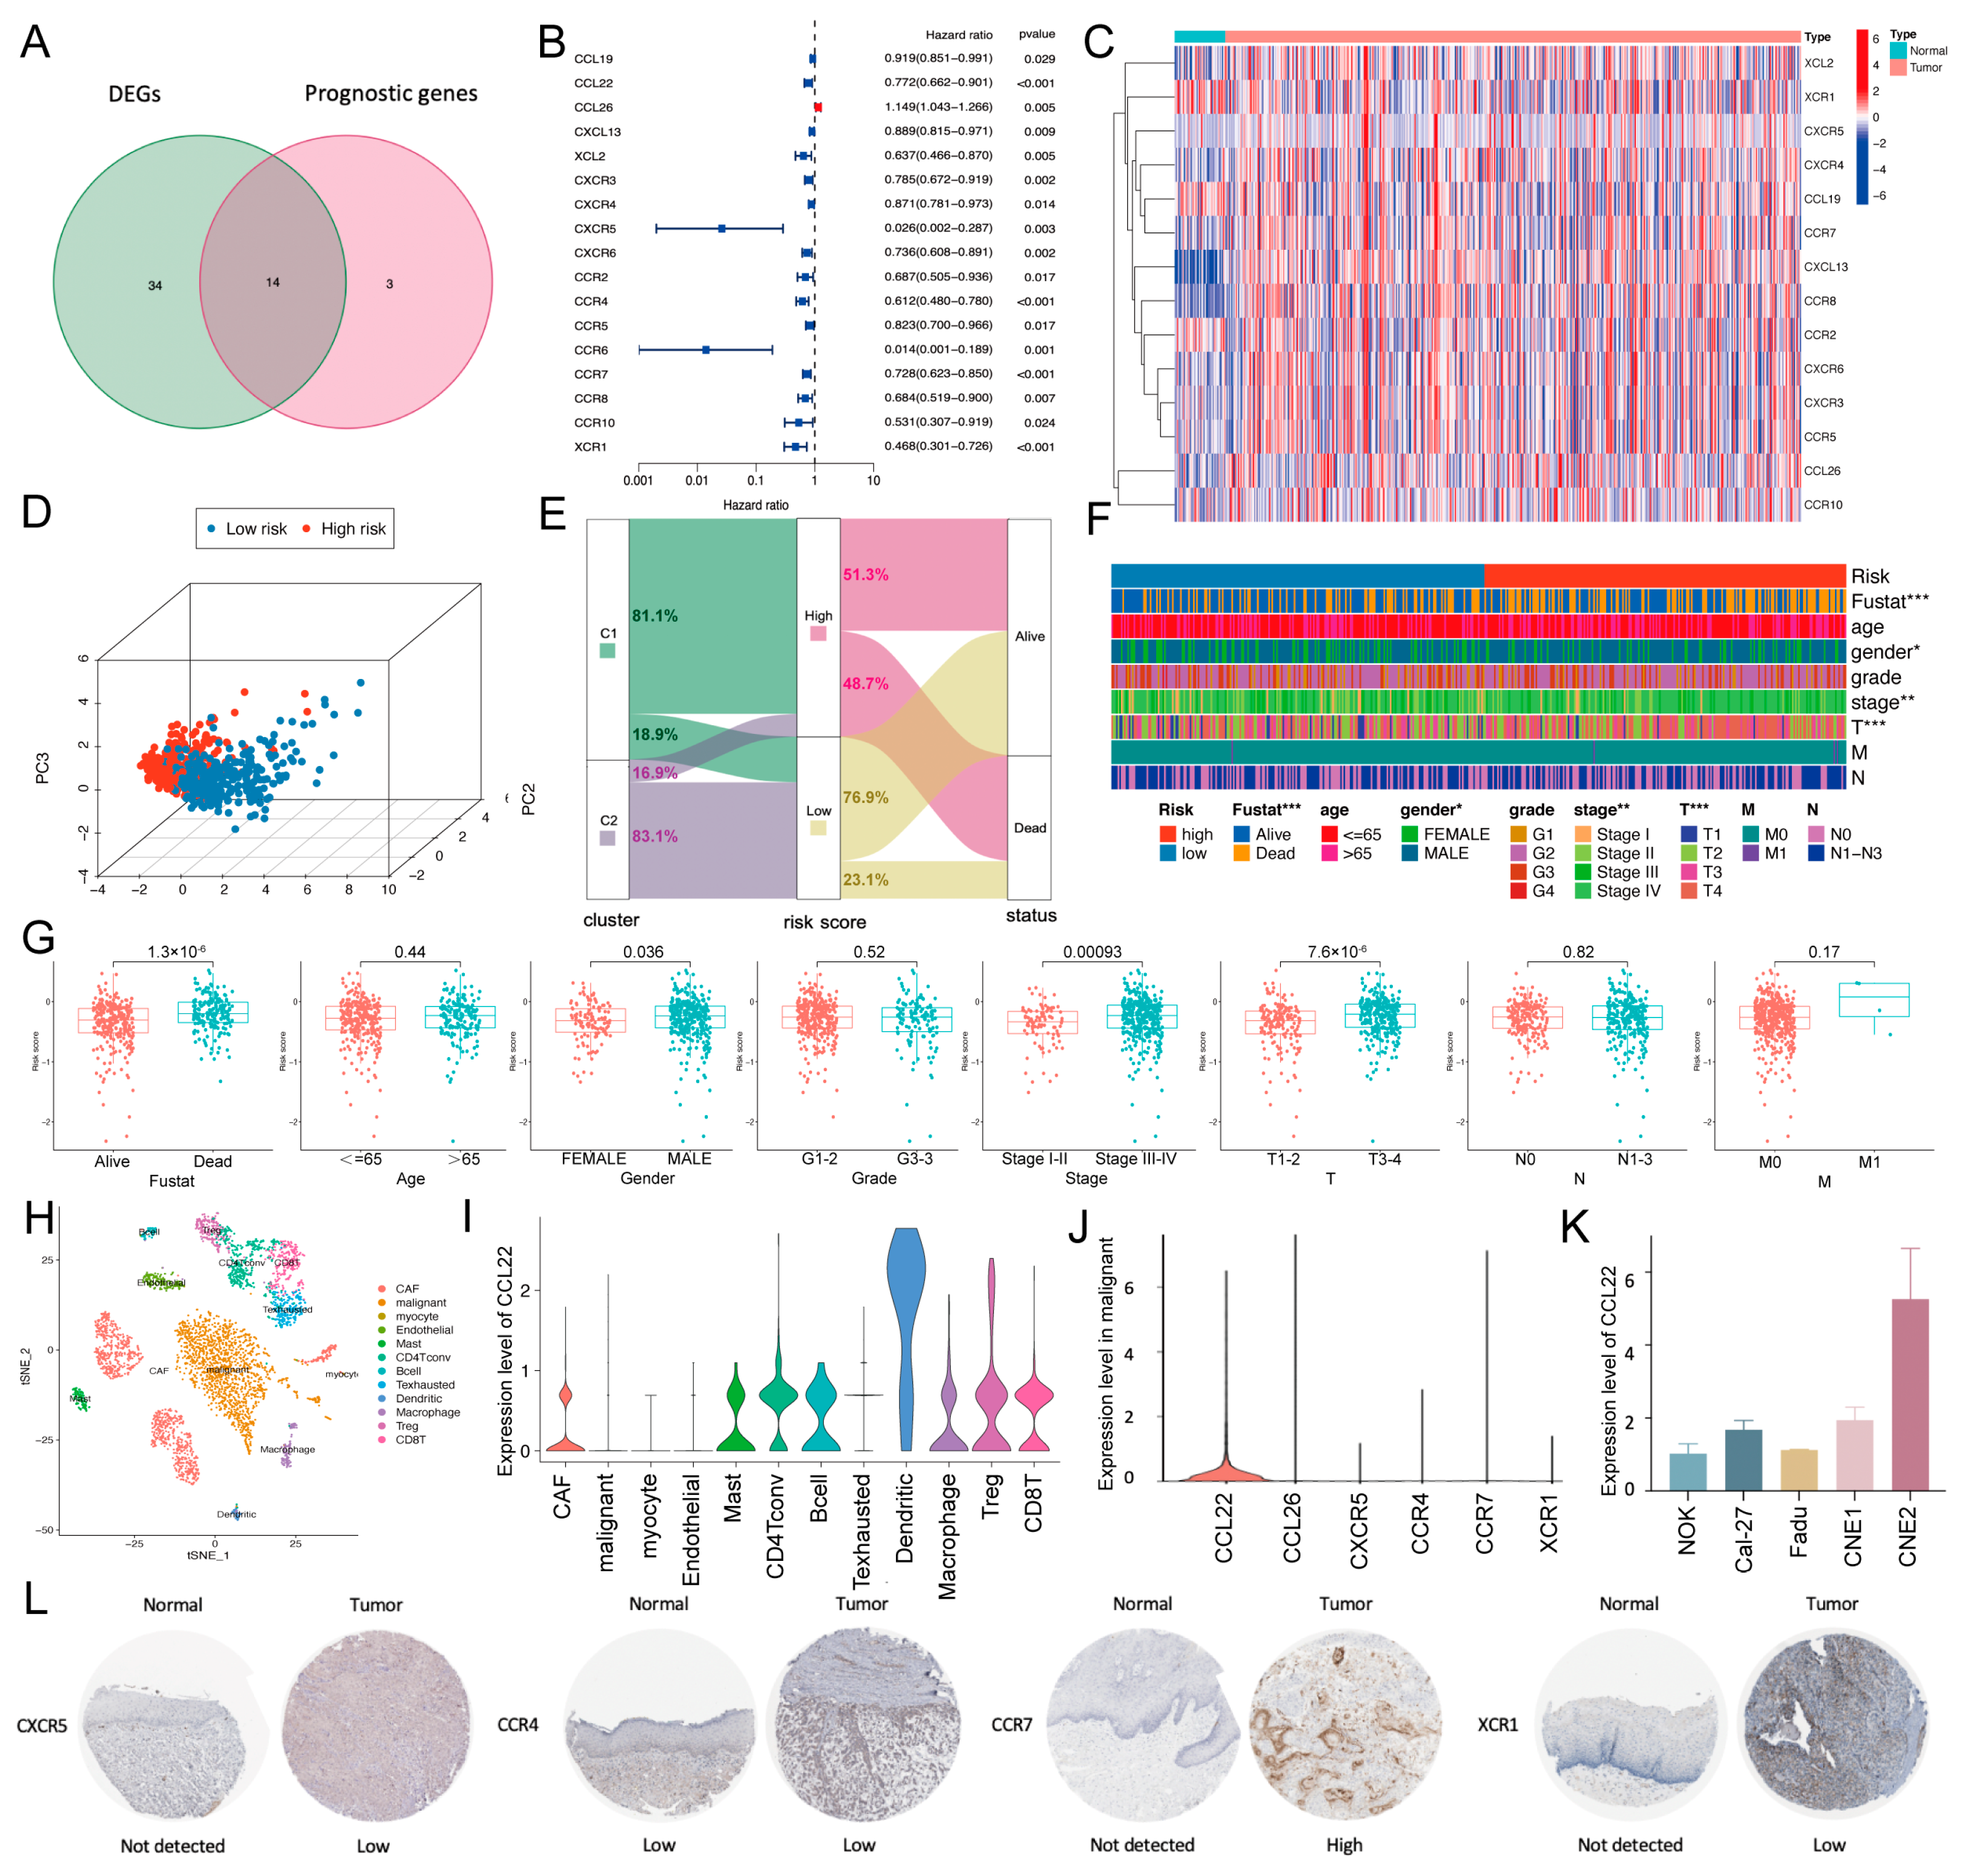
2.2. Establishment and Validation of a Chemokine/Chemokine Receptor-Based Risk Model
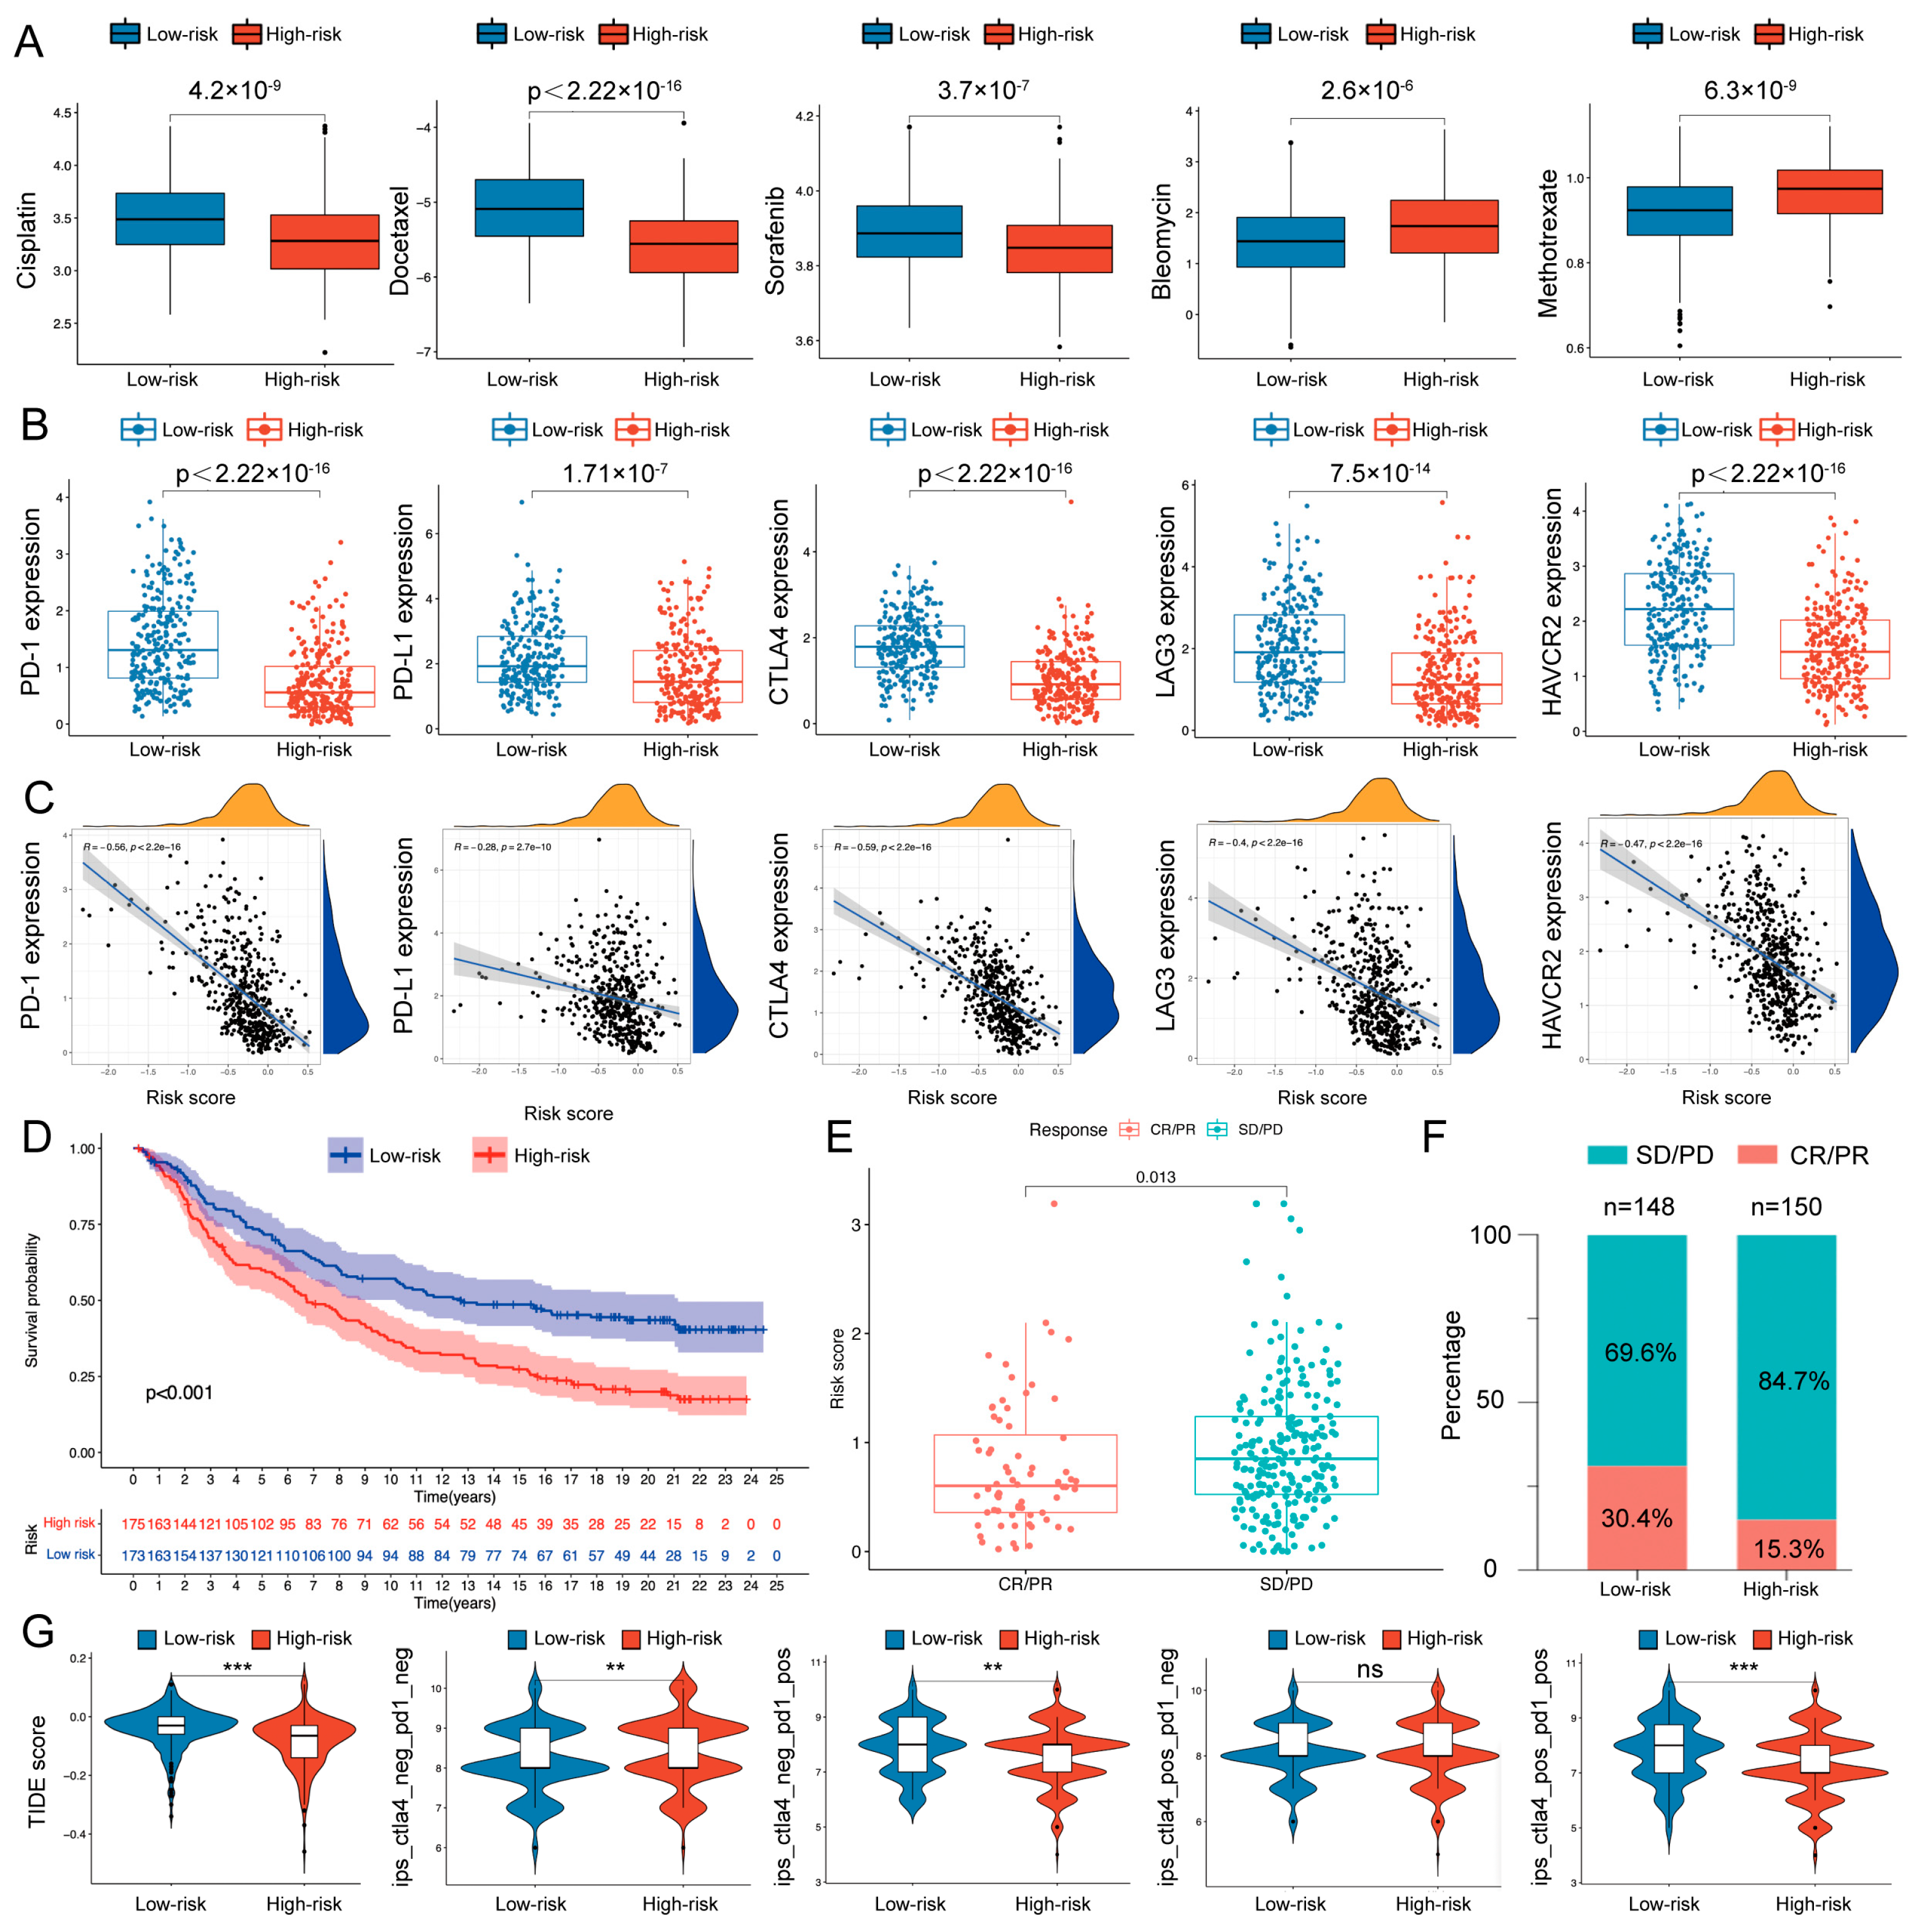
2.3. Therapeutic Response Prediction and Validation of the Risk Model
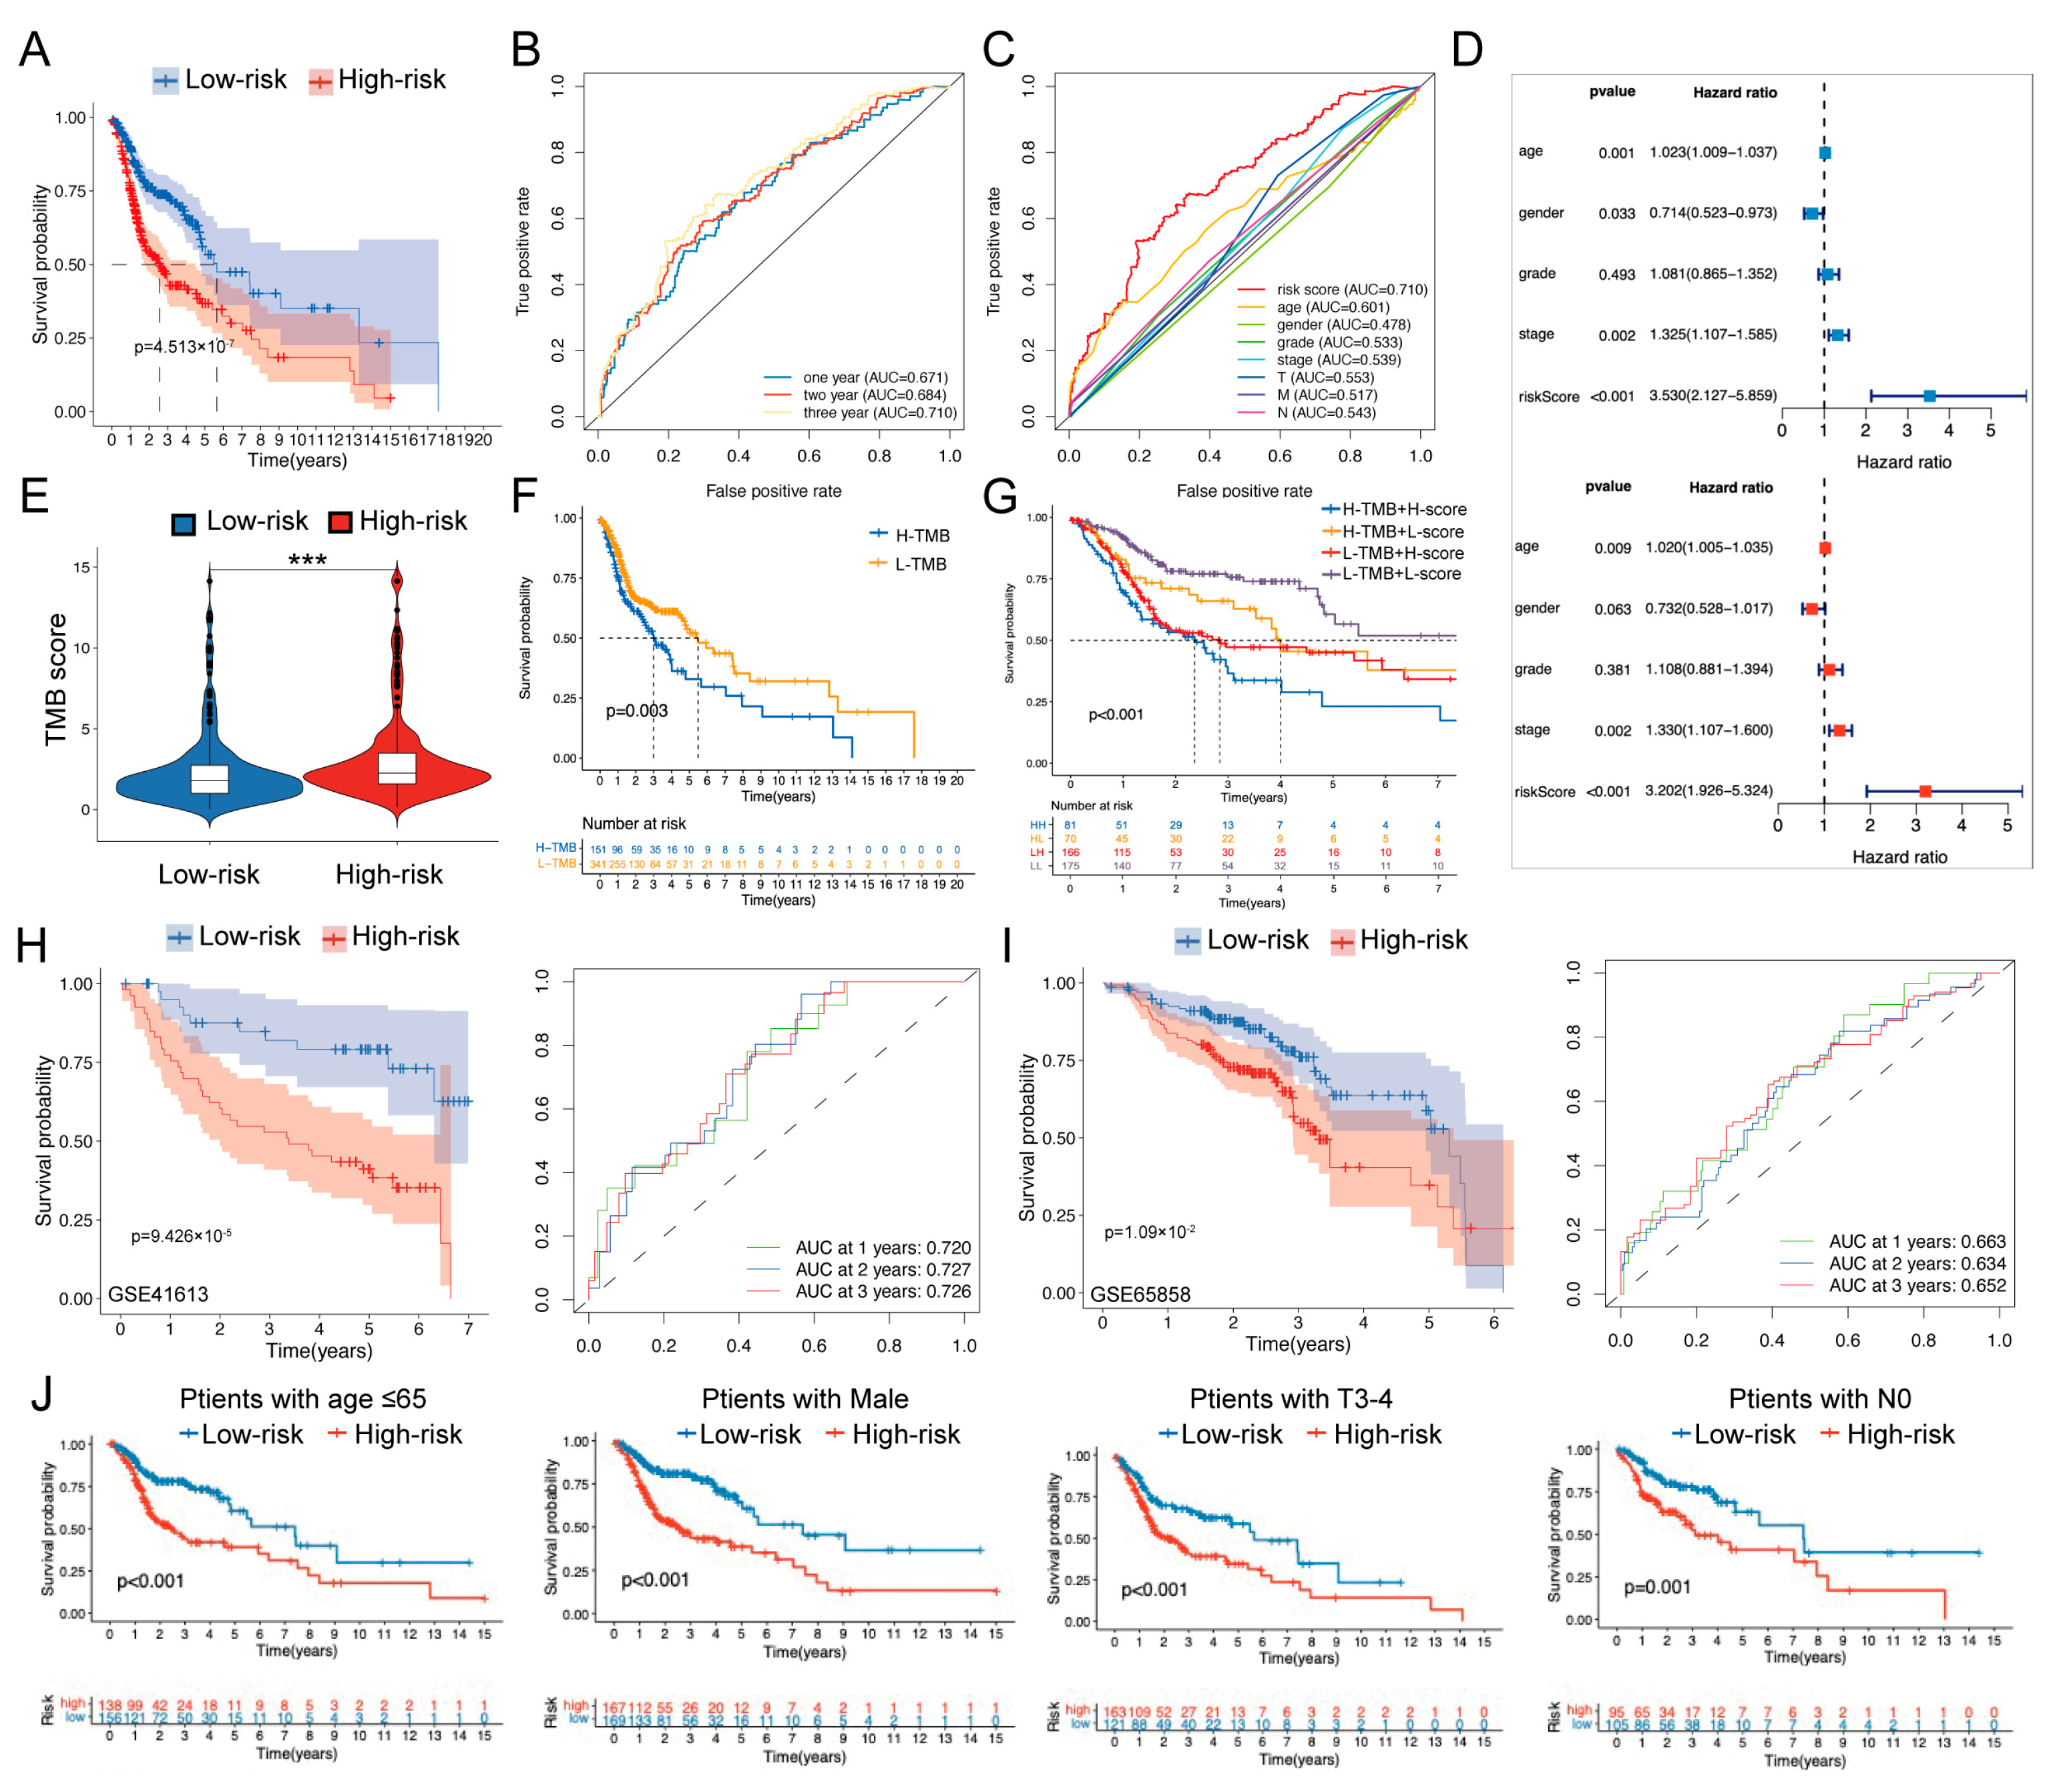
2.4. Prognosis Prediction and Validation of the Risk Model
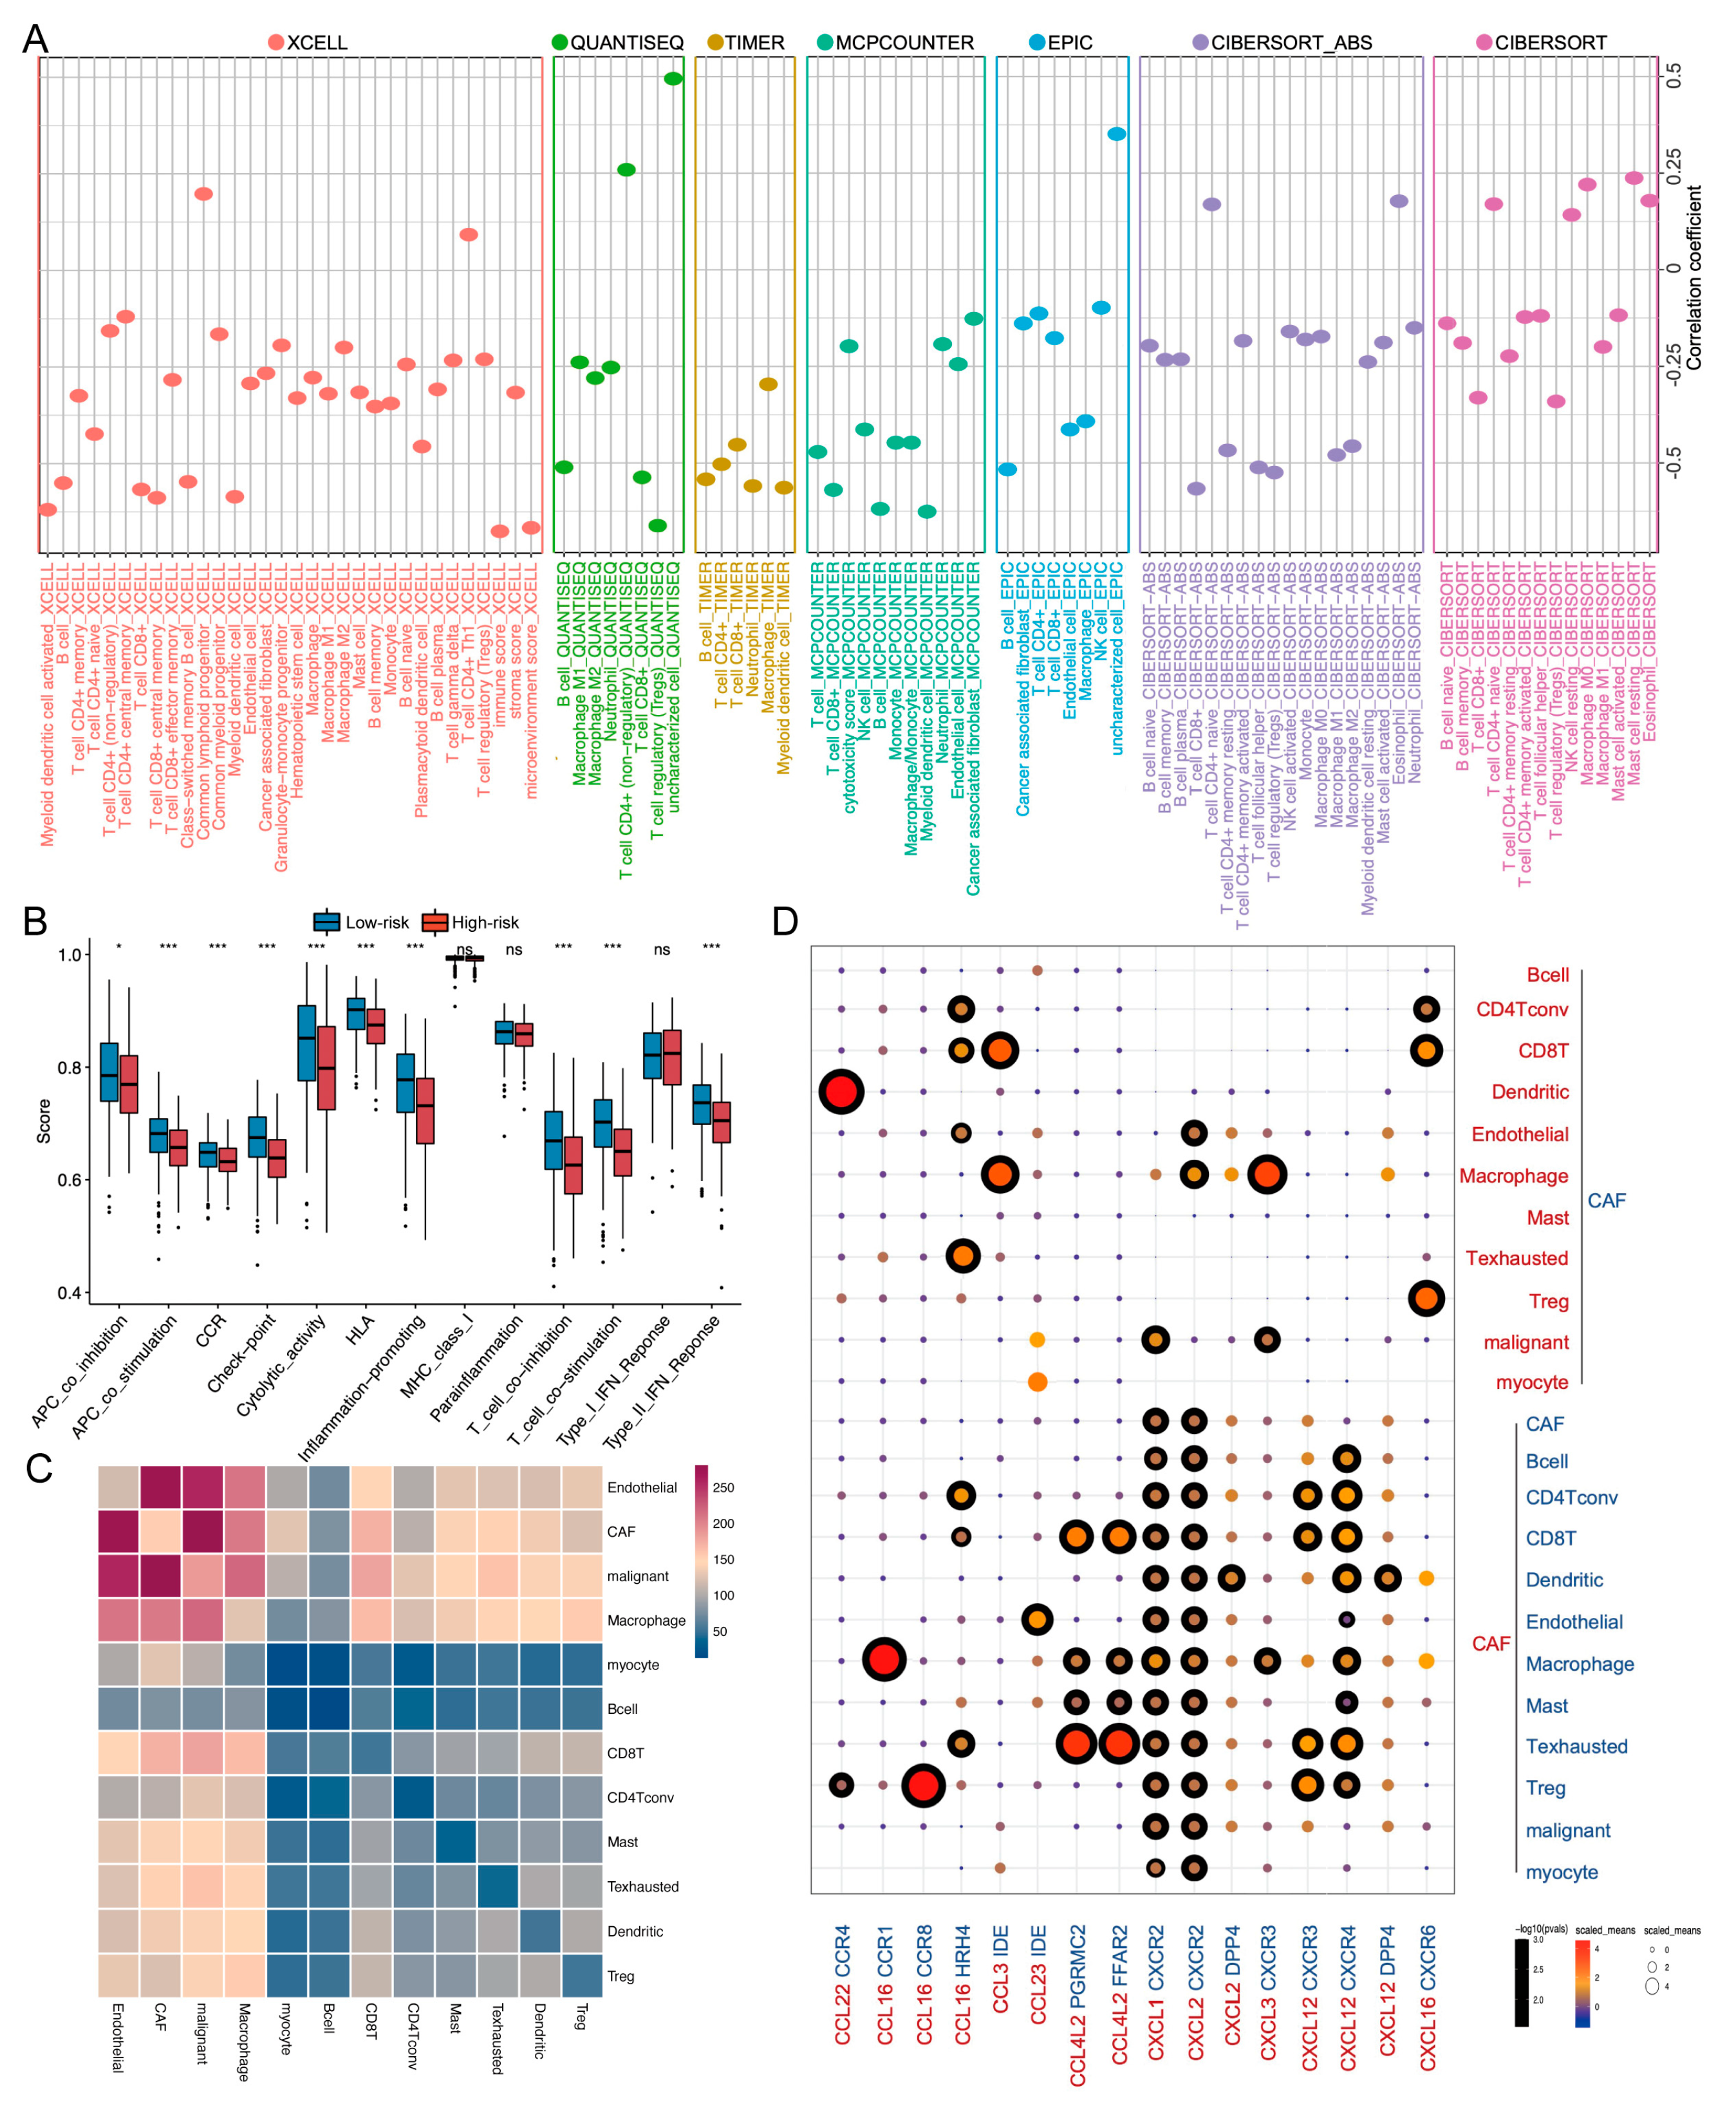
2.5. TME and Single-Cell Landscape of the Risk Model
3. Discussion
4. Materials and Methods
4.1. Data Acquisition and Consensus Clustering
4.2. Gene Set Variation Analysis and Single-Sample Gene-Set Enrichment Analysis
4.3. Establishment of a Risk Model
4.4. Immunotherapy Response Prediction
4.5. Prognosis Prediction of the Risk Model
4.6. External Cohort Validation
4.7. Immune Landscape between the Two Groups
4.8. Cell Culture and Real-Time Quantitative Polymerase Chain Reaction
4.9. Statistical Analysis
Supplementary Materials
Author Contributions
Funding
Institutional Review Board Statement
Informed Consent Statement
Data Availability Statement
Acknowledgments
Conflicts of Interest
References
- Mody, M.; Rocco, J.; Yom, S.; Haddad, R.; Saba, N. Head and neck cancer. Lancet 2021, 398, 2289–2299. [Google Scholar] [CrossRef]
- Sung, H.; Ferlay, J.; Siegel, R.; Laversanne, M.; Soerjomataram, I.; Jemal, A.; Bray, F. Global Cancer Statistics 2020: GLOBOCAN Estimates of Incidence and Mortality Worldwide for 36 Cancers in 185 Countries. CA-Cancer J. Clin. 2021, 71, 209–249. [Google Scholar] [CrossRef] [PubMed]
- Vos, J.; Elbers, J.; Krijgsman, O.; Traets, J.; Qiao, X.; van der Leun, A.; Lubeck, Y.; Seignette, I.; Smit, L.; Willems, S.; et al. Neoadjuvant immunotherapy with nivolumab and ipilimumab induces major pathological responses in patients with head and neck squamous cell carcinoma. Nat. Commun. 2021, 12, 7348. [Google Scholar] [CrossRef]
- Harrington, K.; Burtness, B.; Greil, R.; Soulières, D.; Tahara, M.; de Castro, G.; Psyrri, A.; Brana, I.; Basté, N.; Neupane, P.; et al. Pembrolizumab With or Without Chemotherapy in Recurrent or Metastatic Head and Neck Squamous Cell Carcinoma: Updated Results of the Phase III KEYNOTE-048 Study. J. Clin. Oncol. 2022, JCO2102508. [Google Scholar] [CrossRef]
- Le, X.; Ferrarotto, R.; Wise-Draper, T.; Gillison, M. Evolving Role of Immunotherapy in Recurrent Metastatic Head and Neck Cancer. J. Natl. Compr. Cancer Netw. 2020, 18, 899–906. [Google Scholar] [CrossRef] [PubMed]
- Jardim, D.; Goodman, A.; de Melo Gagliato, D.; Kurzrock, R. The Challenges of Tumor Mutational Burden as an Immunotherapy Biomarker. Cancer Cell 2021, 39, 154–173. [Google Scholar] [CrossRef] [PubMed]
- Ti, W.; Wei, T.; Wang, J.; Cheng, Y. Comparative Analysis of Mutation Status and Immune Landscape for Squamous Cell Carcinomas at Different Anatomical sites. Front. Immunol. 2022, 13, 947712. [Google Scholar] [CrossRef] [PubMed]
- Bhat, A.; Yousuf, P.; Wani, N.; Rizwan, A.; Chauhan, S.; Siddiqi, M.; Bedognetti, D.; El-Rifai, W.; Frenneaux, M.; Batra, S.; et al. Tumor microenvironment: An evil nexus promoting aggressive head and neck squamous cell carcinoma and avenue for targeted therapy. Signal Transduct. Target. Ther. 2021, 6, 12. [Google Scholar] [CrossRef] [PubMed]
- Gissi, D.B.; Gabusi, A.; Tarsitano, A.; Badiali, G.; Marchetti, C.; Morandi, L.; Foschini, M.P.; Montebugnoli, L. Ki67 Overexpression in mucosa distant from oral carcinoma: A poor prognostic factor in patients with long-term follow-up. J. Cranio-MaxilloFac. Surg. 2016, 44, 1430–1435. [Google Scholar] [CrossRef] [PubMed]
- Zhang, X.; Yang, M.; Liu, Y.; Liu, H.; Yang, J.; Luo, J.; Zhou, H. A novel 4-gene signature model simultaneously predicting malignant risk of oral potentially malignant disorders and oral squamous cell carcinoma prognosis. Arch. Oral Biol. 2021, 129, 105203. [Google Scholar] [CrossRef] [PubMed]
- Zhang, Y.; Chen, K.; Li, L.; Mao, W.; Shen, D.; Yao, N.; Zhang, L. CCR4 is a prognostic biomarker and correlated with immune infiltrates in head and neck squamous cell carcinoma. Ann. Transl. Med. 2021, 9, 1443. [Google Scholar] [CrossRef]
- Jing, F.; Wang, J.; Zhou, L.; Ning, Y.; Xu, S.; Zhu, Y. Bioinformatics analysis of the role of CXC ligands in the microenvironment of head and neck tumor. Aging 2021, 13, 17789–17817. [Google Scholar] [CrossRef] [PubMed]
- Wu, X.; Tang, J.; Cheng, B. Oral squamous cell carcinoma gene patterns connected with RNA methylation for prognostic prediction. Oral Dis. 2022. [Google Scholar] [CrossRef] [PubMed]
- Huo, M.; Zhang, Y.; Chen, Z.; Zhang, S.; Bao, Y.; Li, T. Tumor microenvironment characterization in head and neck cancer identifies prognostic and immunotherapeutically relevant gene signatures. Sci. Rep. 2020, 10, 11163. [Google Scholar] [CrossRef]
- Ji, A.L.; Rubin, A.J.; Thrane, K.; Jiang, S.; Reynolds, D.L.; Meyers, R.M.; Guo, M.G.; George, B.M.; Mollbrink, A.; Bergenstråhle, J.; et al. Multimodal Analysis of Composition and Spatial Architecture in Human Squamous Cell Carcinoma. Cell 2020, 182, 1661–1662. [Google Scholar] [CrossRef]
- Kürten, C.H.L.; Kulkarni, A.; Cillo, A.R.; Santos, P.M.; Roble, A.K.; Onkar, S.; Reeder, C.; Lang, S.; Chen, X.; Duvvuri, U.; et al. Investigating immune and non-immune cell interactions in head and neck tumors by single-cell RNA sequencing. Nat. Commun. 2021, 12, 7338. [Google Scholar] [CrossRef]
- Nisar, S.; Yousuf, P.; Masoodi, T.; Wani, N.; Hashem, S.; Singh, M.; Sageena, G.; Mishra, D.; Kumar, R.; Haris, M.; et al. Chemokine-Cytokine Networks in the Head and Neck Tumor Microenvironment. Int. J. Mol. Sci. 2021, 22, 4584. [Google Scholar] [CrossRef]
- da Silva, J.; Soave, D.; Moreira Dos Santos, T.; Batista, A.; Russo, R.; Teixeira, M.; da Silva, T. Significance of chemokine and chemokine receptors in head and neck squamous cell carcinoma: A critical review. Oral Oncol. 2016, 56, 8–16. [Google Scholar] [CrossRef]
- Zlotnik, A.; Yoshie, O. The chemokine superfamily revisited. Immunity 2012, 36, 705–716. [Google Scholar] [CrossRef] [PubMed]
- Binnewies, M.; Roberts, E.; Kersten, K.; Chan, V.; Fearon, D.; Merad, M.; Coussens, L.; Gabrilovich, D.; Ostrand-Rosenberg, S.; Hedrick, C.; et al. Understanding the tumor immune microenvironment (TIME) for effective therapy. Nat. Med. 2018, 24, 541–550. [Google Scholar] [CrossRef]
- Watermann, C.; Pasternack, H.; Idel, C.; Ribbat-Idel, J.; Brägelmann, J.; Kuppler, P.; Offermann, A.; Jonigk, D.; Kühnel, M.; Schröck, A.; et al. Recurrent HNSCC Harbor an Immunosuppressive Tumor Immune Microenvironment Suggesting Successful Tumor Immune Evasion. Clin. Cancer Res. 2021, 27, 632–644. [Google Scholar] [CrossRef]
- Borst, J.; Ahrends, T.; Bąbała, N.; Melief, C.J.M.; Kastenmüller, W. CD4 T cell help in cancer immunology and immunotherapy. Nat. Rev. Immunol. 2018, 18, 635–647. [Google Scholar] [CrossRef] [PubMed]
- Bonavita, E.; Bromley, C.P.; Jonsson, G.; Pelly, V.S.; Sahoo, S.; Walwyn-Brown, K.; Mensurado, S.; Moeini, A.; Flanagan, E.; Bell, C.R.; et al. Antagonistic Inflammatory Phenotypes Dictate Tumor Fate and Response to Immune Checkpoint Blockade. Immunity 2020, 53, 1215–1229.e8. [Google Scholar] [CrossRef] [PubMed]
- Takahashi, H.; Kawaguchi, T.; Yan, L.; Peng, X.; Qi, Q.; Morris, L.G.T.; Chan, T.A.; Tsung, A.; Otsuji, E.; Takabe, K. Immune Cytolytic Activity for Comprehensive Understanding of Immune Landscape in Hepatocellular Carcinoma. Cancers 2020, 12, 1221. [Google Scholar] [CrossRef]
- Narayanan, S.; Kawaguchi, T.; Yan, L.; Peng, X.; Qi, Q.; Takabe, K. Cytolytic Activity Score to Assess Anticancer Immunity in Colorectal Cancer. Ann. Surg. Oncol. 2018, 25, 2323–2331. [Google Scholar] [CrossRef] [PubMed]
- Hu, Q.; Nonaka, K.; Wakiyama, H.; Miyashita, Y.; Fujimoto, Y.; Jogo, T.; Hokonohara, K.; Nakanishi, R.; Hisamatsu, Y.; Ando, K.; et al. Cytolytic activity score as a biomarker for antitumor immunity and clinical outcome in patients with gastric cancer. Cancer Med. 2021, 10, 3129–3138. [Google Scholar] [CrossRef] [PubMed]
- Cohen, E.E.W.; Bell, R.B.; Bifulco, C.B.; Burtness, B.; Gillison, M.L.; Harrington, K.J.; Le, Q.T.; Lee, N.Y.; Leidner, R.; Lewis, R.L.; et al. The Society for Immunotherapy of Cancer consensus statement on immunotherapy for the treatment of squamous cell carcinoma of the head and neck (HNSCC). J. Immunother. Cancer 2019, 7, 184. [Google Scholar] [CrossRef] [PubMed]
- Kang, Y.J.; O’Haire, S.; Franchini, F.; Ijzerman, M.; Zalcberg, J.; Macrae, F.; Canfell, K.; Steinberg, J. A scoping review and meta-analysis on the prevalence of pan-tumour biomarkers (dMMR, MSI, high TMB) in different solid tumours. Sci. Rep. 2022, 12, 20495. [Google Scholar] [CrossRef]
- Ready, N.; Hellmann, M.D.; Awad, M.M.; Otterson, G.A.; Gutierrez, M.; Gainor, J.F.; Borghaei, H.; Jolivet, J.; Horn, L.; Mates, M.; et al. First-Line Nivolumab Plus Ipilimumab in Advanced Non-Small-Cell Lung Cancer (CheckMate 568): Outcomes by Programmed Death Ligand 1 and Tumor Mutational Burden as Biomarkers. J. Clin. Oncol. 2019, 37, 992–1000. [Google Scholar] [CrossRef]
- Deneka, A.Y.; Baca, Y.; Serebriiskii, I.G.; Nicolas, E.; Parker, M.I.; Nguyen, T.T.; Xiu, J.; Korn, W.M.; Demeure, M.J.; Wise-Draper, T.; et al. Association of TP53 and CDKN2A Mutation Profile with Tumor Mutation Burden in Head and Neck Cancer. Clin. Cancer Res. 2022, 28, 1925–1937. [Google Scholar] [CrossRef]
- Kang, S.H.; Oh, S.Y.; Lee, H.J.; Kwon, T.G.; Kim, J.W.; Lee, S.T.; Choi, S.Y.; Hong, S.H. Cancer-Associated Fibroblast Subgroups Showing Differential Promoting Effect on HNSCC Progression. Cancers 2021, 13, 654. [Google Scholar] [CrossRef] [PubMed]
- Galbo, P.M.; Zang, X.; Zheng, D. Molecular Features of Cancer-associated Fibroblast Subtypes and their Implication on Cancer Pathogenesis, Prognosis, and Immunotherapy Resistance. Clin. Cancer Res. 2021, 27, 2636–2647. [Google Scholar] [CrossRef] [PubMed]
- Kieffer, Y.; Hocine, H.R.; Gentric, G.; Pelon, F.; Bernard, C.; Bourachot, B.; Lameiras, S.; Albergante, L.; Bonneau, C.; Guyard, A.; et al. Single-Cell Analysis Reveals Fibroblast Clusters Linked to Immunotherapy Resistance in Cancer. Cancer Discov. 2020, 10, 1330–1351. [Google Scholar] [CrossRef] [PubMed]
- Obradovic, A.; Graves, D.; Korrer, M.; Wang, Y.; Roy, S.; Naveed, A.; Xu, Y.; Luginbuhl, A.; Curry, J.; Gibson, M.; et al. Immunostimulatory Cancer-Associated Fibroblast Subpopulations Can Predict Immunotherapy Response in Head and Neck Cancer. Clin. Cancer Res. 2022, 28, 2094–2109. [Google Scholar] [CrossRef]
- Qian, J.; Olbrecht, S.; Boeckx, B.; Vos, H.; Laoui, D.; Etlioglu, E.; Wauters, E.; Pomella, V.; Verbandt, S.; Busschaert, P.; et al. A pan-cancer blueprint of the heterogeneous tumor microenvironment revealed by single-cell profiling. Cell Res. 2020, 30, 745–762. [Google Scholar] [CrossRef] [PubMed]
- Wu, F.; Yang, J.; Liu, J.; Wang, Y.; Mu, J.; Zeng, Q.; Deng, S.; Zhou, H. Signaling pathways in cancer-associated fibroblasts and targeted therapy for cancer. Signal Transduct. Target. Ther. 2021, 6, 218. [Google Scholar] [CrossRef]
- Tsujikawa, T.; Yaguchi, T.; Ohmura, G.; Ohta, S.; Kobayashi, A.; Kawamura, N.; Fujita, T.; Nakano, H.; Shimada, T.; Takahashi, T.; et al. Autocrine and paracrine loops between cancer cells and macrophages promote lymph node metastasis via CCR4/CCL22 in head and neck squamous cell carcinoma. Int. J. Cancer 2013, 132, 2755–2766. [Google Scholar] [CrossRef]
- Li, X.; Liu, Z.; Zhou, W.; Liu, X.; Cao, W. Downregulation of CCL22 and mutated NOTCH1 in tongue and mouth floor squamous cell carcinoma results in decreased Th2 cell recruitment and expression, predicting poor clinical outcome. BMC Cancer 2021, 21, 922. [Google Scholar] [CrossRef]
- Huang, Y.-H.; Chang, C.-Y.; Kuo, Y.-Z.; Fang, W.-Y.; Kao, H.-Y.; Tsai, S.-T.; Wu, L.-W. Cancer-associated fibroblast-derived interleukin-1β activates protumor C-C motif chemokine ligand 22 signaling in head and neck cancer. Cancer Sci. 2019, 110, 2783–2793. [Google Scholar] [CrossRef]
- Ritchie, M.; Phipson, B.; Wu, D.; Hu, Y.; Law, C.; Shi, W.; Smyth, G. limma powers differential expression analyses for RNA-sequencing and microarray studies. Nucleic Acids Res. 2015, 43, e47. [Google Scholar] [CrossRef]
- Wilkerson, M.; Hayes, D. ConsensusClusterPlus: A class discovery tool with confidence assessments and item tracking. Bioinformatics 2010, 26, 1572–1573. [Google Scholar] [CrossRef] [PubMed]
- Uhlen, M.; Oksvold, P.; Fagerberg, L.; Lundberg, E.; Jonasson, K.; Forsberg, M.; Zwahlen, M.; Kampf, C.; Wester, K.; Hober, S.; et al. Towards a knowledge-based Human Protein Atlas. Nat. Biotechnol. 2010, 28, 1248–1250. [Google Scholar] [CrossRef] [PubMed]
- Hänzelmann, S.; Castelo, R.; Guinney, J. GSVA: Gene set variation analysis for microarray and RNA-seq data. BMC Bioinform. 2013, 14, 7. [Google Scholar] [CrossRef]
- Yoshihara, K.; Shahmoradgoli, M.; Martínez, E.; Vegesna, R.; Kim, H.; Torres-Garcia, W.; Treviño, V.; Shen, H.; Laird, P.; Levine, D.; et al. Inferring tumour purity and stromal and immune cell admixture from expression data. Nat. Commun. 2013, 4, 2612. [Google Scholar] [CrossRef] [PubMed]
- Yang, Z.; Yang, X.; Xu, S.; Jin, P.; Li, X.; Wei, X.; Liu, D.; Huang, K.; Long, S.; Wang, Y.; et al. Reprogramming of stromal fibroblasts by SNAI2 contributes to tumor desmoplasia and ovarian cancer progression. Mol. Cancer 2017, 16, 163. [Google Scholar] [CrossRef]
- Friedman, J.; Hastie, T.; Tibshirani, R. Regularization Paths for Generalized Linear Models via Coordinate Descent. J. Stat. Softw. 2010, 33. [Google Scholar] [CrossRef]
- Geeleher, P.; Cox, N.; Huang, R.S. pRRophetic: An R package for prediction of clinical chemotherapeutic response from tumor gene expression levels. PLoS ONE 2014, 9, e107468. [Google Scholar] [CrossRef] [PubMed]
- Mariathasan, S.; Turley, S.J.; Nickles, D.; Castiglioni, A.; Yuen, K.; Wang, Y.; Kadel, E.E.; Koeppen, H.; Astarita, J.L.; Cubas, R.; et al. TGFβ attenuates tumour response to PD-L1 blockade by contributing to exclusion of T cells. Nature 2018, 554, 544–548. [Google Scholar] [CrossRef] [PubMed]
- Zhang, X.; Shi, M.; Chen, T.; Zhang, B. Characterization of the Immune Cell Infiltration Landscape in Head and Neck Squamous Cell Carcinoma to Aid Immunotherapy. Mol. Ther.-Nucl. Acids 2020, 22, 298–309. [Google Scholar] [CrossRef] [PubMed]
- Chang, W.; Li, H.; Zhong, L.; Zhu, T.; Chang, Z.; Ou, W.; Wang, S. Development of a copper metabolism-related gene signature in lung adenocarcinoma. Front. Immunol. 2022, 13, 1040668. [Google Scholar] [CrossRef] [PubMed]
- Liu, Q.; Yang, X.; Yin, Y.; Zhang, H.; Yin, F.; Guo, P.; Zhang, X.; Sun, C.; Li, S.; Han, Y.; et al. Identifying the Role of Oxidative Stress-Related Genes as Prognostic Biomarkers and Predicting the Response of Immunotherapy and Chemotherapy in Ovarian Cancer. Oxidative Med. Cell. Longev. 2022, 2022, 6575534. [Google Scholar] [CrossRef] [PubMed]
- Jiang, P.; Gu, S.; Pan, D.; Fu, J.; Sahu, A.; Hu, X.; Li, Z.; Traugh, N.; Bu, X.; Li, B.; et al. Signatures of T cell dysfunction and exclusion predict cancer immunotherapy response. Nat. Med. 2018, 24, 1550–1558. [Google Scholar] [CrossRef]
- Charoentong, P.; Finotello, F.; Angelova, M.; Mayer, C.; Efremova, M.; Rieder, D.; Hackl, H.; Trajanoski, Z. Pan-cancer Immunogenomic Analyses Reveal Genotype-Immunophenotype Relationships and Predictors of Response to Checkpoint Blockade. Cell Rep. 2017, 18, 248–262. [Google Scholar] [CrossRef]
- Butler, A.; Hoffman, P.; Smibert, P.; Papalexi, E.; Satija, R. Integrating single-cell transcriptomic data across different conditions, technologies, and species. Nat. Biotechnol. 2018, 36, 411–420. [Google Scholar] [CrossRef] [PubMed]
- Plattner, C.; Finotello, F.; Rieder, D. Deconvoluting tumor-infiltrating immune cells from RNA-seq data using quanTIseq. Methods Enzymol. 2020, 636, 261–285. [Google Scholar] [CrossRef] [PubMed]
- Li, T.; Fu, J.; Zeng, Z.; Cohen, D.; Li, J.; Chen, Q.; Li, B.; Liu, X.S. TIMER2.0 for analysis of tumor-infiltrating immune cells. Nucleic Acids Res. 2020, 48, W509–W514. [Google Scholar] [CrossRef] [PubMed]
- Becht, E.; Giraldo, N.A.; Lacroix, L.; Buttard, B.; Elarouci, N.; Petitprez, F.; Selves, J.; Laurent-Puig, P.; Sautès-Fridman, C.; Fridman, W.H.; et al. Estimating the population abundance of tissue-infiltrating immune and stromal cell populations using gene expression. Genome Biol. 2016, 17, 218. [Google Scholar] [CrossRef] [PubMed]


Disclaimer/Publisher’s Note: The statements, opinions and data contained in all publications are solely those of the individual author(s) and contributor(s) and not of MDPI and/or the editor(s). MDPI and/or the editor(s) disclaim responsibility for any injury to people or property resulting from any ideas, methods, instructions or products referred to in the content. |
© 2023 by the authors. Licensee MDPI, Basel, Switzerland. This article is an open access article distributed under the terms and conditions of the Creative Commons Attribution (CC BY) license (https://creativecommons.org/licenses/by/4.0/).
Share and Cite
Wang, Y.; Wang, S.; Wang, H.; Yang, J.; Zhou, H. Identification and Biological Validation of a Chemokine/Chemokine Receptor-Based Risk Model for Predicting Immunotherapeutic Response and Prognosis in Head and Neck Squamous Cell Carcinoma. Int. J. Mol. Sci. 2023, 24, 3317. https://doi.org/10.3390/ijms24043317
Wang Y, Wang S, Wang H, Yang J, Zhou H. Identification and Biological Validation of a Chemokine/Chemokine Receptor-Based Risk Model for Predicting Immunotherapeutic Response and Prognosis in Head and Neck Squamous Cell Carcinoma. International Journal of Molecular Sciences. 2023; 24(4):3317. https://doi.org/10.3390/ijms24043317
Chicago/Turabian StyleWang, Ye, Shimeng Wang, Houshang Wang, Jin Yang, and Hongmei Zhou. 2023. "Identification and Biological Validation of a Chemokine/Chemokine Receptor-Based Risk Model for Predicting Immunotherapeutic Response and Prognosis in Head and Neck Squamous Cell Carcinoma" International Journal of Molecular Sciences 24, no. 4: 3317. https://doi.org/10.3390/ijms24043317