
Effect of Hydroxyapatite/β-Tricalcium Phosphate on Osseointegration after Implantation into Mouse Maxilla


Abstract
:1. Introduction
2. Results
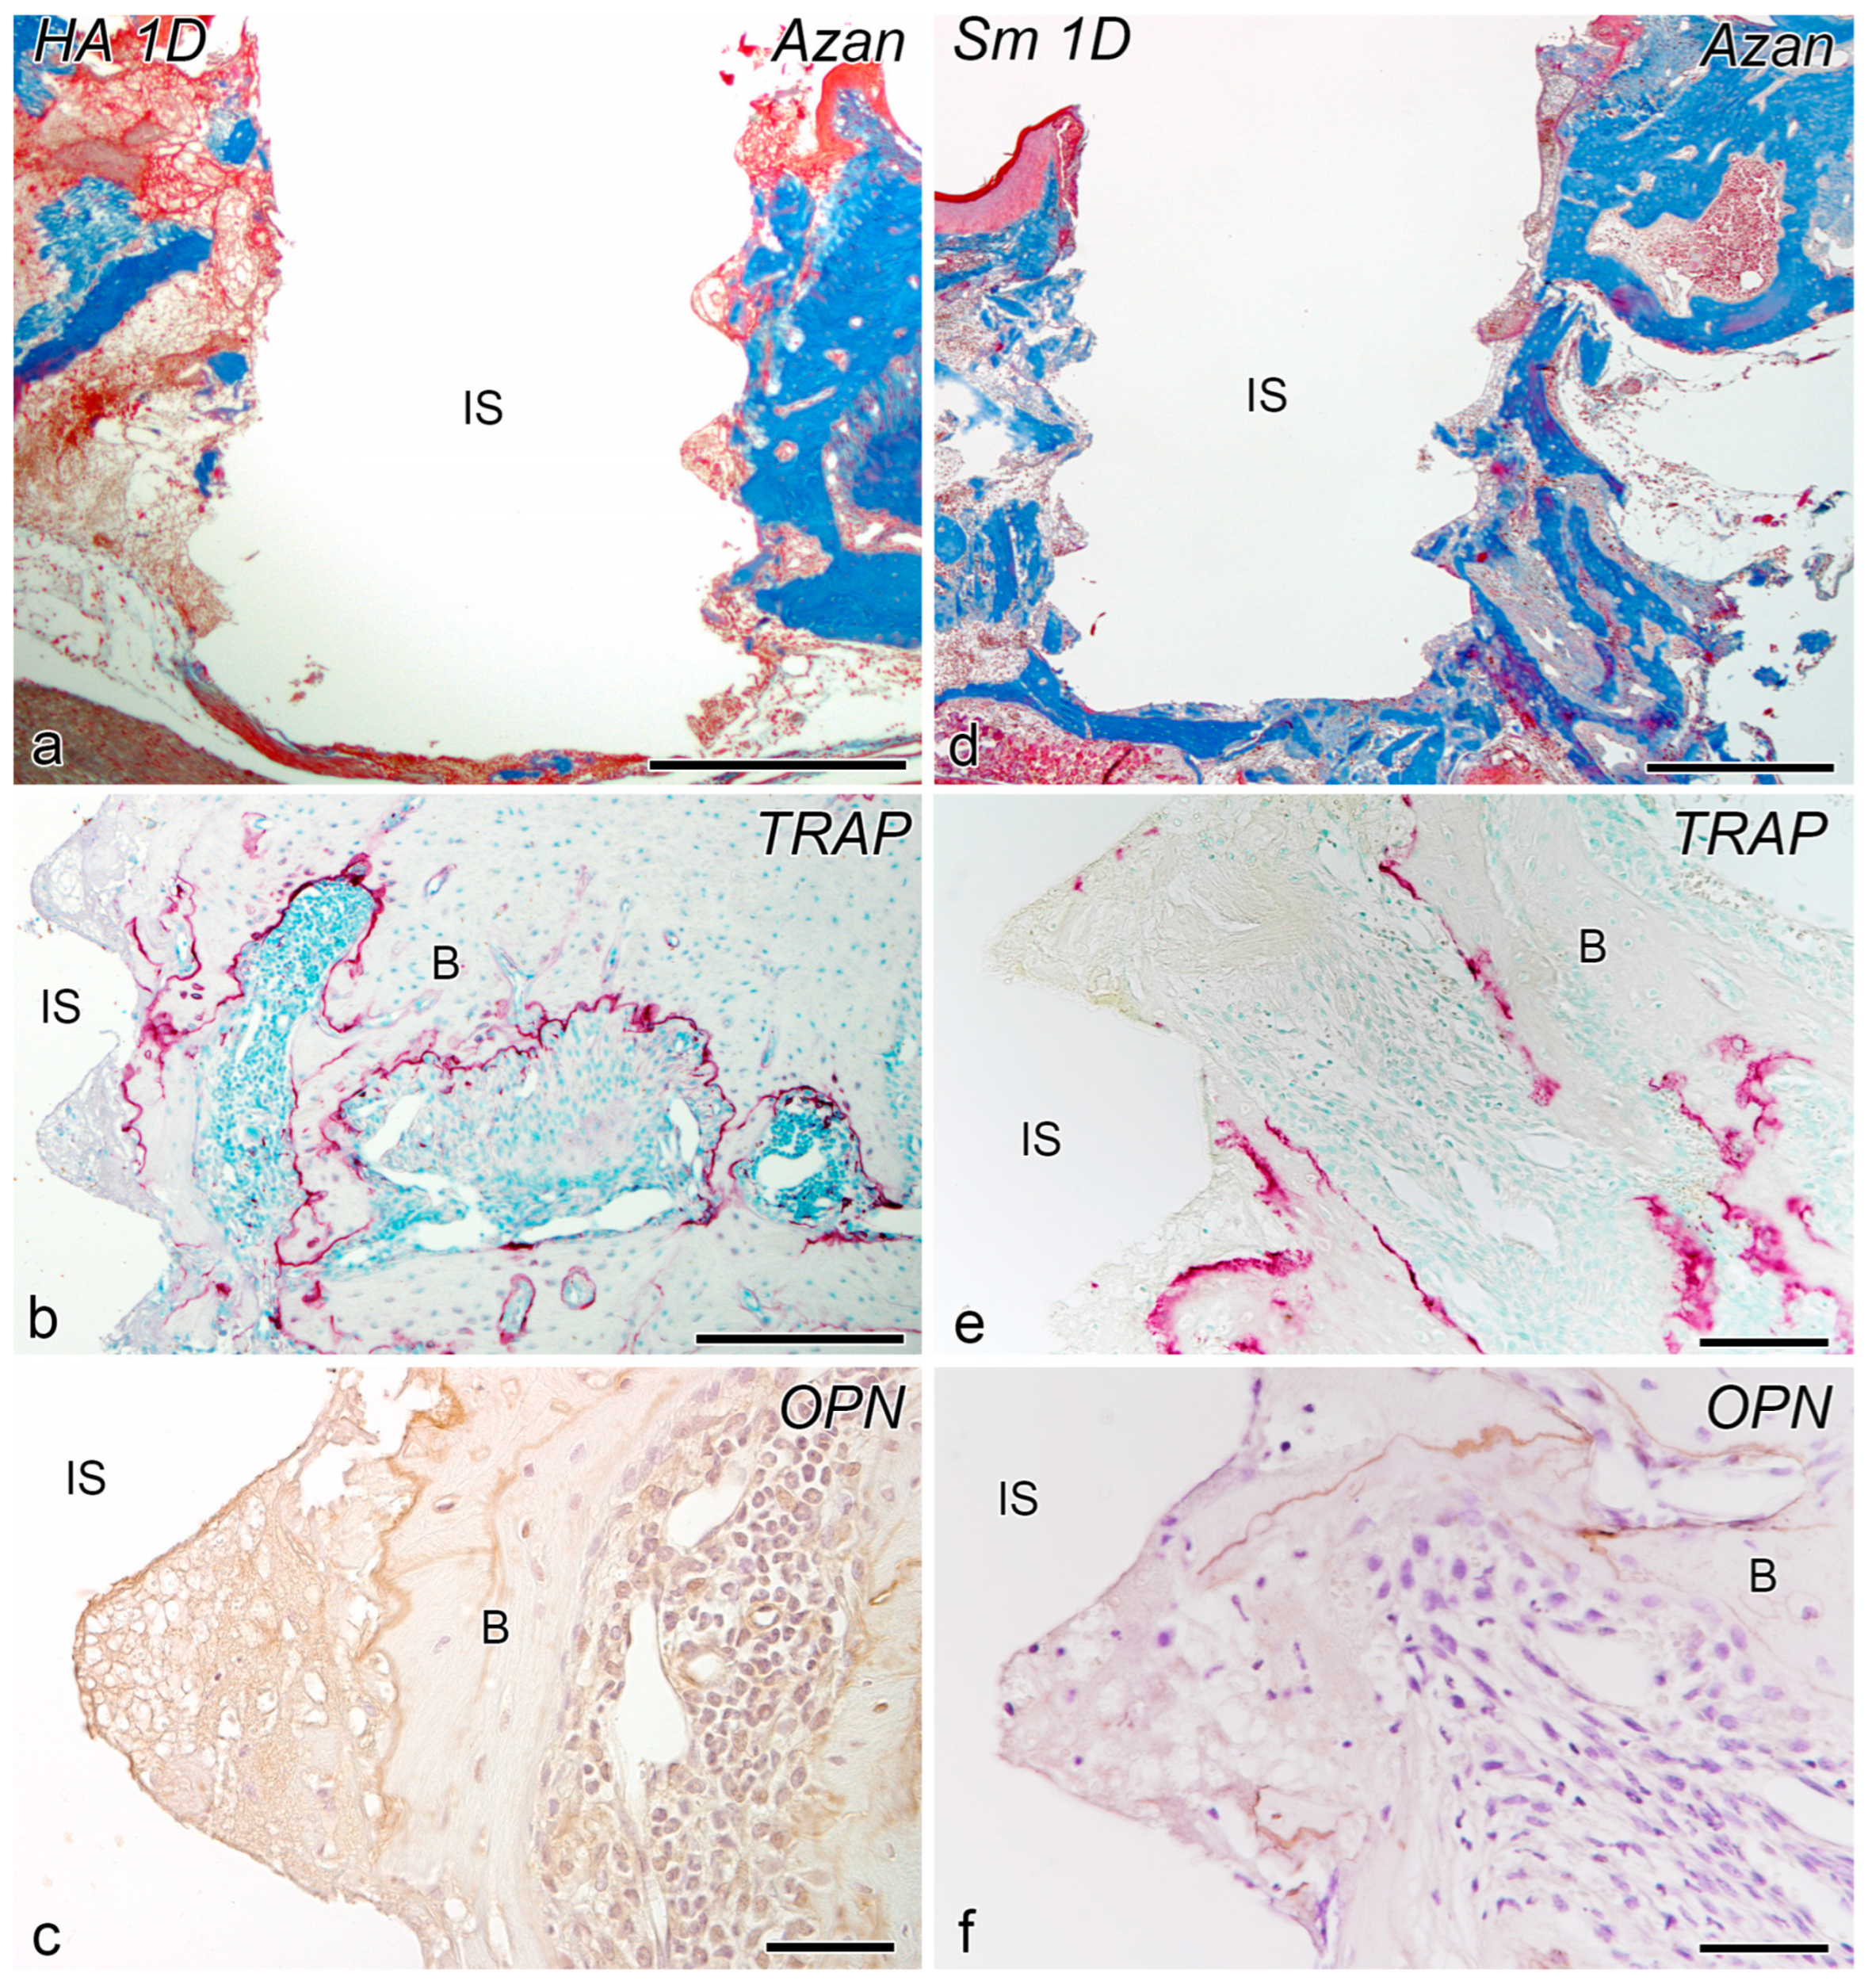
2.1. Day 1
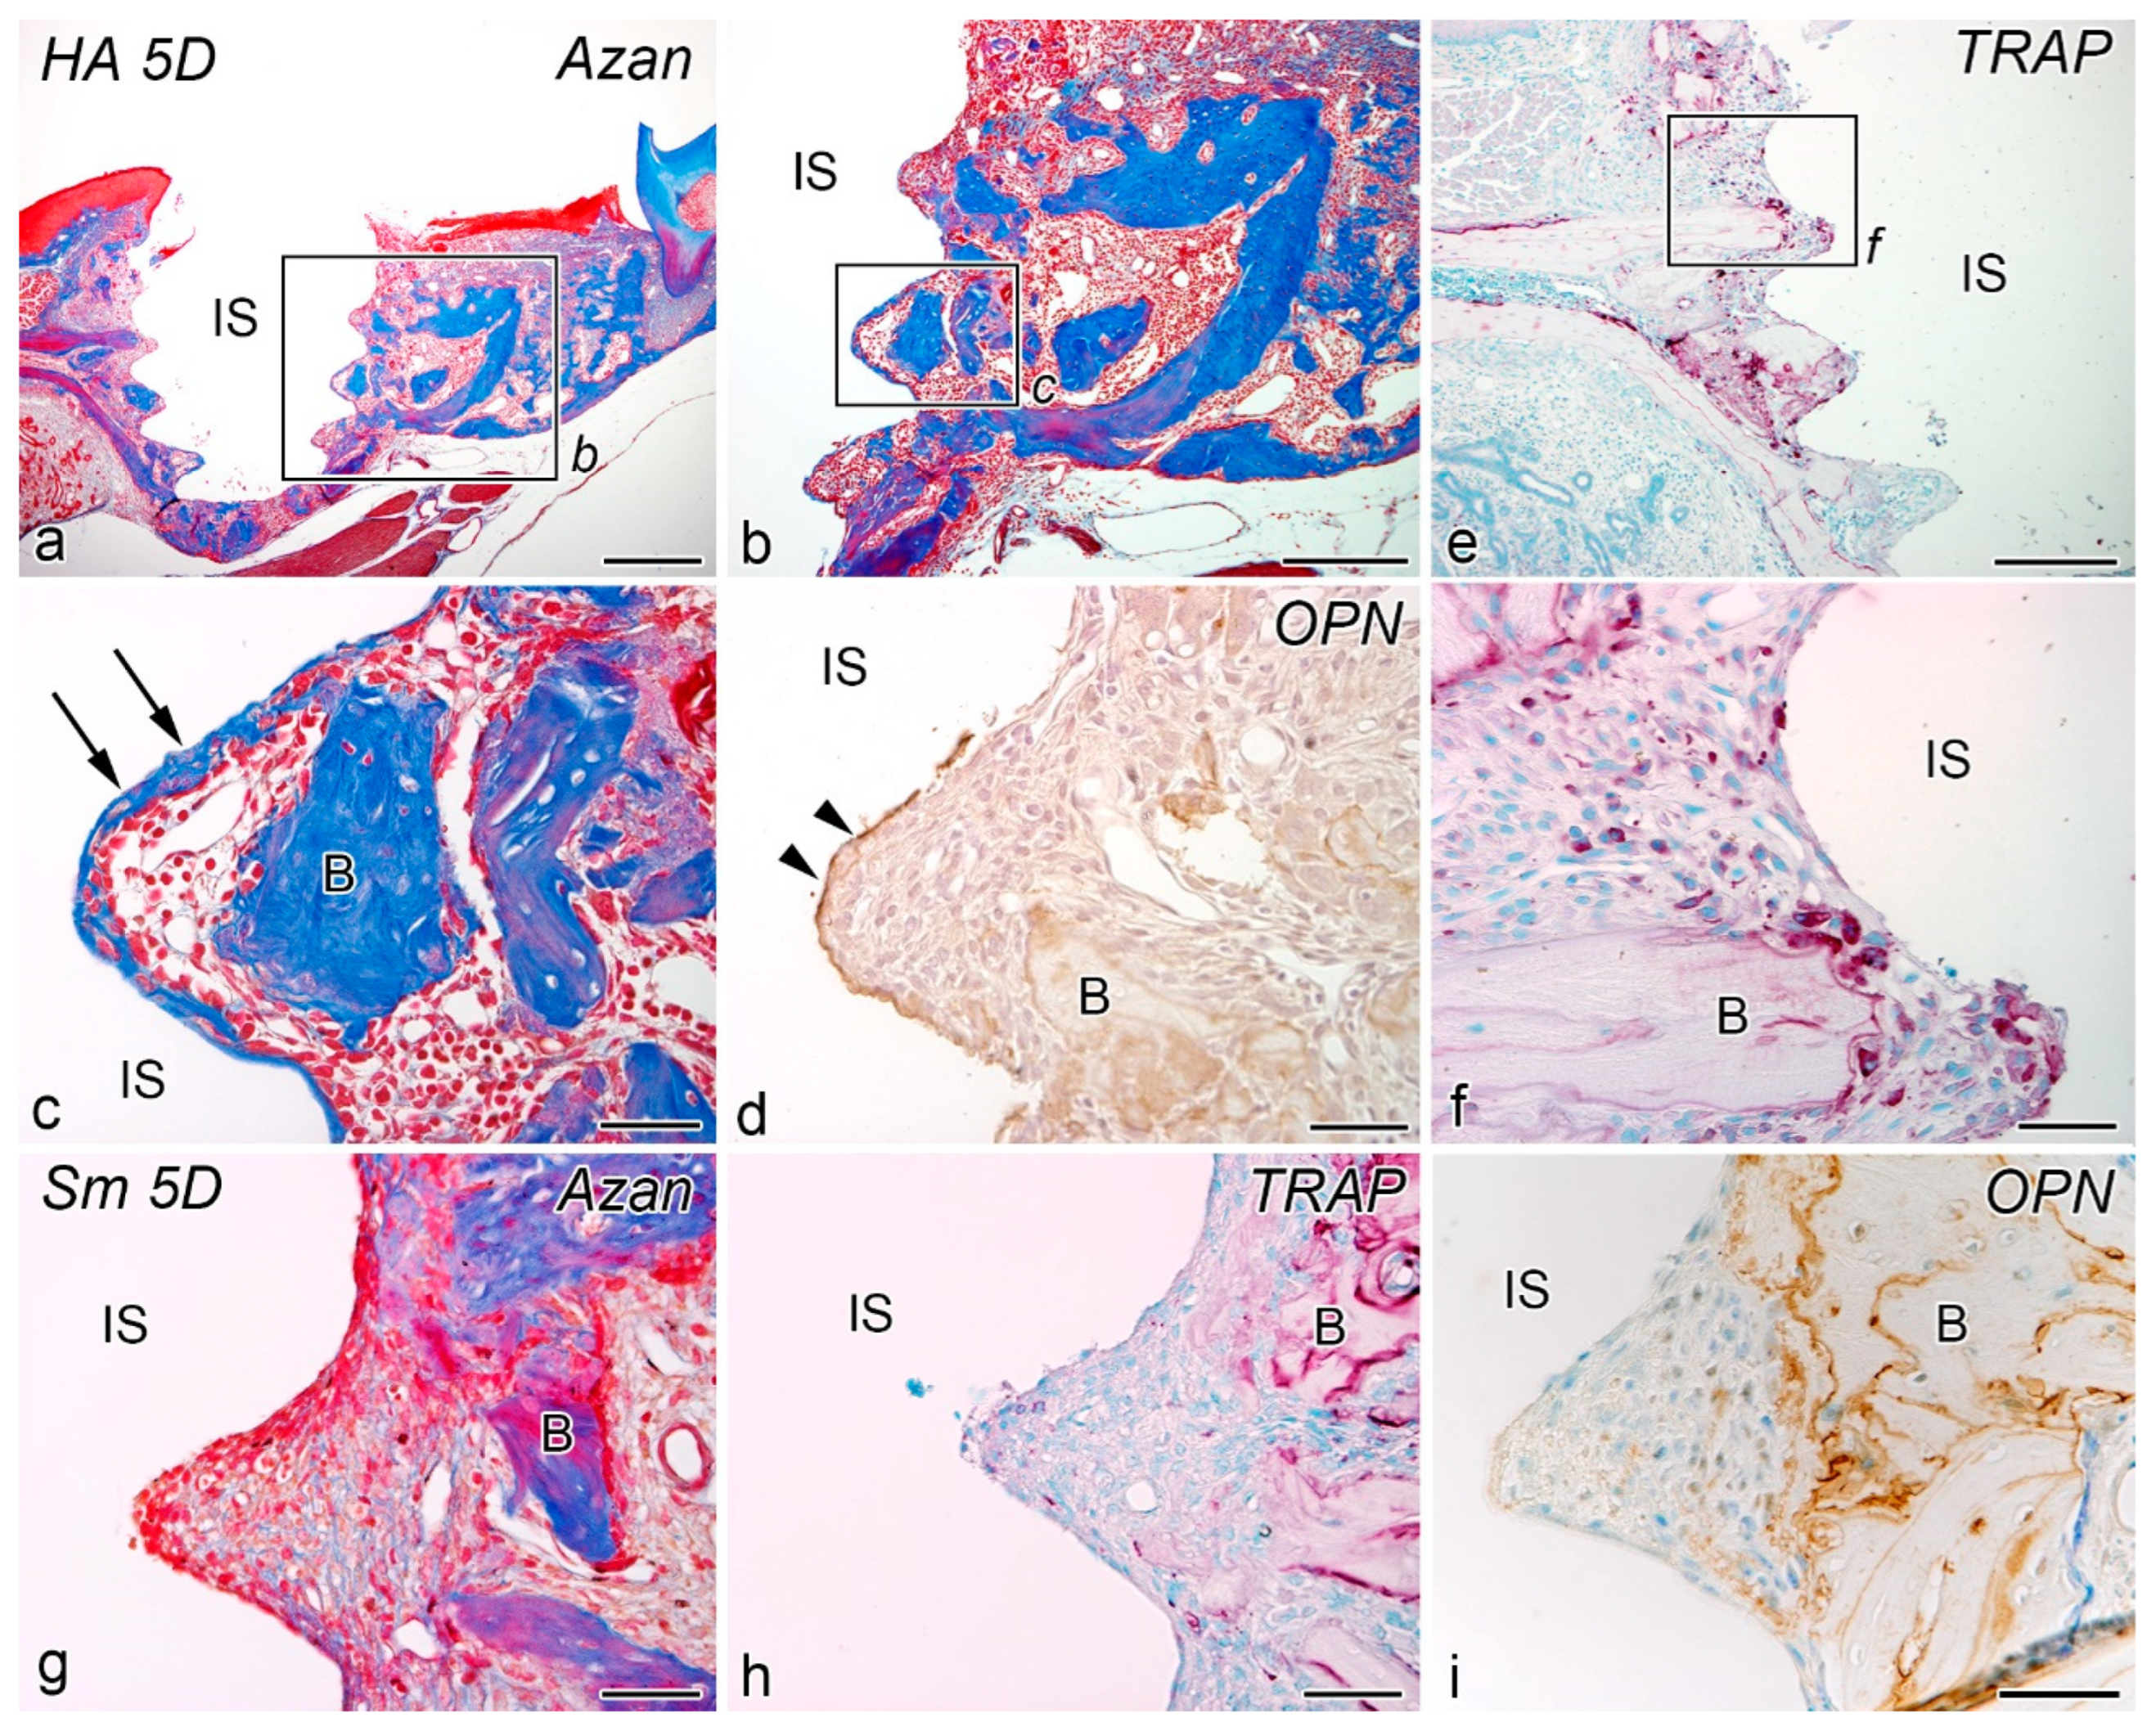
2.2. Day 5
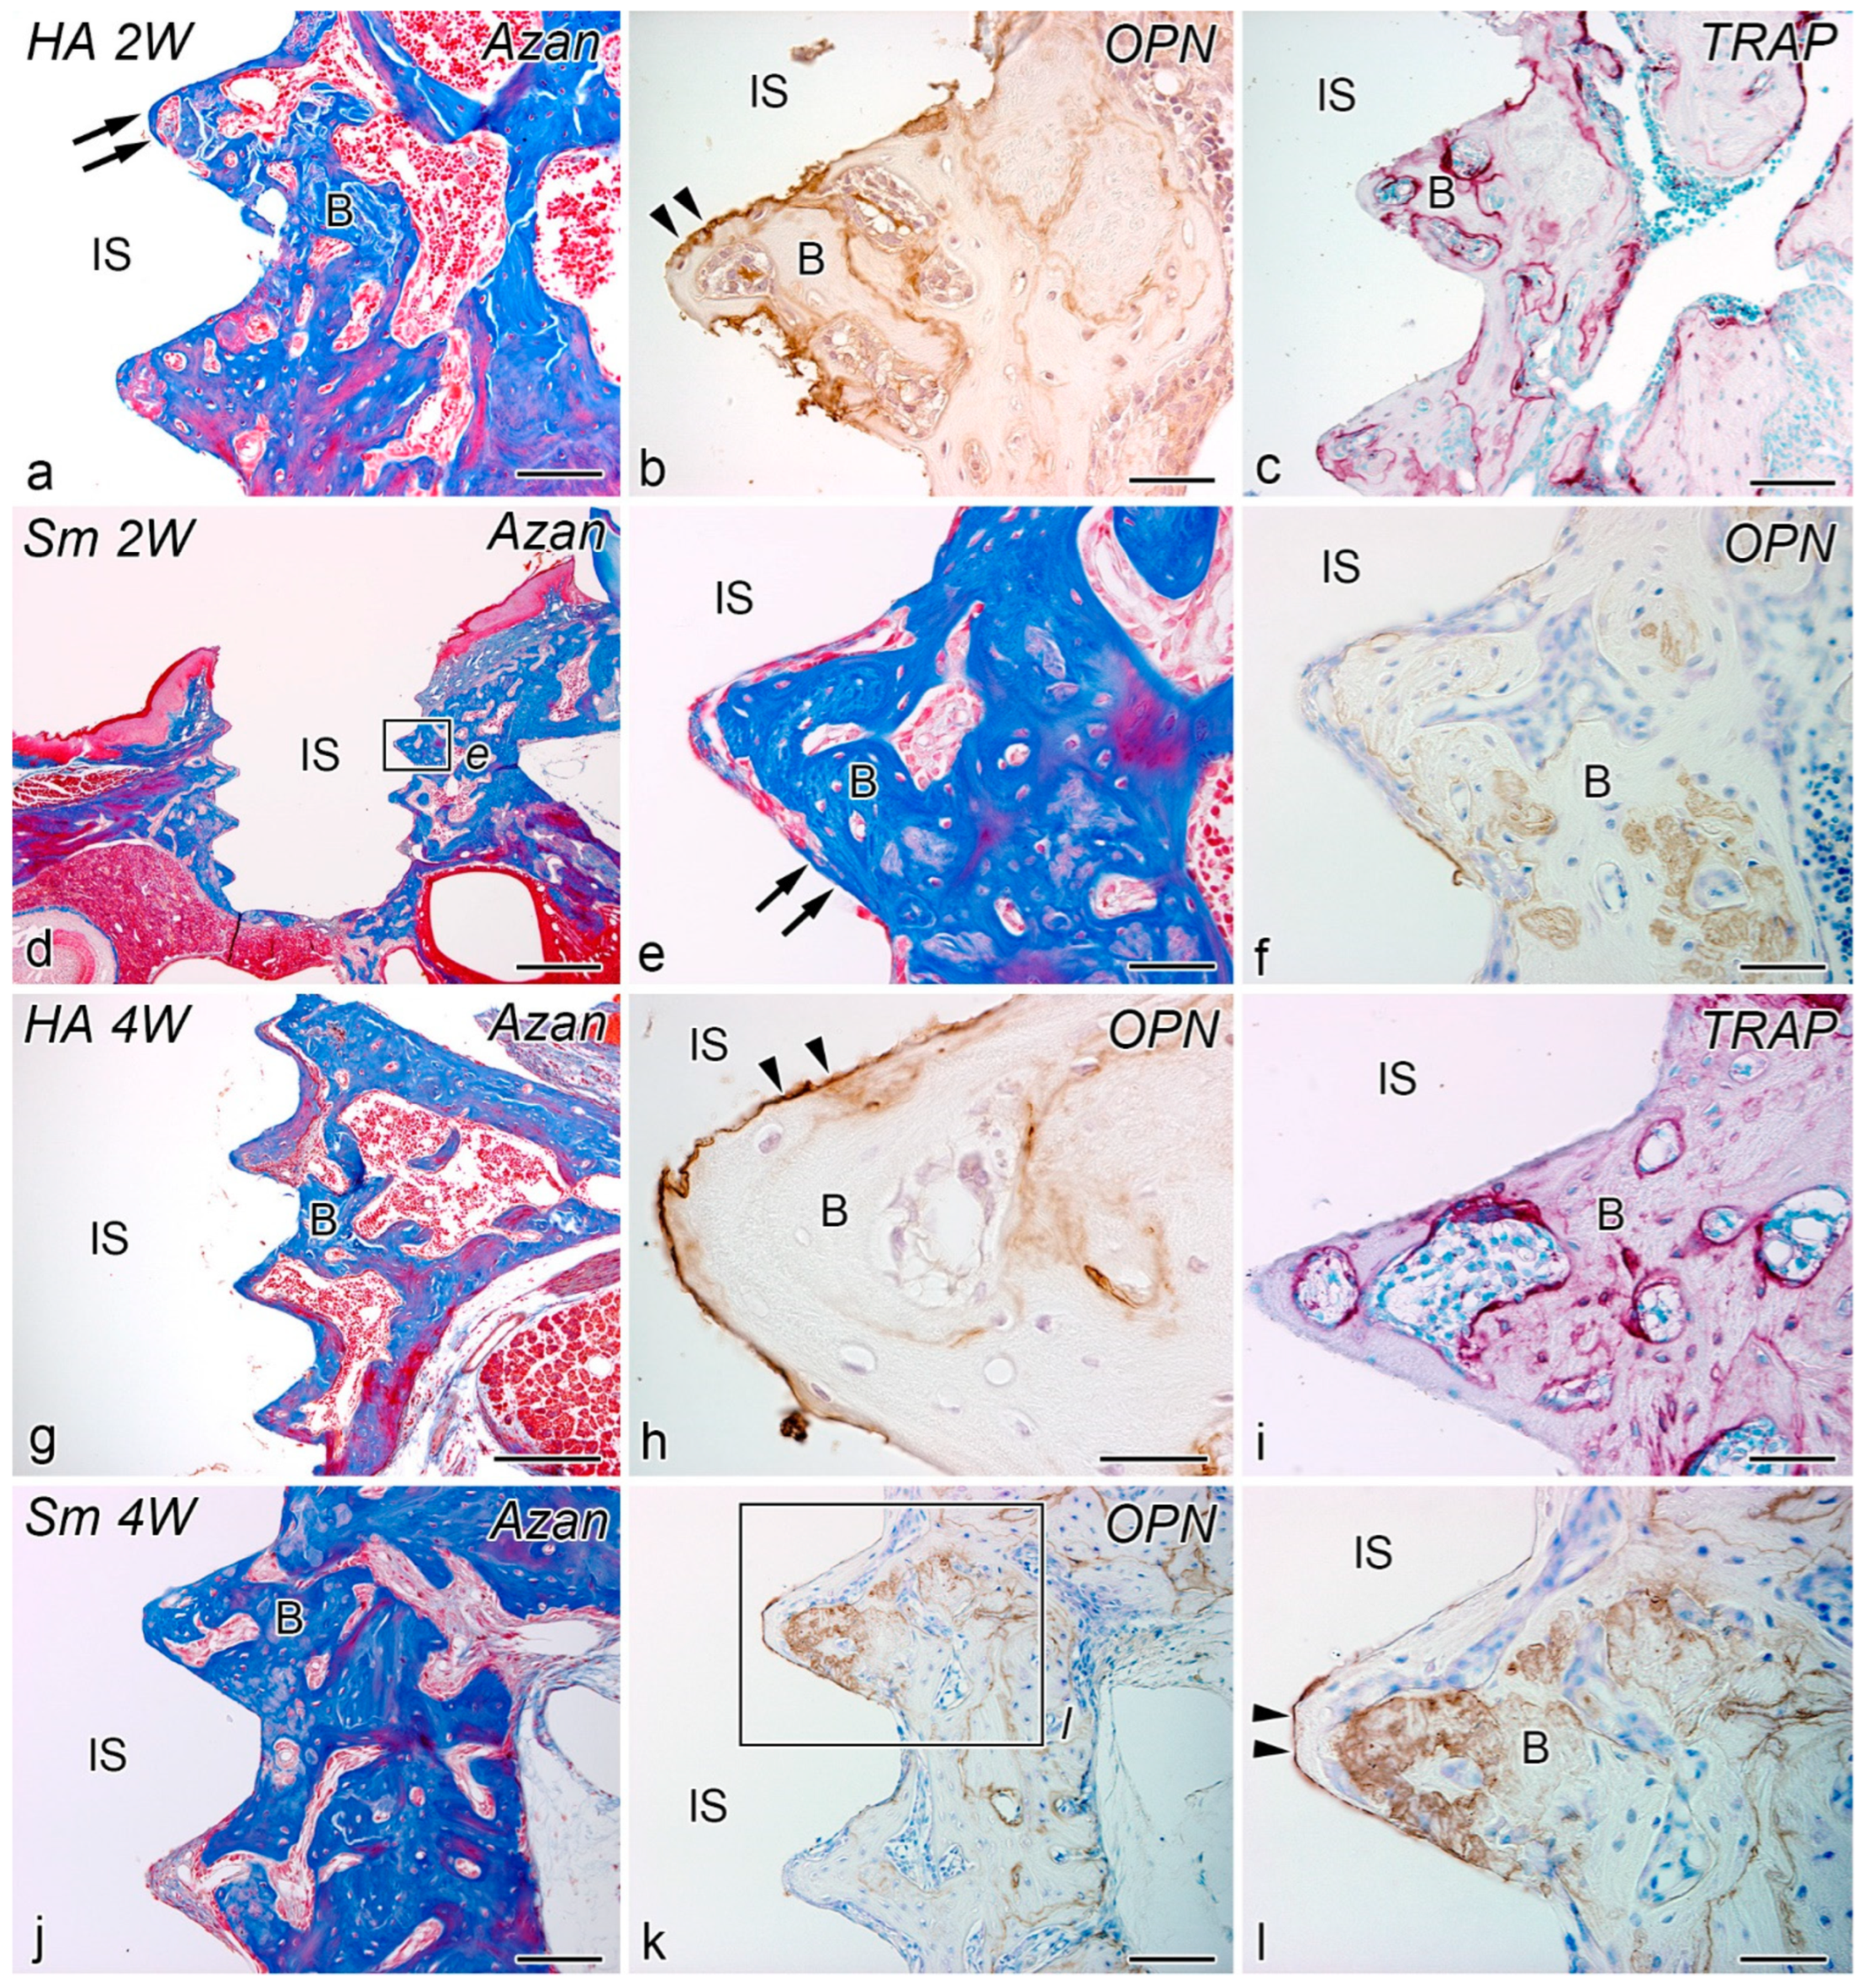
2.3. Weeks 2–4
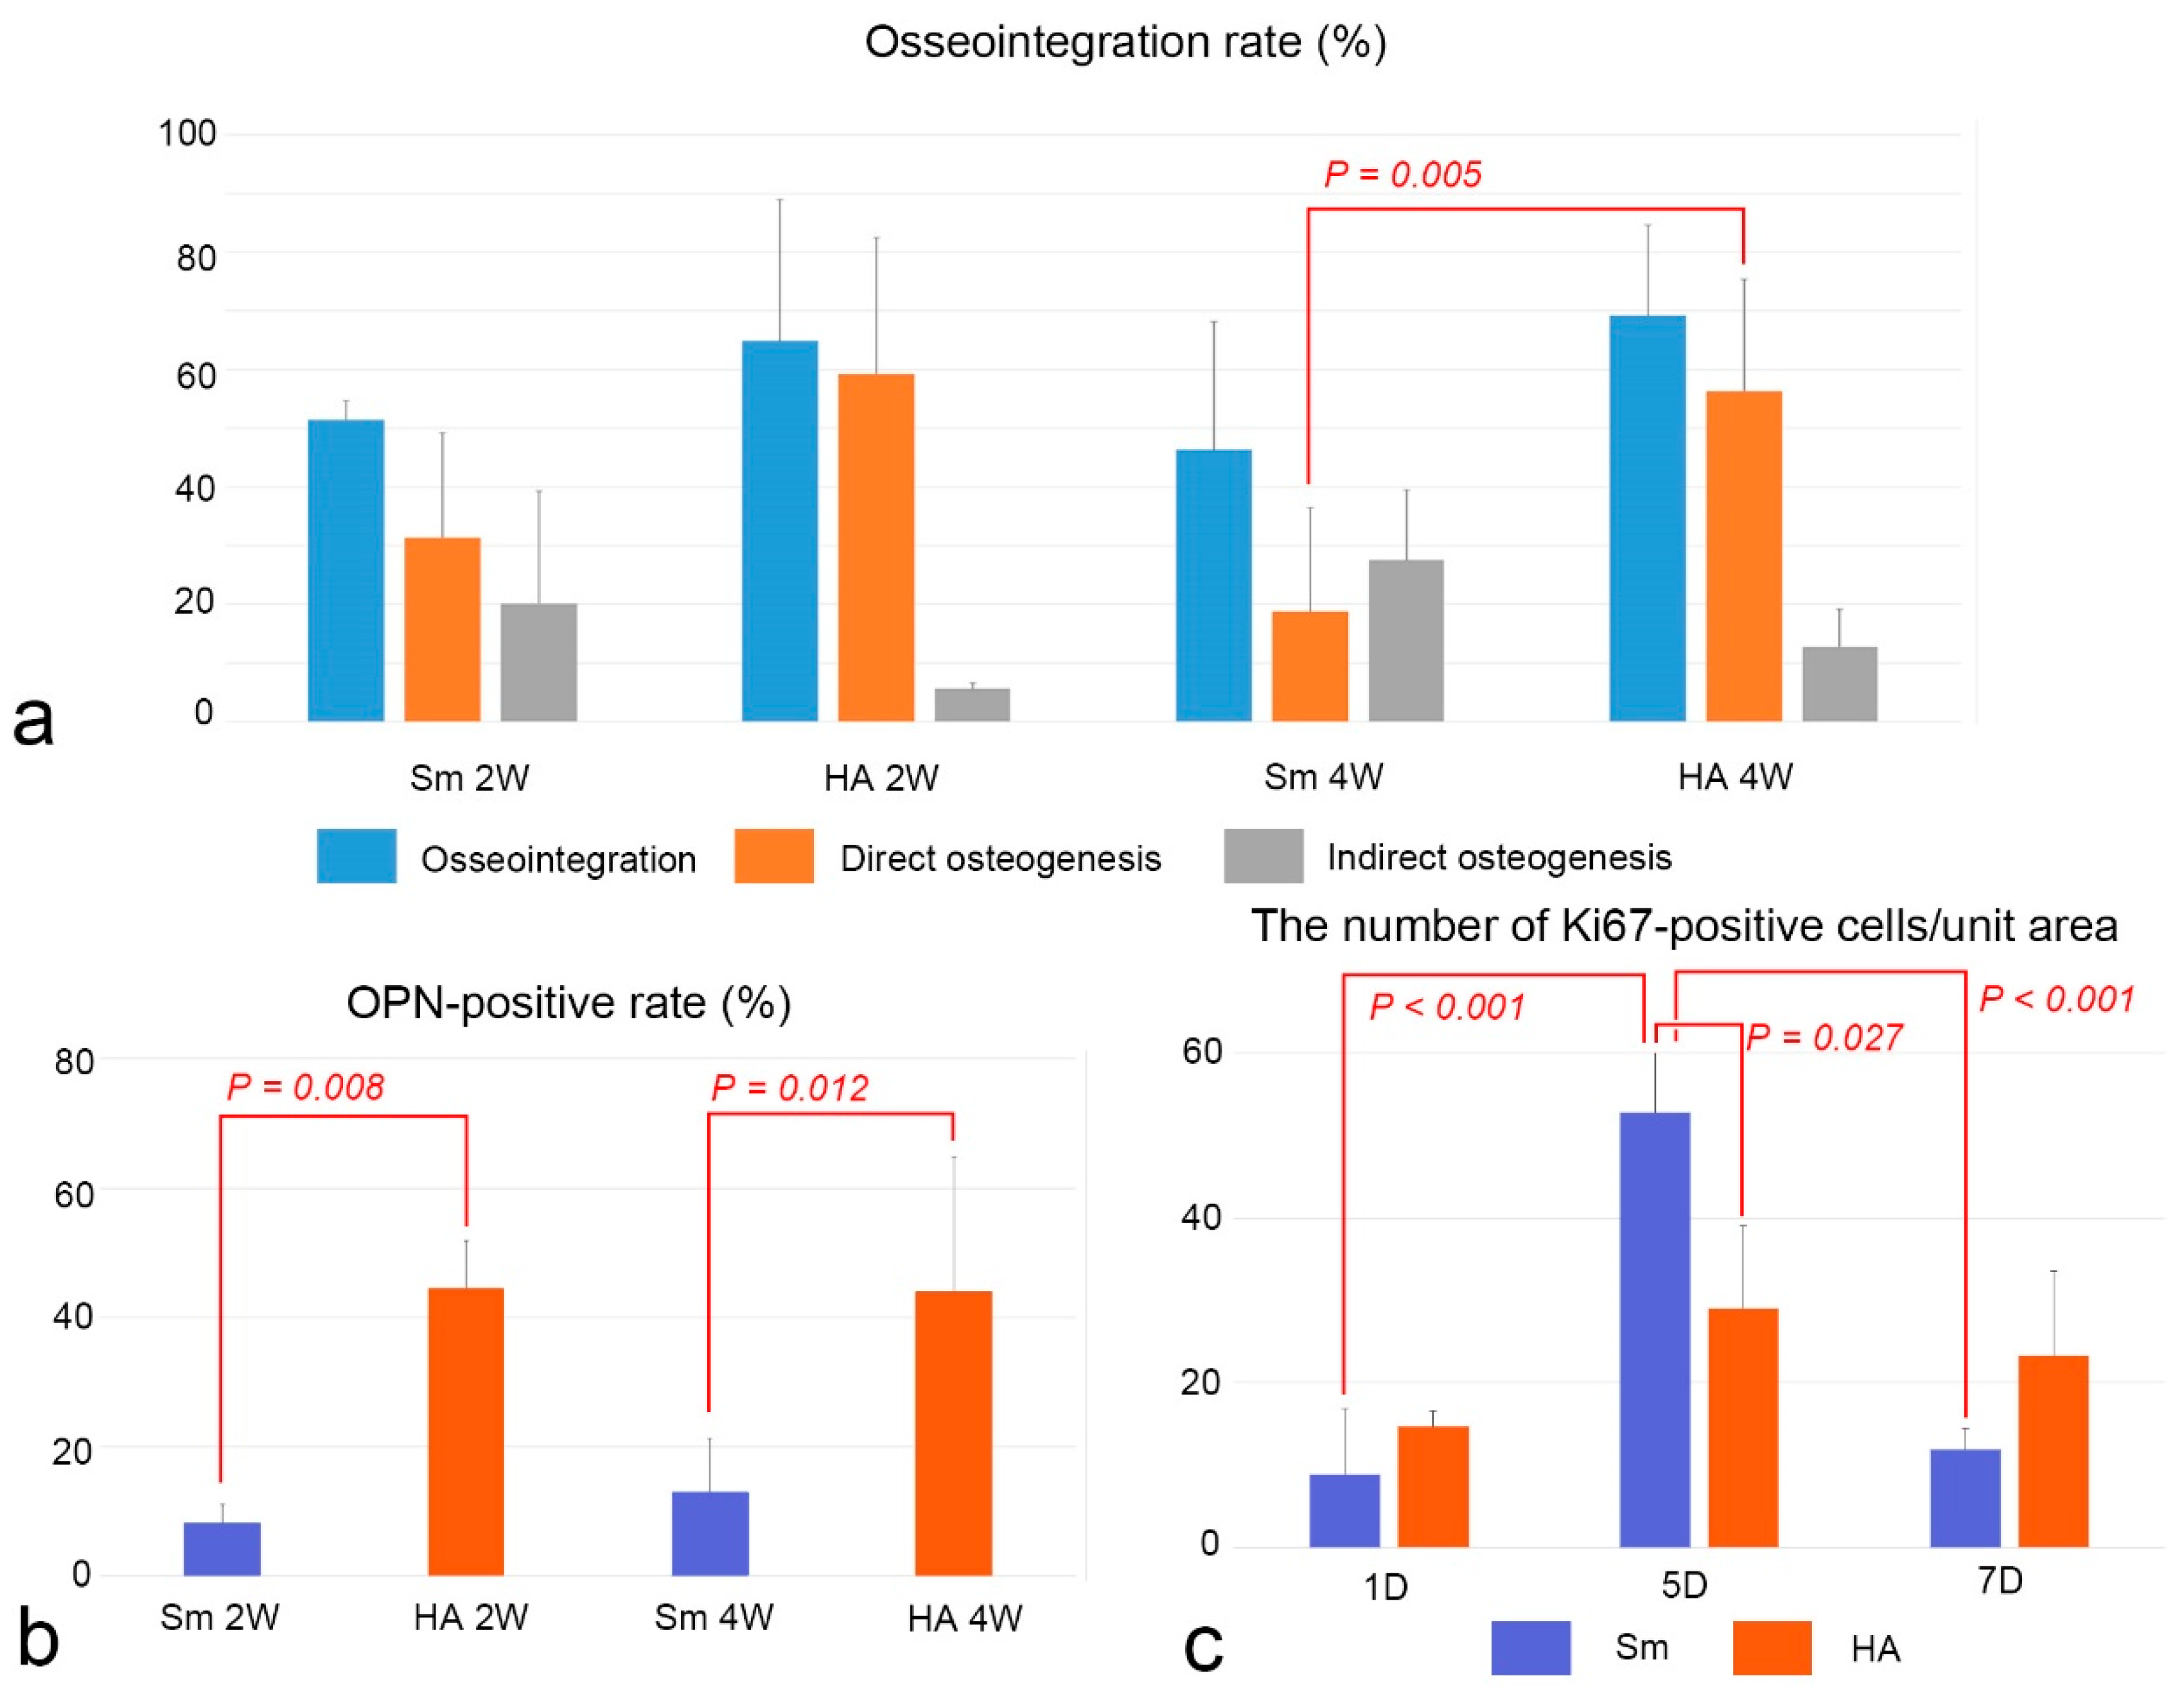
2.4. Osseointegration and OPN-Positive Rates and Cell Proliferation
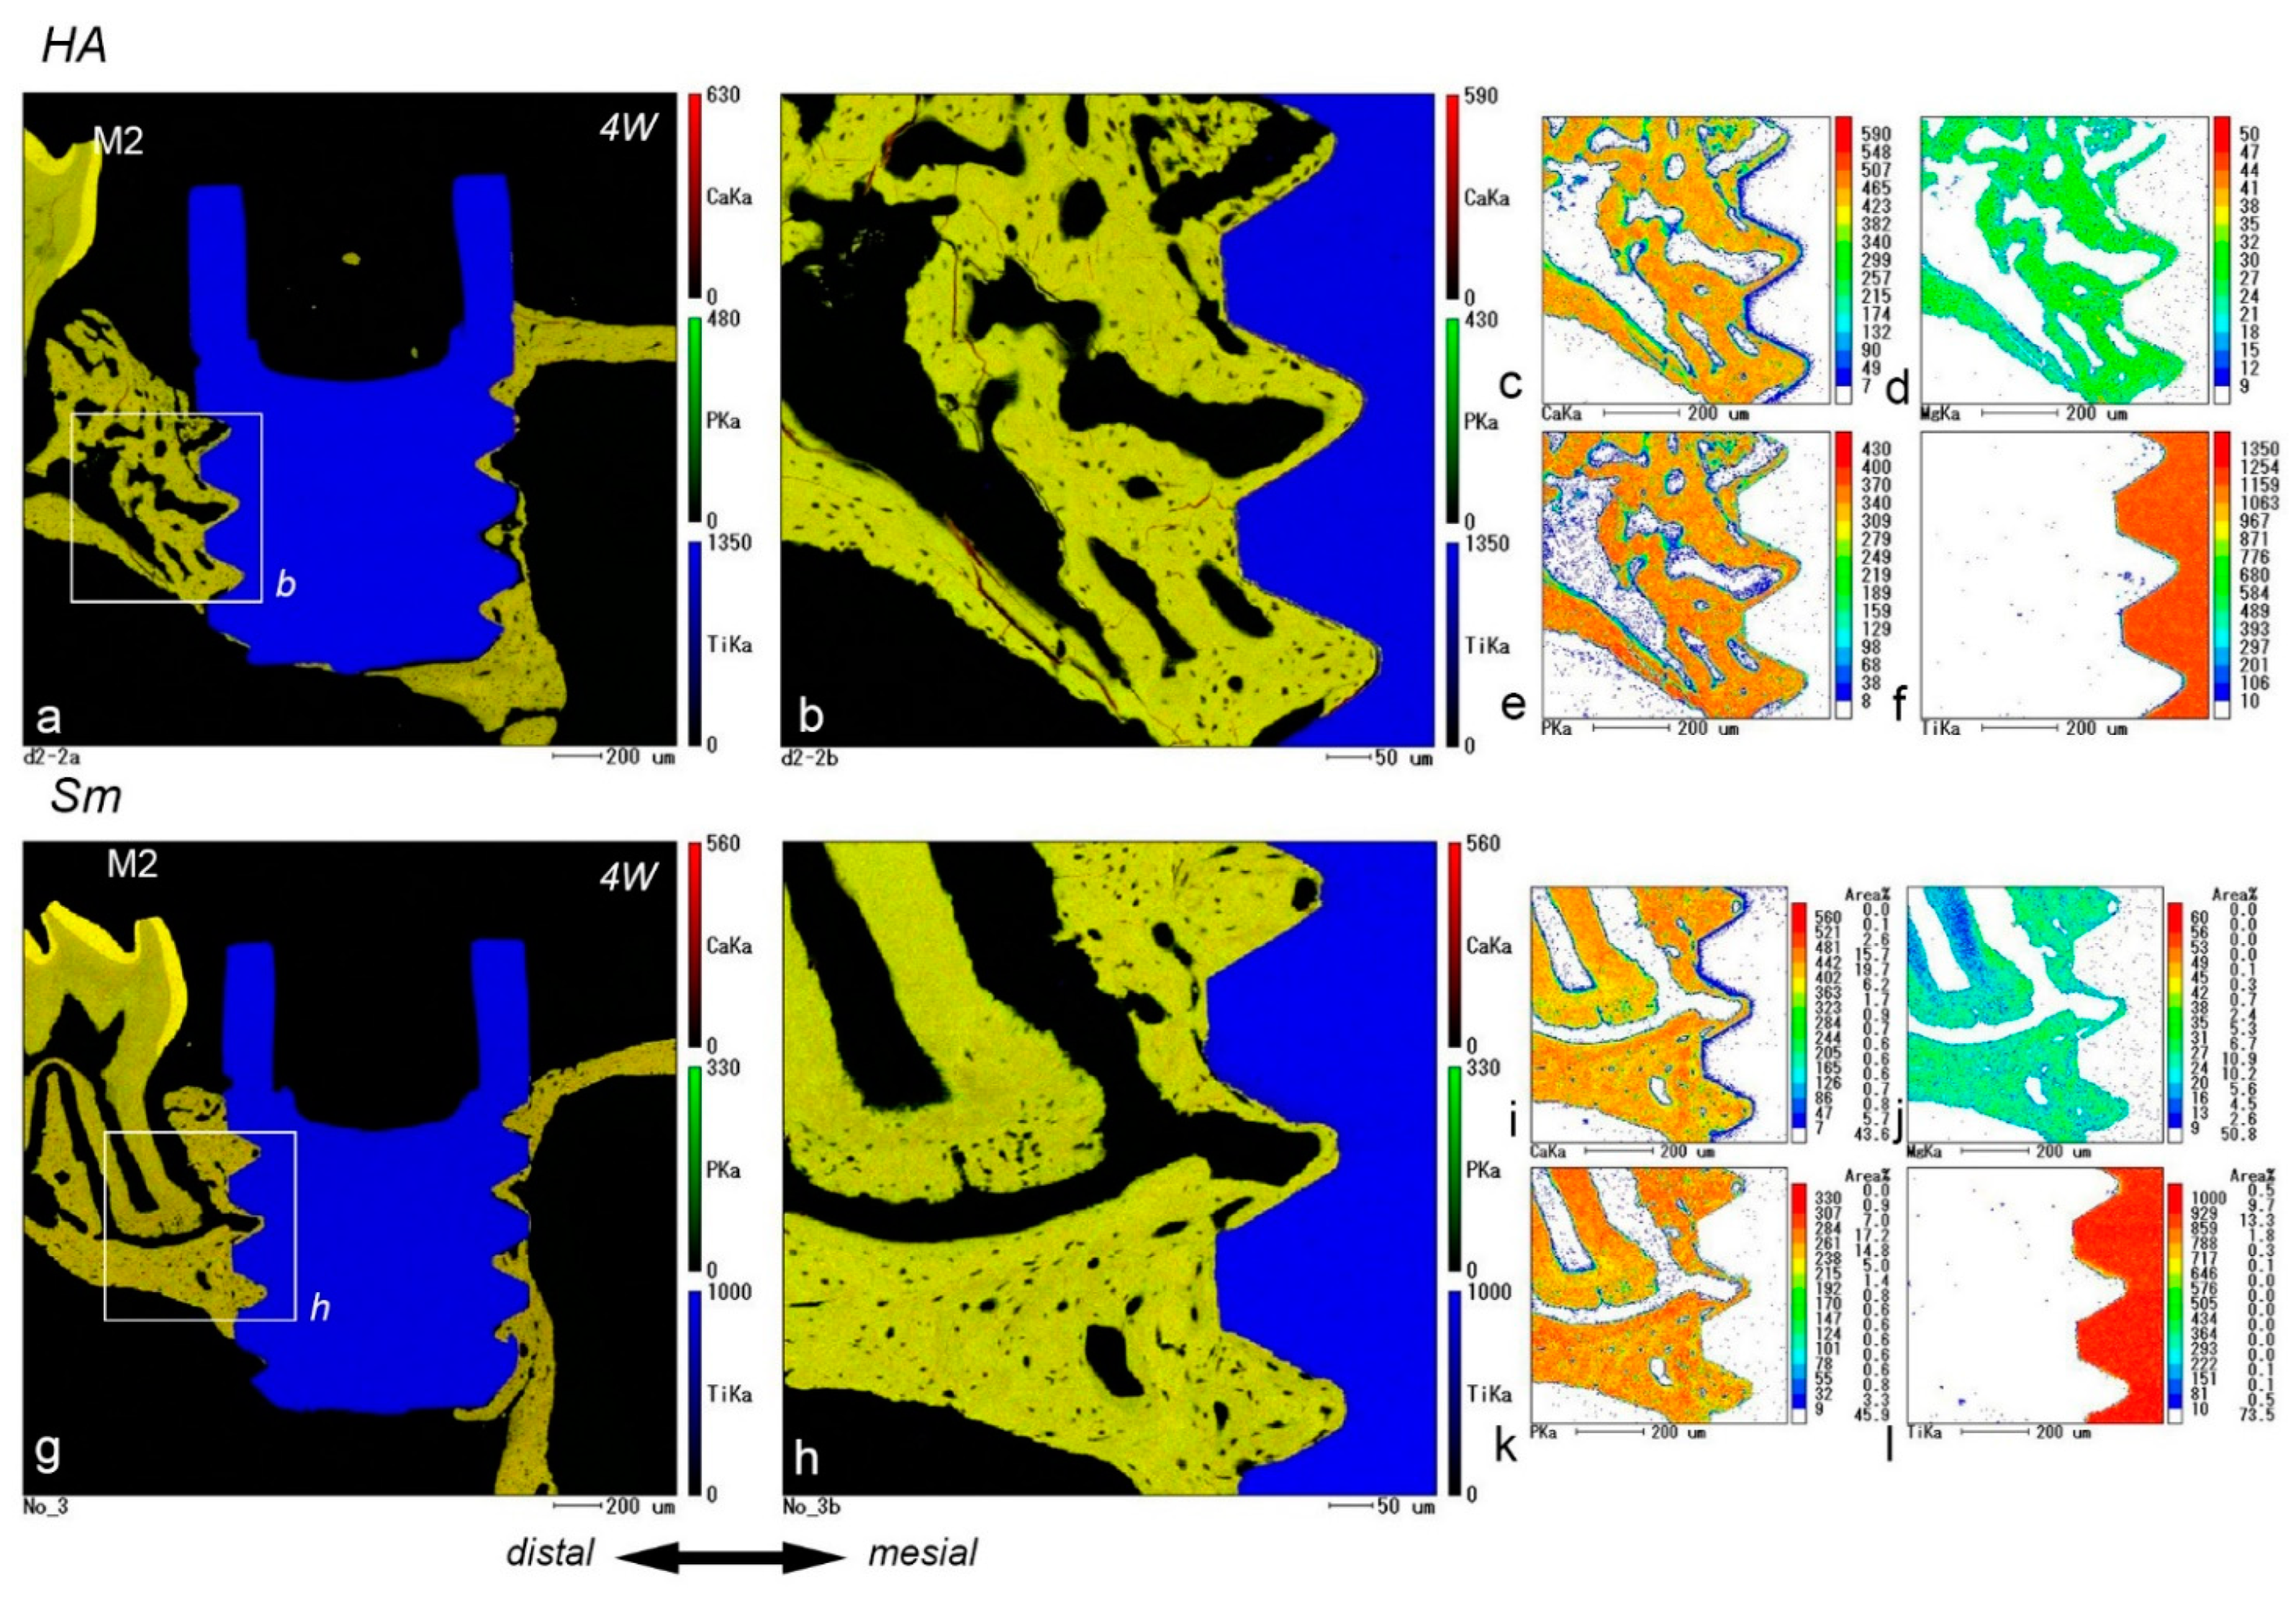
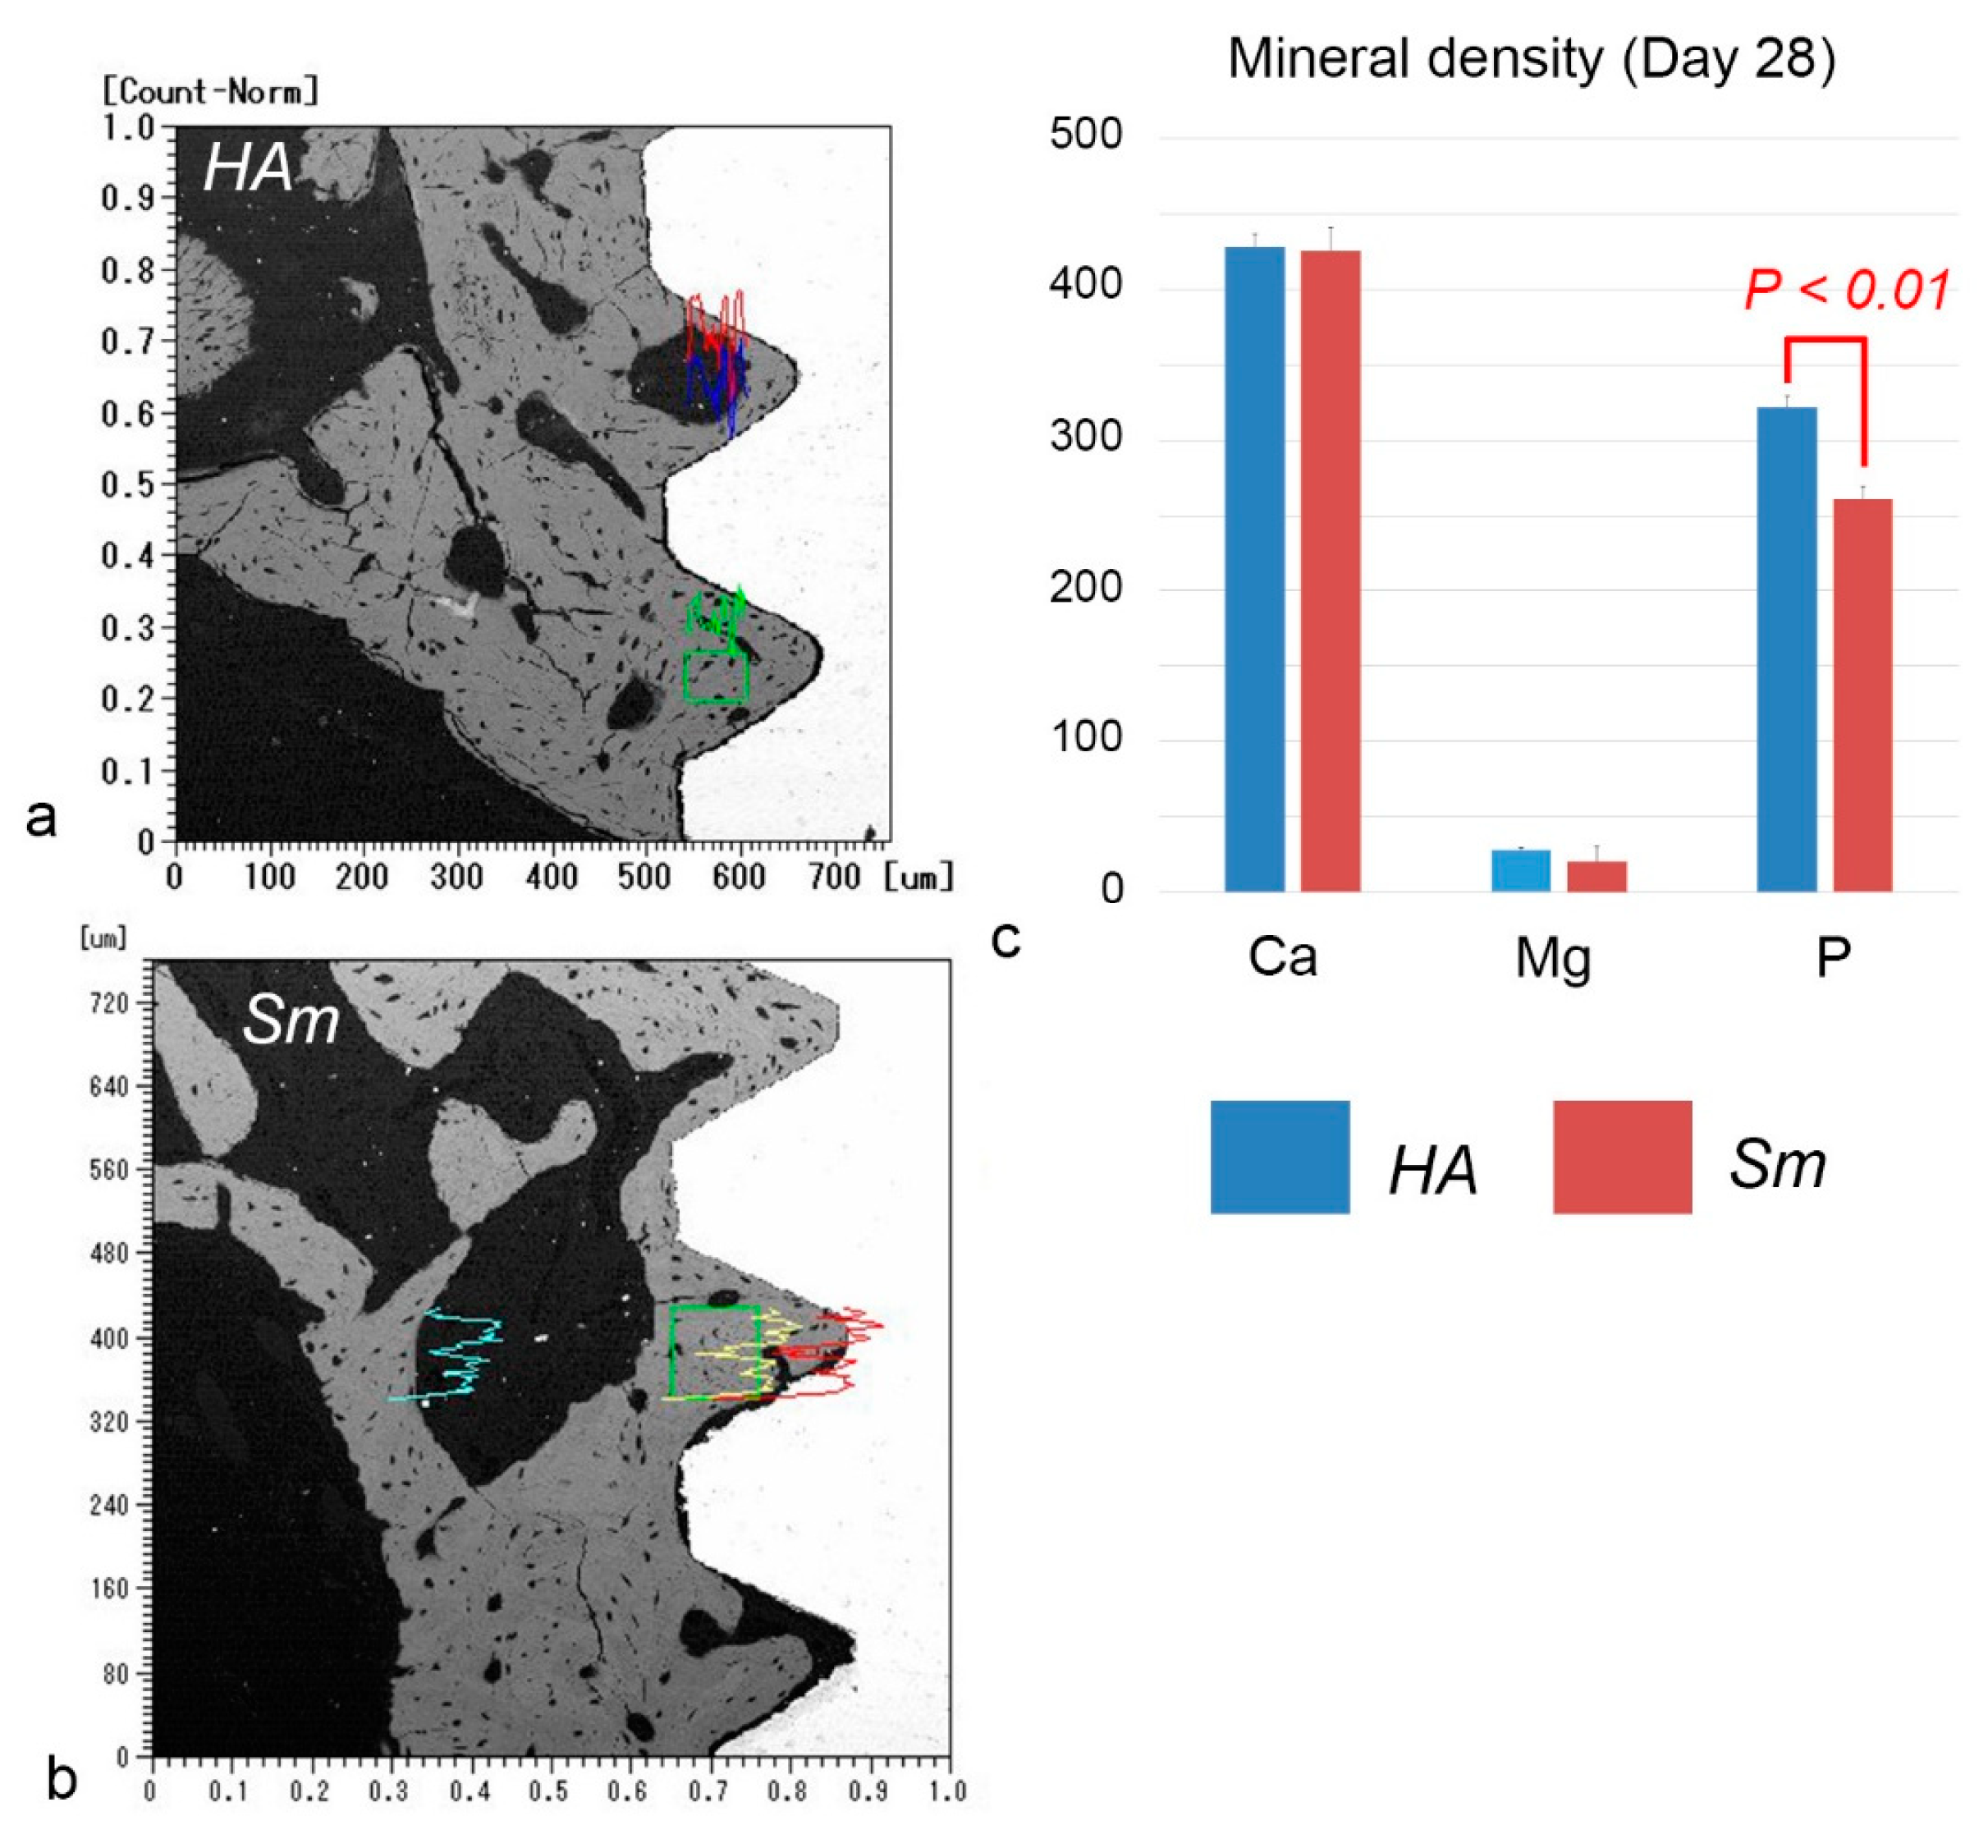
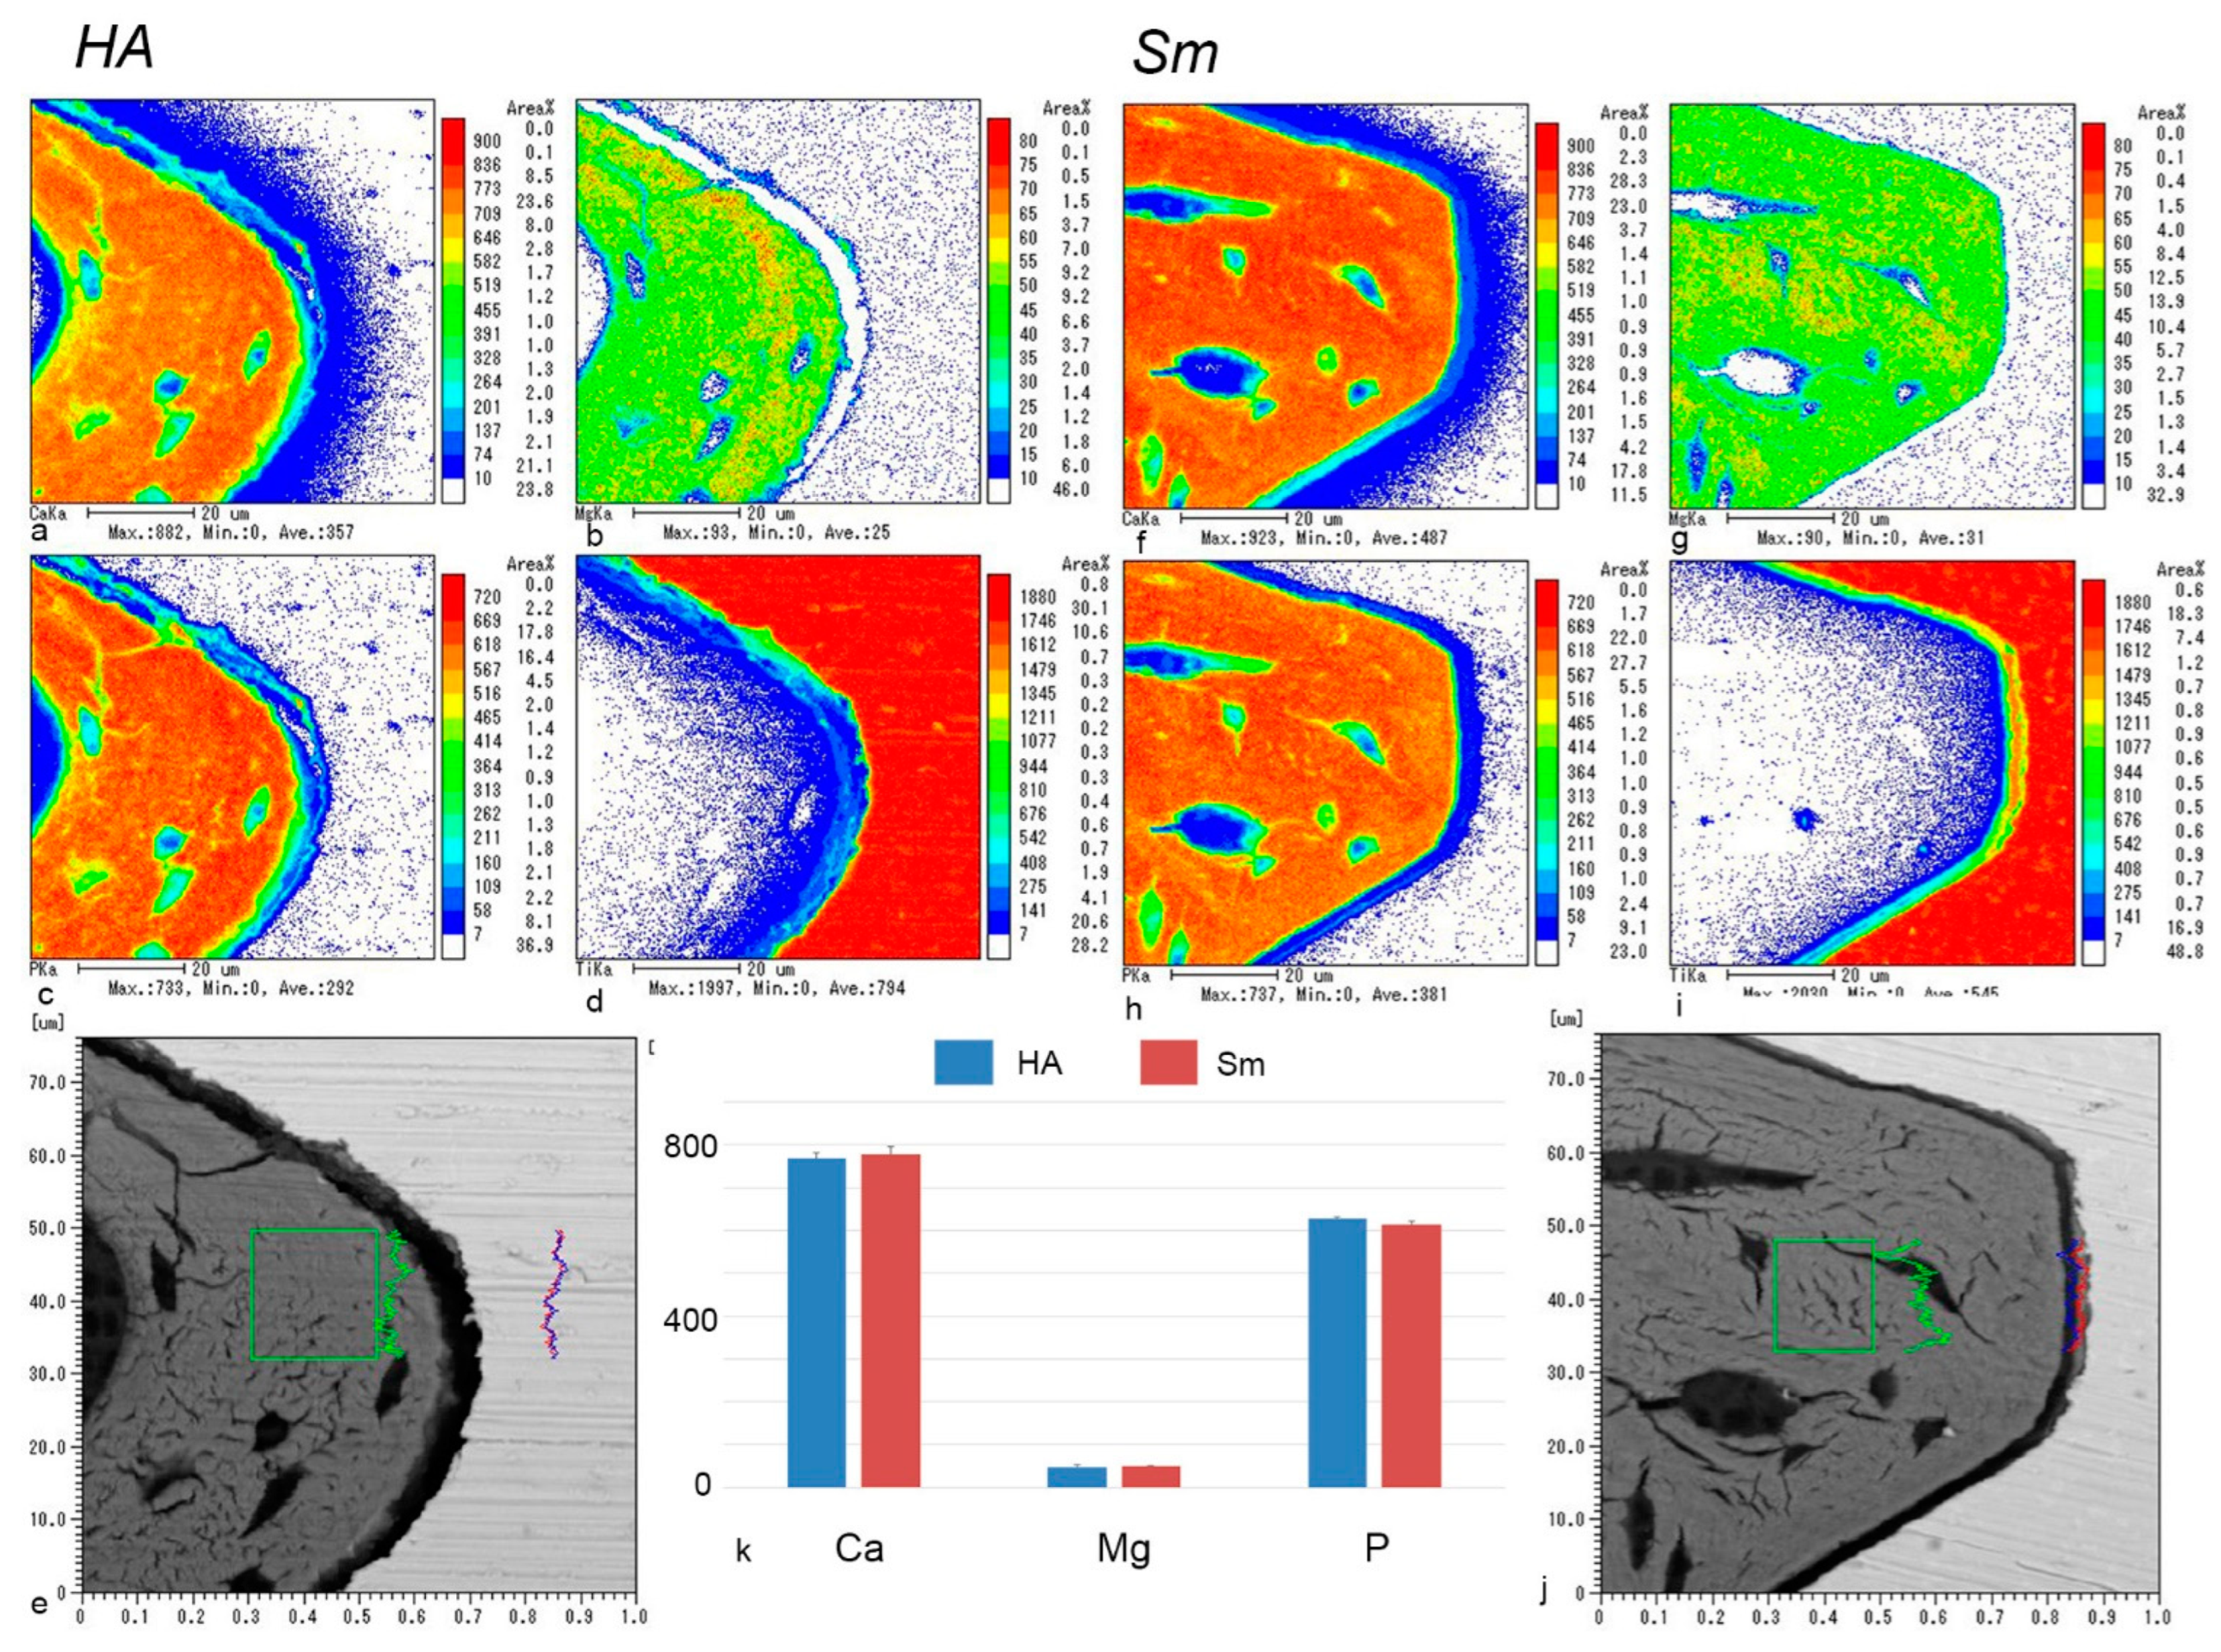
2.5. EPMA Analysis
3. Discussion
4. Materials and Methods
4.1. Animals and Experimental Procedure
4.2. Immediate Implant Placement
4.3. Histological Procedure and Immunohistochemical and Histochemical Analysis
4.4. EPMA Analysis
4.5. Statistical Analysis
5. Conclusions
Author Contributions
Funding
Institutional Review Board Statement
Informed Consent Statement
Data Availability Statement
Acknowledgments
Conflicts of Interest
References
- Adell, R.; Lekholm, U.; Rockler, B.; Branemark, P.I. A 15-year study of osseointegrated implants in the treatment of the edentulous jaw. Int. J. Oral Surg. 1981, 10, 387–416. [Google Scholar] [CrossRef] [PubMed]
- Komori, T. Whole Aspect of Runx2 Functions in Skeletal Development. Int. J. Mol. Sci. 2022, 23, 5776. [Google Scholar] [CrossRef] [PubMed]
- Nakamichi, Y.; Udagawa, N.; Suda, T.; Takahashi, N. Mechanisms involved in bone resorption regulated by vitamin D. J. Steroid Biochem. Mol. Biol. 2018, 177, 70–76. [Google Scholar] [CrossRef] [PubMed]
- Davies, J.E. Understanding peri-implant endosseous healing. J. Dent. Educ. 2003, 67, 932–949. [Google Scholar] [CrossRef] [PubMed]
- Watanabe, T.; Nakagawa, E.; Saito, K.; Ohshima, H. Differences in Healing Patterns of the Bone-Implant Interface between Immediately and Delayed-Placed Titanium Implants in Mouse Maxillae. Clin. Implant. Dent. Relat. Res. 2016, 18, 146–160. [Google Scholar] [CrossRef] [PubMed]
- Makishi, S.; Saito, K.; Ohshima, H. Osteopontin-deficiency disturbs direct osteogenesis in the process of achieving osseointegration following immediate placement of endosseous implants. Clin. Implant. Dent. Relat. Res. 2017, 19, 496–504. [Google Scholar] [CrossRef] [PubMed]
- Sodek, J.; Ganss, B.; McKee, M.D. Osteopontin. Crit. Rev. Oral Biol. Med. 2000, 11, 279–303. [Google Scholar] [CrossRef] [PubMed]
- Makishi, S.; Yamazaki, T.; Ohshima, H. Osteopontin on the Dental Implant Surface Promotes Direct Osteogenesis in Osseointegration. Int. J. Mol. Sci. 2022, 23, 1039. [Google Scholar] [CrossRef]
- Garcia-Gareta, E.; Coathup, M.J.; Blunn, G.W. Osteoinduction of bone grafting materials for bone repair and regeneration. Bone 2015, 81, 112–121. [Google Scholar] [CrossRef]
- Tour, G.; Wendel, M.; Tcacencu, I. Cell-derived matrix enhances osteogenic properties of hydroxyapatite. Tissue Eng. Part A 2011, 17, 127–137. [Google Scholar] [CrossRef] [PubMed]
- Nery, E.B.; LeGeros, R.Z.; Lynch, K.L.; Lee, K. Tissue response to biphasic calcium phosphate ceramic with different ratios of HA/beta TCP in periodontal osseous defects. J. Periodontol. 1992, 63, 729–735. [Google Scholar] [CrossRef]
- Futami, T.; Fujii, N.; Ohnishi, H.; Taguchi, N.; Kusakari, H.; Ohshima, H.; Maeda, T. Tissue response to titanium implants in the rat maxilla: Ultrastructural and histochemical observations of the bone-titanium interface. J. Periodontol. 2000, 71, 287–298. [Google Scholar] [CrossRef]
- Shirakura, M.; Fujii, N.; Ohnishi, H.; Taguchi, Y.; Ohshima, H.; Nomura, S.; Maeda, T. Tissue response to titanium implantation in the rat maxilla, with special reference to the effects of surface conditions on bone formation. Clin. Oral Implant. Res. 2003, 14, 687–696. [Google Scholar] [CrossRef] [PubMed]
- Marongiu, G.; Contini, A.; Lepri, A.C.; Donadu, M.; Verona, M.; Capone, A. The treatment of acute diaphyseal long-bones fractures with orthobiologics and pharmacological interventions for bone healing enhancement: A systematic review of clinical evidence. Bioengineering 2020, 7, 22. [Google Scholar] [CrossRef]
- Lyris, V.; Millen, C.; Besi, E.; Pace-Balzan, A. Effect of leukocyte and platelet rich fibrin (L-PRF) on stability of dental implants. A systematic review and meta-analysis. Br. J. Oral Maxillofac. Surg. 2021, 59, 1130–1139. [Google Scholar] [CrossRef] [PubMed]
- Lindhe, J.; Meyle, J.; Periodontology, E.W. Peri-implant diseases: Consensus Report of the Sixth European Workshop on Periodontology. J. Clin. Periodontol. 2008, 35, 282–285. [Google Scholar] [CrossRef] [PubMed]
- Poli, P.P.; Cicciu, M.; Beretta, M.; Maiorana, C. Peri-Implant Mucositis and Peri-Implantitis: A Current Understanding of Their Diagnosis, Clinical Implications, and a Report of Treatment Using a Combined Therapy Approach. J. Oral Implant. 2017, 43, 45–50. [Google Scholar] [CrossRef] [PubMed]
- Kuroda, K.; Okido, M. Hydroxyapatite Coating of Titanium Implants Using Hydroprocessing and Evaluation of Their Osteoconductivity. Bioinorg. Chem. Appl. 2012, 2012, 730693. [Google Scholar] [CrossRef] [PubMed]
- Kubasiewicz-Ross, P.; Fleischer, M.; Pitulaj, A.; Hadzik, J.; Nawrot-Hadzik, I.; Bortkiewicz, O.; Dominiak, M.; Jurczyszyn, K. Evaluation of the three methods of bacterial decontamination on implants with three different surfaces. Adv. Clin. Exp. Med. 2020, 29, 177–182. [Google Scholar] [CrossRef] [PubMed]
- Suzuki-Barrera, K.; Makishi, S.; Nakatomi, M.; Saito, K.; Ida-Yonemochi, H.; Ohshima, H. Role of osteopontin in the process of pulpal healing following tooth replantation in mice. Regen. Ther. 2022, 21, 460–468. [Google Scholar] [CrossRef] [PubMed]


| Group | Method | Day 1 | Day 5 | Week 1 | Week 2 | Week 4 | Total |
|---|---|---|---|---|---|---|---|
| HA | Histological section | 3 1 | 4 1 | 4 1 | 3 1 | 6 (4 1) | 20 (18 1) |
| Ki67 | (3 1) | (4 1) | (4 1) | - | (11 1) | ||
| OPN | (3 1) | (4 1) | (4 1) | (3 1) | (6 (4 1)) | (20 1) | |
| TRAP | (3 1) | (4 1) | (4 1) | (3 1) | (4 1) | (18 1) | |
| EPMA | 3 1 | 3 1 | |||||
| Sm | Histological section | 3 | 3 | 4 | 4 | 6 | 20 |
| Ki67 | (3) | (3) | (4) | - | (10) | ||
| OPN | (3) | (3) | (4) | (4) | (6) | (20) | |
| TRAP | (3) | (3) | (4) | (4) | (6) | (20) | |
| EPMA | 3 | 3 | |||||
| Total | 6 | 7 | 8 | 7 | 18 | 46 | |
Disclaimer/Publisher’s Note: The statements, opinions and data contained in all publications are solely those of the individual author(s) and contributor(s) and not of MDPI and/or the editor(s). MDPI and/or the editor(s) disclaim responsibility for any injury to people or property resulting from any ideas, methods, instructions or products referred to in the content. |
© 2023 by the authors. Licensee MDPI, Basel, Switzerland. This article is an open access article distributed under the terms and conditions of the Creative Commons Attribution (CC BY) license (https://creativecommons.org/licenses/by/4.0/).
Share and Cite
Makishi, S.; Watanabe, T.; Saito, K.; Ohshima, H. Effect of Hydroxyapatite/β-Tricalcium Phosphate on Osseointegration after Implantation into Mouse Maxilla. Int. J. Mol. Sci. 2023, 24, 3124. https://doi.org/10.3390/ijms24043124
Makishi S, Watanabe T, Saito K, Ohshima H. Effect of Hydroxyapatite/β-Tricalcium Phosphate on Osseointegration after Implantation into Mouse Maxilla. International Journal of Molecular Sciences. 2023; 24(4):3124. https://doi.org/10.3390/ijms24043124
Chicago/Turabian StyleMakishi, Sanako, Taisuke Watanabe, Kotaro Saito, and Hayato Ohshima. 2023. "Effect of Hydroxyapatite/β-Tricalcium Phosphate on Osseointegration after Implantation into Mouse Maxilla" International Journal of Molecular Sciences 24, no. 4: 3124. https://doi.org/10.3390/ijms24043124