Article

Genome-Wide Identification and Phylogenetic and Expression Analyses of the PLATZ Gene Family in Medicago sativa L.

1
Institute of Animal Science, Chinese Academy of Agricultural Sciences, Beijing 100193, China
2
College of Life Science and Technology, Harbin Normal University, Harbin 150025, China
3
Institute of Forage Crop Science, Ordos Academy of Agricultural and Animal Husbandry Sciences, Ordos 017000, China
*
Author to whom correspondence should be addressed.
These authors contributed equally to this work.
Int. J. Mol. Sci. 2023, 24(3), 2388; https://doi.org/10.3390/ijms24032388
Submission received: 12 December 2022 / Revised: 10 January 2023 / Accepted: 18 January 2023 / Published: 25 January 2023
(This article belongs to the Special Issue Advanced Research in Plant Responses to Environmental Stresses 2.0)

Abstract

:
The PLATZ family is a novel class of plant-specific zinc finger transcription factors with important roles in plant growth and development and abiotic stress responses. PLATZ members have been identified in many plants, including Oryza sativa, Zea mays, Triticum aestivum, Fagopyrum tataricum, and Arabidopsis thaliana; however, due to the complexity of the alfalfa reference genome, the members of the PLATZ gene family in alfalfa (Medicago sativa L.) have not been systematically identified and analyzed. In this study, 55 Medicago sativa PLATZ genes (MsPLATZs) were identified in the alfalfa “Xinjiangdaye” reference genome. Basic bioinformatic analysis was performed, including the characterization of sequence lengths, protein molecular weights, genomic positions, and conserved motifs. Expression analysis reveals that 7 MsPLATZs are tissue-specifically expressed, and 10 MsPLATZs are expressed in all examined tissues. The transcriptomic expression of these genes is obvious, indicating that these MsPLATZs have different functions in the growth and development of alfalfa. Based on transcriptome data analysis and real-time quantitative PCR (RT-qPCR), we identified 22, 22, and 21 MsPLATZ genes that responded to salt, cold, and drought stress, respectively, with 20 MsPLATZs responding to all three stresses. This study lays a foundation for further exploring the functions of MsPLATZs, and provides ideas for the improvement of alfalfa varieties and germplasm innovation.

1. Introduction

Transcription factor is a protein that binds to specific DNA sequences, often containing one or more DNA-binding domains, and regulates the expression of target genes by identifying cis DNA sequences in the promoters of target genes [1,2]. Transcription factors play an important role in improving stress resistance in plants. Therefore, it is important to study the biological functions and regulatory mechanisms of important transcription factors under abiotic stress conditions. The typical DNA-binding regions in plant transcription factors include the AP2/EREBP domain [3], MYB domain [4], WRKY domain [5], zinc finger domain [6], and bZIP domain [7]. The PLATZ family is a novel class of plant-specific zinc finger transcription factors initially isolated from peas (first member named plant AT-rich sequence and zinc-binding protein 1, PLATZ 1), whose members contain two highly conserved protein zinc finger motifs (C-x2-H-x11-C-x2-C-x(4–5)-C-x2-C-x(3–7)-H-x2-H and C-x2-C-x(10–11)-C-x3-C) that show nonspecific binding to A/T-rich sequences and repress transcription [8]. PLATZ proteins play important roles in plant growth and development and abiotic stress responses.
Previous studies show that PLATZ proteins play important roles in multiple biological processes in plants, including regulating seed germination, leaf cell proliferation, and senescence. For example, the Oryza sativa PLATZ proteins can regulate the expression of genes involved in rice grain development. The Oryza sativa GL6 (SG6) PLATZ protein knockout mutant gl6/sg6 shows grain length shortening and grain weight reduction, while after GL6/SG6 overexpression, the grains become significantly larger and heavier, and plant height and plant fresh weight are significantly increased [9,10]. The protein encoded by the Floury3 (FL3) gene in Zea mays also belongs to the PLATZ superfamily and is specifically expressed in endosperm cells and can affect endosperm development and nutrient storage [11]. A dominant Arabidopsis thaliana mutant of the PLATZ family transcription factor ORESARA15 shows increases in the leaf life span and leaf size, suggesting that ORE15 could regulate leaf growth [12]. In transcriptome comparison studies of normal villous (FL) and syngenic nonvillous (Fl) diploid cotton fibers, it was found that a PLATZ transcription factor was downregulated after 10 d of flowering in Fl compared with FL, suggesting that the PLATZ zinc finger transcription factor may play a role in the cotton fiber initiation and elongation stage [13]. A PLATZ protein plays an important role in the transition from primary growth to secondary growth during Populus stem development [14]. PLATZ gene expression is very different in mature and immature sugarcane tissues of sugarcane high-fiber genotypes, and it is speculated that PLATZ may be a transcriptional regulator of secondary cell wall synthesis [15].
Many studies show that PLATZ transcription factors are not only widely involved in plant growth and development, but can also respond to multiple abiotic stresses. AtPLATZ1 plays an important role in seed dehydration tolerance. AtPLATZ1 overexpression in wild-type Arabidopsis thaliana results in partial seed dehydration tolerance in vegetative tissues, contributing to its ability to improve low water utilization and survive in water-deficient environments, and AtPLATZ1 regulates drought resistance in vegetative tissues [16]. The expression of Zea mays PLATZ1 homologs is strongly induced by drought stress [14,15,16], indicating that PLATZ proteins are key factors regulating drought stress in Zea mays [17]. The heterologous expression of GhPLATZ1 in Arabidopsis thaliana can inhibit ABA biosynthesis during seed development and regulate the Arabidopsis thaliana response to salt and osmotic stress during seed germination and seedling establishment. Therefore, it is speculated that GhPLATZ1 may regulate osmotic stress and salt stress responses during cotton seed germination and seedling establishment [18].
Alfalfa (Medicago sativa L.) is a perennial legume plant widely planted worldwide as an economic forage plant [19]. It has the advantages of high adaptability, high protein content, and rich nutritional value [20,21]. Alfalfa has a long history of cultivation in China. With the continuous development of animal husbandry in China in recent years, the demand for alfalfa has also greatly increased, and research on alfalfa is intensifying [22]. Mining the excellent genes of Medicago sativa is of great significance to improve researching alfalfa at the theoretical level and to better guide the production of alfalfa. Therefore, the identification of PLATZ proteins in Medicago sativa is important based on the identified regulatory roles of PLATZ proteins in plant seed growth and development and the functional potential associated with plant stress resistance [9,12].
In this study, 55 PLATZ proteins were identified in the alfalfa genome. The chromosomal localizations, gene structures, conserved motifs, and cis-acting elements in the promoter regions of 55 MsPLATZs were comprehensively studied, and the evolutionary relationships of Medicago sativa PLATZs with those of three representative species, Arabidopsis thaliana, Medicago truncatula, and Glycine max, were analyzed. Real-time quantitative polymerase chain reaction (qRT-PCR) was used to determine the different tissue expression profiles of MsPLATZs in alfalfa. In addition, the expression profiles of MsPLATZs under three abiotic stresses (salt, drought, and cold stress) were also studied to determine the roles of MsPLATZs in different biological processes in alfalfa. These results provide valuable information for the identification of candidate MsPLATZ genes involved in various abiotic stress responses in alfalfa.

2. Results

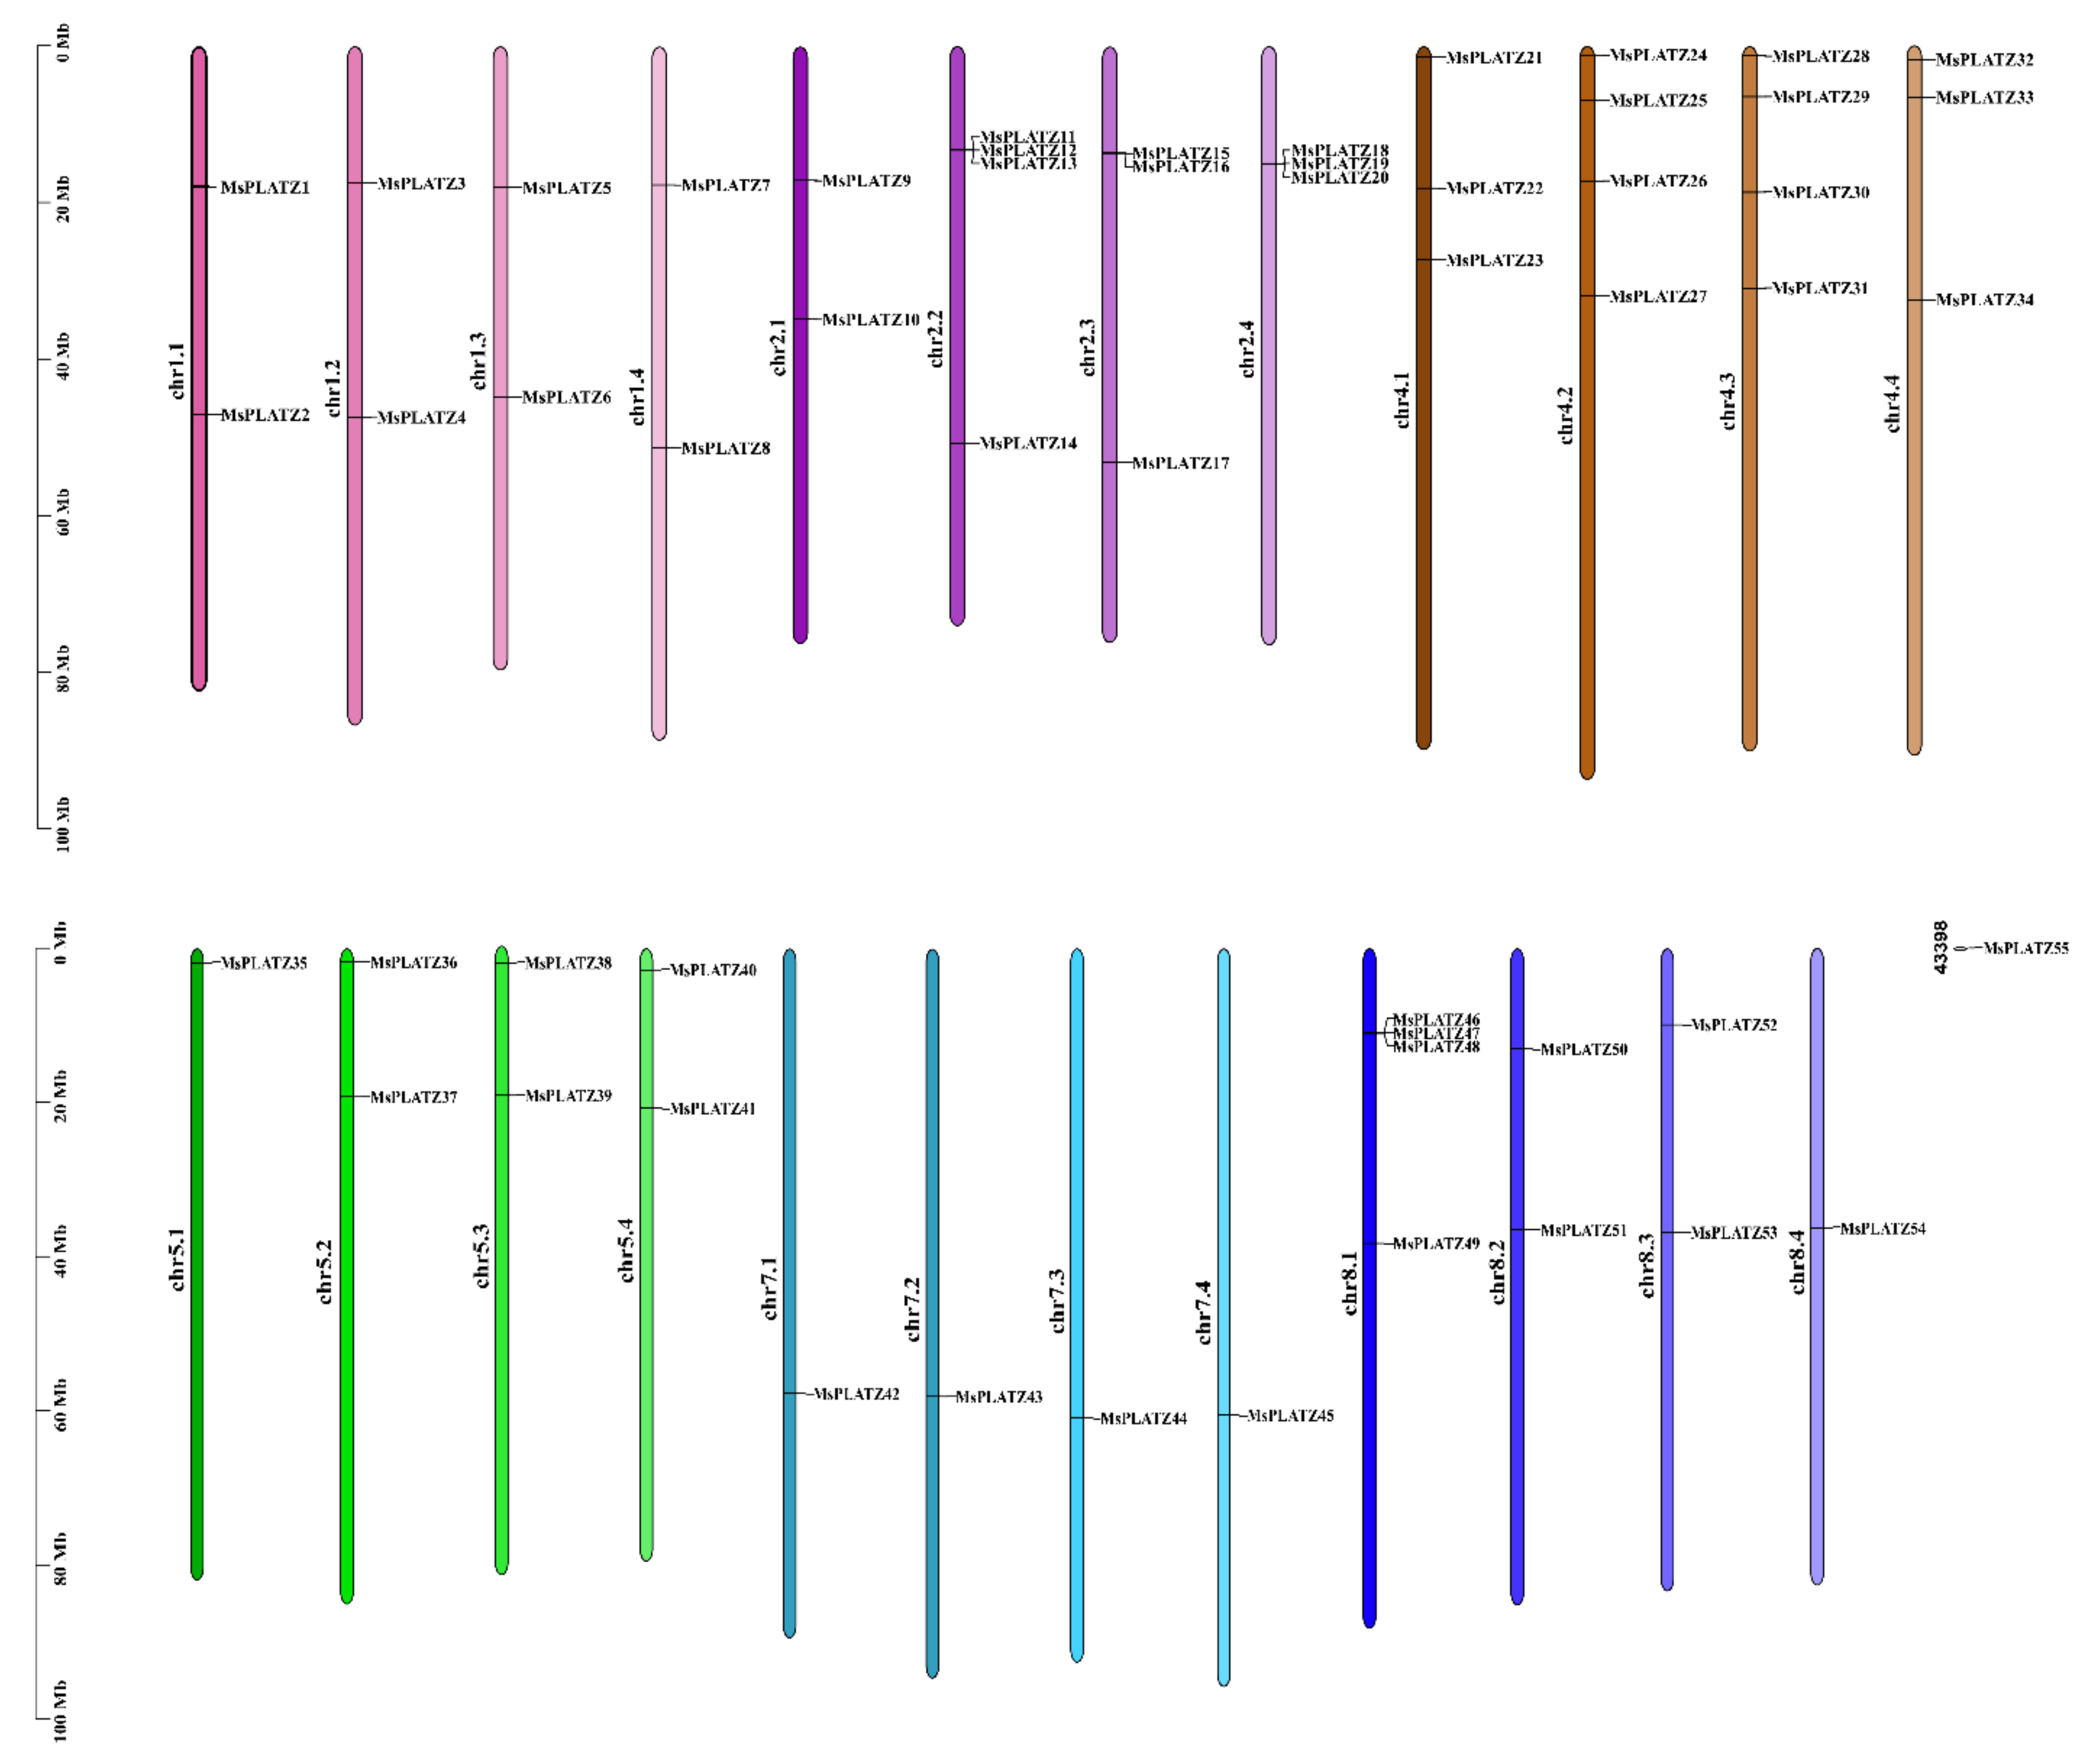
2.1. Identification of PLATZ Genes in the Alfalfa Genome

A total of 55 PLATZ genes were identified in the genome of Chinese landraces (Medicago sativa L. XinJiangDaYe) on the basis of HMM and domain analysis [23]. Basic information about the members of the alfalfa PLATZ gene family is listed in Table 1 and Table S1. As shown in Table 1, the full-length coding sequences (CDS), predicted protein products, molecular weights (Mw), and isoelectric points (pI) of the MsPLATZ genes are quite different, ranging from 156 (MsPLATZ1)–1890 (MsPLATZ17) bp, 52 (MsPLATZ1)–630 (MsPLATZ17) aa, 5.83 (MsPLATZ1)–72.48 (MsPLATZ17) kDa, and 4.69 (MsPLATZ10)–9.91 (MsPLAT37), respectively, with corresponding mean values of 654 bp, 218 aa, 24.82 kDa, and 8.92, respectively.
The 55 PLATZ genes are not evenly distributed on the 32 chromosomes in the alfalfa reference genome and are not distributed on either chr3 or chr6 (Figure 1). The greatest number of MsPLATZ genes (four genes) are located on chromosomes chr2.2, chr4.2, chr4.3, and chr8.1, while three genes are distributed on chromosomes chr2.3, chr2.4, chr4.1, and chr4.4. In chr1.1, chr1.2, chr1.3, chr1.4, chr2.1, chr5.2, chr5.3, chr5.4, chr8.2, and chr8.3, two genes are distributed on these 10 chromosomes. There is only one gene located on six chromosomes (chr5.1, chr7.1, chr7.2, chr7.3, chr7.4, and chr8.4). Finally, one gene is not distributed on the chromosome. We named these genes MsPLATZ1-MsPLATZ54 based on their location on the chromosome, and a gene not on the chromosome, MsPLZATZ55.

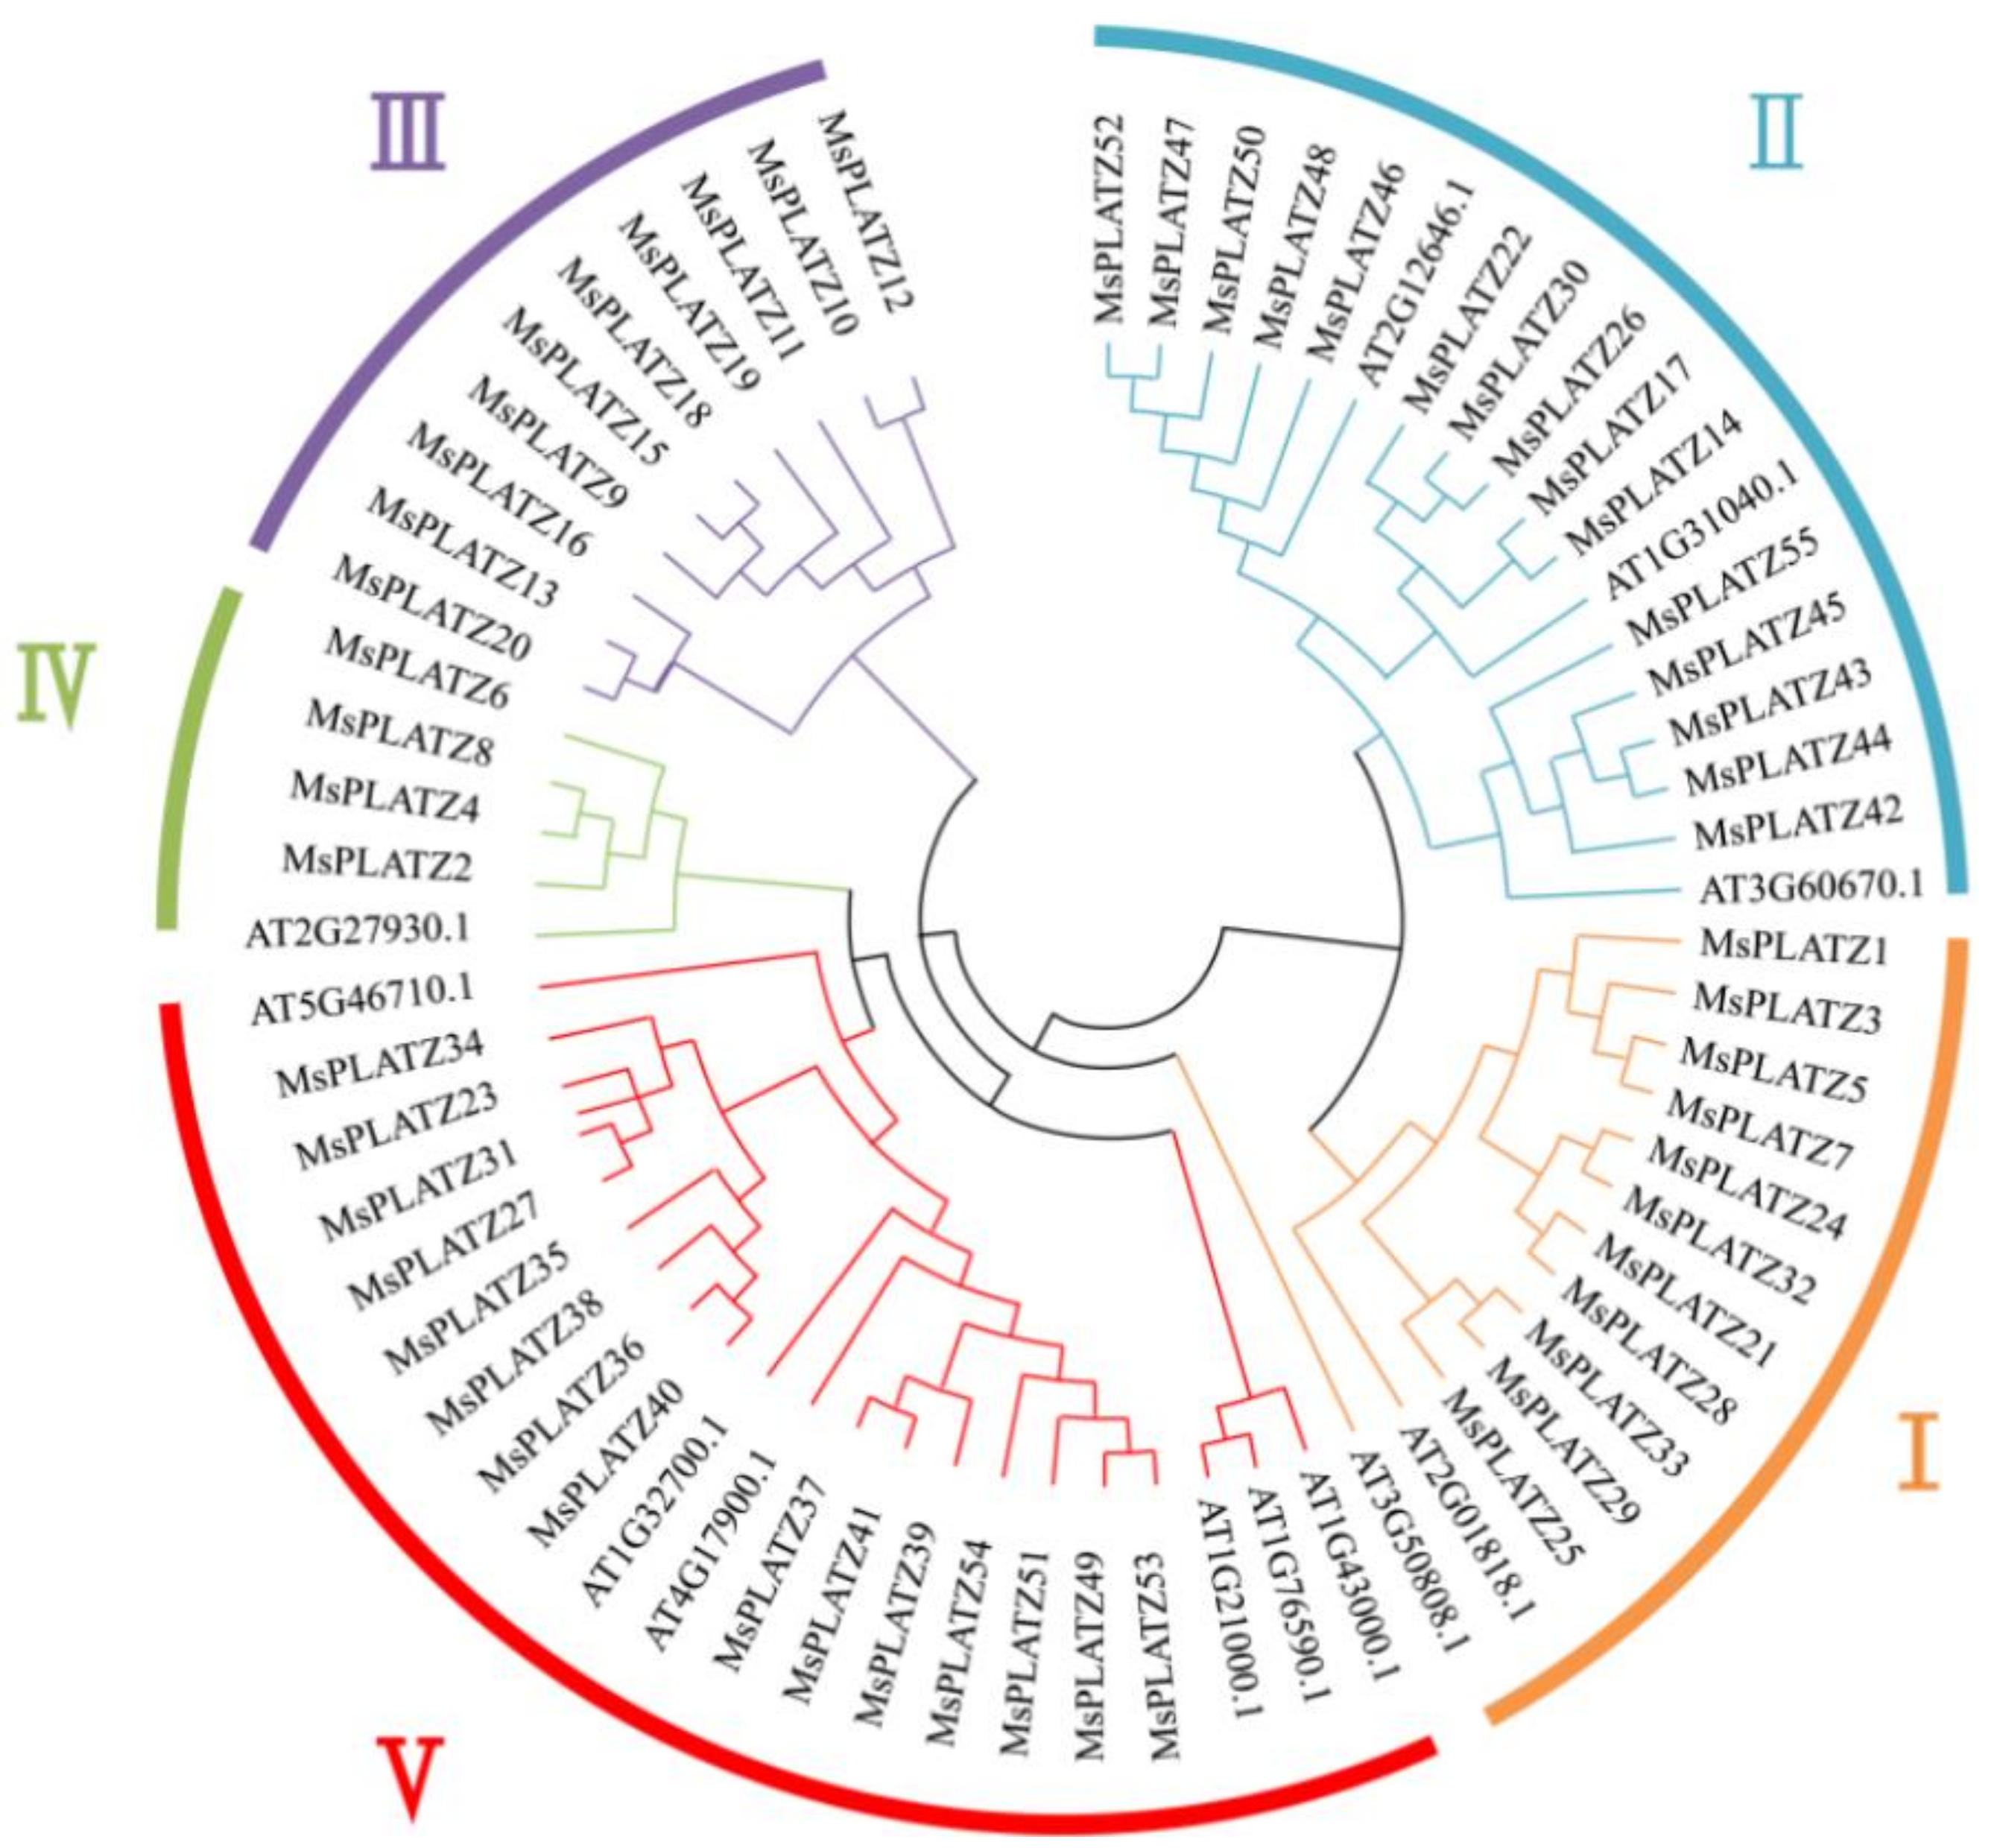
2.2. Phylogenetic Analysis and Classification of MsPLATZ Proteins

To elucidate the evolutionary relationship between the MsPLATZ proteins and the model plant AtPLATZ proteins, a neighbor-joining tree containing 55 identified MsPLATZs and 12 AtPLATZs was constructed with MEGA software (Figure 2). The 67 PLATZ proteins were divided into five groups (I–V), and the MsPLATZ proteins were distributed in all five groups (I–V). Among the five groups, group V contains the most PLATZ proteins, with 21 members, including 15 MsPLATZs and 6 AtPLATZs, and group IV has the fewest PLATZ members, including 4 MsPLAYTZs and 1 AtPLATZ. Group II contains 3 AtPLATZs and 15 MsPLATZs, and the number of MsPLATZs is the same as that in group V. Group III contains only 10 MsPLATZ members. Group I has a total of 13 PLATZ members, including 11 MsPLATZs and 2 AtPLATZs. In addition, the phylogenetic tree of MsPLATZs was constructed based on the grouping in the phylogenetic tree and analyzed for gene structure and motif components among the groups (Figure 3A).

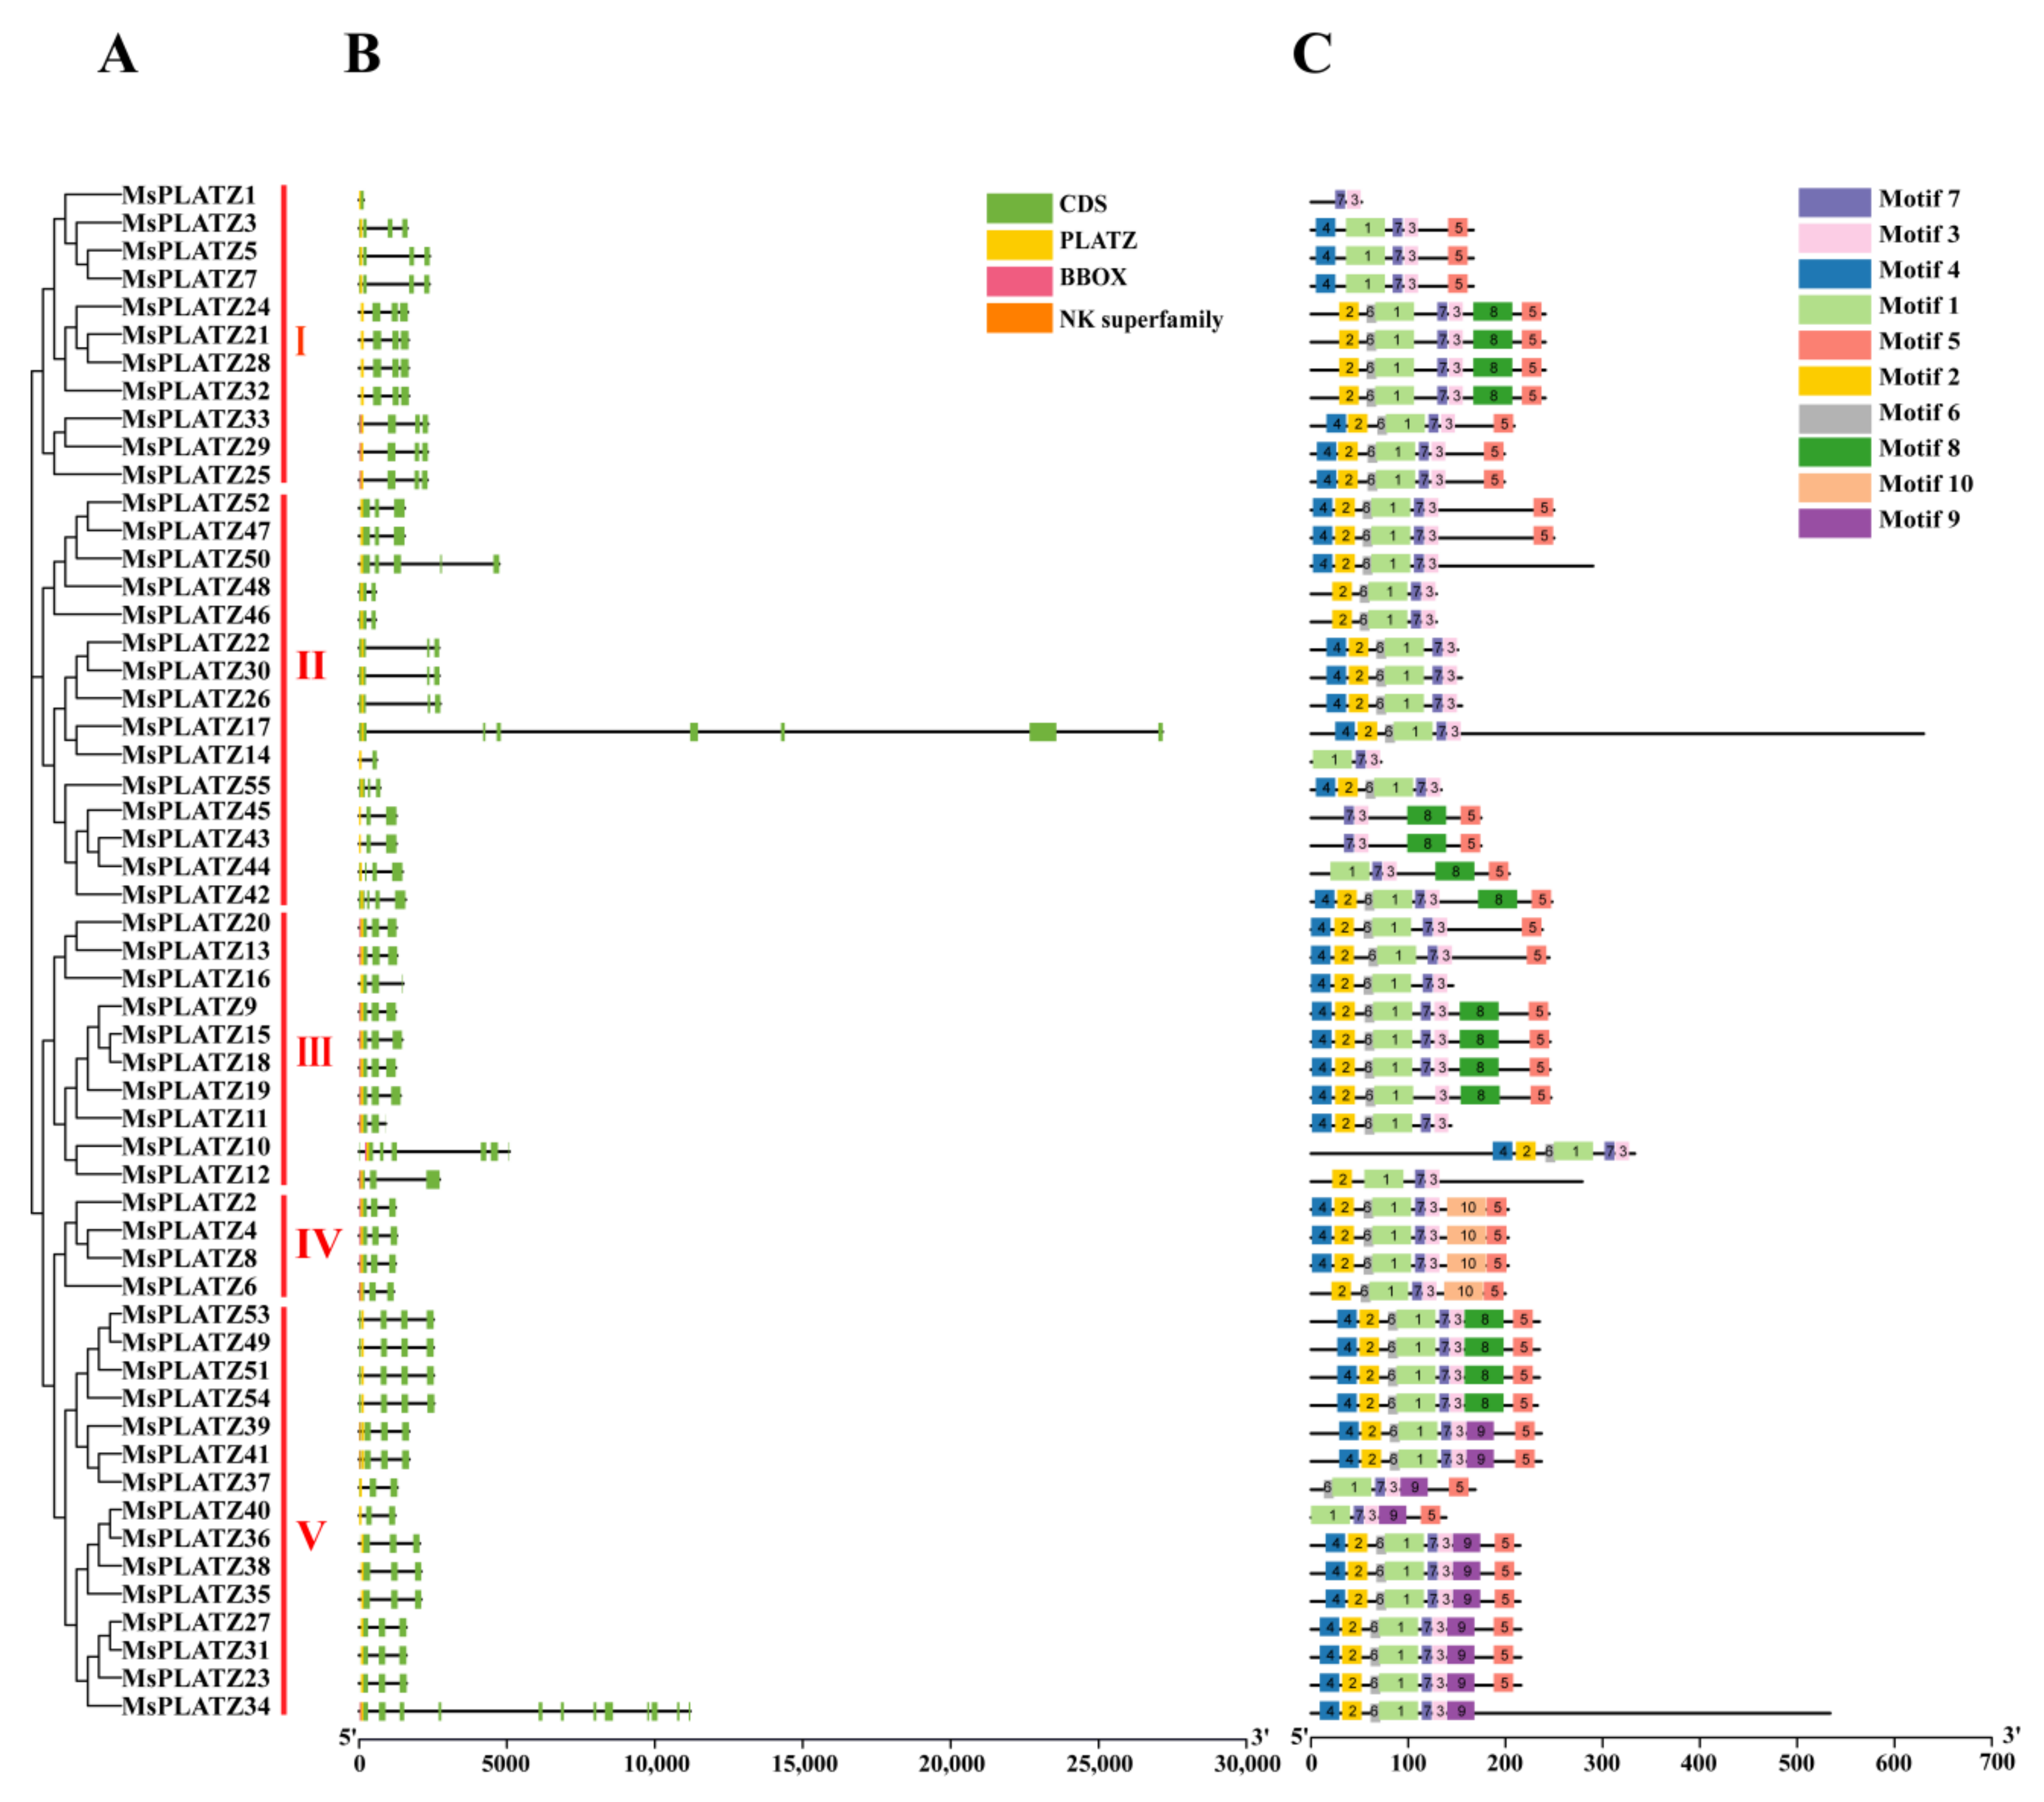
2.3. Gene structure and Conserved Motif Analysis of MsPLATZ Genes

To understand the structural composition of the MsPLATZ genes, we investigated the exon and intron structure of the MsPLATZ genes based on the Medicago sativa genomic DNA sequence (Figure 3B). The results show that the gene structure of the MsPLATZ genes presents some differences in the five groups, but also exhibits some similarity between the groups. The vast majority of genes (51 of 55, 92.73%) have five exons or fewer, with the greatest percentage containing four exons (40 of 55, 72.73%); only four genes, MsPLATZ50/10/17/34, have more than 5 exons, and MsPLATZ34 has 13 exons. Among the genes in group I, MsPLATZ1 has only one exon, and all other genes contain four exons. In group III, similar to group I, only MsPLATZ10 has seven exons, and all other genes contain four exons. Group IV includes only four members, all of which contain four exons. Group V induces the gene with the largest number of exons, MsPLATZ34, with 13 exons. The number of exons varies among the members of group II, ranging from 1–8, but most of these genes contain four exons.
To identify the conserved motifs of the MsPLATZs, we performed an assay analysis with the MEME website. A total of 10 conserved motifs were detected in the MsPLATZ genes, which were designated Motifs 1–10 (Figure 3C). Motif 3, motif 7, motif 1, motif 2, and motif 6 represent 100%, 98.18%, 94.55%, 81.82%, and 80%, respectively, of the five most abundant pairs of the 10 motifs, indicating that these motifs are the most important components of MsPLATZ proteins. Motif 7 is not present in MsPLATZ19, indicating possible sequence loss in the course of evolution. The members within each group present similar gene structures and motifs, with some motifs only being present in specific groups, such as motif 10, which is only present in group IV, and motif 9, which is only present in group V. Thus, the MsPLATZ genes of the same group have similar gene structures and motif compositions, while MsPLATZ genes from different groups may have specific structures, indicating that the conservation and diversity of MsPLATZ function have evolved during long-term evolution.

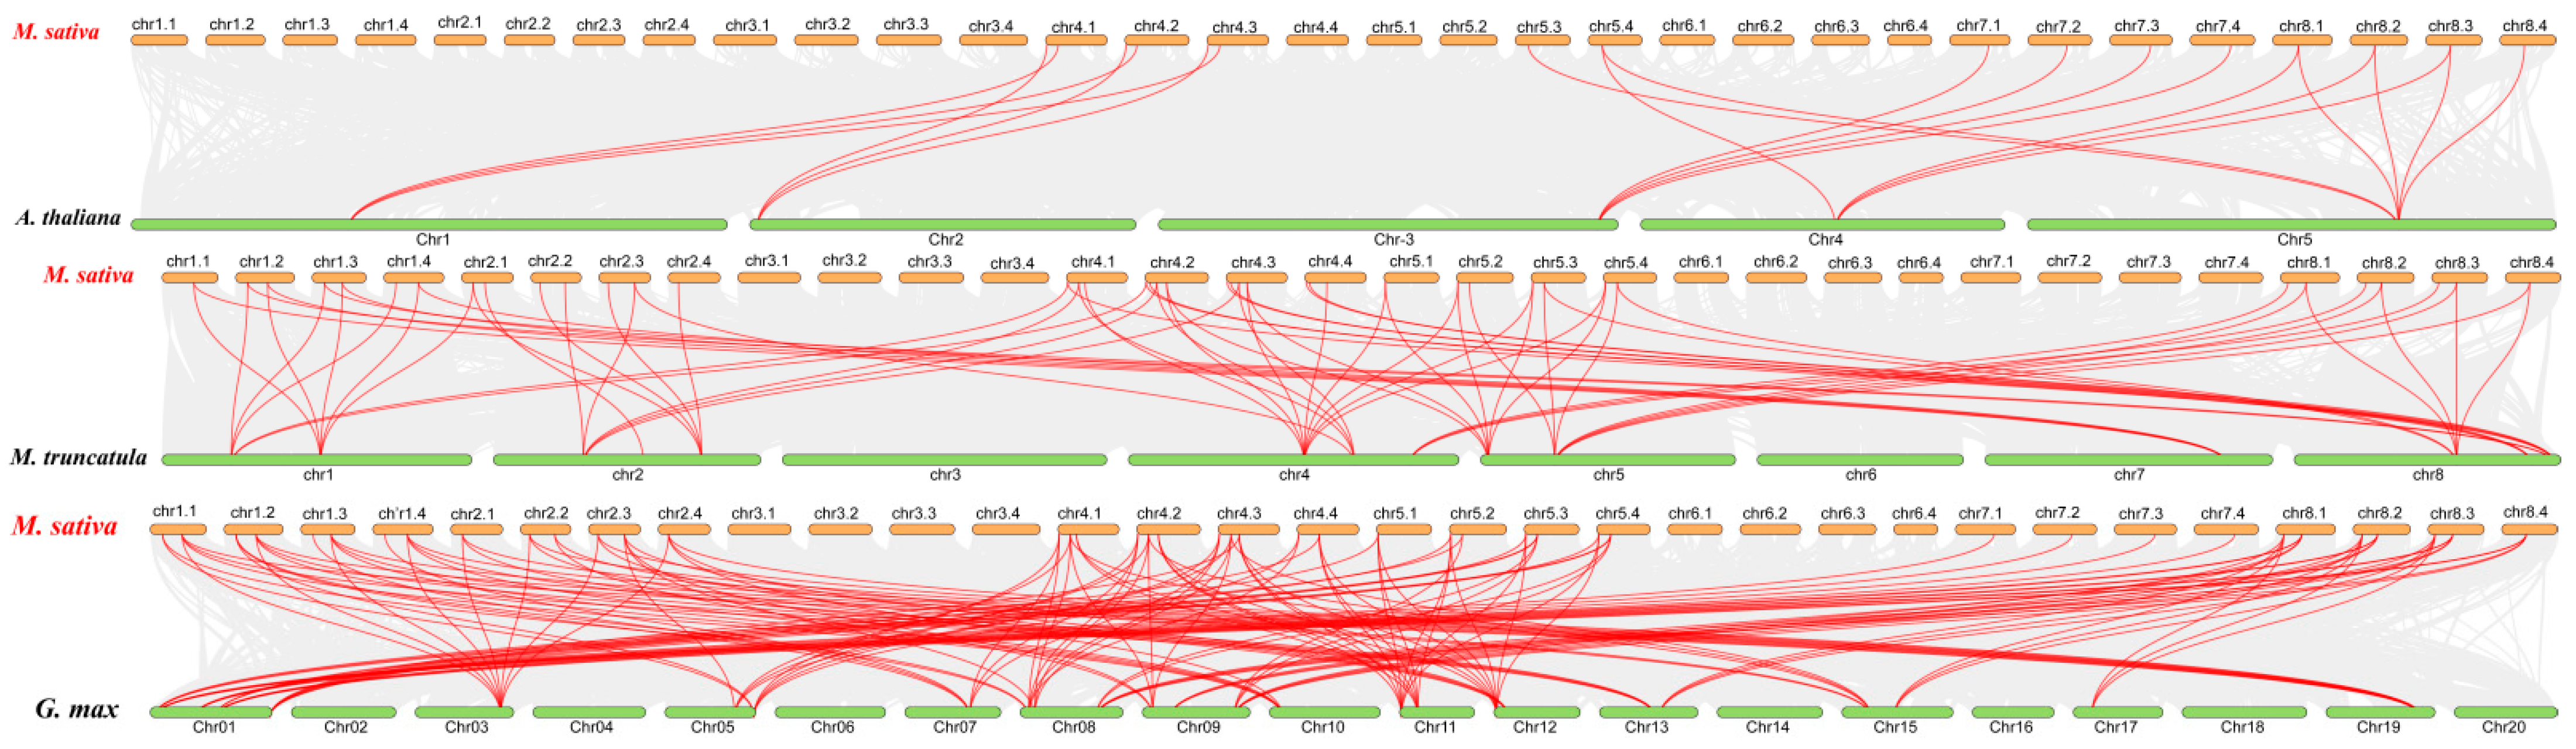
2.4. Gene Duplication Events and Synteny Analysis of MsPLATZ Genes

To further investigate possible gene duplication events among the MsPLATZ genes, we mapped the predicted MsPLATZs using the genome database of Medicago sativa (XinJiang DaYe) [23]. The results show possible tandem duplication events among genes such as MsPLATZ18/19/20 on chromosome chr2.4 (Figure 1). The analysis of segmental duplication events in the MsPLATZ family reveal a total of 94 pairs of fragment duplications, as found in MsPLATZ21 and MsPLATZ1, located on different chromosomes (Figure 4). These results suggest that duplication events have been widely involved in the evolution of MsPLATZs.
Furthermore, to further understand the possible evolutionary events of the PLATZ gene family in different crops, collinearity maps of Medicago sativa with Arabidopsis thaliana, Glycine max, and Medicago truncatula were constructed. The MsPLATZ genes differ from those of the other three species. A total of 16 of the 55 MsPLATZ genes show collinearity with Arabidopsis thaliana, 42 with Medicago truncatula, and 43 with Glycine max (Figure 5). Among these genes, there are 20 pairs in Arabidopsis thaliana, 64 in Medicago truncatula, and 134 in Glycine max (Figure 5). The collinearity identified between Medicago sativa, Medicago truncatula, and Glycine max is significantly higher than that between Medicago sativa and Arabidopsis thaliana, indicating that the distribution of PLATZ genes is relatively conserved among the three legume species.

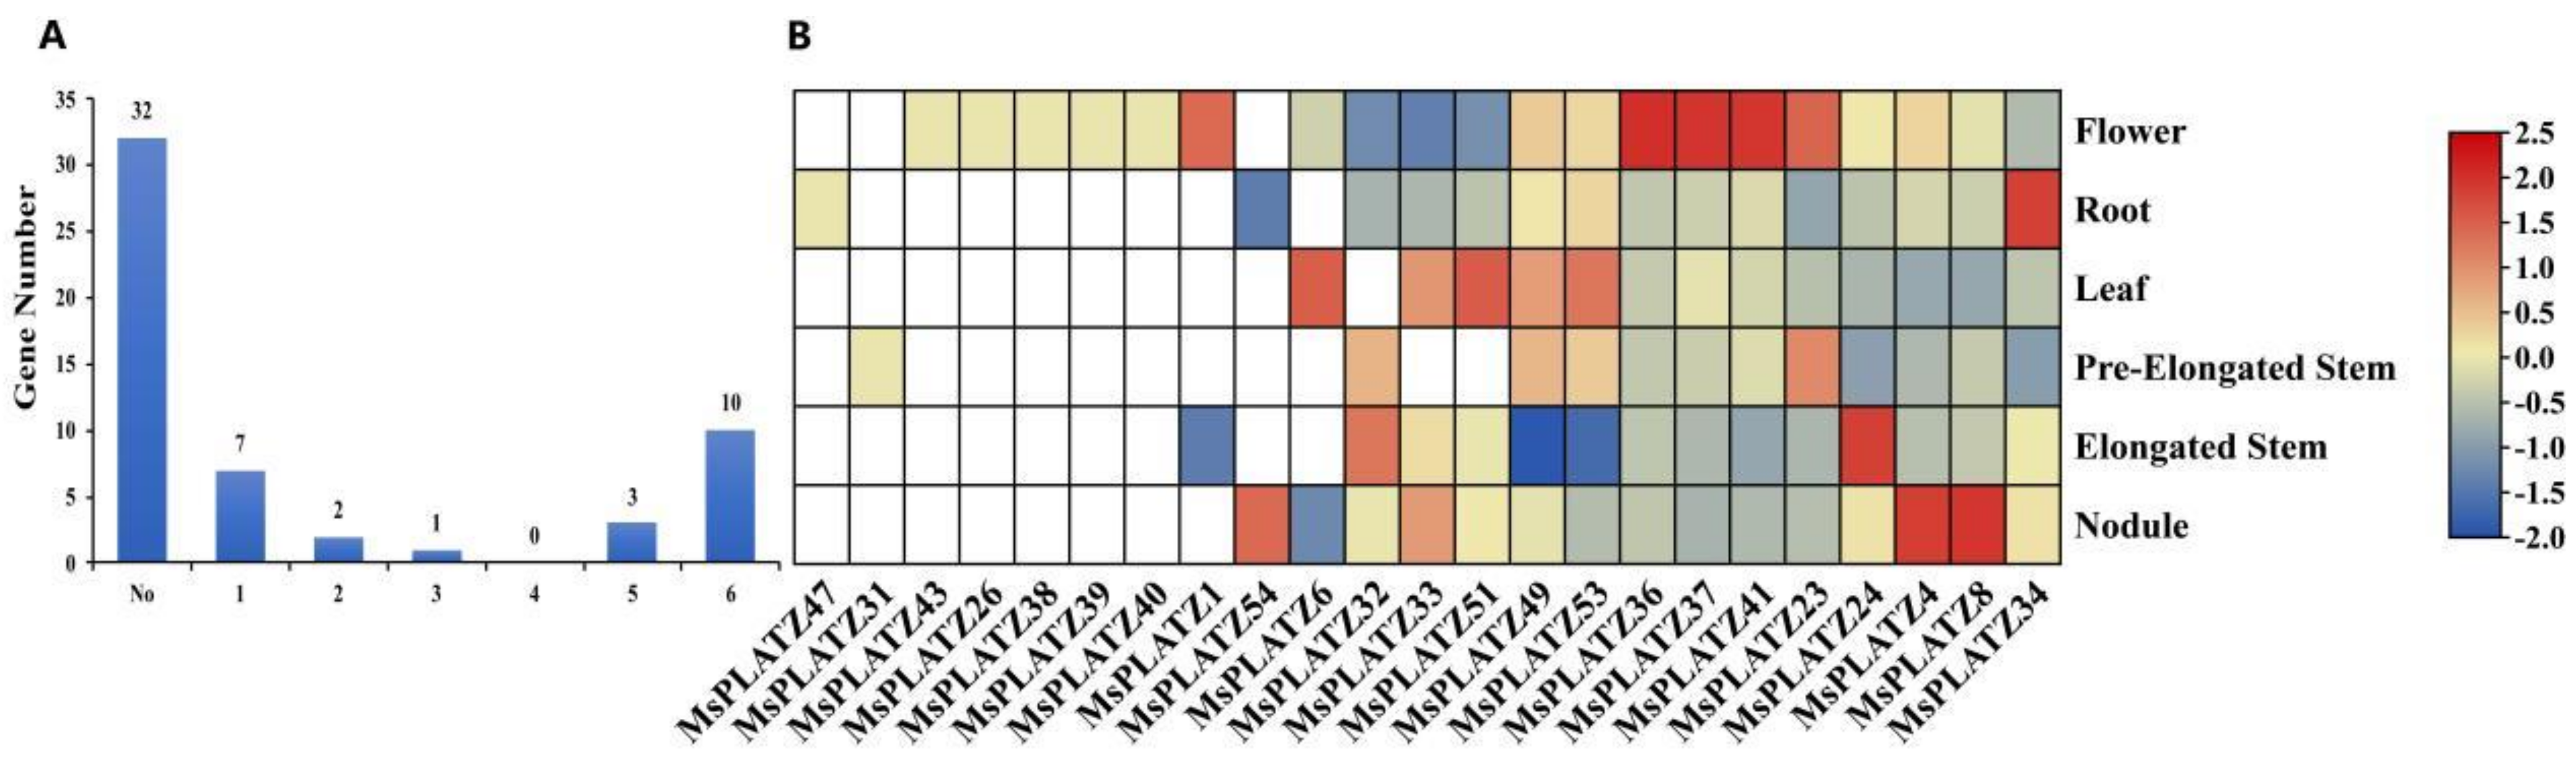
2.5. Expression Patterns of MsPLATZ Genes in Different Tissues of Medicago sativa

Genome-wide gene expression data for some tissues of alfalfa, such as roots, elongated stems, pre-elongated stems, leaves, flowers, and nodules, are publicly available. As shown in Figure 6A, only 23 of the 55 MsPLATZ genes are expressed in the six tissues studied, and other unexpressed genes may be expressed in other specific tissues or specifically expressed under certain biotic or abiotic stresses. The transcript abundance of the 23 expressed MsPLATZ genes also varies in the six tissues, indicating that the functions of each gene are also significantly different. A total of 7 out of 23 MsPLATZ genes are detected in only one tissue, indicating tissue expression specificity. The seven genes are MsPLATZ47, expressed in roots; MsPLATZ31, expressed in pre-elongated stems; and MsPLATZ26/43/38/39/40, expressed in flowers. The only gene expressed in three tissues is MsPLATZ6, which is expressed in flowers, leaves, and nodules. Two genes, MsPLATZ1 and MsPLATZ54, are expressed in two tissues: MsPLATZ1 is expressed in flowers and elongated stems, and MsPLATZ54 is expressed in nodules and roots. MsPLATZ32 is expressed in five of the tissues with the exception of leaves, and MsPLATZ33/51 is expressed five of the tissues with the exception of pre-elongated stems. Ten genes are expressed in six tissues, including MsPLATZ41/37/36, and although they are expressed in six tissues, their expression is significantly higher in flowers than in other tissues. These results indicate significant functional differences between MsPLATZ genes, and suggest that they play important roles in regulating the growth and development of M. sativa.

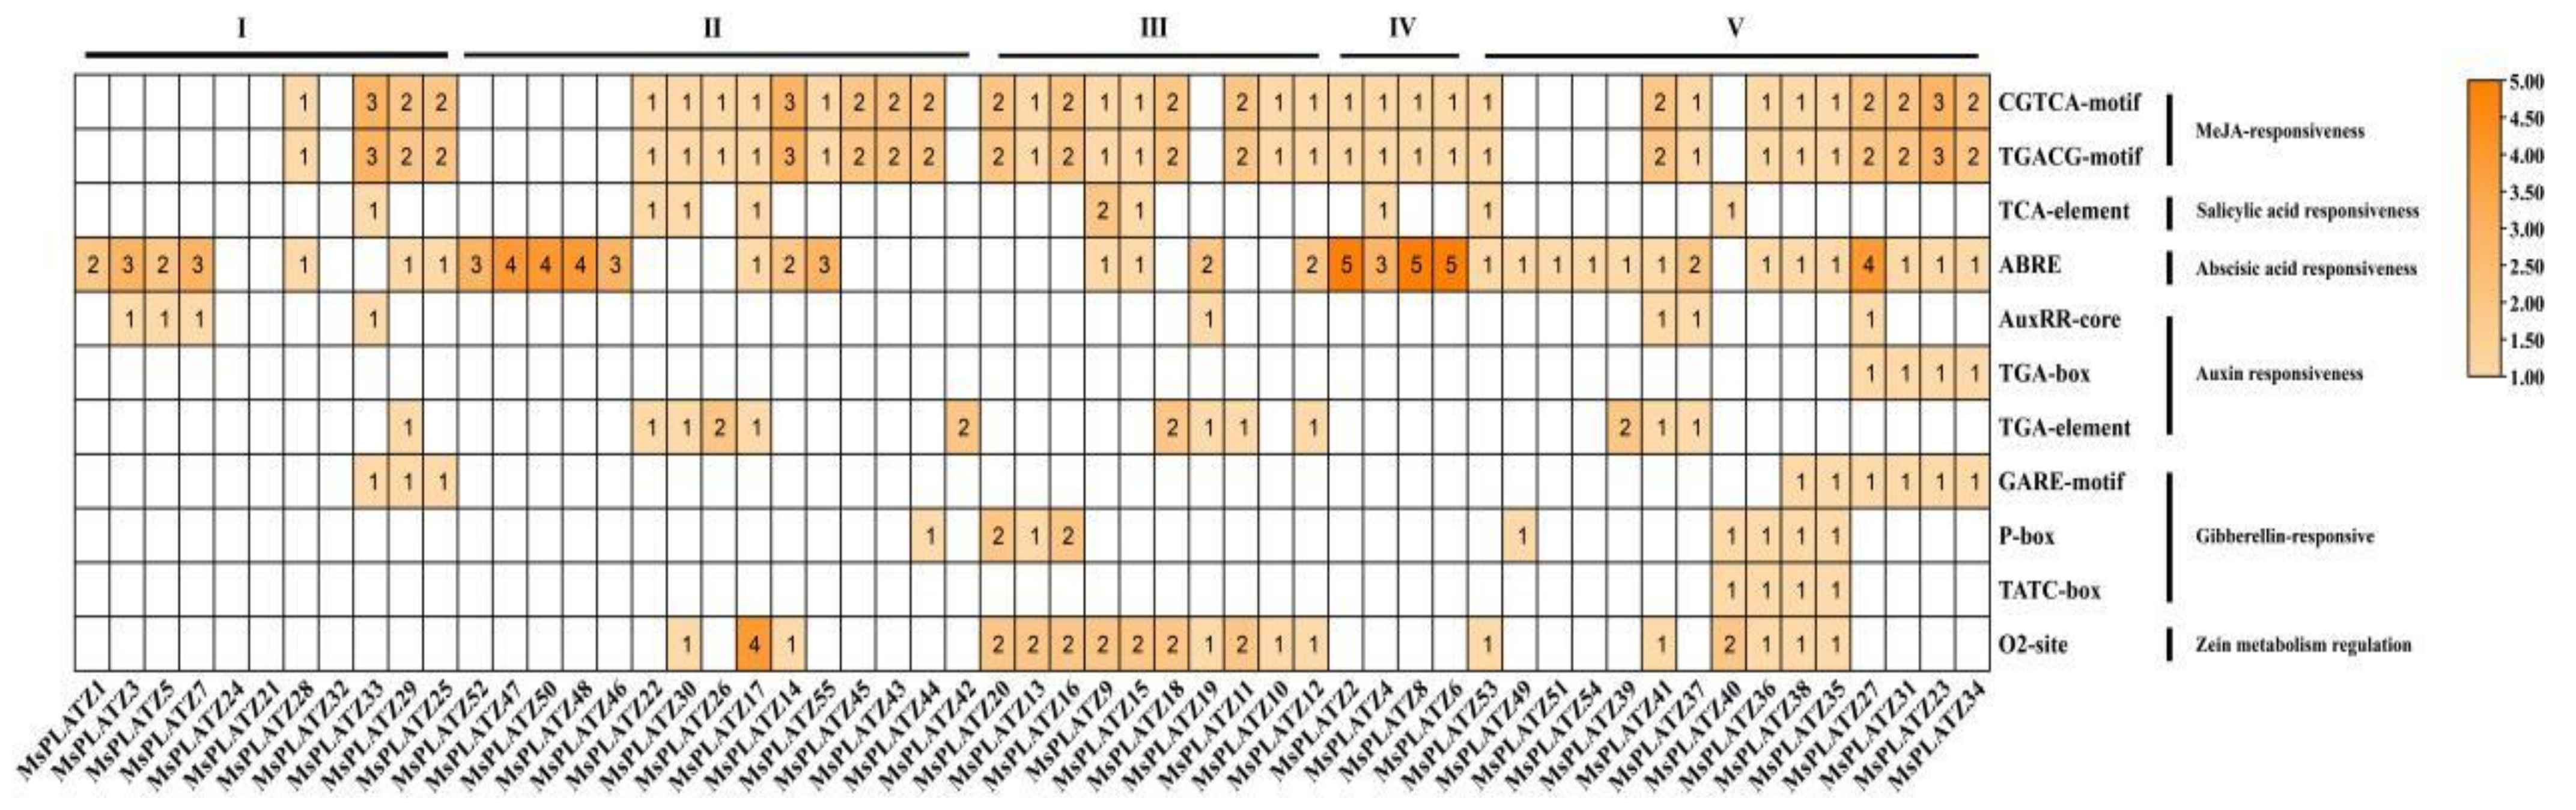
2.6. Analysis of Promoter Cis-Acting Elements of MsPLATZ Genes

To further explore the functional potential of the MsPLATZ genes, we analyzed the cis-acting elements withing the 2 kb upstream region of the MsPLATZ start codon (ATG) using the PlantCARE database (http://bioinformatics.psb.ugent.be/webtools/plantcare/html/, accessed on 16 August 2022). For example (Table S2), various cis-acting elements were identified. Photoreaction elements such as Box 4 and the GT1 motif are widely distributed in the promoter regions of MsPLATZ genes. In addition to photo-responsive elements, hormone response elements such as ABREs, cell-cycle-related elements such as circadian elements, stress-related elements such as MBSs, and growth and development elements such as CAT boxes are found. Notably, the number of hormone response elements varies greatly among the numerous MsPLATZ genes compared to the other elements. As shown in Figure 7, MsPLATZ42 contains only two auxin-related response elements. In addition to the two auxin-related response elements, MsPLATZ27 has four elements related to the abscisic acid response, four elements related to the methyl jasmonate response, and one element related to the gibberellin response. These results suggest that different MsPLATZ genes may function under different hormonal stimuli.

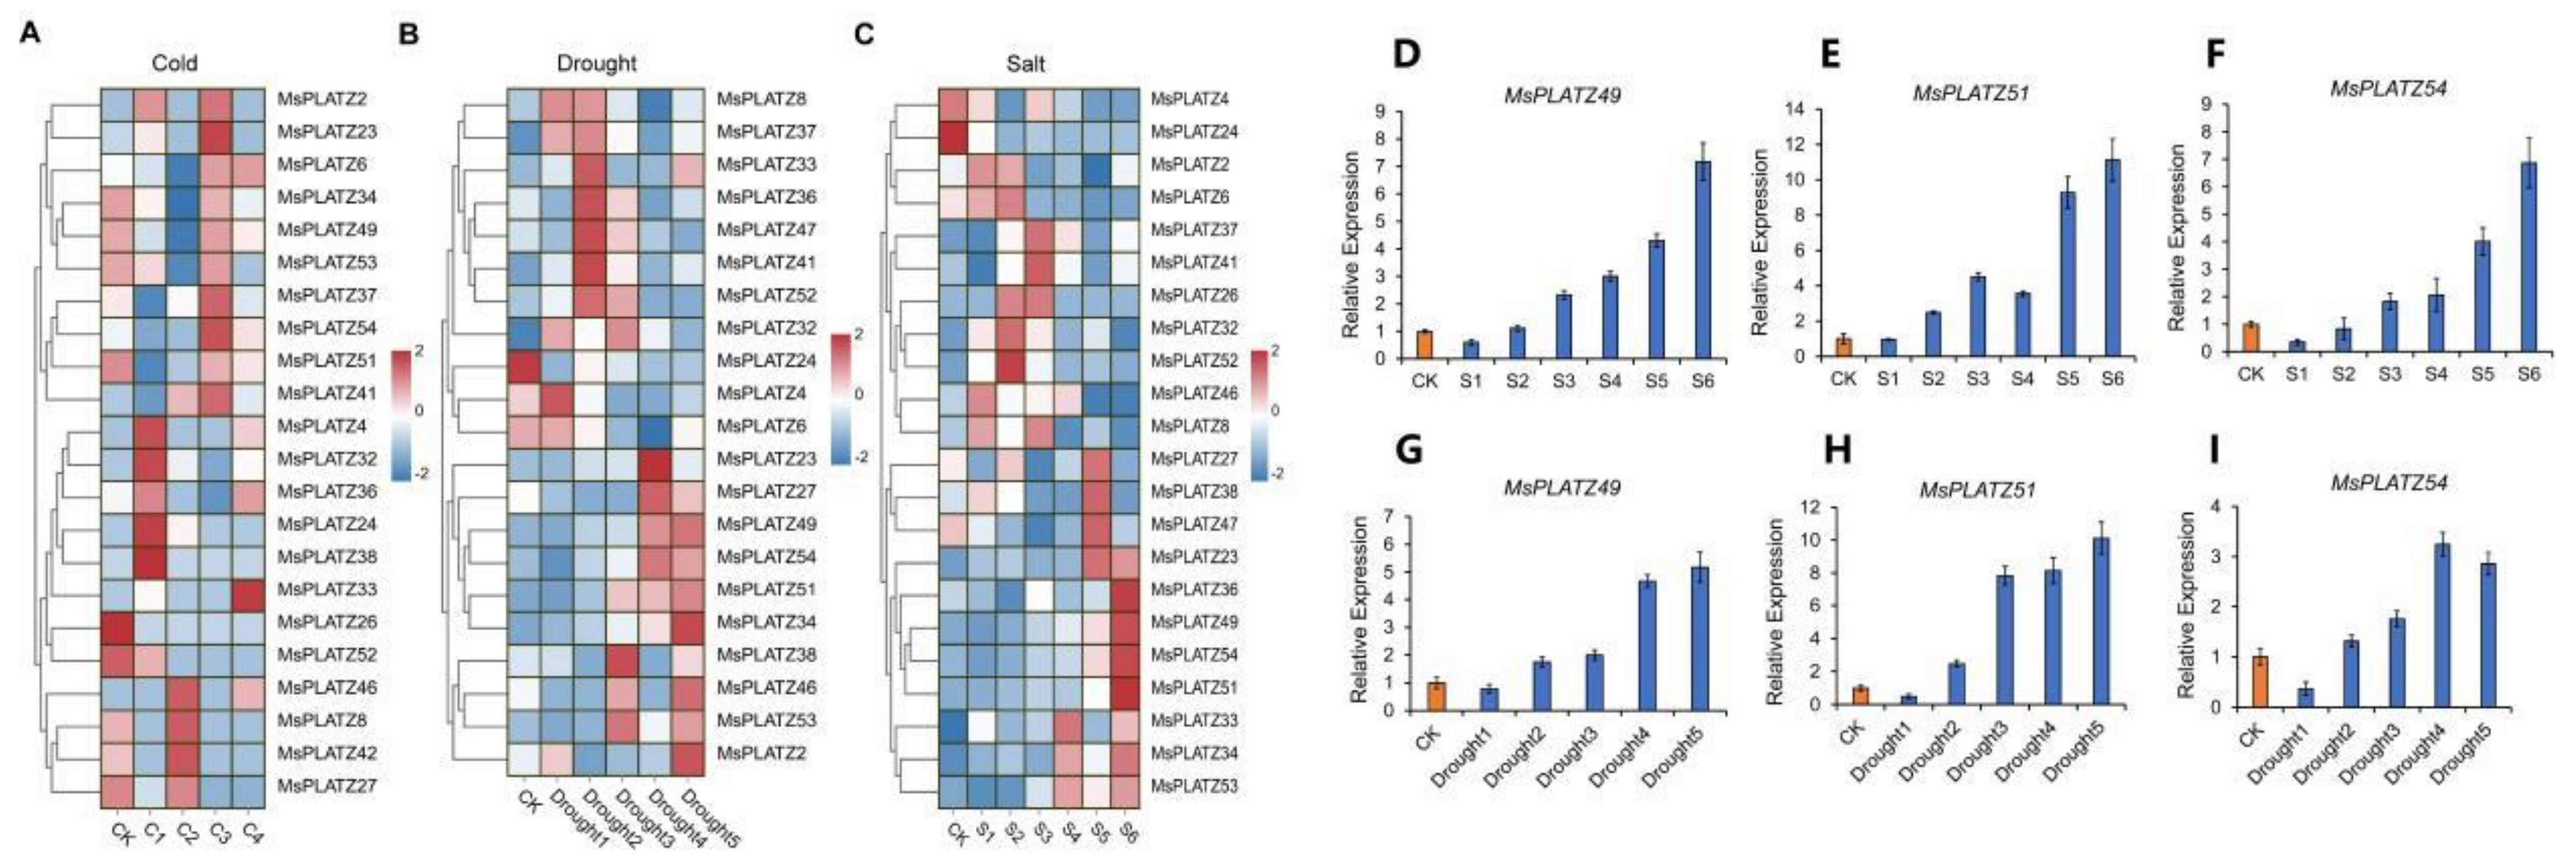
2.7. Differential Expression of MsPLATZ Genes under Different Abiotic Stress Treatments

To understand the responses of the 55 MsPLATZ genes involved in abiotic stress responses, we further analyzed the MsPLATZ genes that were differentially expressed under three abiotic stresses (salt, cold, and drought). As shown in Figure 8A–C, 20 of the 55 MsPLATZ genes show altered expression under the three abiotic stresses, while 3 genes show altered expression under two of the abiotic stresses, among which MsPLATZ47/37 expression is altered under salt and drought stress, and MsPLATZ26 expression is altered under cold and drought stress. Four genes (MsPLATZ48/9/42/1) are expressed only under one stress, among which, MsPLATZ48/9 are expressed only under salt stress treatment, MsPLATZ42 expression is altered only under cold stress, and MsPLATZ1 is expressed only under drought stress. The expression of MsPLATZ49/51/54 changes significantly under all three abiotic stress treatments, and the expression abundance of MsPLATZ49/51/54 also increases significantly with a longer treatment time under both salt and drought treatments. To verify these findings, we performed RT-PCR, the primers are listed in Table S3. The results show that MsPLATZ49/51/54 expression significantly increases with prolonged salt and drought stress treatment times (Figure 8D–I). This further indicates that the MsPLATZ49/51/54 genes may play an important role in stress resistance. Finally, it is concluded that the results obtained for the different genes under the different stress treatments differ significantly, which also indicates that the genes have different functions and specificities. All candidate genes selected in this study are listed in Table S4.

3. Discussion

PLATZ transcription factors are a class of plant-specific zinc-dependent DNA-binding proteins that have been shown by multiple studies to be widely involved in plant growth and development and to play an important role in the response to abiotic stresses [24]. The identification of PLATZ gene family members at the genome-wide level has been confirmed in many plants. For example, 12 PLATZ genes were identified in Arabidopsis thaliana [25], 15 PLATZ genes in Oryza sativa [25], 17 PLATZ genes in Zea mays [25], 14 PLATZ genes in Fagopyrum tataricum [26], 11 PLATZ genes in Ginkgo biloba [27], and 62 PLATZ genes in Triticum aestivum [28]. However, systematic analyses and in-depth studies at the genome-wide level are still lacking for Medicago sativa PLATZ gene families. In this study, we identified a total of 55 PLATZ genes in the alfalfa reference genome, all of which contain a conserved PLATZ domain. Sequence analysis, basic bioinformatics analysis, evolutionary analysis, and expression analysis were also performed. The results indicate that the MsPLATZ genes play an important role in the growth and development of M. sativa and may cause its resistance to abiotic stresses such as cold, drought, and salinity.
Phylogenetic tree analysis was used to help predict gene function. PLATZ transcription factors regulate root growth in Arabidopsis thaliana. For example, in Arabidopsis thaliana, RITF1 (PLATZ7), which acts as a receptor of the RGF1 small peptide, is involved in regulating ROS signaling and then in regulating the development of the root meristem [29]. In this study, we find that MsPLATZ52/47/50/48/46/22/30/26/17/14/55/45/43/44/42 cluster into the same group (group II) as AtRGFI (At2G12646, Figure 2). Among these MsPLATZ genes, only MsPLATZ47 is specifically expressed in alfalfa roots (Figure 5). Therefore, through the phylogenetic analysis and expression analysis of the MsPLATZ genes, we infer that MsPLATZ47 may also play an important role in alfalfa root development.
Plants can respond to and coordinate growth and stress resistance by regulating hormone production, distribution, and signaling to promote survival under abiotic and biotic stresses [30]. Zinc finger transcription factors are a relatively large family of plant transcription factors (approximately 15% of the total family) that are involved in regulating the expression of multiple genes in response to cold, salt, drought, osmotic stress, and oxidative stress [31,32]. AtPLATZ1 and AtPLATZ12 were identified as major genes positively regulating access to dehydration tolerance in Arabidopsis thaliana seeds and vegetative tissues [13]. Transgenic plants overexpressing AtPLATZ2 show higher sensitivity to salt stress, which inhibits CBL4/SOS3 promoter activity by directly binding to A/T-rich sequences in the CBL4/SOS3 and CBL10/SCaBP8 promoters in vitro and in vivo [24]. In this study, we find 22, 21, and 22 MsPLATZ genes responding to cold, drought, and salt stress, respectively (Figure 8A–C). Phylogenetic analysis shows that both AtPLATZ2 (AT1G76590) and 15 MsPLATZ members (MsPLATZ34/23/31/27/35/38/36/40/37/41/39/54/51/49/53) belong to group V (Figure 2). Under salt stress, the 11 MsPLATZ members are differentially expressed, among which the expression of MsPLATZ49/51/54 is significantly upregulated (Figure 8D–I). Therefore, these genes may be important candidates for the salt stress response in alfalfa.
Alfalfa is one of the most important feed crops in the world and is known as the “king of forage grass” [20]. It shows high adaptability, high yields, and a nutrient-rich composition and is considered a high-quality diet for herbivores [21]. As alfalfa is often subjected to abiotic stresses such as cold, drought, and salinity during growth, its quality and production decrease [33,34]. Therefore, it is important to identify good alfalfa stress resistance genes to guide alfalfa production. PLATZ transcription factors are zinc finger transcription factors, which constitute a relatively large family of plant transcription factors that are widely involved in plant growth and development and play an important role in the response to abiotic stresses [24]. The results of this study provide useful information for the MsPLATZ gene family, and the functions of MsPLATZs in response to various abiotic stresses need to be confirmed by more experiments in the future.

4. Materials and Methods

4.1. Identification of MsPLATZ Genes in the Medicago sativa Genome

The alfalfa genome comes from the Alfalfa Genome Project (https://fgshare.com/projects/whole_genome_sequencing_and_assembly_of_Medicago_sativa/66380, accessed on 5 August 2022). Arabidopsis thaliana protein sequences and Medicago truncatula genome were obtained from the Arabidopsis thaliana Information Resource (TAIR) (https://www.arabidopsis.org/, accessed on 9 August 2022), and (http://www.medicagogenome.org/, accessed on 9 August 2022). The largest number of PLATZ genes was screened from the alfalfa genome by BLASTp methods, and the hidden MarKov model (HMM) profiles corresponding to the PLATZ domain (PF04640) were downloaded from the Pfam protein family database (https://pfam.xfam.org/, accessed on 13 August 2022). In total, 55 MsPLATZ genes were identified in the alfalfa genome using BLAST with a cutoff E-value > 1e−10. All putative MsPLATZ genes integrating the results of the HMM retrieval and BLASTP operations were submitted to the NCBI Conserved Domain Database (CDD, https://www.ncbi.nlm.nih.gov/cdd, accessed on 19 August 2022), SMART (http://smart.embl-heidelberg.de/, accessed on 19 August 2022), and Pfam to examine the existence of the conserved PLATZ domain. The ExPASy website (https://web.expasy.org/compute_pi/, accessed on 8 September 2022) was used to analyze the MsPLATZ gene sequences to obtain the theoretical isoelectric points (pIs) and molecular weights (MWs).

4.2. Phylogenetic Analysis and Intron–Exon Structure Determination

The PLATZ protein sequences used to generate the phylogenetic tree were obtained from the UniProt database (https://www.UniProt.org, accessed on 20 August 2022). The PLATZ protein sequences from Medicago sativa and Arabidopsis thaliana were also aligned using the Clustalx2.0 program before the phylogenetic tree was constructed. Phylogenetic trees comparing MsPLATZs and AtPLATZs were constructed with the NJ method, and the specific parameters were the Poisson model and 1000 bootstrap replications in MEGA software (v11.0, Tamura, K., Tokyo, Japan). The classification of MsPLATZs based on the phylogenetic tree was performed according to the method described by Wang et al. [25]. The determination of the conserved motifs in the MsPLATZ proteins was conducted by the MEME online program (http:/meme.nbcr.net/meme/intro.html, accessed on 11 August 2022), and the parameters were set to the optimum mode width of 6 to 200 and the maximum number of motifs of 10.

4.3. Gene Duplication, Synteny Analysis and Cis-Element Analysis

MCScanX software [35,36] (Hu, Y., Herndon, USA) was used to analyze the MsPLATZ replication events and detect collinear regions between MsPLATZ and collinear blocks of MsPLATZ genes with Arabidopsis thaliana, Medicago truncatula, and Glycine max. All function and chromosomal location information was obtained by TBtools software [37] (v1.108, Chen, C., GZ, China). The upstream 2 kb sequence was extracted as the promoter region for the prediction of cis-acting elements. The homeopathy components of the promoter sequence were predicted by the online tool PlantCARE [38], and the predicted results were drawn by GSDS online software (v2.0, Hu, B., BJ, China).

4.4. Plant Materials and Treatments

The alfalfa seeds (Cultivar Zhongmu No. 1) were preserved in our laboratory at the Institute of Animal Science of the Chinese Academy of Agricultural Sciences. The seedlings were placed in a greenhouse at 24 °C (day)/20 °C (night) with a 16 h light/8 h dark photoperiod in the hydroponic culture medium for two weeks. For cold stress, drought stress and salt stress, refer to He et al. [30]. Three replicates with five single seedlings young leaves in each replicate were collected for each condition. The samples were stored at −80 °C for further RT-PCR experiments.

4.5. Transcriptome Data Collection and Analysis

Transcriptomic data from six Medicago sativa tissues (flower, leaf, elongated stem, pre-elongated stem, nodule, and root) were collected from the NCBI database (SRP055547) [39]. Transcriptomic data for MsPLATZ genes exposed to cold, drought, and salt treatments were collected from the NCBI database (SRR7091780–SRR7091794 and SRR7160313– SRR7160357) [40]. TopHat2 was used to map the obtained clean reads to the reference genome (Xinjiangdaye) [41]. In addition, we applied fragments per kilobase of transcript per million fragments mapped (FPKM) to calculate the gene expression level according to the number of reads mapped to the reference sequence. TBtools software (v1.108, Chen, C., GZ, China) was used for data visualization [37].

4.6. Expression Analyses of MsPLATZ Genes by qRT-PCR

Total RNA was extracted from all samples in this study by using TRIzol reagent according to the manufacturer’s instructions. Then, the corresponding cDNA was obtained by using the EasyScript First-Strand cDNA Synthesis kit. The RT-PCR primers for these MsPLATZ genes were designed by using Primer 5.0 software. The RT-PCR experiments were conducted by using SYBR Premix Ex Taq (Takara, Maebashi, Japan) on a 7500 Real-Time PCR system (Applied Biosystems, Foster City, CA, USA). Three replicates were designed for each sample, and alfalfa actin gene expression was used for data normalization. The data were quantified by the 2−ΔΔCT method [42].

5. Conclusions

In this study, the PLATZ gene family members of Medicago sativa were systematically identified and characterized. A total of 55 MsPLATZ proteins were identified that were unevenly distributed on 24 out of the 32 chromosomes in Medicago sativa, and one was not spliced to the chromosomes. Based on the phylogenetic analysis, the MsPLATZ proteins were divided into five groups, each with similar gene structure and motif compositions. In addition, in regard to gene duplications, gene segment duplication rather than gene tandem duplication is the main driving force of MsPLATZ gene evolution. We analyzed the expression levels of 55 MsPLATZ genes in different tissues of Medicago sativa and their responses to three abiotic stresses (salt, cold, and drought). Expression analysis shows that 7 MsPLATZ genes have tissue-specific expression, and 10 MsPLATZ genes are expressed in all tissues. The transcriptomic profiles of these genes vary greatly, indicating that these MsPLATZ genes have different functions in the growth and development of alfalfa. Through transcriptome data analysis and real-time quantitative PCR (RT-qPCR), we identify 22, 21, and 22 MsPLATZ genes that are responsive to cold, drought, and salt stress, respectively. Moreover, the expression of MsPLATZ49/51/54 under salt and drought stress is significant, indicating that MsPLATZ49/51/54 may be related to the regulation of salt and drought stress. The results of this study lay a foundation for the further exploration of the MsPLATZ function and provide ideas for the improvement of alfalfa varieties and the innovation of germplasm resources.

Supplementary Materials

The following supporting information can be downloaded at: https://www.mdpi.com/article/10.3390/ijms24032388/s1.

Author Contributions

X.L. planned and designed the study and wrote the manuscript; F.H., G.Z. and M.L. prepared the figures and tables; R.L. validated the data; J.K. and Q.Y. validated the data and reviewed and edited the manuscript; L.C. curated the software and data and reviewed the manuscript. All authors have read and agreed to the published version of the manuscript.

Funding

This work was supported by the Central Public-interest Scientific Institution Basal Research Fund (No. 2022-YWF-ZYSQ-04), the Agricultural Science and Technology Innovation Program (ASTIP No. CAAS-ZDRW202201), the Ordos Science and Technology Plan (2022EEDSKJZDZX011), and the Innovation Program of CAAS (ASTIP-IAS14).

Institutional Review Board Statement

Not applicable.

Informed Consent Statement

Not applicable.

Data Availability Statement

Not applicable.

Conflicts of Interest

The authors declare no conflict of interest.

References

  1. Honma, T.; Goto, K. Complexes of MADS-box proteins are sufficient to convert leaves into floral organs. Nature 2001, 409, 525–529. [Google Scholar] [CrossRef] [PubMed]
  2. Singh, K.B.; Foley, R.C.; Oñate-Sánchez, L. Transcription factors in plant defense and stress responses. Curr. Opin. Plant Biol. 2002, 5, 430–436. [Google Scholar] [CrossRef] [PubMed]
  3. Riechmann, J.L.; Meyerowitz, E.M. The AP2/EREBP family of plant transcription factors. Biol. Chem. 1998, 379, 633–646. [Google Scholar]
  4. Martin, C.; Paz-Ares, J. MYB transcription factors in plants. Trends Genet. 1997, 13, 67–73. [Google Scholar] [CrossRef] [PubMed]
  5. Bakshi, M.; Oelmuller, R. WRKY transcription factors: Jack of many trades in plants. Plant Signal. Behav. 2014, 9, e27700. [Google Scholar] [CrossRef] [Green Version]
  6. Takatsuji, H. Zinc-finger transcription factors in plants. Cell Mol. Life Sci. 1998, 54, 582–596. [Google Scholar] [CrossRef]
  7. Nantel, A.; Quatrano, R.S. Characterization of three rice basic/leucine zipper factors, including two inhibitors of Em BP-1 DNA binding activity. J. Biol. Chem. 1996, 271, 31296–31305. [Google Scholar] [CrossRef] [Green Version]
  8. Nagano, Y.; Furuhashi, H.; Inaba, T.; Sasaki, Y. A novel class of plant-specific zinc-dependent DNA-binding protein that binds to A/T-rich DNA sequences. Nucleic Acids Res. 2001, 29, 4097–4105. [Google Scholar] [CrossRef] [Green Version]
  9. Wang, A.; Hou, Q.; Si, L.; Huang, X.; Luo, J.; Lu, D.; Zhu, J.; Shangguan, Y.; Miao, J.; Xie, Y.; et al. The PLATZ transcription factor GL6 affects grain length and number in rice. Plant Physiol. 2019, 180, 2077–2090. [Google Scholar] [CrossRef] [Green Version]
  10. Zhou, S.R.; Xue, H.W. The rice PLATZ protein SHORT GRAIN6 determines grain size by regulating spikelet hull cell division. J. Integr. Plant Biol. 2020, 62, 847–864. [Google Scholar] [CrossRef]
  11. Li, Q.; Wang, J.; Ye, J.; Zheng, X.; Xiang, X.; Li, C.; Fu, M.; Wang, Q.; Zhang, Z.; Wu, Y. The Maize imprinted gene Floury3 encodes a PLATZ protein required for t RNA and 5S rRNA transcription through interaction with RNA polymerase III. Plant Cell 2017, 29, 2661–2675. [Google Scholar] [CrossRef] [Green Version]
  12. Kim, J.H.; Kim, J.; Jun, S.E.; Park, S.; Timilsina, R.; Kwon, D.S.; Kim, Y.; Park, S.J.; Hwang, J.Y.; Nam, H.G.; et al. ORESARA15, a PLATZ transcription factor, mediates leaf growth and senescence in Arabidopsis. New Phytol. 2018, 220, 609–623. [Google Scholar] [CrossRef] [Green Version]
  13. Hande, A.S.; Katageri, I.S.; Jadhav, M.P.; Adiger, S.; Gamanagatti, S.; Padmalatha, K.V.; Dhandapani, G.; Kanakachari, M.; Kumar, P.A.; Reddy, V.S. Transcript profiling of genes expressed during fibre development in diploid cotton (Gossypium arboreum L.). BMC Genom. 2017, 18, 675. [Google Scholar]
  14. Chao, Q.; Gao, Z.F.; Zhang, D.; Zhao, B.G.; Dong, F.Q.; Fu, C.X.; Liu, L.J.; Wang, B.C. The developmental dynamics of the Populus stem transcriptome. Plant Biotechnol. J. 2019, 17, 206–219. [Google Scholar] [CrossRef] [Green Version]
  15. Kasirajan, L.; Hoang, N.V.; Furtado, A.; Botha, F.C.; Henry, R.J. Transcriptome analysis highlights key differentially expressed genes involved in cellulose and lignin biosynthesis of sugarcane genotypes varying in fiber content. Sci. Rep. 2018, 8, 11612. [Google Scholar] [CrossRef] [Green Version]
  16. González-Morales, S.I.; Chávez-Montes, R.A.; Hayano-Kanashiro, C.; Alejo-Jacuinde, G.; Rico-Cambron, T.Y.; de Folter, S.; Herrera-Estrella, L. Regulatory network analysis reveals novel regulators of seed desiccation tolerance in Arabidopsis thaliana. Proc. Natl. Acad. Sci. USA 2016, 113, E5232–E5241. [Google Scholar] [CrossRef] [Green Version]
  17. Zenda, T.; Liu, S.; Wang, X.; Liu, G.; Jin, H.; Dong, A.; Yang, Y.; Duan, H. Key maize drought-responsive genes and pathways revealed by comparative transcriptome and physiological analyses of contrasting inbred lines. Int. J. Mol. Sci. 2019, 20, 1268. [Google Scholar] [CrossRef] [Green Version]
  18. Zhang, S.; Yang, R.; Huo, Y.; Liu, S.; Yang, G.; Huang, J.; Zheng, C.; Wu, C. Expression of cotton PLATZ1 in transgenic Arabidopsis reduces sensitivity to osmotic and salt stress for germination and seedling establishment associated with modification of the abscisic acid, gibberellin, and ethylene signalling pathways. BMC Plant Biol. 2018, 18, 218. [Google Scholar] [CrossRef] [Green Version]
  19. Yari, M.; Valizadeh, R.; Naserian, A.A.; Ghorbani, G.R.; Moghaddam, P.R.; Jonker, A.; Yu, P. Botanical traits, protein and carbohydrate fractions, ruminal degradability and energy contents of alfalfa hay harvested at three stages of maturity and in the afternoon and morning. Anim. Feed. Sci. Technol. 2012, 172, 162–170. [Google Scholar] [CrossRef]
  20. Radović, J.; Sokolović, D.; Marković, J. Alfalfa-most important perennial forage legume in animal husbandry. Biotechnol. Anim. Husb. 2009, 25, 465–475. [Google Scholar] [CrossRef]
  21. Chen, L.; He, F.; Long, R.; Zhang, F.; Li, M.; Wang, Z.; Kang, J.; Yang, Q. A global alfalfa diversity panel reveals genomic selection signatures in Chinese varieties and genomic associations with root development. Integr. Plant Biol. 2021, 63, 1937–1951. [Google Scholar] [CrossRef]
  22. Jafari, M.; Yari, M.; Ghabooli, M.; Sepehri, M.; Ghasemi, E.; Jonker, A. Inoculation and co-inoculation of alfalfa seedlings with root growth promoting microorganisms (Piriformospora indica, Glomus intraradices and Sinorhizobium meliloti) affect molecular structures, nutrient profiles and availability of hay for ruminants. Anim. Nutr. 2018, 4, 90–99. [Google Scholar] [CrossRef]
  23. Chen, H.; Zeng, Y.; Yang, Y.; Huang, L.; Tang, B.; Zhang, H.; Hao, F.; Liu, W.; Li, Y.; Liu, Y.; et al. Allele-aware chromosome-level genome assembly and efcient transgene-free genome editing for the autotetraploid cultivated alfalfa. Nat Commun. 2020, 11, 2494. [Google Scholar] [CrossRef] [PubMed]
  24. Liu, S.; Yang, R.; Liu, M.; Zhang, S.; Yan, K.; Yang, G.; Huang, J.; Zheng, C.; Wu, C. PLATZ2 negatively regulates salt tolerance in Arabidopsis seedlings by directly suppressing the expression of the CBL4/SOS3 and CBL10/SCaBP8 genes. J. Exp. Bot. 2020, 71, 5589–5602. [Google Scholar] [CrossRef]
  25. Wang, J.; Ji, C.; Li, Q.; Zhou, Y.; Wu, Y. Genome-wide analysis of the plantspecifc PLATZ proteins in maize and identifcation of their general role in interaction with RNA polymerase III complex. BMC Plant Biol. 2018, 18, 221. [Google Scholar] [CrossRef]
  26. Li, J.; Feng, S.; Zhang, Y.; Xu, L.; Luo, Y.; Yuan, Y.; Yang, Q.; Feng, B. Genome-wide identification and expression analysis of the plant-specific PLATZ gene family in Tartary buckwheat (Fagopyrum tataricum). BMC Plant Biol. 2022, 22, 160. [Google Scholar]
  27. Han, X.; Rong, H.; Tian, Y.; Qu, Y.; Xu, M.; Xu, L.A. Genome-Wide Identification of PLATZ Transcription Factors in Ginkgo biloba L. and Their Expression Characteristics During Seed Development. Front. Plant Sci. 2022, 13, 946194. [Google Scholar] [CrossRef] [PubMed]
  28. Fu, Y.; Cheng, M.; Li, M.; Guo, X.; Wu, Y.; Wang, J. Identification and Characterization of PLATZ Transcription Factors in Wheat. Int. J. Mol. Sci. 2020, 21, 8934. [Google Scholar] [CrossRef]
  29. Yamada, M.; Han, X.; Benfey, P.N. RGF1 controls root meristem size through ROS signalling. Nature 2020, 577, 85–88. [Google Scholar] [CrossRef]
  30. He, F.; Zhang, L.; Zhao, G.; Kang, J.; Long, R.; Li, M.; Yang, Q.; Chen, L. Genome-Wide Identification and Expression Analysis of the NAC Gene Family in Alfalfa Revealed Its Potential Roles in Response to Multiple Abiotic Stresses. Int. J. Mol. Sci. 2022, 23, 10015. [Google Scholar] [CrossRef]
  31. Riechmann, J.L.; Heard, J.; Martin, G.; Reuber, L.; Jiang, C.; Keddie, J.; Adam, L.; Pineda, O.; Ratcliffe, O.J.; Samaha, R.R.; et al. Arabidopsis transcription factors: Genome-wide comparative analysis among eukaryotes. Science 2000, 290, 2105–2110. [Google Scholar] [CrossRef]
  32. Kiełbowicz-Matuk, A. Involvement of plant C2H2 -type zinc fifinger transcription factors in stress responses. Plant Sci. Int. J. Exp. Plant Biol. 2012, 185–186, 78–85. [Google Scholar]
  33. He, F.; Wei, C.; Zhang, Y.; Long, R.; Li, M.; Wang, Z.; Yang, Q.; Kang, J.; Chen, L. Genome-wide association analysis coupled with transcriptome analysis reveals candidate genes related to salt stress in alfalfa (Medicago sativa L). Front. Plant Sci. 2022, 12, 3407. [Google Scholar] [CrossRef]
  34. He, F.; Long, R.; Wei, C.; Zhang, Y.; Li, M.; Kang, J.; Yang, Q.; Wang, Z.; Chen, L. Genome-wide identification, phylogeny and expression analysis of the SPL gene family and its important role in salt stress in Medicago sativa L. BMC Plant Biol. 2022, 22, 295. [Google Scholar] [CrossRef]
  35. Wang, Y.; Tang, H.; Debarry, J.D.; Tan, X.; Li, J.; Wang, X.; Lee, T.H.; Jin, H.; Marler, B.; Guo, H.; et al. MCScanX: A toolkit for detection and evolutionary analysis of gene synteny and collinearity. Nucleic Acids Res. 2012, 40, e49. [Google Scholar] [CrossRef] [Green Version]
  36. Xu, G.; Guo, C.; Shan, H.; Kong, H. Divergence of duplicate genes in exonintron structure. Proc. Natl. Acad. Sci. USA 2012, 109, 1187–1192. [Google Scholar] [CrossRef] [Green Version]
  37. Chen, C.; Chen, H.; Zhang, Y.; Thomas, H.R.; Frank, M.H.; He, Y.; Xia, R. TBtools: An integrative toolkit developed for interactive analyses of big biological data. Mol. Plant 2020, 13, 1194–1202. [Google Scholar] [CrossRef]
  38. Lescot, M.; Déhais, P.; Thijs, G.; Marchal, K.; Moreau, Y.; Van de Peer, Y.; Rouzé, P.; Rombauts, S. PlantCARE, a database of plant cis-acting regulatory elements and a portal to tools for in silico analysis of promoter sequences. Nucleic Acids Res. 2002, 30, 325–327. [Google Scholar] [CrossRef] [PubMed]
  39. O‘Rourke, J.A.; Fu, F.; Bucciarelli, B.; Yang, S.S.; Samac, D.A.; Lamb, J.F.; Monteros, M.J.; Graham, M.A.; Gronwald, J.W.; Krom, N.; et al. The Medicago sativa gene index 1.2: A web-accessible gene expression atlas for investigating expression differences between Medicago sativa subspecies. BMC Genom. 2015, 16, 502. [Google Scholar] [CrossRef] [PubMed] [Green Version]
  40. Dong, X.; Deng, H.; Ma, W.; Zhou, Q.; Liu, Z. Genome-wide identification of the MADS-box transcription factor family in autotetraploid cultivated alfalfa (Medicago sativa L.) and expression analysis under abiotic stress. BMC Genom. 2021, 22, 603. [Google Scholar] [CrossRef] [PubMed]
  41. Kim, D.; Pertea, G.; Trapnell, C.; Pimentel, H.; Kelley, R.; Salzberg, S.L. TopHat2: Accurate alignment of transcriptomes in the presence of insertions, deletions and gene fusions. Genome Biol. 2013, 14, R36. [Google Scholar] [CrossRef] [Green Version]
  42. Kenneth, J.L.; Thomas, D.S. Analysis of relative gene expression data using real-time quantitative PCR and the 2−ΔΔCT method. Methods 2001, 25, 402–408. [Google Scholar]
Figure 1. Schematic diagram of the chromosomal distribution of MsPLATZ genes in Medicago sativa. The vertical bars represent the chromosomes of Medicago sativa, and a scale for chromosome length is shown on the left.
Ijms 24 02388 g001
Figure 2. Phylogenetic tree of the PLATZ genes in Medicago sativa and Arabidopsis thaliana. I–V: PLATZ genes were divided into five groups and were represented using different colors; Neighbor-joining (NJ) was used to generate the unrooted phylogenetic tree with the maximum likelihood method (1000 bootstrap replicates).
Ijms 24 02388 g002
Figure 3. Phylogenetic relationships, gene structures, and motif compositions of MsPLATZ genes of Medicago sativa. (A) The phylogenetic tree of PLATZ genes of Medicago sativa was constructed using the maximum likelihood method. I–V: MsPLATZ genes were divided into five groups. (B) Exon–intron structure of MsPLATZ genes. The legend is shown in the upper-right corner, and the introns are represented by black lines. (C) Motif composition of MsPLATZ genes. Different motifs are represented by different colors, as indicated in the legend on the right.
Ijms 24 02388 g003
Figure 4. Schematic diagram of the syntenic relationships of MsPLATZ genes in Medicago sativa. The gray ribbons represent syntenic blocks in the alfalfa genome, and the segmental duplication events are marked in red.
Ijms 24 02388 g004
Figure 5. Synteny analysis of PLATZ genes between Medicago sativa and three representative plant species. Gray lines in the background indicate collinear blocks within Medicago sativa and the indicated plant species, whereas the red lines highlight syntenic PLATZ gene pairs.
Ijms 24 02388 g005
Figure 6. Expression analysis of MsPLATZ genes in different tissues (flower, leaf, elongated stem, pre−elongated stem, nodule, and root). (A) Statistical analysis of the numbers of MsPLATZ genes expressed in different tissues. (B) Expression of 23 MsPLATZ genes in different tissues. The expression levels were normalized by row using the Z−scores algorithm. The color scale on the right side of the heatmap indicates the relative expression levels, and the color gradient from blue to red indicates an increase in expression levels.
Ijms 24 02388 g006
Figure 7. Distribution of the cis-acting elements related to hormone responses in the promoter regions of MsPLATZ genes. I–V: MsPLATZ genes were divided into five groups.
Ijms 24 02388 g007
Figure 8. Expression of MsPLATZ genes under different abiotic stress treatments (salt, cold, drought). (A) Expression of MsPLATZ genes under cold stress treatments. (B) Expression of MsPLATZ genes under drought stress treatments. (C) Expression of MsPLATZ genes under salt stress treatments. The expression levels were normalized by row using the Z−scores algorithm. The color scale at the right of the heatmap refers to the relative expression level, and the color gradient from blue to red presents an increasing expression level. (DF). RT-PCR expression of MsPLATZ49/51/54 under salt stress. (GI). RT-PCR expression of MsPLATZ49/51/54 under drought stress. CK was set to orange, and the treatment groups were set to blue. CK was arbitrarily set to 1. Error bars represent the standard deviations of three technical replicates.
Ijms 24 02388 g008
Table 1. PLATZ family genes in Medicago sativa.
Gene NameGene IDChr LocationCDS Length (bp)Protein Length (aa)Mw (kDa)pISubcellular Location
MsPLATZ1MS.gene026494Ms1.1: 17,863,747–17,863,902156525.839.64Nucleus
MsPLATZ2MS.gene051384Ms1.1: 46,909,227–46,910,46160920322.928.83Nucleus
MsPLATZ3MS.gene040928Ms1.2: 17,427,194–17,428,82850116719.378.97Nucleus
MsPLATZ4MS.gene029705Ms1.2: 47,307,863–47,309,14360920322.958.83Nucleus
MsPLATZ5MS.gene95330Ms1.3: 17,964,734–17,967,11850116719.368.97Nucleus
MsPLATZ6MS.gene034971Ms1.3: 44,693,845–44,695,01660020022.618.96Nucleus
MsPLATZ7MS.gene83024Ms1.4: 17,595,429–17,597,80550116719.368.97Nucleus
MsPLATZ8MS.gene47395Ms1.4: 51,168,875–51,170,10960920322.928.7Nucleus
MsPLATZ9MS.gene35330Ms2.1: 17,012,467–17,013,70873524528.589.24Nucleus
MsPLATZ10MS.gene99752Ms2.1: 34,752,509–34,757,59199933336.914.69Chloroplast
MsPLATZ11MS.gene073125Ms2.2: 13,169,890–13,170,79143214416.709.03Cytosol
MsPLATZ12MS.gene073126Ms2.2: 13,185,522–13,188,24583727931.605.81Extracellular
MsPLATZ13MS.gene073129Ms2.2: 13,219,049–13,220,33373524528.468.71Extracellular
MsPLATZ14MS.gene57445Ms2.2: 50,631,783–50,632,379216728.398.85Chloroplast
MsPLATZ15MS.gene91274Ms2.3: 13,498,110–13,499,56473824628.689.26Nucleus
MsPLATZ16MS.gene91270Ms2.3: 13,545,547–13,547,03443814616.939.21Extracellular
MsPLATZ17MS.gene58706Ms2.3: 53,047,725–53,074,883189063072.489Nucleus
MsPLATZ18MS.gene94621Ms2.4: 14,906,505–14,907,74673824628.719.26Nucleus
MsPLATZ19MS.gene94620Ms2.4: 14,914,416–14,915,81474124728.699.1Nucleus
MsPLATZ20MS.gene94618Ms2.4: 14,941,107–14,942,36871423827.888.79Extracellular
MsPLATZ21MS.gene015620Ms4.1: 1,317,444–1,319,11872324127.868.94Nucleus
MsPLATZ22MS.gene36510Ms4.1: 18,036,419–18,039,12145315116.908.57Nucleus
MsPLATZ23MS.gene065915Ms4.1: 27,206,398–27,208,00064821623.969.31Nucleus
MsPLATZ24MS.gene62657Ms4.2: 1,067,724–1,069,37372324127.909.03Nucleus
MsPLATZ25MS.gene72172Ms4.2: 6,826,199–6,828,51459719922.678.82Nucleus
MsPLATZ26MS.gene028280Ms4.2: 17,145,854–17,148,60146515517.488.57Nucleus
MsPLATZ27MS.gene83177Ms4.2: 31,843,428–31,845,02564821623.969.31Nucleus
MsPLATZ28MS.gene95852Ms4.3: 1,135,074–1,136,74872324127.868.94Nucleus
MsPLATZ29MS.gene048775Ms4.3: 6,372,228–6,374,54959719922.678.82Nucleus
MsPLATZ30MS.gene023191Ms4.3: 18,576,051–18,578,76146515517.408.57Nucleus
MsPLATZ31MS.gene031722Ms4.3: 30,835,572–30,837,17164821623.969.31Nucleus
MsPLATZ32MS.gene058564Ms4.4: 1,743,997–1,745,67472324127.899.03Nucleus
MsPLATZ33MS.gene030429Ms4.4: 6,545,886–6,548,21962720923.658.81Nucleus
MsPLATZ34MS.gene006587Ms4.4: 32,411,516–32,422,710160253458.318.69Nucleus
MsPLATZ35MS.gene058083Ms5.1: 1,754,805–1,756,90464521524.069.07Nucleus
MsPLATZ36MS.gene21784Ms5.2: 1,651,210–1,653,25764521524.169.15Nucleus
MsPLATZ37MS.gene64179Ms5.2: 18,922,507–18,923,80050716919.249.91Nucleus
MsPLATZ38MS.gene40512Ms5.3: 2,100,515–2,102,61564521524.069.07Nucleus
MsPLATZ39MS.gene036303Ms5.3: 19,070,783–19,072,47071123727.119.44Nucleus
MsPLATZ40MS.gene024806Ms5.4: 2,681,147–2,682,36941713915.609.72Nucleus
MsPLATZ41MS.gene027893Ms5.4: 20,364,134–20,365,82771123727.119.44Nucleus
MsPLATZ42MS.gene96355Ms7.1: 56,837,237–56,838,80874424827.698.99Extracellular
MsPLATZ43MS.gene20118Ms7.2: 57,201,793–57,203,05752517518.969.22Nucleus
MsPLATZ44MS.gene82045Ms7.3: 59,965,702–59,967,16961220422.349.31Extracellular
MsPLATZ45MS.gene010738Ms7.4: 59,599,942–59,601,20252517518.939.22Nucleus
MsPLATZ46MS.gene036665Ms8.1: 10,732,368–10,732,92838712915.088.84Cytosol
MsPLATZ47MS.gene59920Ms8.1: 10,748,163–10,749,69775025028.748.61Nucleus
MsPLATZ48MS.gene041385Ms8.1: 10,830,973–10,831,53338712915.088.84Cytosol
MsPLATZ49MS.gene60992Ms8.1: 37,680,744–37,683,26570523526.739.5Nucleus
MsPLATZ50MS.gene041387Ms8.2: 12,789,586–12,794,32387029033.828.67Nucleus
MsPLATZ51MS.gene009009Ms8.2: 35,918,983–35,921,50970523526.749.5Nucleus
MsPLATZ52MS.gene58786Ms8.3: 9,688,042–9,689,58675025028.748.61Nucleus
MsPLATZ53MS.gene71193Ms8.3: 36,233,879–36,236,39770523526.739.5Nucleus
MsPLATZ54MS.gene038444Ms8.4: 35,728,371–35,730,90869923326.509.5Nucleus
MsPLATZ55MS.gene8145343398: 41,531–42,24340213415.699.1Nucleus
Chr: chromosome; CDS: coding sequence; bp: base pair; aa: amino acid; Mw: molecular weight; pI: isoelectric point.
Disclaimer/Publisher’s Note: The statements, opinions and data contained in all publications are solely those of the individual author(s) and contributor(s) and not of MDPI and/or the editor(s). MDPI and/or the editor(s) disclaim responsibility for any injury to people or property resulting from any ideas, methods, instructions or products referred to in the content.

