
Activating Transcription Factor 3 Diminishes Ischemic Cerebral Infarct and Behavioral Deficit by Downregulating Carboxyl-Terminal Modulator Protein
 , , and
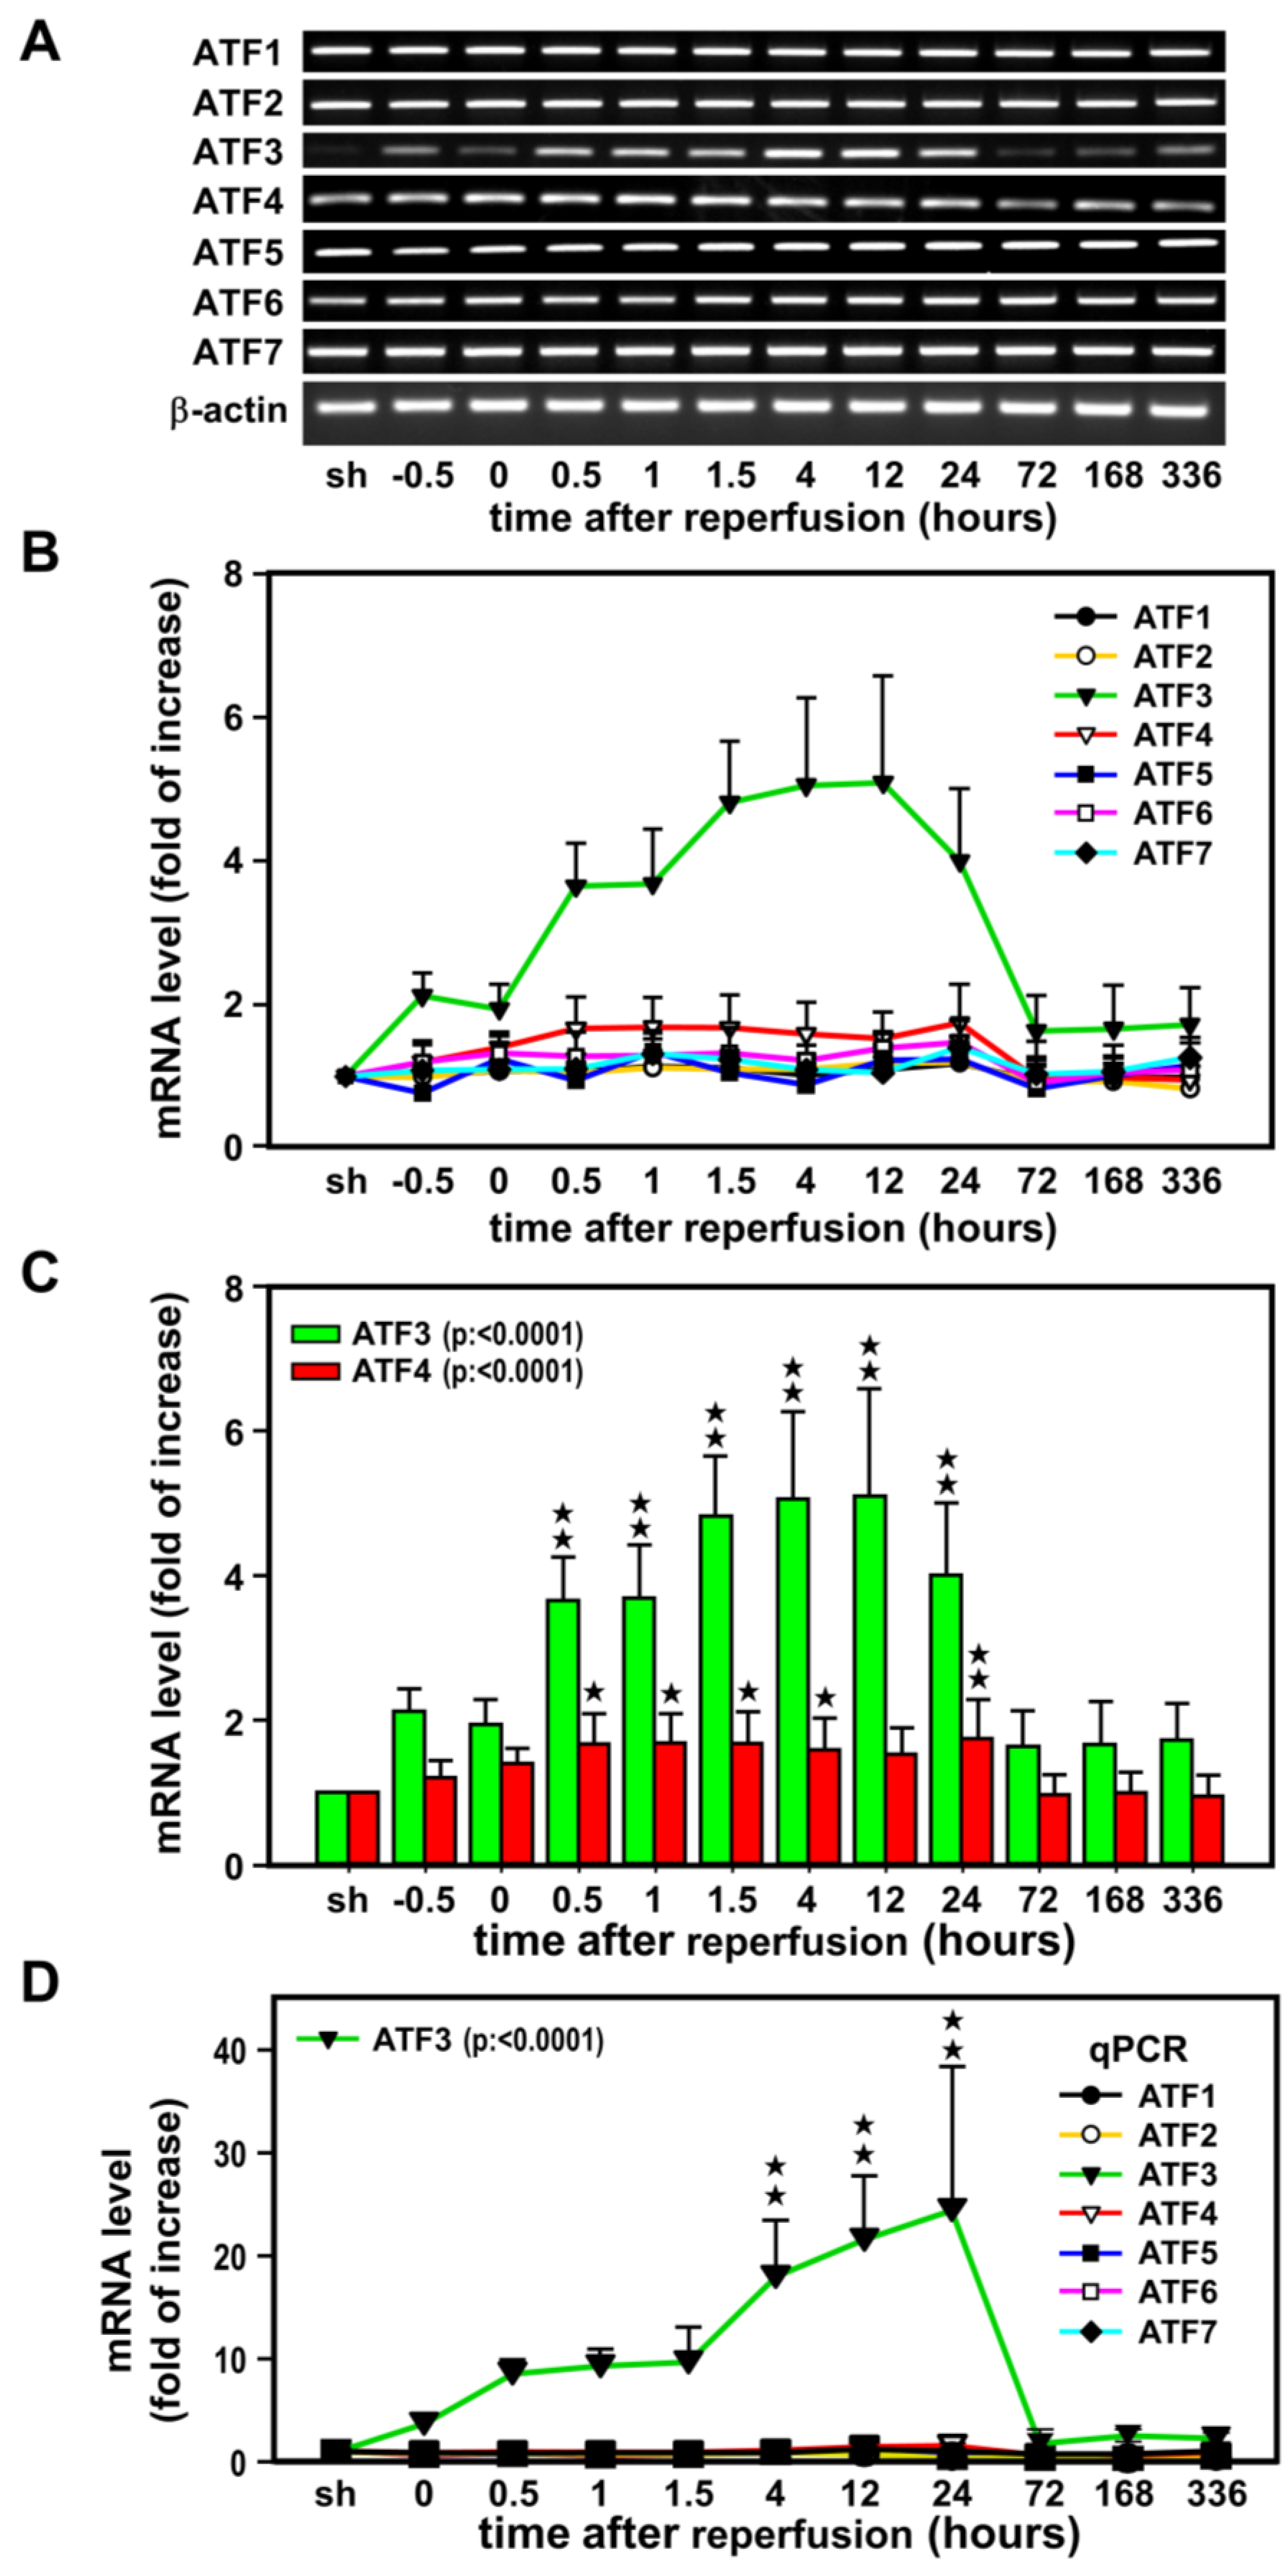
Abstract
:1. Introduction
2. Results
2.1. Induction of ATF3 mRNAs in the Ischemic Cortex after Ischemia-Reperfusion
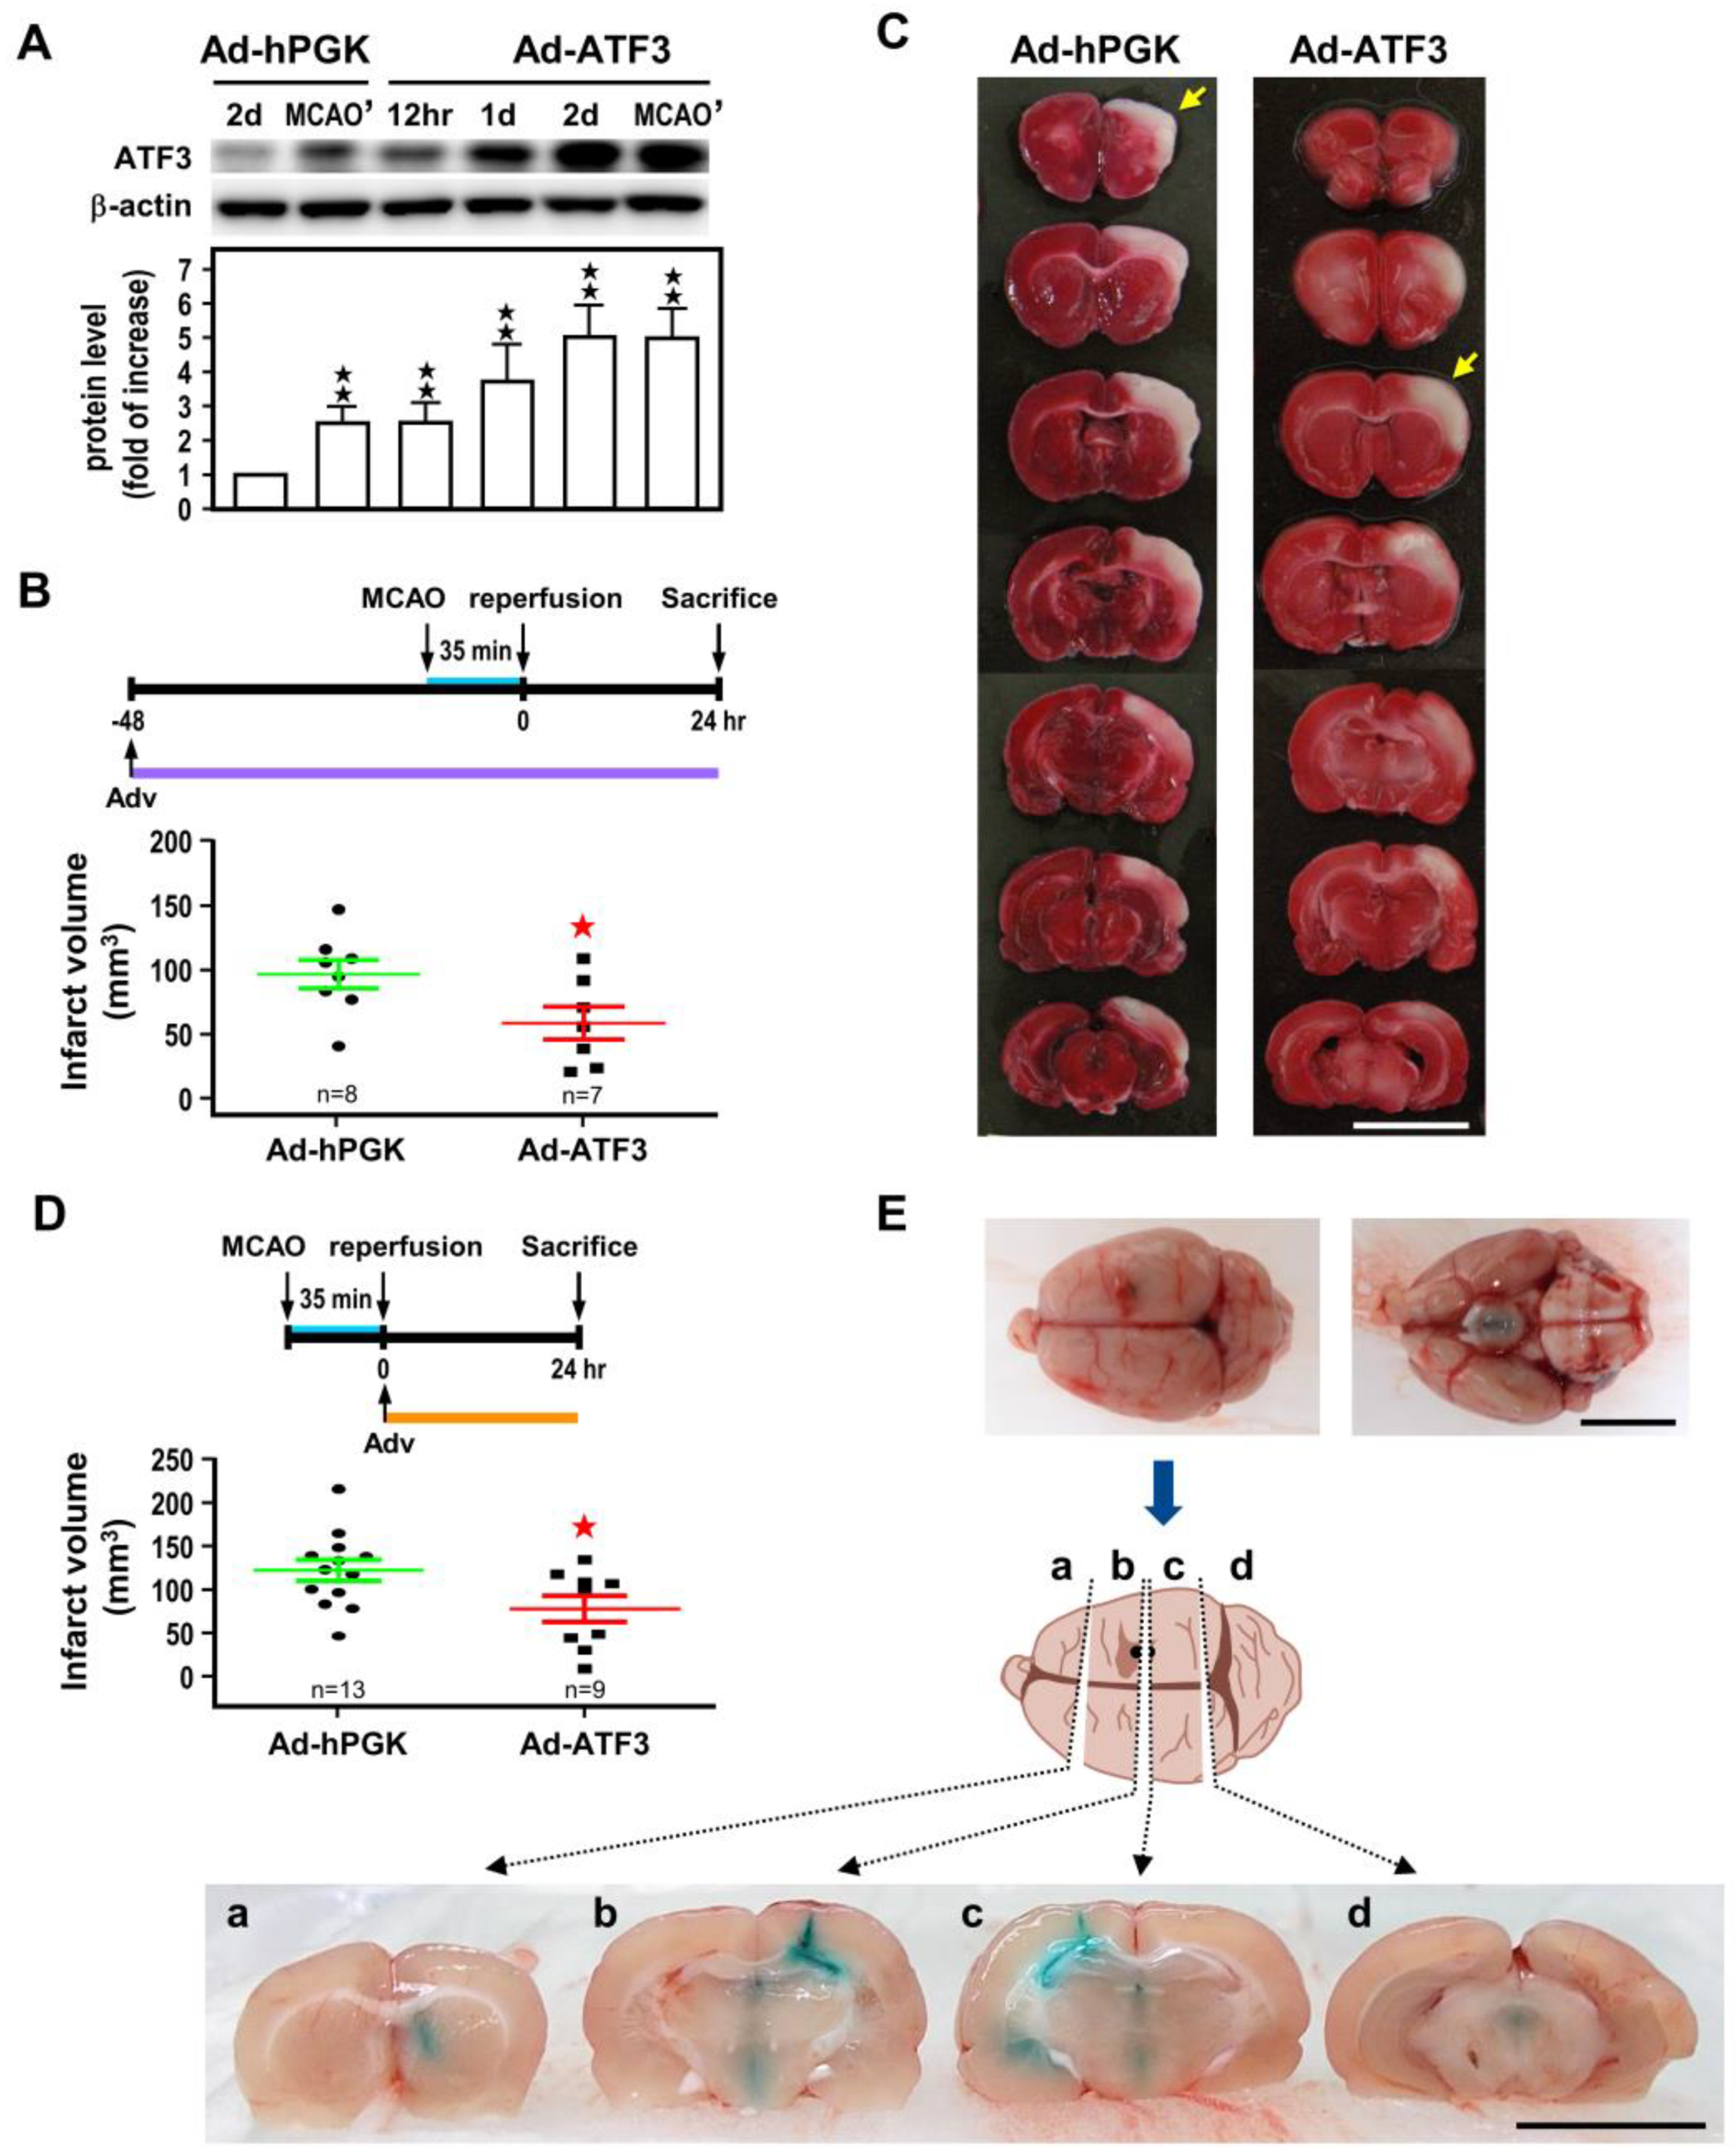
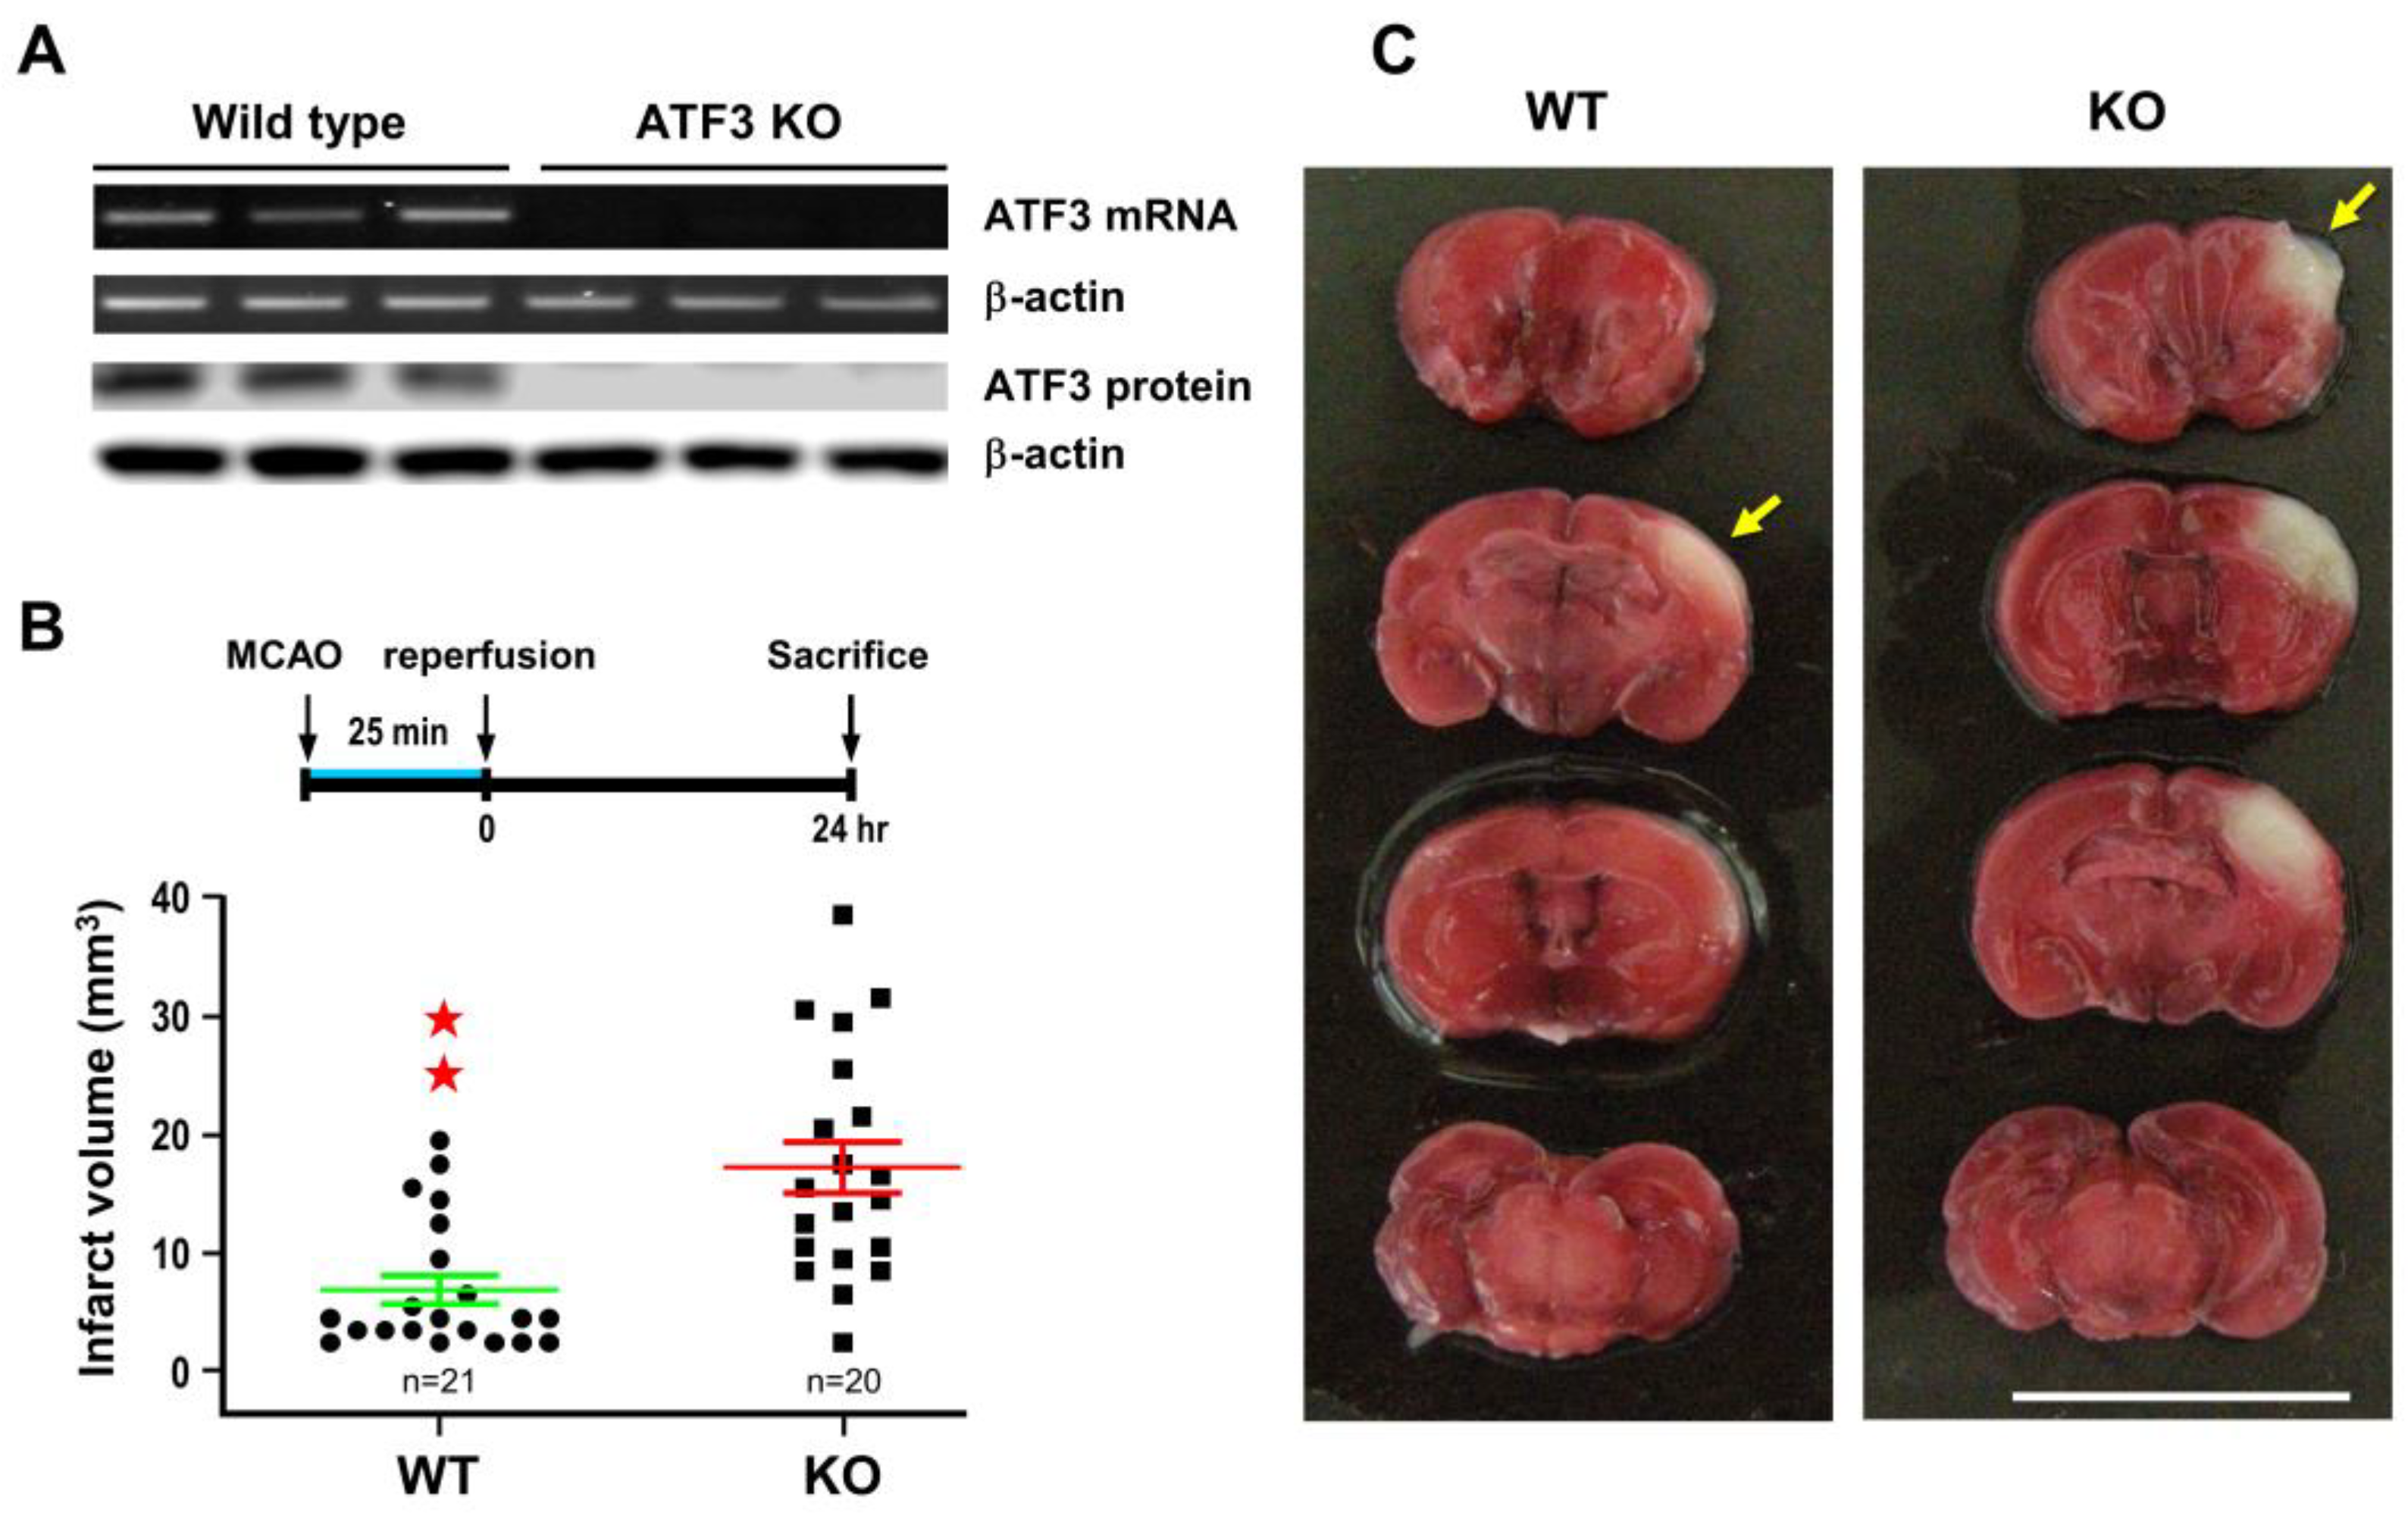
2.2. ATF3 Attenuates Brain Infarct upon Transient Ischemic Insult
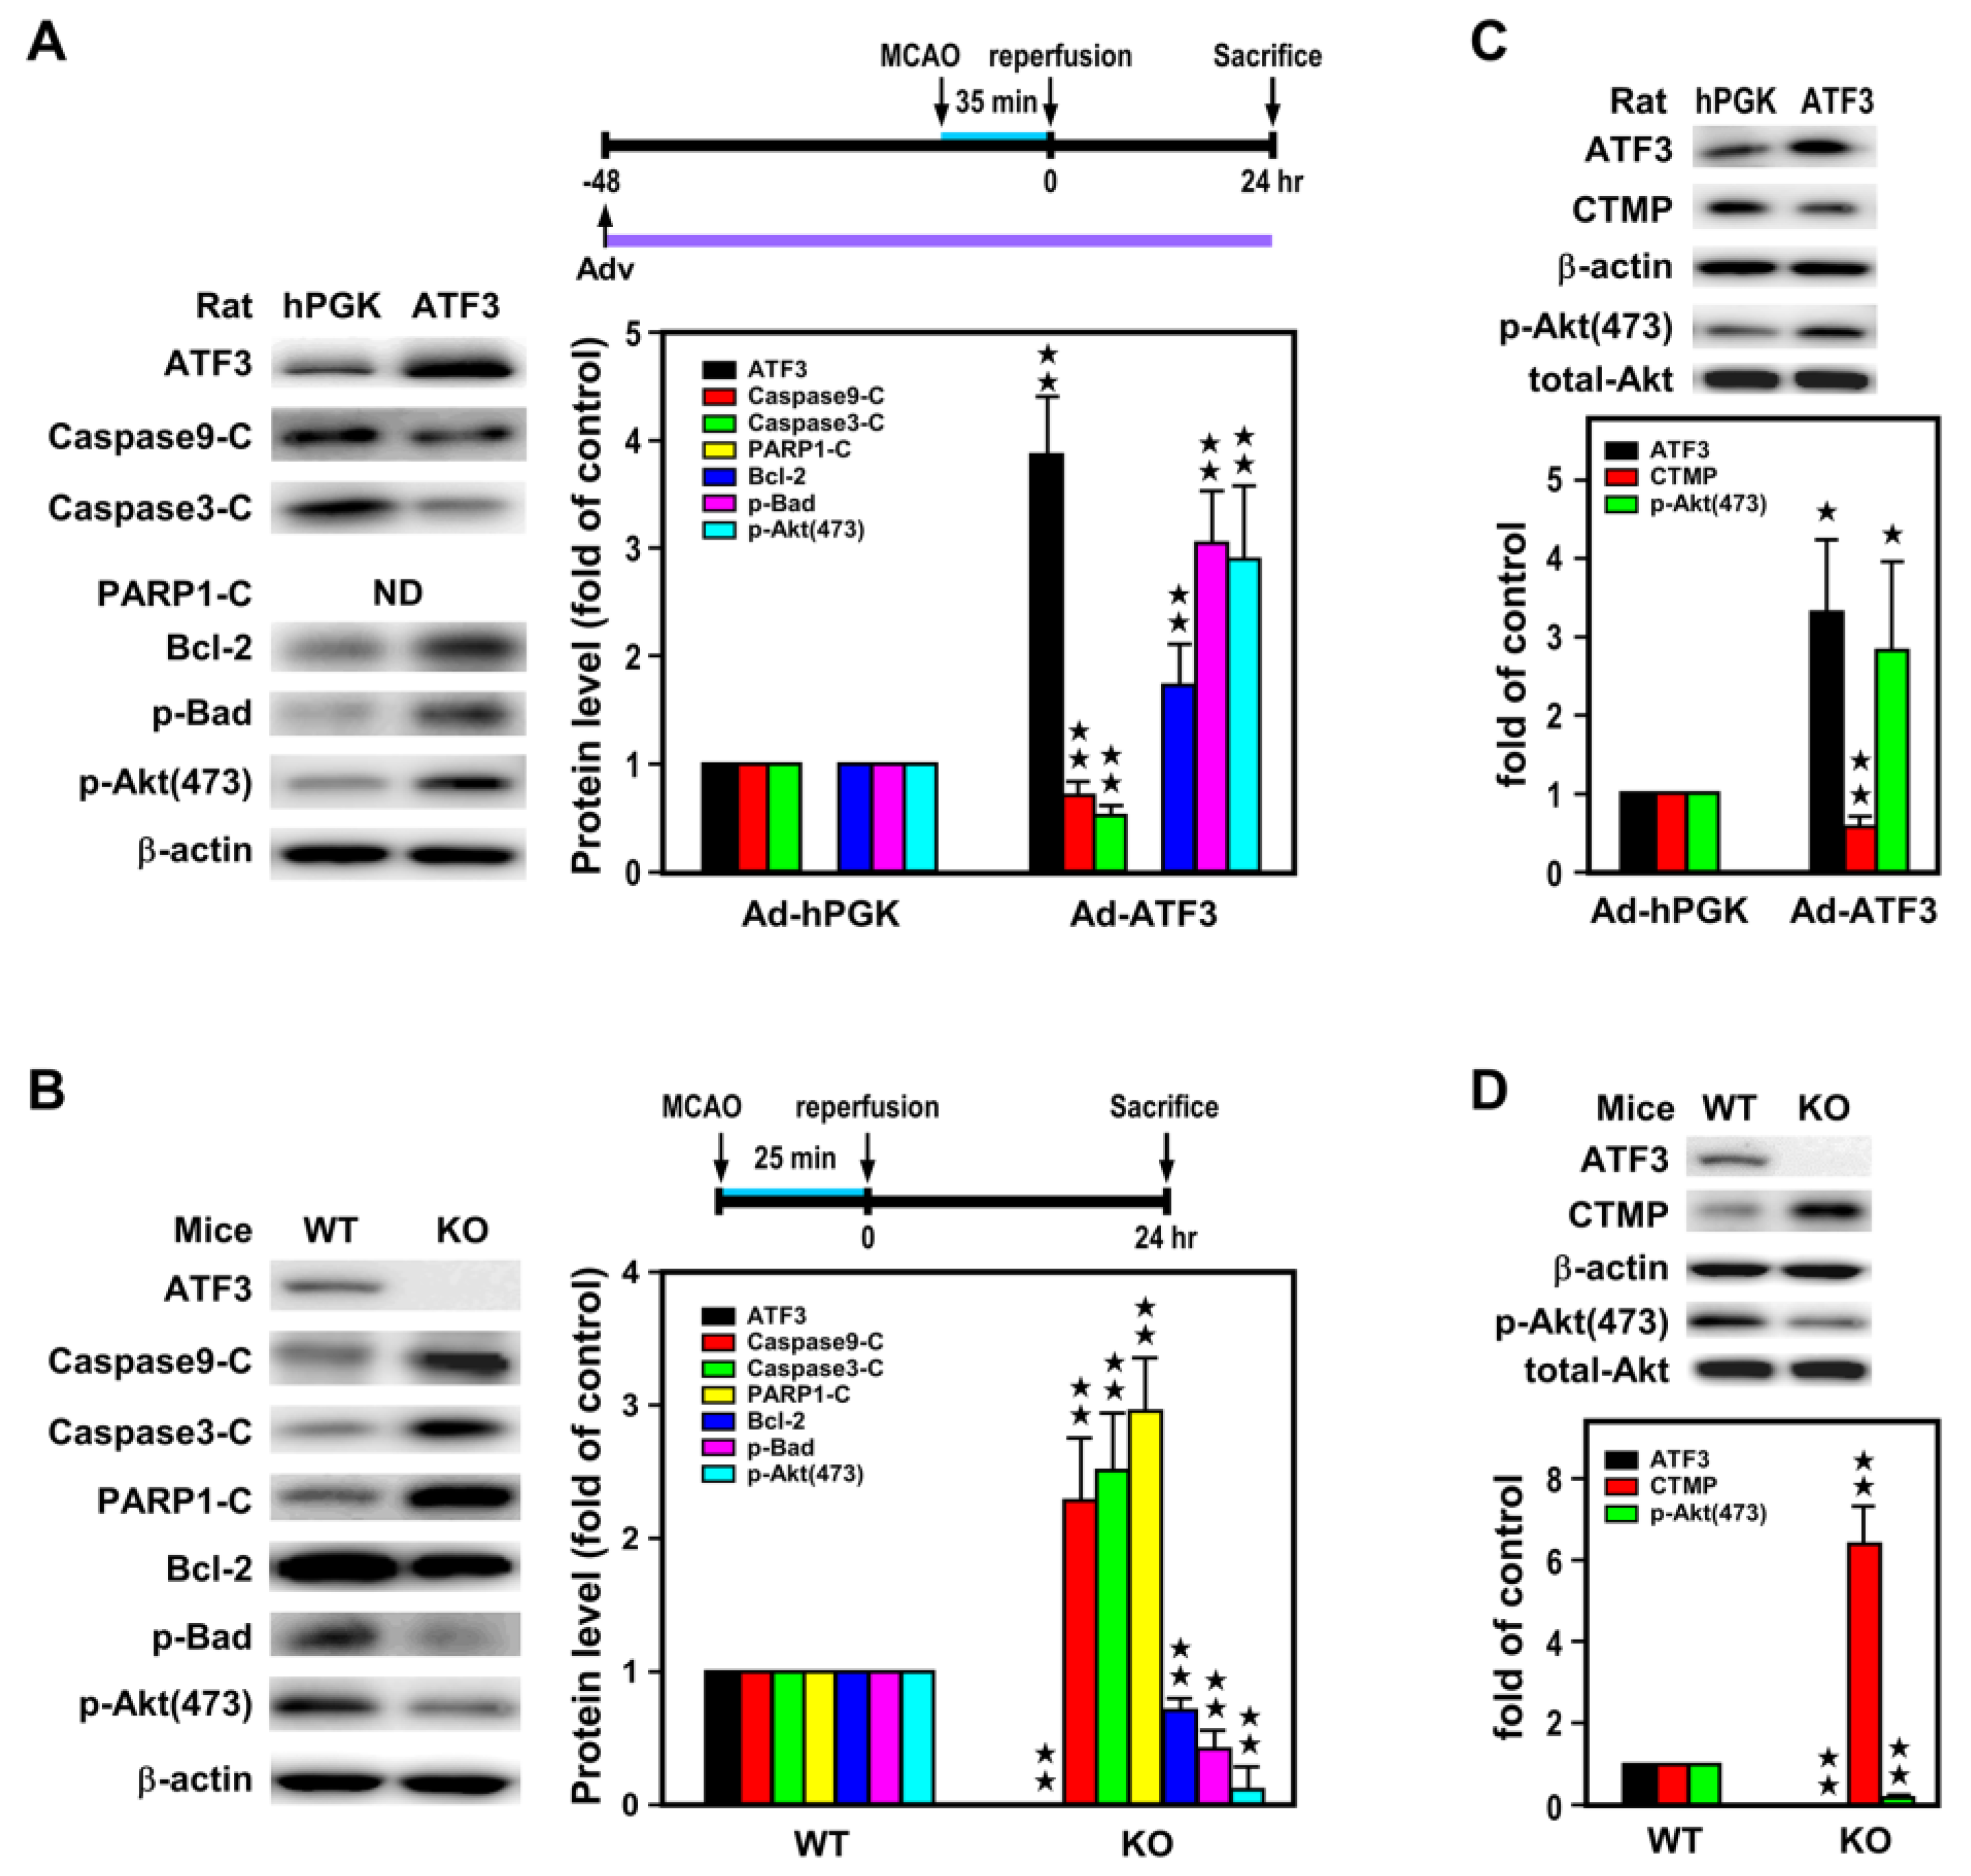
2.3. ATF3 Led to Downregulation of CTMP and Upregulation of p-Akt(473) Expression In Vivo
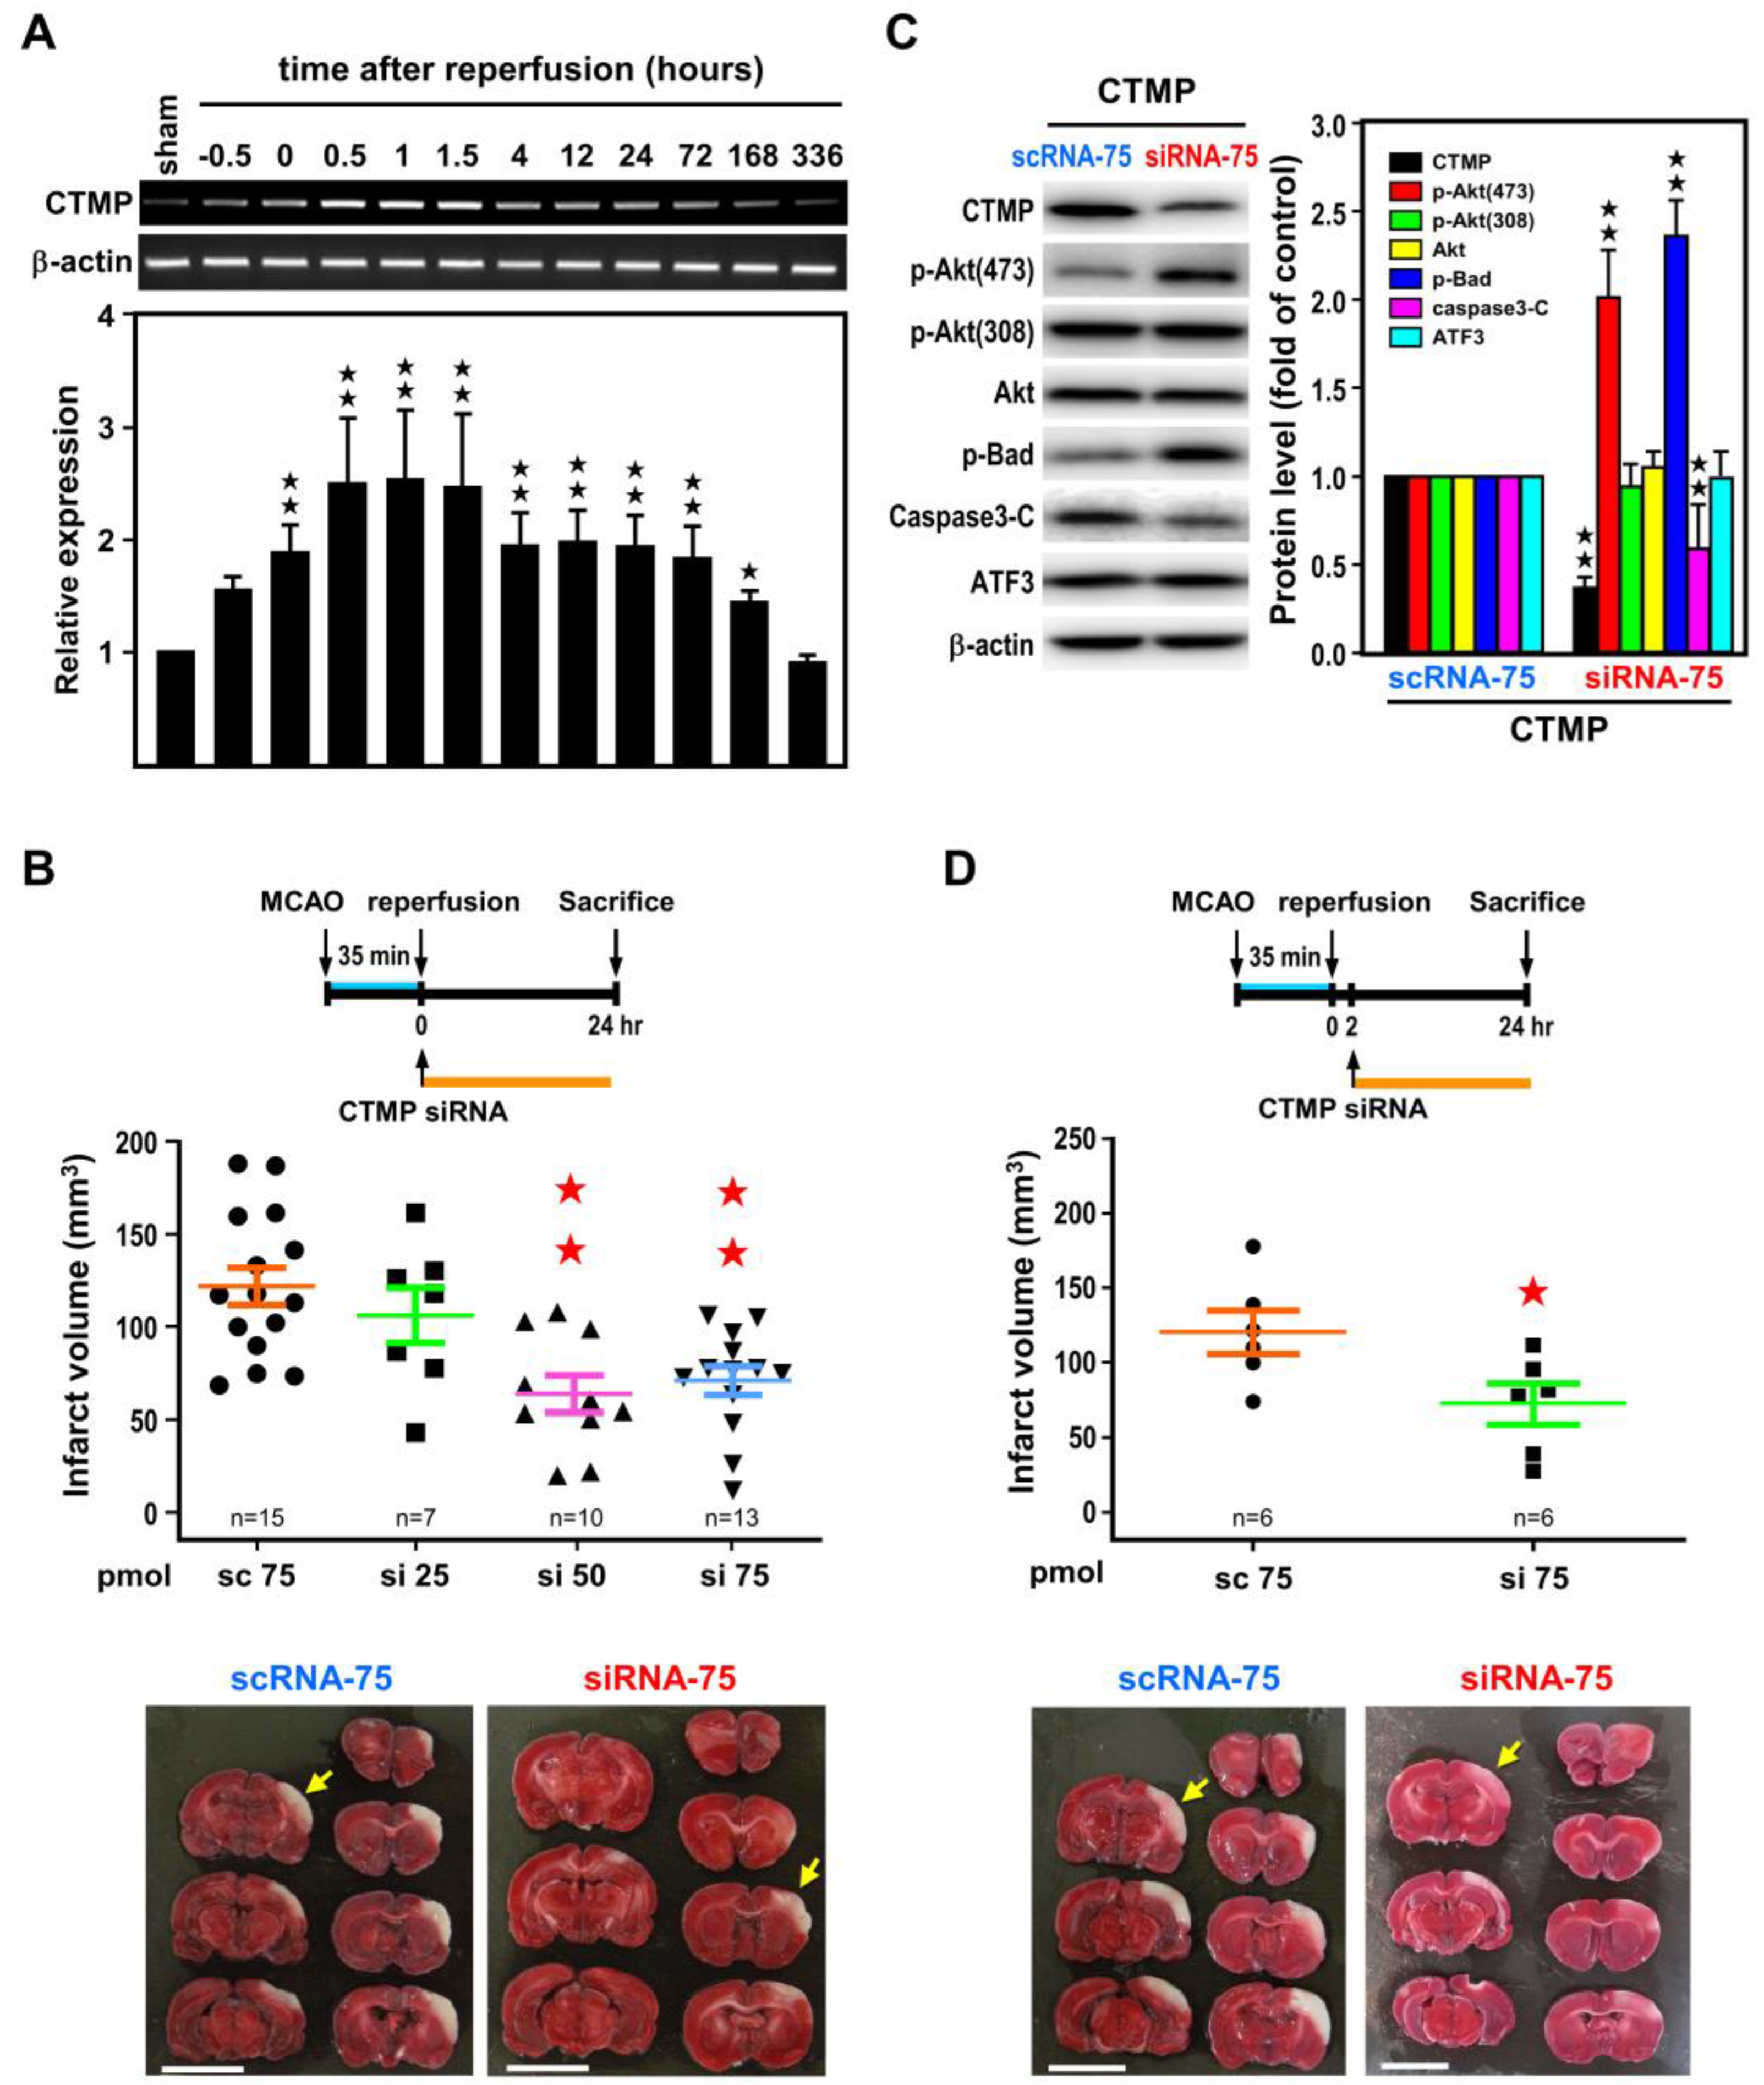
2.4. Post-Ischemic CTMP siRNA Treatment Ameliorates Brain Infarct and Neurological Deficits
3. Discussion
4. Materials and Methods
4.1. Stroke Model
4.2. RNA Isolation, Reverse Transcription (RT), Semi-Quantitative Polymerase Chain Reaction (PCR) and Real Time Quantitative PCR (qPCR)
4.3. Western Blot and Immunoprecipitation Analysis
4.4. Preparation of Replication-Defective Recombinant Adenoviral Vectors
4.5. Intracerebroventricular (icv) Infusion of Ad-ATF3 and CTMP siRNA
4.6. Behavioral Assessment
4.7. Magnetic Resonance Imaging (MRI) Experiment
4.8. Statistical Analysis
5. Conclusions
Author Contributions
Funding
Institutional Review Board Statement
Informed Consent Statement
Data Availability Statement
Acknowledgments
Conflicts of Interest
References
- Hai, T.; Wolfgang, C.D.; Marsee, D.K.; Allen, A.E.; Sivaprasad, U. ATF3 and stress responses. Gene Expr. 1999, 7, 321–335. [Google Scholar] [PubMed]
- Hai, T.W.; Liu, F.; Coukos, W.J.; Green, M.R. Transcription factor ATF cDNA clones: An extensive family of leucine zipper proteins able to selectively form DNA-binding heterodimers. Genes Dev. 1989, 3, 2083–2090. [Google Scholar] [CrossRef] [PubMed] [Green Version]
- Hai, T.; Wolford, C.C.; Chang, Y.S. ATF3, a hub of the cellular adaptive-response network, in the pathogenesis of diseases: Is modulation of inflammation a unifying component? Gene Expr. J. Liver Res. 2010, 15, 1–11. [Google Scholar] [CrossRef] [PubMed]
- Thompson, M.R.; Xu, D.; Williams, B.R.G. ATF3 transcription factor and its emerging roles in immunity and cancer. J. Mol. Med. 2009, 87, 1053–1060. [Google Scholar] [CrossRef] [PubMed] [Green Version]
- Hartman, M.G.; Lu, D.; Kim, M.L.; Kociba, G.J.; Shukri, T.; Buteau, J.; Wang, X.; Frankel, W.L.; Guttridge, D.; Prentki, M.; et al. Role for activating transcription factor 3 in stress-induced beta-cell apoptosis. Mol. Cell. Biol. 2004, 24, 5721–5732. [Google Scholar] [CrossRef] [Green Version]
- Hunt, D.; Raivich, G.; Anderson, P.N. Activating Transcription Factor 3 and the Nervous System. Front. Mol. Neurosci. 2012, 5, 7. [Google Scholar] [CrossRef] [Green Version]
- Zhou, H.; Li, N.; Yuan, Y.; Jin, Y.-G.; Guo, H.; Deng, W.; Tang, Q.-Z. Activating transcription factor 3 in cardiovascular diseases: A potential therapeutic target. Basic Res. Cardiol. 2018, 113, 37. [Google Scholar] [CrossRef]
- Petrović, A.; Ban, J.; Ivaničić, M.; Tomljanović, I.; Mladinic, M. The Role of ATF3 in Neuronal Differentiation and Development of Neuronal Networks in Opossum Postnatal Cortical Cultures. Int. J. Mol. Sci. 2022, 23, 4964. [Google Scholar] [CrossRef]
- Tsujino, H.; Kondo, E.; Fukuoka, T.; Dai, Y.; Tokunaga, A.; Miki, K.; Yonenobu, K.; Ochi, T.; Noguchi, K. Activating Transcription Factor 3 (ATF3) Induction by Axotomy in Sensory and Motoneurons: A Novel Neuronal Marker of Nerve Injury. Mol. Cell. Neurosci. 2000, 15, 170–182. [Google Scholar] [CrossRef]
- Katz, H.R.; Arcese, A.A.; Bloom, O.; Morgan, J.R. Activating Transcription Factor 3 (ATF3) is a Highly Conserved Pro-regenerative Transcription Factor in the Vertebrate Nervous System. Front. Cell Dev. Biol. 2022, 10, 824036. [Google Scholar] [CrossRef]
- Ohba, N.; Maeda, M.; Nakagomi, S.; Muraoka, M.; Kiyama, H. Biphasic expression of activating transcription factor-3 in neurons after cerebral infarction. Mol. Brain Res. 2003, 115, 147–156. [Google Scholar] [CrossRef] [PubMed]
- Kawasaki, K.; Yano, K.; Sasaki, K.; Tawara, S.; Ikegaki, I.; Satoh, S.-I.; Ohtsuka, Y.; Yoshino, Y.; Kuriyama, H.; Asano, T.; et al. Correspondence Between Neurological Deficit, Cerebral Infarct Size, and Rho-Kinase Activity in a Rat Cerebral Thrombosis Model. J. Mol. Neurosci. 2009, 39, 59–68. [Google Scholar] [CrossRef]
- Ohba, N.; Kiryu-Seo, S.; Maeda, M.; Muraoka, M.; Ishii, M.; Kiyama, H. Expression of damage-induced neuronal endopeptidase (DINE) mRNA in peri-infarct cortical and thalamic neurons following middle cerebral artery occlusion. J. Neurochem. 2004, 91, 956–964. [Google Scholar] [CrossRef] [PubMed]
- Song, D.-Y.; Oh, K.-M.; Yu, H.-N.; Park, C.-R.; Woo, R.-S.; Jung, S.-S.; Baik, T.-K. Role of activating transcription factor 3 in ischemic penumbra region following transient middle cerebral artery occlusion and reperfusion injury. Neurosci. Res. 2011, 70, 428–434. [Google Scholar] [CrossRef] [PubMed]
- Ai, Z.; Cheng, C.; Zhou, L.; Yin, S.; Wang, L.; Liu, Y. RETRACTED: Bone marrow mesenchymal stem cells-derived extracellular vesicles carrying microRNA-221-3p protect against ischemic stroke via ATF3. Brain Res. Bull. 2021, 172, 220–228. [Google Scholar] [CrossRef]
- Tang, Y.; Pacary, E.; Fréret, T.; Divoux, D.; Petit, E.; Schumann-Bard, P.; Bernaudin, M. Effect of hypoxic preconditioning on brain genomic response before and following ischemia in the adult mouse: Identification of potential neuroprotective candidates for stroke. Neurobiol. Dis. 2006, 21, 18–28. [Google Scholar] [CrossRef]
- Nakagomi, S.; Suzuki, Y.; Namikawa, K.; Kiryu-Seo, S.; Kiyama, H. Expression of the Activating Transcription Factor 3 Prevents c-Jun N-Terminal Kinase-Induced Neuronal Death by Promoting Heat Shock Protein 27 Expression and Akt Activation. J. Neurosci. 2003, 23, 5187–5196. [Google Scholar] [CrossRef] [PubMed] [Green Version]
- van der Weerd, L.; Akbar, M.T.; Badin, R.A.; Valentim, L.M.; Thomas, D.; Wells, D.; Latchman, D.S.; Gadian, D.G.; Lythgoe, M.F.; De Belleroche, J.S. Overexpression of Heat Shock Protein 27 Reduces Cortical Damage after Cerebral Ischemia. J. Cereb. Blood Flow Metab. 2010, 30, 849–856. [Google Scholar] [CrossRef]
- Wu, F.; Echeverry, R.; Wu, J.; An, J.; Haile, W.B.; Cooper, D.S.; Catano, M.; Yepes, M. Tissue-type plasminogen activator protects neurons from excitotoxin-induced cell death via activation of the ERK1/2-CREB-ATF3 signaling pathway. Mol. Cell. Neurosci. 2013, 52, 9–19. [Google Scholar] [CrossRef] [Green Version]
- Zhang, S.-J.; Buchthal, B.; Lau, D.; Hayer, S.; Dick, O.; Schwaninger, M.; Veltkamp, R.; Zou, M.; Weiss, U.; Bading, H. A Signaling Cascade of Nuclear Calcium-CREB-ATF3 Activated by Synaptic NMDA Receptors Defines a Gene Repression Module That Protects against Extrasynaptic NMDA Receptor-Induced Neuronal Cell Death and Ischemic Brain Damage. J. Neurosci. 2011, 31, 4978–4990. [Google Scholar] [CrossRef] [Green Version]
- Ahlgren, H.; Orth, C.B.; Freitag, H.E.; Hellwig, A.; Ottersen, O.P.; Bading, H. The Nuclear Calcium Signaling Target, Activating Transcription Factor 3 (ATF3), Protects against Dendrotoxicity and Facilitates the Recovery of Synaptic Transmission after an Excitotoxic Insult. J. Biol. Chem. 2014, 289, 9970–9982. [Google Scholar] [CrossRef] [Green Version]
- Takarada, T.; Kou, M.; Hida, M.; Fukumori, R.; Nakamura, S.; Kutsukake, T.; Kuramoto, N.; Hinoi, E.; Yoneda, Y. Protective upregulation of activating transcription factor-3 against glutamate neurotoxicity in neuronal cells under ischemia. J. Neurosci. Res. 2016, 94, 378–388. [Google Scholar] [CrossRef]
- Wang, L.; Deng, S.; Lu, Y.; Zhang, Y.; Yang, L.; Guan, Y.; Jiang, H.; Li, H. Increased inflammation and brain injury after transient focal cerebral ischemia in activating transcription factor 3 knockout mice. Neuroscience 2012, 220, 100–108. [Google Scholar] [CrossRef] [PubMed]
- Darlyuk-Saadon, I.; Weidenfeld-Baranboim, K.; Yokoyama, K.K.; Hai, T.; Aronheim, A. The bZIP repressor proteins, c-Jun dimerization protein 2 and activating transcription factor 3, recruit multiple HDAC members to the ATF3 promoter. Biochim. et Biophys. Acta (BBA)-Gene Regul. Mech. 2012, 1819, 1142–1153. [Google Scholar] [CrossRef] [Green Version]
- Cheng, C.-F.; Lin, H. Activating transcription factor 3, an early cellular adaptive responder in ischemia/reperfusion-induced injury. Tzu Chi Med. J. 2018, 30, 61–65. [Google Scholar] [CrossRef] [PubMed]
- Ma, N.; Li, G.; Fu, X. Protective role of activating transcription factor 3 against neuronal damage in rats with cerebral ischemia. Brain Behav. 2022, 12, e2522. [Google Scholar] [CrossRef]
- Zhai, K.; Kong, X.; Liu, B.; Lou, J. Bioinformatics analysis of gene expression profiling for identification of potential key genes among ischemic stroke. Medicine 2017, 96, e7564. [Google Scholar] [CrossRef] [PubMed]
- Huang, C.-Y.; Chen, J.-J.; Wu, J.-S.; Tsai, H.-D.; Lin, H.; Yan, Y.-T.; Hsu, C.Y.; Ho, Y.-S.; Lin, T.-N. Novel Link of Anti-apoptotic ATF3 with Pro-apoptotic CTMP in the Ischemic Brain. Mol. Neurobiol. 2015, 51, 543–557. [Google Scholar] [CrossRef]
- Maira, S.-M.; Galetic, I.; Brazil, D.P.; Kaech, S.; Ingley, E.; Thelen, M.; Hemmings, B.A. Carboxyl-Terminal Modulator Protein (CTMP), a Negative Regulator of PKB/Akt and v-Akt at the Plasma Membrane. Science 2001, 294, 374–380. [Google Scholar] [CrossRef]
- Jiang, H.-Y.; Wek, S.A.; McGrath, B.C.; Lu, D.; Hai, T.; Harding, H.P.; Wang, X.; Ron, D.; Cavener, D.R.; Wek, R.C. Activating Transcription Factor 3 Is Integral to the Eukaryotic Initiation Factor 2 Kinase Stress Response. Mol. Cell. Biol. 2004, 24, 1365–1377. [Google Scholar] [CrossRef] [Green Version]
- Pitale, P.M.; Gorbatyuk, O.; Gorbatyuk, M. Neurodegeneration: Keeping ATF4 on a Tight Leash. Front. Cell. Neurosci. 2017, 11, 410. [Google Scholar] [CrossRef] [PubMed] [Green Version]
- Ke, H.; Zhang, X.; Cheng, L.; Fan, Y.; Xiao, S.; Ma, Y.; Feng, G. Bioinformatic analysis to explore key genes associated with brain ischemia–reperfusion injury in rats. Int. J. Neurosci. 2019, 129, 945–954. [Google Scholar] [CrossRef] [PubMed]
- Eisener-Dorman, A.F.; Lawrence, D.A.; Bolivar, V.J. Cautionary insights on knockout mouse studies: The gene or not the gene? Brain Behav. Immun. 2009, 23, 318–324. [Google Scholar] [CrossRef] [PubMed] [Green Version]
- Miyawaki, T.; Ofengeim, D.; Noh, K.-M.; Latuszek-Barrantes, A.; Hemmings, B.A.; Follenzi, A.; Zukin, R.S. The endogenous inhibitor of Akt, CTMP, is critical to ischemia-induced neuronal death. Nat. Neurosci. 2009, 12, 618–626. [Google Scholar] [CrossRef] [Green Version]
- Chen, Y.; Cai, M.; Deng, J.; Tian, L.; Wang, S.; Tong, L.; Dong, H.; Xiong, L. Elevated Expression of Carboxy-Terminal Modulator Protein (CTMP) Aggravates Brain Ischemic Injury in Diabetic db/db Mice. Neurochem. Res. 2016, 41, 2179–2189. [Google Scholar] [CrossRef] [PubMed]
- Li, J.; Shan, W.; Zuo, Z. Age-Related Upregulation of Carboxyl Terminal Modulator Protein Contributes to the Decreased Brain Ischemic Tolerance in Older Rats. Mol. Neurobiol. 2018, 55, 6145–6154. [Google Scholar] [CrossRef]
- Setten, R.L.; Rossi, J.J.; Han, S.-P. The current state and future directions of RNAi-based therapeutics. Nat. Rev. Drug Discov. 2019, 18, 421–446. [Google Scholar] [CrossRef]
- Lin, T.N.; He, Y.Y.; Wu, G.; Khan, M.; Hsu, C.Y. Effect of brain edema on infarct volume in a focal cerebral ischemia model in rats. Stroke 1993, 24, 117–121. [Google Scholar] [CrossRef] [Green Version]
- Wu, J.S.; Cheung, W.M.; Tsai, Y.S.; Chen, Y.T.; Fong, W.H.; Tsai, H.D.; Chen, Y.C.; Liou, J.Y.; Shyue, S.K.; Chen, J.J.; et al. Ligand-activated peroxisome proliferator-activated receptor-gamma protects against ischemic cerebral infarction and neuronal apoptosis by 14-3-3 epsilon upregulation. Circulation 2009, 119, 1124–1134. [Google Scholar] [CrossRef]
- Wu, J.S.; Tsai, H.D.; Cheung, W.M.; Hsu, C.Y.; Lin, T.N. PPAR-γ Ameliorates Neuronal Apoptosis and Ischemic Brain Injury via Suppressing NF-κB-Driven p22phox Transcription. Mol. Neurobiol. 2016, 53, 3626–3645. [Google Scholar] [CrossRef]
- Wu, J.-S.; Kao, M.-H.; Tsai, H.-D.; Cheung, W.-M.; Chen, J.-J.; Ong, W.-Y.; Sun, G.Y.; Lin, T.-N. Clinacanthus nutans Mitigates Neuronal Apoptosis and Ischemic Brain Damage Through Augmenting the C/EBPβ-Driven PPAR-γ Transcription. Mol. Neurobiol. 2018, 55, 5425–5438. [Google Scholar] [CrossRef] [PubMed]
- Graham, F.L.; Prevec, L. Methods for construction of adenovirus vectors. Mol. Biotechnol. 1995, 3, 207–220. [Google Scholar] [CrossRef] [PubMed]
- Lin, H.; Lin, T.N.; Cheung, W.M.; Nian, G.M.; Tseng, P.H.; Chen, S.F.; Chen, J.J.; Shyue, S.K.; Liou, J.Y.; Wu, C.W.; et al. Cyclooxygenase-1 and bicistronic cyclooxygenase-1/prostacyclin synthase gene transfer protect against ischemic cerebral infarction. Circulation 2002, 105, 1962–1969. [Google Scholar] [CrossRef] [PubMed]
- Lin, T.-N.; Cheung, W.-M.; Wu, J.-S.; Chen, J.-J.; Lin, H.; Chen, J.-J.; Liou, J.-Y.; Shyue, S.-K.; Wu, K.K. 15d-Prostaglandin J2 Protects Brain From Ischemia-Reperfusion Injury. Arter. Thromb. Vasc. Biol. 2006, 26, 481–487. [Google Scholar] [CrossRef] [PubMed] [Green Version]
- Bederson, J.B.; Pitts, L.H.; Tsuji, M.; Nishimura, M.C.; Davis, R.L.; Bartkowski, H. Rat middle cerebral artery occlusion: Evaluation of the model and development of a neurologic examination. Stroke 1986, 17, 472–476. [Google Scholar] [CrossRef] [Green Version]
- Schäbitz, W.-R.; Berger, C.; Kollmar, R.; Seitz, M.; Tanay, E.; Kiessling, M.; Schwab, S.; Sommer, C. Effect of Brain-Derived Neurotrophic Factor Treatment and Forced Arm Use on Functional Motor Recovery After Small Cortical Ischemia. Stroke 2004, 35, 992–997. [Google Scholar] [CrossRef] [Green Version]
- Han, X.; Huang, X.; Wang, Y.; Chen, H. A study of astrocyte activation in the periinfarct region after cerebral ischemia with electroacupuncture. Brain Inj. 2010, 24, 773–779. [Google Scholar] [CrossRef]
- Lin, T.-N.; Sun, S.-W.; Cheung, W.-M.; Li, F.; Chang, C. Dynamic Changes in Cerebral Blood Flow and Angiogenesis After Transient Focal Cerebral Ischemia in Rats: Evaluation with serial magnetic resonance imaging. Stroke 2002, 33, 2985–2991. [Google Scholar] [CrossRef] [Green Version]


Disclaimer/Publisher’s Note: The statements, opinions and data contained in all publications are solely those of the individual author(s) and contributor(s) and not of MDPI and/or the editor(s). MDPI and/or the editor(s) disclaim responsibility for any injury to people or property resulting from any ideas, methods, instructions or products referred to in the content. |
© 2023 by the authors. Licensee MDPI, Basel, Switzerland. This article is an open access article distributed under the terms and conditions of the Creative Commons Attribution (CC BY) license (https://creativecommons.org/licenses/by/4.0/).
Share and Cite
Kao, M.-H.; Huang, C.-Y.; Cheung, W.-M.; Yan, Y.-T.; Chen, J.-J.; Ho, Y.-S.; Hsu, C.Y.; Lin, T.-N. Activating Transcription Factor 3 Diminishes Ischemic Cerebral Infarct and Behavioral Deficit by Downregulating Carboxyl-Terminal Modulator Protein. Int. J. Mol. Sci. 2023, 24, 2306. https://doi.org/10.3390/ijms24032306
Kao M-H, Huang C-Y, Cheung W-M, Yan Y-T, Chen J-J, Ho Y-S, Hsu CY, Lin T-N. Activating Transcription Factor 3 Diminishes Ischemic Cerebral Infarct and Behavioral Deficit by Downregulating Carboxyl-Terminal Modulator Protein. International Journal of Molecular Sciences. 2023; 24(3):2306. https://doi.org/10.3390/ijms24032306
Chicago/Turabian StyleKao, Mei-Han, Chien-Yu Huang, Wai-Mui Cheung, Yu-Ting Yan, Jin-Jer Chen, Yuan-Soon Ho, Chung Y. Hsu, and Teng-Nan Lin. 2023. "Activating Transcription Factor 3 Diminishes Ischemic Cerebral Infarct and Behavioral Deficit by Downregulating Carboxyl-Terminal Modulator Protein" International Journal of Molecular Sciences 24, no. 3: 2306. https://doi.org/10.3390/ijms24032306