
Autophagy Is Required to Sustain Increased Intestinal Cell Proliferation during Phenotypic Plasticity Changes in Honey Bee (Apis mellifera)
 , , and
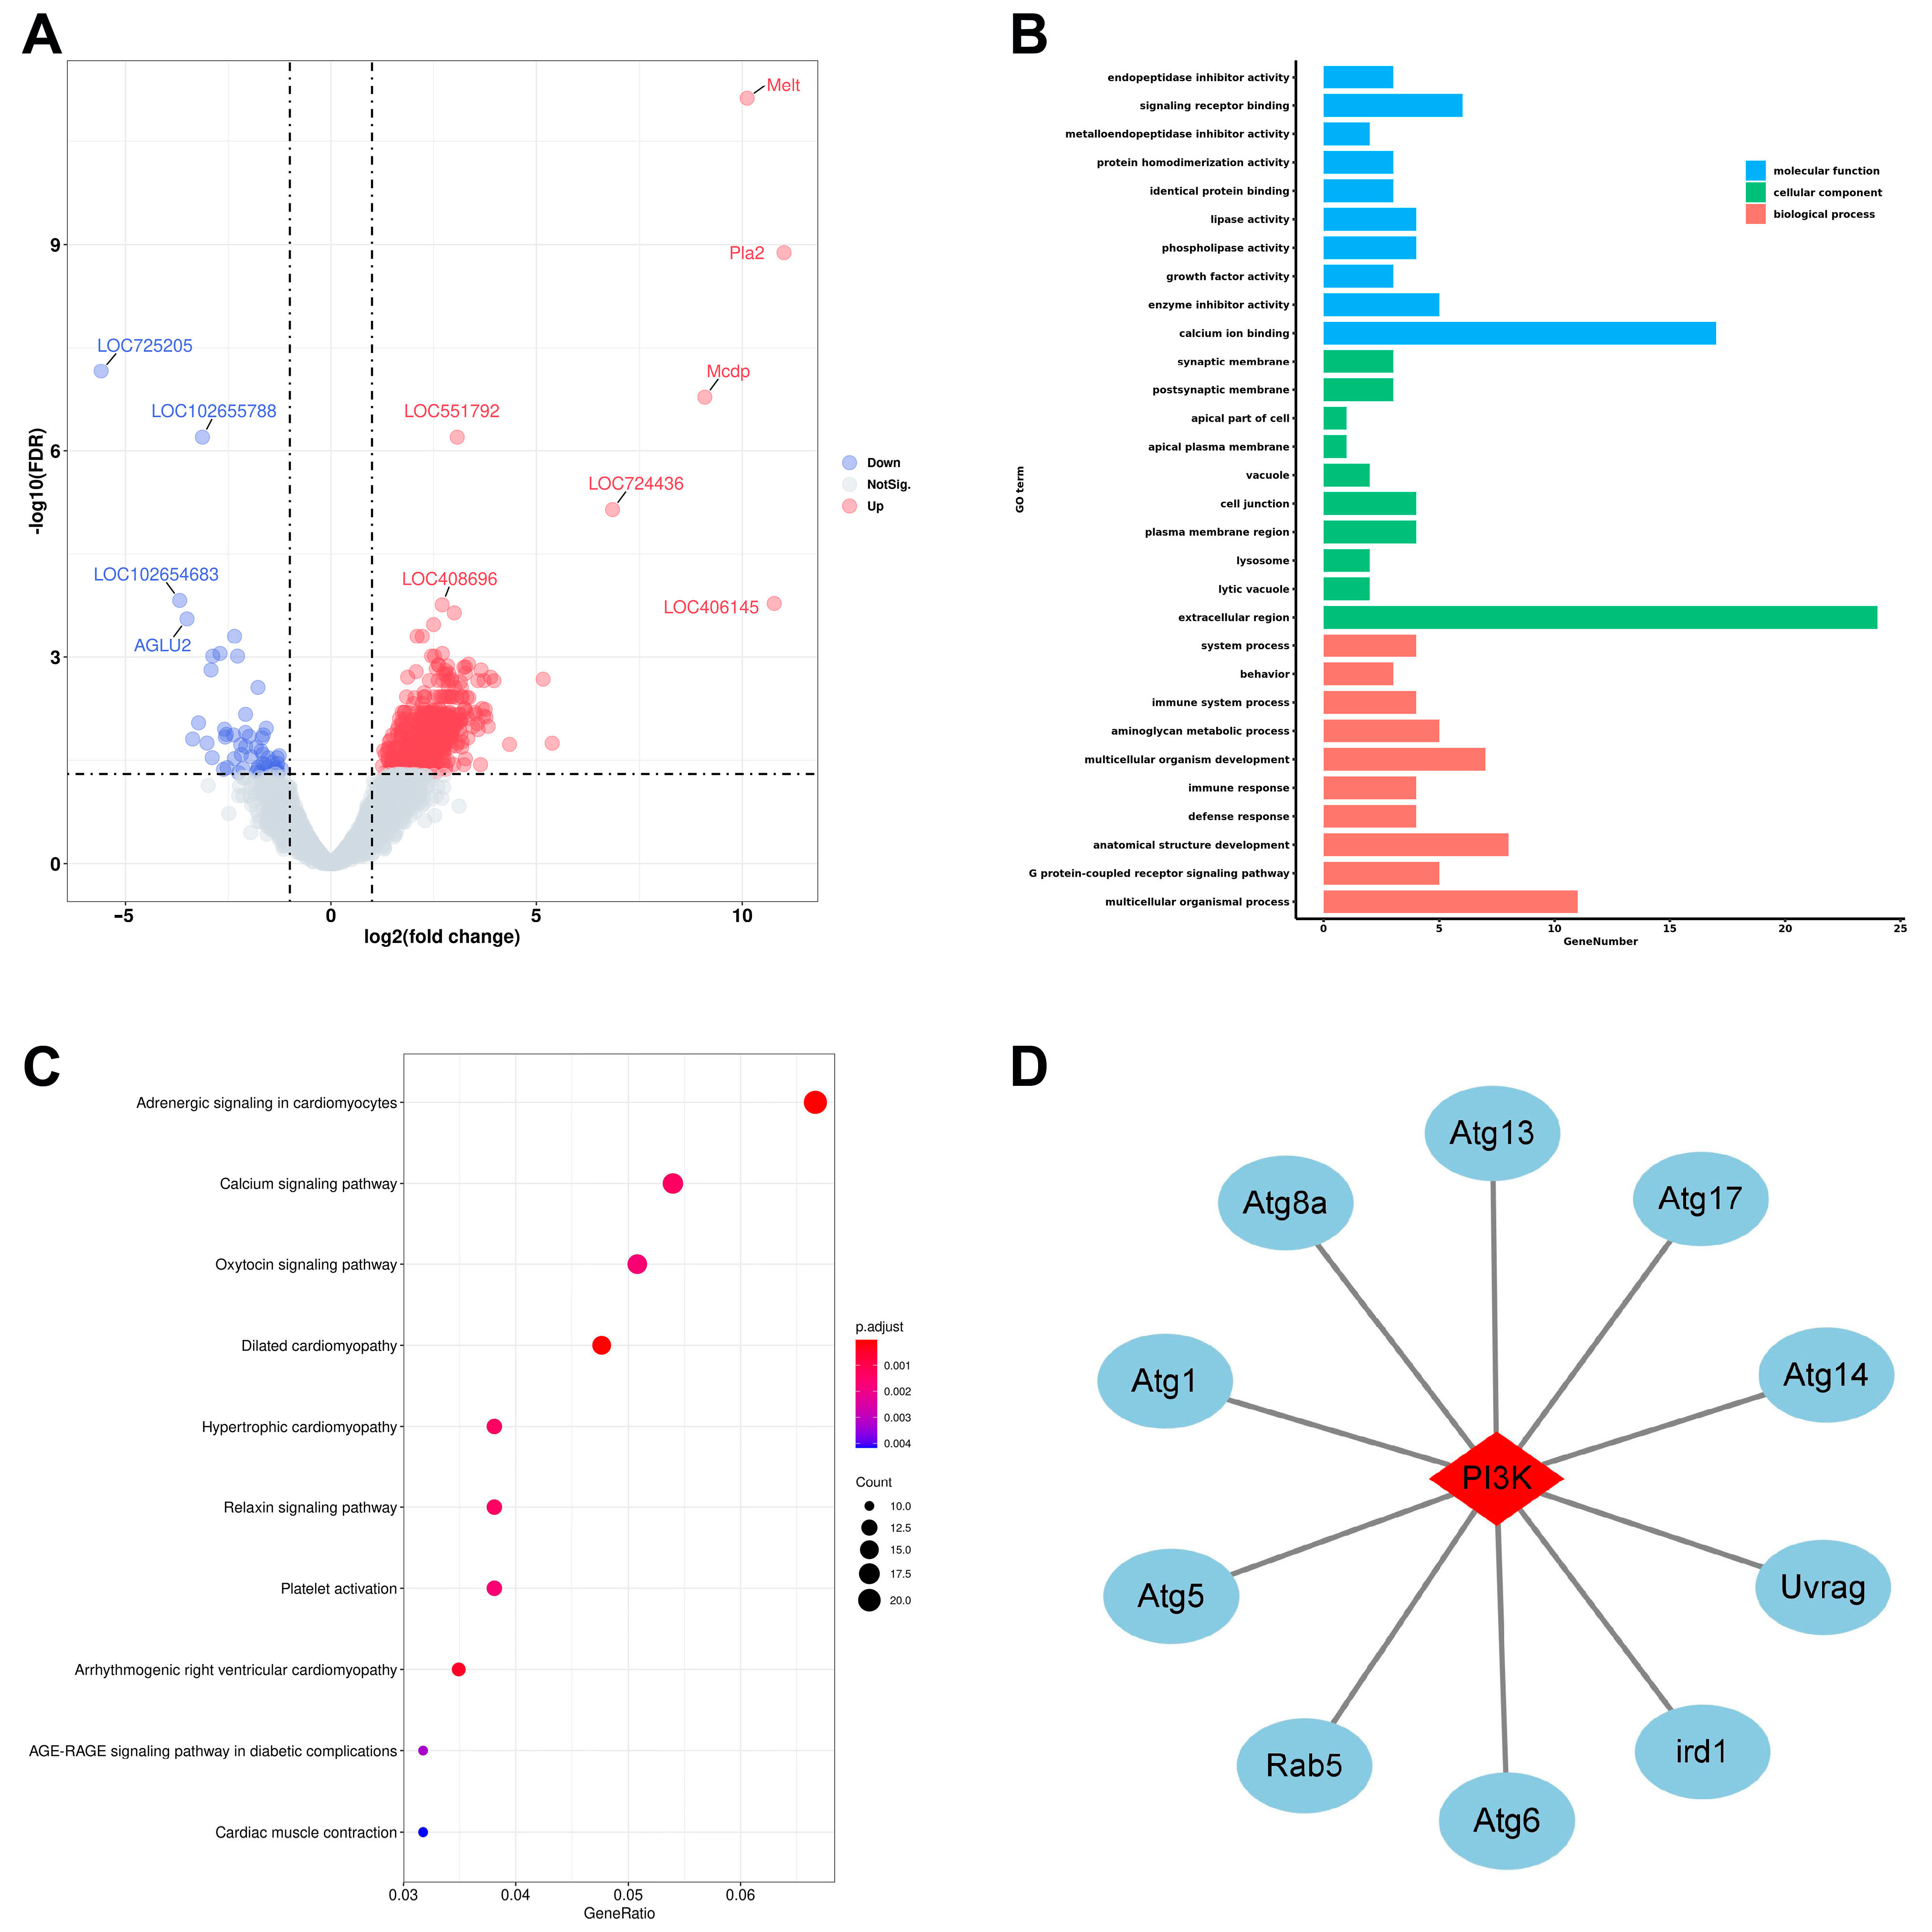
Abstract
:1. Introduction
2. Results
2.1. Key Genes and Signaling Pathways Are Affected in the Midguts of ELWs during Phenotypic Plasticity
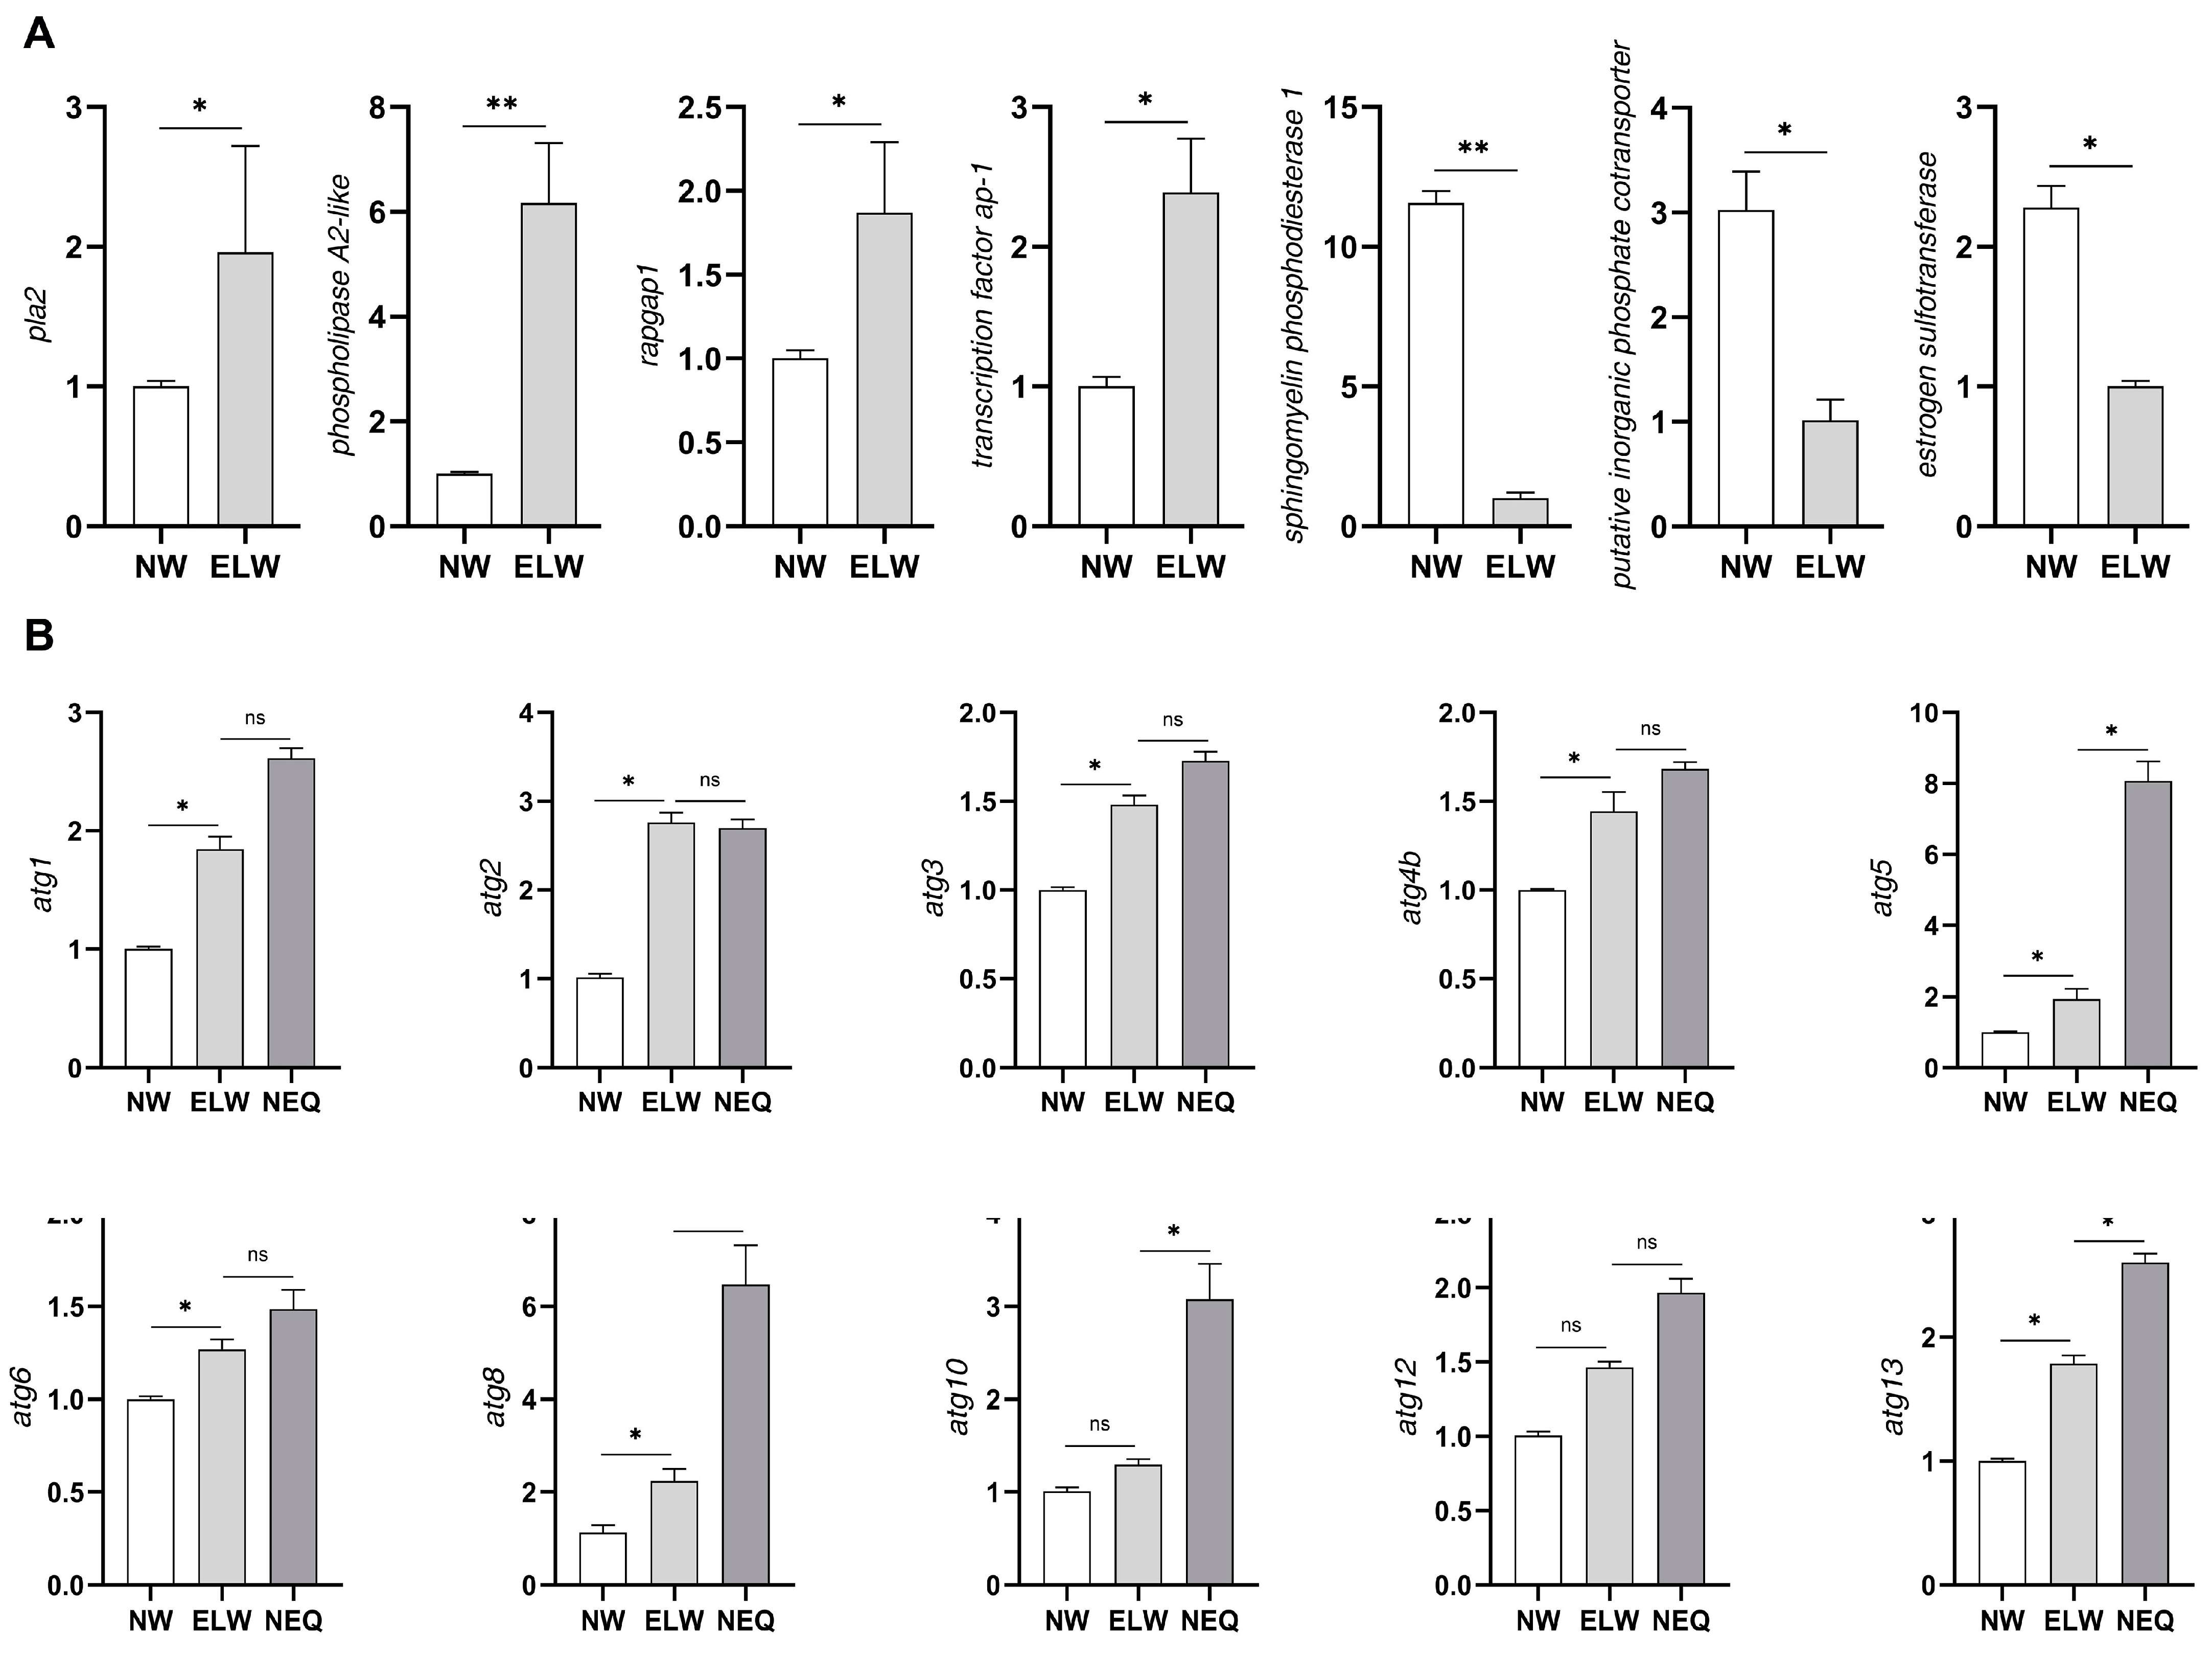
2.2. Key DEGs Are Validated in the Midguts of ELWs
2.3. Autophagy Genes Are Up-Regulated in the Midguts of ELWs during Plastic Changes
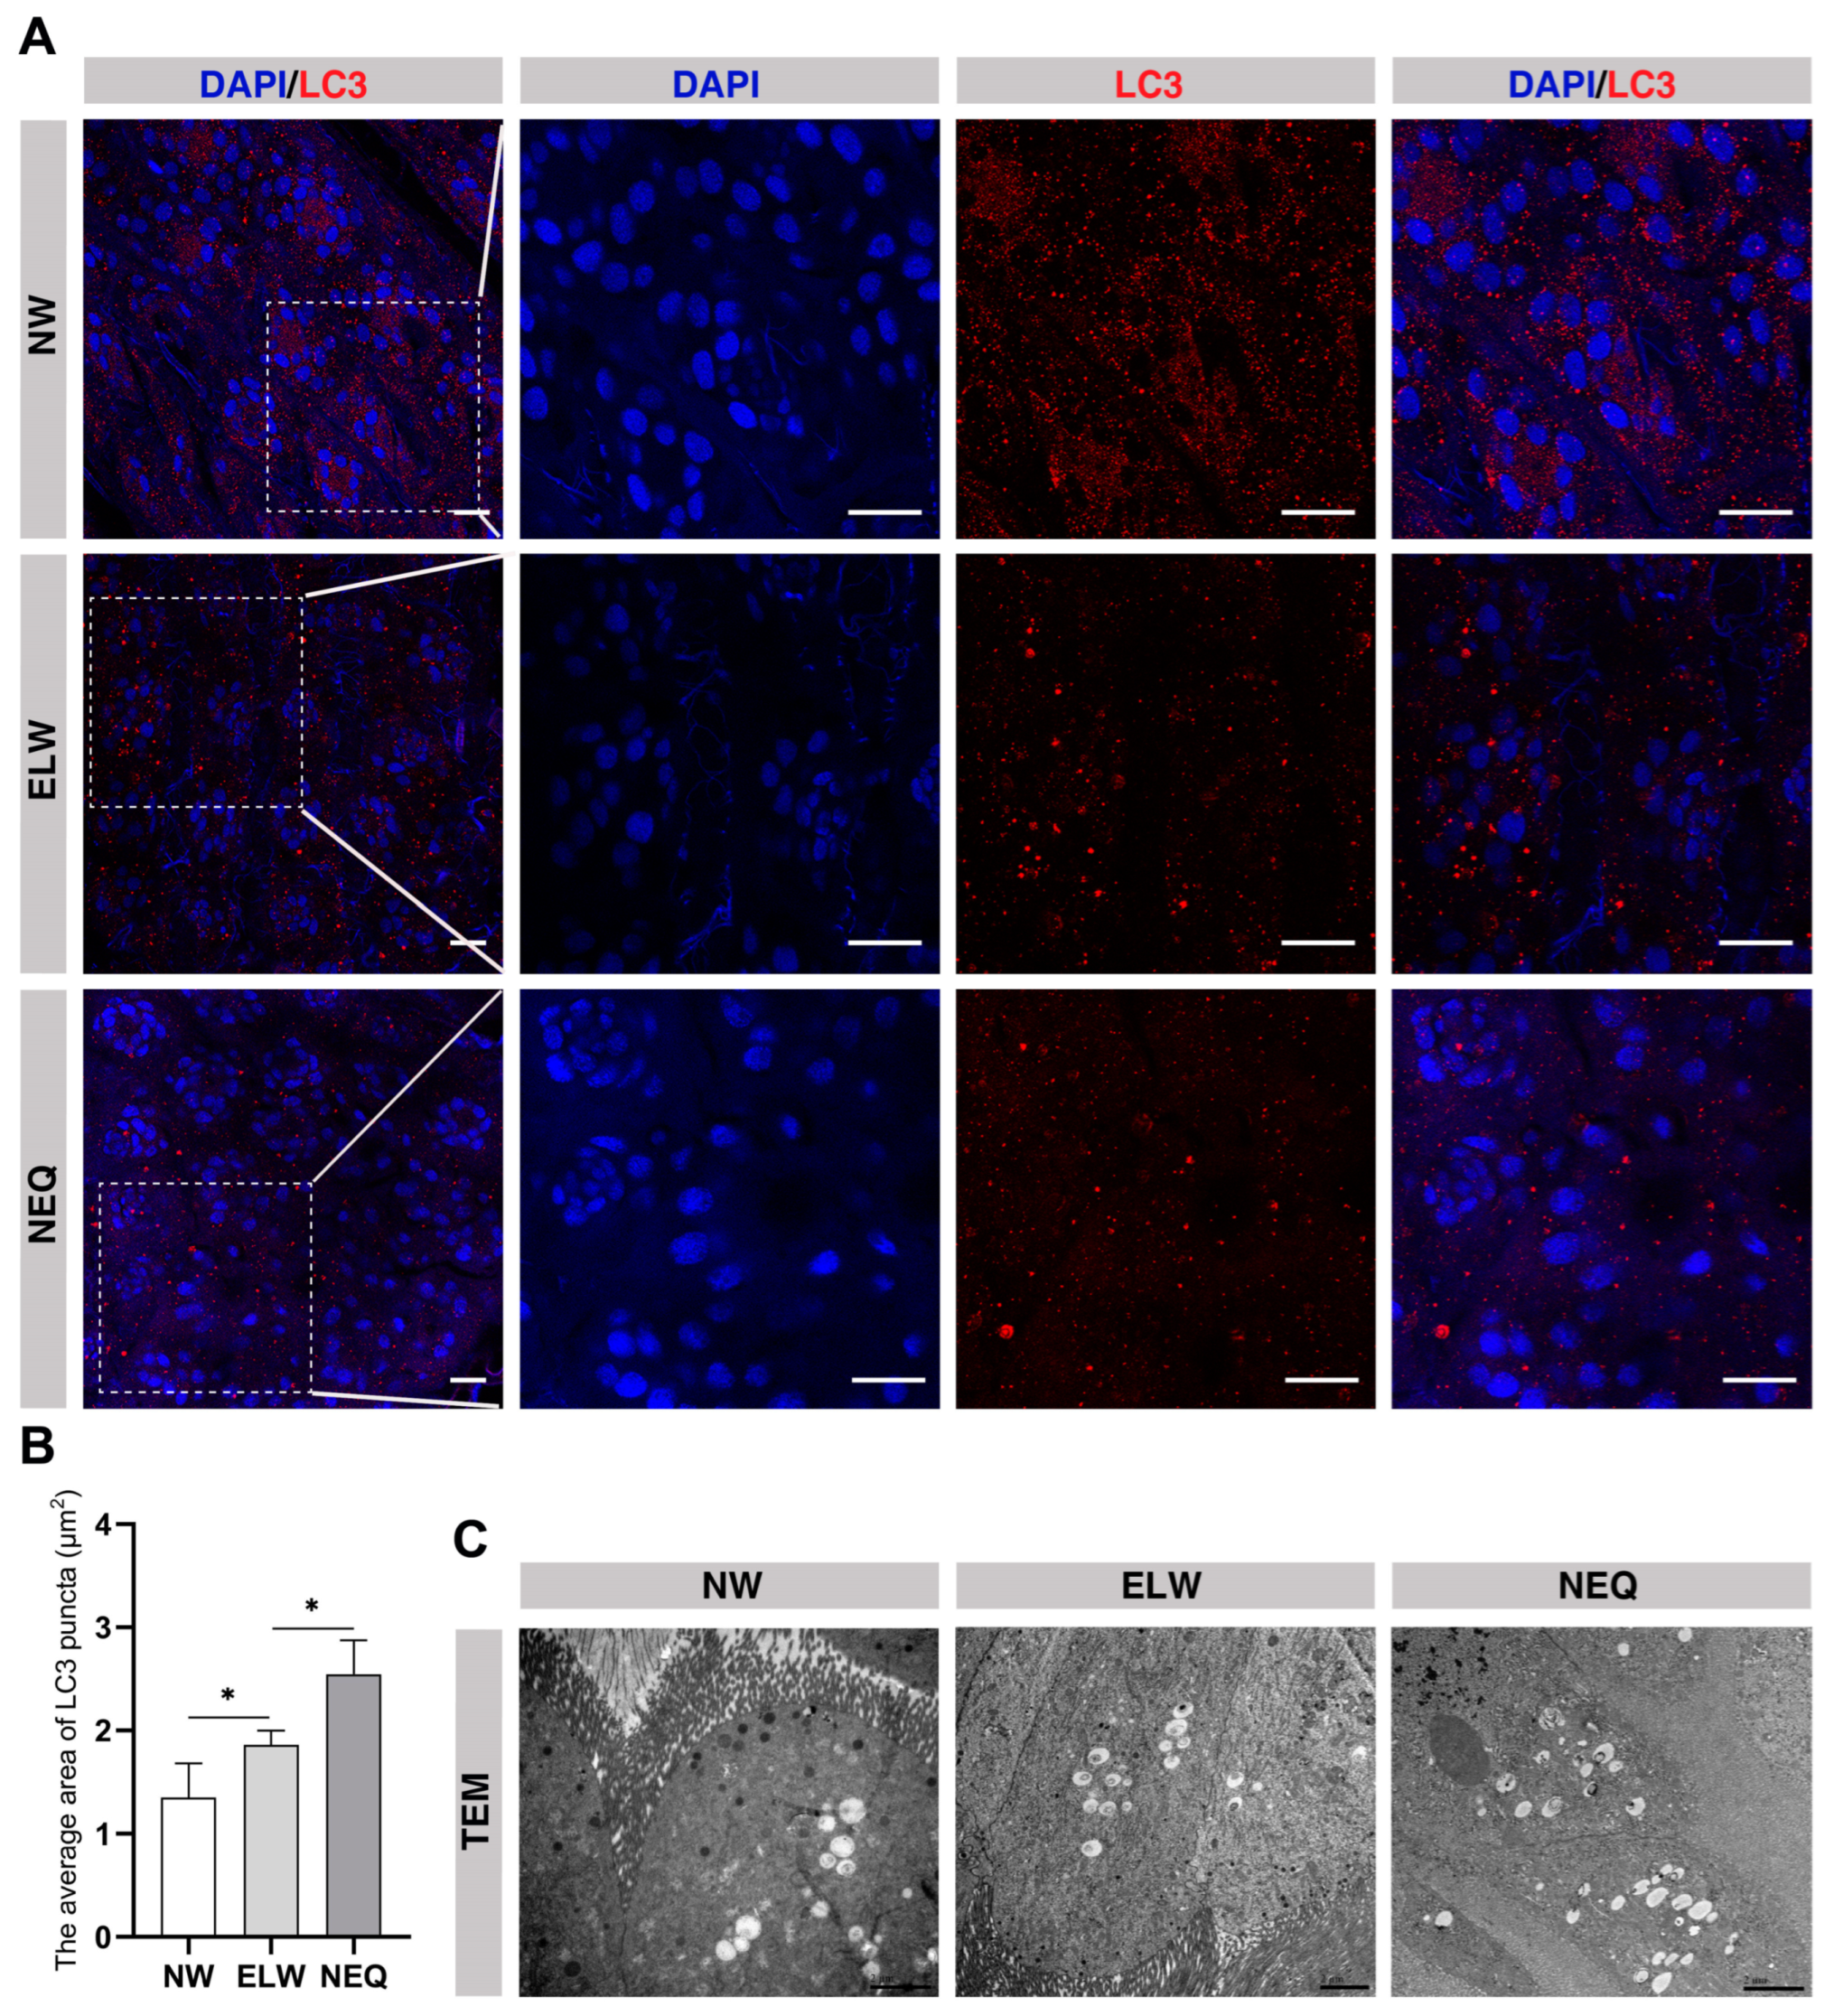
2.4. Autophagy Is Activated in the Midgut of ELWs
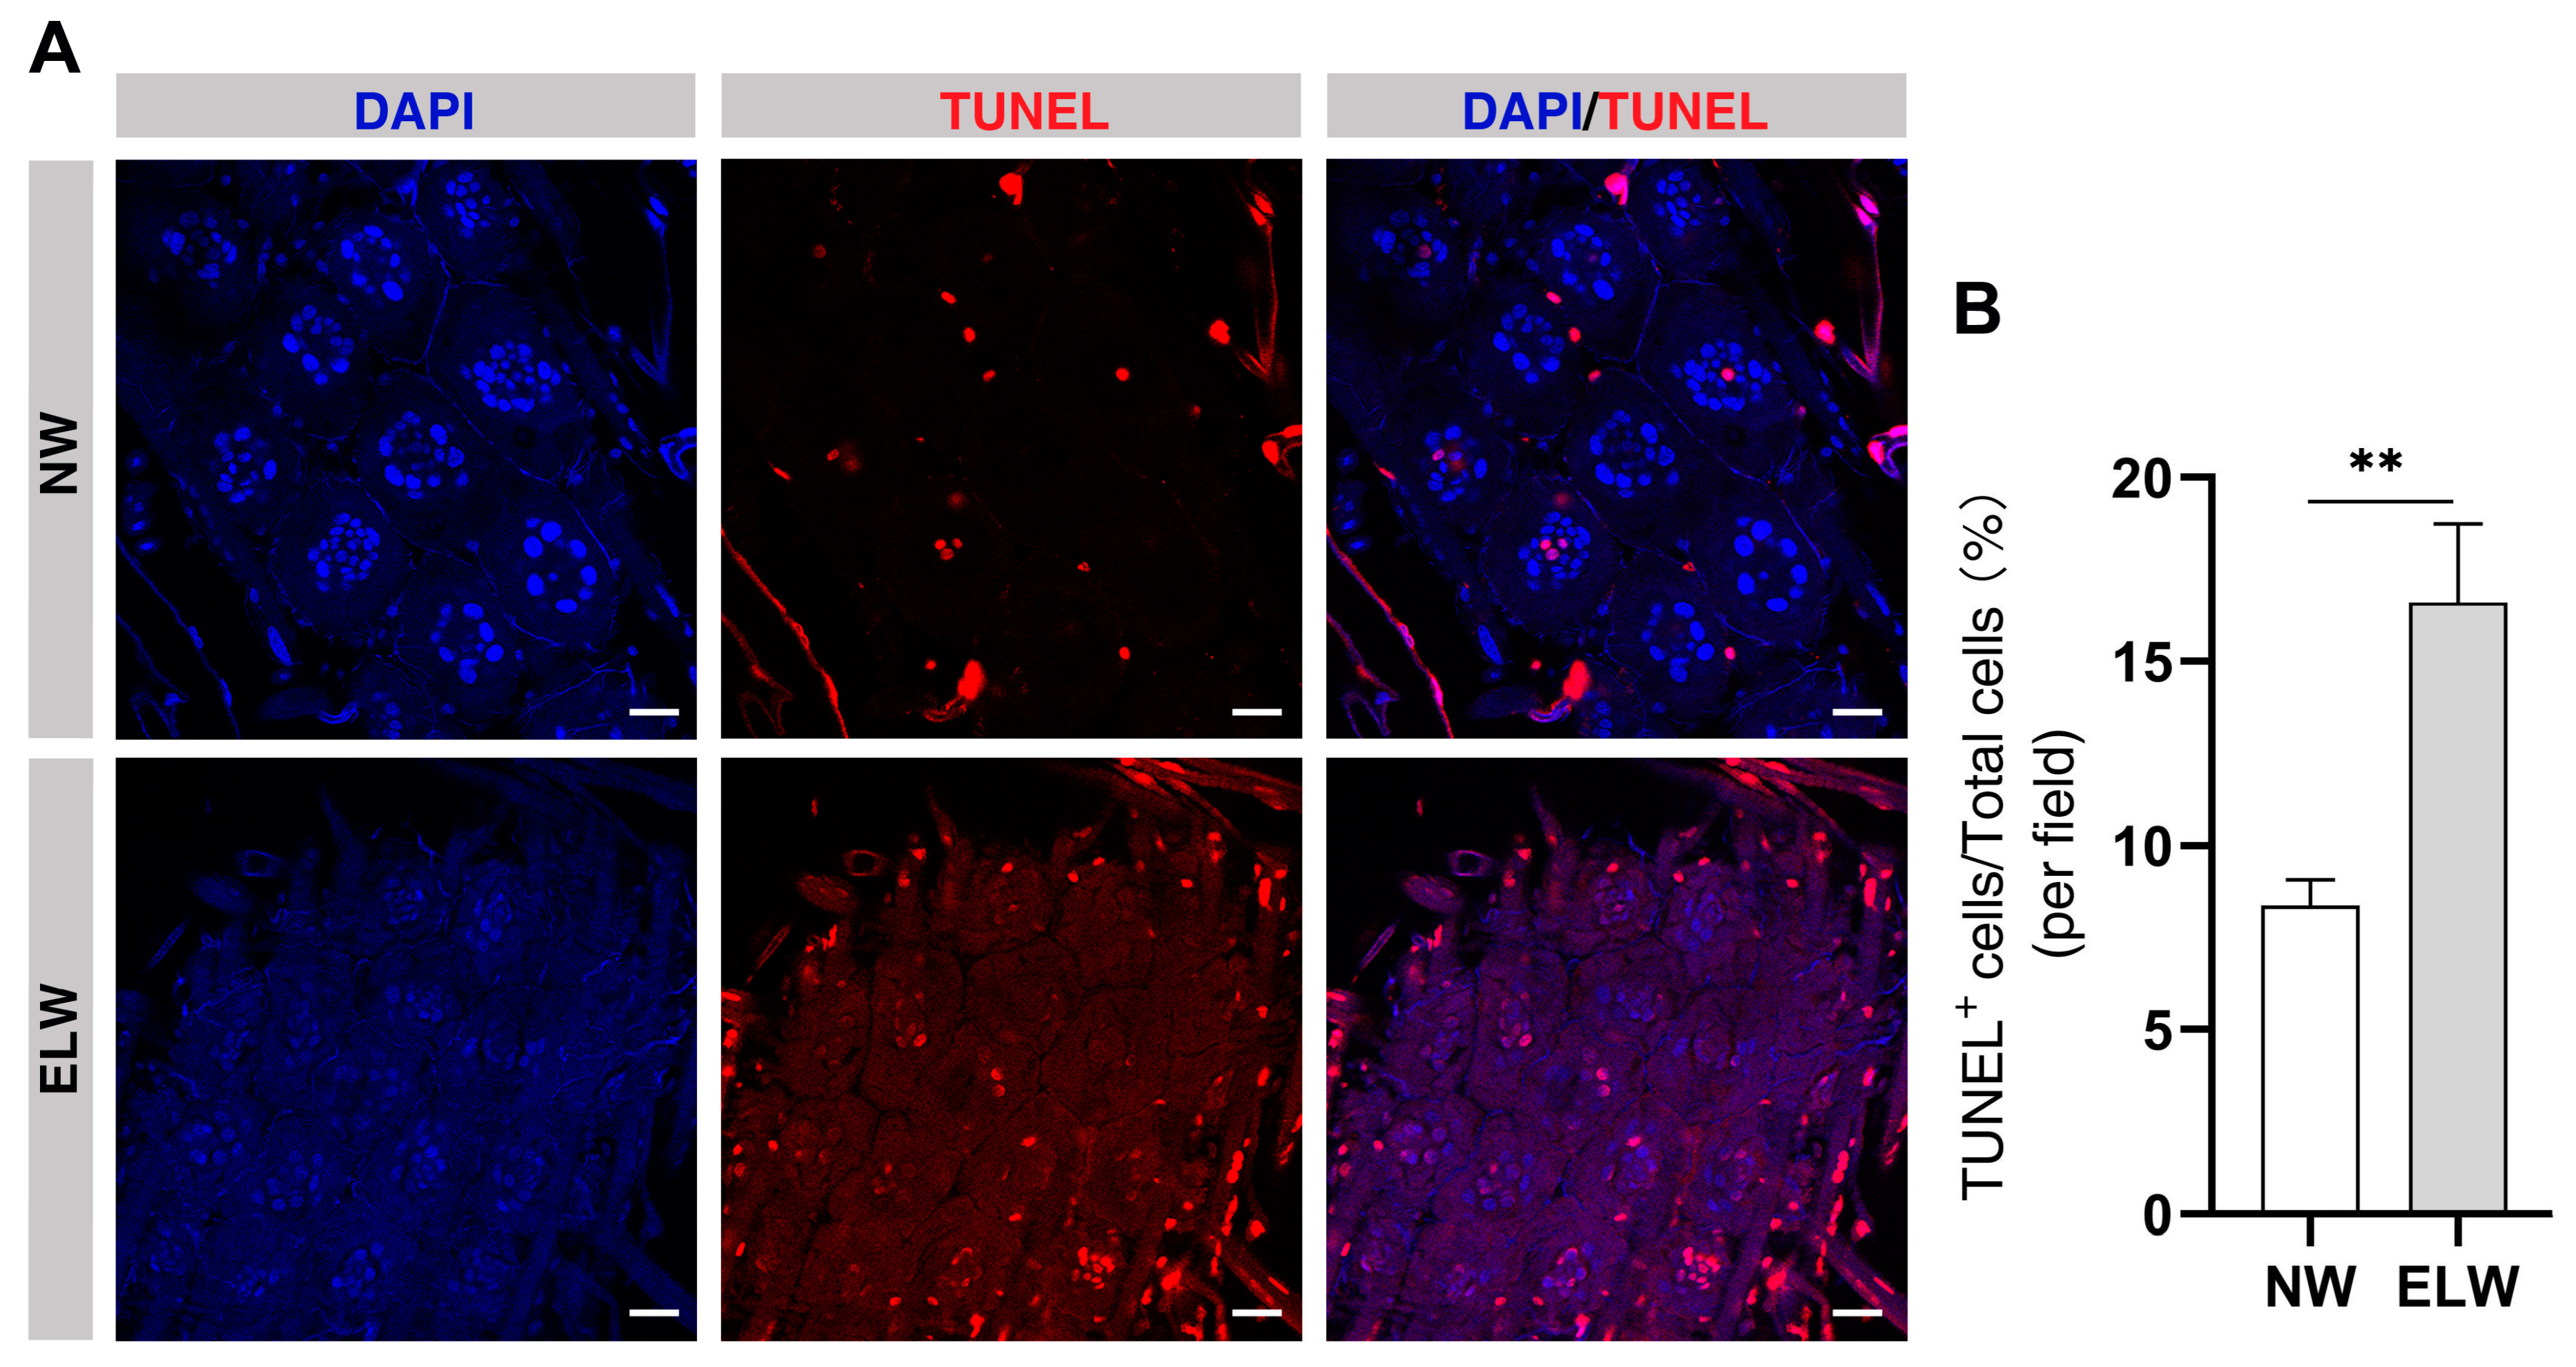
2.5. Autophagy-Induced Cell Death Is Increased in the Midguts of ELWs
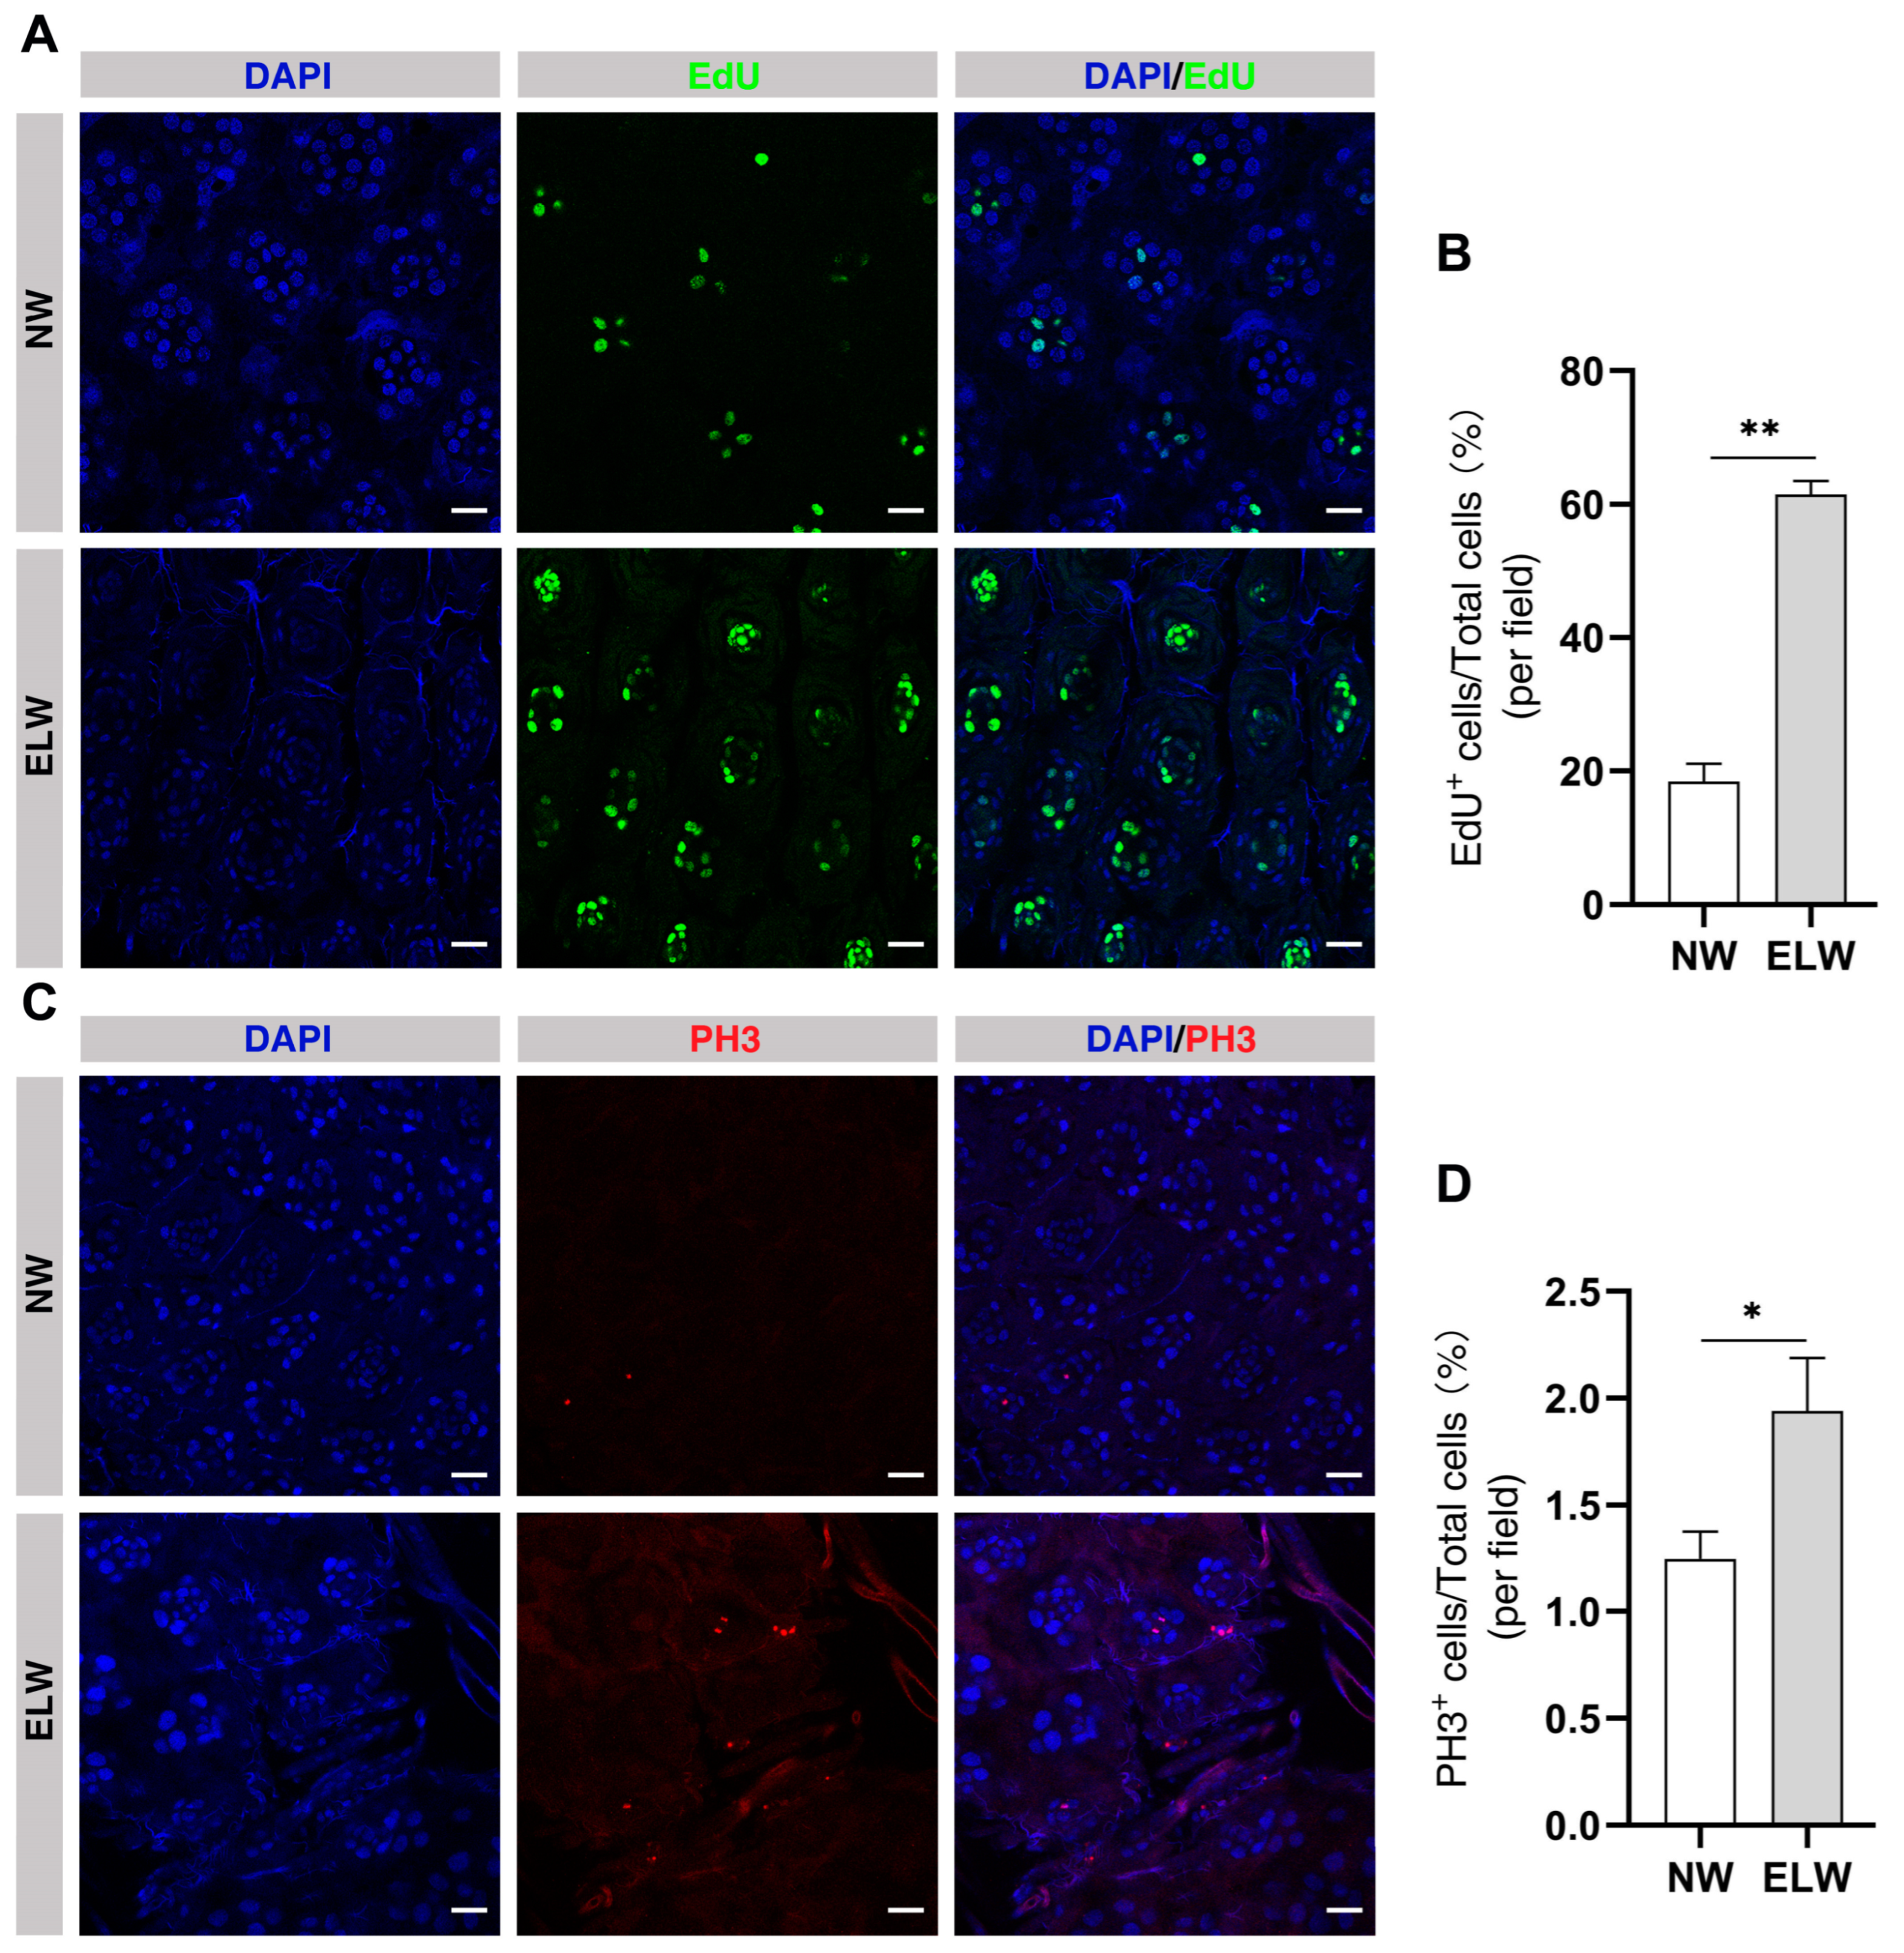
2.6. Cell Proliferation Is Significantly Increased in the Midguts of ELWs
2.7. The Intestinal Cell Proliferation of Honey Bee Larvae Is Influenced by the Nutritional Level
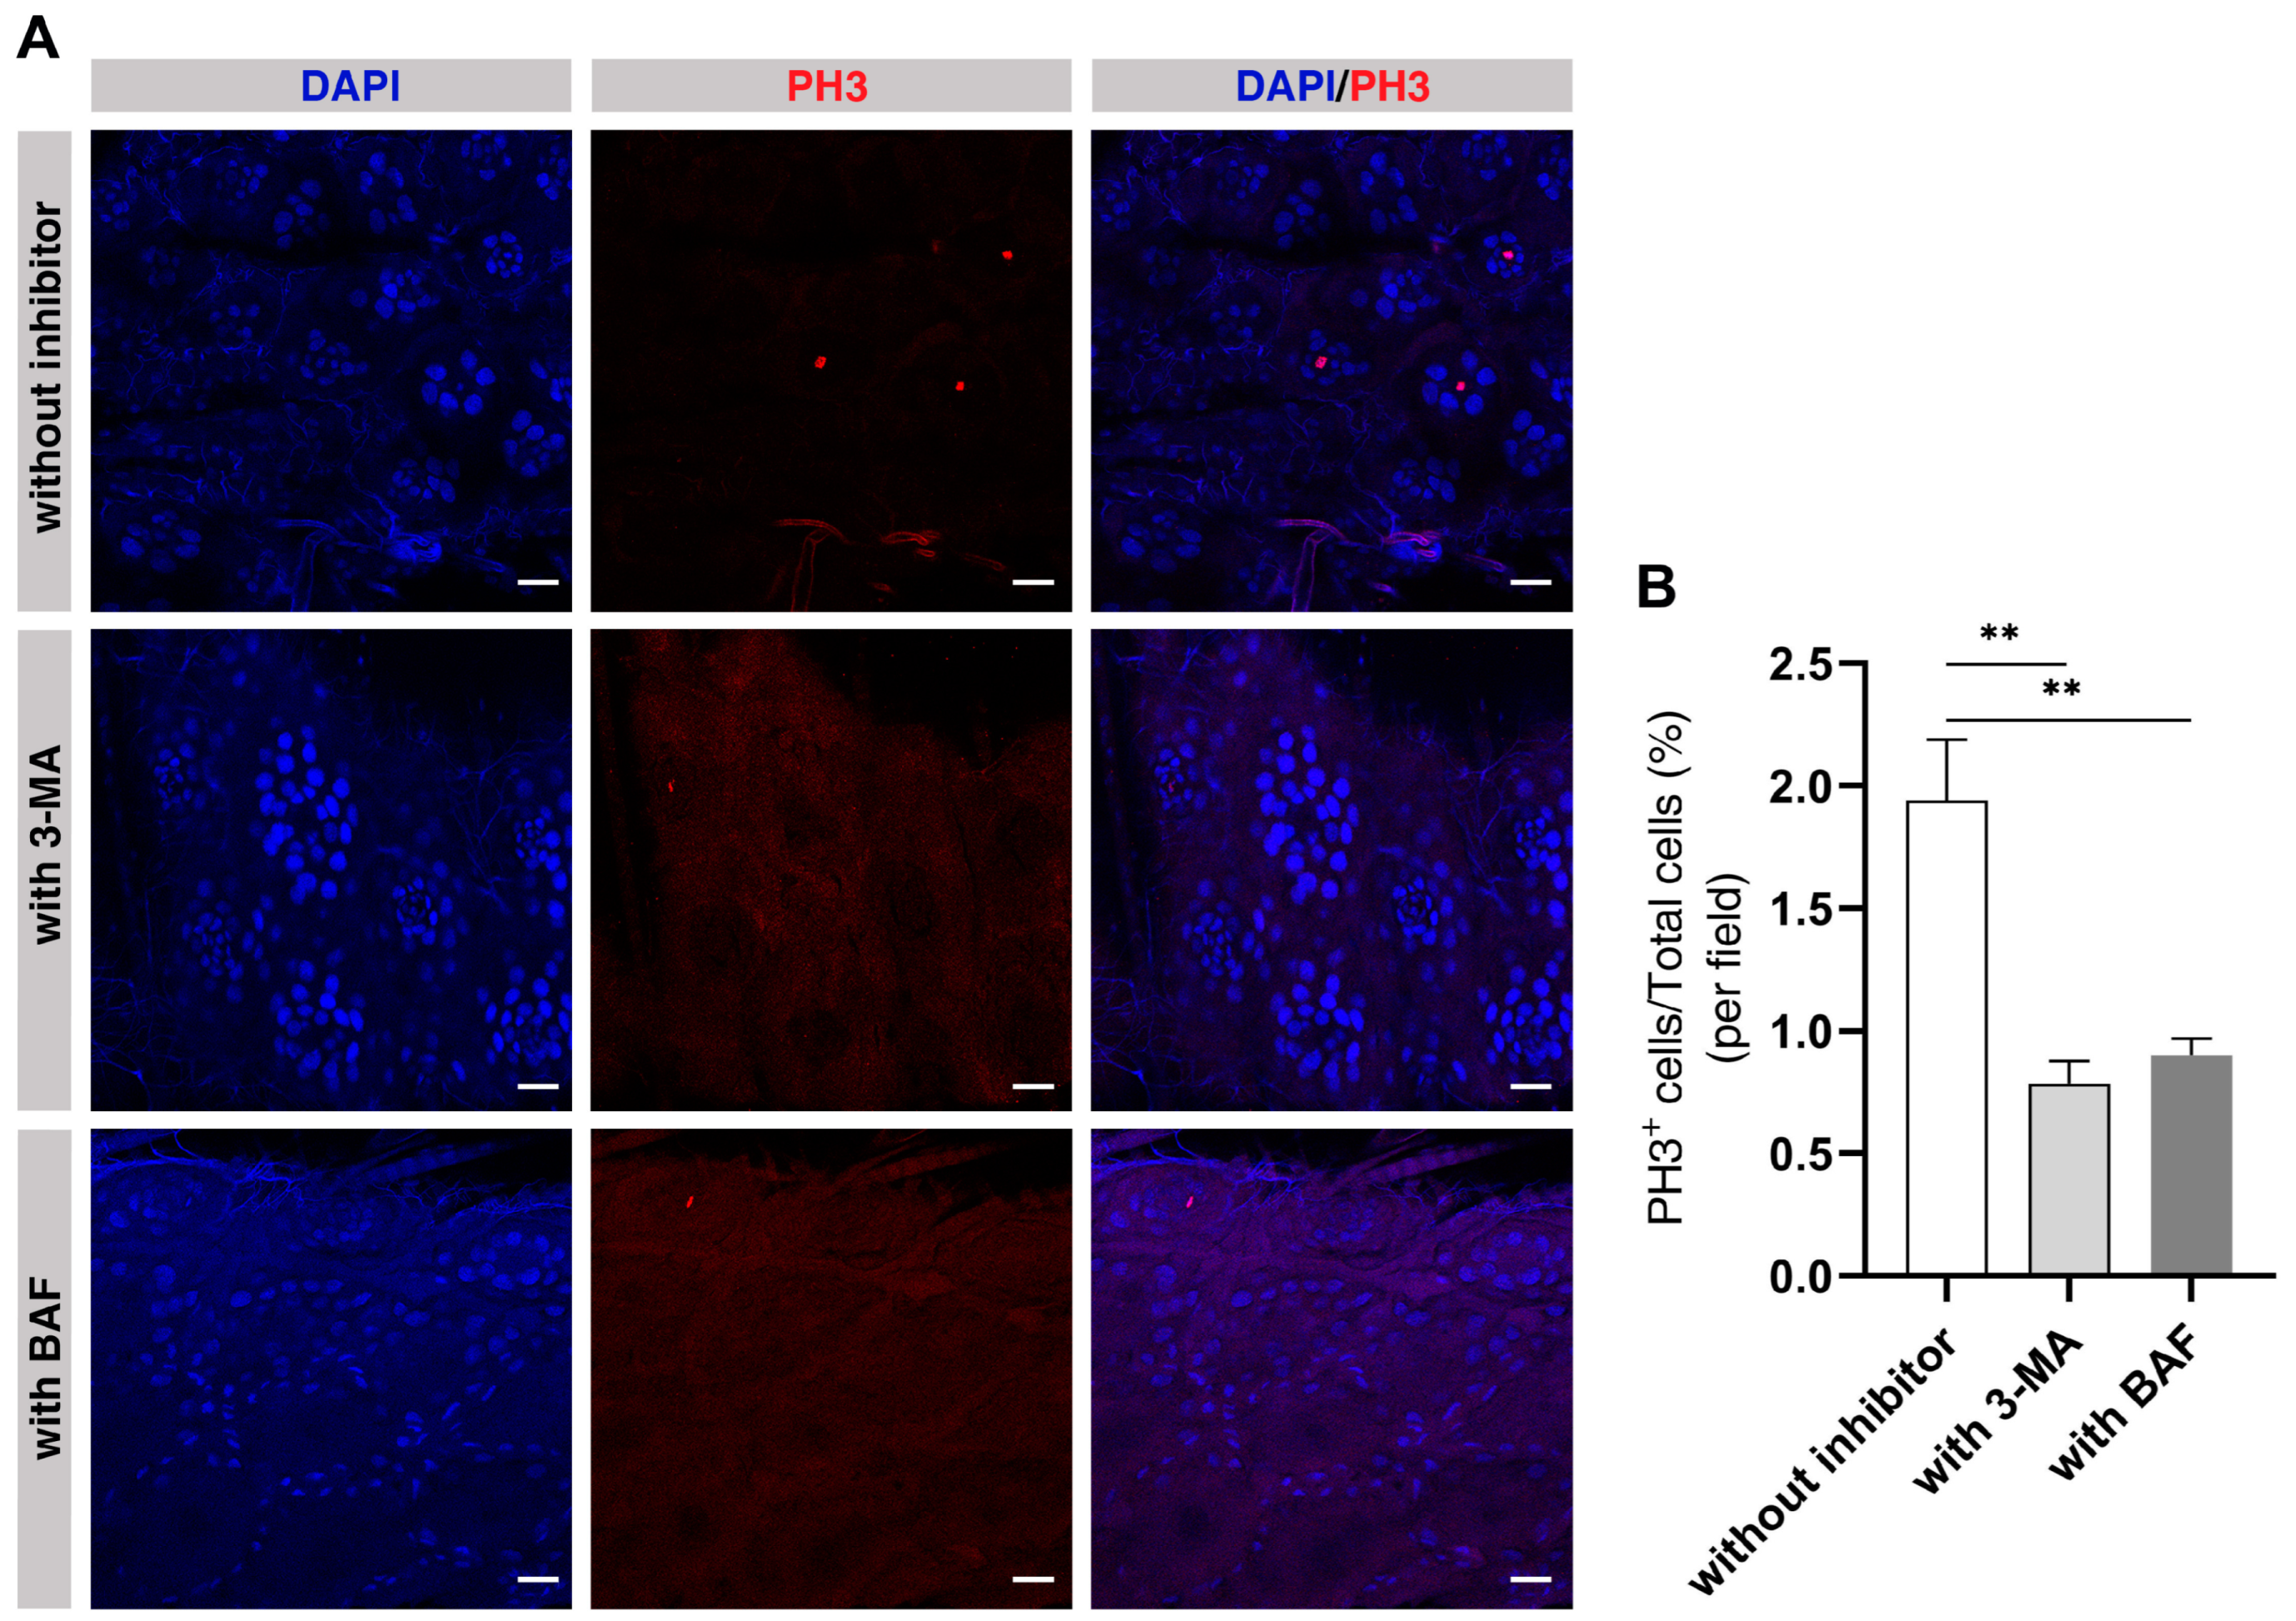
2.8. Autophagy Is Required in the Midguts of ELWs during Phenotypic Plasticity Change
3. Discussion
4. Materials and Methods
4.1. Honey Bees
4.2. RNA Sequencing (RNA-Seq)
4.3. RNA-Seq Data Analysis
4.4. Protein-Protein Interaction Network Analysis
4.5. Quantitative Real-Time PCR (qRT-PCR)
4.6. Rearing of Honey Bee Larvae with RJ and without RJ under Laboratory Conditions
4.7. Immunostaining and Fluorescence Microscopy
4.8. EdU Labeling of Proliferation Cell
4.9. Transmission Electron Microscopy (TEM)
4.10. TUNEL Staining
4.11. Effects of Autophagy Inhibitors on Cell Proliferation of ELWs’ Midguts
4.12. Statistical Analysis
5. Conclusions
Supplementary Materials
Author Contributions
Funding
Institutional Review Board Statement
Informed Consent Statement
Data Availability Statement
Acknowledgments
Conflicts of Interest
References
- Duncan, E.J.; Leask, M.P.; Dearden, P.K. Genome architecture facilitates phenotypic plasticity in the Honeybee (Apis mellifera). Mol. Biol. Evol. 2020, 37, 1964–1978. [Google Scholar] [CrossRef] [PubMed] [Green Version]
- Nijhout, H.F. Development and evolution of adaptive polyphenisms. Evol. Dev. 2003, 5, 9–18. [Google Scholar] [CrossRef] [PubMed]
- West-Eberhard, M.J. Developmental plasticity and the origin of species differences. Proc. Natl. Acad. Sci. USA 2005, 102 (Suppl. S1), 6543–6549. [Google Scholar] [CrossRef] [PubMed] [Green Version]
- Kucharski, R.; Maleszka, J.; Foret, S.; Maleszka, R. Nutritional control of reproductive status in honeybees via DNA methylation. Science 2008, 319, 1827–1830. [Google Scholar] [CrossRef] [Green Version]
- Oster, G.F.; Wilson, E.O. Caste and Ecology in the Social Insects; Princeton University Press: Princeton, NJ, USA, 1978. [Google Scholar]
- Seeley, T.D. Honeybee Ecology; Princeton University Press: Princeton, NJ, USA, 1985. [Google Scholar]
- Lyko, F.; Foret, S.; Kucharski, R.; Wolf, S.; Falckenhayn, C.; Maleszka, R. The honey bee epigenomes: Differential methylation of brain DNA in queens and workers. PLoS Biol. 2010, 8, e1000506. [Google Scholar] [CrossRef] [Green Version]
- Leimar, O.; Hartfelder, K.; Laubichler, M.D.; Page, R.E., Jr. Development and evolution of caste dimorphism in honeybees—A modeling approach. Ecol. Evol. 2012, 2, 3098–3109. [Google Scholar] [CrossRef]
- Kamakura, M. Royalactin induces queen differentiation in honeybees. Nature 2011, 473, 478–483. [Google Scholar] [CrossRef]
- Martin, N.; Hulbert, A.J.; Brenner, G.C.; Brown, S.H.J.; Mitchell, T.W.; Else, P.L. Honey bee caste lipidomics in relation to life-history stage and the long life of the queen. J. Exp. Biol. 2019, 222 Pt 24, jeb207043. [Google Scholar] [CrossRef]
- Slater, G.P.; Yocum, G.D.; Bowsher, J.H. Diet quantity influences caste determination in honeybees (Apis mellifera). Proc. Biol. Sci. 2020, 287, 20200614. [Google Scholar] [CrossRef]
- Pankiw, T.; Winston, M.L.; Fondrk, M.K.; Slessor, K.N. Selection on worker honeybee responses to queen pheromone (Apis mellifera L.). Naturwissenschaften 2000, 87, 487–490. [Google Scholar] [CrossRef]
- Hoover, S.E.; Keeling, C.I.; Winston, M.L.; Slessor, K.N. The effect of queen pheromones on worker honey bee ovary development. Naturwissenschaften 2003, 90, 477–480. [Google Scholar] [CrossRef] [PubMed]
- Mumoki, F.N.; Pirk, C.W.W.; Yusuf, A.A.; Crewe, R.M. Reproductive parasitism by worker honey bees suppressed by queens through regulation of worker mandibular secretions. Sci. Rep. 2018, 8, 7701. [Google Scholar] [CrossRef] [Green Version]
- Mattila, H.R.; Reeve, H.K.; Smith, M.L. Promiscuous honey bee queens increase colony productivity by suppressing worker selfishness. Curr. Biol. 2012, 22, 2027–2031. [Google Scholar] [CrossRef] [PubMed] [Green Version]
- Ronai, I.; Oldroyd, B.P.; Vergoz, V. Queen pheromone regulates programmed cell death in the honey bee worker ovary. Insect Mol. Biol. 2016, 25, 646–652. [Google Scholar] [CrossRef] [PubMed]
- Velthuis, H. Ovarian development in Apis mellifera worker bees. Entomol. Exp. Appl. 1970, 13, 377–394. [Google Scholar] [CrossRef]
- Duncan, E.J.; Hyink, O.; Dearden, P.K. Notch signalling mediates reproductive constraint in the adult worker honeybee. Nat. Commun. 2016, 7, 12427. [Google Scholar] [CrossRef] [Green Version]
- Hoover, S.E.; Higo, H.A.; Winston, M.L. Worker honey bee ovary development: Seasonal variation and the influence of larval and adult nutrition. J. Comp. Physiol. B 2006, 176, 55–63. [Google Scholar] [CrossRef]
- Cardoso-Junior, C.A.M.; Oldroyd, B.P.; Ronai, I. Vitellogenin expression in the ovaries of adult honeybee workers provides insights into the evolution of reproductive and social traits. Insect Mol. Biol. 2021, 30, 277–286. [Google Scholar] [CrossRef]
- Yang, W.; Tian, Y.; Han, M.; Miao, X. Longevity extension of worker honey bees (Apis mellifera) by royal jelly: Optimal dose and active ingredient. PeerJ 2017, 5, e3118. [Google Scholar] [CrossRef] [Green Version]
- Koywiwattrakul, P.; Sittipraneed, S. Expression of vitellogenin and transferrin in activated ovaries of worker honey bees, Apis mellifera. Biochem. Genet. 2009, 47, 19–26. [Google Scholar] [CrossRef]
- Li, R.; Xiao, Y.; Li, K.; Tian, L. Transcription and Post-translational Regulation of Autophagy in Insects. Front. Physiol. 2022, 13, 825202. [Google Scholar] [CrossRef] [PubMed]
- Klionsky, D.J.; Abdel-Aziz, A.K.; Abdelfatah, S.; Abdellatif, M.; Abdoli, A.; Abel, S.; Abeliovich, H.; Abildgaard, M.H.; Abudu, Y.P.; Acevedo-Arozena, A.; et al. Guidelines for the use and interpretation of assays for monitoring autophagy (4th edition). Autophagy 2021, 17, 1–382. [Google Scholar] [CrossRef] [PubMed]
- Li, Z.; Lyu, Z.; Ye, Q.; Cheng, J.; Wang, C.; Lin, T. Cloning, expression analysis, 20-hydroxyecdysone induction, and RNA interference study of autophagy-related gene 8 from Heortia vitessoides Moore. Insects 2020, 11, 245. [Google Scholar] [CrossRef] [Green Version]
- Lee, J.H.; Jo, Y.H.; Patnaik, B.B.; Park, K.B.; Tindwa, H.; Seo, G.W.; Chandrasekar, R.; Lee, Y.S.; Han, Y.S. Cloning, expression analysis, and RNA interference study of a HORMA domain containing autophagy-related gene 13 (ATG13) from the coleopteran beetle, Tenebrio molitor. Front. Physiol. 2015, 6, 180. [Google Scholar] [CrossRef] [PubMed] [Green Version]
- Mizushima, N.; Yoshimori, T.; Ohsumi, Y. The role of Atg proteins in autophagosome formation. Annu. Rev. Cell Dev. Biol. 2011, 27, 107–132. [Google Scholar] [CrossRef] [PubMed]
- Mizushima, N. Autophagy: Process and function. Genes Dev. 2007, 21, 2861–2873. [Google Scholar] [CrossRef] [Green Version]
- Guo, T.; Nan, Z.; Miao, C.; Jin, X.; Yang, W.; Wang, Z.; Tu, Y.; Bao, H.; Lyu, J.; Zheng, H.; et al. The autophagy-related gene Atg101 in Drosophila regulates both neuron and midgut homeostasis. J. Biol. Chem. 2019, 294, 5666–5676. [Google Scholar] [CrossRef]
- Franzetti, E.; Huang, Z.J.; Shi, Y.X.; Xie, K.; Deng, X.J.; Li, J.P.; Li, Q.R.; Yang, W.Y.; Zeng, W.N.; Casartelli, M.; et al. Autophagy precedes apoptosis during the remodeling of silkworm larval midgut. Apoptosis 2012, 17, 305–324. [Google Scholar] [CrossRef]
- Sumithra, P.; Britto, C.P.; Krishnan, M. Modes of cell death in the pupal perivisceral fat body tissue of the silkworm Bombyx mori L. Cell Tissue Res. 2010, 339, 349–358. [Google Scholar] [CrossRef]
- Santos, D.E.; Azevedo, D.O.; Campos, L.A.; Zanuncio, J.C.; Serrao, J.E. Melipona quadrifasciata (Hymenoptera: Apidae) fat body persists through metamorphosis with a few apoptotic cells and an increased autophagy. Protoplasma 2015, 252, 619–627. [Google Scholar] [CrossRef]
- Malta, J.; Heerman, M.; Weng, J.L.; Fernandes, K.M.; Martins, G.F.; Ramalho-Ortigao, M. Midgut morphological changes and autophagy during metamorphosis in sand flies. Cell Tissue Res. 2017, 368, 513–529. [Google Scholar] [CrossRef] [PubMed]
- Gunay, B.; Goncu, E. Role of autophagy in midgut stem cells of silkworm Bombyx mori, during larval-pupal metamorphosis. Arch. Insect Biochem. Physiol. 2021, 108, e21832. [Google Scholar] [CrossRef] [PubMed]
- Poyraz Tinartas, E.; Goncu, E.; Koc, K. Apoptotic and autophagic characteristics of perivisceral fat body remodeling of the greater wax moth Galleria mellonella and effects of juvenile hormone analog, fenoxycarb, on these processes. Arch. Insect Biochem. Physiol. 2021, 107, e21780. [Google Scholar] [CrossRef] [PubMed]
- Goncalves, W.G.; Fernandes, K.M.; Santana, W.C.; Martins, G.F.; Zanuncio, J.C.; Serrao, J.E. Post-embryonic changes in the hindgut of honeybee Apis mellifera workers: Morphology, cuticle deposition, apoptosis, and cell proliferation. Dev. Biol. 2017, 431, 194–204. [Google Scholar] [CrossRef]
- Senos Demarco, R.; Uyemura, B.S.; Jones, D.L. EGFR signaling stimulates autophagy to regulate stem cell maintenance and lipid homeostasis in the Drosophila testis. Cell Rep. 2020, 30, 1101–1116.e5. [Google Scholar] [CrossRef] [Green Version]
- Losinno, A.D.; Martinez, S.J.; Labriola, C.A.; Carrillo, C.; Romano, P.S. Induction of autophagy increases the proteolytic activity of reservosomes during Trypanosoma cruzi metacyclogenesis. Autophagy 2021, 17, 439–456. [Google Scholar] [CrossRef]
- Liang, Q.; Luo, Z.; Zeng, J.; Chen, W.; Foo, S.S.; Lee, S.A.; Ge, J.; Wang, S.; Goldman, S.A.; Zlokovic, B.V.; et al. Zika virus NS4A and NS4B proteins deregulate Akt-mTOR signaling in human fetal neural stem cells to Inhibit neurogenesis and Induce autophagy. Cell Stem Cell 2016, 19, 663–671. [Google Scholar] [CrossRef] [Green Version]
- Cicchini, M.; Karantza, V.; Xia, B. Molecular pathways: Autophagy in cancer—A matter of timing and context. Clin. Cancer Res. 2015, 21, 498–504. [Google Scholar] [CrossRef] [Green Version]
- Panek, J.; Paris, L.; Roriz, D.; Mone, A.; Dubuffet, A.; Delbac, F.; Diogon, M.; El Alaoui, H. Impact of the microsporidian Nosema ceranae on the gut epithelium renewal of the honeybee, Apis mellifera. J. Invertebr. Pathol. 2018, 159, 121–128. [Google Scholar] [CrossRef]
- El-Saad, A.M.; Kheirallah, D.A.; El-Samad, L.M. Biochemical and histological biomarkers in the midgut of Apis mellifera from polluted environment at Beheira Governorate, Egypt. Environ. Sci. Pollut. Res. Int. 2017, 24, 3181–3193. [Google Scholar] [CrossRef]
- Jiang, H.; Edgar, B.A. Intestinal stem cell function in Drosophila and mice. Curr. Opin. Genet. Dev. 2012, 22, 354–360. [Google Scholar] [CrossRef] [PubMed] [Green Version]
- Zhu, S.Q.; Zhang, Y.J.; Abbas, M.N.; Hao, X.W.; Zhao, Y.Z.; Liang, H.H.; Cui, H.J.; Yang, L.Q. Hedgehog promotes cell proliferation in the midgut of silkworm, Bombyx mori. Insect Sci. 2020, 27, 697–707. [Google Scholar] [CrossRef] [PubMed]
- Ohlstein, B.; Spradling, A. The adult Drosophila posterior midgut is maintained by pluripotent stem cells. Nature 2006, 439, 470–474. [Google Scholar] [CrossRef] [PubMed]
- Ren, F.; Wang, B.; Yue, T.; Yun, E.Y.; Ip, Y.T.; Jiang, J. Hippo signaling regulates Drosophila intestine stem cell proliferation through multiple pathways. Proc. Natl. Acad. Sci. USA 2010, 107, 21064–21069. [Google Scholar] [CrossRef] [Green Version]
- Micchelli, C.A.; Perrimon, N. Evidence that stem cells reside in the adult Drosophila midgut epithelium. Nature 2006, 439, 475–479. [Google Scholar] [CrossRef]
- Franzetti, E.; Romanelli, D.; Caccia, S.; Cappellozza, S.; Congiu, T.; Rajagopalan, M.; Grimaldi, A.; de Eguileor, M.; Casartelli, M.; Tettamanti, G. The midgut of the silkmoth Bombyx mori is able to recycle molecules derived from degeneration of the larval midgut epithelium. Cell Tissue Res 2015, 361, 509–528. [Google Scholar] [CrossRef]
- Ward, K.N.; Coleman, J.L.; Clinnin, K.; Fahrbach, S.; Rueppell, O. Age, caste, and behavior determine the replicative activity of intestinal stem cells in honeybees (Apis mellifera L.). Exp. Gerontol. 2008, 43, 530–537. [Google Scholar] [CrossRef]
- Liu, J.; Li, Y.; Gao, N.; Ji, J.; He, Q. Calcium/calmodulin-dependent protein kinase IV regulates vascular autophagy and insulin signaling through Akt/mTOR/CREB pathway in ob/ob mice. J. Physiol. Biochem. 2022, 78, 199–211. [Google Scholar] [CrossRef]
- Waghela, B.N.; Vaidya, F.U.; Ranjan, K.; Chhipa, A.S.; Tiwari, B.S.; Pathak, C. AGE-RAGE synergy influences programmed cell death signaling to promote cancer. Mol. Cell. Biochem. 2021, 476, 585–598. [Google Scholar] [CrossRef]
- Gao, J.W.; He, W.B.; Xie, C.M.; Gao, M.; Feng, L.Y.; Liu, Z.Y.; Wang, J.F.; Huang, H.; Liu, P.M. Aldosterone enhances high phosphate-induced vascular calcification through inhibition of AMPK-mediated autophagy. J. Cell. Mol. Med. 2020, 24, 13648–13659. [Google Scholar] [CrossRef]
- Ouseph, M.M.; Huang, Y.; Banerjee, M.; Joshi, S.; MacDonald, L.; Zhong, Y.; Liu, H.; Li, X.; Xiang, B.; Zhang, G.; et al. Autophagy is induced upon platelet activation and is essential for hemostasis and thrombosis. Blood 2015, 126, 1224–1233. [Google Scholar] [CrossRef] [PubMed] [Green Version]
- Scatozza, F.; D’Arcangelo, D.; Giampietri, C.; Facchiano, F.; Facchiano, A. Melanogenesis and autophagy in melanoma. Melanoma. Res. 2020, 30, 530–531. [Google Scholar] [CrossRef] [PubMed]
- Sousa, C.M.; Biancur, D.E.; Wang, X.; Halbrook, C.J.; Sherman, M.H.; Zhang, L.; Kremer, D.; Hwang, R.F.; Witkiewicz, A.K.; Ying, H.; et al. Pancreatic stellate cells support tumour metabolism through autophagic alanine secretion. Nature 2016, 536, 479–483. [Google Scholar] [CrossRef] [PubMed] [Green Version]
- Qureshi-Baig, K.; Kuhn, D.; Viry, E.; Pozdeev, V.I.; Schmitz, M.; Rodriguez, F.; Ullmann, P.; Koncina, E.; Nurmik, M.; Frasquilho, S.; et al. Hypoxia-induced autophagy drives colorectal cancer initiation and progression by activating the PRKC/PKC-EZR (ezrin) pathway. Autophagy 2020, 16, 1436–1452. [Google Scholar] [CrossRef] [PubMed] [Green Version]
- Mishra, S.K.; Gao, Y.G.; Deng, Y.; Chalfant, C.E.; Hinchcliffe, E.H.; Brown, R.E. CPTP: A sphingolipid transfer protein that regulates autophagy and inflammasome activation. Autophagy 2018, 14, 862–879. [Google Scholar] [CrossRef] [Green Version]
- Perez-Diaz, A.J.; Vazquez-Marin, B.; Vicente-Soler, J.; Prieto-Ruiz, F.; Soto, T.; Franco, A.; Cansado, J.; Madrid, M. cAMP-Protein kinase A and stress-activated MAP kinase signaling mediate transcriptional control of autophagy in fission yeast during glucose limitation or starvation. Autophagy 2022, Sep 26, 1–21. [Google Scholar] [CrossRef]
- Xin, W.; Yu, Y.; Ma, Y.; Gao, Y.; Xu, Y.; Chen, L.; Wan, Q. Thyroid-stimulating hormone stimulation downregulates autophagy and promotes apoptosis in chondrocytes. Endocr. J. 2017, 64, 749–757. [Google Scholar] [CrossRef] [Green Version]
- Yi, W.; Zhu, R.; Hou, X.; Wu, F.; Feng, R. Integrated Analysis Reveals S100a8/a9 Regulates Autophagy and Apoptosis through the MAPK and PI3K-AKT Signaling Pathway in the Early Stage of Myocardial Infarction. Cells 2022, 11, 1911. [Google Scholar] [CrossRef]
- Wu, S.Y.; Wu, H.T.; Wang, Y.C.; Chang, C.J.; Shan, Y.S.; Wu, S.R.; Chiu, Y.C.; Hsu, C.L.; Juan, H.F.; Lan, K.Y.; et al. Secretory autophagy promotes RAB37-mediated insulin secretion under glucose stimulation both in vitro and in vivo. Autophagy 2022, Sep 15, 1–19. [Google Scholar] [CrossRef]
- Zhang, L.; Lin, Q.; Feng, Y.; Fan, X.; Zou, F.; Yuan, D.Y.; Zeng, X.; Cao, H. Transcriptomic identification and expression of starch and sucrose metabolism genes in the seeds of Chinese chestnut (Castanea mollissima). J. Agric. Food. Chem. 2015, 63, 929–942. [Google Scholar] [CrossRef]
- Huang, M.; Lin, H.; Xu, C.; Yu, Q.; Wang, X.; Qin, J.G.; Chen, L.; Han, F.; Li, E. Growth, Metabolite, Antioxidative Capacity, Transcriptome, and the Metabolome Response to Dietary Choline Chloride in Pacific White Shrimp Litopenaeus vannamei. Animals 2020, 10, 2246. [Google Scholar] [CrossRef] [PubMed]
- Woscholski, R.; Marme, D. Dihydropyridine binding of the calcium channel complex from skeletal muscle is modulated by subunit interaction. Cell. Signal. 1992, 4, 209–218. [Google Scholar] [CrossRef] [PubMed]
- Wang, H.; Liu, Y.; Wang, D.; Xu, Y.; Dong, R.; Yang, Y.; Lv, Q.; Chen, X.; Zhang, Z. The Upstream Pathway of mTOR-Mediated Autophagy in Liver Diseases. Cells 2019, 8, 1597. [Google Scholar] [CrossRef]
- Ben-David, G.; Miller, E.; Steinhauer, J. Drosophila spermatid individualization is sensitive to temperature and fatty acid metabolism. Spermatogenesis 2015, 5, e1006089. [Google Scholar] [CrossRef] [Green Version]
- Chen, F.; Barkett, M.; Ram, K.T.; Quintanilla, A.; Hariharan, I.K. Biological characterization of Drosophila Rapgap1, a GTPase activating protein for Rap1. Proc. Natl. Acad. Sci. USA 1997, 94, 12485–12490. [Google Scholar] [CrossRef] [PubMed] [Green Version]
- Perez-Vale, K.Z.; Yow, K.D.; Gurley, N.J.; Greene, M.; Peifer, M. Rap1 regulates apical contractility to allow embryonic morphogenesis without tissue disruption and acts in part via Canoe-independent mechanisms. Mol. Biol. Cell 2023, 34, ar7. [Google Scholar] [CrossRef]
- Looi, C.K.; Hii, L.W.; Ngai, S.C.; Leong, C.O.; Mai, C.W. The Role of Ras-Associated Protein 1 (Rap1) in Cancer: Bad Actor or Good Player? Biomedicines 2020, 8, 334. [Google Scholar] [CrossRef]
- Kannangara, A.R.; Poole, D.M.; McEwan, C.M.; Youngs, J.C.; Weerasekara, V.K.; Thornock, A.M.; Lazaro, M.T.; Balasooriya, E.R.; Oh, L.M.; Soderblom, E.J.; et al. BioID reveals an ATG9A interaction with ATG13-ATG101 in the degradation of p62/SQSTM1-ubiquitin clusters. EMBO Rep. 2021, 22, e51136. [Google Scholar] [CrossRef]
- Yi, M.; Negishi, M.; Lee, S.J. Estrogen Sulfotransferase (SULT1E1): Its Molecular Regulation, Polymorphisms, and Clinical Perspectives. J. Pers. Med. 2021, 11, 194. [Google Scholar] [CrossRef]
- Han, L.; Ding, G.; Liu, Y.; Huang, J.; Wu, J. Characterization of Sphingomyelin Phosphodiesterase Expression in Bumblebee (Bombus lantschouensis). J. Insect Sci. 2018, 18, 20. [Google Scholar] [CrossRef]
- MacIver, B.; McCahill, A.; Pathirana, S.; Leaper, K.; Bownes, M. A putative sodium-dependent inorganic phosphate co-transporter from Drosophila melanogaster. Dev. Genes Evol. 2000, 210, 207–211. [Google Scholar] [CrossRef] [PubMed]
- Yu, P.L.; Rollins, J.A. The cAMP-dependent protein kinase A pathway perturbs autophagy and plays important roles in development and virulence of Sclerotinia sclerotiorum. Fungal Biol. 2022, 126, 20–34. [Google Scholar] [CrossRef] [PubMed]
- Bhattacharya, A.; Biswas, A.; Das, P.K. Identification of a protein kinase A regulatory subunit from Leishmania having importance in metacyclogenesis through induction of autophagy. Mol. Microbiol. 2012, 83, 548–564. [Google Scholar] [CrossRef] [PubMed]
- Goncalves, W.G.; Fernandes, K.M.; Santana, W.C.; Martins, G.F.; Zanuncio, J.C.; Serrao, J.E. Post-embryonic development of the Malpighian tubules in Apis mellifera (Hymenoptera) workers: Morphology, remodeling, apoptosis, and cell proliferation. Protoplasma 2018, 255, 585–599. [Google Scholar] [CrossRef]
- Billingsley, P.F. Endpolyploidy and digestion in the midgut of Rhodnius prolixus Stal (Hemiptera: Reduviidae). Ann. Trop. Med. Parasitol. 1989, 83, 93–99. [Google Scholar] [CrossRef]
- Lee, H.O.; Davidson, J.M.; Duronio, R.J. Endoreplication: Polyploidy with purpose. Genes Dev. 2009, 23, 2461–2477. [Google Scholar] [CrossRef] [Green Version]
- Traynor, K.S.; Le Conte, Y.; Page, R.E., Jr. Queen and young larval pheromones impact nursing and reproductive physiology of honey bee (Apis mellifera) workers. Behav. Ecol. Sociobiol. 2014, 68, 2059–2073. [Google Scholar] [CrossRef] [Green Version]
- Tan, K.; Liu, X.; Dong, S.; Wang, C.; Oldroyd, B.P. Pheromones affecting ovary activation and ovariole loss in the Asian honey bee Apis cerana. J. Insect Physiol. 2015, 74, 25–29. [Google Scholar] [CrossRef]
- Rangel, J.; Strauss, K.; Seedorf, K.; Hjelmen, C.E.; Johnston, J.S. Endopolyploidy changes with age-related polyethism in the honey bee, Apis mellifera. PLoS ONE 2015, 10, e0122208. [Google Scholar] [CrossRef] [Green Version]
- Neiman, M.; Beaton, M.J.; Hessen, D.O.; Jeyasingh, P.D.; Weider, L.J. Endopolyploidy as a potential driver of animal ecology and evolution. Biol. Rev. Camb. Philos. Soc. 2017, 92, 234–247. [Google Scholar] [CrossRef]
- Wu, C.Y.; Rolfe, P.A.; Gifford, D.K.; Fink, G.R. Control of transcription by cell size. PLoS Biol. 2010, 8, e1000523. [Google Scholar] [CrossRef] [PubMed] [Green Version]
- Palova, M.; Rucova, D.; Goga, M.; Kolarcik, V. Spatial and Temporal Patterns of Endopolyploidy in Mosses. Genes 2020, 12, 27. [Google Scholar] [CrossRef] [PubMed]
- Tanner, E.A.; Blute, T.A.; Brachmann, C.B.; McCall, K. Bcl-2 proteins and autophagy regulate mitochondrial dynamics during programmed cell death in the Drosophila ovary. Development 2011, 138, 327–338. [Google Scholar] [CrossRef] [PubMed] [Green Version]
- Hua, F.; Li, K.; Shang, S.; Wang, F.; Hu, Z. Immune Signaling and Autophagy Regulation. Adv. Exp. Med. Biol. 2019, 1206, 551–593. [Google Scholar] [CrossRef] [PubMed]
- Barth, J.M.; Szabad, J.; Hafen, E.; Kohler, K. Autophagy in Drosophila ovaries is induced by starvation and is required for oogenesis. Cell Death Differ. 2011, 18, 915–924. [Google Scholar] [CrossRef] [Green Version]
- O’Brien, L.E.; Soliman, S.S.; Li, X.; Bilder, D. Altered modes of stem cell division drive adaptive intestinal growth. Cell 2011, 147, 603–614. [Google Scholar] [CrossRef] [Green Version]
- Nadal, M.; Gold, S.E. The autophagy genes ATG8 and ATG1 affect morphogenesis and pathogenicity in Ustilago maydis. Mol. Plant Pathol. 2010, 11, 463–478. [Google Scholar] [CrossRef]
- Denton, D.; Shravage, B.; Simin, R.; Mills, K.; Berry, D.L.; Baehrecke, E.H.; Kumar, S. Autophagy, not apoptosis, is essential for midgut cell death in Drosophila. Curr. Biol. 2009, 19, 1741–1746. [Google Scholar] [CrossRef] [Green Version]
- Feng, M.; Fang, Y.; Li, J. Proteomic analysis of honeybee worker (Apis mellifera) hypopharyngeal gland development. BMC Genom. 2009, 10, 645. [Google Scholar] [CrossRef] [Green Version]
- Lourenco, A.P.; Mackert, A.; Cristino, A.D.; Simoes, Z.L.P. Validation of reference genes for gene expression studies in the honey bee, Apis mellifera, by quantitative real-time RT-PCR. Apidologie 2008, 39, 372–385. [Google Scholar] [CrossRef]
- Vandenberg, J.D.; Shimanuki, H. Technique for rearing worker honeybees in the laboratory. J. Apic. Res. 1987, 26, 90–97. [Google Scholar] [CrossRef]
- Li, Z.; Zhang, Y.; Han, L.; Shi, L.; Lin, X. Trachea-derived dpp controls adult midgut homeostasis in Drosophila. Dev. Cell 2013, 24, 133–143. [Google Scholar] [CrossRef] [PubMed] [Green Version]
- Chehrehasa, F.; Meedeniya, A.C.; Dwyer, P.; Abrahamsen, G.; Mackay-Sim, A. EdU, a new thymidine analogue for labelling proliferating cells in the nervous system. J. Neurosci. Methods 2009, 177, 122–130. [Google Scholar] [CrossRef] [PubMed] [Green Version]
- Wang, X.; Wu, R.; Liu, Y.; Zhao, Y.; Bi, Z.; Yao, Y.; Liu, Q.; Shi, H.; Wang, F.; Wang, Y. m(6)A mRNA methylation controls autophagy and adipogenesis by targeting Atg5 and Atg7. Autophagy 2020, 16, 1221–1235. [Google Scholar] [CrossRef]
- Chicote, J.; Yuste, V.J.; Boix, J.; Ribas, J. Cell Death Triggered by the Autophagy Inhibitory Drug 3-Methyladenine in Growing Conditions Proceeds With DNA Damage. Front. Pharmacol. 2020, 11, 580343. [Google Scholar] [CrossRef]
- Wang, L.L.; Wang, X.R.; Wei, X.M.; Huang, H.; Wu, J.X.; Chen, X.X.; Liu, S.S.; Wang, X.W. The autophagy pathway participates in resistance to tomato yellow leaf curl virus infection in whiteflies. Autophagy 2016, 12, 1560–1574. [Google Scholar] [CrossRef]


Disclaimer/Publisher’s Note: The statements, opinions and data contained in all publications are solely those of the individual author(s) and contributor(s) and not of MDPI and/or the editor(s). MDPI and/or the editor(s) disclaim responsibility for any injury to people or property resulting from any ideas, methods, instructions or products referred to in the content. |
© 2023 by the authors. Licensee MDPI, Basel, Switzerland. This article is an open access article distributed under the terms and conditions of the Creative Commons Attribution (CC BY) license (https://creativecommons.org/licenses/by/4.0/).
Share and Cite
Guo, Y.; Hu, R.; Li, N.; Li, N.; Wu, J.; Yu, H.; Tan, J.; Li, Z.; Xu, S. Autophagy Is Required to Sustain Increased Intestinal Cell Proliferation during Phenotypic Plasticity Changes in Honey Bee (Apis mellifera). Int. J. Mol. Sci. 2023, 24, 1926. https://doi.org/10.3390/ijms24031926
Guo Y, Hu R, Li N, Li N, Wu J, Yu H, Tan J, Li Z, Xu S. Autophagy Is Required to Sustain Increased Intestinal Cell Proliferation during Phenotypic Plasticity Changes in Honey Bee (Apis mellifera). International Journal of Molecular Sciences. 2023; 24(3):1926. https://doi.org/10.3390/ijms24031926
Chicago/Turabian StyleGuo, Yueqin, Ruoyang Hu, Naikang Li, Nannan Li, Jiangli Wu, Huimin Yu, Jing Tan, Zhouhua Li, and Shufa Xu. 2023. "Autophagy Is Required to Sustain Increased Intestinal Cell Proliferation during Phenotypic Plasticity Changes in Honey Bee (Apis mellifera)" International Journal of Molecular Sciences 24, no. 3: 1926. https://doi.org/10.3390/ijms24031926