
Pro- vs. Anti-Inflammatory Features of Monocyte Subsets in Glioma Patients
 , , , and
Abstract
:1. Introduction
2. Results
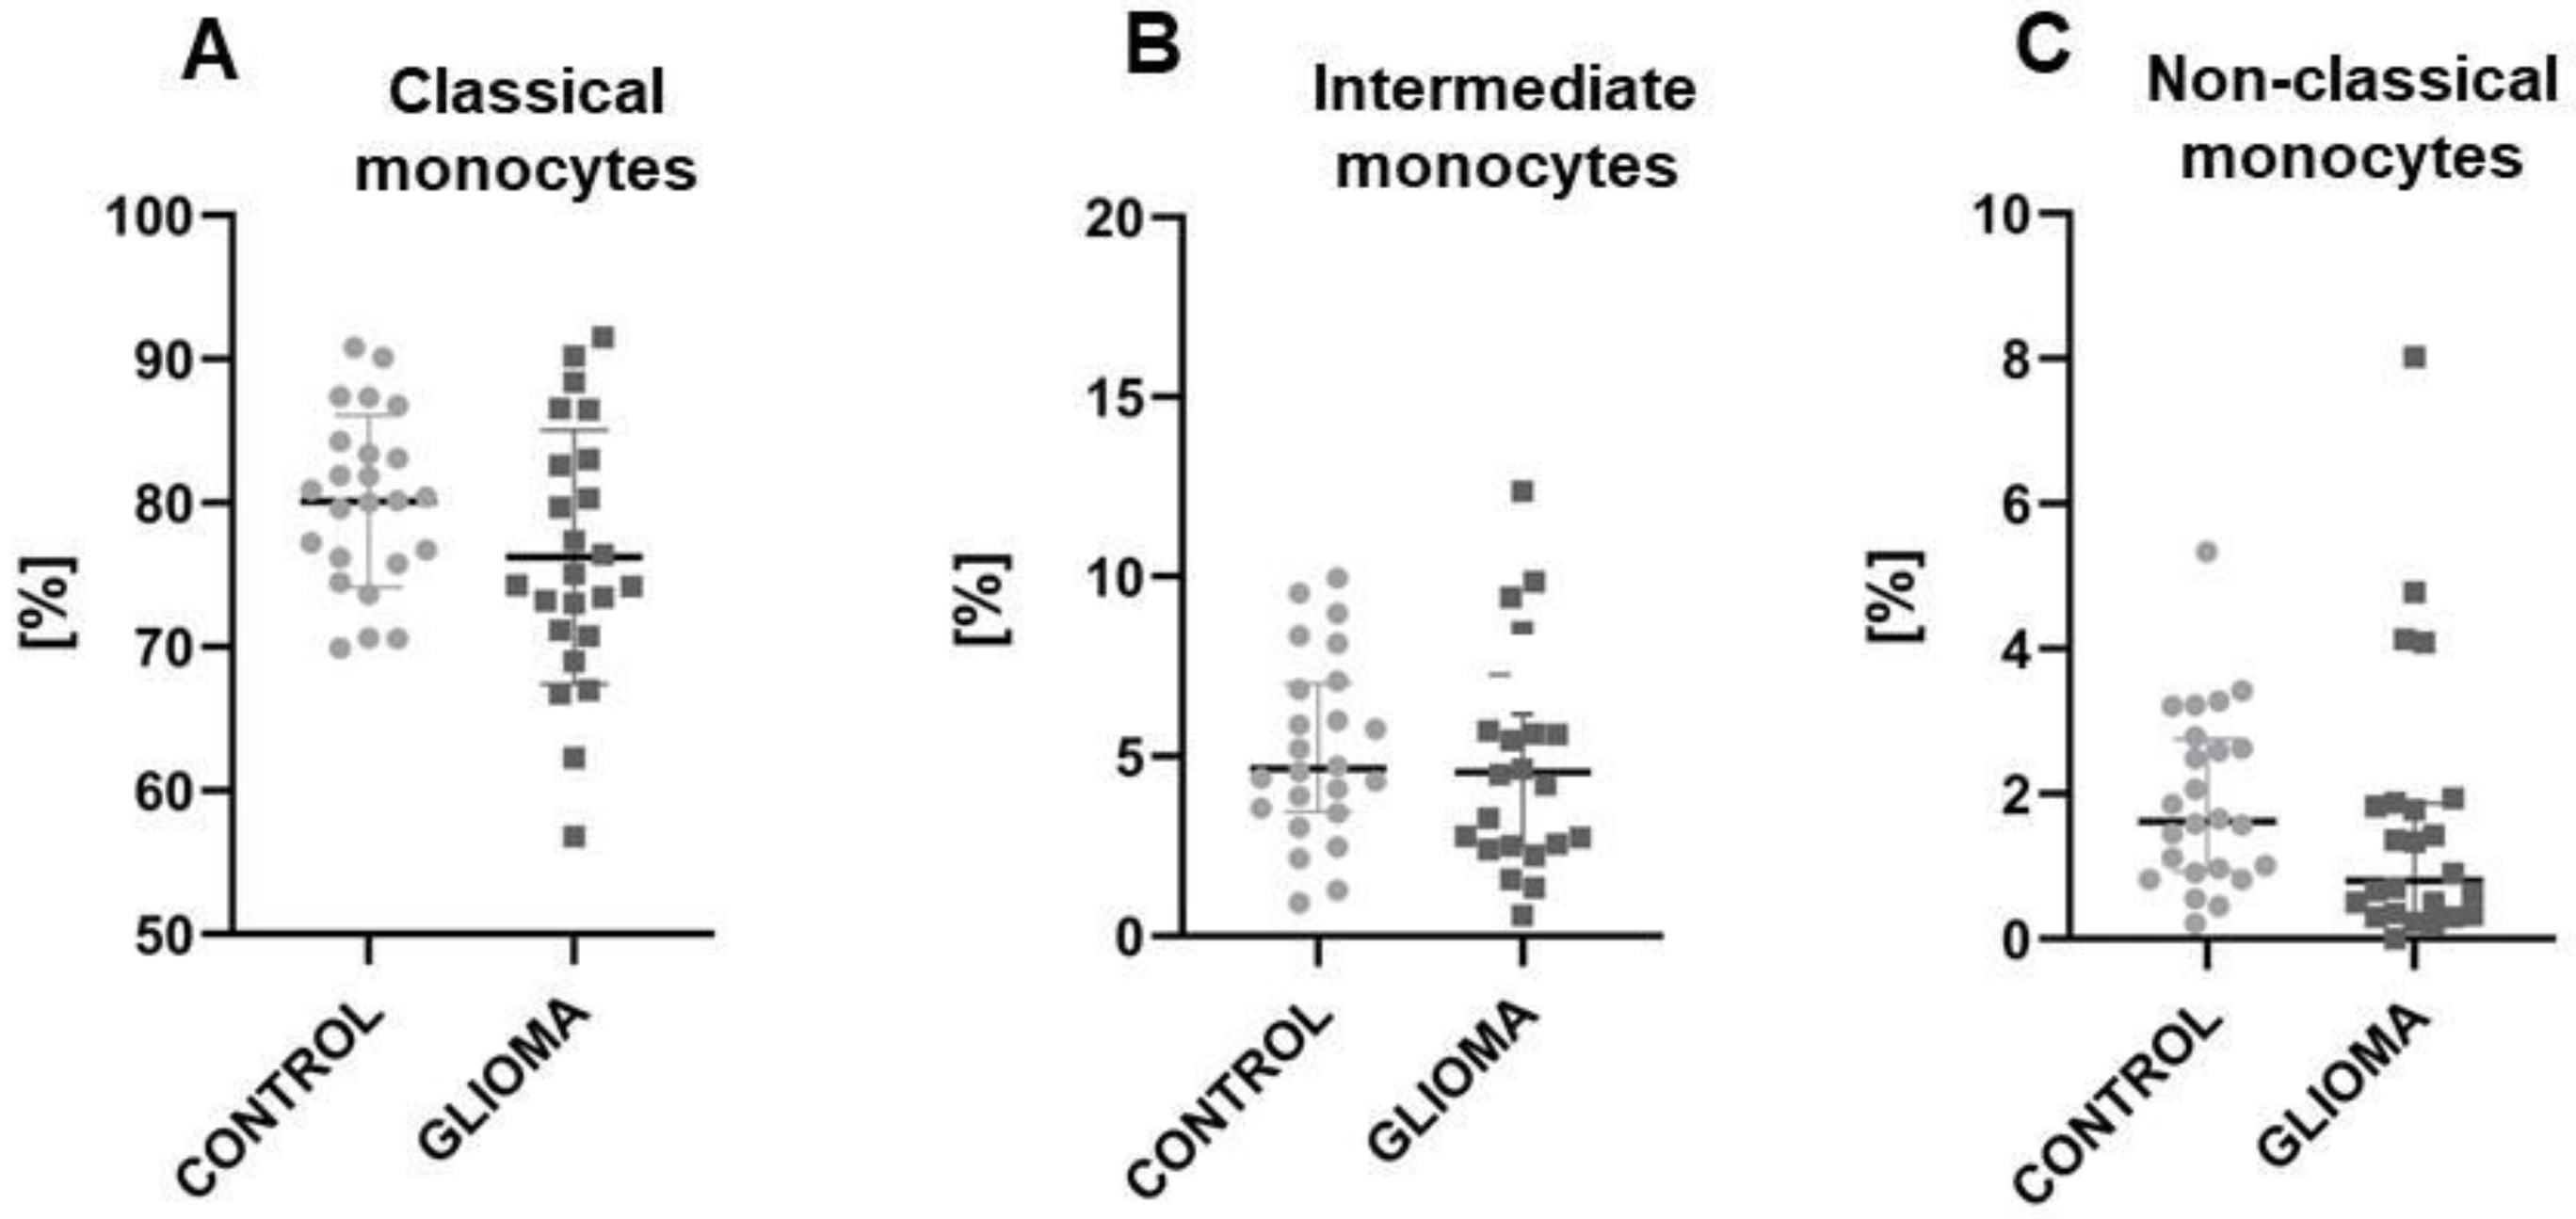
2.1. The Reduction of Classical and Non-Classical Monocytes in Glioma Patients
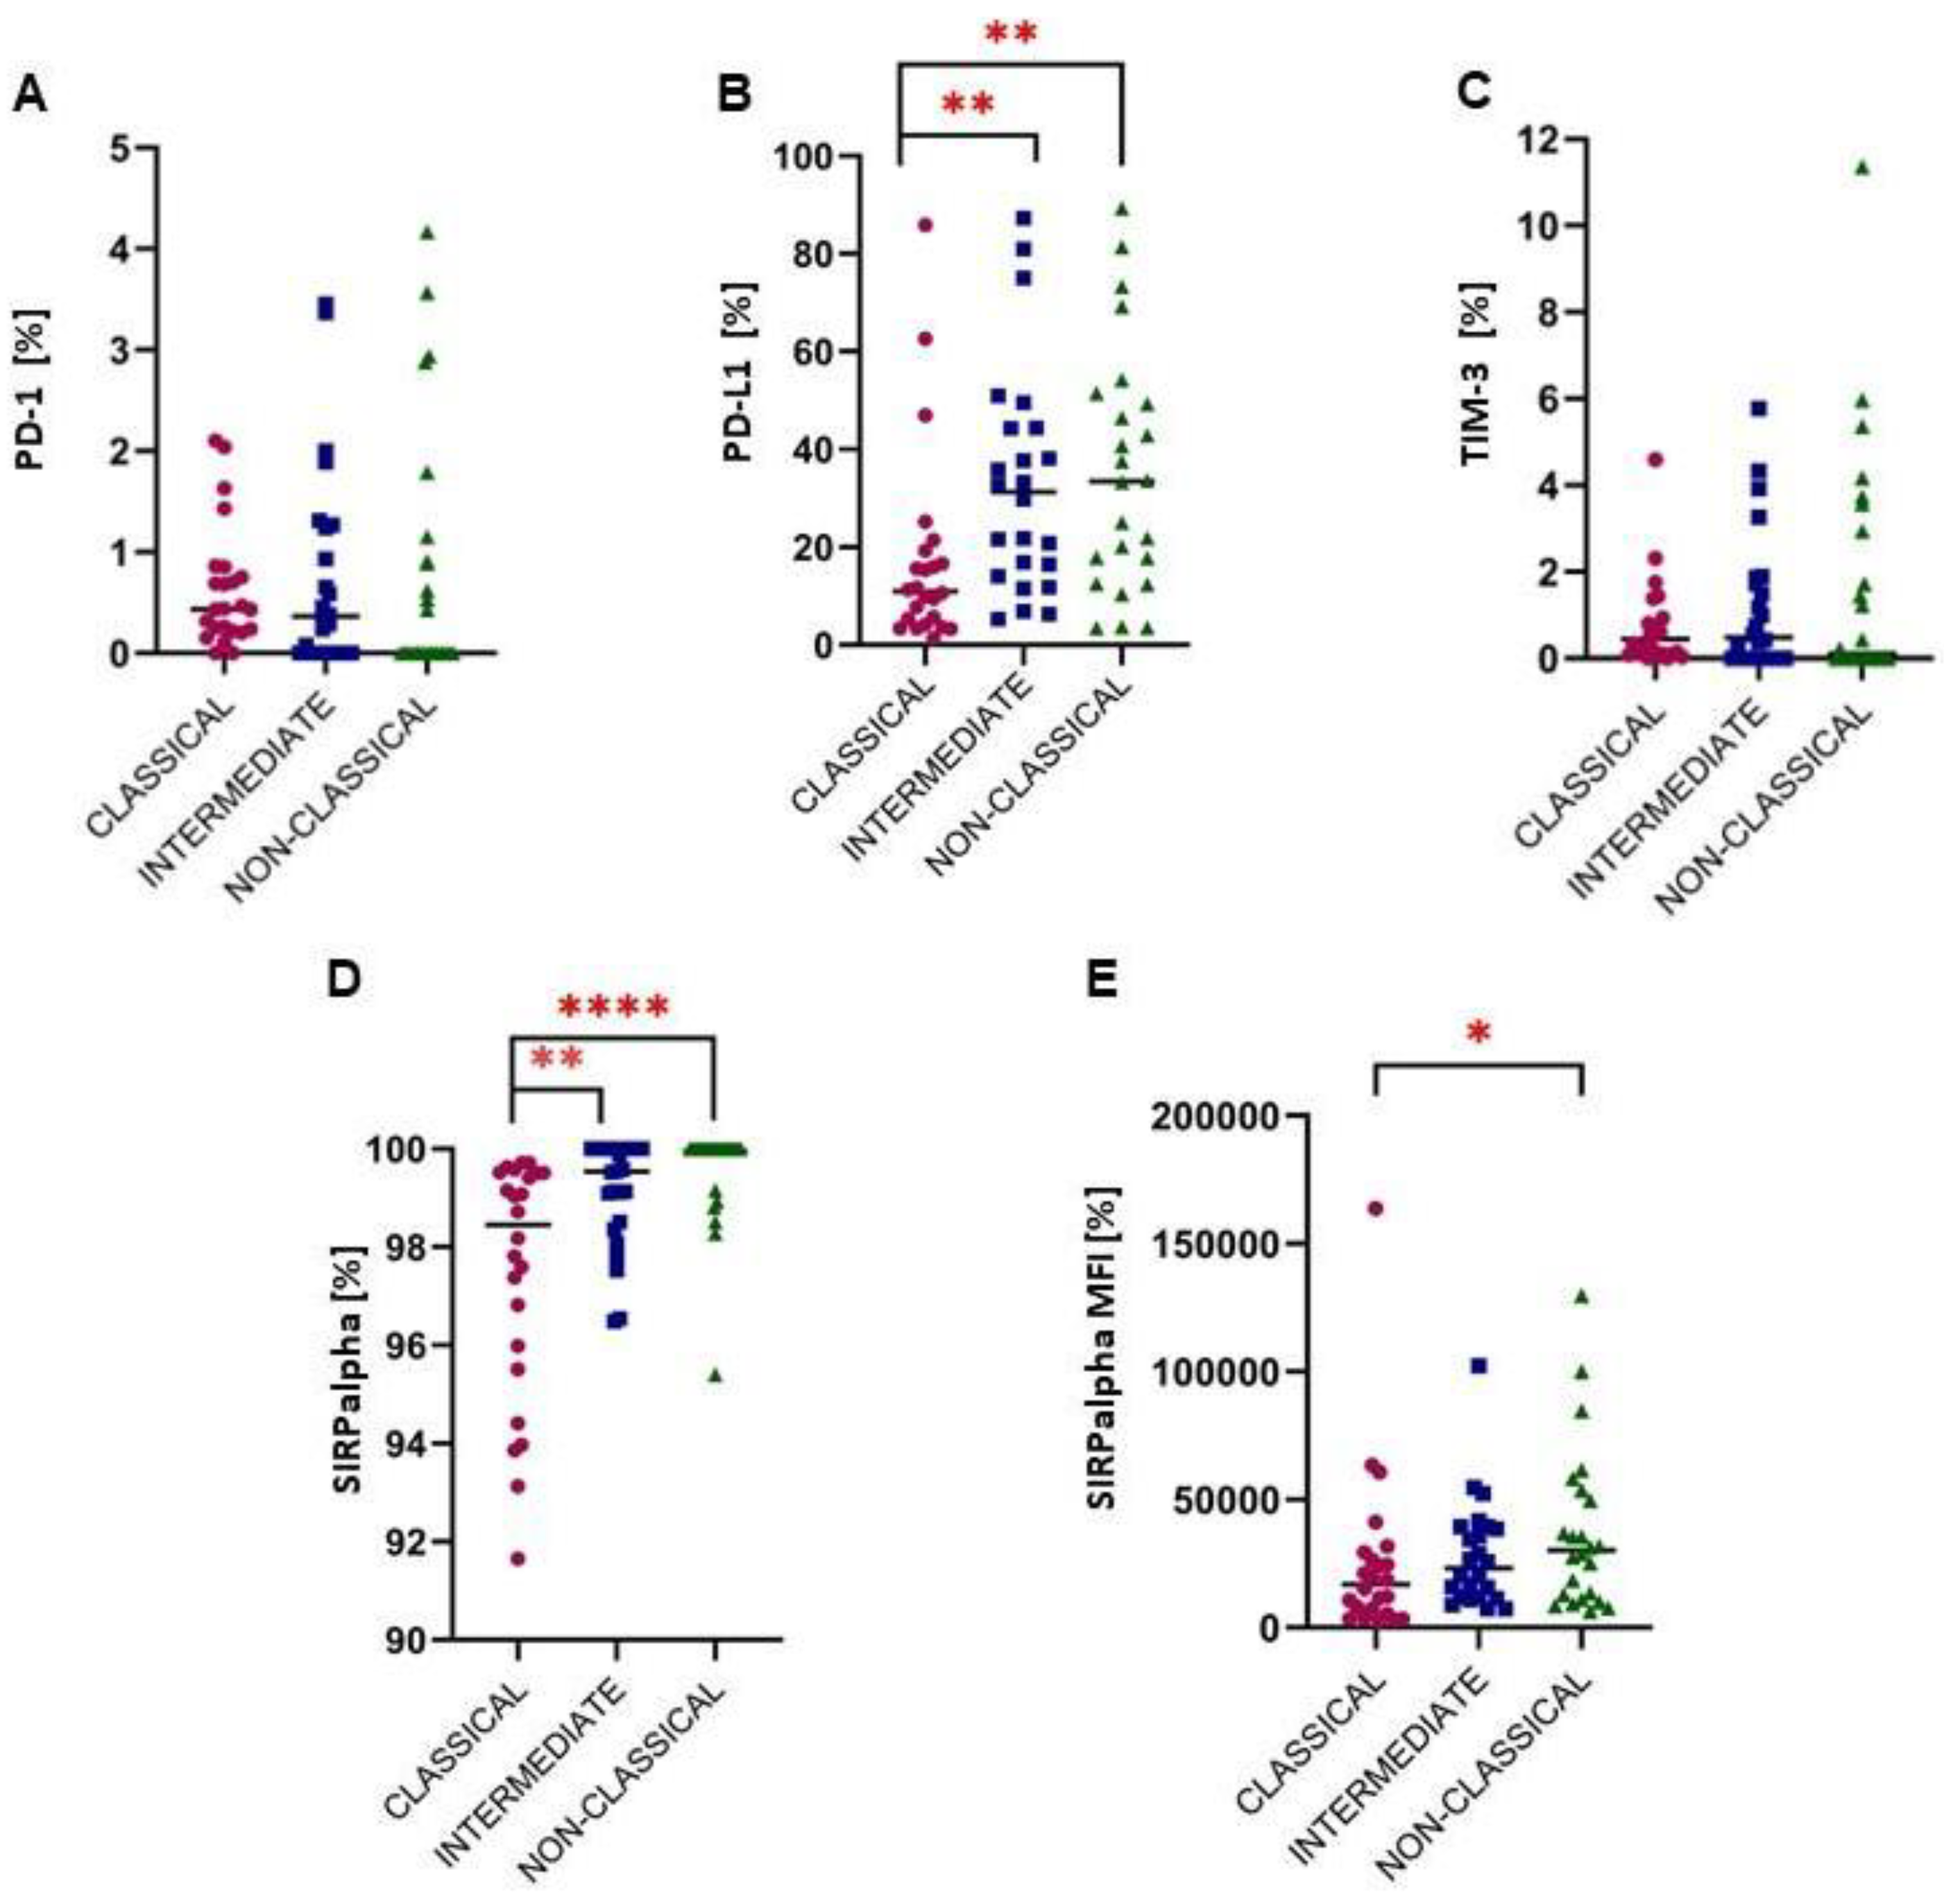
2.2. A Higher Expression of Immune Checkpoints from the PD-1/PD-L1 Pathway
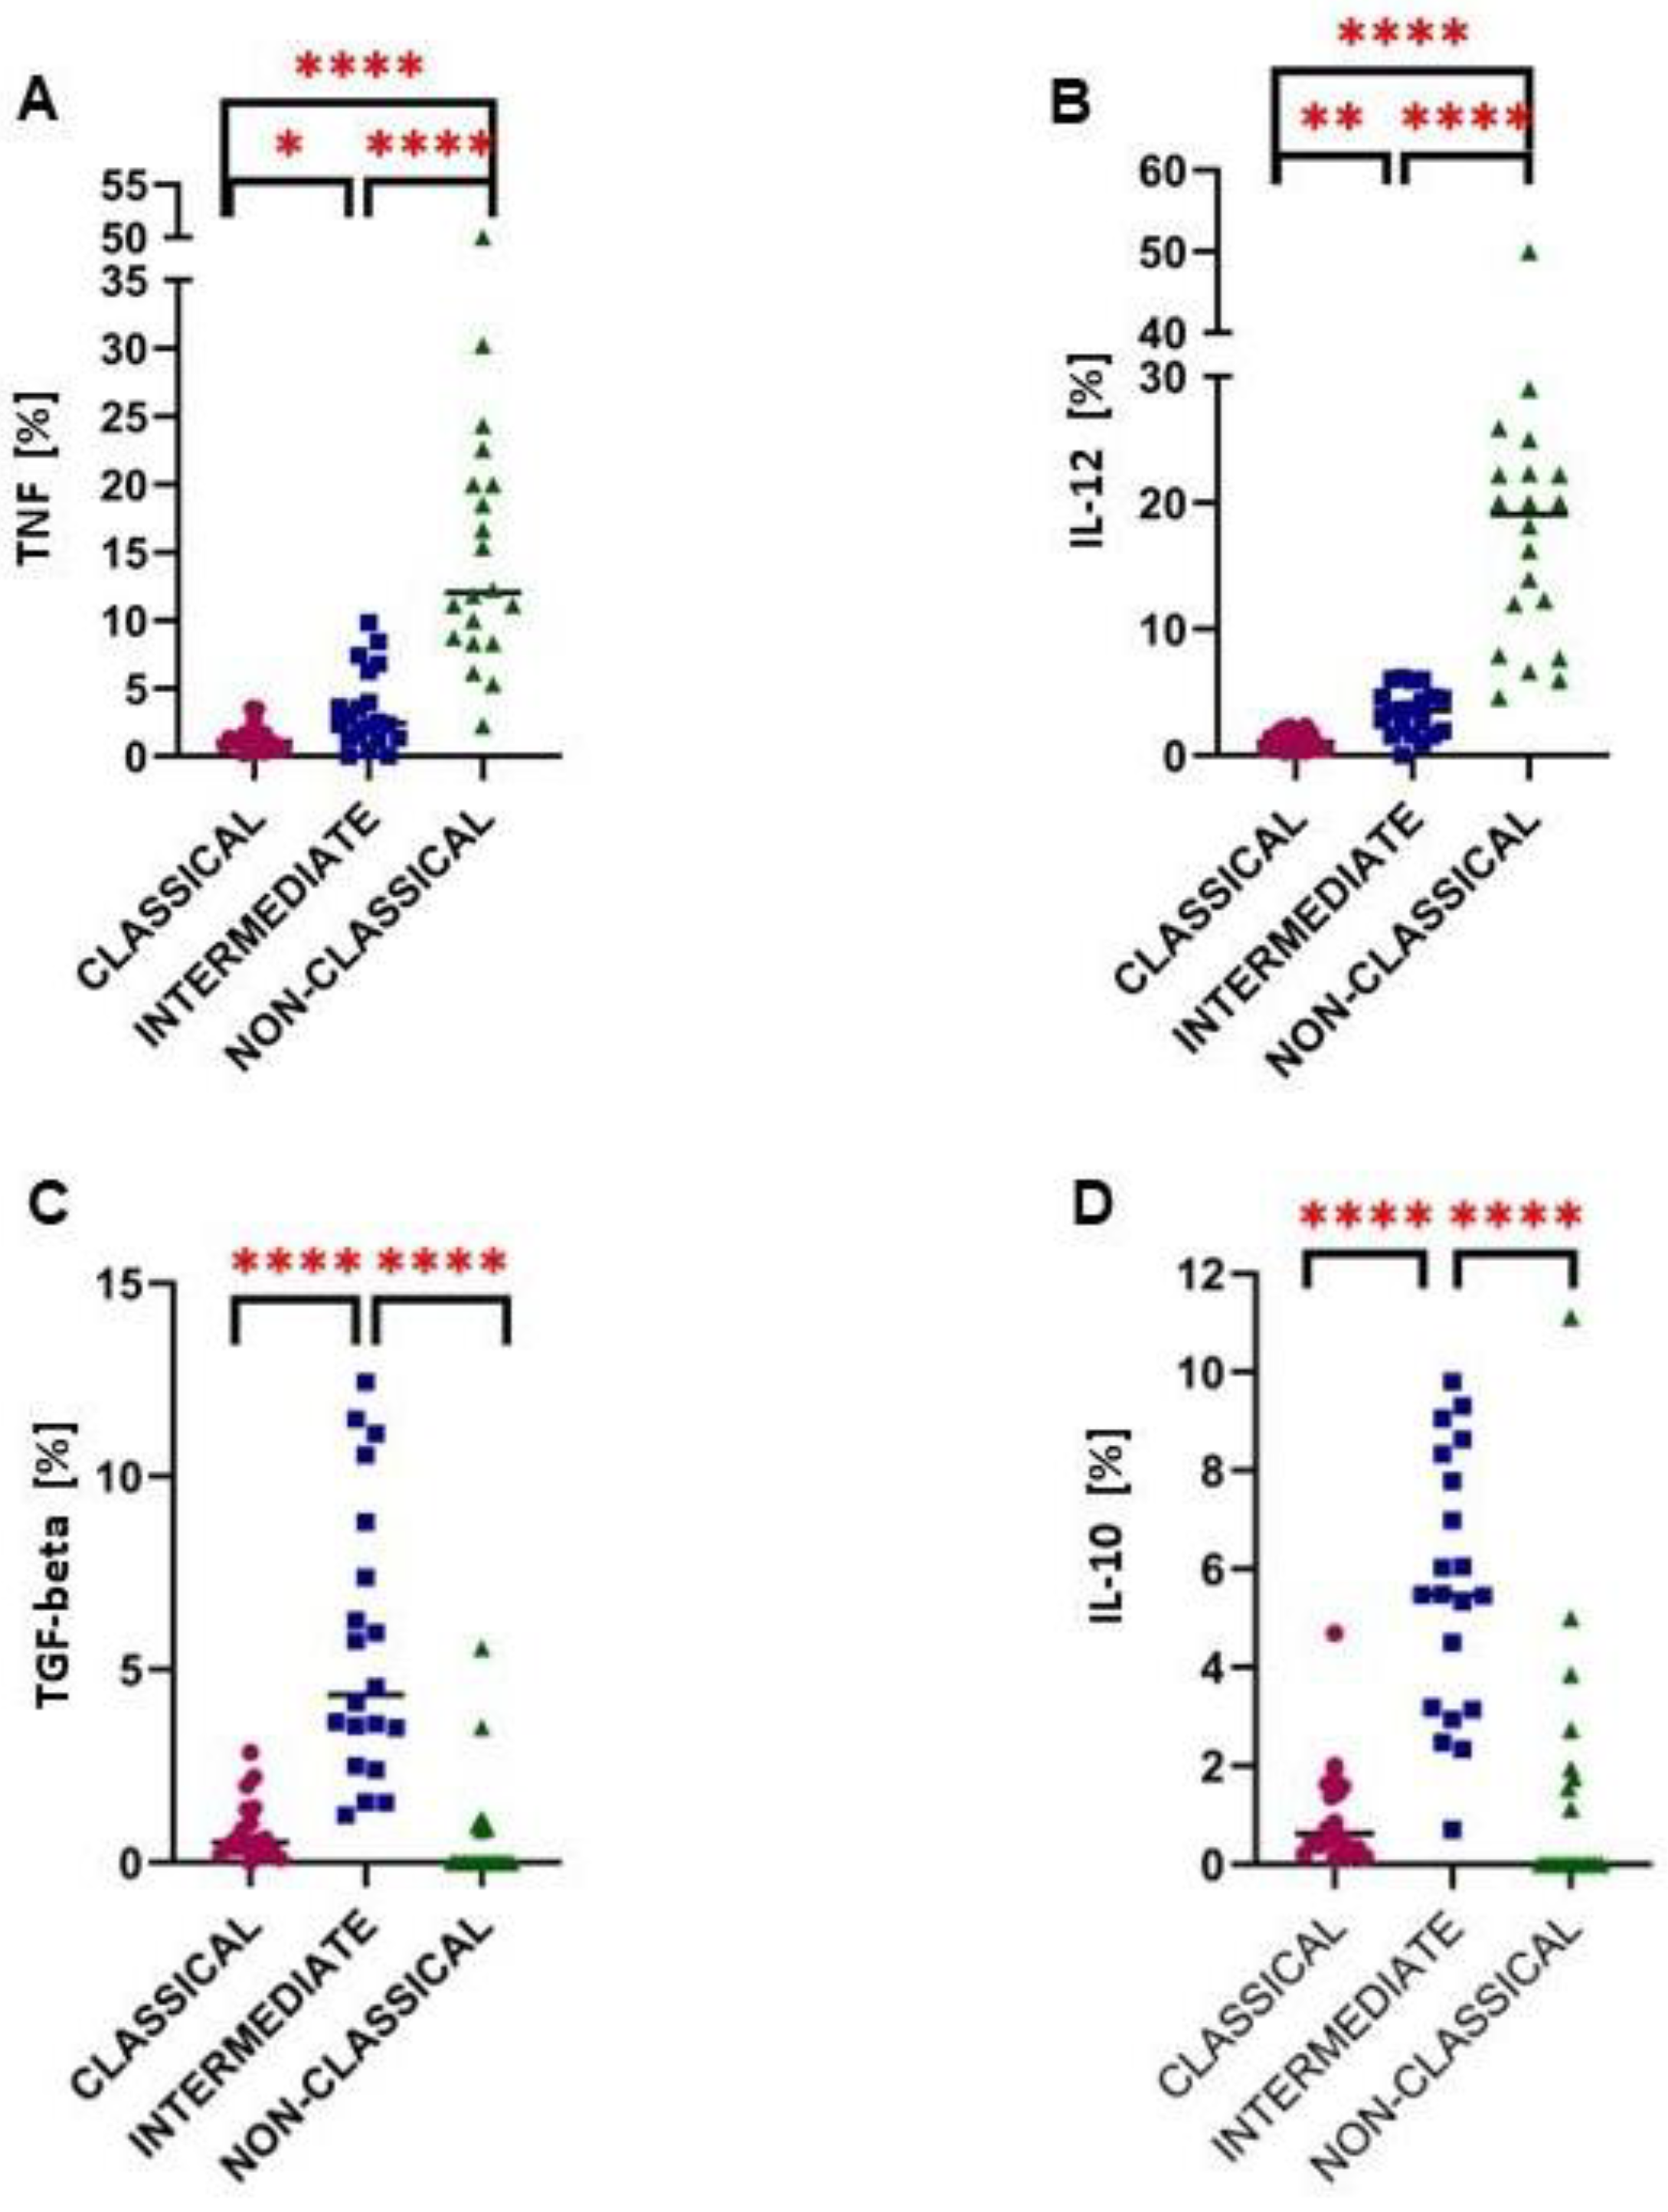
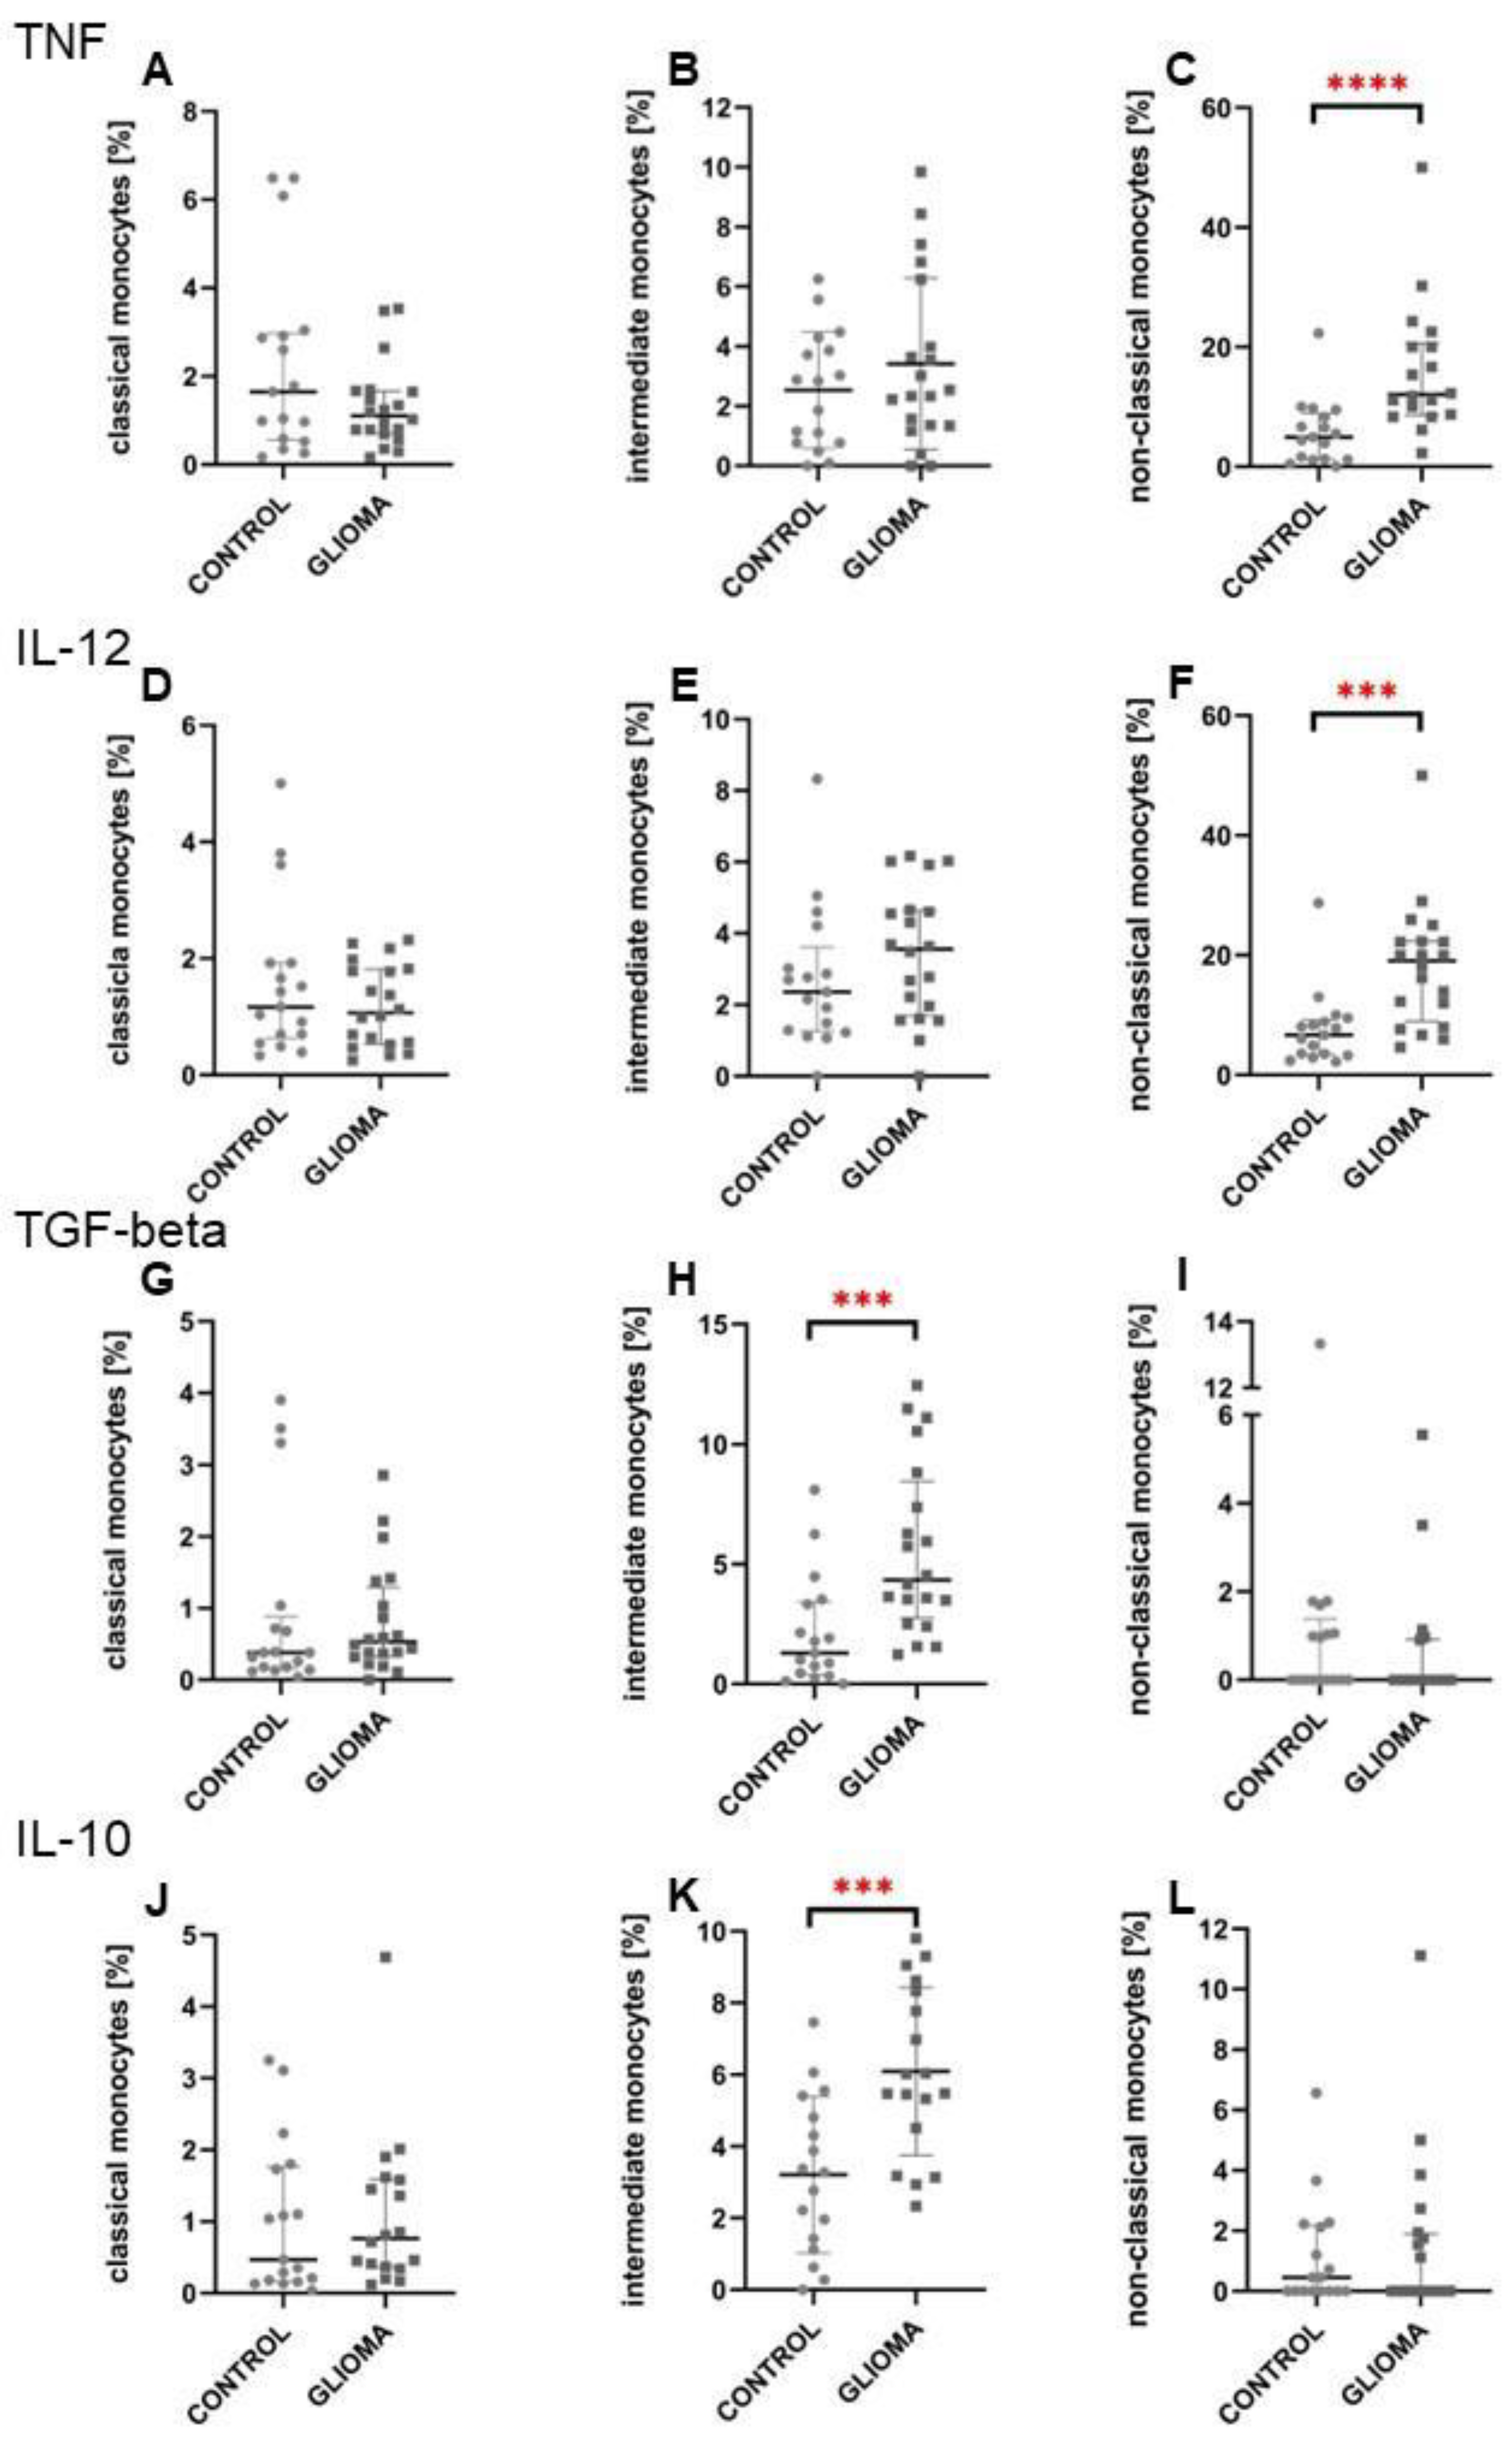
2.3. Intermediate Monocytes Were Skewed towards the Anti-Inflammatory Profile in Glioma Patients
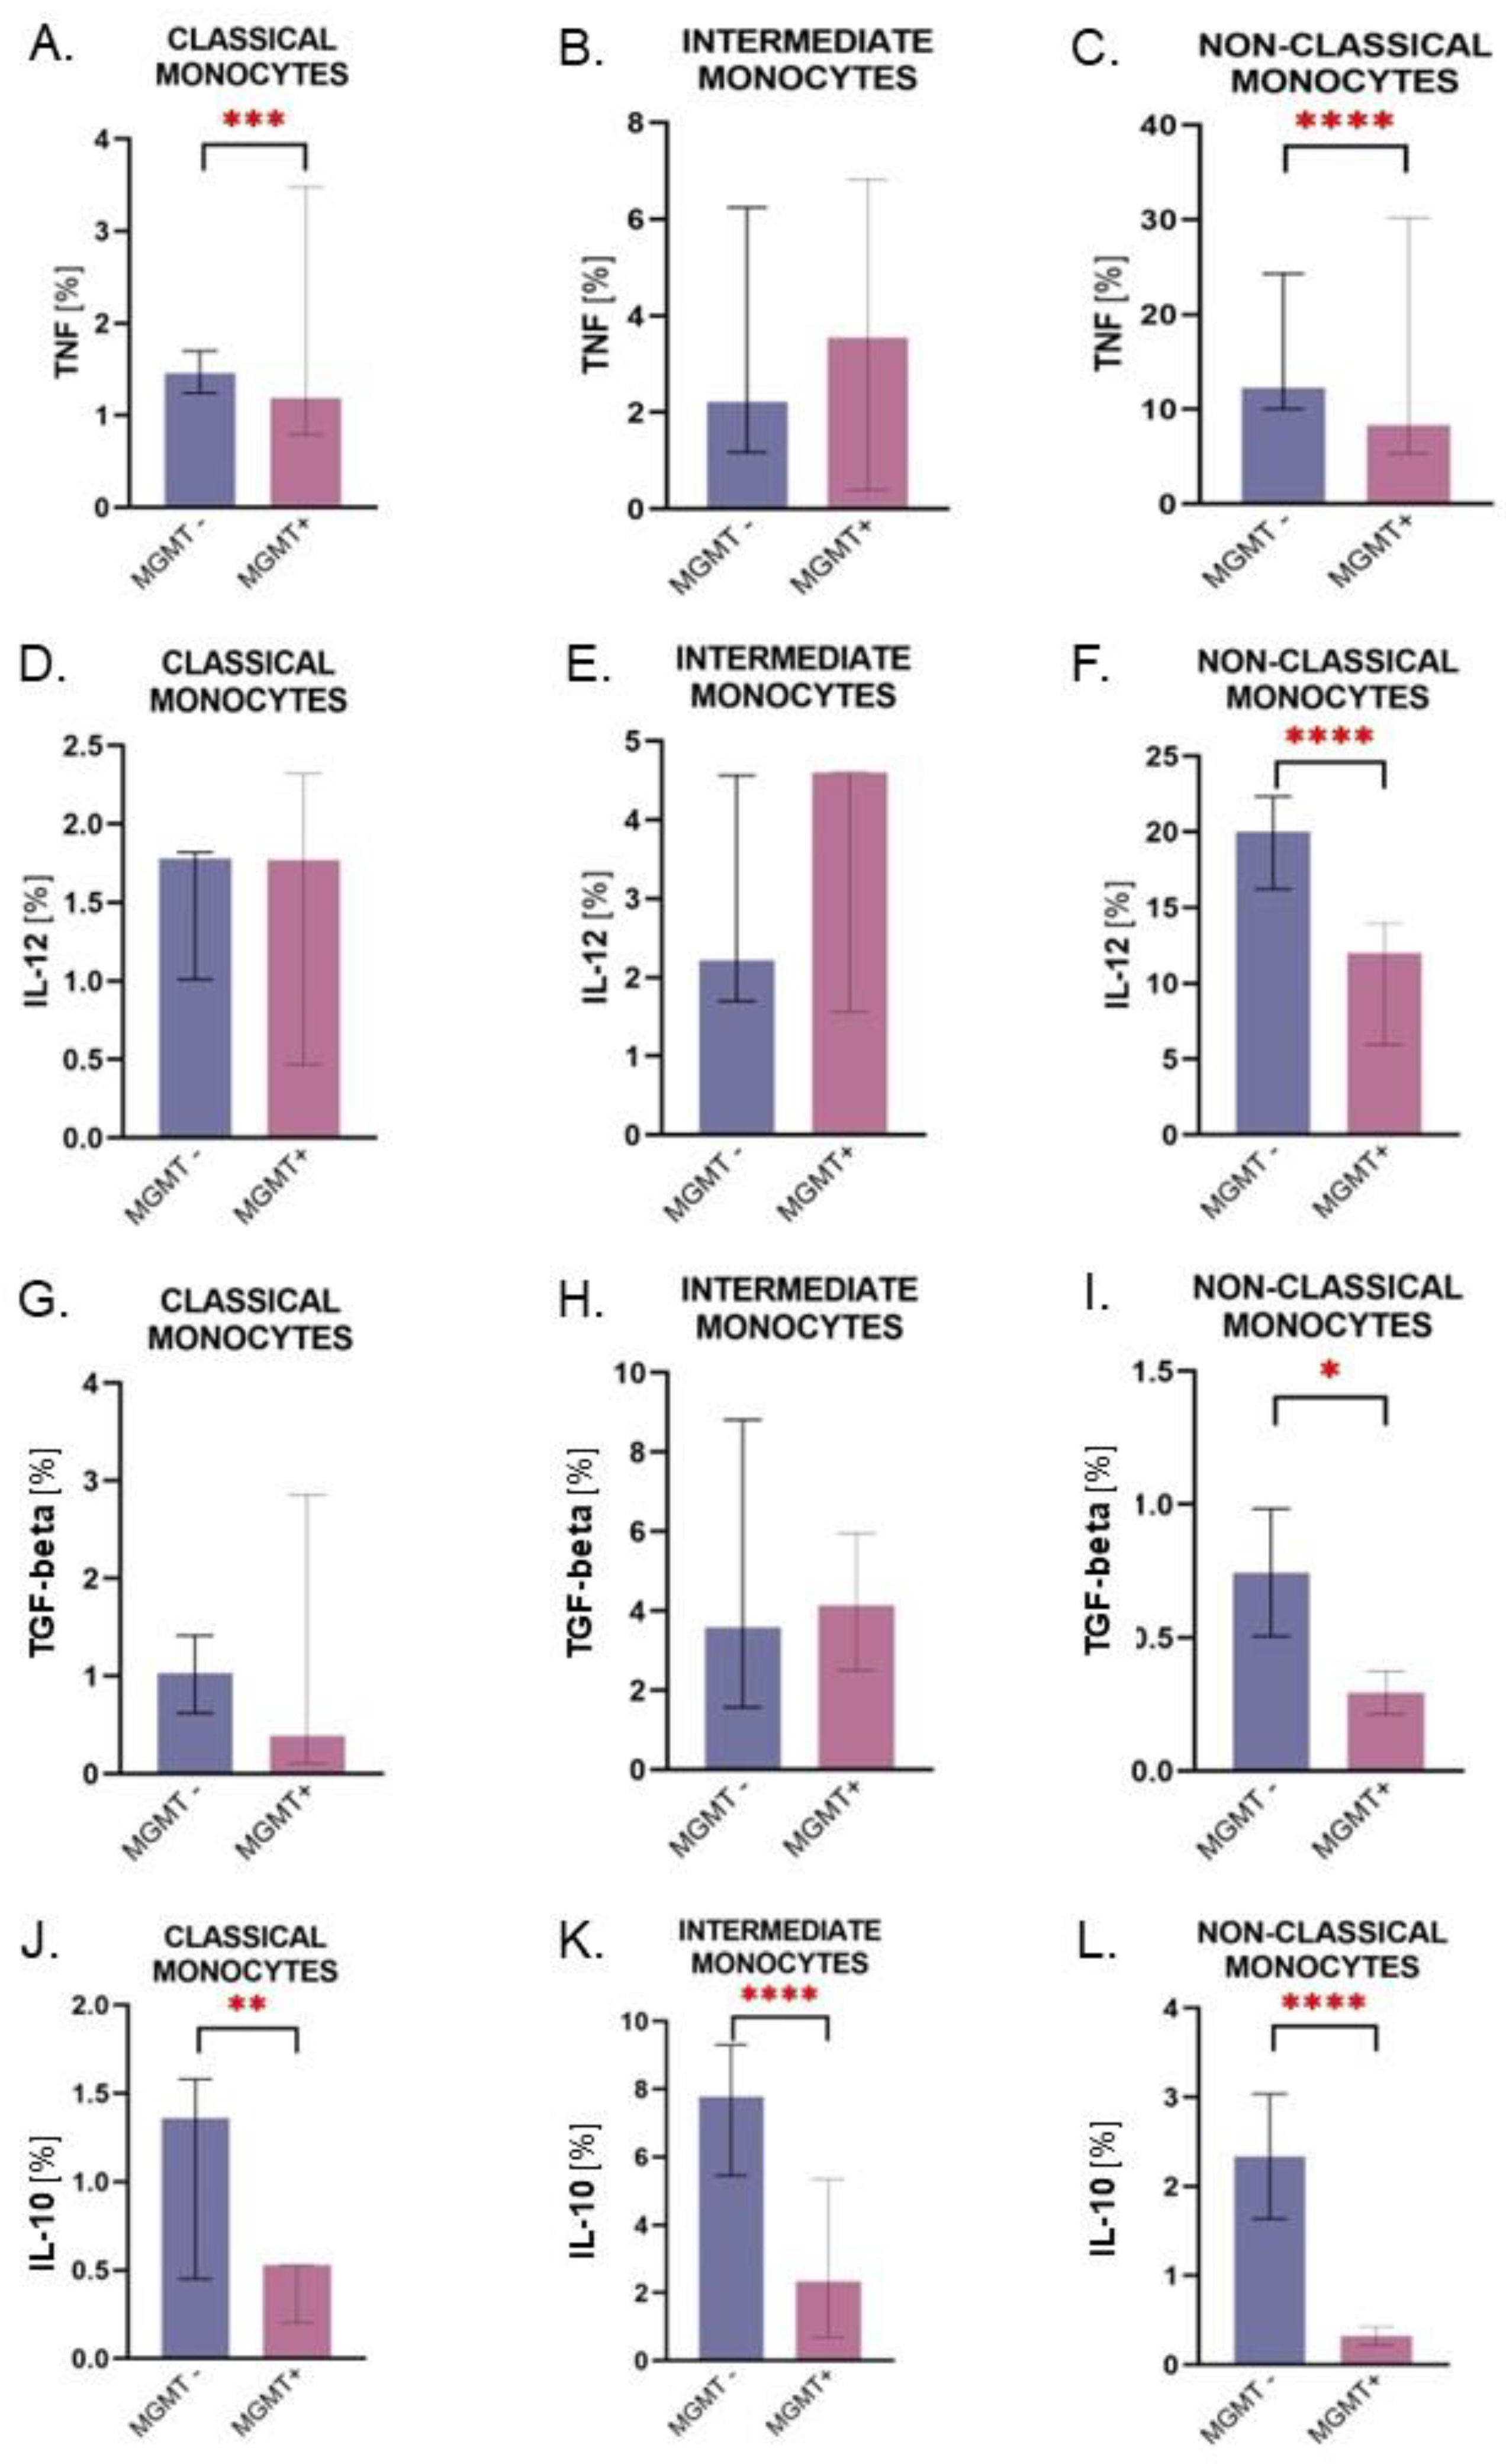
2.4. Monocytes from Patients with the MGMT-Unmethylated Tumors Are Characterized by Higher Expression of IL-10
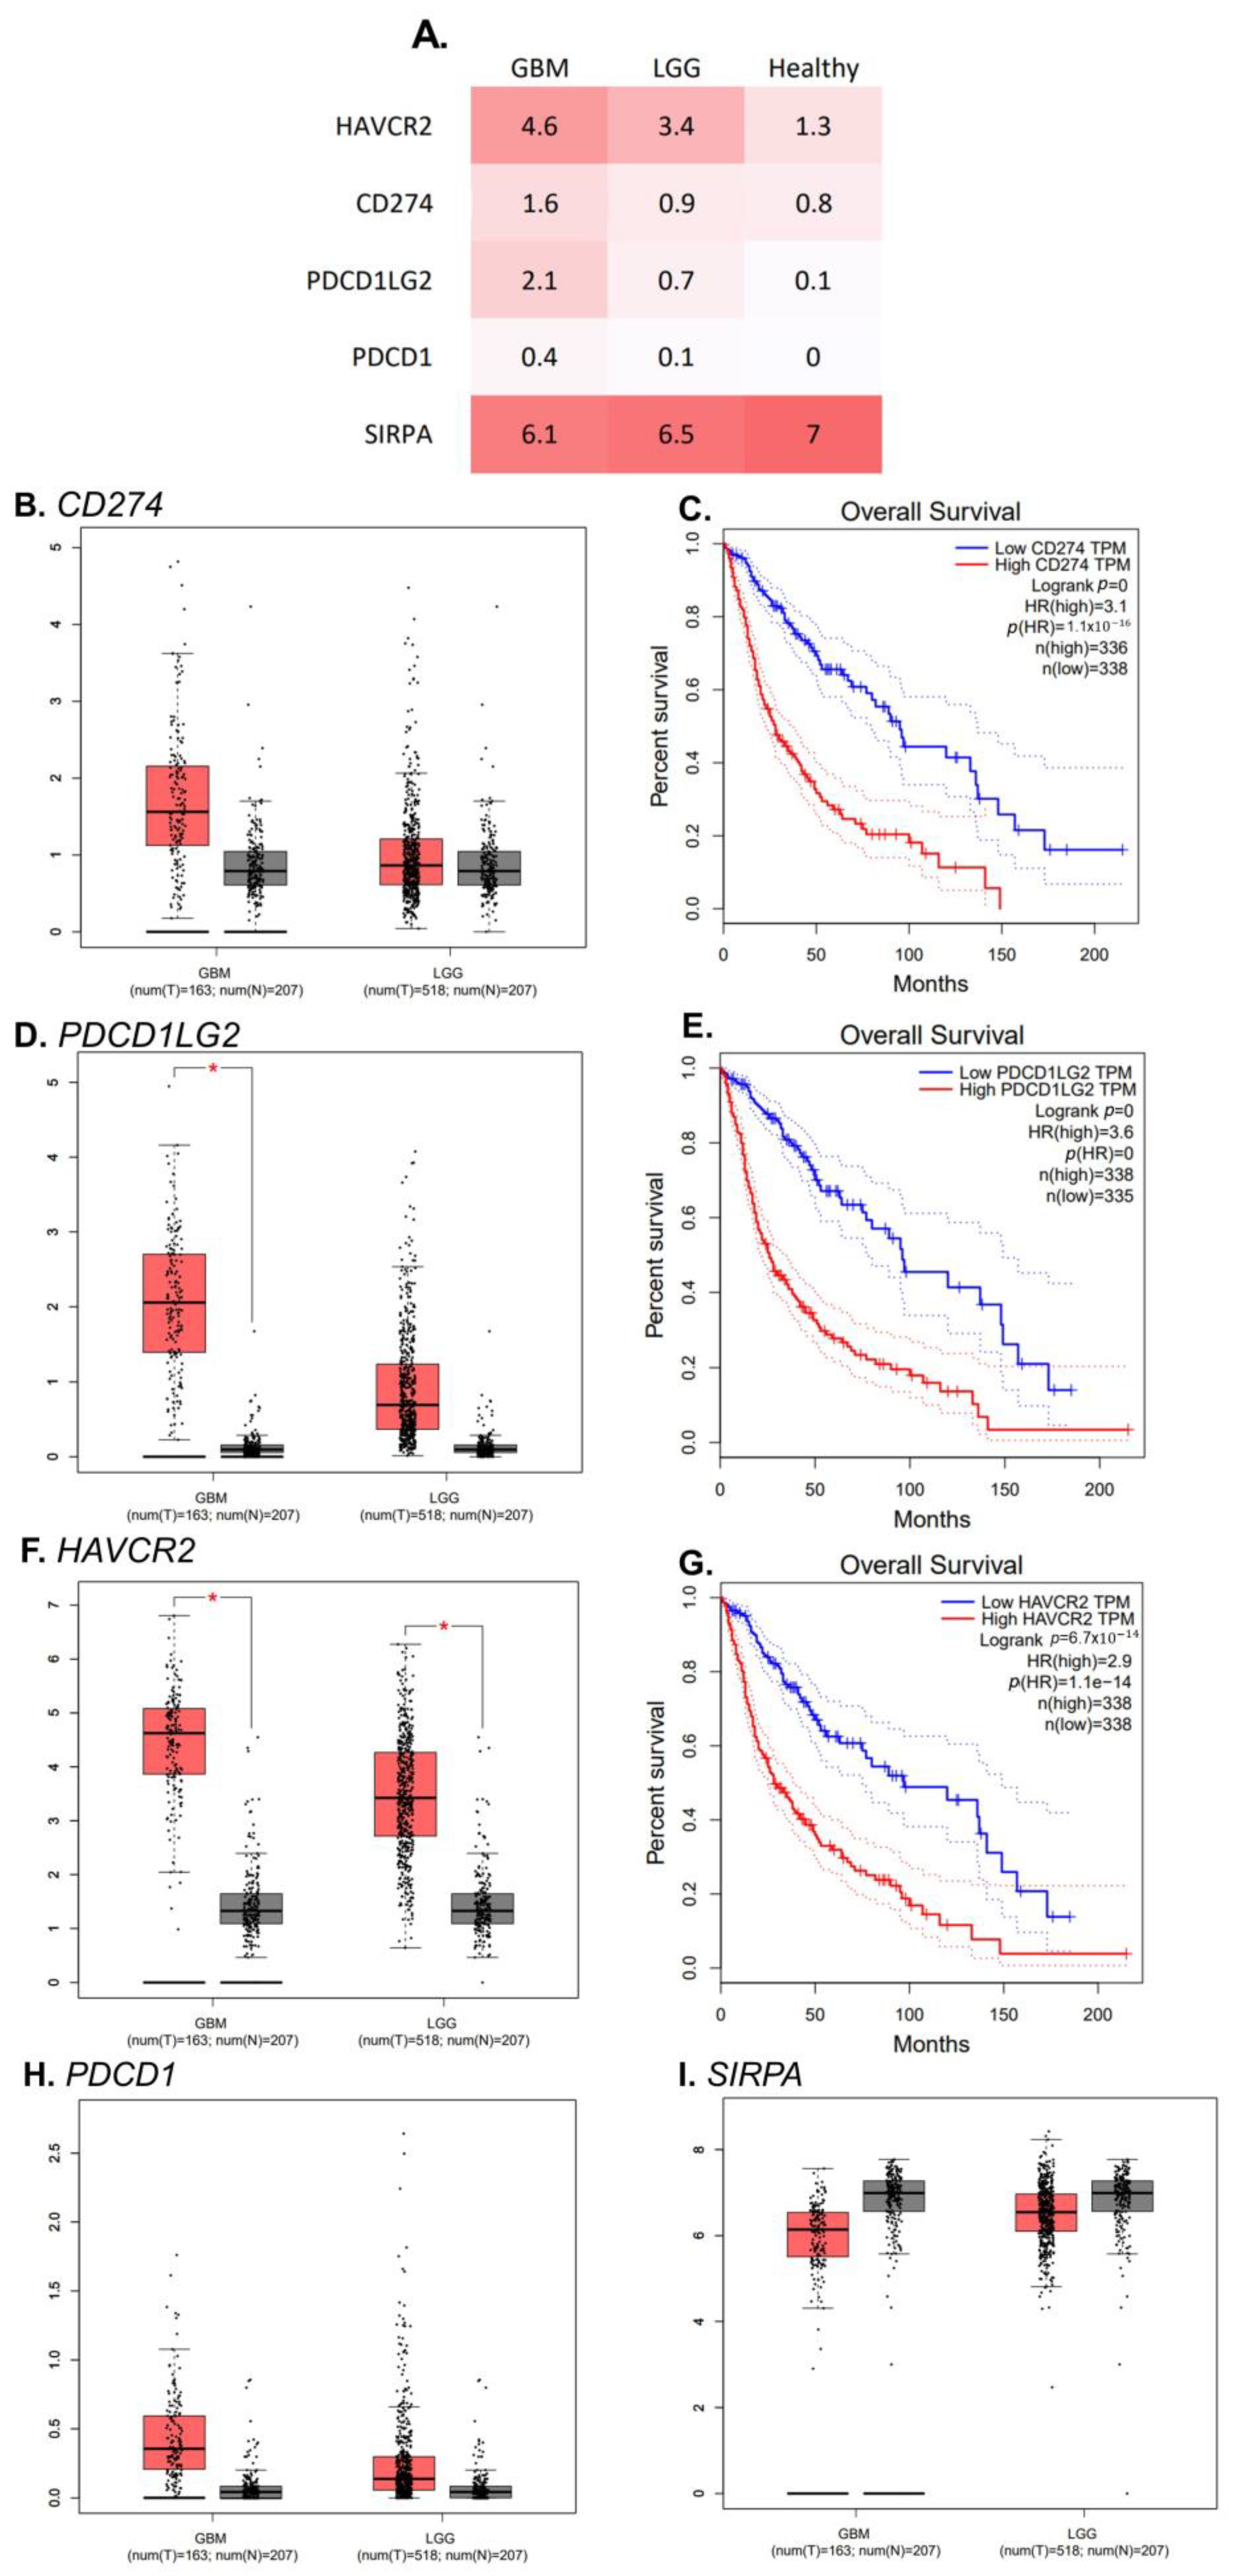
2.5. RNA Transcript Expression of PDCD1LG2 and HAVCR2 Gene Is Higher in GBMs’ Tissue Than in Healthy Control
3. Discussion
4. Materials and Methods
4.1. Study Group
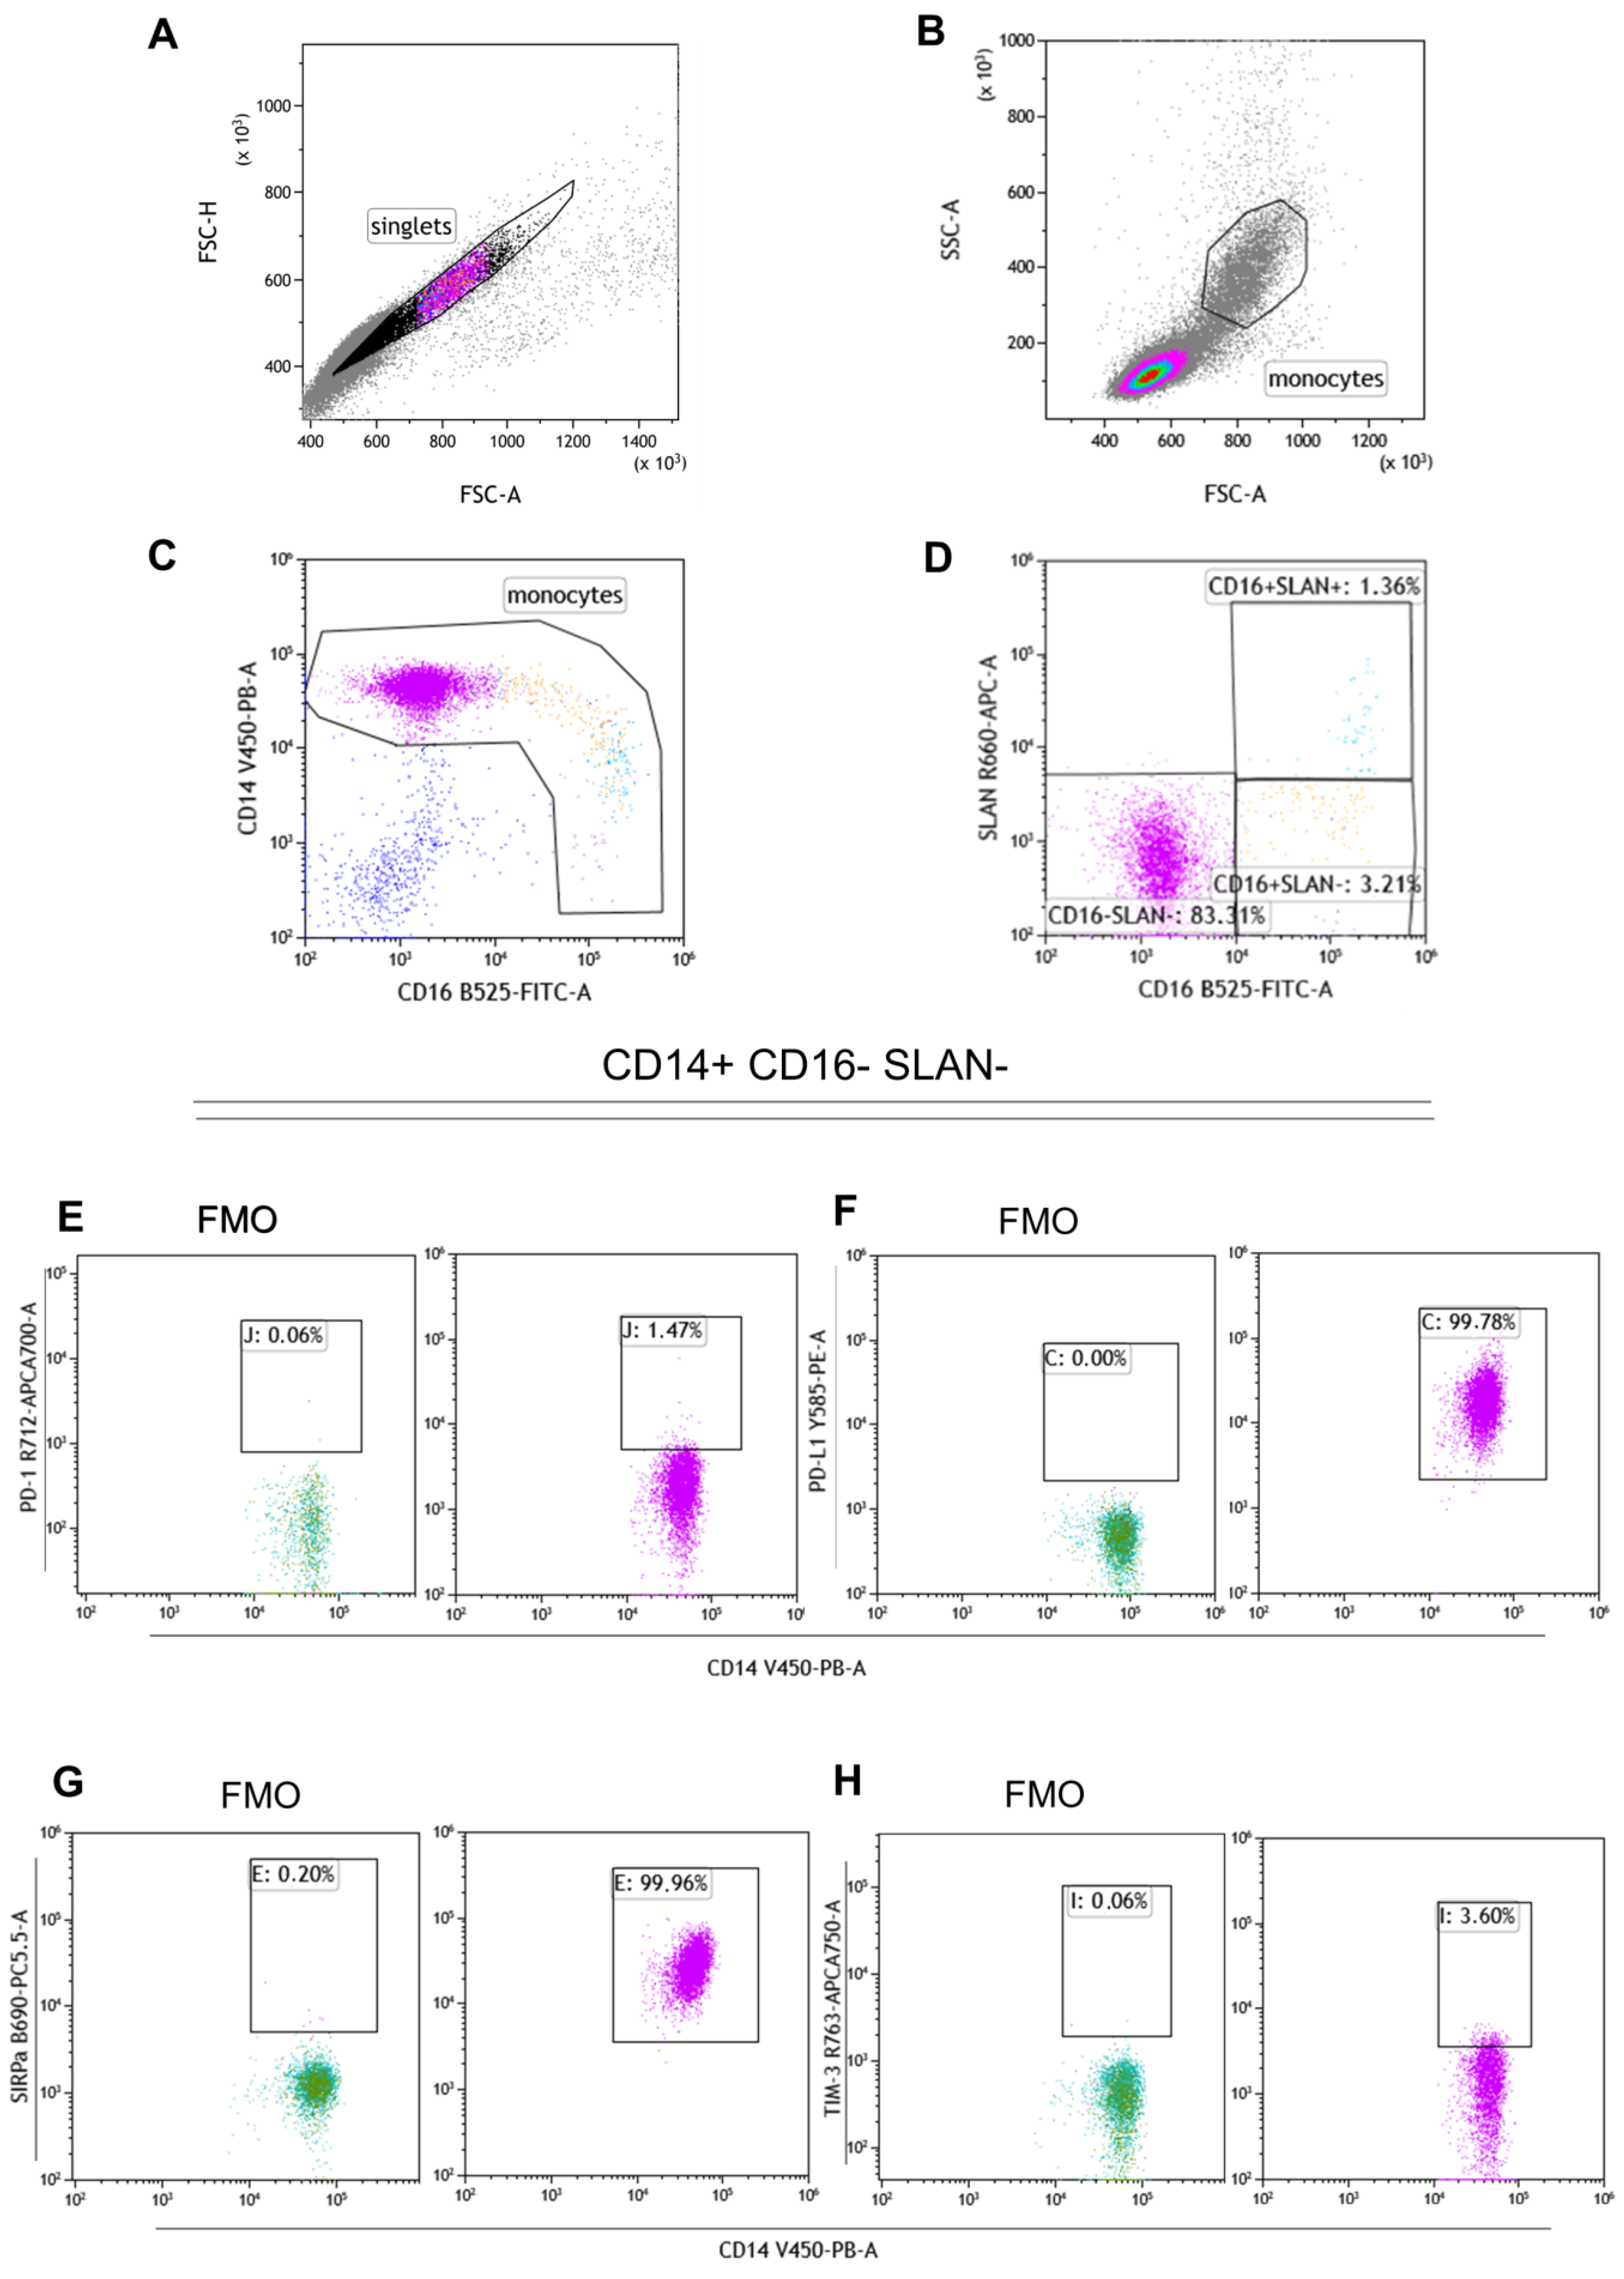
4.2. Flow Cytometry
4.2.1. Surface Staining
4.2.2. Intracellular Staining
4.3. Single-Cell RNA-Seq Analysis
4.4. Statistical Analysis
5. Conclusions
Supplementary Materials
Author Contributions
Funding
Institutional Review Board Statement
Informed Consent Statement
Data Availability Statement
Acknowledgments
Conflicts of Interest
References
- Theeler, B.J.; Yung, W.K.A.; Fuller, G.N.; Groot, J.F.D. Moving toward Molecular Classification of Diffuse Gliomas in Adults. Neurology 2012, 79, 1917–1926. [Google Scholar] [CrossRef] [Green Version]
- Louis, D.N.; Perry, A.; Wesseling, P.; Brat, D.J.; Cree, I.A.; Figarella-Branger, D.; Hawkins, C.; Ng, H.K.; Pfister, S.M.; Reifenberger, G.; et al. The 2021 WHO Classification of Tumors of the Central Nervous System: A Summary. Neuro-Oncol. 2021, 23, 1231–1251. [Google Scholar] [CrossRef] [PubMed]
- Weller, M.; van den Bent, M.; Preusser, M.; Le Rhun, E.; Tonn, J.C.; Minniti, G.; Bendszus, M.; Balana, C.; Chinot, O.; Dirven, L.; et al. EANO Guidelines on the Diagnosis and Treatment of Diffuse Gliomas of Adulthood. Nat. Rev. Clin. Oncol. 2021, 18, 170–186. [Google Scholar] [CrossRef]
- Madhugiri, V.S.; Moiyadi, A.V.; Shetty, P.; Gupta, T.; Epari, S.; Jalali, R.; Subeikshanan, V.; Dutt, A.; Sasidharan, G.M.; Roopesh Kumar, V.R.; et al. Analysis of Factors Associated with Long-Term Survival in Patients with Glioblastoma. World Neurosurg. 2021, 149, e758–e765. [Google Scholar] [CrossRef] [PubMed]
- Tykocki, T.; Eltayeb, M. Ten-Year Survival in Glioblastoma. A Systematic Review. J. Clin. Neurosci. 2018, 54, 7–13. [Google Scholar] [CrossRef]
- Vázquez Cervantes, G.I.; González Esquivel, D.F.; Gómez-Manzo, S.; Pineda, B.; Pérez de la Cruz, V. New Immunotherapeutic Approaches for Glioblastoma. J. Immunol. Res. 2021, 2021, 3412906. [Google Scholar] [CrossRef]
- Zhao, H.; Wang, S.; Song, C.; Zha, Y.; Li, L. The Prognostic Value of MGMT Promoter Status by Pyrosequencing Assay for Glioblastoma Patients’ Survival: A Meta-Analysis. World J. Surg. Oncol. 2016, 14, 261. [Google Scholar] [CrossRef] [Green Version]
- Hegi, M.E.; Diserens, A.-C.; Gorlia, T.; Hamou, M.-F.; de Tribolet, N.; Weller, M.; Kros, J.M.; Hainfellner, J.A.; Mason, W.; Mariani, L.; et al. MGMT Gene Silencing and Benefit from Temozolomide in Glioblastoma. N. Engl. J. Med. 2005, 352, 997–1003. [Google Scholar] [CrossRef] [Green Version]
- Olingy, C.E.; Dinh, H.Q.; Hedrick, C.C. Monocyte Heterogeneity and Functions in Cancer. J. Leukoc. Biol. 2019, 106, 309–322. [Google Scholar] [CrossRef] [Green Version]
- Pushalkar, S.; Hundeyin, M.; Daley, D.; Zambirinis, C.P.; Kurz, E.; Mishra, A.; Mohan, N.; Aykut, B.; Usyk, M.; Torres, L.E.; et al. The Pancreatic Cancer Microbiome Promotes Oncogenesis by Induction of Innate and Adaptive Immune Suppression. Cancer Discov. 2018, 8, 403–416. [Google Scholar] [CrossRef]
- Hisada, Y.; Mackman, N. Cancer-Associated Pathways and Biomarkers of Venous Thrombosis. Blood 2017, 130, 1499–1506. [Google Scholar] [CrossRef] [PubMed]
- Boyette, L.B.; Macedo, C.; Hadi, K.; Elinoff, B.D.; Walters, J.T.; Ramaswami, B.; Chalasani, G.; Taboas, J.M.; Lakkis, F.G.; Metes, D.M. Phenotype, Function, and Differentiation Potential of Human Monocyte Subsets. PLoS ONE 2017, 12, e0176460. [Google Scholar] [CrossRef] [PubMed] [Green Version]
- Ziegler-Heitbrock, L.; Ancuta, P.; Crowe, S.; Dalod, M.; Grau, V.; Hart, D.N.; Leenen, P.J.M.; Liu, Y.-J.; MacPherson, G.; Randolph, G.J.; et al. Nomenclature of Monocytes and Dendritic Cells in Blood. Blood 2010, 116, e74-80. [Google Scholar] [CrossRef]
- Hofer, T.P.; Zawada, A.M.; Frankenberger, M.; Skokann, K.; Satzl, A.A.; Gesierich, W.; Schuberth, M.; Levin, J.; Danek, A.; Rotter, B.; et al. Slan-Defined Subsets of CD16-Positive Monocytes: Impact of Granulomatous Inflammation and M-CSF Receptor Mutation. Blood 2015, 126, 2601–2610. [Google Scholar] [CrossRef] [PubMed] [Green Version]
- Yang, J.; Zhang, L.; Yu, C.; Yang, X.-F.; Wang, H. Monocyte and Macrophage Differentiation: Circulation Inflammatory Monocyte as Biomarker for Inflammatory Diseases. Biomark. Res. 2014, 2, 1. [Google Scholar] [CrossRef] [PubMed] [Green Version]
- Le Gallou, S.; Lhomme, F.; Irish, J.M.; Mingam, A.; Pangault, C.; Monvoisin, C.; Ferrant, J.; Azzaoui, I.; Rossille, D.; Bouabdallah, K.; et al. Nonclassical Monocytes Are Prone to Migrate Into Tumor in Diffuse Large B-Cell Lymphoma. Front. Immunol. 2021, 12, 755623. [Google Scholar] [CrossRef] [PubMed]
- McKee, S.J.; Tuong, Z.K.; Kobayashi, T.; Doff, B.L.; Soon, M.S.; Nissen, M.; Lam, P.Y.; Keane, C.; Vari, F.; Moi, D.; et al. B Cell Lymphoma Progression Promotes the Accumulation of Circulating Ly6Clo Monocytes with Immunosuppressive Activity. Oncoimmunology 2018, 7, e1393599. [Google Scholar] [CrossRef]
- Ma, R.-Y.; Zhang, H.; Li, X.-F.; Zhang, C.-B.; Selli, C.; Tagliavini, G.; Lam, A.D.; Prost, S.; Sims, A.H.; Hu, H.-Y.; et al. Monocyte-Derived Macrophages Promote Breast Cancer Bone Metastasis Outgrowth. J. Exp. Med. 2020, 217, e20191820. [Google Scholar] [CrossRef]
- Qian, B.-Z.; Li, J.; Zhang, H.; Kitamura, T.; Zhang, J.; Campion, L.R.; Kaiser, E.A.; Snyder, L.A.; Pollard, J.W. CCL2 Recruits Inflammatory Monocytes to Facilitate Breast-Tumour Metastasis. Nature 2011, 475, 222–225. [Google Scholar] [CrossRef] [Green Version]
- Kranjc, M.K.; Novak, M.; Pestell, R.G.; Lah, T.T. Cytokine CCL5 and Receptor CCR5 Axis in Glioblastoma Multiforme. Radiol. Oncol. 2019, 53, 397–406. [Google Scholar] [CrossRef]
- Aretz, P.; Maciaczyk, D.; Yusuf, S.; Sorg, R.V.; Hänggi, D.; Liu, H.; Liu, H.; Dakal, T.C.; Sharma, A.; Bethanabatla, R.; et al. Crosstalk between β-Catenin and CCL2 Drives Migration of Monocytes towards Glioblastoma Cells. Int. J. Mol. Sci. 2022, 23, 4562. [Google Scholar] [CrossRef] [PubMed]
- Ma, J.; Chen, C.C.; Li, M. Macrophages/Microglia in the Glioblastoma Tumor Microenvironment. Int. J. Mol. Sci. 2021, 22, 5775. [Google Scholar] [CrossRef] [PubMed]
- Pinton, L.; Masetto, E.; Vettore, M.; Solito, S.; Magri, S.; D’Andolfi, M.; Del Bianco, P.; Lollo, G.; Benoit, J.-P.; Okada, H.; et al. The Immune Suppressive Microenvironment of Human Gliomas Depends on the Accumulation of Bone Marrow-Derived Macrophages in the Center of the Lesion. J. Immunother. Cancer 2019, 7, 58. [Google Scholar] [CrossRef] [PubMed] [Green Version]
- Russo, C.D.; Cappoli, N. Glioma Associated Microglia/Macrophages, a Potential Pharmacological Target to Promote Antitumor Inflammatory Immune Response in the Treatment of Glioblastoma. Neuroimmunol. Neuroinflammation 2018, 5, 36. [Google Scholar] [CrossRef] [Green Version]
- van den Bossche, W.B.L.; Vincent, A.J.P.E.; Teodosio, C.; Koets, J.; Taha, A.; Kleijn, A.; de Bruin, S.; Dik, W.A.; Damasceno, D.; Almeida, J.; et al. Monocytes Carrying GFAP Detect Glioma, Brain Metastasis and Ischaemic Stroke, and Predict Glioblastoma Survival. Brain Commun. 2021, 3, fcaa215. [Google Scholar] [CrossRef] [PubMed]
- Wei, J.; Chen, P.; Gupta, P.; Ott, M.; Zamler, D.; Kassab, C.; Bhat, K.P.; Curran, M.A.; de Groot, J.F.; Heimberger, A.B. Immune Biology of Glioma-Associated Macrophages and Microglia: Functional and Therapeutic Implications. Neuro-Oncol. 2020, 22, 180–194. [Google Scholar] [CrossRef]
- Guilliams, M.; Mildner, A.; Yona, S. Developmental and Functional Heterogeneity of Monocytes. Immunity 2018, 49, 595–613. [Google Scholar] [CrossRef] [Green Version]
- Kiss, M.; Caro, A.A.; Raes, G.; Laoui, D. Systemic Reprogramming of Monocytes in Cancer. Front. Oncol. 2020, 10, 1399. [Google Scholar] [CrossRef]
- Hirose, S.; Lin, Q.; Ohtsuji, M.; Nishimura, H.; Verbeek, J.S. Monocyte Subsets Involved in the Development of Systemic Lupus Erythematosus and Rheumatoid Arthritis. Int. Immunol. 2019, 31, 687–696. [Google Scholar] [CrossRef] [Green Version]
- Waschbisch, A.; Schröder, S.; Schraudner, D.; Sammet, L.; Weksler, B.; Melms, A.; Pfeifenbring, S.; Stadelmann, C.; Schwab, S.; Linker, R.A. Pivotal Role for CD16+ Monocytes in Immune Surveillance of the Central Nervous System. J. Immunol. 2016, 196, 1558–1567. [Google Scholar] [CrossRef]
- Prat, M.; Le Naour, A.; Coulson, K.; Lemée, F.; Leray, H.; Jacquemin, G.; Rahabi, M.C.; Lemaitre, L.; Authier, H.; Ferron, G.; et al. Circulating CD14high CD16low Intermediate Blood Monocytes as a Biomarker of Ascites Immune Status and Ovarian Cancer Progression. J. Immunother. Cancer 2020, 8, e000472. [Google Scholar] [CrossRef] [PubMed]
- Kwiecień, I.; Rutkowska, E.; Polubiec-Kownacka, M.; Raniszewska, A.; Rzepecki, P.; Domagała-Kulawik, J. Blood Monocyte Subsets with Activation Markers in Relation with Macrophages in Non-Small Cell Lung Cancer. Cancers 2020, 12, 2513. [Google Scholar] [CrossRef] [PubMed]
- Lowther, D.E.; Goods, B.A.; Lucca, L.E.; Lerner, B.A.; Raddassi, K.; van Dijk, D.; Hernandez, A.L.; Duan, X.; Gunel, M.; Coric, V.; et al. PD-1 Marks Dysfunctional Regulatory T Cells in Malignant Gliomas. JCI Insight 2016, 1, e85935. [Google Scholar] [CrossRef] [PubMed] [Green Version]
- Li, C.; Wang, Y.; Long, L.; Zhang, P.; Zhang, Y.; Ji, N. Gp96 Expression in Gliomas and Its Association with Tumor Malignancy and T Cell Infiltrating Level. J. Oncol. 2022, 2022, 9575867. [Google Scholar] [CrossRef] [PubMed]
- Yun, J.; Yu, G.; Hu, P.; Chao, Y.; Li, X.; Chen, X.; Wei, Q.; Wang, J. PD-1 Expression Is Elevated in Monocytes from Hepatocellular Carcinoma Patients and Contributes to CD8 T Cell Suppression. Immunol. Res. 2020, 68, 436–444. [Google Scholar] [CrossRef]
- Strauss, L.; Mahmoud, M.A.A.; Weaver, J.D.; Tijaro-Ovalle, N.M.; Christofides, A.; Wang, Q.; Pal, R.; Yuan, M.; Asara, J.; Patsoukis, N.; et al. Targeted Deletion of PD-1 in Myeloid Cells Induces Anti-Tumor Immunity. Sci. Immunol. 2020, 5, eaay1863. [Google Scholar] [CrossRef]
- Ferreira da Mota, N.V.; Brunialti, M.K.C.; Santos, S.S.; Machado, F.R.; Assuncao, M.; Azevedo, L.C.P.; Salomao, R. Immunophenotyping of Monocytes During Human Sepsis Shows Impairment in Antigen Presentation: A Shift Toward Nonclassical Differentiation and Upregulation of FCγRi-Receptor. Shock 2018, 50, 293–300. [Google Scholar] [CrossRef]
- Matlung, H.L.; Szilagyi, K.; Barclay, N.A.; van den Berg, T.K. The CD47-SIRPα Signaling Axis as an Innate Immune Checkpoint in Cancer. Immunol. Rev. 2017, 276, 145–164. [Google Scholar] [CrossRef]
- Lee, S.W.L.; Adriani, G.; Kamm, R.D.; Gillrie, M.R. Models for Monocytic Cells in the Tumor Microenvironment. In Tumor Microenvironment: Hematopoietic Cells—Part A; Birbrair, A., Ed.; Advances in Experimental Medicine and Biology; Springer International Publishing: Cham, Switzerland, 2020; pp. 87–115. ISBN 978-3-030-35723-8. [Google Scholar]
- Nakamura, K.; Smyth, M.J. Myeloid Immunosuppression and Immune Checkpoints in the Tumor Microenvironment. Cell. Mol. Immunol. 2020, 17, 1–12. [Google Scholar] [CrossRef]
- Li, X.; Wang, B.; Gu, L.; Zhang, J.; Li, X.; Gao, L.; Ma, C.; Liang, X.; Li, X. Tim-3 Expression Predicts the Abnormal Innate Immune Status and Poor Prognosis of Glioma Patients. Clin. Chim. Acta 2018, 476, 178–184. [Google Scholar] [CrossRef]
- Das, M.; Zhu, C.; Kuchroo, V.K. Tim-3 and Its Role in Regulating Anti-Tumor Immunity. Immunol. Rev. 2017, 276, 97–111. [Google Scholar] [CrossRef] [PubMed] [Green Version]
- Murray, P.J. Immune Regulation by Monocytes. Semin. Immunol. 2018, 35, 12–18. [Google Scholar] [CrossRef] [PubMed]
- Abels, E.R.; Maas, S.L.N.; Tai, E.; Ting, D.T.; Broekman, M.L.D.; Breakefield, X.O.; El Khoury, J. GlioM&M: Web-Based Tool for Studying Circulating and Infiltrating Monocytes and Macrophages in Glioma. Sci. Rep. 2020, 10, 9898. [Google Scholar] [CrossRef] [PubMed]
- Kowalska, W.; Zarobkiewicz, M.; Tomczak, W.; Woś, J.; Morawska, I.; Bojarska-Junak, A. Reduced Percentage of CD14dimCD16+SLAN+ Monocytes Producing TNF and IL-12 as an Immunological Sign of CLL Progression. Int. J. Mol. Sci. 2022, 23, 3029. [Google Scholar] [CrossRef]
- van Leeuwen-Kerkhoff, N.; Westers, T.M.; Poddighe, P.J.; Povoleri, G.A.M.; Timms, J.A.; Kordasti, S.; de Gruijl, T.D.; Loosdrecht, A.A. van de Reduced Frequencies and Functional Impairment of Dendritic Cell Subsets and Non-Classical Monocytes in Myelodysplastic Syndromes. Haematologica 2022, 107, 655–667. [Google Scholar] [CrossRef]
- Mukherjee, R.; Kanti Barman, P.; Kumar Thatoi, P.; Tripathy, R.; Kumar Das, B.; Ravindran, B. Non-Classical Monocytes Display Inflammatory Features: Validation in Sepsis and Systemic Lupus Erythematous. Sci. Rep. 2015, 5, 13886. [Google Scholar] [CrossRef] [Green Version]
- Zhao, H.; Wu, L.; Yan, G.; Chen, Y.; Zhou, M.; Wu, Y.; Li, Y. Inflammation and Tumor Progression: Signaling Pathways and Targeted Intervention. Signal Transduct. Target. Ther. 2021, 6, 263. [Google Scholar] [CrossRef]
- Liu, Z.; Zhang, Y.; Zhang, L.; Zhou, T.; Li, Y.; Zhou, G.; Miao, Z.; Shang, M.; He, J.; Ding, N.-; et al. Duality of Interactions Between TGF-β and TNF-α During Tumor Formation. Front. Immunol. 2022, 12, 5628. [Google Scholar] [CrossRef]
- Ochocka, N.; Segit, P.; Walentynowicz, K.A.; Wojnicki, K.; Cyranowski, S.; Swatler, J.; Mieczkowski, J.; Kaminska, B. Single-Cell RNA Sequencing Reveals Functional Heterogeneity of Glioma-Associated Brain Macrophages. Nat. Commun. 2021, 12, 1151. [Google Scholar] [CrossRef]
- Zhu, Z.; Zhang, H.; Chen, B.; Liu, X.; Zhang, S.; Zong, Z.; Gao, M. PD-L1-Mediated Immunosuppression in Glioblastoma Is Associated With the Infiltration and M2-Polarization of Tumor-Associated Macrophages. Front. Immunol. 2020, 11, 588552. [Google Scholar] [CrossRef]
- Schaafsma, E.; Jiang, C.; Nguyen, T.; Zhu, K.; Cheng, C. Microglia-Based Gene Expression Signature Highly Associated with Prognosis in Low-Grade Glioma. Cancers 2022, 14, 4802. [Google Scholar] [CrossRef] [PubMed]
- Zhang, H.; Huang, Y.; Yang, E.; Gao, X.; Zou, P.; Sun, J.; Tian, Z.; Bao, M.; Liao, D.; Ge, J.; et al. Identification of a Fibroblast-Related Prognostic Model in Glioma Based on Bioinformatics Methods. Biomolecules 2022, 12, 1598. [Google Scholar] [CrossRef] [PubMed]
- De Vlaminck, K.; Romão, E.; Puttemans, J.; Pombo Antunes, A.R.; Kancheva, D.; Scheyltjens, I.; Van Ginderachter, J.A.; Muyldermans, S.; Devoogdt, N.; Movahedi, K.; et al. Imaging of Glioblastoma Tumor-Associated Myeloid Cells Using Nanobodies Targeting Signal Regulatory Protein Alpha. Front. Immunol. 2021, 12, 777524. [Google Scholar] [CrossRef] [PubMed]
- Sharma, S.; Salehi, F.; Scheithauer, B.W.; Rotondo, F.; Syro, L.V.; Kovacs, K. Role of MGMT in Tumor Development, Progression, Diagnosis, Treatment and Prognosis. Anticancer Res. 2009, 29, 3759–3768. [Google Scholar]
- Kmiecik, J.; Poli, A.; Brons, N.H.C.; Waha, A.; Eide, G.E.; Enger, P.Ø.; Zimmer, J.; Chekenya, M. Elevated CD3+ and CD8+ Tumor-Infiltrating Immune Cells Correlate with Prolonged Survival in Glioblastoma Patients despite Integrated Immunosuppressive Mechanisms in the Tumor Microenvironment and at the Systemic Level. J. Neuroimmunol. 2013, 264, 71–83. [Google Scholar] [CrossRef] [Green Version]
- Rahman, M.A.; Brekke, J.; Arnesen, V.; Hannisdal, M.H.; Navarro, A.G.; Waha, A.; Herfindal, L.; Rygh, C.B.; Bratland, E.; Brandal, P.; et al. Sequential Bortezomib and Temozolomide Treatment Promotes Immunological Responses in Glioblastoma Patients with Positive Clinical Outcomes: A Phase 1B Study. Immun. Inflamm. Dis. 2020, 8, 342–359. [Google Scholar] [CrossRef]
- Zhao, S.; Ji, W.; Shen, Y.; Fan, Y.; Huang, H.; Huang, J.; Lai, G.; Yuan, K.; Cheng, C. Expression of Hub Genes of Endothelial Cells in Glioblastoma-A Prognostic Model for GBM Patients Integrating Single-Cell RNA Sequencing and Bulk RNA Sequencing. BMC Cancer 2022, 22, 1274. [Google Scholar] [CrossRef]
- Ding, M.; Li, Y.-A.; Lu, Z.; Hou, G. Identification of Potential Immune Checkpoint Inhibitor Targets in Gliomas via Bioinformatic Analyses. BioMed Res. Int. 2022, 2022, 1734847. [Google Scholar] [CrossRef]
- D’hautcourt, J.L.; Isaac, J. Mean Fluorescence Intensity of Dual Stained Cells. Cytometry 1999, 38, 44–46. [Google Scholar] [CrossRef]
- Tang, Z.; Li, C.; Kang, B.; Gao, G.; Li, C.; Zhang, Z. GEPIA: A Web Server for Cancer and Normal Gene Expression Profiling and Interactive Analyses. Nucleic Acids Res. 2017, 45, W98–W102. [Google Scholar] [CrossRef]
- Available online: https://www.cancer.gov/about-nci/organization/ccg/research/structural-genomics/tcga (accessed on 2 January 2023).
- Available online: https://commonfund.nih.gov/GTex (accessed on 2 January 2023).


| Characteristics | Glioma Patients n = 24 | Healthy Volunteers n = 24 |
|---|---|---|
| Gender: | ||
| Male [n] | 18 | 12 |
| Female [n] | 6 | 12 |
| Age | ||
| Mean [yr] | 10 | 56 |
| Min [yr] | 22 | 44 |
| Max [yr] | 82 | 78 |
| WHO grade | ||
| I [%] | 0 | |
| II [%] | 8.33 | |
| III [%] | 20.83 | |
| IV [%] | 62.5 | |
| Glioblastoma multiforme [n] | 16 | |
| IDH status: | ||
| Mutant [n] | 4 | |
| Wildtype [n] | 20 | |
| MGMT status (among Glioblastoma multiforme; n = 16) | ||
| MGMT-methylated [n] | 4 | |
| MGMT-unmethylated [n] | 11 | |
| Unknown status [n] | 1 | |
| Monocytes (before surgery) | ||
| Mean [K/µL] | 0.475 |
Disclaimer/Publisher’s Note: The statements, opinions and data contained in all publications are solely those of the individual author(s) and contributor(s) and not of MDPI and/or the editor(s). MDPI and/or the editor(s) disclaim responsibility for any injury to people or property resulting from any ideas, methods, instructions or products referred to in the content. |
© 2023 by the authors. Licensee MDPI, Basel, Switzerland. This article is an open access article distributed under the terms and conditions of the Creative Commons Attribution (CC BY) license (https://creativecommons.org/licenses/by/4.0/).
Share and Cite
Lehman, N.; Kowalska, W.; Zarobkiewicz, M.; Mazurek, M.; Mrozowska, K.; Bojarska-Junak, A.; Rola, R. Pro- vs. Anti-Inflammatory Features of Monocyte Subsets in Glioma Patients. Int. J. Mol. Sci. 2023, 24, 1879. https://doi.org/10.3390/ijms24031879
Lehman N, Kowalska W, Zarobkiewicz M, Mazurek M, Mrozowska K, Bojarska-Junak A, Rola R. Pro- vs. Anti-Inflammatory Features of Monocyte Subsets in Glioma Patients. International Journal of Molecular Sciences. 2023; 24(3):1879. https://doi.org/10.3390/ijms24031879
Chicago/Turabian StyleLehman, Natalia, Wioleta Kowalska, Michał Zarobkiewicz, Marek Mazurek, Karolina Mrozowska, Agnieszka Bojarska-Junak, and Radosław Rola. 2023. "Pro- vs. Anti-Inflammatory Features of Monocyte Subsets in Glioma Patients" International Journal of Molecular Sciences 24, no. 3: 1879. https://doi.org/10.3390/ijms24031879